Embed Size (px)
Citation preview
Drug Induced Acute Kidney InjuryLinda Awdishu, PharmD, MASAssociate Clinical Professor of Pharmacy and MedicineUC San Diego
• Grant funding from the International Serious Adverse Events Consortium
Disclosures
1. Defining an adverse event2. Phenotype standardization3. Causality assessment
Outline
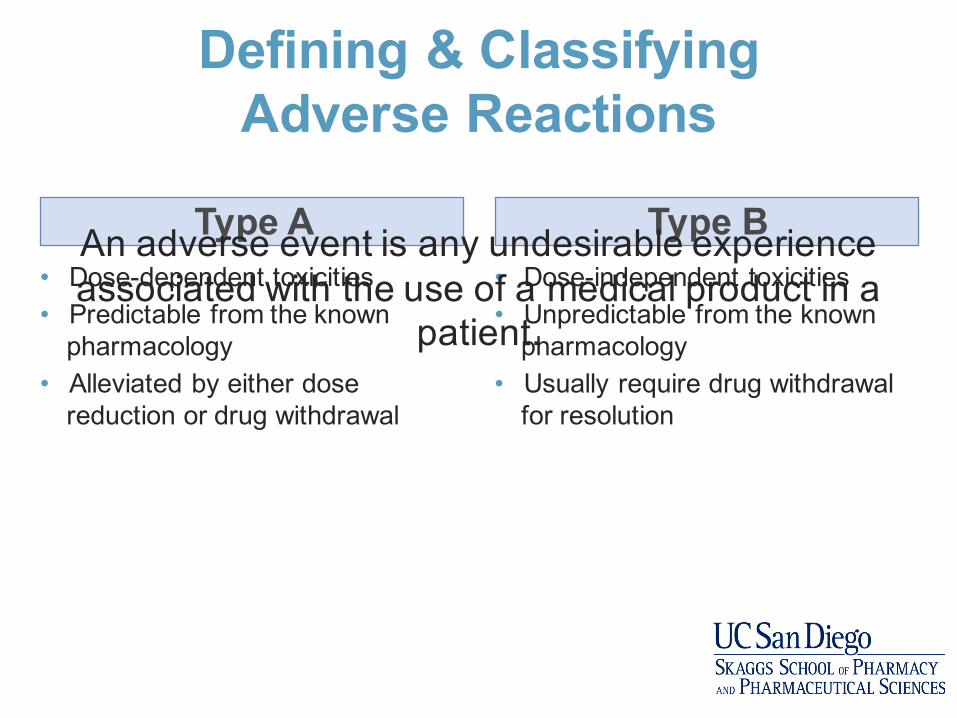
Defining & Classifying Adverse Reactions
• Dose-dependent toxicities • Predictable from the known
pharmacology• Alleviated by either dose
reduction or drug withdrawal
• Dose-independent toxicities • Unpredictable from the known
pharmacology • Usually require drug withdrawal
for resolution
Type A Type BAn adverse event is any undesirable experience associated with the use of a medical product in a
patient.

a. Type Ab. Type Bc. Type A and B
How would you classify drug induced nephrotoxicity ?
Drug induced nephrotoxicity may result form predictable toxicity to the various structures in the kidney or an immune mediated response within the different structures of the kidneys
Nephrotoxicity..the usual thinking…
• Give drug.
• Creatinine go up.
• That bad.
• Bad drug.
Courtesy of R. Steiner 2015

• Historically defined based on the mechanism of injury
Drug Induced Nephrotoxicity Classification
Acute kidney injury
Pre-renal
Hemodynamic
Intrinsic
AIN
ATN
Tubular disorders
Glomerular damage
TMA
Post-renal
Nephrolithiasis
• A panel of international, adult and pediatric, nephrologists and pharmacists convened a series of eight teleconferences followed by two face-to-face meetings
• Phenotypic criteria was developed using a modified Delphi process
• Criteria was considered in the context of using electronic medical records to screen for patients with phenotypes in both hospitalized and ambulatory settings.
Drug Induced Kidney Disease: Phenotype Standardization
Mehta RL, Awdishu L et al. Phenotype Standardization for Drug Induced Kidney Injury. Kidney Int. 2015; 88(2):226-34.

Minimal Criteria in Addition to Biomarker Definition
1. The drug exposure must be at least 24 hours preceding the event.
1. Reasonable evidence for biological plausibility for the causal drug, based on known mechanism of drug effect; metabolism and immunogenicity.
1. Complete data is required to account for concomitant risks and exposures to other nephrotoxic agents.
1. The strength of the relationship between the attributable drug and phenotype should be based on drug exposure duration, extent of primary and secondary criteria met and the time course of the injury.
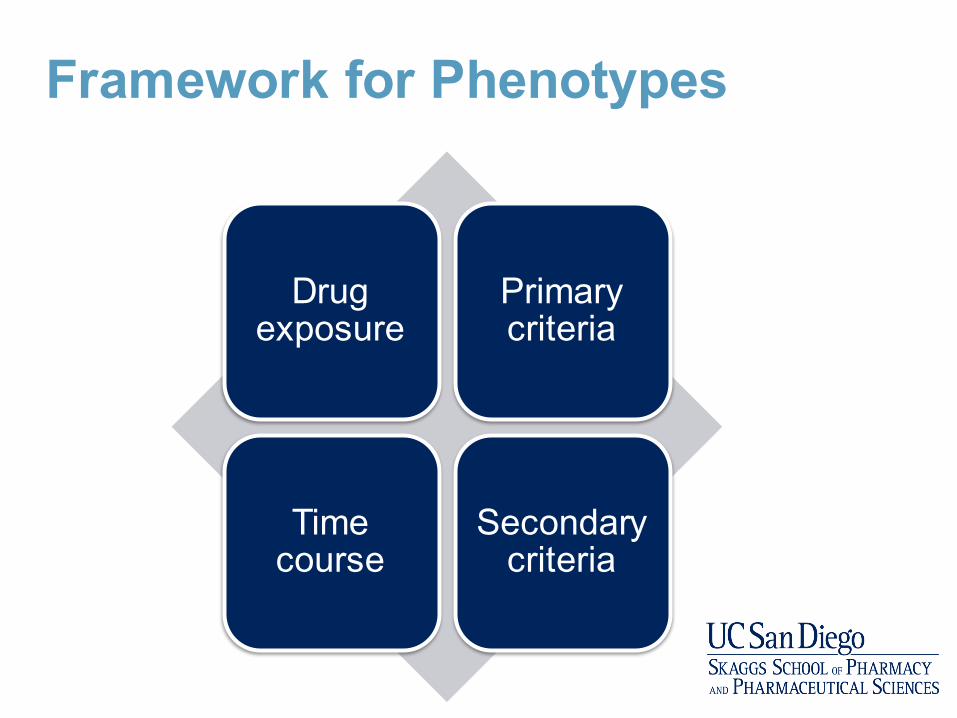
Framework for Phenotypes
Drug exposure
Primary criteria
Time course
Secondary criteria
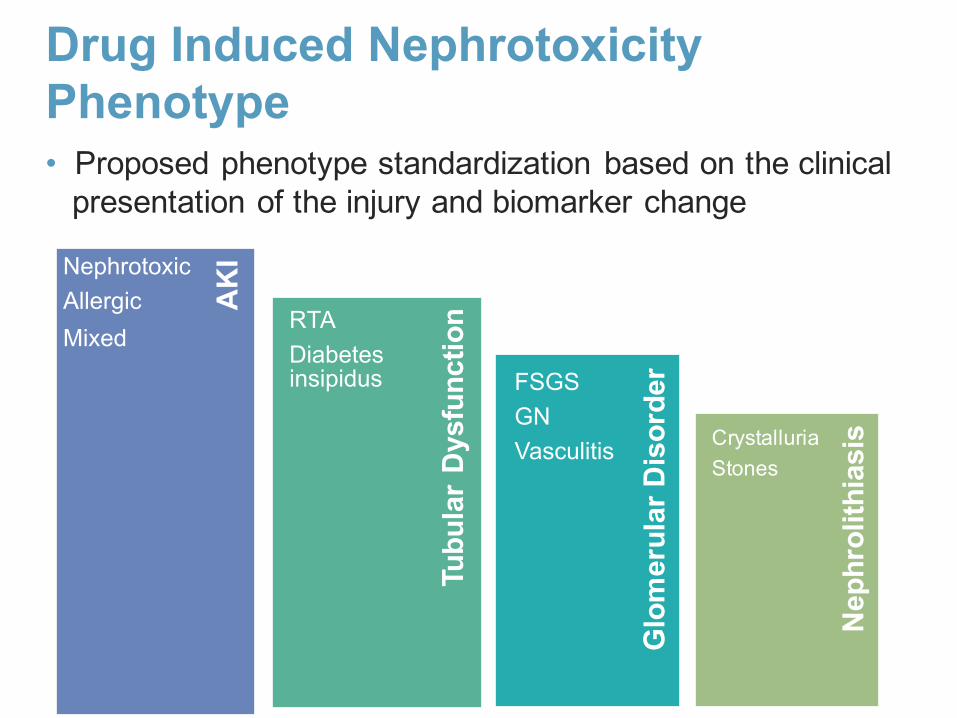
• Proposed phenotype standardization based on the clinical presentation of the injury and biomarker change
Drug Induced Nephrotoxicity Phenotype
Glo
mer
ular
Dis
orde
r
Tubu
lar
Dys
func
tion
Nep
hrol
ithia
sis
AK
INephrotoxicAllergicMixed
RTADiabetes insipidus FSGS
GNVasculitis Crystalluria
Stones
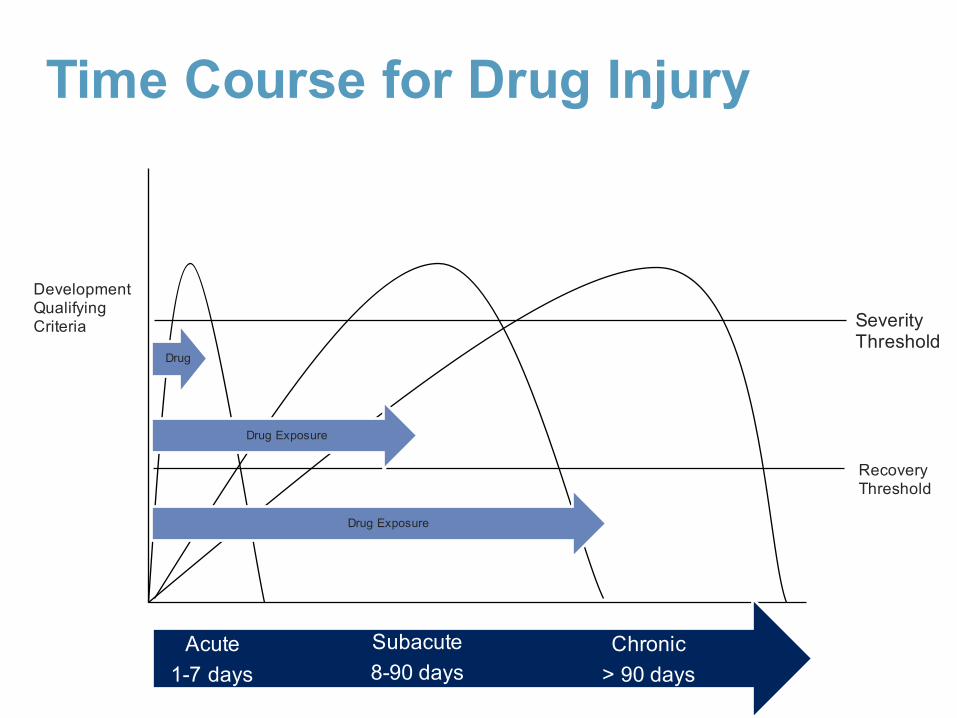
Time Course for Drug Injury
DevelopmentQualifying Criteria
Chronic > 90 days
Subacute8-90 days
Acute 1-7 days
Drug
Severity Threshold
Recovery Threshold
Drug Exposure
Drug Exposure

AKI Phenotype Primary Defining Criteria
Rise in Scr that presents as or progresses to AKIN Stage 2 (KDIGO) or higher in relation to drug exposure• 2-2.9 x reference Scr
• If child has baseline Scr < 0.5 mg/dL, must double Scrto get to at least 0.5 mg/dLor above
Decline in Scr as defined by Stage 2 (KDIGO)• Decline by 50% from
peak creatinine over 7 days
• For pediatrics peak creatinine must be at least 0.5 mg/dL
• Must have decline in relationship to change in drug dosing (reduction, or stopping drug)
Kidney Biopsy findings consistent with• nephrotoxic, • allergic or• mixed patternOR /±
Mehta RL, Awdishu L et al. Phenotype Standardization for Drug Induced Kidney Injury. Kidney Int. 2015; 88(2):226-34.
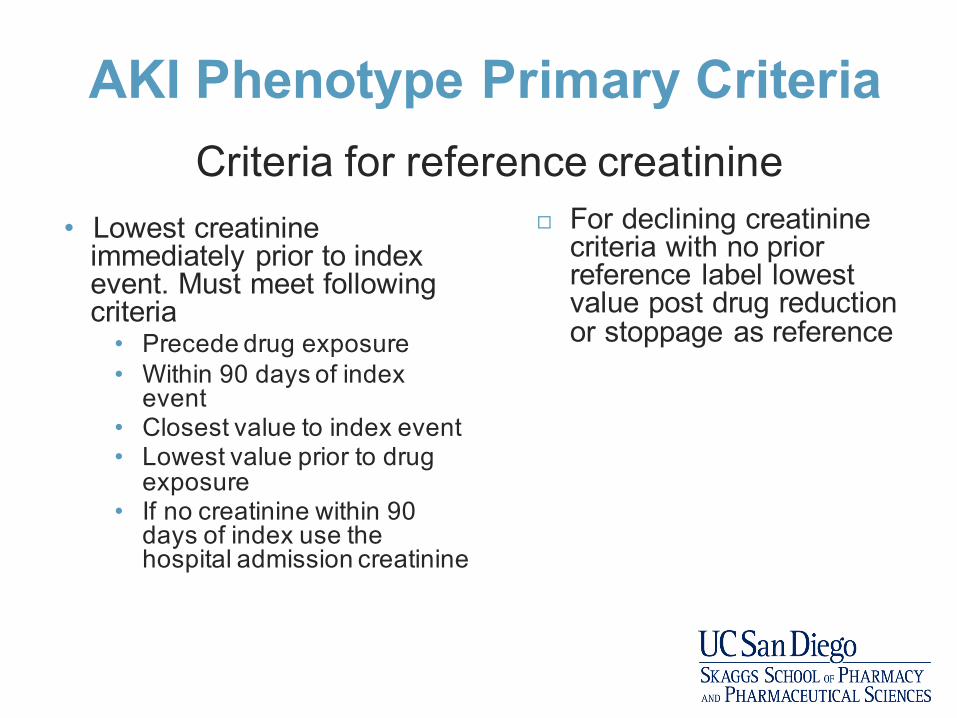
AKI Phenotype Primary Criteria
• Lowest creatinine immediately prior to index event. Must meet following criteria
• Precede drug exposure• Within 90 days of index
event• Closest value to index event• Lowest value prior to drug
exposure• If no creatinine within 90
days of index use the hospital admission creatinine
¨ For declining creatininecriteria with no prior reference label lowest value post drug reduction or stoppage as reference
Criteria for reference creatinine
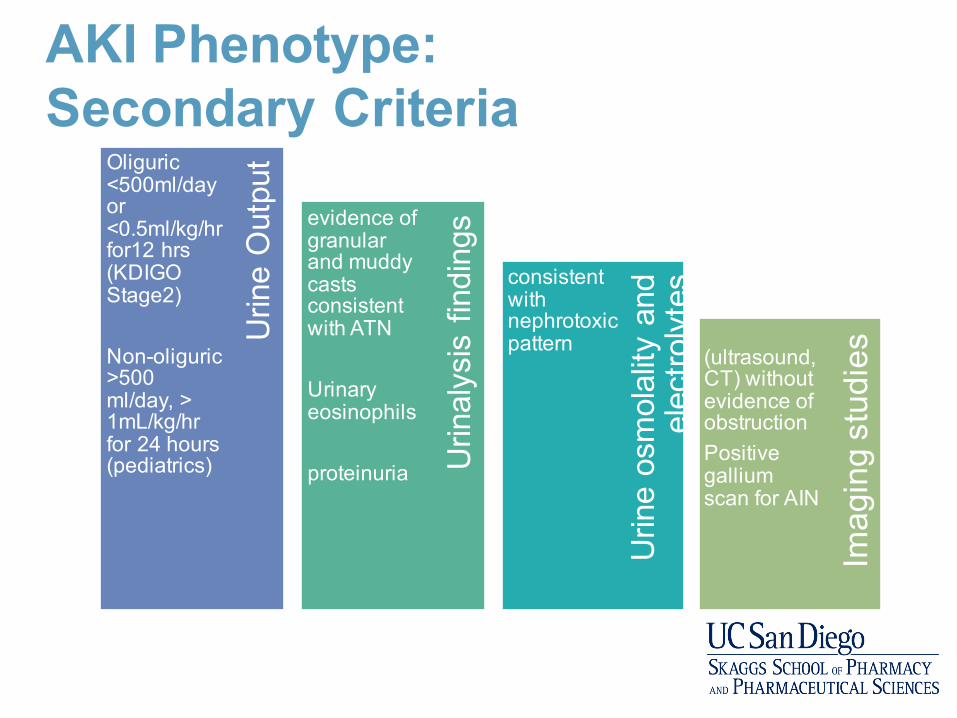
AKI Phenotype: Secondary Criteria
Urin
e os
mol
ality
and
el
ectro
lyte
s
Urin
alys
is fi
ndin
gs
Imag
ing
stud
iesU
rine
Out
putOliguric
<500ml/day or <0.5ml/kg/hrfor12 hrs(KDIGO Stage2)
Non-oliguric>500 ml/day, > 1mL/kg/hrfor 24 hours (pediatrics)
evidence of granular and muddy casts consistent with ATN
Urinary eosinophils
proteinuria
consistent with nephrotoxic pattern (ultrasound,
CT) without evidence of obstructionPositive gallium scan for AIN

Supporting Criteria:Sub Phenotypes
Signs and Symptoms
• Nephrotoxic• Decreased
UOP• Non-oliguric
• Allergic• Decreased
UOP• Fever• Rash• Joint pain• Hematuria
• Mixed
Laboratory
• Nephrotoxic• Scr• UA – casts• FeNa > 1%• Urine Osmisoesthenuric
• Allergic• Scr• Peripheral
eosinophilia• UA –
protein, casts, eosinophils, white cells and red cells
• Mixed
Ultrasound
• No evidence of obstruction
• Kidney size for chronicity
• Other abnormalities
• CT Scan• Nuclear scan
e.g. gallium
Biopsy
• Nephrotoxic• Tubular
necrosis without inflammatory changes
• Allergic• Interstitial
nephritis
• Mixed
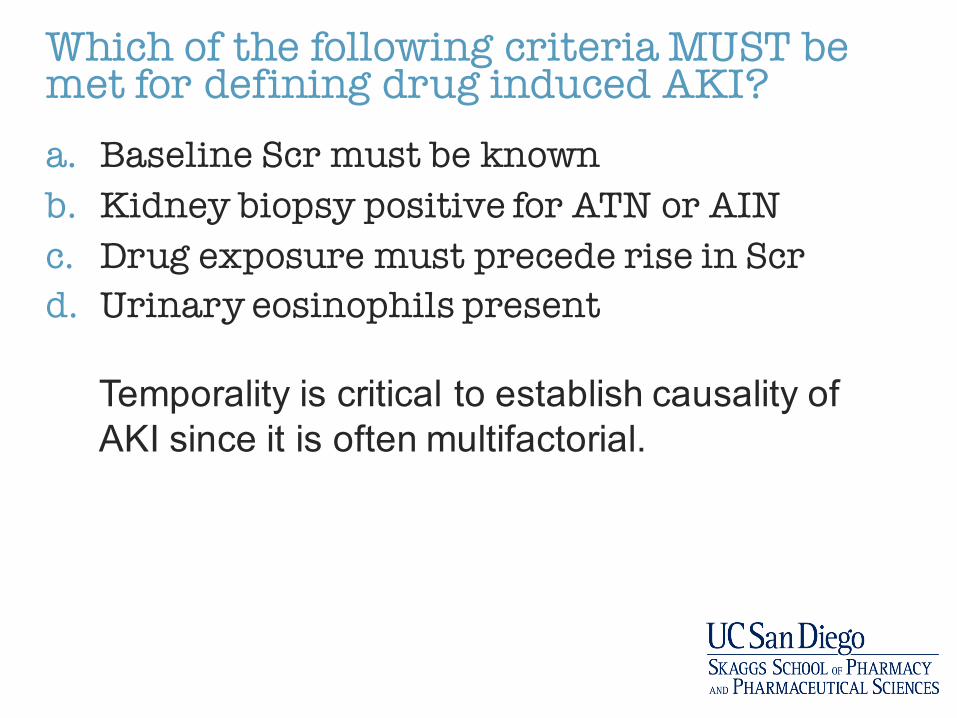
Which of the following criteria MUST be met for defining drug induced AKI?a. Baseline Scr must be knownb. Kidney biopsy positive for ATN or AINc. Drug exposure must precede rise in Scrd. Urinary eosinophils present
Temporality is critical to establish causality of AKI since it is often multifactorial.
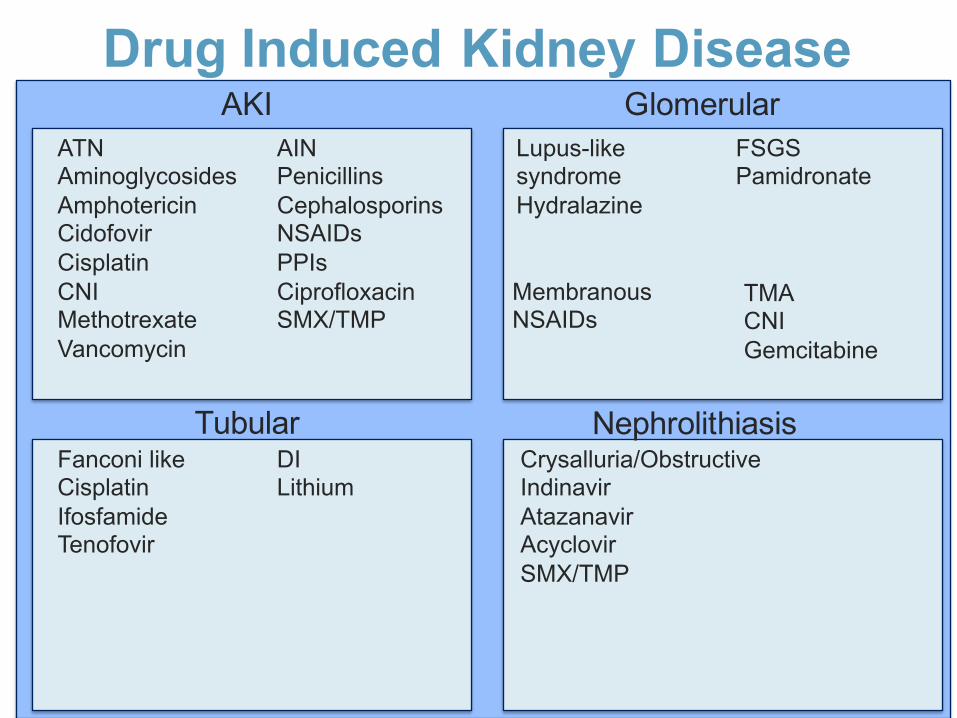
Drug Induced Kidney DiseaseATNAminoglycosidesAmphotericinCidofovirCisplatinCNIMethotrexateVancomycin
AINPenicillinsCephalosporinsNSAIDsPPIsCiprofloxacinSMX/TMP
AKI GlomerularLupus-like syndromeHydralazine
FSGSPamidronate
MembranousNSAIDs
TubularFanconi likeCisplatinIfosfamideTenofovir
DILithium
NephrolithiasisCrysalluria/Obstructive IndinavirAtazanavirAcyclovirSMX/TMP
TMACNIGemcitabine

Vancomycin Nephrotoxicity• Glycopeptide antibiotic isolated from Streptomyces
orientalis• “Mississippi Mud”
• Improvement in purity from 70 to 95%• Recognition: 5-43% depending on definition employed• Risk: Dose > 4 g/day Trough > 15 ng/mL, CKD, duration of
therapy, concomitant nephrotoxins• Response: Minimize concurrent nephrotoxins, dose < 4
g/day and trough closer to 15 ng/mL, switch abx• Renal Support: 0-7.1% require dialysis• Rehabilitation: resolution in 21-72.5%
Bosso et al. Antimicrob Agents Chemother. 2011;55(12): 5475–9.Lodise et al. Antimicrob Agents Chemother. 2008;52(4): 1330-6.Gomes et al. Pharmacotherapy. 2014Meaney et al. Pharmacotherapy. 2014
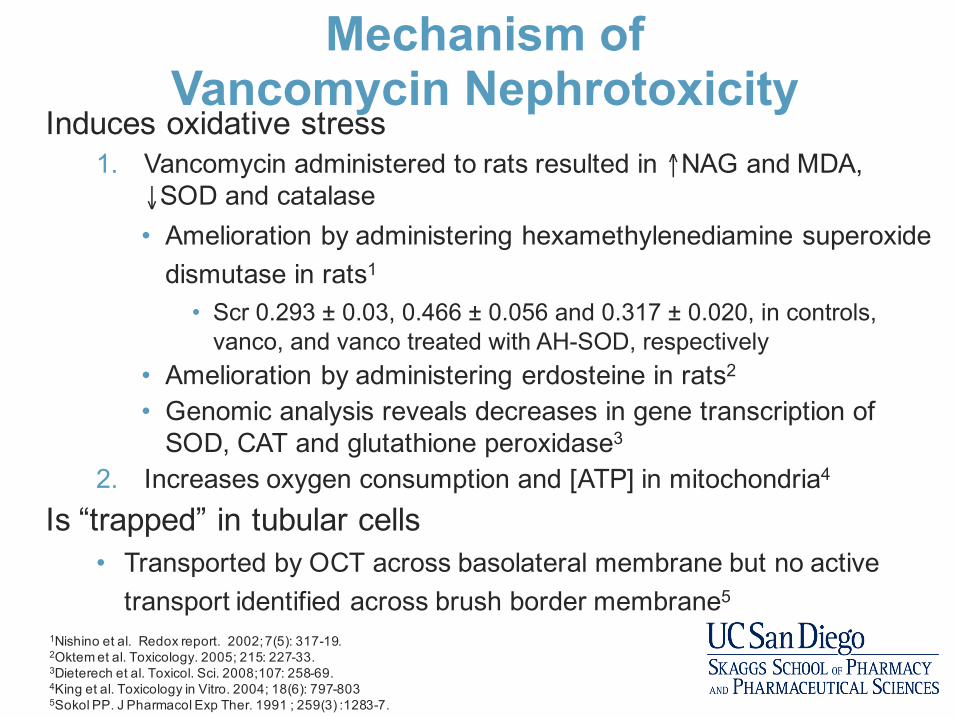
Mechanism of Vancomycin Nephrotoxicity
Induces oxidative stress1. Vancomycin administered to rats resulted in ↑NAG and MDA,
↓SOD and catalase• Amelioration by administering hexamethylenediamine superoxide
dismutase in rats1
• Scr 0.293 ± 0.03, 0.466 ± 0.056 and 0.317 ± 0.020, in controls, vanco, and vanco treated with AH-SOD, respectively
• Amelioration by administering erdosteine in rats2
• Genomic analysis reveals decreases in gene transcription of SOD, CAT and glutathione peroxidase3
2. Increases oxygen consumption and [ATP] in mitochondria4
Is “trapped” in tubular cells• Transported by OCT across basolateral membrane but no active
transport identified across brush border membrane5
1Nishino et al. Redox report. 2002; 7(5): 317-19.2Oktem et al. Toxicology. 2005; 215: 227-33.3Dieterech et al. Toxicol. Sci. 2008;107: 258-69.4King et al. Toxicology in Vitro. 2004; 18(6): 797-8035Sokol PP. J Pharmacol Exp Ther. 1991 ; 259(3) :1283-7.
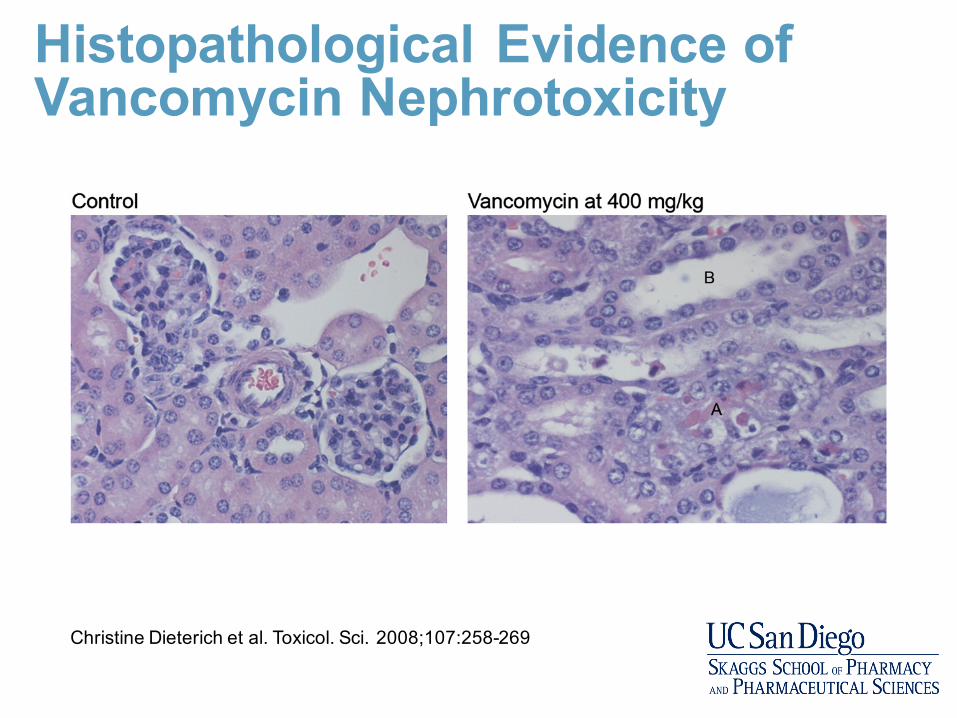
Histopathological Evidence of Vancomycin Nephrotoxicity
Christine Dieterich et al. Toxicol. Sci. 2008;107:258-269
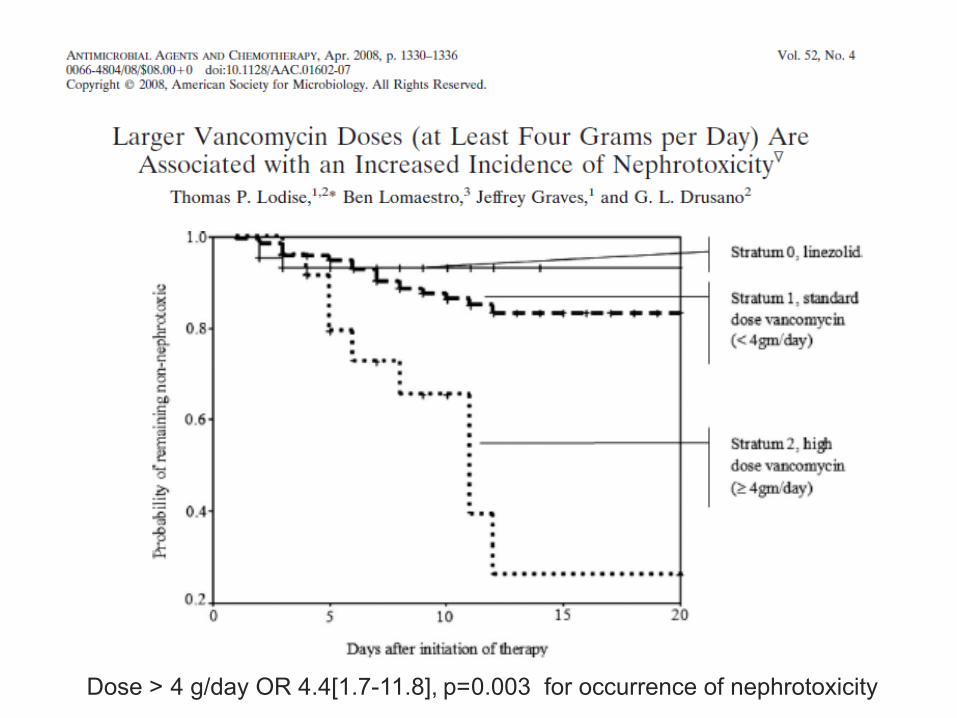
Dose > 4 g/day OR 4.4[1.7-11.8], p=0.003 for occurrence of nephrotoxicity

Bosso et al. Antimicrob Agents Chemother 2011;55(12):5475-79.
Incidence of nephrotoxicity:• 8.9% in low
trough group • 29.6% in high
trough group

Van Hal et al. Antimicrob Agents Chemother. 2013; 57(2): 734-44.
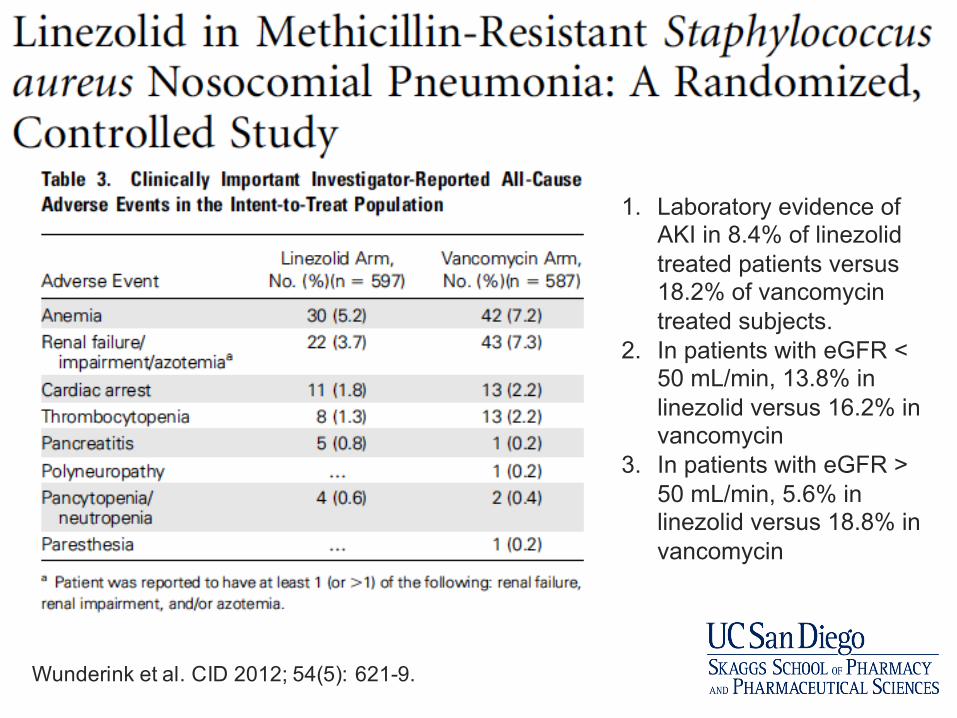
Wunderink et al. CID 2012; 54(5): 621-9.
1. Laboratory evidence of AKI in 8.4% of linezolid treated patients versus 18.2% of vancomycintreated subjects.
2. In patients with eGFR < 50 mL/min, 13.8% in linezolid versus 16.2% in vancomycin
3. In patients with eGFR > 50 mL/min, 5.6% in linezolid versus 18.8% in vancomycin

Higher clinical success in patients with ventilator-associated pneumonia due to methicillin-resistant Staphylococcus aureus treated with linezolid compared with vancomycin: results from the IMPACT-HAP study
Mean(SD) vancomycin trough 13 mg/L on Day 3
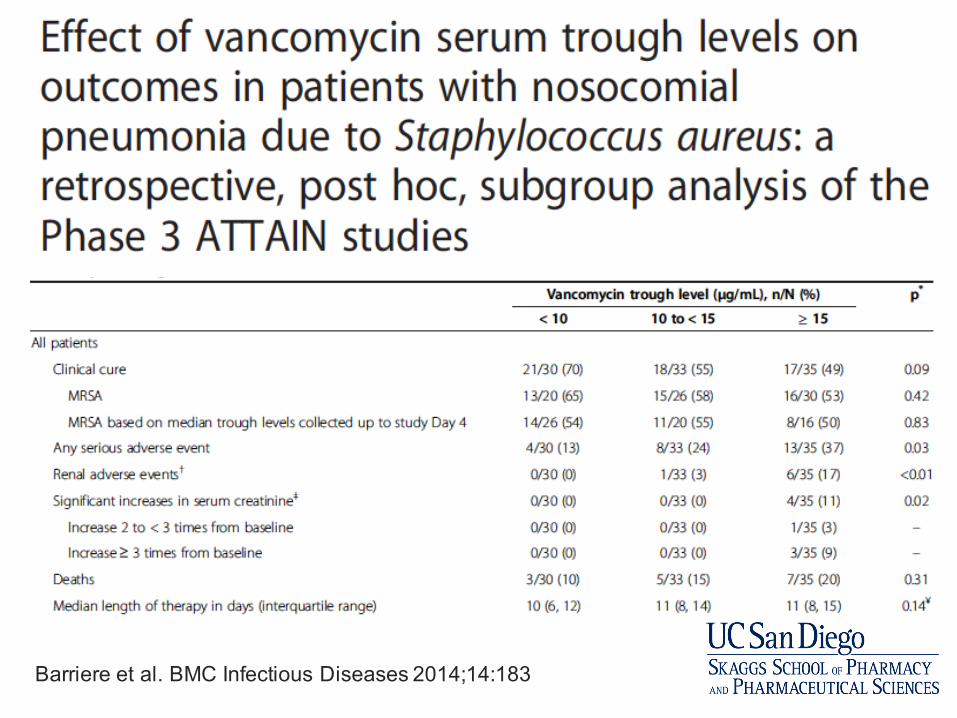
Barriere et al. BMC Infectious Diseases 2014;14:183

Meta-analysis of Vancomycin Nephrotoxicity
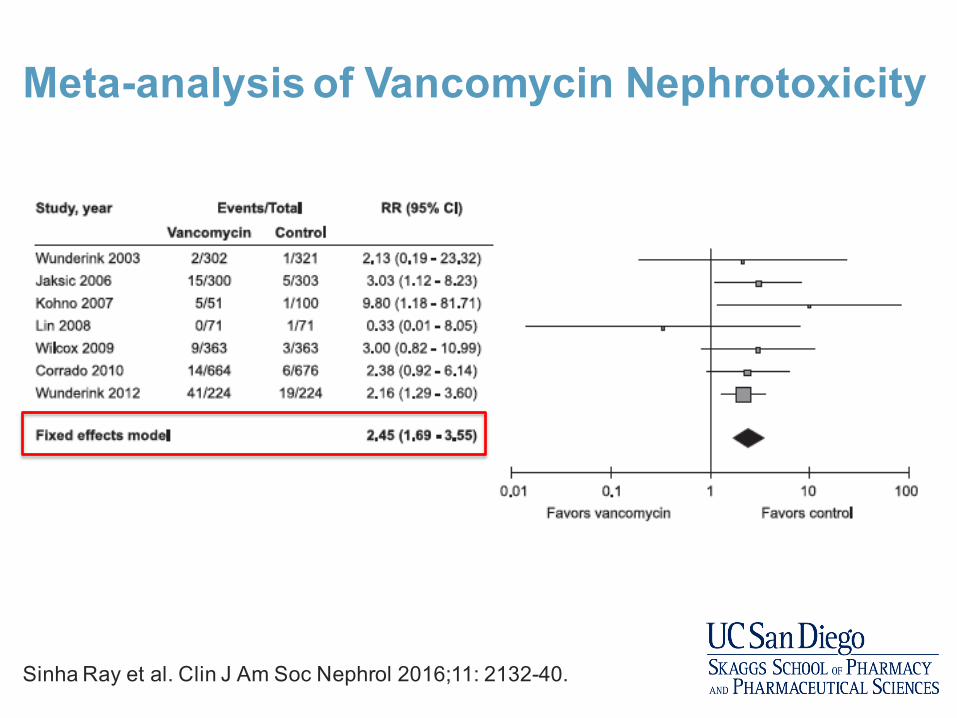
Meta-analysis of Vancomycin Nephrotoxicity
Sinha Ray et al. Clin J Am Soc Nephrol 2016;11: 2132-40.

Telavancin is associated with higher risk of AKI compared to vancomycin

Early switch in antibiotic selection does not reduce vancomycin associated AKI
Carreno JJ et al. Annals of Pharmacotherapy 2017; 51(3): 185-193.

A 53-year-old woman (Weight 71 kg, Height 62”) is transferred from a community hospital to an academic medical center for sepsis secondary to a recurrent LLE cellulitis. Her past medical history includes open-reduction, internal fixation of left ankle, recurrent LLE cellulitis, HTN and hypothyroidism. At the community hospital she was treated with IV clindamycin. She has worsening pain, erythema, swelling to LLE with new open wound to left lateral ankle. Home medications include carvedilol 12.5 mg po bid, lisinopril 20 mg po daily, clindamycin 300 mg po three times daily, levothyroxine 137 mcg po daily. Her vital signs include BP 90/65 mmHg, heart rate 98 bpm, RR 16, O2 sat 98%, pain score 8/10. She is started on IV fluids, vancomycin (goal trough 15-20 mg/L) and piperacillin/tazobactam. Her oral anti-hypertensives are discontinued. On day 2 of her admission she develops AKI, which continues to worsen over the next few days.
Clear as Mississippi Mud?

Labs Adm D2 D3 D4 D5 D6 D7
Scr 0.89 1.68 2.29 2.35 2.31 2.34 2.45
GFR >60 32 22 22 22 22 21
[Vanc] 18.8 20.8
WBC 22.4 21.9 13.1 12.8 14.7 12.6 12.3
Clear as Mississippi Mud?
Is this vancomycin nephrotoxicity?
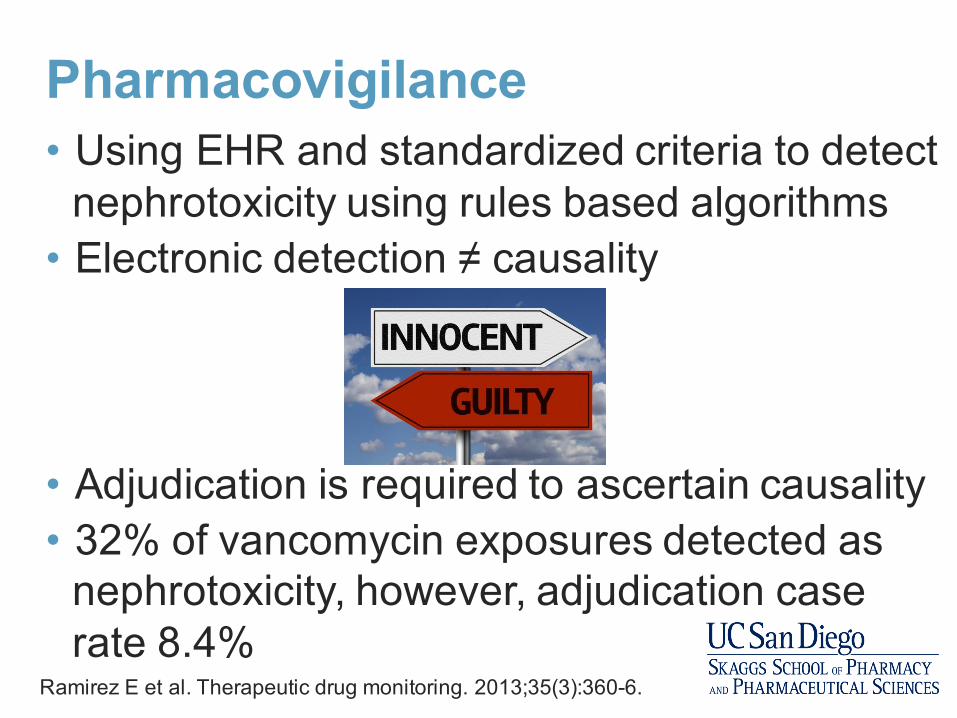
Pharmacovigilance• Using EHR and standardized criteria to detect
nephrotoxicity using rules based algorithms• Electronic detection ≠ causality
• Adjudication is required to ascertain causality• 32% of vancomycin exposures detected as
nephrotoxicity, however, adjudication case rate 8.4%
Ramirez E et al. Therapeutic drug monitoring. 2013;35(3):360-6.
Causality Assessment of Adverse Events• Most cases concern suspected adverse drug reactions.• Few adverse reactions are ‘certain’ or ‘unlikely’
Drug Induced
AKI
Patient susceptibilities• Age• Race/Ethnicity• Genetic predisposition
Disease Susceptibilities• Concurrent AKI Risk
Factors• Underlying Illness and
competing bias
Multidrug injuryProcess of Care Complexities• Incomplete data on
exposures• Reference creatinine
Lack of diagnostics• Biopsies• Drug Concentrations• Measures of immune
reactivity• Genetic profiling• PK modeling
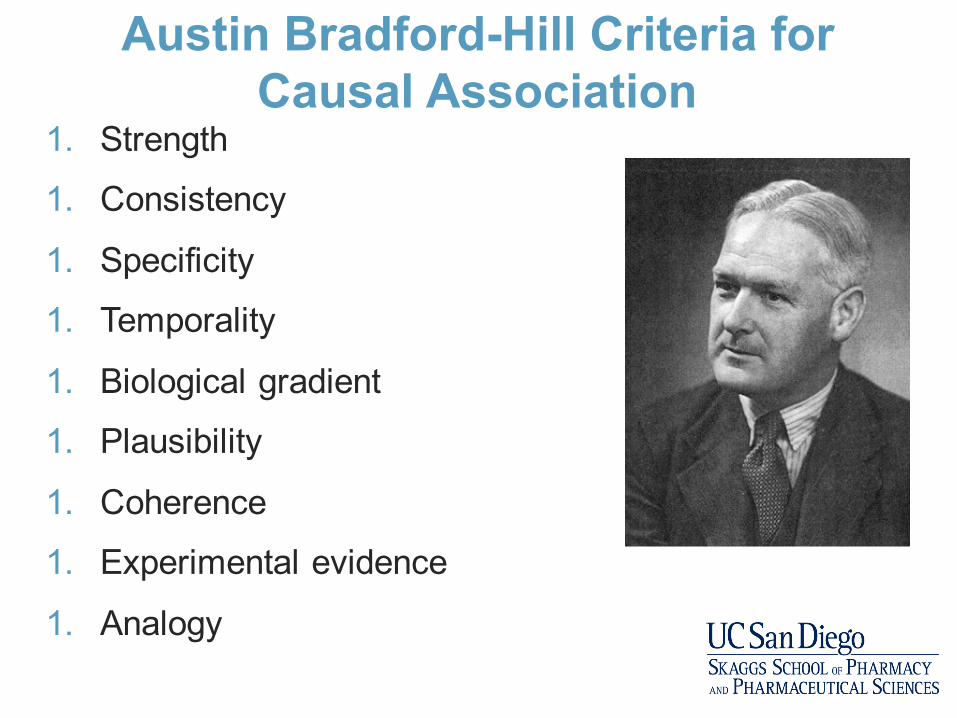
Austin Bradford-Hill Criteria for Causal Association
1. Strength
1. Consistency
1. Specificity
1. Temporality
1. Biological gradient
1. Plausibility
1. Coherence
1. Experimental evidence
1. Analogy

Gold Standard: Expert Consensus• Adjudication of cases by experts • Two methods for dealing with disagreement
• Third expert reviews case• Consensual agreement by modified delphi process
• Disadvantages of adjudication• Time intensive • Impractical for real-time clinical decision making
• Need for structured tools to assess drug:ADR
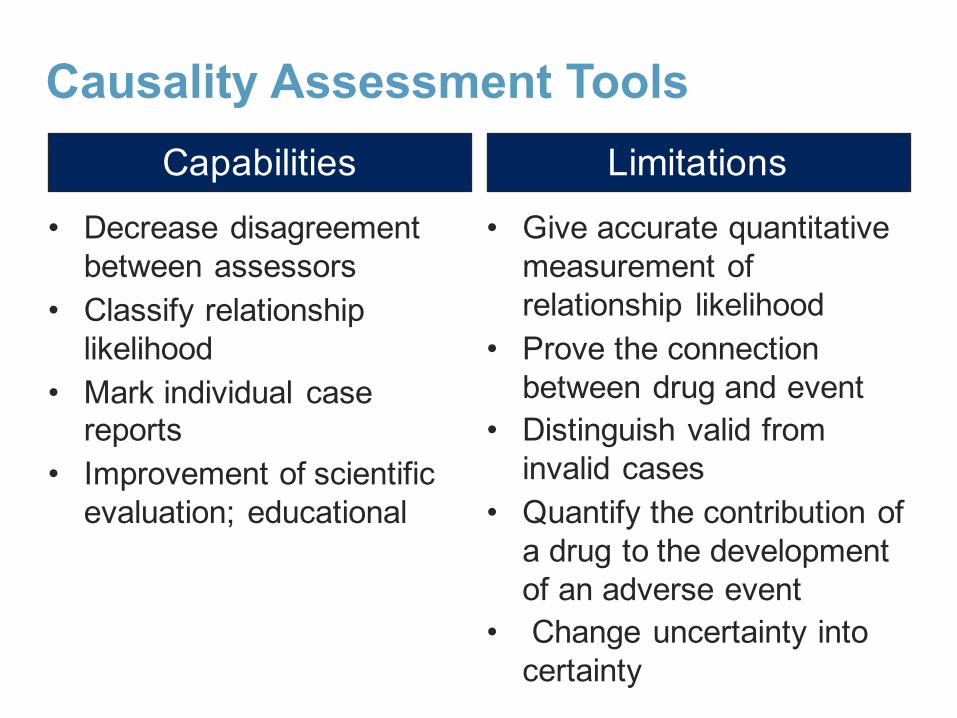
Capabilities• Decrease disagreement
between assessors• Classify relationship
likelihood• Mark individual case
reports• Improvement of scientific
evaluation; educational
Limitations• Give accurate quantitative
measurement of relationship likelihood
• Prove the connection between drug and event
• Distinguish valid from invalid cases
• Quantify the contribution of a drug to the development of an adverse event
• Change uncertainty into certainty
Causality Assessment Tools

General
• Naranjo scale• WHO causality tools• French probabilistic tool
Organ Specific
• Rucam for hepatotoxicity
• Liverpool for skin hypersensitivity
Causality Assessment Tools

Naranjo Scale
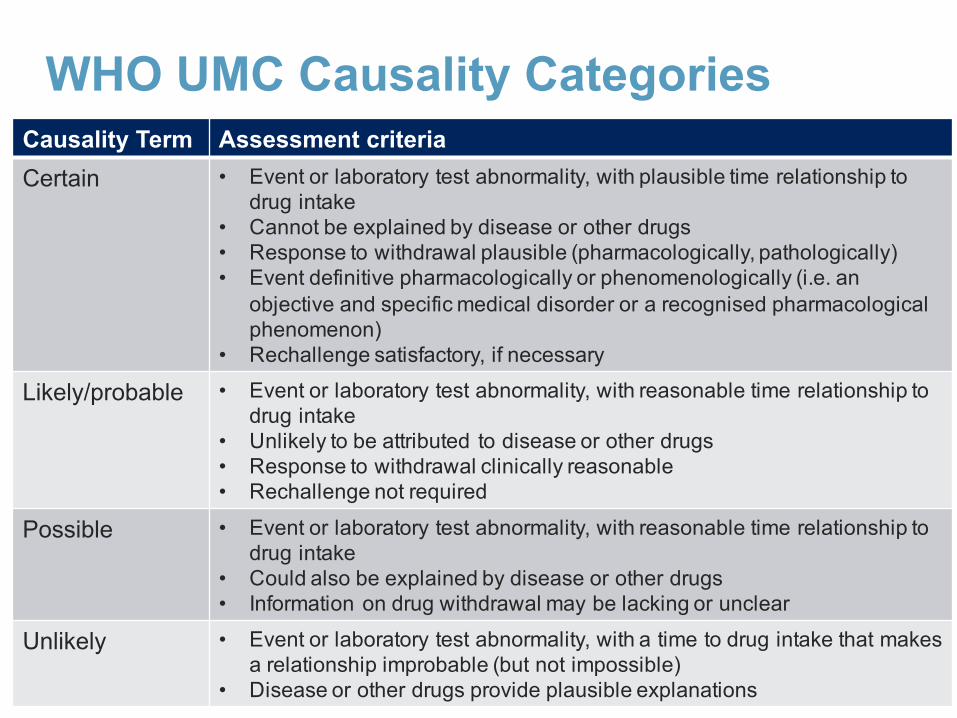
WHO UMC Causality CategoriesCausality Term Assessment criteriaCertain • Event or laboratory test abnormality, with plausible time relationship to
drug intake • Cannot be explained by disease or other drugs • Response to withdrawal plausible (pharmacologically, pathologically) • Event definitive pharmacologically or phenomenologically (i.e. an
objective and specific medical disorder or a recognised pharmacological phenomenon)
• Rechallenge satisfactory, if necessary
Likely/probable • Event or laboratory test abnormality, with reasonable time relationship to drug intake
• Unlikely to be attributed to disease or other drugs • Response to withdrawal clinically reasonable • Rechallenge not required
Possible • Event or laboratory test abnormality, with reasonable time relationship to drug intake
• Could also be explained by disease or other drugs • Information on drug withdrawal may be lacking or unclear
Unlikely • Event or laboratory test abnormality, with a time to drug intake that makes a relationship improbable (but not impossible)
• Disease or other drugs provide plausible explanations
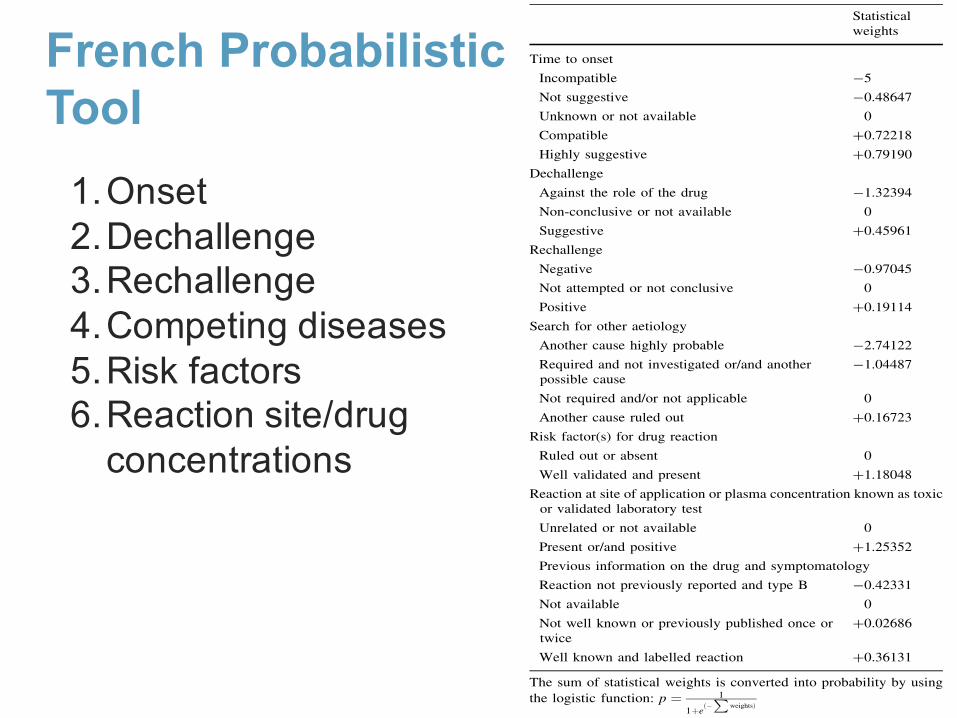
French Probabilistic Tool
met in routine (and thus unlikely to be found in a random
sample) yet important to take into consideration to evaluatethe performance of causality assessment methods. One
drug–event pair was randomly sampled for each of these
particular situations: drug overdose, drug–drug interaction,withdrawal syndrome, adverse event related to drug
exposure during pregnancy, adverse event related to drug
exposure during breastfeeding, adverse event at the site ofdrug application, adverse event with fatal outcome, adverse
event with recurrence of signs when the suspected drugwas rechallenged, adverse event with no recurrence of
signs when the suspected drug was rechallenged, adverse
event after vaccination (other than reaction at the injectionsite and effect occurring within 48 h after injection). For
each case, information available from the complete file was
summarized in standardized form, including the patient’scharacteristics, the suspected drug(s) with dates of treat-
ment initiation and discontinuation, the type of event, its
date of onset, relevant biological and clinical data, othercurrent medicines and the time course of the event. The
likelihood for drug causation for the 59 drug–event pairswas then assessed separately by two groups of experts.
2.1 Evaluation of Drug Causation by ConsensualExpert Judgement
This approach was used as the gold standard. Each drug–event pair was assessed by a multidisciplinary group with
expertise both in clinical pathology and in pharmacovigi-
lance. For 31 cases, this group comprised three seniorphysicians who were heads of a pharmacovigilance regio-
nal centre or of a pharmacovigilance unit in a pharma-
ceutical company or of a department of internal medicinein a university hospital. For the remaining drug–events
pairs (n = 28) that appeared to be more complex to assess
(effect involving different organs, or different possiblepathophysiological mechanisms, multiple risk factors, etc.)
two additional experts were added. Each expert was asked
to express separately his/her judgment on the responsibilityof the suspected drug on a 100 mm visual analogue scale
(VAS). The judgement was then directly converted into a
probability of drug causation ranging from 0 to 1. Sec-ondly, causes for discrepancies, defined by a difference of
25 mm on the VAS, were discussed by the same experts
according to the Delphi process [8] and until agreement ona probability of drug responsibility. For each case, the final
probability obtained by consensual agreement was retained
as the gold standard for drug causation.To comply with current practice of routine drug cau-
sality assessment, the pharmacovigilance medical staff of
the Bordeaux pharmacovigilance centre (two senior clini-cal pharmacologists, one pharmacist and one physician
with a large amount of experience in internal medicine)
assessed the likelihood of drug causation for each of the 59drug–event pairs, by first using the logistic method [16],
followed by the Naranjo algorithm [19] one month later,
and then the Liverpool algorithm [30].
2.2 Evaluation of Drug Causation by the Logistic
Algorithm
The logistic algorithm [18] consists of assessing seven
causality criteria: time to onset, dechallenge, rechallenge,search for other aetiology, risk factor(s) for drug reaction
Table 1 New version of the logistic method to obtain a probability ofdrug causation
Statisticalweights
Time to onset
Incompatible -5
Not suggestive -0.48647
Unknown or not available 0
Compatible ?0.72218
Highly suggestive ?0.79190
Dechallenge
Against the role of the drug -1.32394
Non-conclusive or not available 0
Suggestive ?0.45961
Rechallenge
Negative -0.97045
Not attempted or not conclusive 0
Positive ?0.19114
Search for other aetiology
Another cause highly probable -2.74122
Required and not investigated or/and anotherpossible cause
-1.04487
Not required and/or not applicable 0
Another cause ruled out ?0.16723
Risk factor(s) for drug reaction
Ruled out or absent 0
Well validated and present ?1.18048
Reaction at site of application or plasma concentration known as toxicor validated laboratory test
Unrelated or not available 0
Present or/and positive ?1.25352
Previous information on the drug and symptomatology
Reaction not previously reported and type B -0.42331
Not available 0
Not well known or previously published once ortwice
?0.02686
Well known and labelled reaction ?0.36131
The sum of statistical weights is converted into probability by using
the logistic function: p ¼ 1
1þeð$P
weightsÞ
Probabilistic Method vs. Naranjo and Liverpool Algorithms 1035
1.Onset2.Dechallenge3.Rechallenge4.Competing diseases5.Risk factors6.Reaction site/drug
concentrations
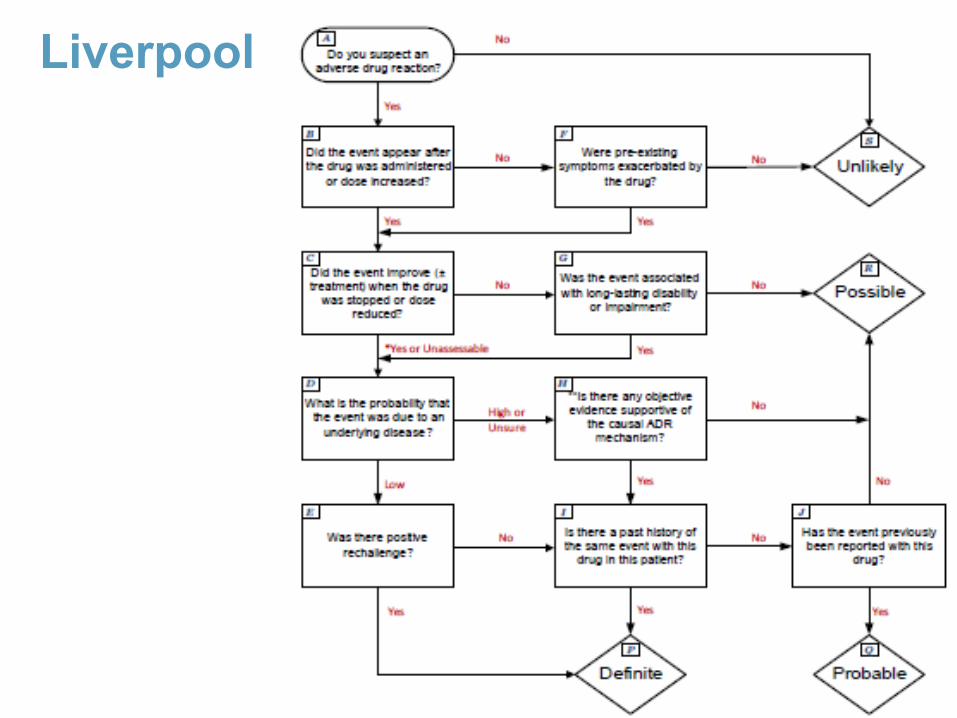
Liverpool
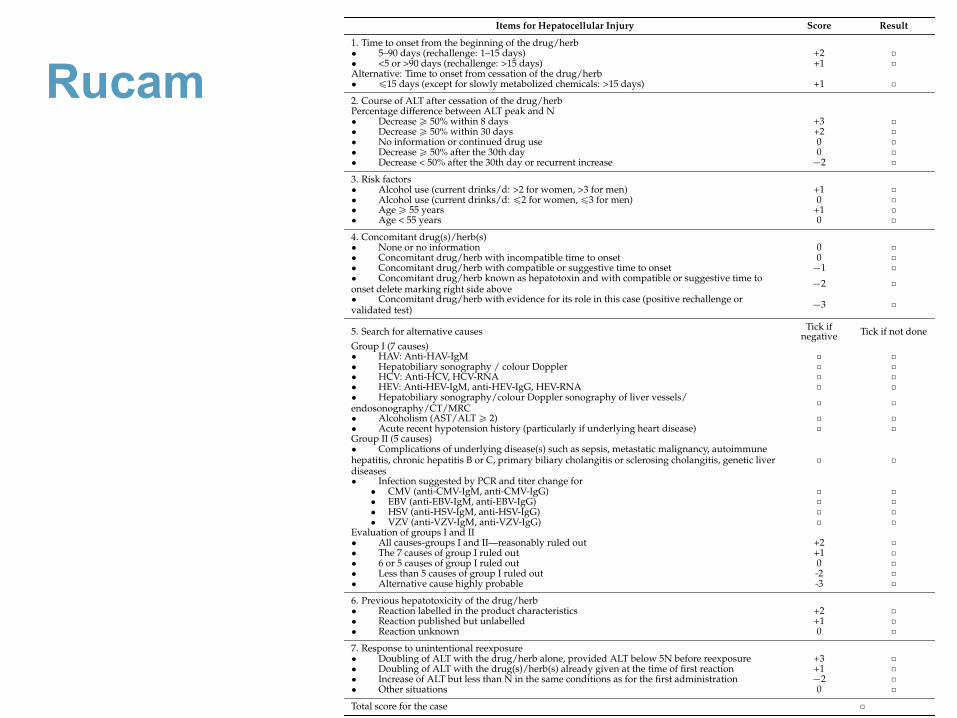
Rucam
Int. J. Mol. Sci. 2016, 17, 14 5 of 33
Table 2. Updated RUCAM for the hepatocellular injury of DILI and HILI. The items specificallyrefer to the hepatocellular injury rather than to the cholestatic or mixed liver injury (shown inTable 3). Abbreviations: ALT, Alanine aminotransferase; AST, Aspartate aminotransferase; CMV,Cytomegalovirus; CT, Computer tomography; DILI, Drug induced liver injury; EBV, Epstein Barrvirus; HAV, Hepatitis A virus; HBc, Hepatitis B core; HBsAg, Hepatitis B antigen; HBV, HepatitisB virus; HCV, Hepatitis C virus; HEV, Hepatitis E virus; HILI, Herb induced liver injury; HSV,Herpes simplex virus; MRC, Magnetic resonance cholangiography; N, upper limit of the normalrange; RUCAM, Roussel Uclaf Causality Assessment Method; VZV, Varicella zoster virus. Total scoreand resulting causality grading: §0, excluded; 1–2, unlikely; 3–5, possible; 6–8, probable; and •9,highly probable.
Items for Hepatocellular Injury Score Result
1. Time to onset from the beginning of the drug/herb‚ 5–90 days (rechallenge: 1–15 days) +2 ˝‚ <5 or >90 days (rechallenge: >15 days) +1 ˝Alternative: Time to onset from cessation of the drug/herb‚ §15 days (except for slowly metabolized chemicals: >15 days) +1 ˝2. Course of ALT after cessation of the drug/herbPercentage difference between ALT peak and N‚ Decrease • 50% within 8 days +3 ˝‚ Decrease • 50% within 30 days +2 ˝‚ No information or continued drug use 0 ˝‚ Decrease • 50% after the 30th day 0 ˝‚ Decrease < 50% after the 30th day or recurrent increase ´2 ˝3. Risk factors‚ Alcohol use (current drinks/d: >2 for women, >3 for men) +1 ˝‚ Alcohol use (current drinks/d: §2 for women, §3 for men) 0 ˝‚ Age • 55 years +1 ˝‚ Age < 55 years 0 ˝4. Concomitant drug(s)/herb(s)‚ None or no information 0 ˝‚ Concomitant drug/herb with incompatible time to onset 0 ˝‚ Concomitant drug/herb with compatible or suggestive time to onset ´1 ˝‚ Concomitant drug/herb known as hepatotoxin and with compatible or suggestive time toonset delete marking right side above ´2 ˝‚ Concomitant drug/herb with evidence for its role in this case (positive rechallenge orvalidated test) ´3 ˝
5. Search for alternative causes Tick ifnegative Tick if not done
Group I (7 causes)‚ HAV: Anti-HAV-IgM ˝ ˝‚ Hepatobiliary sonography / colour Doppler ˝ ˝‚ HCV: Anti-HCV, HCV-RNA ˝ ˝‚ HEV: Anti-HEV-IgM, anti-HEV-IgG, HEV-RNA ˝ ˝‚ Hepatobiliary sonography/colour Doppler sonography of liver vessels/endosonography/CT/MRC ˝ ˝‚ Alcoholism (AST/ALT • 2) ˝ ˝‚ Acute recent hypotension history (particularly if underlying heart disease) ˝ ˝Group II (5 causes)‚ Complications of underlying disease(s) such as sepsis, metastatic malignancy, autoimmunehepatitis, chronic hepatitis B or C, primary biliary cholangitis or sclerosing cholangitis, genetic liverdiseases
˝ ˝
‚ Infection suggested by PCR and titer change for‚ CMV (anti-CMV-IgM, anti-CMV-IgG) ˝ ˝‚ EBV (anti-EBV-IgM, anti-EBV-IgG) ˝ ˝‚ HSV (anti-HSV-IgM, anti-HSV-IgG) ˝ ˝‚ VZV (anti-VZV-IgM, anti-VZV-IgG) ˝ ˝
Evaluation of groups I and II‚ All causes-groups I and II—reasonably ruled out +2 ˝‚ The 7 causes of group I ruled out +1 ˝‚ 6 or 5 causes of group I ruled out 0 ˝‚ Less than 5 causes of group I ruled out -2 ˝‚ Alternative cause highly probable -3 ˝6. Previous hepatotoxicity of the drug/herb‚ Reaction labelled in the product characteristics +2 ˝‚ Reaction published but unlabelled +1 ˝‚ Reaction unknown 0 ˝7. Response to unintentional reexposure‚ Doubling of ALT with the drug/herb alone, provided ALT below 5N before reexposure +3 ˝‚ Doubling of ALT with the drug(s)/herb(s) already given at the time of first reaction +1 ˝‚ Increase of ALT but less than N in the same conditions as for the first administration ´2 ˝‚ Other situations 0 ˝Total score for the case ˝
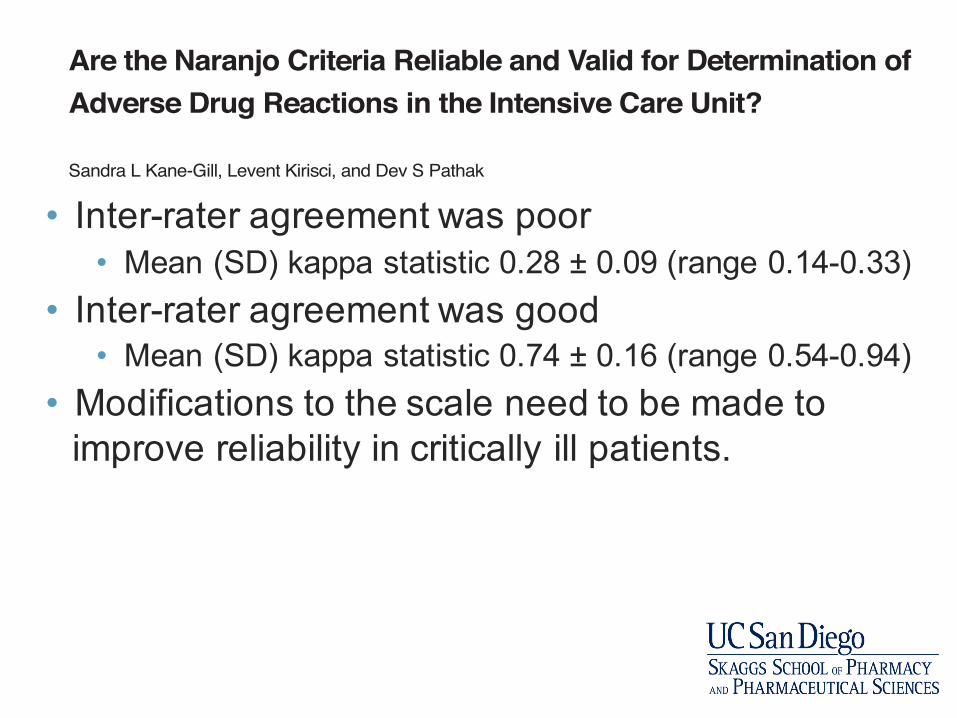
• Inter-rater agreement was poor • Mean (SD) kappa statistic 0.28 ± 0.09 (range 0.14-0.33)
• Inter-rater agreement was good• Mean (SD) kappa statistic 0.74 ± 0.16 (range 0.54-0.94)
• Modifications to the scale need to be made to improve reliability in critically ill patients.
The risk for adverse drug reactions (ADRs) increasesfollowing a prescribing error, but ADRs also occur fol-
lowing appropriate prescribing; it is important to be able toaccurately confirm suspected events.1 Current determina-tion of ADRs results in considerable differences of opinionwhen evaluating a situation for the presence of an ADR.2,3In one study, the rate of agreement by 3 clinical pharma-cologists was only 50%.2
It is widely recognized that explicit, operationally definedcriteria could greatly increase reliability and validity of ADRdetermination. In response to this need, several instrumentshave been proposed,4-6 including the Naranjo criteria.7 TheNaranjo criteria is the most widely used ADR instrument inthe literature and is commonly used in clinical practice.8,9
Naranjo et al.7 developed a 10-item probability scale(Appendix I) that uses a weighted scoring system associat-ed with nominal answers. It was tested for reliability andvalidity using published ADR cases. ADRs were definedas a noxious, unintended, or undesired effect of a drugused for prophylaxis, diagnosis, or therapy. A stratifiedrandom sample of 63 ADRs was selected from the litera-ture and categorized by 6 observers (2 physicians, 4 phar-macists) in the following 3 phases for reliability testing: (1)subjectively using predetermined definitions of definite,probable, possible, and doubtful, (2) objectively using the10-item questionnaire, and (3) objectively using the 10-item questionnaire 4 months after phase 2. The agreementbetween raters increased about 35% from phase 1 to phase2. The kappa statistic was 0.21–0.37 and 0.69–0.86 forphases 1 and 2, respectively. The percent agreement forphases 2 and 3 ranged from 80% to 97% (κ = 0.64–0.95).
Validity testing was also completed in 3 phases: (1) con-sensus of 3 expert opinions was compared with those of
The Annals of Pharmacotherapy ■ 2005 November, Volume 39 ■ 1823
Are the Naranjo Criteria Reliable and Valid for Determination ofAdverse Drug Reactions in the Intensive Care Unit?
Sandra L Kane-Gill, Levent Kirisci, and Dev S Pathak
www.theannals.com
Critical Care
Author information provided at the end of the text.This work was presented as an abstract at the American Collegeof Clinical Pharmacy Annual Meeting, Albuquerque, NM, October2002.
BACKGROUND: The Naranjo criteria are frequently used for determination of causality for suspected adverse drug reactions (ADRs);however, the psychometric properties have not been studied in the critically ill. OBJECTIVE: To evaluate the reliability and validity of the Naranjo criteria for ADR determination in the intensive care unit (ICU).METHODS: All patients admitted to a surgical ICU during a 3-month period were enrolled. Four raters independently reviewed 142suspected ADRs using the Naranjo criteria (review 1). Raters evaluated the 142 suspected ADRs 3–4 weeks later, again using theNaranjo criteria (review 2). Inter-rater reliability was tested using the kappa statistic. The weighted kappa statistic was calculatedbetween reviews 1 and 2 for the intra-rater reliability of each rater. Cronbach alpha was computed to assess the inter-itemconsistency correlation. The Naranjo criteria were compared with expert opinion for criterion validity for each rater and reported as aSpearman rank (rs) coefficient.RESULTS: The kappa statistic ranged from 0.14 to 0.33, reflecting poor inter-rater agreement. The weighted kappa within raters was0.5402–0.9371. The Cronbach alpha ranged from 0.443 to 0.660, which is considered moderate to good. The rs coefficient rangewas 0.385–0.545; all rs coefficients were statistically significant (p < 0.05).CONCLUSIONS: Inter-rater reliability is marginal; however, within-rater evaluation appears to be consistent. The inter-item correlationis expected to be higher since all questions pertain to ADRs. Overall, the Naranjo criteria need modification for use in the ICU toimprove reliability, validity, and clinical usefulness. KEY WORDS: adverse drug reactions, Naranjo probability scale; critical care unit.Ann Pharmacother 2005;39:1823-7.Published Online, 4 Oct 2005, www.theannals.com, DOI 10.1345/aph.1G177
at UNIV CALIFORNIA SAN DIEGO on March 23, 2016aop.sagepub.comDownloaded from

Which of the following is TRUE regarding causality assessment of drug induced AKI?
a. Most cases will be classified as certainb. Scoring tools assess for AKI risk factorsc. Scoring tools prove the connection between
the drug and the eventd. The gold standard is expert consensus
Specific causality assessment tools for drug induced AKI have not been developed and expert consensus is still the gold standard.

Conclusions• Drug induced AKI has been standardized• Current causality assessment tools lack
assessment of AKI risk factors• Expert consensus remains the gold standard


![Review Article Pathophysiology of Cisplatin-Induced Acute ... · kidney contributes to its nephrotoxicity [ , ]. 3. General Pathophysiology e pathophysiology of cisplatin-induced](https://img.pdfslide.us/doc/110x75/61289e1d6416d118e54e3470/review-article-pathophysiology-of-cisplatin-induced-acute-kidney-contributes.jpg)