Embed Size (px)
Citation preview
Preformulation studies
School of Pharmaceutical Sciences 42
DRUG IDENTIFICATION TESTS
Determination of melting point(s)
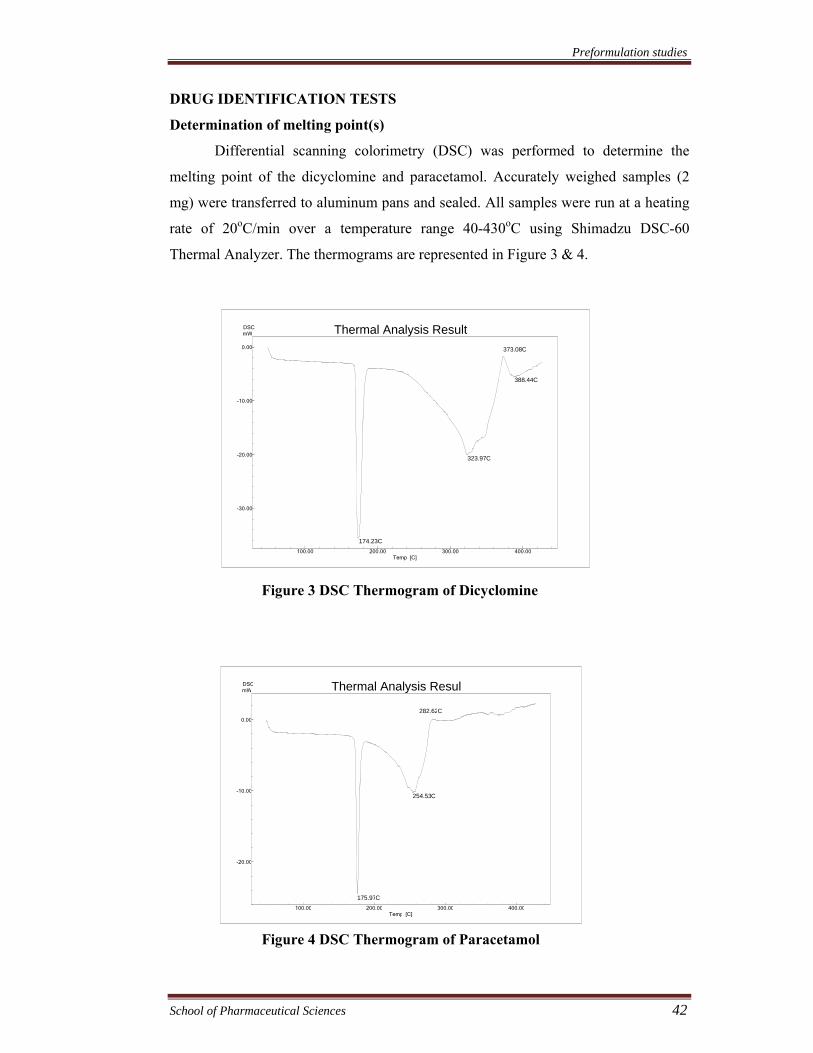
Differential scanning colorimetry (DSC) was performed to determine the
melting point of the dicyclomine and paracetamol. Accurately weighed samples (2
mg) were transferred to aluminum pans and sealed. All samples were run at a heating
rate of 20oC/min over a temperature range 40-430oC using Shimadzu DSC-60
Thermal Analyzer. The thermograms are represented in Figure 3 & 4.
100.00 200.00 300.00 400.00Temp [C]
-30.00
-20.00
-10.00
0.00
mWDSC
174.23C
323.97C
373.08C
388.44C
Thermal Analysis Result
100.00 200.00 300.00 400.00Temp [C]
-20.00
-10.00
0.00
mWDSC
175.97C
254.53C
282.62C
Thermal Analysis Result
Figure 3 DSC Thermogram of Dicyclomine
Figure 4 DSC Thermogram of Paracetamol

Preformulation studies
School of Pharmaceutical Sciences 43
Determination of absorption maxima (λmax)
Dicyclomine
10 mg of dicyclomine was accurately weighed and transferred to 100 ml
volumetric flask. The drug was dissolved in 0.1 N hydrochloric acid and the volume
was made up to 100 ml to obtain a stock solution of 100 μg/ml. One ml of this stock
solution was added to 5 ml of methyl orange solution and was extracted with
chloroform (3x1.5 ml). Organic layers were separated and pooled. The volume of
organic layer was made up to 10 ml with 0.5 % sodium acetate solution (Sethi 2008).
This solution was scanned between 400 nm to 500 nm in a double beam UV/ Visible
spectrophotometer (Shimadzu 1700). The λmax of the dicyclomine is shown in
Table 8.
Paracetamol
10 mg of paracetamol was accurately weighed and transferred to 100 ml of
volumetric flask. The drug was dissolved in methanol and the volume was made up to
100 ml to obtain a stock solution of 100 µg/ml. One ml of this stock solution was
again diluted with methanol up to 10 ml to obtain a solution of 10 µg/ml
(Pharmacopoeia of India 1996). The resulting solution was scanned between 200 nm
to 400 nm in a double beam UV/ Visible spectrophotometer (Shimadzu 1700). The
λmax of the paracetamol is shown in Table 8.
Loss on Drying
Dicyclomine
Loss on drying was determined by accurately weighing 1 gm of the drug and
drying at 105οC for three hours. It lost 0.0069 gm (NMT 1.0 %) of its weight
(Pharmacopoeia of India 1996). The results are presented in Table 8.
Paracetamol
Loss on drying was determined by accurately weighing 1 gm of the drug and
drying at 105οC for three hours. It lost 0.0023 gm (NMT 0.5 %) of its weight
(Pharmacopoeia of India 1996). The results are presented in Table 8.
Preformulation studies
School of Pharmaceutical Sciences 44
Table 8 Comparative values of respective parameters used to identify the
drug(s)
S.
No.
Drug(s) Melting point
(0C)
λmax
(nm)
Loss on Drying
(%)
1. Dicyclomine 174
(172-174)
420
(420)
0.69
(NMT 1%)
2. Paracetamol 176
(174-176)
249
(249)
0.23
(NMT 0.5%)
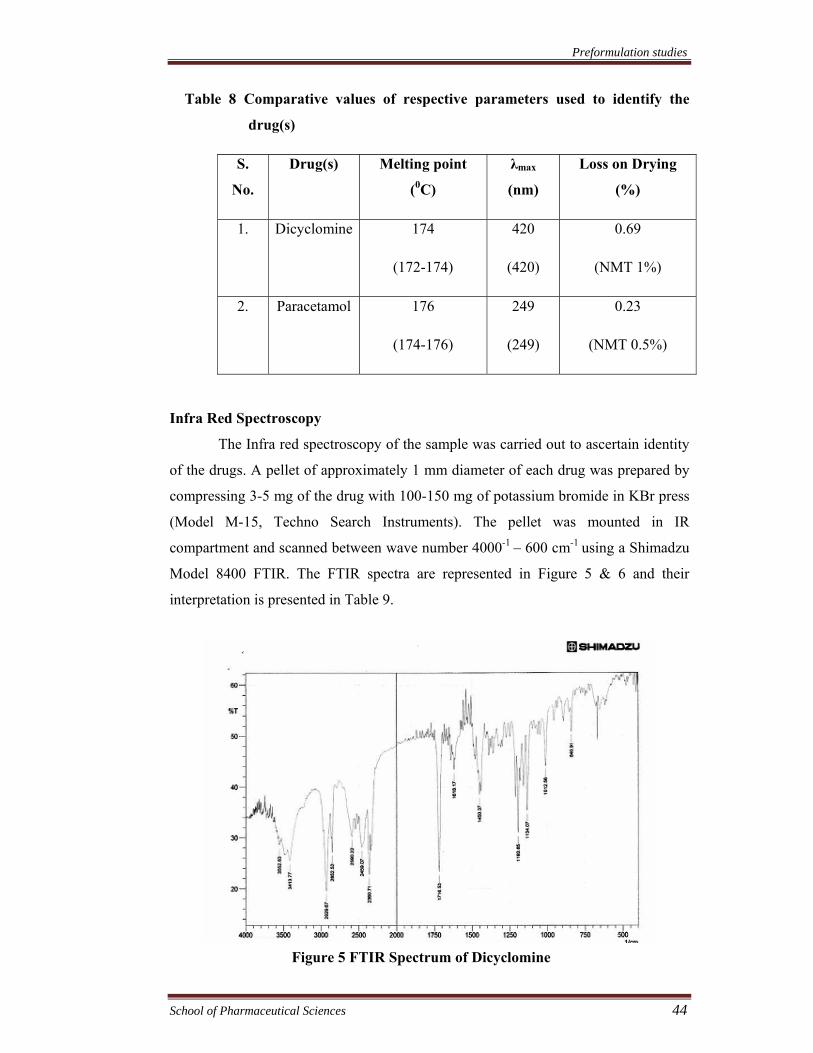
Infra Red Spectroscopy
The Infra red spectroscopy of the sample was carried out to ascertain identity
of the drugs. A pellet of approximately 1 mm diameter of each drug was prepared by
compressing 3-5 mg of the drug with 100-150 mg of potassium bromide in KBr press
(Model M-15, Techno Search Instruments). The pellet was mounted in IR
compartment and scanned between wave number 4000-1 – 600 cm-1 using a Shimadzu
Model 8400 FTIR. The FTIR spectra are represented in Figure 5 & 6 and their
interpretation is presented in Table 9.
Figure 5 FTIR Spectrum of Dicyclomine

Preformulation studies
School of Pharmaceutical Sciences 45
Figure 6 FTIR Spectrum of Paracetamol
Table 9 Interpretation of FTIR spectra of drugs
S. No.
Drug Reported Peaks (cm-1)
Observed Peak (cm-1)
Inference
1250-1020 1134.07 C-N stretching
1300-1000 1193.85 C-O stretching
3000-2840 2929.67 C-H stretching
1. Dicyclomine
1725-1700 1718.45 C=O (ester) stretching
3400-3200 3326..98 O-H stretching
3500-3100 3413.77 N-H stretching
1655-1620 1654.81 C=O (amide) stretching
1570-1515 1560.30 Amide II band
1250 1259.43 C-N-H group
2. Paracetamol
850-750 837.05 Para-disubstituted aromatic ring
Preformulation studies
School of Pharmaceutical Sciences 46
CALIBRATION CURVES
Calibration Curve of Dicyclomine
Preparation of Stock Solution
100 mg of dicyclomine was accurately weighed and transferred to 100 ml
volumetric flask. The drug was dissolved in 0.1 N hydrochloric acid to get a solution
of 1000 μg/ml (stock solution I). 10 ml of stock solution I was diluted to 100 ml with
0.1N HCl (Stock solution II). Further, 10 ml. of stock solution II was diluted up to 50
ml with methyl orange solution (1%w/v) and extracted with chloroform (3x15 ml).
Organic layers were separated and pooled. The volume of pooled organic layer was
made up to 100 ml with sodium acetate solution (Stoke solution III). This stock
solution III was used to prepare a series of standard dicyclomine solutions as
discussed below.
Procedure
From stock solution III aliquots of 1, 2, 3, 4, 5 6, 7 & 8 ml were transferred to
a series of 10 ml volumetric flasks. The volume was made up with 0.1 N HCl to give
10, 20, 30, 40, 50, 60, 70 & 80 μg/ml of dicyclomine. The absorbance of these
solutions was measured at 420 nm against blank. The same procedure was followed
for the preparation of standard curve of dicyclomine in phthalate buffer pH 4.5,
phosphate buffer pH 6.8, and phosphate buffer pH 7.4. The standard curve of
dicyclomine in phosphate buffer pH 6.8 with pectinex ultra-SPL was also prepared by
this method, where the drug was dissolved in mixture of 99 ml of buffer and 1 ml of
pectinex ultra-SPL for the preparation of stock solution III. The data are recorded in
Tables 10 & 11 and the curves are plotted Figure 7-Figure 11.

Preformulation studies
School of Pharmaceutical Sciences 47
Table 10 Calibration curves data of Dicyclomine
Absorbance± S.D. Concentration
µg/ ml 0.1 N HCl Phthalate buffer
pH 4.5
Phosphate buffer
pH 6.8
Phosphate buffer
pH 7.4
Phosphate buffer
pH 6.8 with
Pectinex ultra SPL
10 0.135±0.006 0.139±0.049 0.134±0.015 0.129±0.010 0.089±0.016
20 0.252±0.005 0.254±0.006 0.25±0.022 0.245±0.021 0.205±0.007
30 0.358±0.003 0.361±0.015 0.361±0.001 0.365±0.002 0.325±0.025
40 0.482±0.007 0.485±0.005 0.47±0.006 0.493±0.001 0.453±0.014
50 0.622±0.012 0.610±0.015 0.601±0.014 0.612±0.018 0.572±0.007
60 0.748±0.024 0.724±0.010 0.710±0.002 0.735±0.001 0.695±0.002
70 0.868±0.005 0.825±0.004 0.83±0.004 0.845±0.003 0.805±0.025
80 0.982±0.002 0.955±0.012 0.941±0.012 0.985±0.004 0.945±0.013
* Mean±S.D. (n=3)
Preformulation studies
School of Pharmaceutical Sciences 48
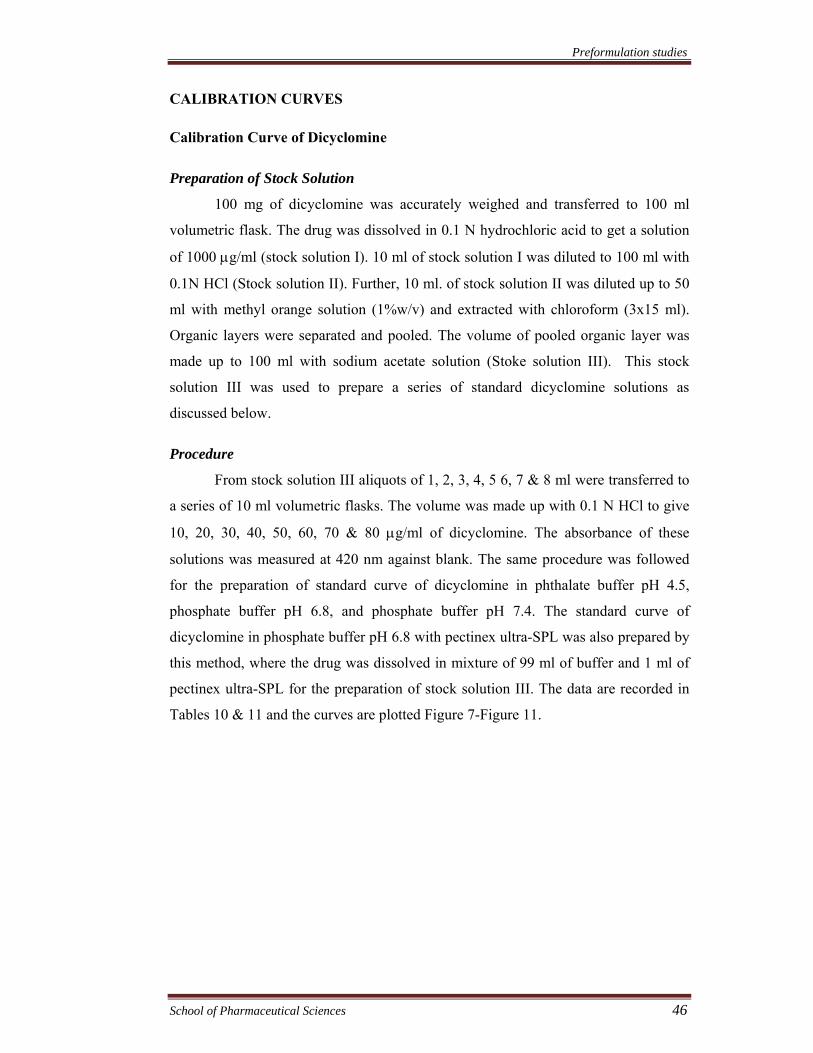
Figure 7 Calibration curve of dicyclomine in 0.1 N HCl
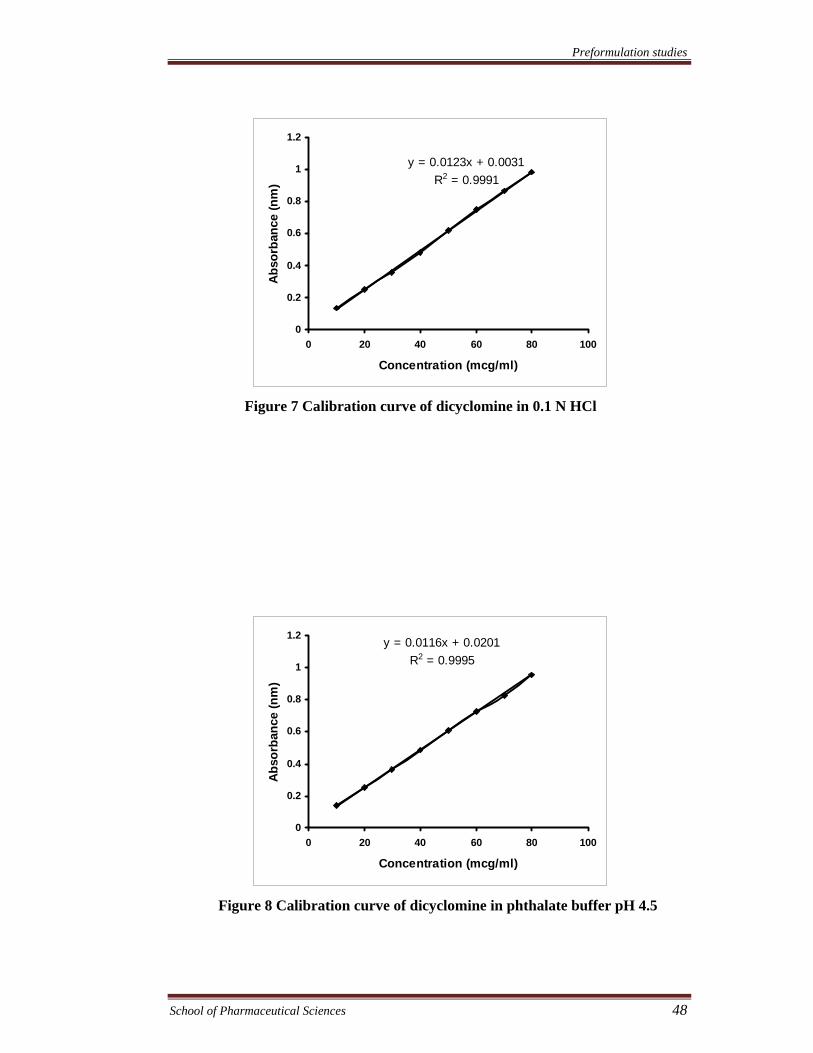
Figure 8 Calibration curve of dicyclomine in phthalate buffer pH 4.5
y = 0.0123x + 0.0031R2 = 0.9991
0
0.2
0.4
0.6
0.8
1
1.2
0 20 40 60 80 100
Concentration (mcg/ml)
Abs
orba
nce
(nm
)
y = 0.0116x + 0.0201R2 = 0.9995
0
0.2
0.4
0.6
0.8
1
1.2
0 20 40 60 80 100
Concentration (mcg/ml)
Abs
orba
nce
(nm
)

Preformulation studies
School of Pharmaceutical Sciences 49
Figure 9 Calibration curve of dicyclomine in phosphate buffer pH 6.8
Figure 10 Calibration curve of dicyclomine in phosphate buffer pH 7.4
y = 0.0116x + 0.016R2 = 0.9997
0
0.1
0.2
0.3
0.4
0.5
0.6
0.7
0.8
0.9
1
0 20 40 60 80 100
Concentration (mcg/ml)
Abs
orba
nce
(nm
)
y = 0.0122x + 0.0036R2 = 0.9997
0
0.2
0.4
0.6
0.8
1
1.2
0 20 40 60 80 100
Concentration (mcg/ml)
Abs
orba
nce
(nm
)
Preformulation studies
School of Pharmaceutical Sciences 50
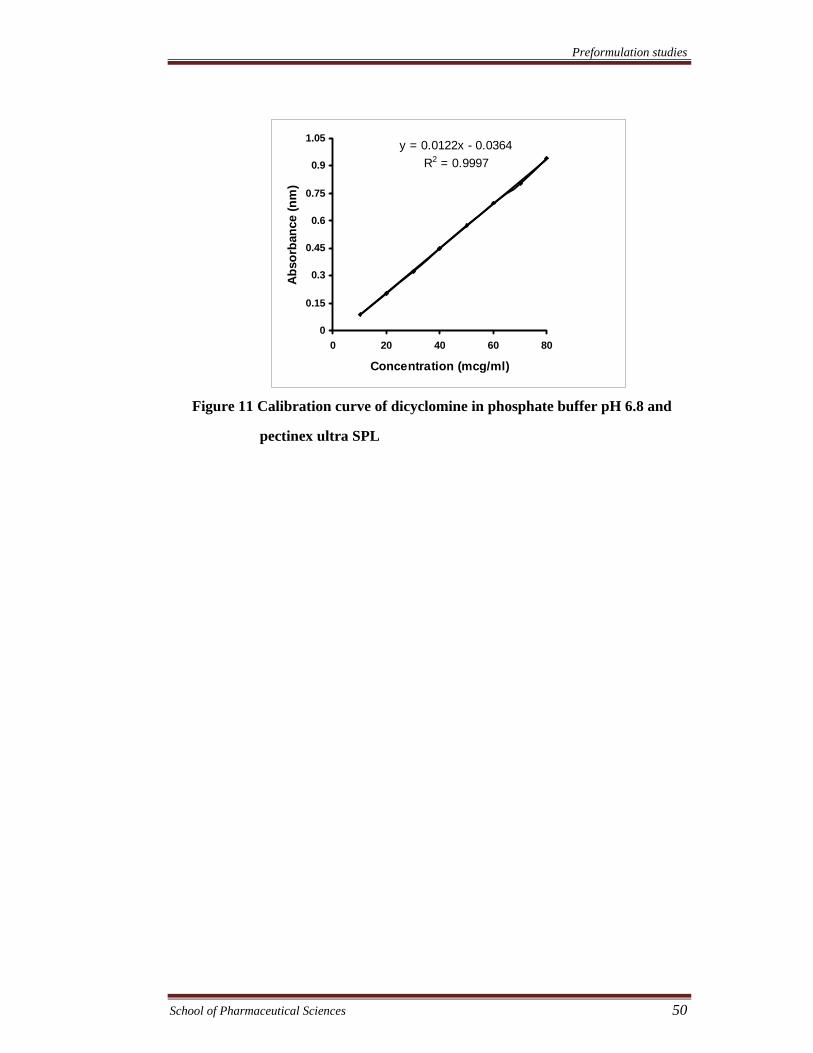
Figure 11 Calibration curve of dicyclomine in phosphate buffer pH 6.8 and
pectinex ultra SPL
y = 0.0122x - 0.0364R2 = 0.9997
0
0.15
0.3
0.45
0.6
0.75
0.9
1.05
0 20 40 60 80
Concentration (mcg/ml)
Abs
orba
nce
(nm
)
Preformulation studies
School of Pharmaceutical Sciences 51
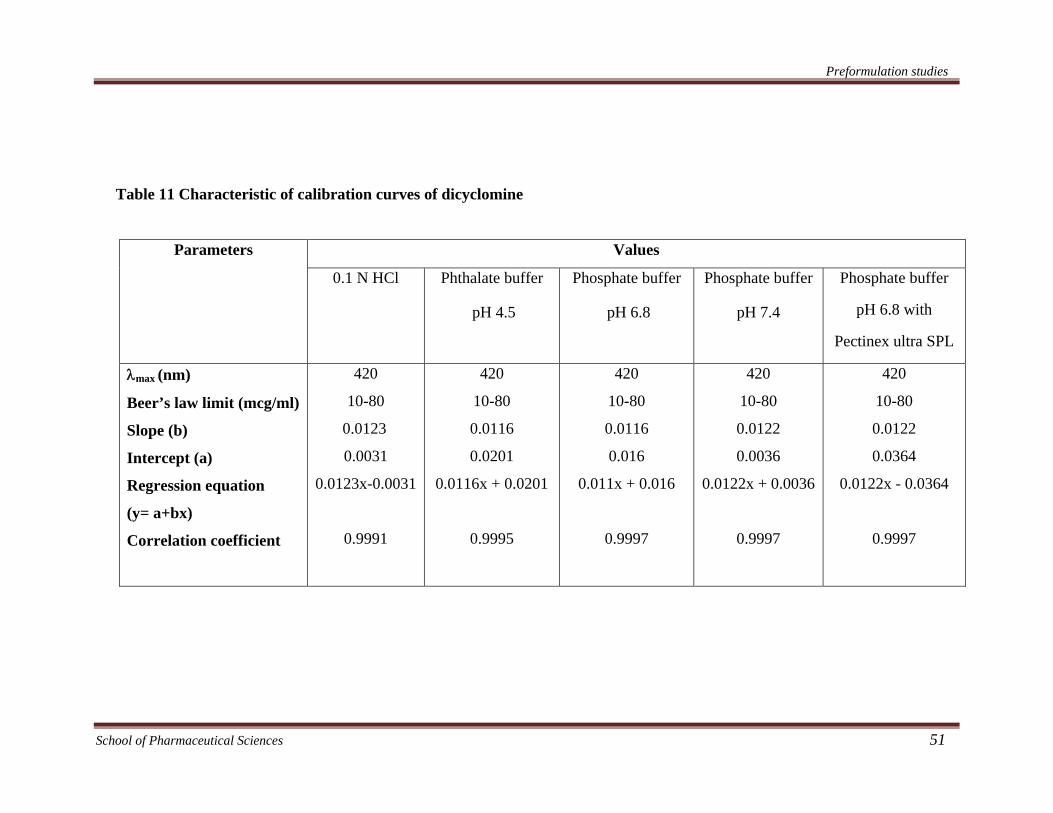
Table 11 Characteristic of calibration curves of dicyclomine
Values Parameters
0.1 N HCl Phthalate buffer
pH 4.5
Phosphate buffer
pH 6.8
Phosphate buffer
pH 7.4
Phosphate buffer
pH 6.8 with
Pectinex ultra SPL
λmax (nm)
Beer’s law limit (mcg/ml)
Slope (b)
Intercept (a)
Regression equation
(y= a+bx)
Correlation coefficient
420
10-80
0.0123
0.0031
0.0123x-0.0031
0.9991
420
10-80
0.0116
0.0201
0.0116x + 0.0201
0.9995
420
10-80
0.0116
0.016
0.011x + 0.016
0.9997
420
10-80
0.0122
0.0036
0.0122x + 0.0036
0.9997
420
10-80
0.0122
0.0364
0.0122x - 0.0364
0.9997

Preformulation studies
School of Pharmaceutical Sciences 52
Calibration Curve of Paracetamol
Preparation of Stock Solution
Accurately weighed 100 mg of the drug was transferred to 100 ml volumetric
flask. The drug was dissolved in 5 ml methanol. The volume was made up to the mark
with methanol (stock solution I) to make a solution of 1000 μg/ml. One ml of stock
solutions I (1000 μg) diluted to 50 ml with methanol to give a stock solution of
concentration 20 μg/ml (Stock solution II). Stock solution II was used to prepare a
series of standard drug solutions.
Procedure
From stock solution II aliquots of 1, 2, 3, 4, 5, 6, 7 & 8 ml were transferred to
a series of 10 ml volumetric flasks and the volume was made up to the mark with 0.1
N hydrochloric acid. The absorbance of standard solutions was measured at 249 nm.
Standard curves in phthalate buffer pH 4.5, phosphate buffer pH 6.8, and phosphate
buffer pH 7.4 were prepared by same method as described earlier. The standard curve
of paracetamol in phosphate buffer pH 6.8 containing pectinex ultra-SPL was also
prepared where the drug was dissolved in mixture of 99 ml of simulated intestinal
fluid of pH 6.8 and 1 ml of pectinex ultra-SPL for the preparation of stock solution II.
The calibration curves data is shown in Table 12 and 13 and the curves are plotted in
Figure 12-Figure 14.
Preformulation studies
School of Pharmaceutical Sciences 53
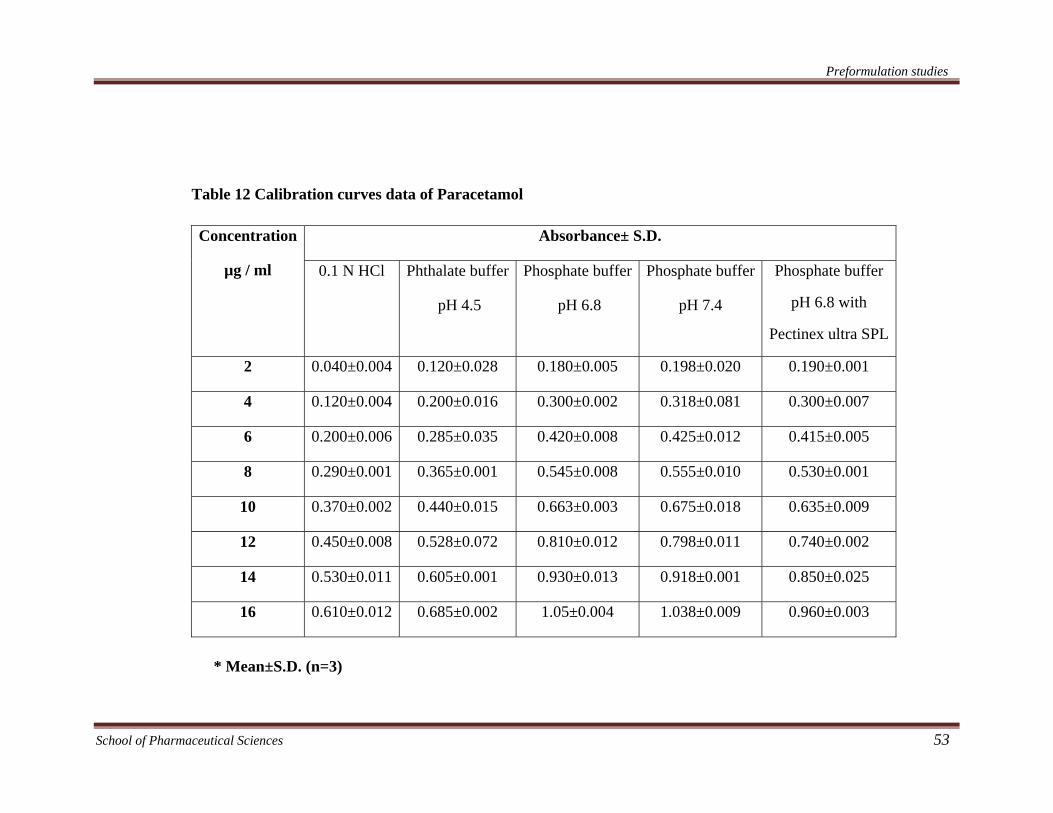
Table 12 Calibration curves data of Paracetamol
Absorbance± S.D. Concentration
µg / ml 0.1 N HCl Phthalate buffer
pH 4.5
Phosphate buffer
pH 6.8
Phosphate buffer
pH 7.4
Phosphate buffer
pH 6.8 with
Pectinex ultra SPL
2 0.040±0.004 0.120±0.028 0.180±0.005 0.198±0.020 0.190±0.001
4 0.120±0.004 0.200±0.016 0.300±0.002 0.318±0.081 0.300±0.007
6 0.200±0.006 0.285±0.035 0.420±0.008 0.425±0.012 0.415±0.005
8 0.290±0.001 0.365±0.001 0.545±0.008 0.555±0.010 0.530±0.001
10 0.370±0.002 0.440±0.015 0.663±0.003 0.675±0.018 0.635±0.009
12 0.450±0.008 0.528±0.072 0.810±0.012 0.798±0.011 0.740±0.002
14 0.530±0.011 0.605±0.001 0.930±0.013 0.918±0.001 0.850±0.025
16 0.610±0.012 0.685±0.002 1.05±0.004 1.038±0.009 0.960±0.003
* Mean±S.D. (n=3)
Preformulation studies
School of Pharmaceutical Sciences 54
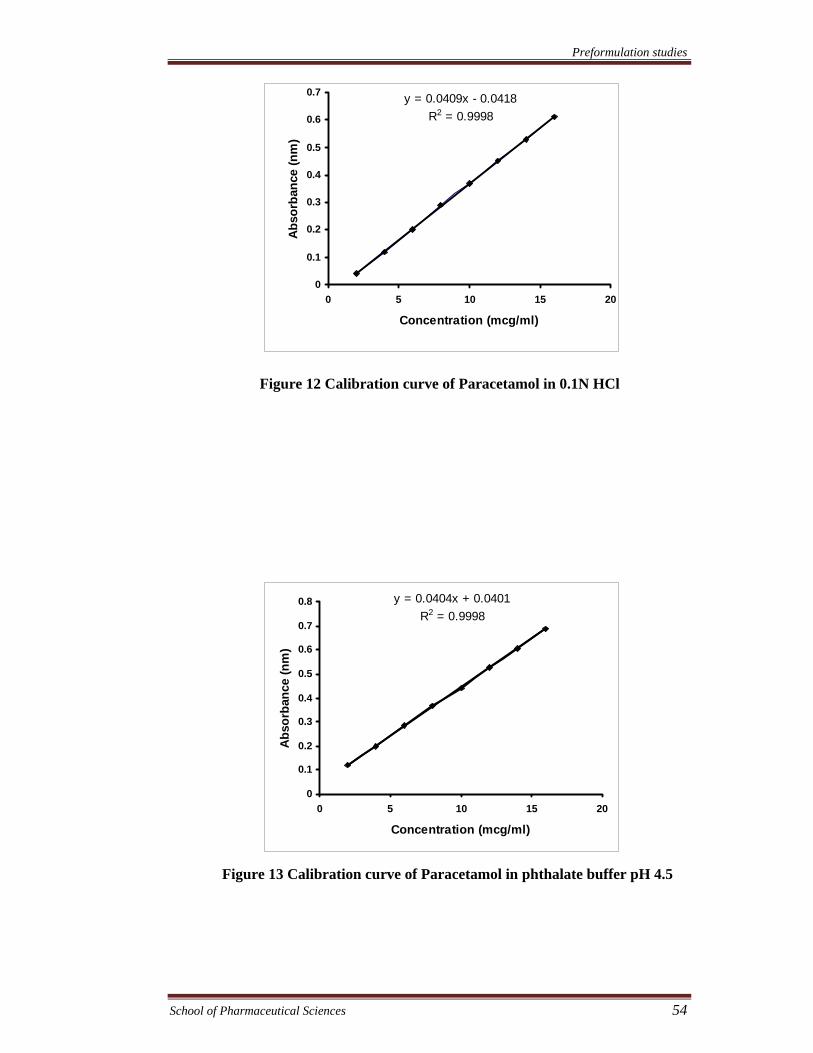
Figure 12 Calibration curve of Paracetamol in 0.1N HCl
Figure 13 Calibration curve of Paracetamol in phthalate buffer pH 4.5
y = 0.0409x - 0.0418R2 = 0.9998
0
0.1
0.2
0.3
0.4
0.5
0.6
0.7
0 5 10 15 20
Concentration (mcg/ml)
Abso
rban
ce (n
m)
y = 0.0404x + 0.0401R2 = 0.9998
0
0.1
0.2
0.3
0.4
0.5
0.6
0.7
0.8
0 5 10 15 20
Concentration (mcg/ml)
Abs
orba
nce
(nm
)
Preformulation studies
School of Pharmaceutical Sciences 55
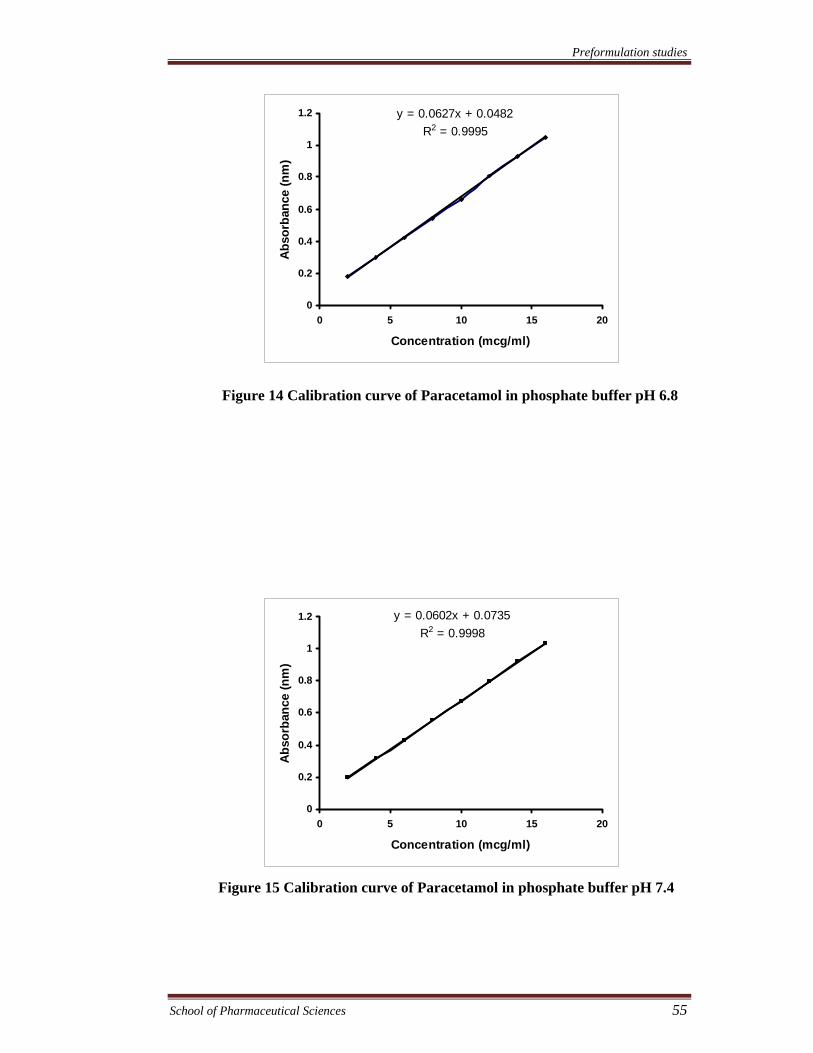
Figure 14 Calibration curve of Paracetamol in phosphate buffer pH 6.8
Figure 15 Calibration curve of Paracetamol in phosphate buffer pH 7.4
y = 0.0627x + 0.0482R2 = 0.9995
0
0.2
0.4
0.6
0.8
1
1.2
0 5 10 15 20
Concentration (mcg/ml)
Abs
orba
nce
(nm
)
y = 0.0602x + 0.0735R2 = 0.9998
0
0.2
0.4
0.6
0.8
1
1.2
0 5 10 15 20
Concentration (mcg/ml)
Abs
orba
nce
(nm
)
Preformulation studies
School of Pharmaceutical Sciences 56
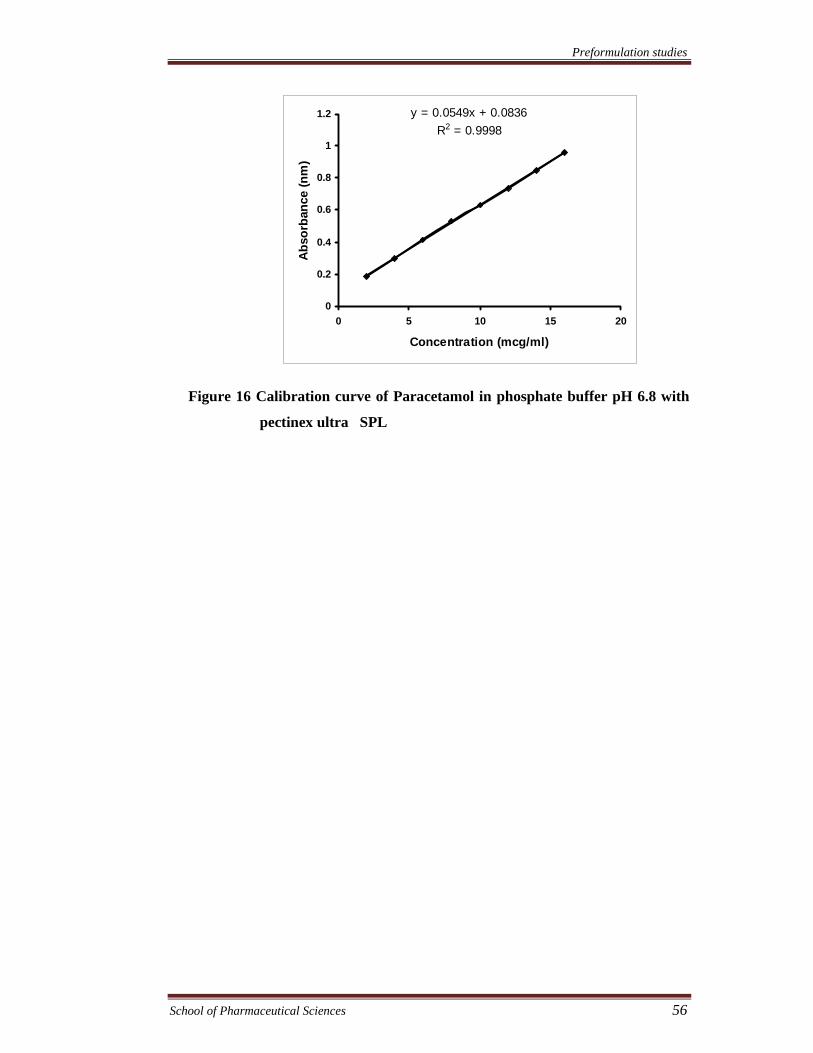
Figure 16 Calibration curve of Paracetamol in phosphate buffer pH 6.8 with
pectinex ultra SPL
y = 0.0549x + 0.0836R2 = 0.9998
0
0.2
0.4
0.6
0.8
1
1.2
0 5 10 15 20
Concentration (mcg/ml)
Abs
orba
nce
(nm
)
Preformulation studies
School of Pharmaceutical Sciences 57
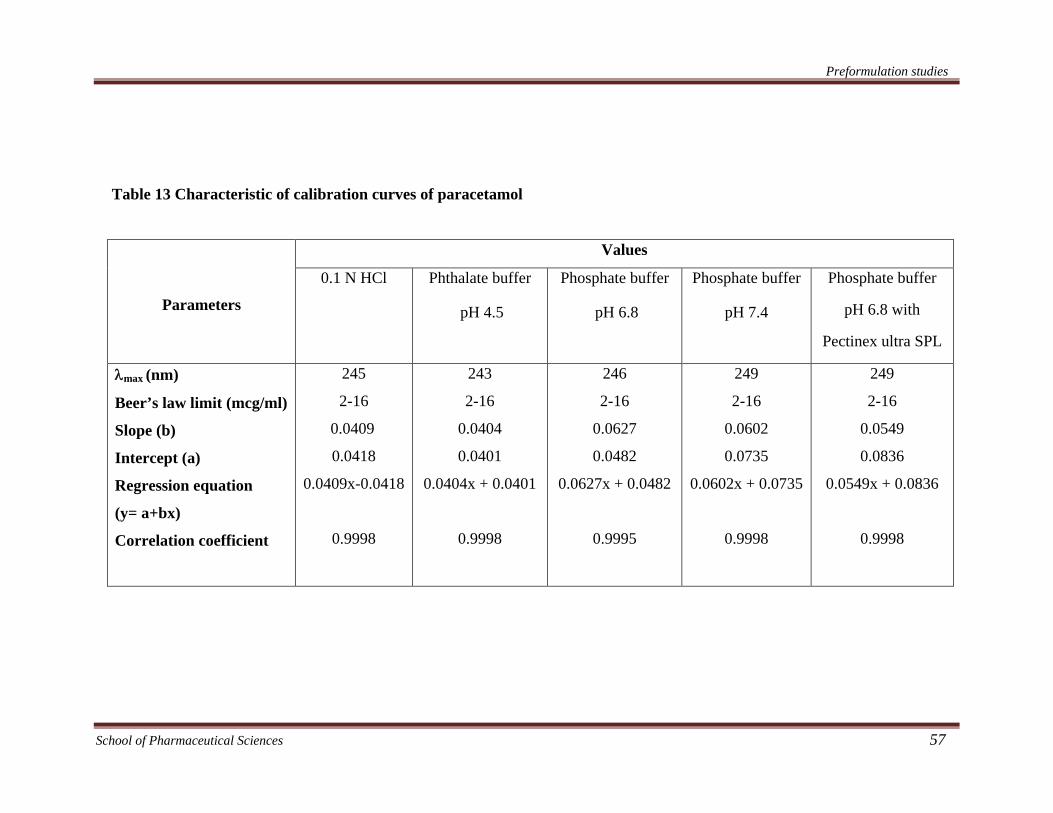
Table 13 Characteristic of calibration curves of paracetamol
Values
Parameters
0.1 N HCl Phthalate buffer
pH 4.5
Phosphate buffer
pH 6.8
Phosphate buffer
pH 7.4
Phosphate buffer
pH 6.8 with
Pectinex ultra SPL
λmax (nm)
Beer’s law limit (mcg/ml)
Slope (b)
Intercept (a)
Regression equation
(y= a+bx)
Correlation coefficient
245
2-16
0.0409
0.0418
0.0409x-0.0418
0.9998
243
2-16
0.0404
0.0401
0.0404x + 0.0401
0.9998
246
2-16
0.0627
0.0482
0.0627x + 0.0482
0.9995
249
2-16
0.0602
0.0735
0.0602x + 0.0735
0.9998
249
2-16
0.0549
0.0836
0.0549x + 0.0836
0.9998
Preformulation studies
School of Pharmaceutical Sciences 58
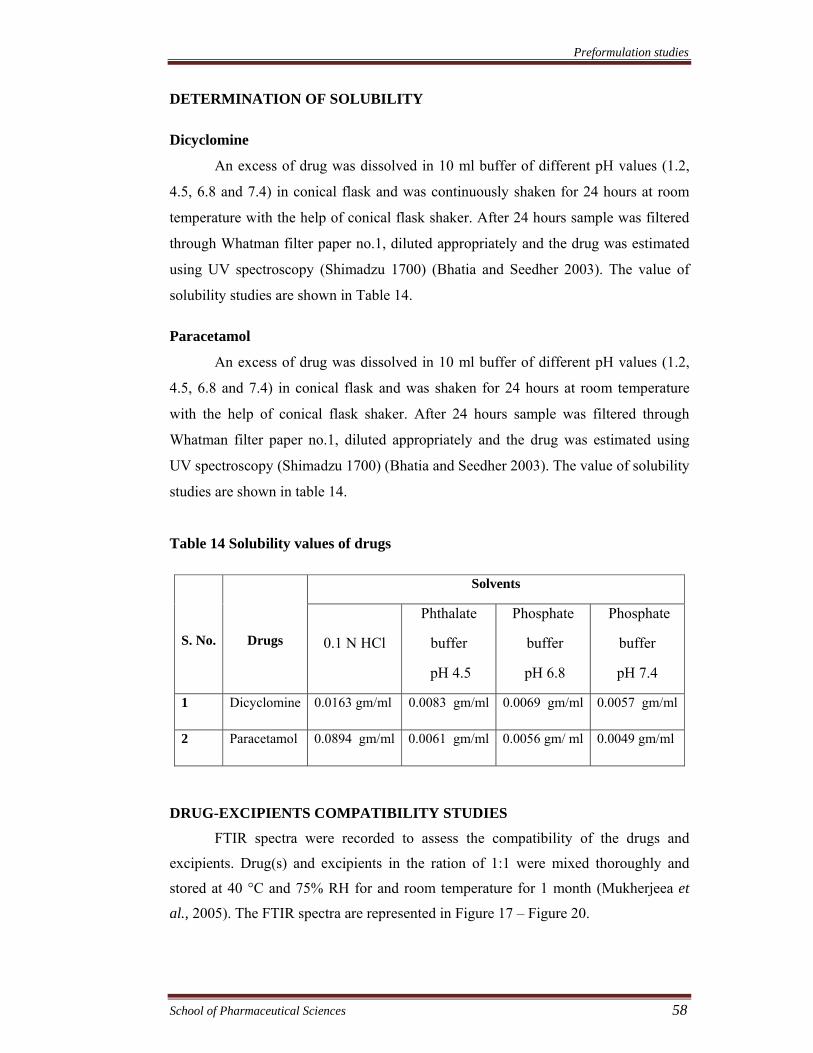
DETERMINATION OF SOLUBILITY
Dicyclomine
An excess of drug was dissolved in 10 ml buffer of different pH values (1.2,
4.5, 6.8 and 7.4) in conical flask and was continuously shaken for 24 hours at room
temperature with the help of conical flask shaker. After 24 hours sample was filtered
through Whatman filter paper no.1, diluted appropriately and the drug was estimated
using UV spectroscopy (Shimadzu 1700) (Bhatia and Seedher 2003). The value of
solubility studies are shown in Table 14.
Paracetamol
An excess of drug was dissolved in 10 ml buffer of different pH values (1.2,
4.5, 6.8 and 7.4) in conical flask and was shaken for 24 hours at room temperature
with the help of conical flask shaker. After 24 hours sample was filtered through
Whatman filter paper no.1, diluted appropriately and the drug was estimated using
UV spectroscopy (Shimadzu 1700) (Bhatia and Seedher 2003). The value of solubility
studies are shown in table 14.
Table 14 Solubility values of drugs
DRUG-EXCIPIENTS COMPATIBILITY STUDIES
FTIR spectra were recorded to assess the compatibility of the drugs and
excipients. Drug(s) and excipients in the ration of 1:1 were mixed thoroughly and
stored at 40 °C and 75% RH for and room temperature for 1 month (Mukherjeea et
al., 2005). The FTIR spectra are represented in Figure 17 – Figure 20.
Solvents
S. No.
Drugs
0.1 N HCl
Phthalate
buffer
pH 4.5
Phosphate
buffer
pH 6.8
Phosphate
buffer
pH 7.4
1 Dicyclomine 0.0163 gm/ml 0.0083 gm/ml 0.0069 gm/ml 0.0057 gm/ml
2 Paracetamol 0.0894 gm/ml 0.0061 gm/ml 0.0056 gm/ ml 0.0049 gm/ml
Preformulation studies
School of Pharmaceutical Sciences 59
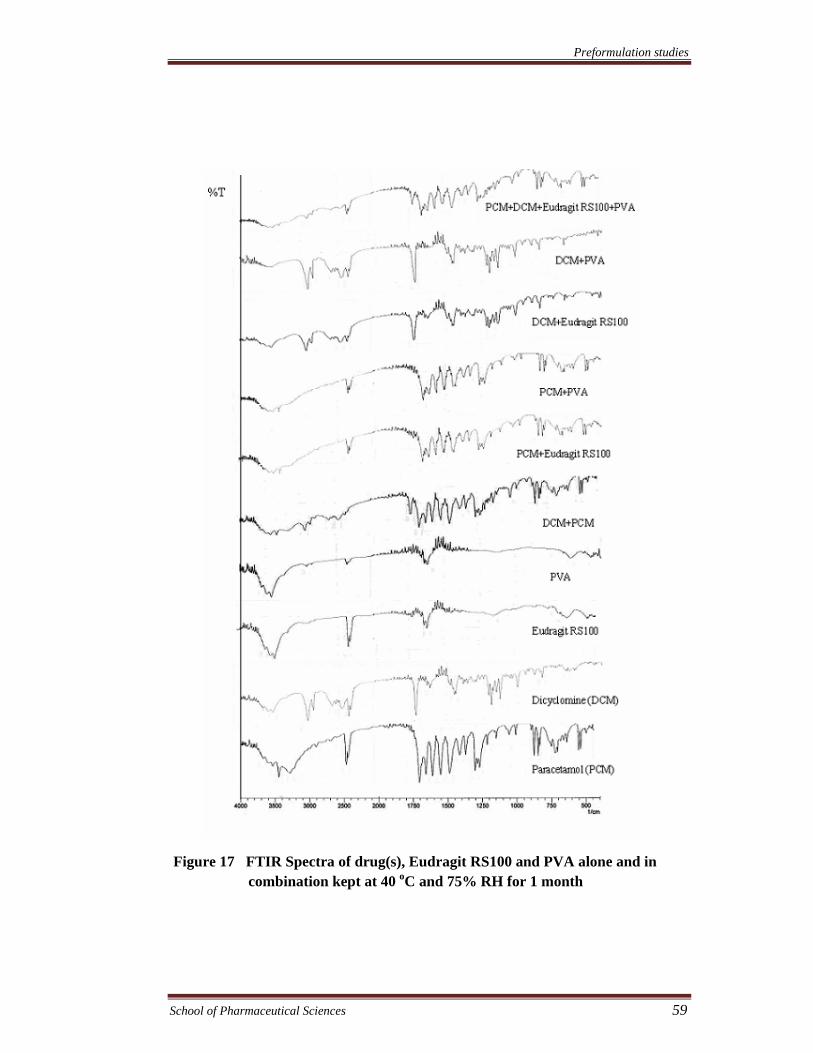
Figure 17 FTIR Spectra of drug(s), Eudragit RS100 and PVA alone and in combination kept at 40 oC and 75% RH for 1 month
Preformulation studies
School of Pharmaceutical Sciences 60
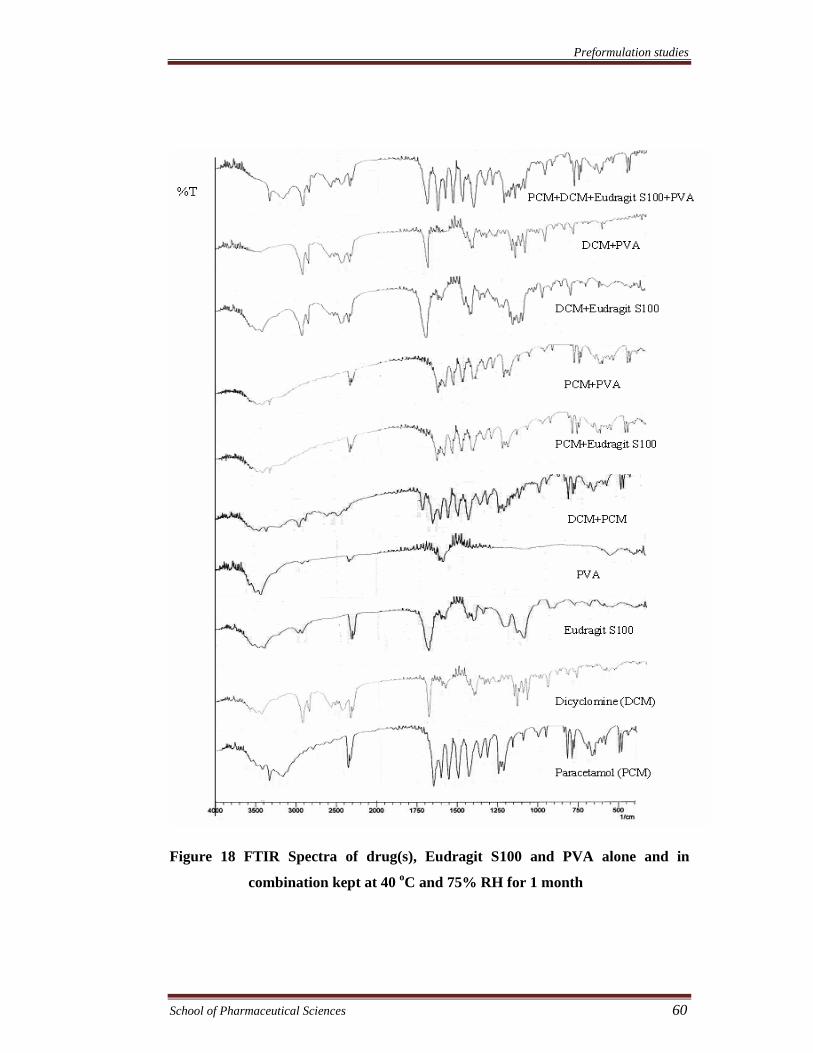
Figure 18 FTIR Spectra of drug(s), Eudragit S100 and PVA alone and in
combination kept at 40 oC and 75% RH for 1 month
Preformulation studies
School of Pharmaceutical Sciences 61
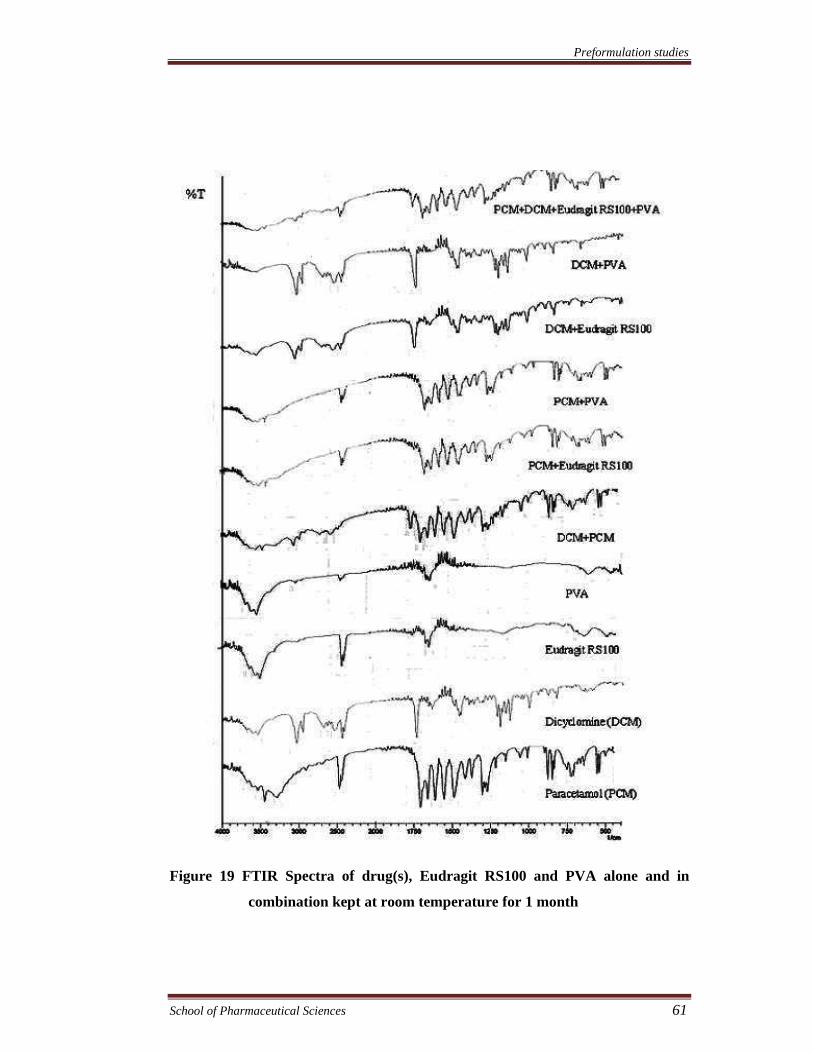
Figure 19 FTIR Spectra of drug(s), Eudragit RS100 and PVA alone and in
combination kept at room temperature for 1 month
Preformulation studies
School of Pharmaceutical Sciences 62
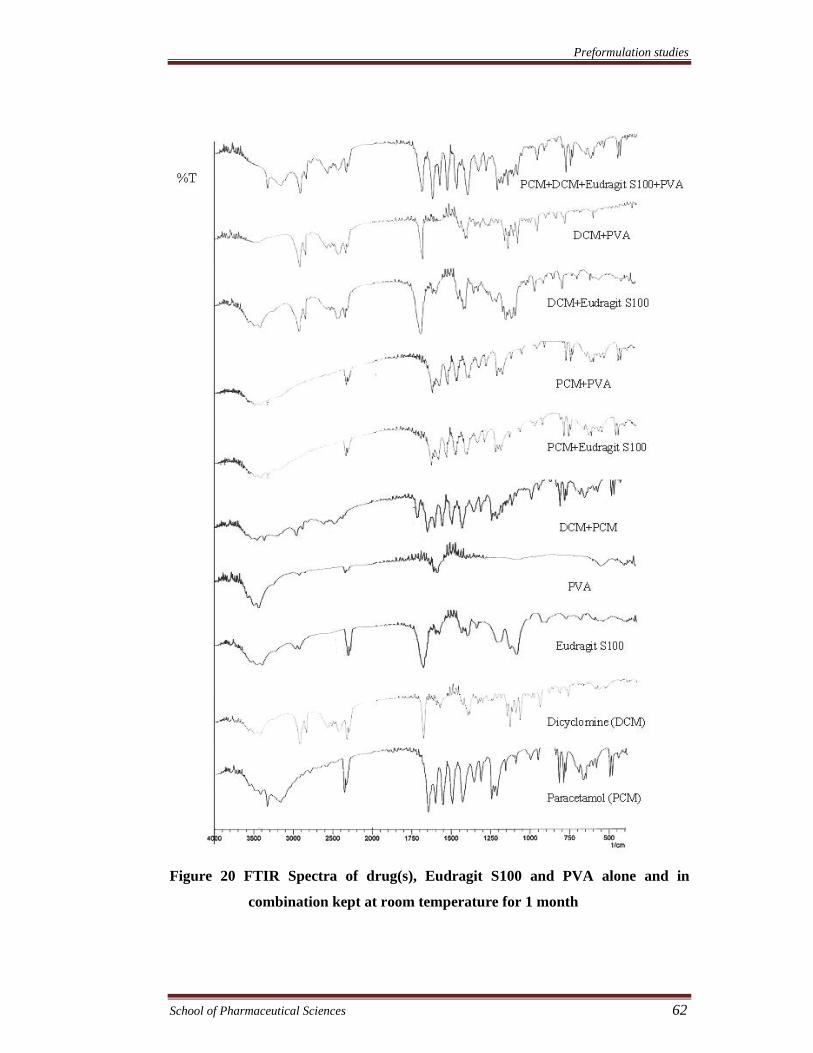
Figure 20 FTIR Spectra of drug(s), Eudragit S100 and PVA alone and in
combination kept at room temperature for 1 month
Preformulation studies
School of Pharmaceutical Sciences 63
RESULTS & DISCUSSION
Dicyclomine and paracetamol were identified using different methods viz.
melting point determination, determination of absorption maxima (λmax), loss on
drying, and FTIR spectroscopy.
The thermogram of differential scanning colorimetry showed sharp
endothermic peaks of dicyclomine and paracetamol at 174.23 °C and 175.97 °C,
respectively corresponding to the melting range of dicyclomine (172-174 °C) and
paracetamol (174-176 °C) in the crystalline form. Absorption maxima (λmax) of
dicyclomine and paracetamol were found to be at wavelength 420 nm and 249 nm
corresponding to the values reported in literature (dicyclomine - 420 nm and
paracetamol - 249 nm). The loss on drying for dicyclomine and paracetamol was
found to be 0.69% (limit NMT 1.0 %) and 0.23 % (limit NMT 0.5 %), respectively.
FTIR spectra of the dicyclomine, showed characteristic C-N, C-O, C-H, C=O
(ester) stretching bands at 1134.07 cm-1, 1193.85 cm-1, 2929.67 cm-1, 1718.45 cm-1,
respectively. FTIR spectra of paracetamol, showed characteristic O-H, N-H, C=O
(amide) stretching bands at 3326.98 cm-1, 3413.77 cm-1, 1654.81 cm-1, respectively.
Whereas, amide II band, C-N-H group and para-disubstituted aromatic rings at
1560.30 cm-1, 1259.43 cm-1 and 837.05 cm-1, respectively were also observed. The
observed FTIR specta of both the drugs were matched with reference spectra. The
study confirmed that the test samples were dicyclomine and paracetamol.
All the tests confirmed the identity and purity of both the drugs.
Calibration curves of both the drugs were prepared in 0.1N HCl, phthalate
buffer pH 4.5, phosphate buffer pH 6.8, phosphate buffer pH 7.4 and phosphate buffer
pH 6.8 with pectinex ultra SPL.
Calibration curve data of both the drugs were subjected to linear regression
analysis. Beer and Lambert’s law was found to be obeyed in the concentration range
of 10-80 mcg/ml and 2-16 mcg/ml for dicyclomine and paracetamol, respectively in
all the media. R-values were found to be 0. 9995, 0.9997, 0.9998, 0.9998 & 0.9998
for dicyclomine and 0. 9998, 0.9998, 0.9997, 0.9998 and 0.9998 for paracetamol in
0.1N HCl, phthalate buffer pH 4.5, phosphate buffer pH 6.8, phosphate buffer pH 7.4
and phosphate buffer pH 6.8 with pectinex ultra SPL, respectively which indicate
linearity.
Preformulation studies
School of Pharmaceutical Sciences 64
The solubility of both the drugs was determined in different media. Both drugs
were found to be sparingly soluble in acidic medium and slightly soluble in basic
medium. The solubility of dicyclomine in 0.1N HCl, phthalate buffer pH 4.5,
phosphate buffer pH 6.8, phosphate buffer pH 7.4 was found to be 0.0163 gm/ml,
0.0083 gm/ml, 0.0069 gm/ml, and 0.0057 gm/ml, respectively. The solubility of
paracetamol in 0.1N HCl, phthalate buffer pH 4.5, phosphate buffer pH 6.8,
phosphate buffer pH 7.4 was found to be 0.0894 gm/ml, 0.0061 gm/ml, 0.0056
gm/ml, and 0.0049 gm/ml, respectively.
FTIR spectra were recorded to assess the compatibility of the drugs and
excipients. The compatibility of drugs with eudragit RS100, eudragit S100, and PVA
was assessed by FTIR spectroscopy of the samples kept at 40°C and 75% RH and at
room temperature for 1 month. FTIR spectra of drug (s), physical mixture of drug (s),
physical mixture of drug (s) & eudragit RS-100, physical mixture of drug (s) &
eudragit S-100, physical mixture of drug (s) & PVA, physical mixture of drug (s),
PVA & eudragit RS100, and physical mixture of drug (s), PVA & eudragit S100 were
recorded and examined. In FTIR spectra of paracetamol, characteristic N-H stretching
band at 3413.77 cm−1, O-H stretching band at 3326.98 cm−1, and carbonyl stretching
band at 1654.81 cm−1 were noted and in case of dicyclomine, characteristic C=O
stretching band was observed at 1718.45 cm-1 which are in agreement with the
reported values. Eudragit RS 100 showed an ester C=O stretching peak around
1726.17 cm−1 and eudragit S 100 showed carbonyl stretching at 1718.46 cm-1 and
bond characteristic to carboxylic group in the range 2437-3473 cm-1 as reported in the
literature. All characteristic peaks of drug(s) were observed in the FTIR spectra of
physical mixture of drug (s) & eudragit S-100, physical mixture of drug (s) & PVA,
physical mixture of drug (s), PVA & eudragit RS100, and physical mixture of drug
(s), PVA & eudragit S100. The results showed no chemical interaction and changes
took place in FTIR spectra of both the drugs and various excipients alone or in
combination exhibiting compatibility of the drugs with all excipients.
Preparation and Characterization of Microsponge Formulations
School of Pharmaceutical Sciences 65
PREPARATION OF MICROSPONGES
Microsponges preparation using Eudragit RS-100
Eudragit RS-100 based paracetamol and dicyclomine loaded microsponges
were prepared by quasi-emulsion solvent diffusion method. The internal phase
consisted of eudragit RS-100 (200mg) and triethylcitrate (1% v/v, as plasticizer)
dissolved in 5 ml dichloromethane. The drug was added to this with gradual stirring
(500 rpm). The internal phase was then poured into 0.5 % w/v polyvinyl alcohol
(PVA, molecular weight 30,000-70,000) solution in water, the external phase. After 8
hour of stirring the microsponges were formed due to removal of dichloromethane
from the system. The microsponges were filtered and dried at 40°C for 12 hours (Orlu
et al., 2006).
The same method was used for the preparation of microsponges with eudragit
S-100 except the stirring rate which was kept at 1000 rpm. The compositions of
various microsponge formulations are given in Table 15 & 16.
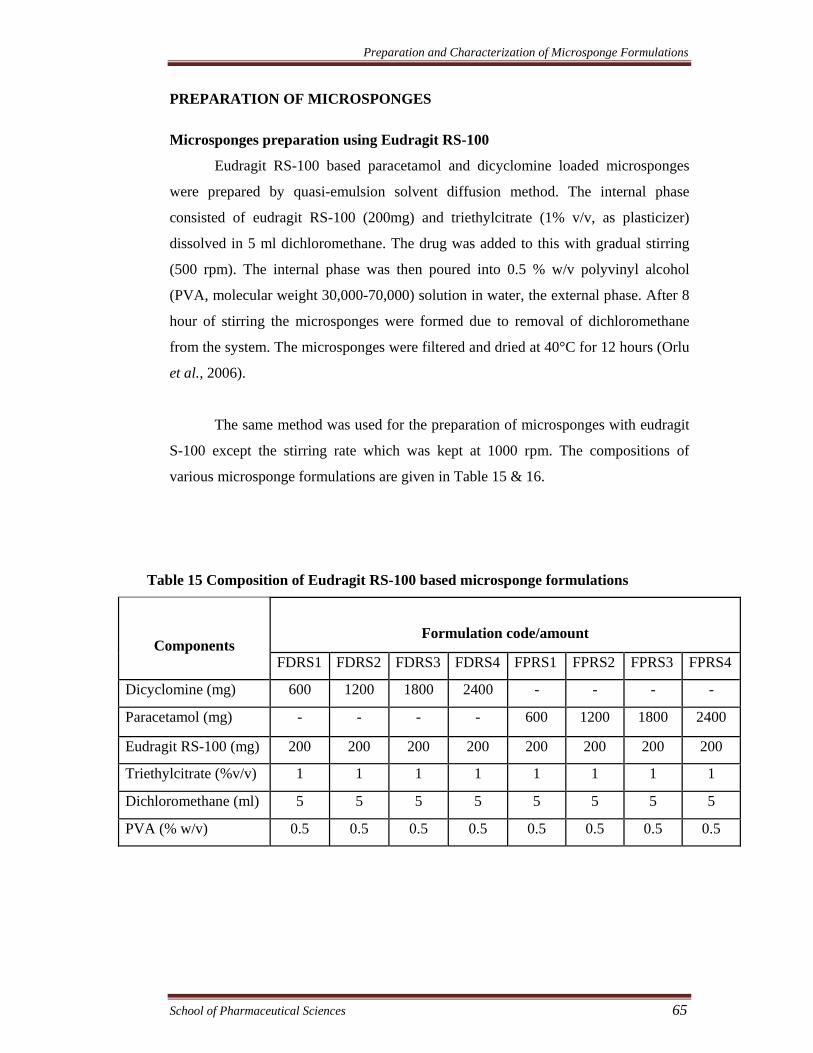
Table 15 Composition of Eudragit RS-100 based microsponge formulations
Formulation code/amount
Components FDRS1 FDRS2 FDRS3 FDRS4 FPRS1 FPRS2 FPRS3 FPRS4
Dicyclomine (mg) 600 1200 1800 2400 - - - -
Paracetamol (mg) - - - - 600 1200 1800 2400
Eudragit RS-100 (mg) 200 200 200 200 200 200 200 200
Triethylcitrate (%v/v) 1 1 1 1 1 1 1 1
Dichloromethane (ml) 5 5 5 5 5 5 5 5
PVA (% w/v) 0.5 0.5 0.5 0.5 0.5 0.5 0.5 0.5
Preparation and Characterization of Microsponge Formulations
School of Pharmaceutical Sciences 66
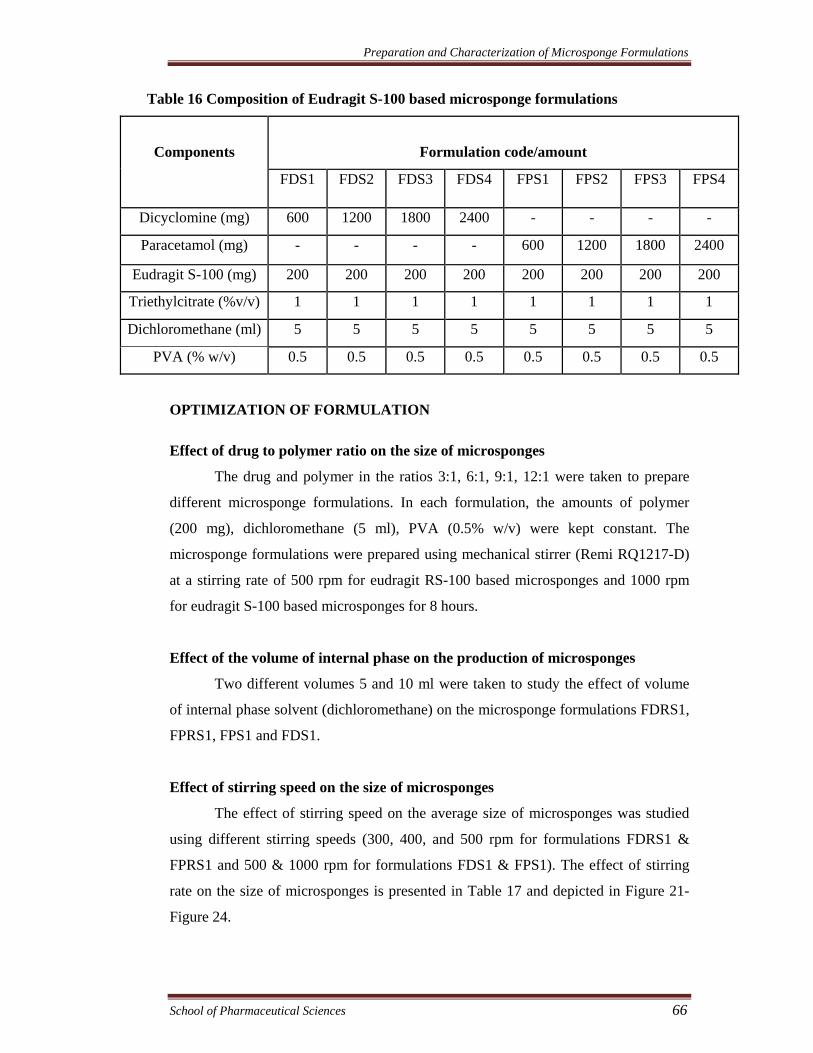
Table 16 Composition of Eudragit S-100 based microsponge formulations
Formulation code/amount
Components
FDS1 FDS2 FDS3 FDS4 FPS1 FPS2 FPS3 FPS4
Dicyclomine (mg) 600 1200 1800 2400 - - - -
Paracetamol (mg) - - - - 600 1200 1800 2400
Eudragit S-100 (mg) 200 200 200 200 200 200 200 200
Triethylcitrate (%v/v) 1 1 1 1 1 1 1 1
Dichloromethane (ml) 5 5 5 5 5 5 5 5
PVA (% w/v) 0.5 0.5 0.5 0.5 0.5 0.5 0.5 0.5
OPTIMIZATION OF FORMULATION
Effect of drug to polymer ratio on the size of microsponges
The drug and polymer in the ratios 3:1, 6:1, 9:1, 12:1 were taken to prepare
different microsponge formulations. In each formulation, the amounts of polymer
(200 mg), dichloromethane (5 ml), PVA (0.5% w/v) were kept constant. The
microsponge formulations were prepared using mechanical stirrer (Remi RQ1217-D)
at a stirring rate of 500 rpm for eudragit RS-100 based microsponges and 1000 rpm
for eudragit S-100 based microsponges for 8 hours.
Effect of the volume of internal phase on the production of microsponges
Two different volumes 5 and 10 ml were taken to study the effect of volume
of internal phase solvent (dichloromethane) on the microsponge formulations FDRS1,
FPRS1, FPS1 and FDS1.
Effect of stirring speed on the size of microsponges
The effect of stirring speed on the average size of microsponges was studied
using different stirring speeds (300, 400, and 500 rpm for formulations FDRS1 &
FPRS1 and 500 & 1000 rpm for formulations FDS1 & FPS1). The effect of stirring
rate on the size of microsponges is presented in Table 17 and depicted in Figure 21-
Figure 24.
Preparation and Characterization of Microsponge Formulations
School of Pharmaceutical Sciences 67
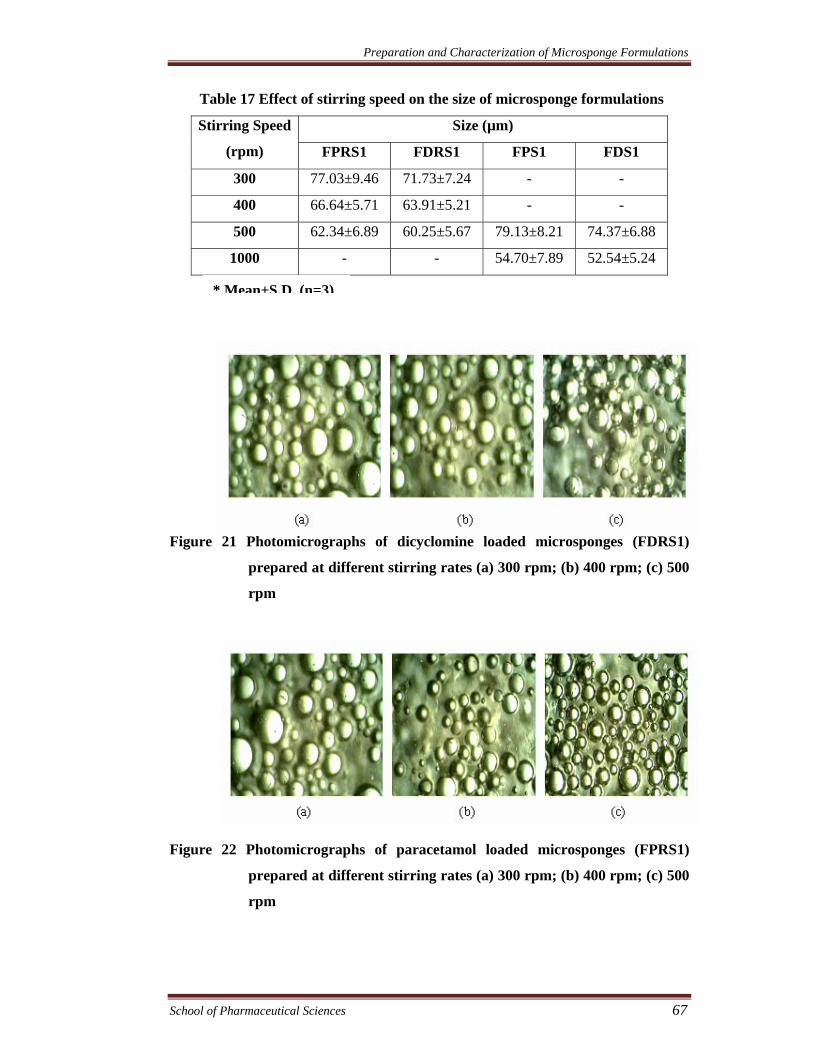
Table 17 Effect of stirring speed on the size of microsponge formulations
Size (µm) Stirring Speed
(rpm) FPRS1 FDRS1 FPS1 FDS1
300 77.03±9.46 71.73±7.24 - -
400 66.64±5.71 63.91±5.21 - -
500 62.34±6.89 60.25±5.67 79.13±8.21 74.37±6.88
1000 - - 54.70±7.89 52.54±5.24
Figure 21 Photomicrographs of dicyclomine loaded microsponges (FDRS1)
prepared at different stirring rates (a) 300 rpm; (b) 400 rpm; (c) 500
rpm
Figure 22 Photomicrographs of paracetamol loaded microsponges (FPRS1)
prepared at different stirring rates (a) 300 rpm; (b) 400 rpm; (c) 500
rpm
* Mean±S.D. (n=3)

Preparation and Characterization of Microsponge Formulations
School of Pharmaceutical Sciences 68
Figure 23 Photomicrographs of dicyclomine loaded microsponges (FDS1)
prepared at different stirring rates (a) 500 rpm; (b) 1000 rpm
Figure 24 Photomicrographs of paracetamol loaded microsponges (FPS1)
prepared at different stirring rates (a) 500 rpm; (b) 1000 rpm
Effect of the amount of emulsifying agent on the production yield and size of
microsponge
Two different concentrations viz. 0.5 % and 1.0 % w/v were taken to study the
effect of amount of emulsifying agent (PVA) on the microsponge formulations
(FDRS1, FPRS1, FPS1 and FDS1). The effect of emulsifying agent on microsponge
formulations is presented in Table 18.

Preparation and Characterization of Microsponge Formulations
School of Pharmaceutical Sciences 69
Table 18 The effect of emulsifying agent on microsponge formulations
Formulation
Code
PVA
(% w/v)
Yield (%)
Mean Diameter
(µm ± S.D.)
FPS1 0.5 70.56±0.23 54.70±7.89
FPS1 1.0 68.07±1.21 55.40±6.73
FPRS1 0.5 72.00±0.43 62.34±6.89
FPRS1 1.0 67.35±2.56 66.12±3.15
FDS1 0.5 73.06±0.21 52.54±5.24
FDS1 1.0 64.82±0.82 63.59±5.64
FDRS1 0.5 79.01±0.57 60.25±5.67
FDRS1 1.0 61.34±3.67 71.02±4.28
CHARACTERIZATION OF MICROSPONGES
Angle of repose
Angle of repose was determined using funnel method. 5 gm microsponges
were allowed to pass through a funnel that was raised vertically until a maximum
cone height, h, was obtained. Diameter of heap, D, was measured. The repose angle,θ,
was calculated by formula (Rao and Patil 2005).
The standard value and experimental value of angle of repose are shown in Table 19
and 20.
* Mean±S.D. (n=3)
Preparation and Characterization of Microsponge Formulations
School of Pharmaceutical Sciences 70
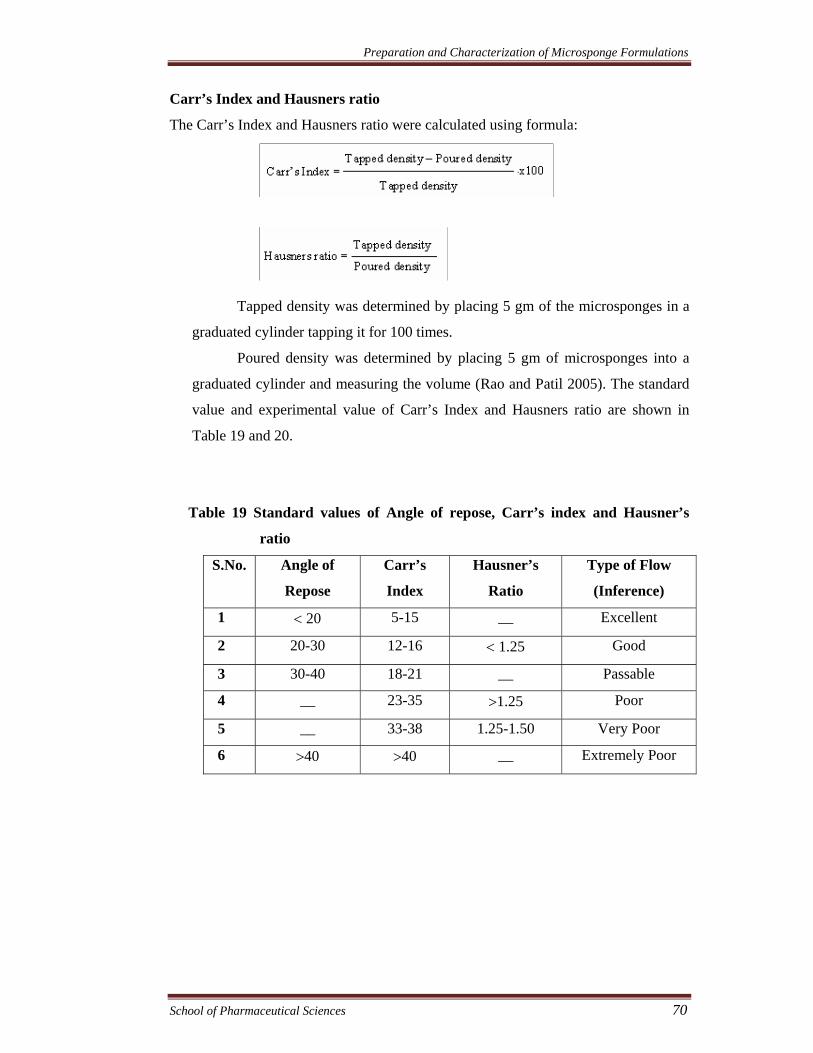
Carr’s Index and Hausners ratio
The Carr’s Index and Hausners ratio were calculated using formula:
Tapped density was determined by placing 5 gm of the microsponges in a
graduated cylinder tapping it for 100 times.
Poured density was determined by placing 5 gm of microsponges into a
graduated cylinder and measuring the volume (Rao and Patil 2005). The standard
value and experimental value of Carr’s Index and Hausners ratio are shown in
Table 19 and 20.
Table 19 Standard values of Angle of repose, Carr’s index and Hausner’s
ratio
S.No. Angle of
Repose
Carr’s
Index
Hausner’s
Ratio
Type of Flow
(Inference)
1 < 20 5-15 __ Excellent
2 20-30 12-16 < 1.25 Good
3 30-40 18-21 __ Passable
4 __ 23-35 >1.25 Poor
5 __ 33-38 1.25-1.50 Very Poor
6 >40 >40 __ Extremely Poor
Preparation and Characterization of Microsponge Formulations
School of Pharmaceutical Sciences 71
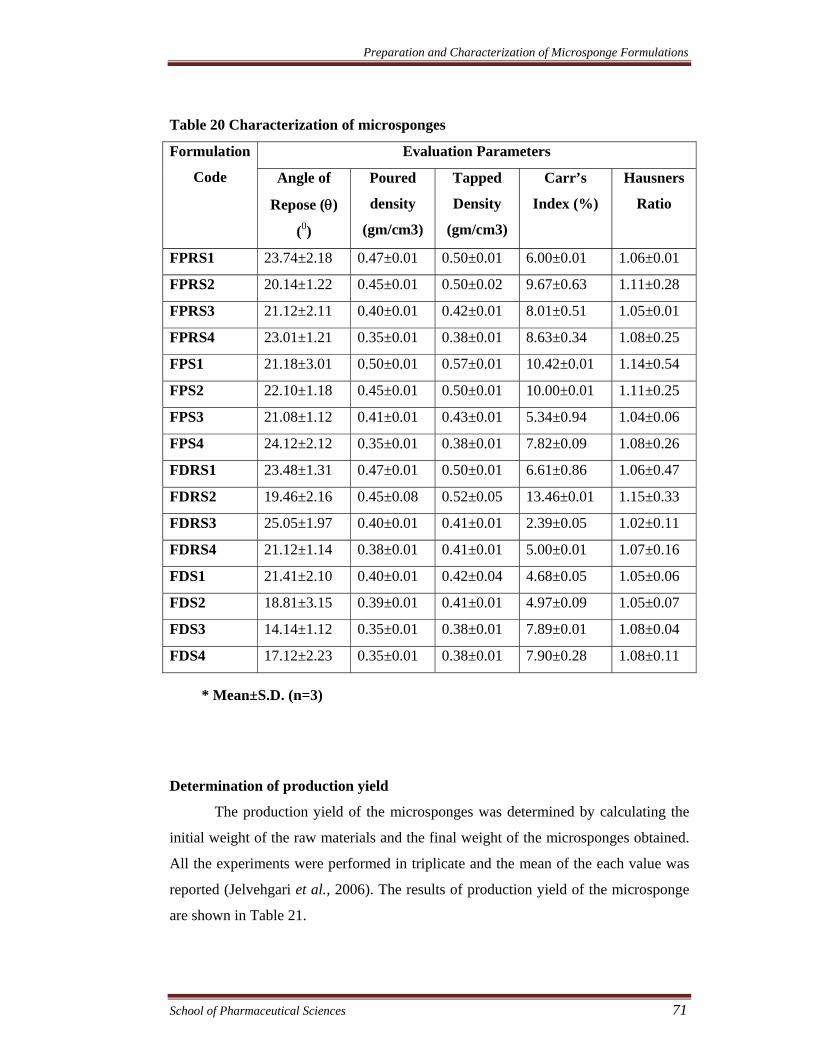
Table 20 Characterization of microsponges
Evaluation Parameters Formulation
Code Angle of
Repose (θ)
(0)
Poured
density
(gm/cm3)
Tapped
Density
(gm/cm3)
Carr’s
Index (%)
Hausners
Ratio
FPRS1 23.74±2.18 0.47±0.01 0.50±0.01 6.00±0.01 1.06±0.01
FPRS2 20.14±1.22 0.45±0.01 0.50±0.02 9.67±0.63 1.11±0.28
FPRS3 21.12±2.11 0.40±0.01 0.42±0.01 8.01±0.51 1.05±0.01
FPRS4 23.01±1.21 0.35±0.01 0.38±0.01 8.63±0.34 1.08±0.25
FPS1 21.18±3.01 0.50±0.01 0.57±0.01 10.42±0.01 1.14±0.54
FPS2 22.10±1.18 0.45±0.01 0.50±0.01 10.00±0.01 1.11±0.25
FPS3 21.08±1.12 0.41±0.01 0.43±0.01 5.34±0.94 1.04±0.06
FPS4 24.12±2.12 0.35±0.01 0.38±0.01 7.82±0.09 1.08±0.26
FDRS1 23.48±1.31 0.47±0.01 0.50±0.01 6.61±0.86 1.06±0.47
FDRS2 19.46±2.16 0.45±0.08 0.52±0.05 13.46±0.01 1.15±0.33
FDRS3 25.05±1.97 0.40±0.01 0.41±0.01 2.39±0.05 1.02±0.11
FDRS4 21.12±1.14 0.38±0.01 0.41±0.01 5.00±0.01 1.07±0.16
FDS1 21.41±2.10 0.40±0.01 0.42±0.04 4.68±0.05 1.05±0.06
FDS2 18.81±3.15 0.39±0.01 0.41±0.01 4.97±0.09 1.05±0.07
FDS3 14.14±1.12 0.35±0.01 0.38±0.01 7.89±0.01 1.08±0.04
FDS4 17.12±2.23 0.35±0.01 0.38±0.01 7.90±0.28 1.08±0.11
Determination of production yield
The production yield of the microsponges was determined by calculating the
initial weight of the raw materials and the final weight of the microsponges obtained.
All the experiments were performed in triplicate and the mean of the each value was
reported (Jelvehgari et al., 2006). The results of production yield of the microsponge
are shown in Table 21.
* Mean±S.D. (n=3)

Preparation and Characterization of Microsponge Formulations
School of Pharmaceutical Sciences 72
Actual drug content and encapsulation efficiency
For paracetamol microsponges
The weighed amount of drug loaded microsponges (100 mg) was suspended in
100 ml phosphate buffer pH 6.8 for 12 h and subjected to intermittent stirring. The
sample was filtered using 0.45_m membrane filter and analyzed at 249 nm against
blank using UV spectrophotometer (UV 1700, Shimadzu, Japan). All analyses were
carried out in triplicate. The results of actual drug content and encapsulation efficacy
are shown in Table 21.
For dicyclomine microsponges
The weighed amount of drug loaded microsponges (100 mg) was suspended in
100 ml phosphate buffer pH 6.8 for 12 h (sample-1) and subjected to intermittent
stirring. 10 ml of sample-1 was diluted with 10 ml of 0.1N HCl (sample-2). 10 ml of
sample-2 was further diluted with 50 ml of methyl orange (1%w/v) and extracted with
chloroform (3x1.5 ml). The organic phase was separate and pooled and the volume of
sample was made up to 100 ml with methylated sodium acetate. The solution was
filtered using 0.45_m membrane filter. The absorbance was taken at 420 nm against
blank using UV spectrophotometer (UV 1700, Shimadzu, Japan). The drug content
and encapsulation efficiency were calculated using the following formula.
Actual drug content (%) =Mact/Mms × 100
Encapsulation efficiency (%) =Mact/Mthe × 100
Where Mact is the actual drug content in microsponges, Mms is the total amount of the
microsponges and Mthe is the amount of drug added to the microsponges. All analyses
were carried out in triplicate. The results of actual drug content and encapsulation
efficacy are shown in Table 21.
Particle size analysis
Particle size was determined by photomicroscope (RXLr-3T, Radical). Microsponges
were suspended in glycerol, and the particle size was determined using the software,
Biowizard. The results of particle size analysis are shown in Table 21.
Preparation and Characterization of Microsponge Formulations
School of Pharmaceutical Sciences 73
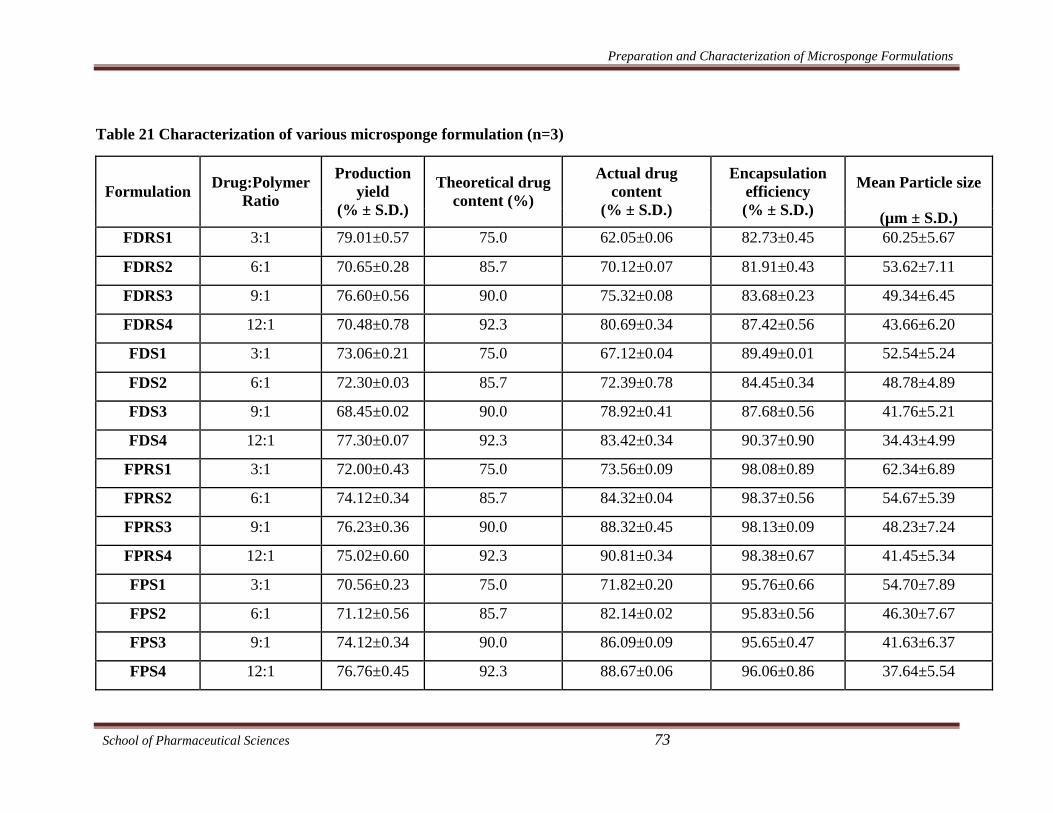
Table 21 Characterization of various microsponge formulation (n=3)
Mean Particle size Formulation Drug:Polymer Ratio
Production yield
(% ± S.D.)
Theoretical drug content (%)
Actual drug content
(% ± S.D.)
Encapsulation efficiency (% ± S.D.) (µm ± S.D.)
FDRS1 3:1 79.01±0.57 75.0 62.05±0.06 82.73±0.45 60.25±5.67
FDRS2 6:1 70.65±0.28 85.7 70.12±0.07 81.91±0.43 53.62±7.11
FDRS3 9:1 76.60±0.56 90.0 75.32±0.08 83.68±0.23 49.34±6.45
FDRS4 12:1 70.48±0.78 92.3 80.69±0.34 87.42±0.56 43.66±6.20
FDS1 3:1 73.06±0.21 75.0 67.12±0.04 89.49±0.01 52.54±5.24
FDS2 6:1 72.30±0.03 85.7 72.39±0.78 84.45±0.34 48.78±4.89
FDS3 9:1 68.45±0.02 90.0 78.92±0.41 87.68±0.56 41.76±5.21
FDS4 12:1 77.30±0.07 92.3 83.42±0.34 90.37±0.90 34.43±4.99
FPRS1 3:1 72.00±0.43 75.0 73.56±0.09 98.08±0.89 62.34±6.89
FPRS2 6:1 74.12±0.34 85.7 84.32±0.04 98.37±0.56 54.67±5.39
FPRS3 9:1 76.23±0.36 90.0 88.32±0.45 98.13±0.09 48.23±7.24
FPRS4 12:1 75.02±0.60 92.3 90.81±0.34 98.38±0.67 41.45±5.34
FPS1 3:1 70.56±0.23 75.0 71.82±0.20 95.76±0.66 54.70±7.89
FPS2 6:1 71.12±0.56 85.7 82.14±0.02 95.83±0.56 46.30±7.67
FPS3 9:1 74.12±0.34 90.0 86.09±0.09 95.65±0.47 41.63±6.37
FPS4 12:1 76.76±0.45 92.3 88.67±0.06 96.06±0.86 37.64±5.54
Preparation and Characterization of Microsponge Formulations
School of Pharmaceutical Sciences 74
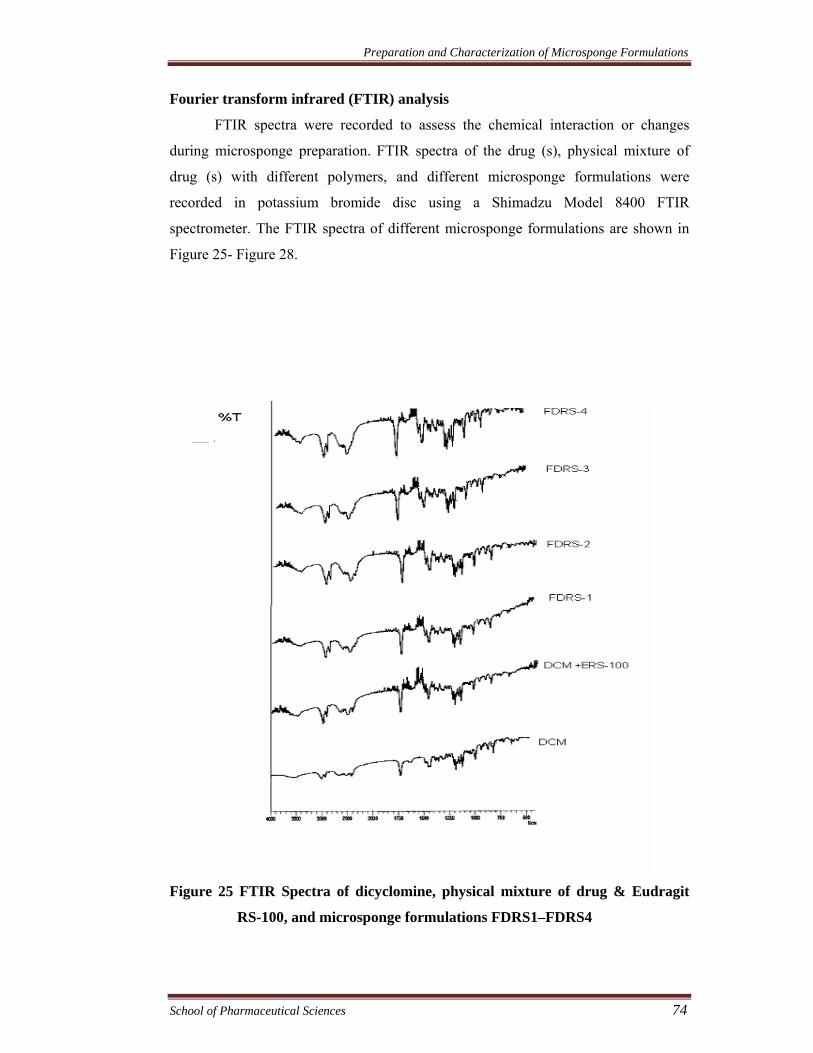
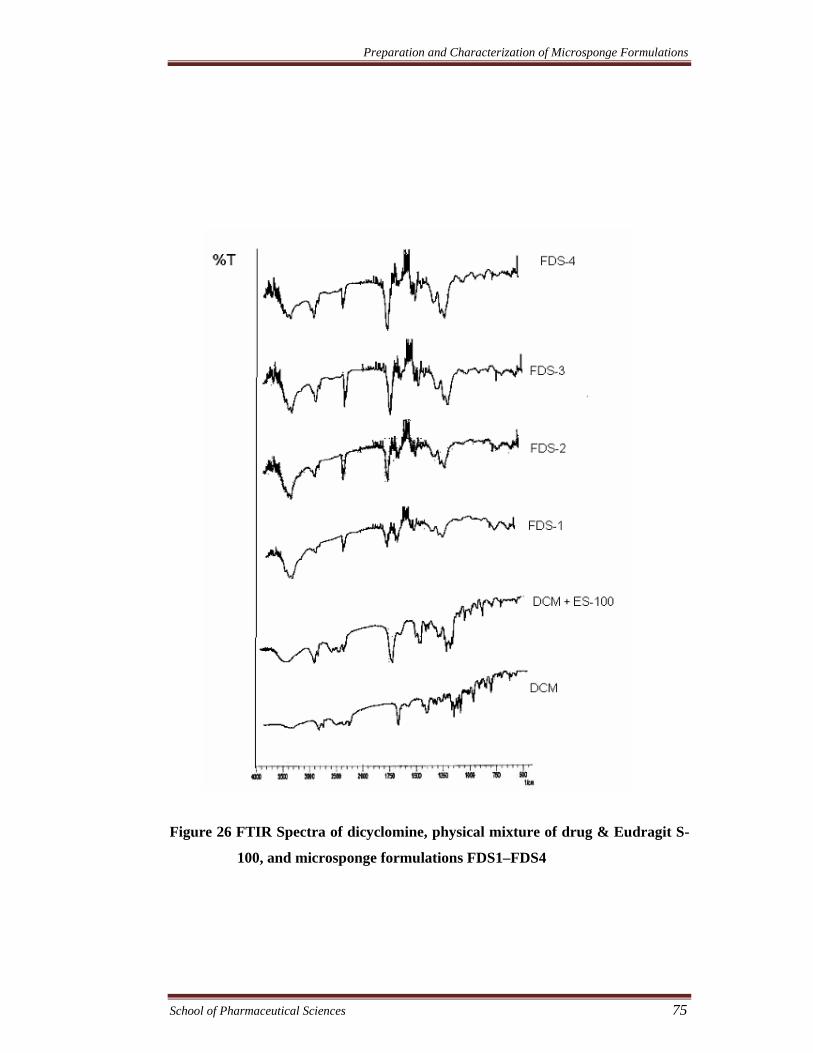
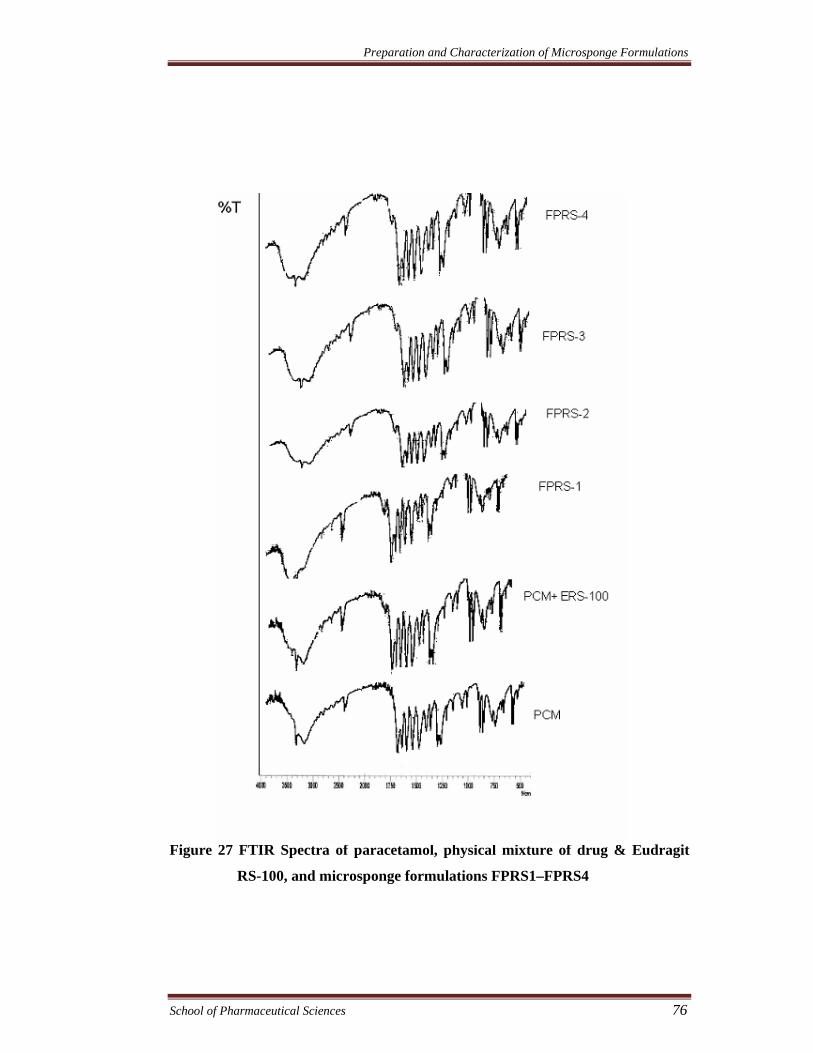
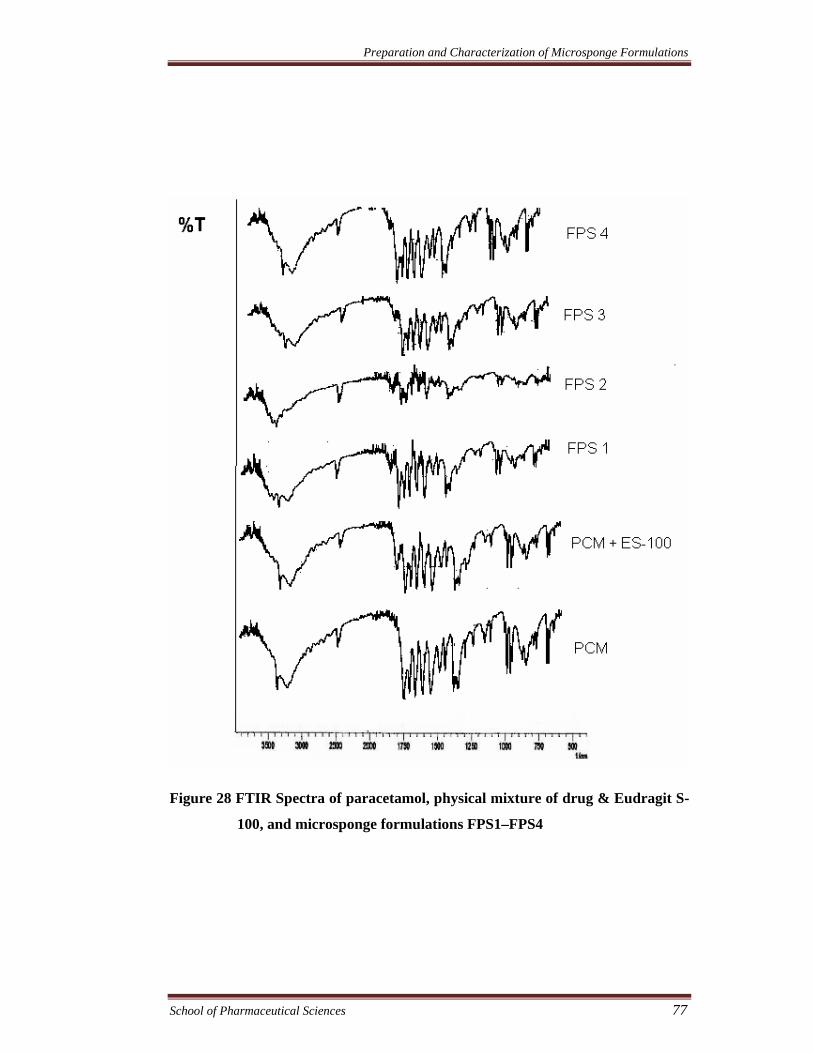
Fourier transform infrared (FTIR) analysis
FTIR spectra were recorded to assess the chemical interaction or changes
during microsponge preparation. FTIR spectra of the drug (s), physical mixture of
drug (s) with different polymers, and different microsponge formulations were
recorded in potassium bromide disc using a Shimadzu Model 8400 FTIR
spectrometer. The FTIR spectra of different microsponge formulations are shown in
Figure 25- Figure 28.
Figure 25 FTIR Spectra of dicyclomine, physical mixture of drug & Eudragit
RS-100, and microsponge formulations FDRS1–FDRS4
Preparation and Characterization of Microsponge Formulations
School of Pharmaceutical Sciences 75
Figure 26 FTIR Spectra of dicyclomine, physical mixture of drug & Eudragit S-
100, and microsponge formulations FDS1–FDS4
Preparation and Characterization of Microsponge Formulations
School of Pharmaceutical Sciences 76
Figure 27 FTIR Spectra of paracetamol, physical mixture of drug & Eudragit
RS-100, and microsponge formulations FPRS1–FPRS4
Preparation and Characterization of Microsponge Formulations
School of Pharmaceutical Sciences 77
Figure 28 FTIR Spectra of paracetamol, physical mixture of drug & Eudragit S-
100, and microsponge formulations FPS1–FPS4
Preparation and Characterization of Microsponge Formulations
School of Pharmaceutical Sciences 78
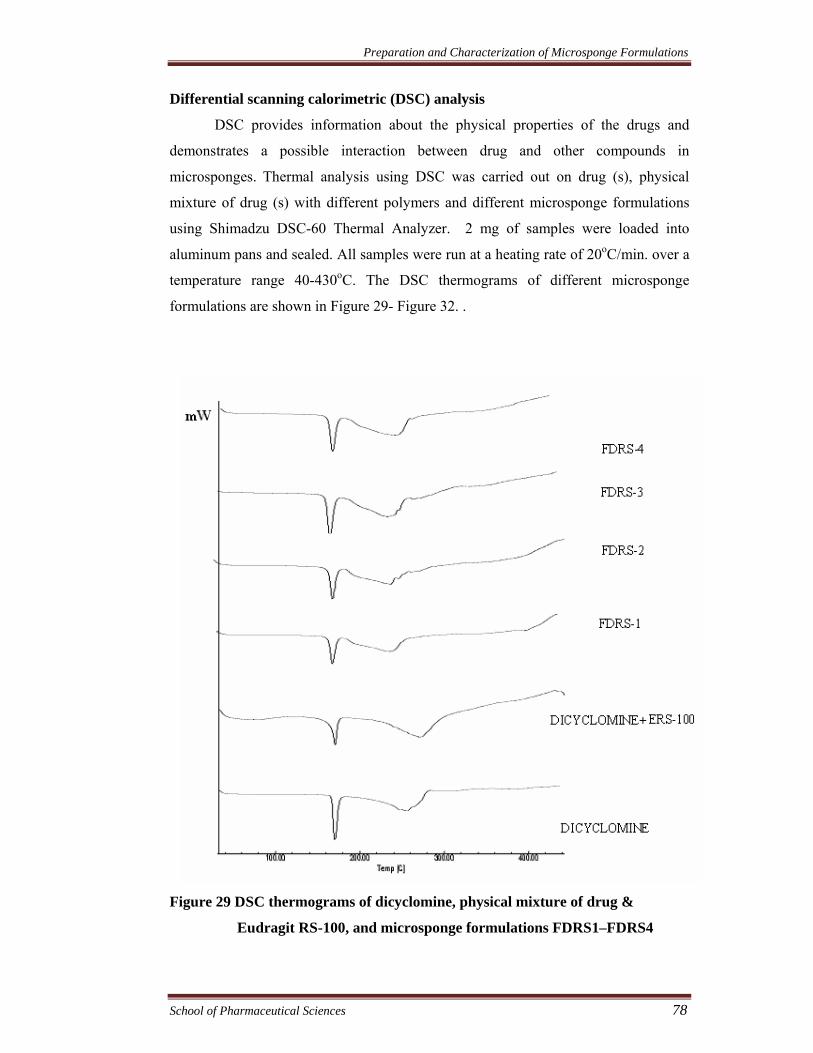
Differential scanning calorimetric (DSC) analysis
DSC provides information about the physical properties of the drugs and
demonstrates a possible interaction between drug and other compounds in
microsponges. Thermal analysis using DSC was carried out on drug (s), physical
mixture of drug (s) with different polymers and different microsponge formulations
using Shimadzu DSC-60 Thermal Analyzer. 2 mg of samples were loaded into
aluminum pans and sealed. All samples were run at a heating rate of 20oC/min. over a
temperature range 40-430oC. The DSC thermograms of different microsponge
formulations are shown in Figure 29- Figure 32. .
Figure 29 DSC thermograms of dicyclomine, physical mixture of drug &
Eudragit RS-100, and microsponge formulations FDRS1–FDRS4
Preparation and Characterization of Microsponge Formulations
School of Pharmaceutical Sciences 79
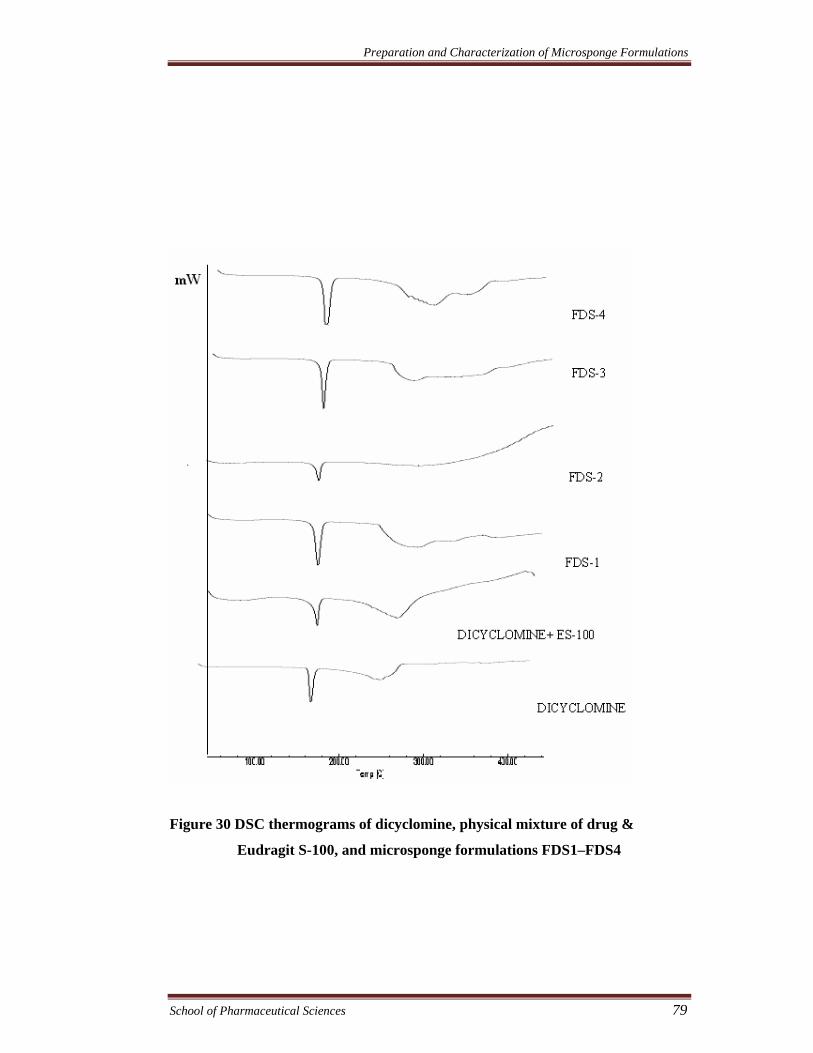
Figure 30 DSC thermograms of dicyclomine, physical mixture of drug &
Eudragit S-100, and microsponge formulations FDS1–FDS4
Preparation and Characterization of Microsponge Formulations
School of Pharmaceutical Sciences 80
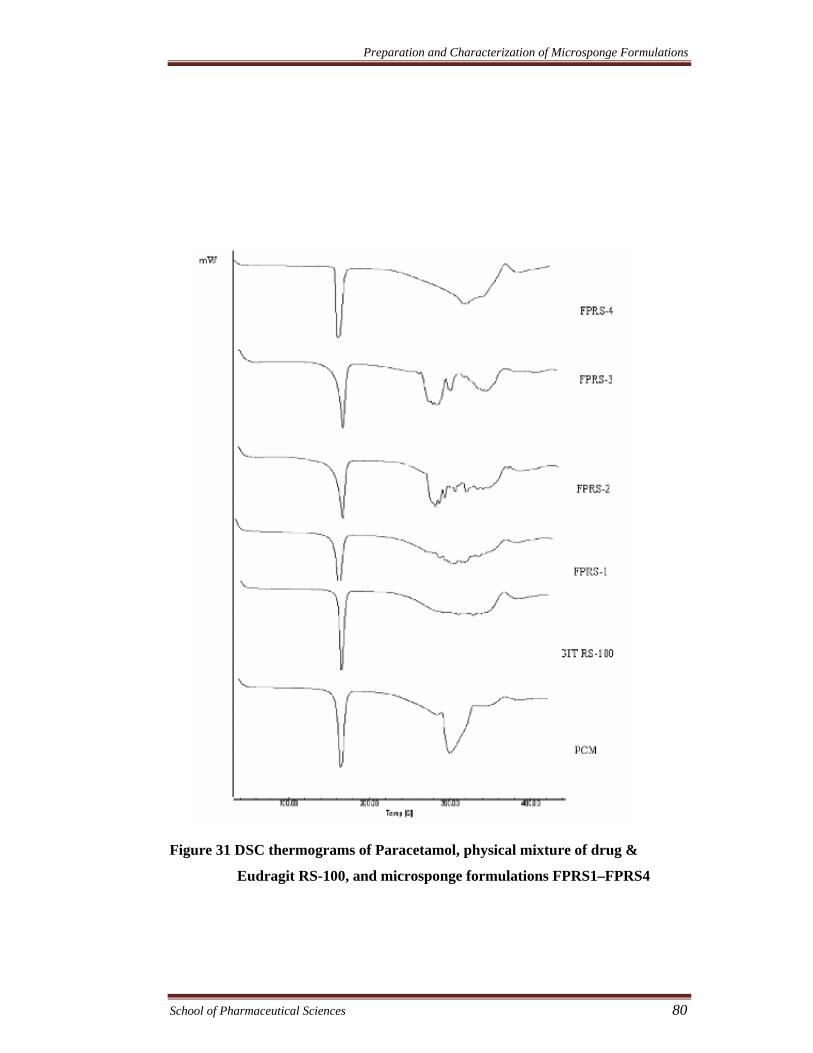
Figure 31 DSC thermograms of Paracetamol, physical mixture of drug &
Eudragit RS-100, and microsponge formulations FPRS1–FPRS4
Preparation and Characterization of Microsponge Formulations
School of Pharmaceutical Sciences 81
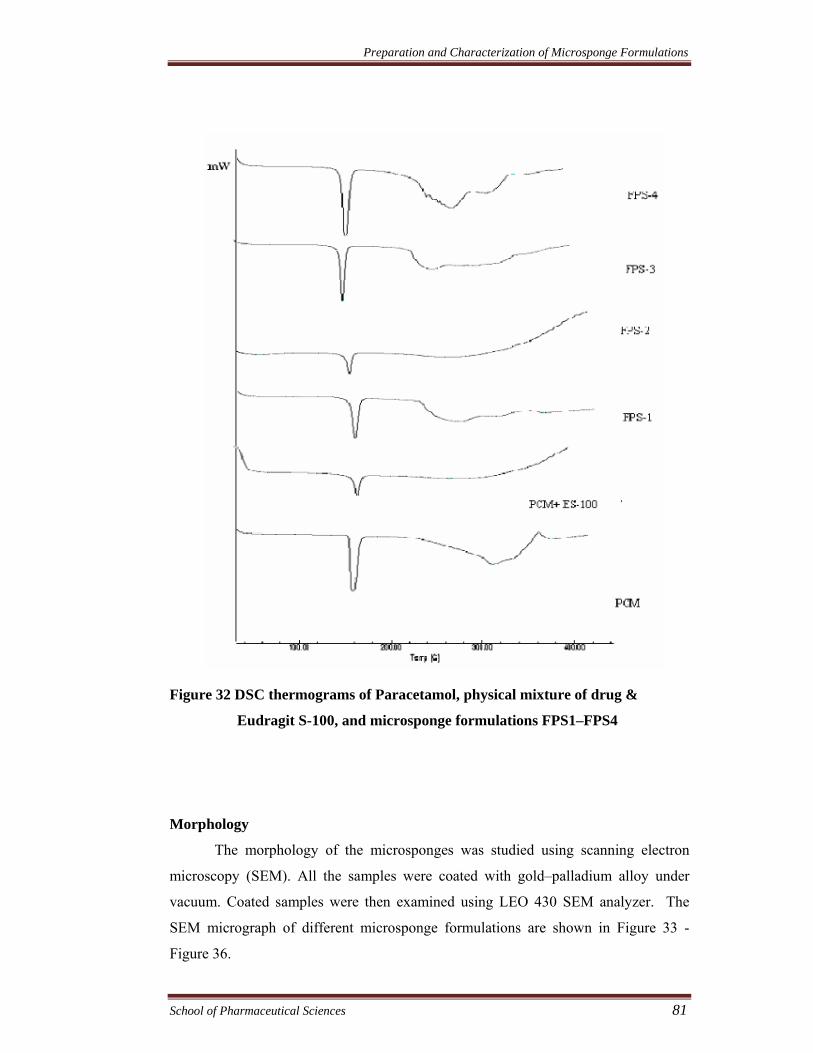
Figure 32 DSC thermograms of Paracetamol, physical mixture of drug &
Eudragit S-100, and microsponge formulations FPS1–FPS4
Morphology
The morphology of the microsponges was studied using scanning electron
microscopy (SEM). All the samples were coated with gold–palladium alloy under
vacuum. Coated samples were then examined using LEO 430 SEM analyzer. The
SEM micrograph of different microsponge formulations are shown in Figure 33 -
Figure 36.
Preparation and Characterization of Microsponge Formulations
School of Pharmaceutical Sciences 82
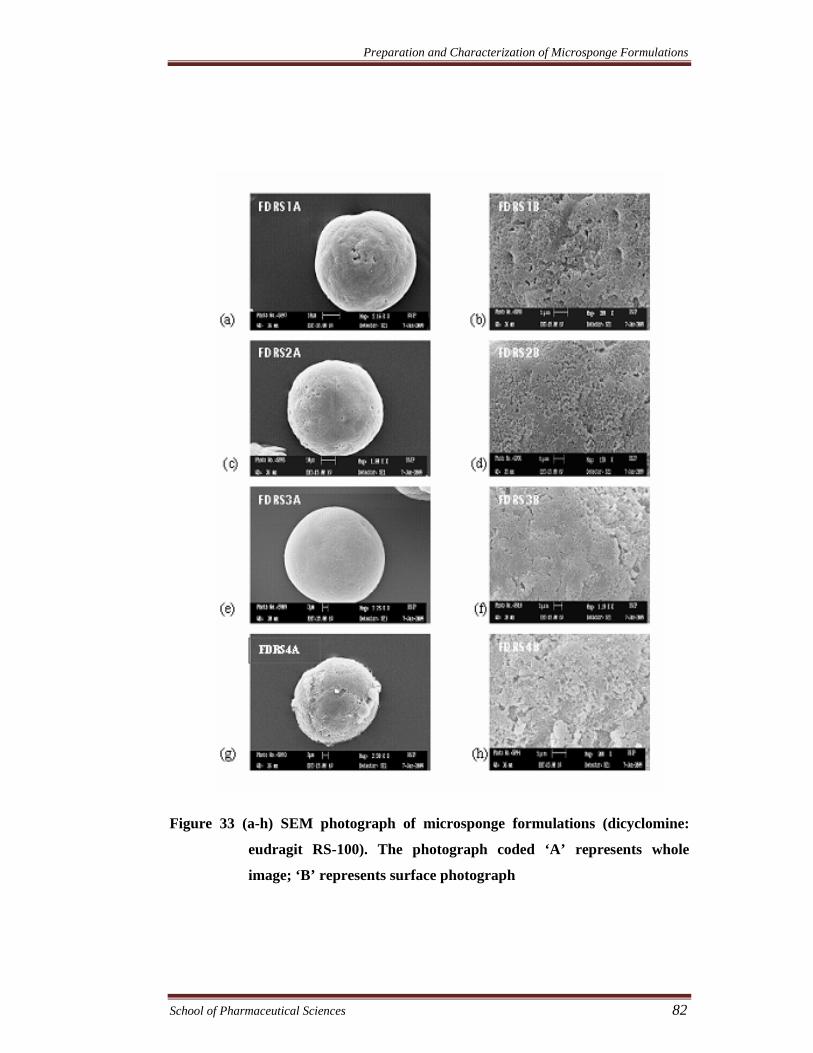
Figure 33 (a-h) SEM photograph of microsponge formulations (dicyclomine:
eudragit RS-100). The photograph coded ‘A’ represents whole
image; ‘B’ represents surface photograph
Preparation and Characterization of Microsponge Formulations
School of Pharmaceutical Sciences 83
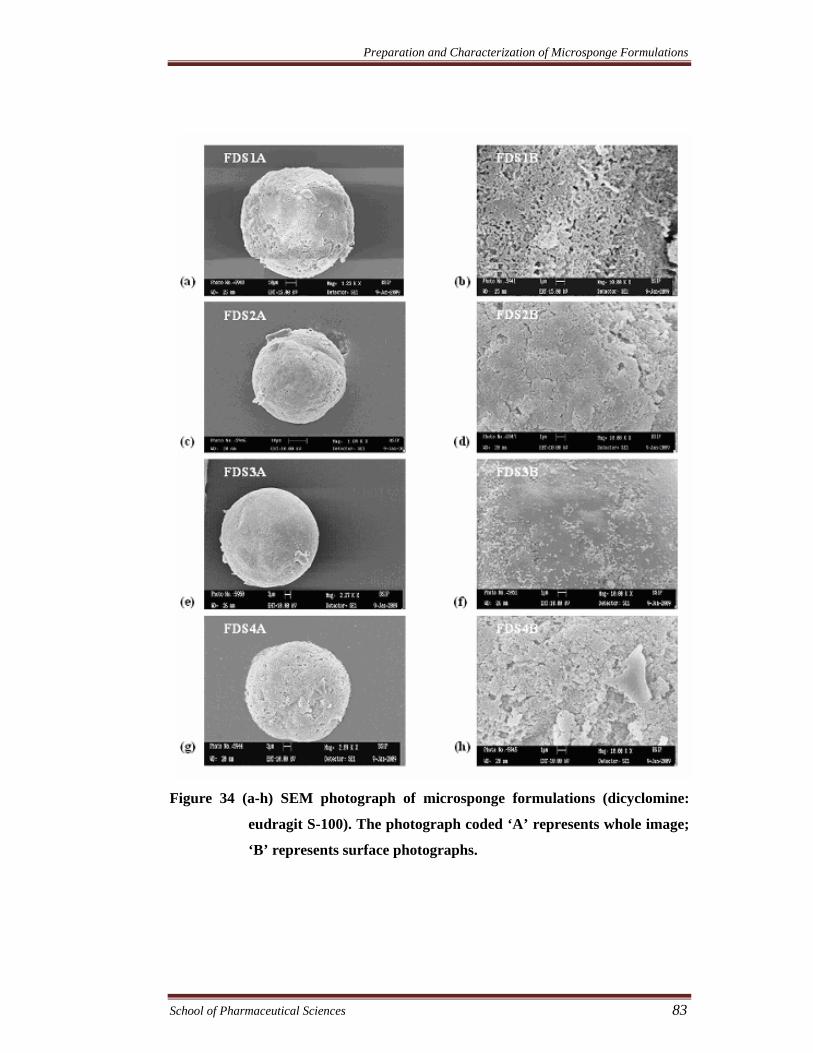
Figure 34 (a-h) SEM photograph of microsponge formulations (dicyclomine:
eudragit S-100). The photograph coded ‘A’ represents whole image;
‘B’ represents surface photographs.
Preparation and Characterization of Microsponge Formulations
School of Pharmaceutical Sciences 84
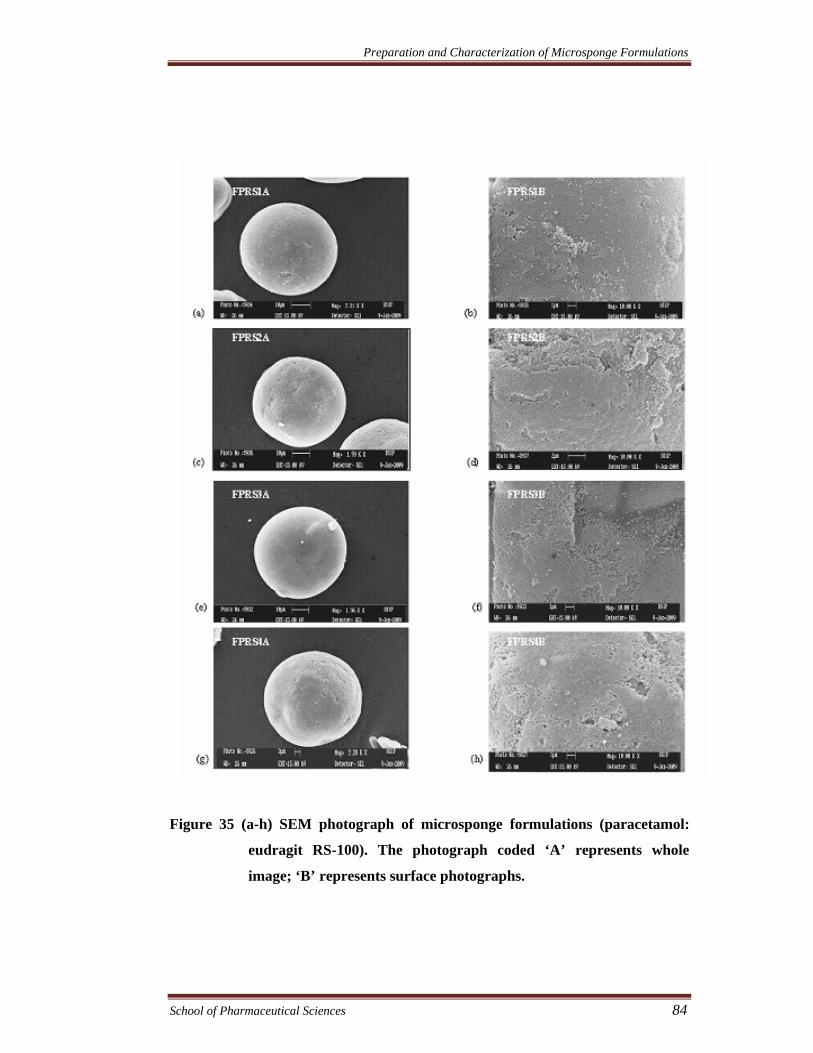
Figure 35 (a-h) SEM photograph of microsponge formulations (paracetamol:
eudragit RS-100). The photograph coded ‘A’ represents whole
image; ‘B’ represents surface photographs.
Preparation and Characterization of Microsponge Formulations
School of Pharmaceutical Sciences 85
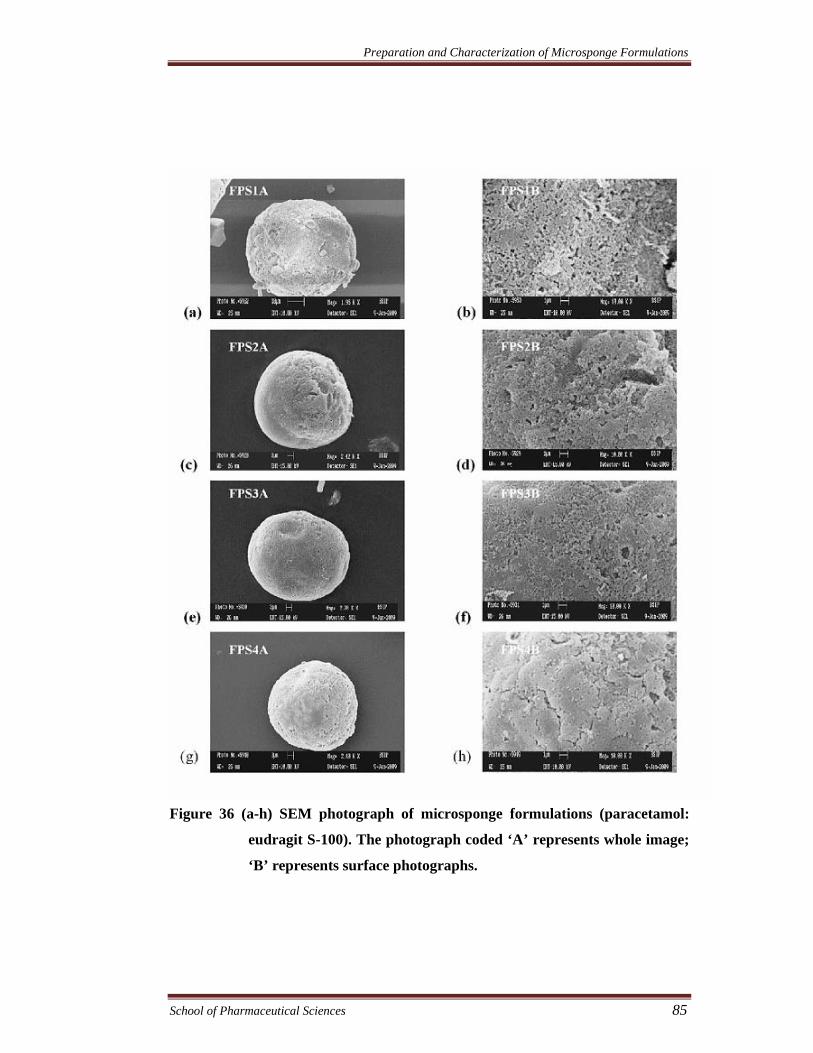
Figure 36 (a-h) SEM photograph of microsponge formulations (paracetamol:
eudragit S-100). The photograph coded ‘A’ represents whole image;
‘B’ represents surface photographs.
Preparation and Characterization of Microsponge Formulations
School of Pharmaceutical Sciences 86
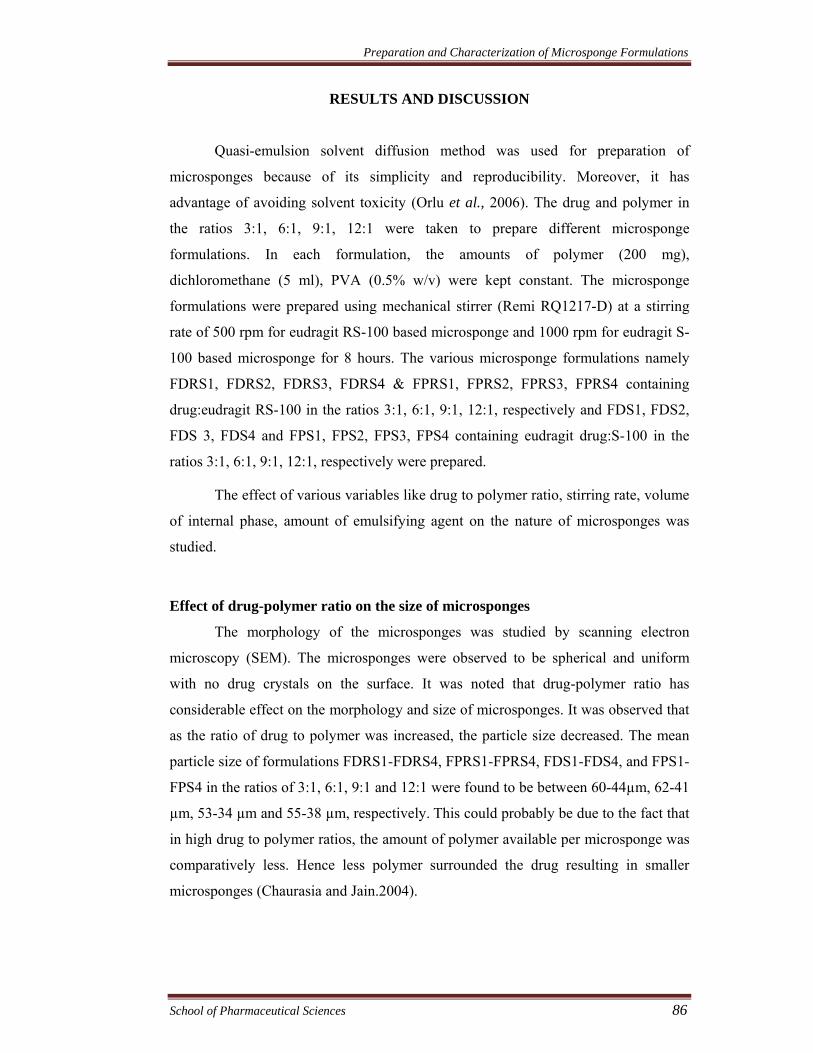
RESULTS AND DISCUSSION
Quasi-emulsion solvent diffusion method was used for preparation of
microsponges because of its simplicity and reproducibility. Moreover, it has
advantage of avoiding solvent toxicity (Orlu et al., 2006). The drug and polymer in
the ratios 3:1, 6:1, 9:1, 12:1 were taken to prepare different microsponge
formulations. In each formulation, the amounts of polymer (200 mg),
dichloromethane (5 ml), PVA (0.5% w/v) were kept constant. The microsponge
formulations were prepared using mechanical stirrer (Remi RQ1217-D) at a stirring
rate of 500 rpm for eudragit RS-100 based microsponge and 1000 rpm for eudragit S-
100 based microsponge for 8 hours. The various microsponge formulations namely
FDRS1, FDRS2, FDRS3, FDRS4 & FPRS1, FPRS2, FPRS3, FPRS4 containing
drug:eudragit RS-100 in the ratios 3:1, 6:1, 9:1, 12:1, respectively and FDS1, FDS2,
FDS 3, FDS4 and FPS1, FPS2, FPS3, FPS4 containing eudragit drug:S-100 in the
ratios 3:1, 6:1, 9:1, 12:1, respectively were prepared.
The effect of various variables like drug to polymer ratio, stirring rate, volume
of internal phase, amount of emulsifying agent on the nature of microsponges was
studied.
Effect of drug-polymer ratio on the size of microsponges
The morphology of the microsponges was studied by scanning electron
microscopy (SEM). The microsponges were observed to be spherical and uniform
with no drug crystals on the surface. It was noted that drug-polymer ratio has
considerable effect on the morphology and size of microsponges. It was observed that
as the ratio of drug to polymer was increased, the particle size decreased. The mean
particle size of formulations FDRS1-FDRS4, FPRS1-FPRS4, FDS1-FDS4, and FPS1-
FPS4 in the ratios of 3:1, 6:1, 9:1 and 12:1 were found to be between 60-44µm, 62-41
µm, 53-34 µm and 55-38 µm, respectively. This could probably be due to the fact that
in high drug to polymer ratios, the amount of polymer available per microsponge was
comparatively less. Hence less polymer surrounded the drug resulting in smaller
microsponges (Chaurasia and Jain.2004).

Preparation and Characterization of Microsponge Formulations
School of Pharmaceutical Sciences 87
Effect of stirring rate on the size of microsponges
The effect of stirring rate on the size of microsponges was studied by photo
microscope (RXLr-3T, Radical, India). The formulation with the lower drug to
polymer ratio (i.e., 3:1) was chosen to investigate the effect of stirring rate on the
morphology of microsponges. The stirring rate was varied in the range of 300 to 500
rpm for eudragit RS-100 based formulations and 500 to 1000 for eudragit S-100 based
formulations. The dispersion of the drug and polymer into the aqueous phase and the
formulation of microsponge were found to be dependant on the agitation speed. As
the speed was increased, smaller spherical microsponges with uniform size were
formed (Perumal 2001). When the rate of stirring was increased 300 - 500 rpm
eudragit RS-100 based microsponges, the spherical microsponges were formed with
mean particle size of 72 µm - 60 µm and 77 µm - 62 µm for formulation FDRS1 and
FPRS1, respectively. When the rate of stirring was increased 500 - 1000 rpm for
eudragit S-100 based microsponges the spherical microsponges were formed with
mean particle size of 74 µm - 53 µm and 79 µm - 55 µm for formulation FDS1
and FPS1, respectively.
Effect of volume of internal phase on the formation of microsponges
It was observed that on increasing the volume of internal phase from 5 to 10
ml microsponges were not formed. This may be due to the decrease in viscosity of the
internal phase (Yang et al., 2003). As the amount of dichloromethane was increased,
though the finely dispersed spherical quasi-emulsion droplets were seen in solvent
under the agitation, but as the stirring was discontinued emulsion droplets adhered to
each other and coalesce. Consequently, no microsponges could be formed. The result
suggests that the amount of dichloromethane need to be controlled within an
appropriate range to effect not only the formation of quasi-emulsion droplets at the
initial stage but also the solidification of drug and polymer in the droplets.
Microsponges were formed when 3 to 5 ml of dichloromethane was used.
Effect of amount of emulsifying agent on the production yield and size of
microsponges
An increase in amount of polyvinyl alcohol (emulsifying agent) from 0.5 % to
1.0 % w/v resulted in decreased production yield and increased mean particle size.
Preparation and Characterization of Microsponge Formulations
School of Pharmaceutical Sciences 88
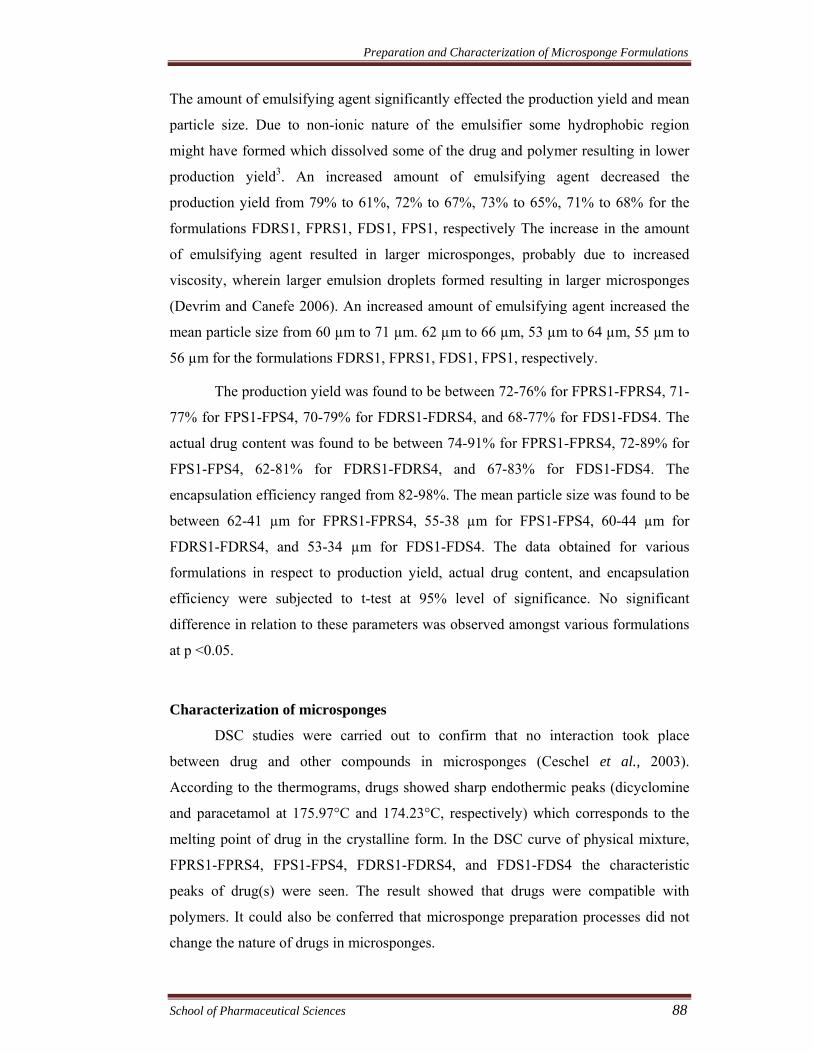
The amount of emulsifying agent significantly effected the production yield and mean
particle size. Due to non-ionic nature of the emulsifier some hydrophobic region
might have formed which dissolved some of the drug and polymer resulting in lower
production yield3. An increased amount of emulsifying agent decreased the
production yield from 79% to 61%, 72% to 67%, 73% to 65%, 71% to 68% for the
formulations FDRS1, FPRS1, FDS1, FPS1, respectively The increase in the amount
of emulsifying agent resulted in larger microsponges, probably due to increased
viscosity, wherein larger emulsion droplets formed resulting in larger microsponges
(Devrim and Canefe 2006). An increased amount of emulsifying agent increased the
mean particle size from 60 µm to 71 µm. 62 µm to 66 µm, 53 µm to 64 µm, 55 µm to
56 µm for the formulations FDRS1, FPRS1, FDS1, FPS1, respectively.
The production yield was found to be between 72-76% for FPRS1-FPRS4, 71-
77% for FPS1-FPS4, 70-79% for FDRS1-FDRS4, and 68-77% for FDS1-FDS4. The
actual drug content was found to be between 74-91% for FPRS1-FPRS4, 72-89% for
FPS1-FPS4, 62-81% for FDRS1-FDRS4, and 67-83% for FDS1-FDS4. The
encapsulation efficiency ranged from 82-98%. The mean particle size was found to be
between 62-41 µm for FPRS1-FPRS4, 55-38 µm for FPS1-FPS4, 60-44 µm for
FDRS1-FDRS4, and 53-34 µm for FDS1-FDS4. The data obtained for various
formulations in respect to production yield, actual drug content, and encapsulation
efficiency were subjected to t-test at 95% level of significance. No significant
difference in relation to these parameters was observed amongst various formulations
at p <0.05.
Characterization of microsponges
DSC studies were carried out to confirm that no interaction took place
between drug and other compounds in microsponges (Ceschel et al., 2003).
According to the thermograms, drugs showed sharp endothermic peaks (dicyclomine
and paracetamol at 175.97°C and 174.23°C, respectively) which corresponds to the
melting point of drug in the crystalline form. In the DSC curve of physical mixture,
FPRS1-FPRS4, FPS1-FPS4, FDRS1-FDRS4, and FDS1-FDS4 the characteristic
peaks of drug(s) were seen. The result showed that drugs were compatible with
polymers. It could also be conferred that microsponge preparation processes did not
change the nature of drugs in microsponges.
Preparation and Characterization of Microsponge Formulations
School of Pharmaceutical Sciences 89
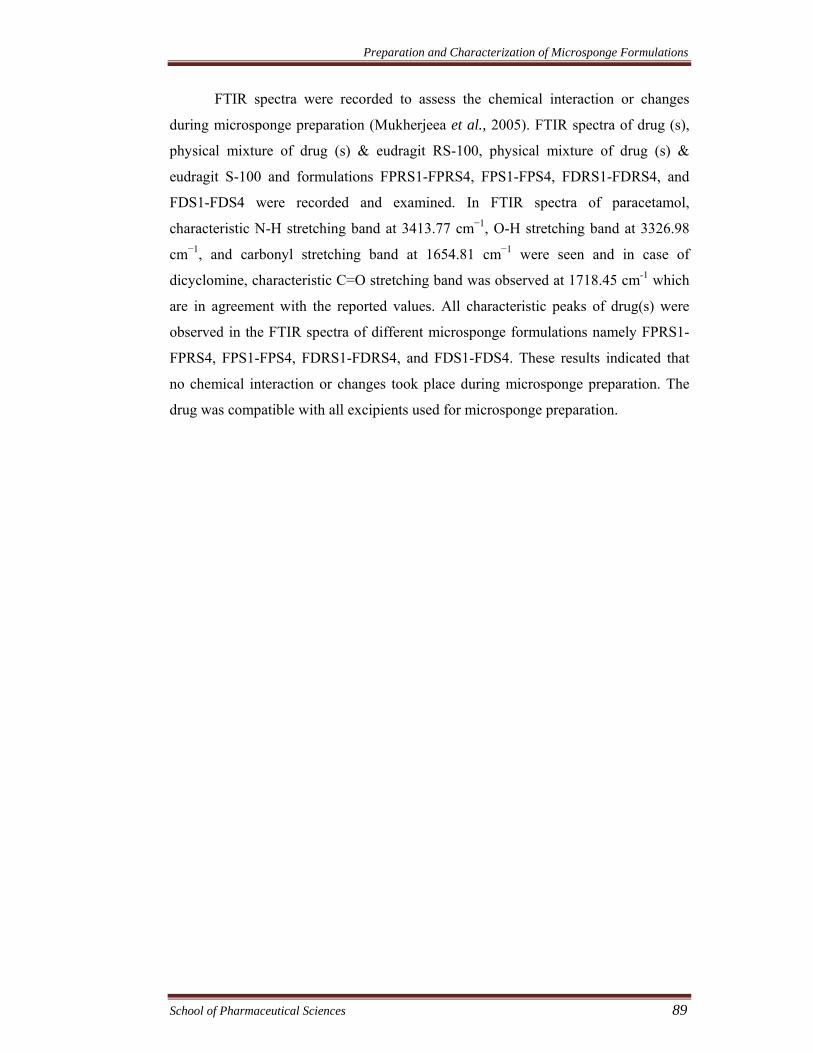
FTIR spectra were recorded to assess the chemical interaction or changes
during microsponge preparation (Mukherjeea et al., 2005). FTIR spectra of drug (s),
physical mixture of drug (s) & eudragit RS-100, physical mixture of drug (s) &
eudragit S-100 and formulations FPRS1-FPRS4, FPS1-FPS4, FDRS1-FDRS4, and
FDS1-FDS4 were recorded and examined. In FTIR spectra of paracetamol,
characteristic N-H stretching band at 3413.77 cm−1, O-H stretching band at 3326.98
cm−1, and carbonyl stretching band at 1654.81 cm−1 were seen and in case of
dicyclomine, characteristic C=O stretching band was observed at 1718.45 cm-1 which
are in agreement with the reported values. All characteristic peaks of drug(s) were
observed in the FTIR spectra of different microsponge formulations namely FPRS1-
FPRS4, FPS1-FPS4, FDRS1-FDRS4, and FDS1-FDS4. These results indicated that
no chemical interaction or changes took place during microsponge preparation. The
drug was compatible with all excipients used for microsponge preparation.
In-vitro drug release studies of Microsponge Formulations
School of Pharmaceutical Sciences 90
EXPERIMENTAL WORK IN-VITRO DRUG RELEASE STUDIES
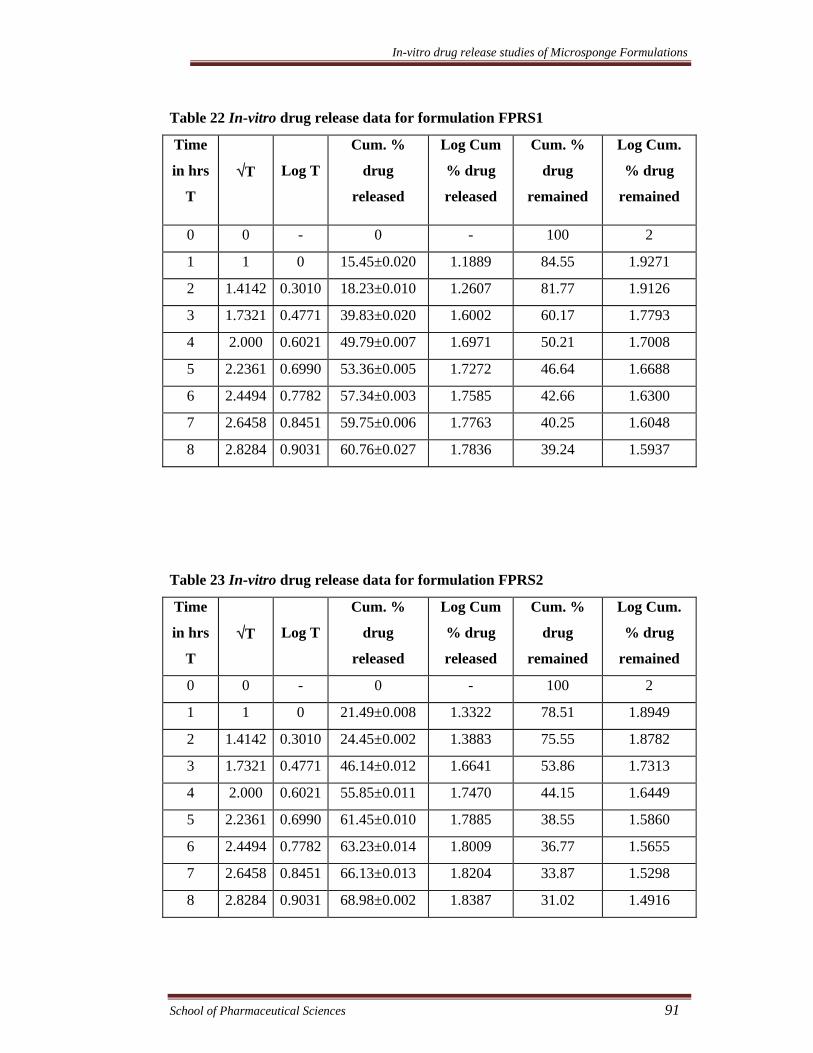
In-vitro drug release studies of paracetamol loaded microsponges
In-vitro release studies were carried out in USP basket apparatus with stirring
rate 50 rpm at 37±0.5 oC. Initial drug release was carried out in 900 ml of 0.1N
hydrochloric acid for 2 hours followed by phosphate buffer pH 6.8 for next 6 hour.
Samples were withdrawn at regular intervals and analyzed spectrophotometrically at
249 nm (Orlu et al., 2006). All the readings were taken in triplicate.
The same procedure was followed for in-vitro release studies of dicyclomine
loaded microsponges. The samples were analyzed at 420 nm. The in-vitro release data
of paracetamol loaded microsponges are given in Table 22 - Table 29 and
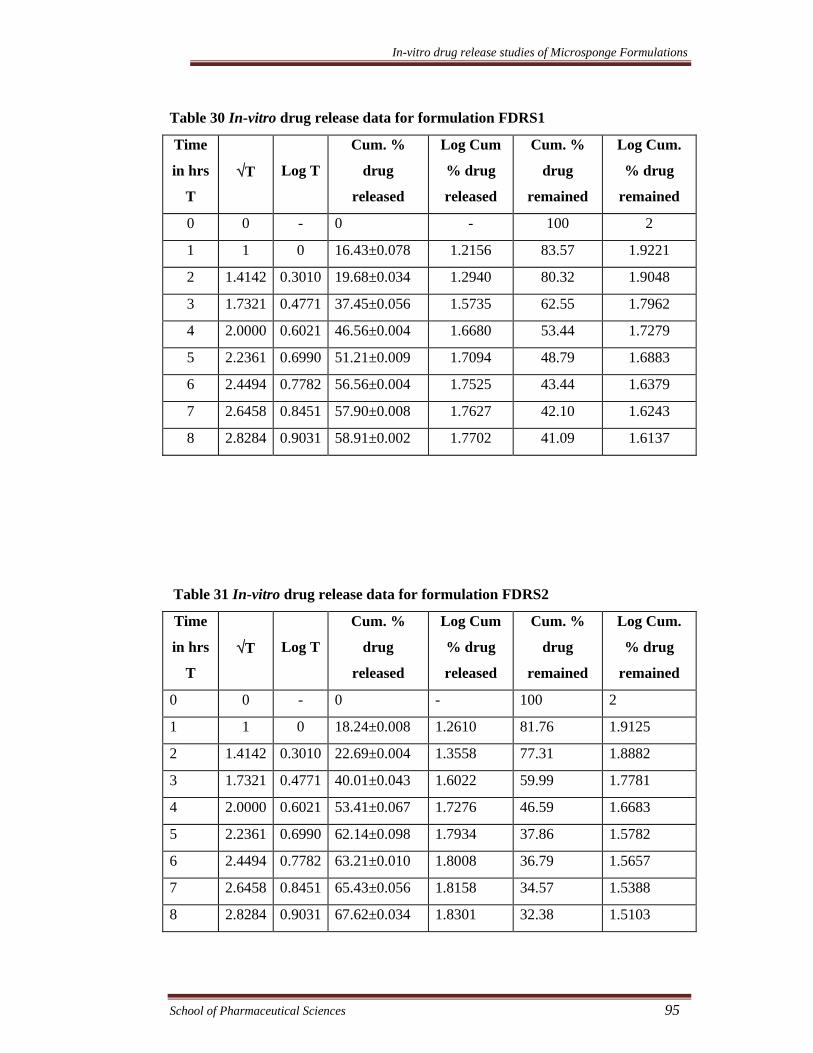
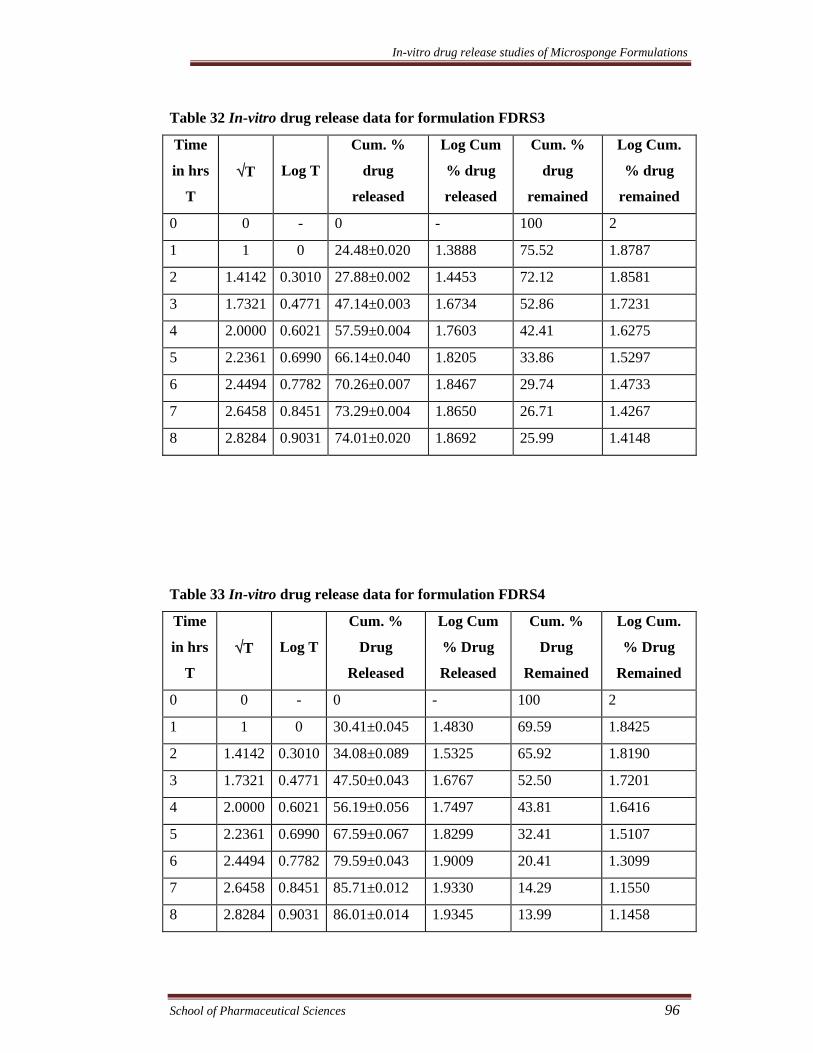
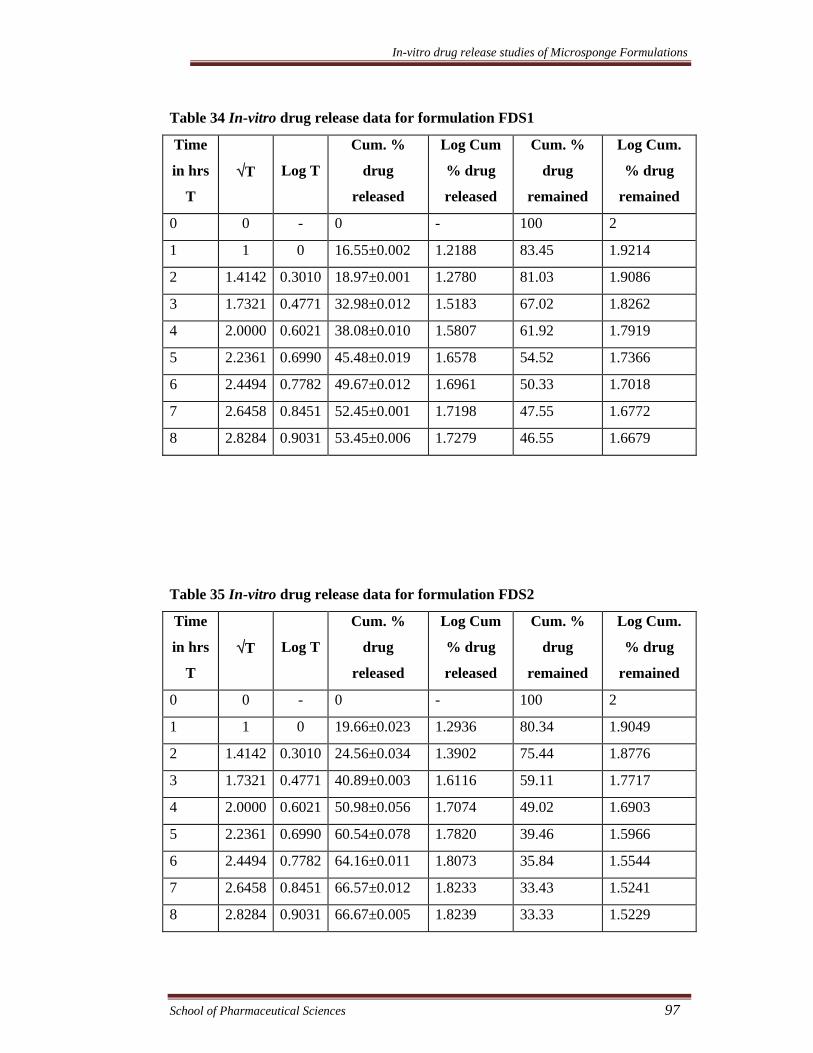
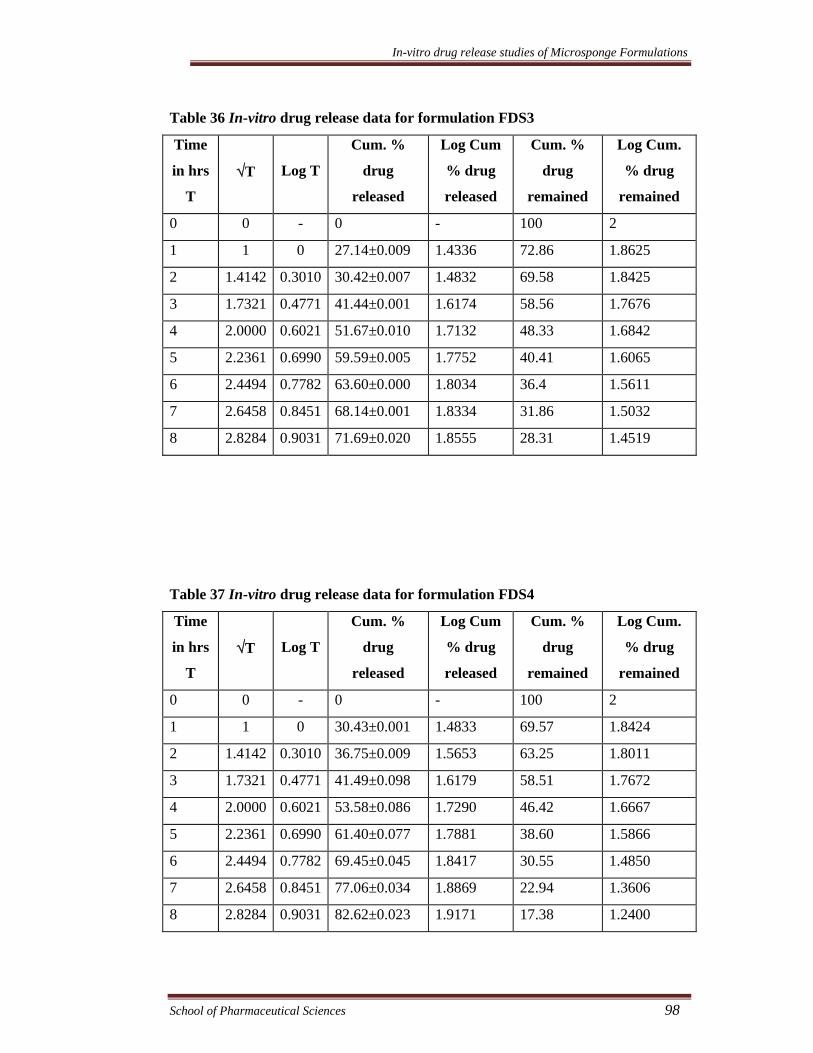
dicyclomine loaded microsponges are given in Table 30 - Table 37.
KINETICS OF RELEASE
To determine the drug release mechanism and to compare the release profile
amongst various microsponge formulations, the in-vitro release data was fitted to
various kinetic equations. The kinetic models included zero order, first order, Higuchi
model, and Korsmeyer-Peppas model (Nokhodchi et al., 2007). The plots were drawn
as per the following details.
• Cumulative percent drug released as a function of time (zero order kinetic plots).
• Log cumulative percent drug retained as a function of time (first order kinetics plots).
• Log cumulative percent drug released as a function of log time (Korsemeyer plots).
• Cumulative percent drug released versus square root of time (Higuchi plots).
The in-vitro release data of different kinetic models are shown in Table 38 and
presented in Figure 37 – Figure 44 for paracetamol microsponges and Figure 45 –
Figure 52 for dicyclomine microsponges.
In-vitro drug release studies of Microsponge Formulations
School of Pharmaceutical Sciences 91
Table 22 In-vitro drug release data for formulation FPRS1
Time
in hrs
T
√T
Log T
Cum. %
drug
released
Log Cum
% drug
released
Cum. %
drug
remained
Log Cum.
% drug
remained
0 0 - 0 - 100 2
1 1 0 15.45±0.020 1.1889 84.55 1.9271
2 1.4142 0.3010 18.23±0.010 1.2607 81.77 1.9126
3 1.7321 0.4771 39.83±0.020 1.6002 60.17 1.7793
4 2.000 0.6021 49.79±0.007 1.6971 50.21 1.7008
5 2.2361 0.6990 53.36±0.005 1.7272 46.64 1.6688
6 2.4494 0.7782 57.34±0.003 1.7585 42.66 1.6300
7 2.6458 0.8451 59.75±0.006 1.7763 40.25 1.6048
8 2.8284 0.9031 60.76±0.027 1.7836 39.24 1.5937
Table 23 In-vitro drug release data for formulation FPRS2
Time
in hrs
T
√T
Log T
Cum. %
drug
released
Log Cum
% drug
released
Cum. %
drug
remained
Log Cum.
% drug
remained
0 0 - 0 - 100 2
1 1 0 21.49±0.008 1.3322 78.51 1.8949
2 1.4142 0.3010 24.45±0.002 1.3883 75.55 1.8782
3 1.7321 0.4771 46.14±0.012 1.6641 53.86 1.7313
4 2.000 0.6021 55.85±0.011 1.7470 44.15 1.6449
5 2.2361 0.6990 61.45±0.010 1.7885 38.55 1.5860
6 2.4494 0.7782 63.23±0.014 1.8009 36.77 1.5655
7 2.6458 0.8451 66.13±0.013 1.8204 33.87 1.5298
8 2.8284 0.9031 68.98±0.002 1.8387 31.02 1.4916
In-vitro drug release studies of Microsponge Formulations
School of Pharmaceutical Sciences 92
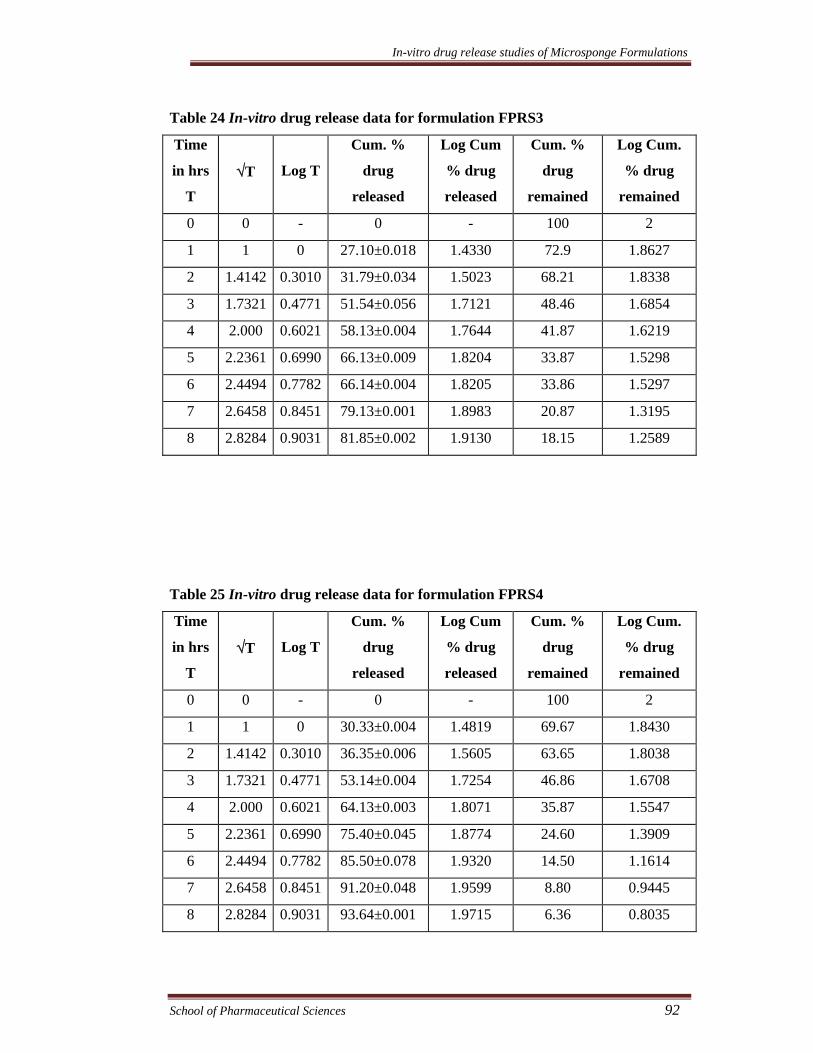
Table 24 In-vitro drug release data for formulation FPRS3
Time
in hrs
T
√T
Log T
Cum. %
drug
released
Log Cum
% drug
released
Cum. %
drug
remained
Log Cum.
% drug
remained
0 0 - 0 - 100 2
1 1 0 27.10±0.018 1.4330 72.9 1.8627
2 1.4142 0.3010 31.79±0.034 1.5023 68.21 1.8338
3 1.7321 0.4771 51.54±0.056 1.7121 48.46 1.6854
4 2.000 0.6021 58.13±0.004 1.7644 41.87 1.6219
5 2.2361 0.6990 66.13±0.009 1.8204 33.87 1.5298
6 2.4494 0.7782 66.14±0.004 1.8205 33.86 1.5297
7 2.6458 0.8451 79.13±0.001 1.8983 20.87 1.3195
8 2.8284 0.9031 81.85±0.002 1.9130 18.15 1.2589
Table 25 In-vitro drug release data for formulation FPRS4
Time
in hrs
T
√T
Log T
Cum. %
drug
released
Log Cum
% drug
released
Cum. %
drug
remained
Log Cum.
% drug
remained
0 0 - 0 - 100 2
1 1 0 30.33±0.004 1.4819 69.67 1.8430
2 1.4142 0.3010 36.35±0.006 1.5605 63.65 1.8038
3 1.7321 0.4771 53.14±0.004 1.7254 46.86 1.6708
4 2.000 0.6021 64.13±0.003 1.8071 35.87 1.5547
5 2.2361 0.6990 75.40±0.045 1.8774 24.60 1.3909
6 2.4494 0.7782 85.50±0.078 1.9320 14.50 1.1614
7 2.6458 0.8451 91.20±0.048 1.9599 8.80 0.9445
8 2.8284 0.9031 93.64±0.001 1.9715 6.36 0.8035
In-vitro drug release studies of Microsponge Formulations
School of Pharmaceutical Sciences 93
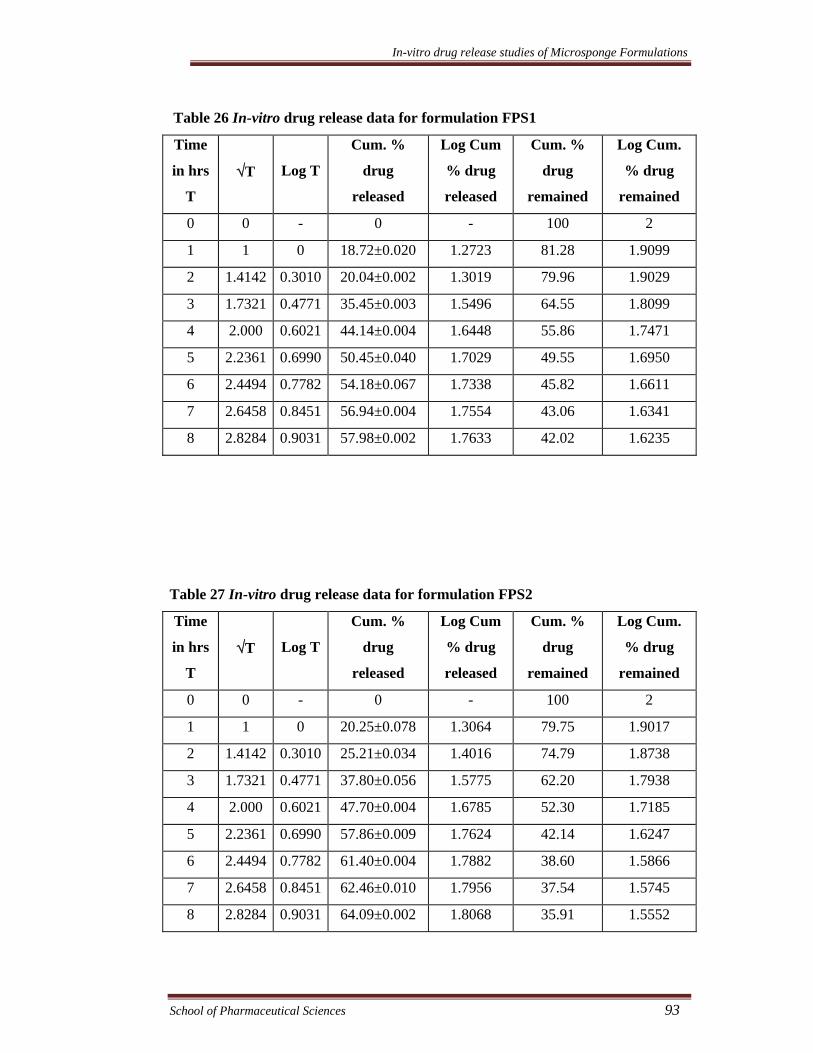
Table 26 In-vitro drug release data for formulation FPS1
Time
in hrs
T
√T
Log T
Cum. %
drug
released
Log Cum
% drug
released
Cum. %
drug
remained
Log Cum.
% drug
remained
0 0 - 0 - 100 2
1 1 0 18.72±0.020 1.2723 81.28 1.9099
2 1.4142 0.3010 20.04±0.002 1.3019 79.96 1.9029
3 1.7321 0.4771 35.45±0.003 1.5496 64.55 1.8099
4 2.000 0.6021 44.14±0.004 1.6448 55.86 1.7471
5 2.2361 0.6990 50.45±0.040 1.7029 49.55 1.6950
6 2.4494 0.7782 54.18±0.067 1.7338 45.82 1.6611
7 2.6458 0.8451 56.94±0.004 1.7554 43.06 1.6341
8 2.8284 0.9031 57.98±0.002 1.7633 42.02 1.6235
Table 27 In-vitro drug release data for formulation FPS2
Time
in hrs
T
√T
Log T
Cum. %
drug
released
Log Cum
% drug
released
Cum. %
drug
remained
Log Cum.
% drug
remained
0 0 - 0 - 100 2
1 1 0 20.25±0.078 1.3064 79.75 1.9017
2 1.4142 0.3010 25.21±0.034 1.4016 74.79 1.8738
3 1.7321 0.4771 37.80±0.056 1.5775 62.20 1.7938
4 2.000 0.6021 47.70±0.004 1.6785 52.30 1.7185
5 2.2361 0.6990 57.86±0.009 1.7624 42.14 1.6247
6 2.4494 0.7782 61.40±0.004 1.7882 38.60 1.5866
7 2.6458 0.8451 62.46±0.010 1.7956 37.54 1.5745
8 2.8284 0.9031 64.09±0.002 1.8068 35.91 1.5552
In-vitro drug release studies of Microsponge Formulations
School of Pharmaceutical Sciences 94
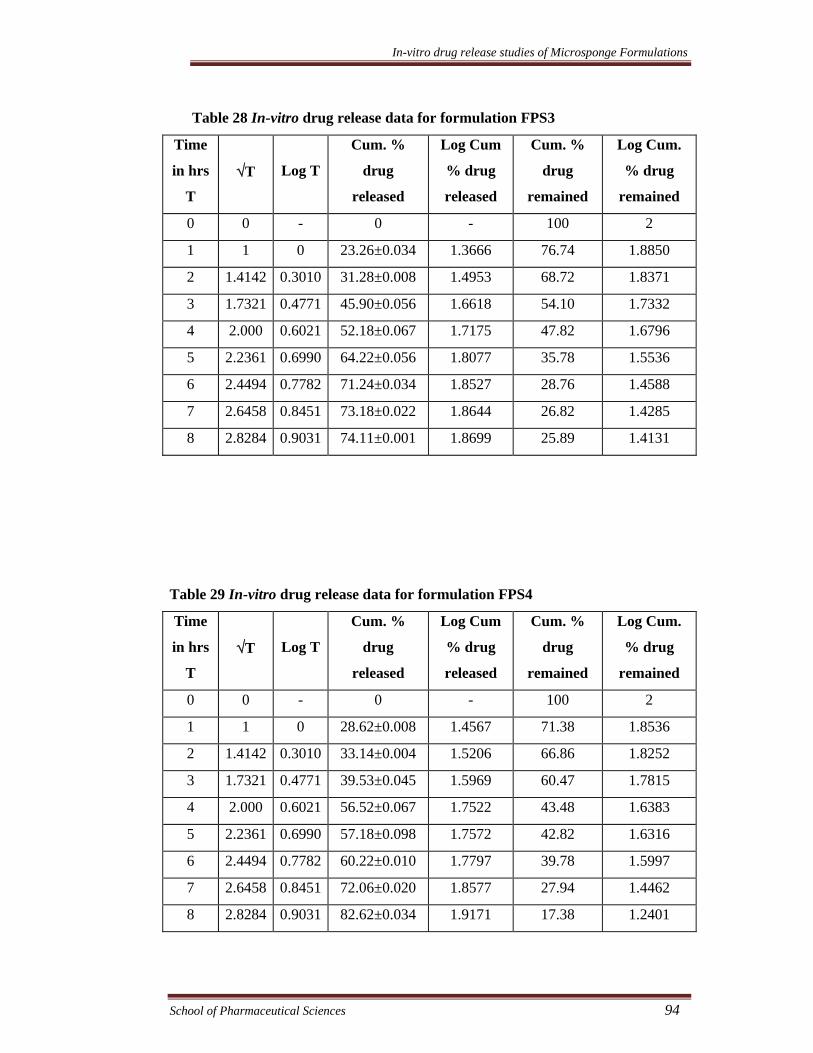
Table 28 In-vitro drug release data for formulation FPS3
Time
in hrs
T
√T
Log T
Cum. %
drug
released
Log Cum
% drug
released
Cum. %
drug
remained
Log Cum.
% drug
remained
0 0 - 0 - 100 2
1 1 0 23.26±0.034 1.3666 76.74 1.8850
2 1.4142 0.3010 31.28±0.008 1.4953 68.72 1.8371
3 1.7321 0.4771 45.90±0.056 1.6618 54.10 1.7332
4 2.000 0.6021 52.18±0.067 1.7175 47.82 1.6796
5 2.2361 0.6990 64.22±0.056 1.8077 35.78 1.5536
6 2.4494 0.7782 71.24±0.034 1.8527 28.76 1.4588
7 2.6458 0.8451 73.18±0.022 1.8644 26.82 1.4285
8 2.8284 0.9031 74.11±0.001 1.8699 25.89 1.4131
Table 29 In-vitro drug release data for formulation FPS4
Time
in hrs
T
√T
Log T
Cum. %
drug
released
Log Cum
% drug
released
Cum. %
drug
remained
Log Cum.
% drug
remained
0 0 - 0 - 100 2
1 1 0 28.62±0.008 1.4567 71.38 1.8536
2 1.4142 0.3010 33.14±0.004 1.5206 66.86 1.8252
3 1.7321 0.4771 39.53±0.045 1.5969 60.47 1.7815
4 2.000 0.6021 56.52±0.067 1.7522 43.48 1.6383
5 2.2361 0.6990 57.18±0.098 1.7572 42.82 1.6316
6 2.4494 0.7782 60.22±0.010 1.7797 39.78 1.5997
7 2.6458 0.8451 72.06±0.020 1.8577 27.94 1.4462
8 2.8284 0.9031 82.62±0.034 1.9171 17.38 1.2401
In-vitro drug release studies of Microsponge Formulations
School of Pharmaceutical Sciences 95
Table 30 In-vitro drug release data for formulation FDRS1
Time
in hrs
T
√T
Log T
Cum. %
drug
released
Log Cum
% drug
released
Cum. %
drug
remained
Log Cum.
% drug
remained
0 0 - 0 - 100 2
1 1 0 16.43±0.078 1.2156 83.57 1.9221
2 1.4142 0.3010 19.68±0.034 1.2940 80.32 1.9048
3 1.7321 0.4771 37.45±0.056 1.5735 62.55 1.7962
4 2.0000 0.6021 46.56±0.004 1.6680 53.44 1.7279
5 2.2361 0.6990 51.21±0.009 1.7094 48.79 1.6883
6 2.4494 0.7782 56.56±0.004 1.7525 43.44 1.6379
7 2.6458 0.8451 57.90±0.008 1.7627 42.10 1.6243
8 2.8284 0.9031 58.91±0.002 1.7702 41.09 1.6137
Table 31 In-vitro drug release data for formulation FDRS2
Time
in hrs
T
√T
Log T
Cum. %
drug
released
Log Cum
% drug
released
Cum. %
drug
remained
Log Cum.
% drug
remained
0 0 - 0 - 100 2
1 1 0 18.24±0.008 1.2610 81.76 1.9125
2 1.4142 0.3010 22.69±0.004 1.3558 77.31 1.8882
3 1.7321 0.4771 40.01±0.043 1.6022 59.99 1.7781
4 2.0000 0.6021 53.41±0.067 1.7276 46.59 1.6683
5 2.2361 0.6990 62.14±0.098 1.7934 37.86 1.5782
6 2.4494 0.7782 63.21±0.010 1.8008 36.79 1.5657
7 2.6458 0.8451 65.43±0.056 1.8158 34.57 1.5388
8 2.8284 0.9031 67.62±0.034 1.8301 32.38 1.5103
In-vitro drug release studies of Microsponge Formulations
School of Pharmaceutical Sciences 96
Table 32 In-vitro drug release data for formulation FDRS3
Time
in hrs
T
√T
Log T
Cum. %
drug
released
Log Cum
% drug
released
Cum. %
drug
remained
Log Cum.
% drug
remained
0 0 - 0 - 100 2
1 1 0 24.48±0.020 1.3888 75.52 1.8787
2 1.4142 0.3010 27.88±0.002 1.4453 72.12 1.8581
3 1.7321 0.4771 47.14±0.003 1.6734 52.86 1.7231
4 2.0000 0.6021 57.59±0.004 1.7603 42.41 1.6275
5 2.2361 0.6990 66.14±0.040 1.8205 33.86 1.5297
6 2.4494 0.7782 70.26±0.007 1.8467 29.74 1.4733
7 2.6458 0.8451 73.29±0.004 1.8650 26.71 1.4267
8 2.8284 0.9031 74.01±0.020 1.8692 25.99 1.4148
Table 33 In-vitro drug release data for formulation FDRS4
Time
in hrs
T
√T
Log T
Cum. %
Drug
Released
Log Cum
% Drug
Released
Cum. %
Drug
Remained
Log Cum.
% Drug
Remained
0 0 - 0 - 100 2
1 1 0 30.41±0.045 1.4830 69.59 1.8425
2 1.4142 0.3010 34.08±0.089 1.5325 65.92 1.8190
3 1.7321 0.4771 47.50±0.043 1.6767 52.50 1.7201
4 2.0000 0.6021 56.19±0.056 1.7497 43.81 1.6416
5 2.2361 0.6990 67.59±0.067 1.8299 32.41 1.5107
6 2.4494 0.7782 79.59±0.043 1.9009 20.41 1.3099
7 2.6458 0.8451 85.71±0.012 1.9330 14.29 1.1550
8 2.8284 0.9031 86.01±0.014 1.9345 13.99 1.1458
In-vitro drug release studies of Microsponge Formulations
School of Pharmaceutical Sciences 97
Table 34 In-vitro drug release data for formulation FDS1
Time
in hrs
T
√T
Log T
Cum. %
drug
released
Log Cum
% drug
released
Cum. %
drug
remained
Log Cum.
% drug
remained
0 0 - 0 - 100 2
1 1 0 16.55±0.002 1.2188 83.45 1.9214
2 1.4142 0.3010 18.97±0.001 1.2780 81.03 1.9086
3 1.7321 0.4771 32.98±0.012 1.5183 67.02 1.8262
4 2.0000 0.6021 38.08±0.010 1.5807 61.92 1.7919
5 2.2361 0.6990 45.48±0.019 1.6578 54.52 1.7366
6 2.4494 0.7782 49.67±0.012 1.6961 50.33 1.7018
7 2.6458 0.8451 52.45±0.001 1.7198 47.55 1.6772
8 2.8284 0.9031 53.45±0.006 1.7279 46.55 1.6679
Table 35 In-vitro drug release data for formulation FDS2
Time
in hrs
T
√T
Log T
Cum. %
drug
released
Log Cum
% drug
released
Cum. %
drug
remained
Log Cum.
% drug
remained
0 0 - 0 - 100 2
1 1 0 19.66±0.023 1.2936 80.34 1.9049
2 1.4142 0.3010 24.56±0.034 1.3902 75.44 1.8776
3 1.7321 0.4771 40.89±0.003 1.6116 59.11 1.7717
4 2.0000 0.6021 50.98±0.056 1.7074 49.02 1.6903
5 2.2361 0.6990 60.54±0.078 1.7820 39.46 1.5966
6 2.4494 0.7782 64.16±0.011 1.8073 35.84 1.5544
7 2.6458 0.8451 66.57±0.012 1.8233 33.43 1.5241
8 2.8284 0.9031 66.67±0.005 1.8239 33.33 1.5229
In-vitro drug release studies of Microsponge Formulations
School of Pharmaceutical Sciences 98
Table 36 In-vitro drug release data for formulation FDS3
Time
in hrs
T
√T
Log T
Cum. %
drug
released
Log Cum
% drug
released
Cum. %
drug
remained
Log Cum.
% drug
remained
0 0 - 0 - 100 2
1 1 0 27.14±0.009 1.4336 72.86 1.8625
2 1.4142 0.3010 30.42±0.007 1.4832 69.58 1.8425
3 1.7321 0.4771 41.44±0.001 1.6174 58.56 1.7676
4 2.0000 0.6021 51.67±0.010 1.7132 48.33 1.6842
5 2.2361 0.6990 59.59±0.005 1.7752 40.41 1.6065
6 2.4494 0.7782 63.60±0.000 1.8034 36.4 1.5611
7 2.6458 0.8451 68.14±0.001 1.8334 31.86 1.5032
8 2.8284 0.9031 71.69±0.020 1.8555 28.31 1.4519
Table 37 In-vitro drug release data for formulation FDS4
Time
in hrs
T
√T
Log T
Cum. %
drug
released
Log Cum
% drug
released
Cum. %
drug
remained
Log Cum.
% drug
remained
0 0 - 0 - 100 2
1 1 0 30.43±0.001 1.4833 69.57 1.8424
2 1.4142 0.3010 36.75±0.009 1.5653 63.25 1.8011
3 1.7321 0.4771 41.49±0.098 1.6179 58.51 1.7672
4 2.0000 0.6021 53.58±0.086 1.7290 46.42 1.6667
5 2.2361 0.6990 61.40±0.077 1.7881 38.60 1.5866
6 2.4494 0.7782 69.45±0.045 1.8417 30.55 1.4850
7 2.6458 0.8451 77.06±0.034 1.8869 22.94 1.3606
8 2.8284 0.9031 82.62±0.023 1.9171 17.38 1.2400
In-vitro drug release studies of Microsponge Formulations
School of Pharmaceutical Sciences 99
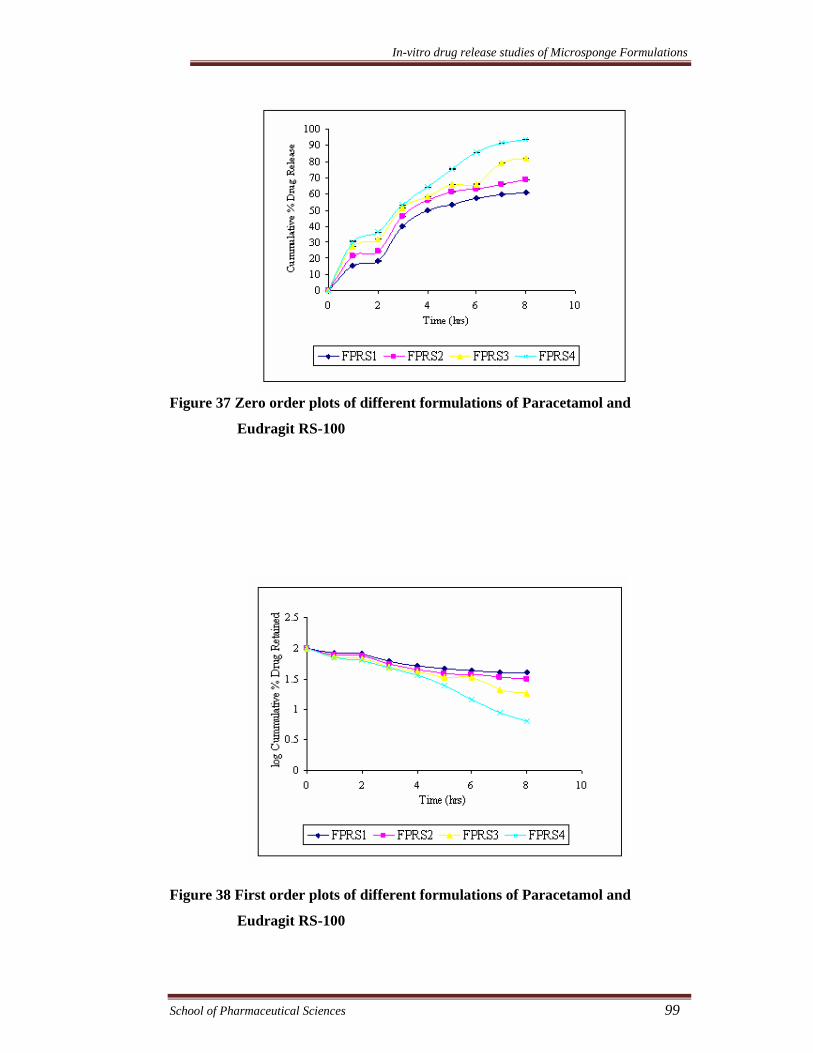
Figure 37 Zero order plots of different formulations of Paracetamol and
Eudragit RS-100
Figure 38 First order plots of different formulations of Paracetamol and
Eudragit RS-100
In-vitro drug release studies of Microsponge Formulations
School of Pharmaceutical Sciences 100
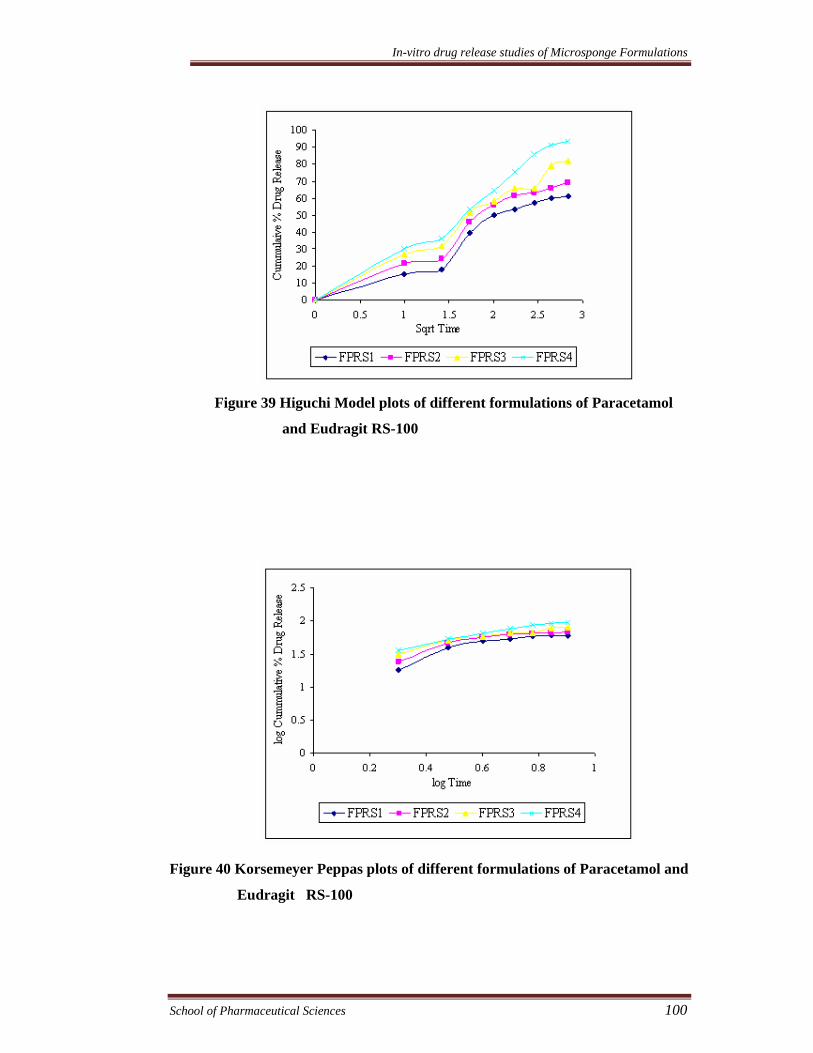
Figure 39 Higuchi Model plots of different formulations of Paracetamol
and Eudragit RS-100
Figure 40 Korsemeyer Peppas plots of different formulations of Paracetamol and
Eudragit RS-100
In-vitro drug release studies of Microsponge Formulations
School of Pharmaceutical Sciences 101
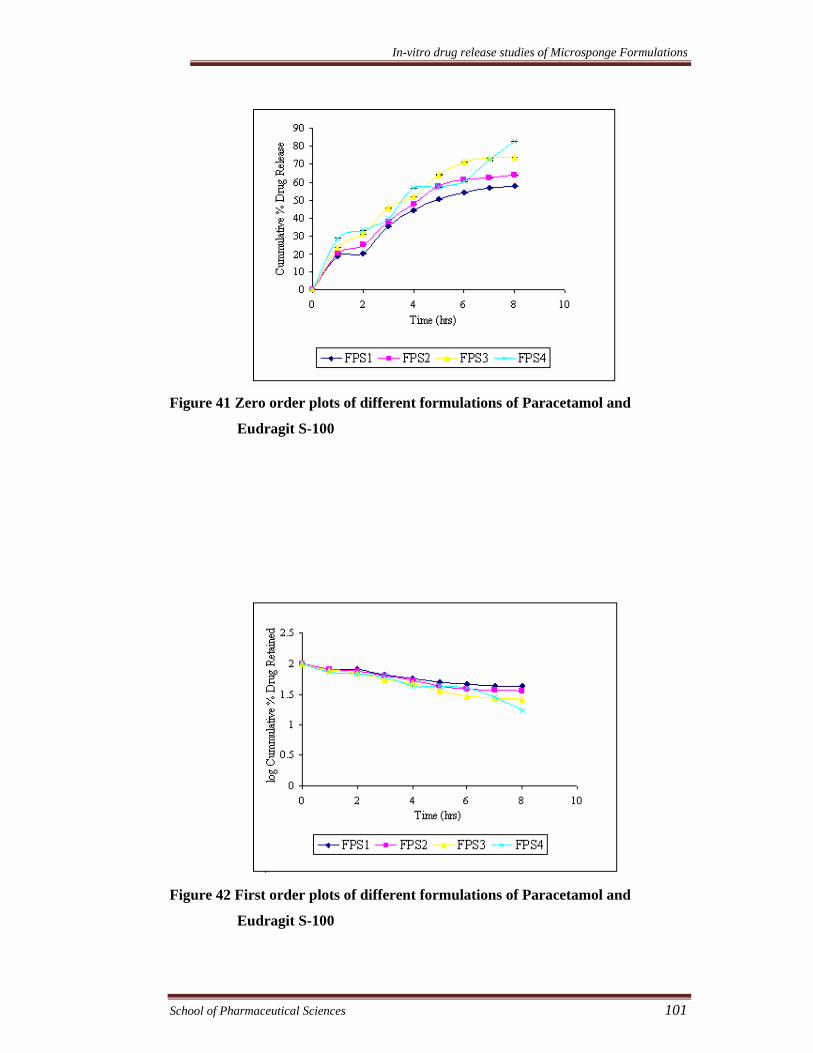
Figure 41 Zero order plots of different formulations of Paracetamol and
Eudragit S-100
Figure 42 First order plots of different formulations of Paracetamol and
Eudragit S-100
In-vitro drug release studies of Microsponge Formulations
School of Pharmaceutical Sciences 102
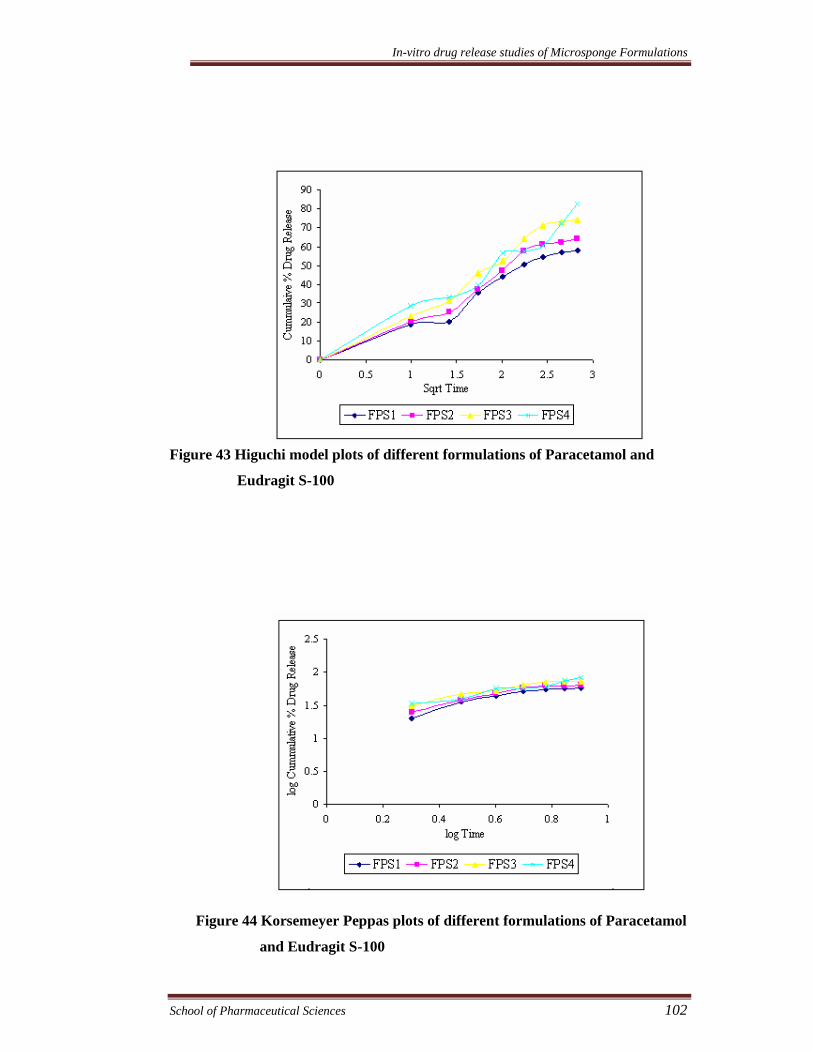
Figure 43 Higuchi model plots of different formulations of Paracetamol and
Eudragit S-100
Figure 44 Korsemeyer Peppas plots of different formulations of Paracetamol
and Eudragit S-100
In-vitro drug release studies of Microsponge Formulations
School of Pharmaceutical Sciences 103
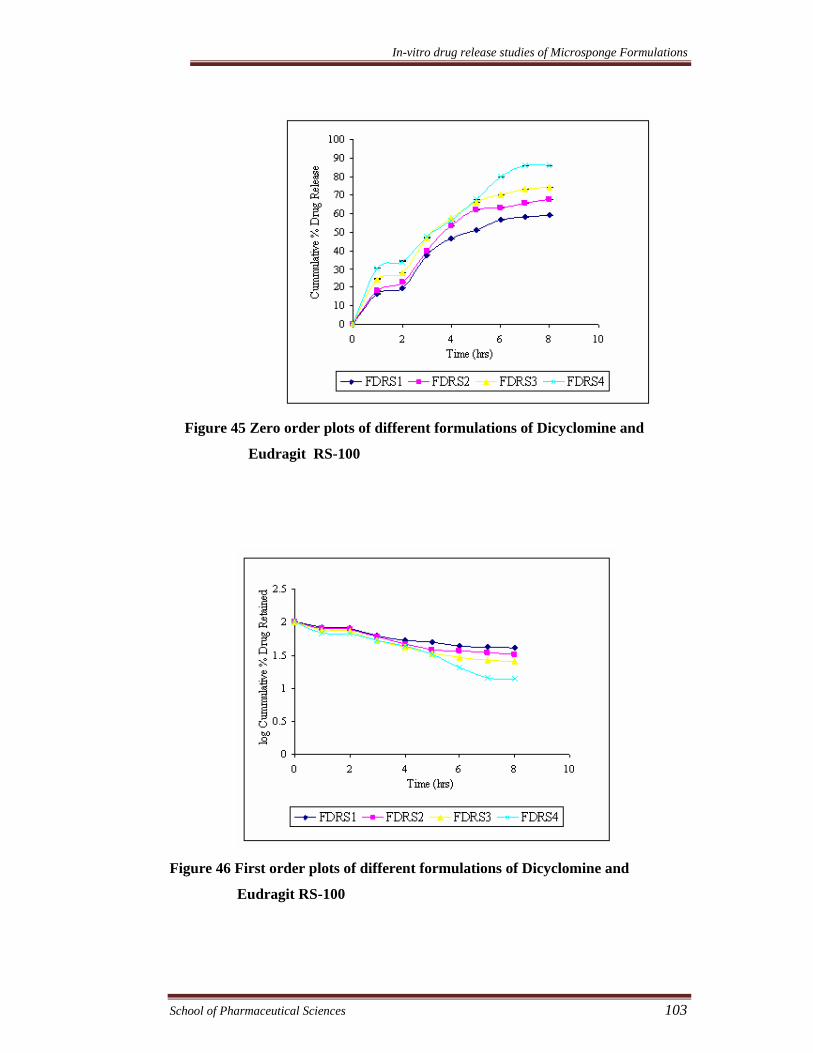
Figure 45 Zero order plots of different formulations of Dicyclomine and
Eudragit RS-100
Figure 46 First order plots of different formulations of Dicyclomine and
Eudragit RS-100
In-vitro drug release studies of Microsponge Formulations
School of Pharmaceutical Sciences 104
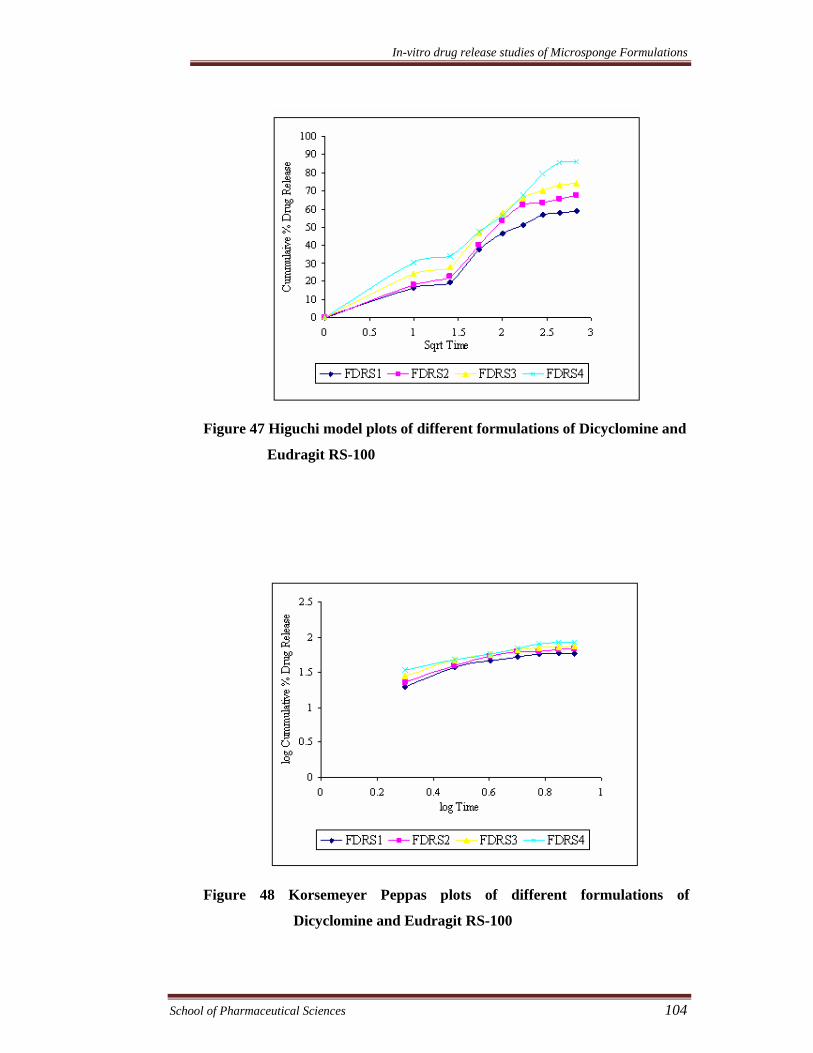
Figure 47 Higuchi model plots of different formulations of Dicyclomine and
Eudragit RS-100
Figure 48 Korsemeyer Peppas plots of different formulations of
Dicyclomine and Eudragit RS-100
In-vitro drug release studies of Microsponge Formulations
School of Pharmaceutical Sciences 105
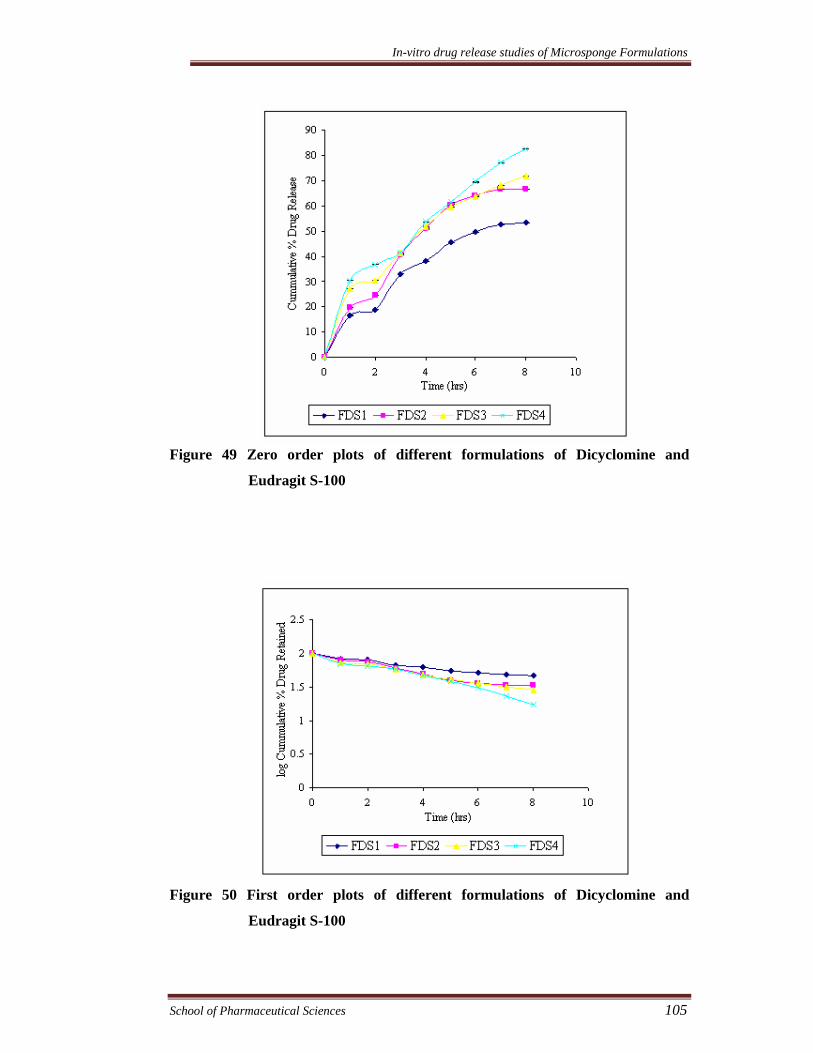
Figure 49 Zero order plots of different formulations of Dicyclomine and
Eudragit S-100
Figure 50 First order plots of different formulations of Dicyclomine and
Eudragit S-100
In-vitro drug release studies of Microsponge Formulations
School of Pharmaceutical Sciences 106
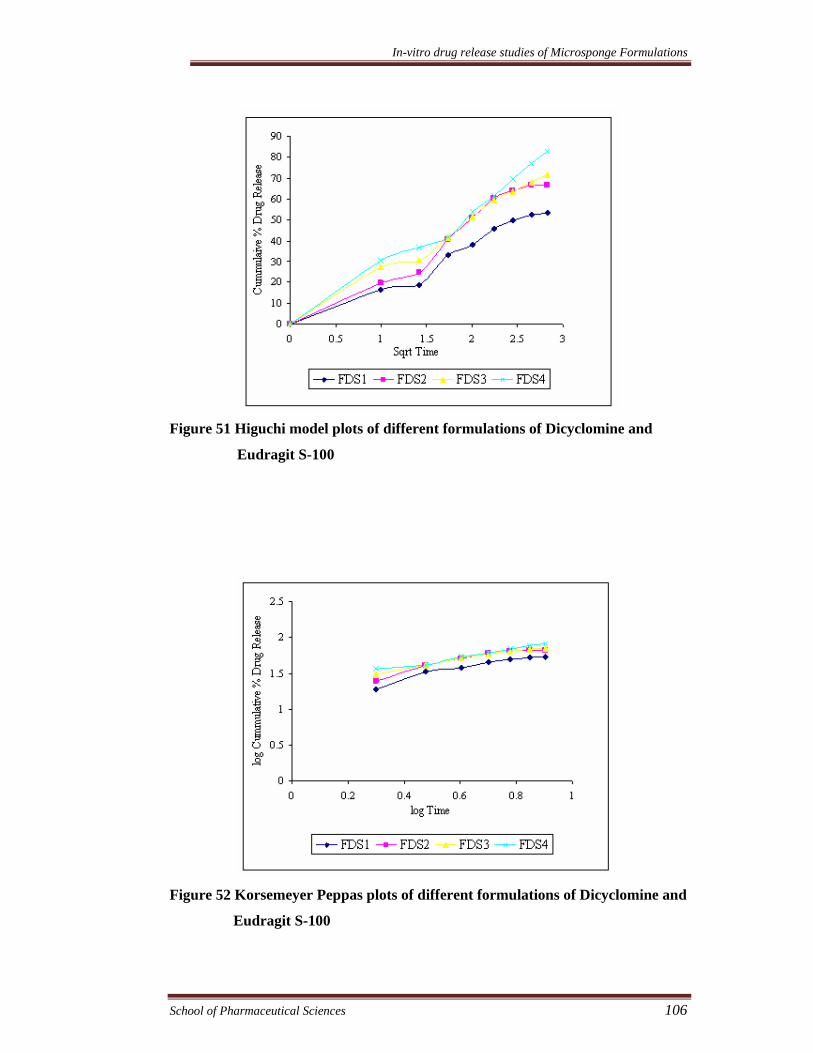
Figure 51 Higuchi model plots of different formulations of Dicyclomine and
Eudragit S-100
Figure 52 Korsemeyer Peppas plots of different formulations of Dicyclomine and
Eudragit S-100
In-vitro drug release studies of Microsponge Formulations
School of Pharmaceutical Sciences 107
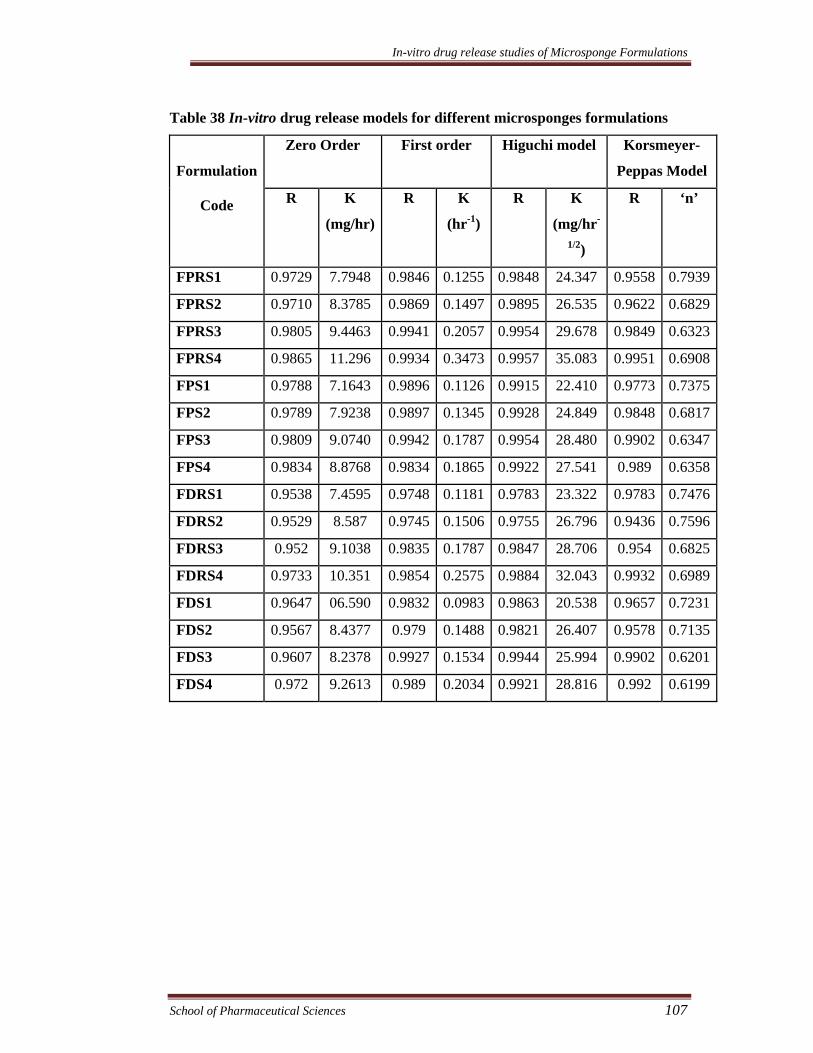
Table 38 In-vitro drug release models for different microsponges formulations
Zero Order First order Higuchi model Korsmeyer-
Peppas Model
Formulation
Code R K
(mg/hr)
R K
(hr-1)
R K
(mg/hr-
1/2)
R ‘n’
FPRS1 0.9729 7.7948 0.9846 0.1255 0.9848 24.347 0.9558 0.7939
FPRS2 0.9710 8.3785 0.9869 0.1497 0.9895 26.535 0.9622 0.6829
FPRS3 0.9805 9.4463 0.9941 0.2057 0.9954 29.678 0.9849 0.6323
FPRS4 0.9865 11.296 0.9934 0.3473 0.9957 35.083 0.9951 0.6908
FPS1 0.9788 7.1643 0.9896 0.1126 0.9915 22.410 0.9773 0.7375
FPS2 0.9789 7.9238 0.9897 0.1345 0.9928 24.849 0.9848 0.6817
FPS3 0.9809 9.0740 0.9942 0.1787 0.9954 28.480 0.9902 0.6347
FPS4 0.9834 8.8768 0.9834 0.1865 0.9922 27.541 0.989 0.6358
FDRS1 0.9538 7.4595 0.9748 0.1181 0.9783 23.322 0.9783 0.7476
FDRS2 0.9529 8.587 0.9745 0.1506 0.9755 26.796 0.9436 0.7596
FDRS3 0.952 9.1038 0.9835 0.1787 0.9847 28.706 0.954 0.6825
FDRS4 0.9733 10.351 0.9854 0.2575 0.9884 32.043 0.9932 0.6989
FDS1 0.9647 06.590 0.9832 0.0983 0.9863 20.538 0.9657 0.7231
FDS2 0.9567 8.4377 0.979 0.1488 0.9821 26.407 0.9578 0.7135
FDS3 0.9607 8.2378 0.9927 0.1534 0.9944 25.994 0.9902 0.6201
FDS4 0.972 9.2613 0.989 0.2034 0.9921 28.816 0.992 0.6199
In-vitro drug release studies of Microsponge Formulations
School of Pharmaceutical Sciences 108
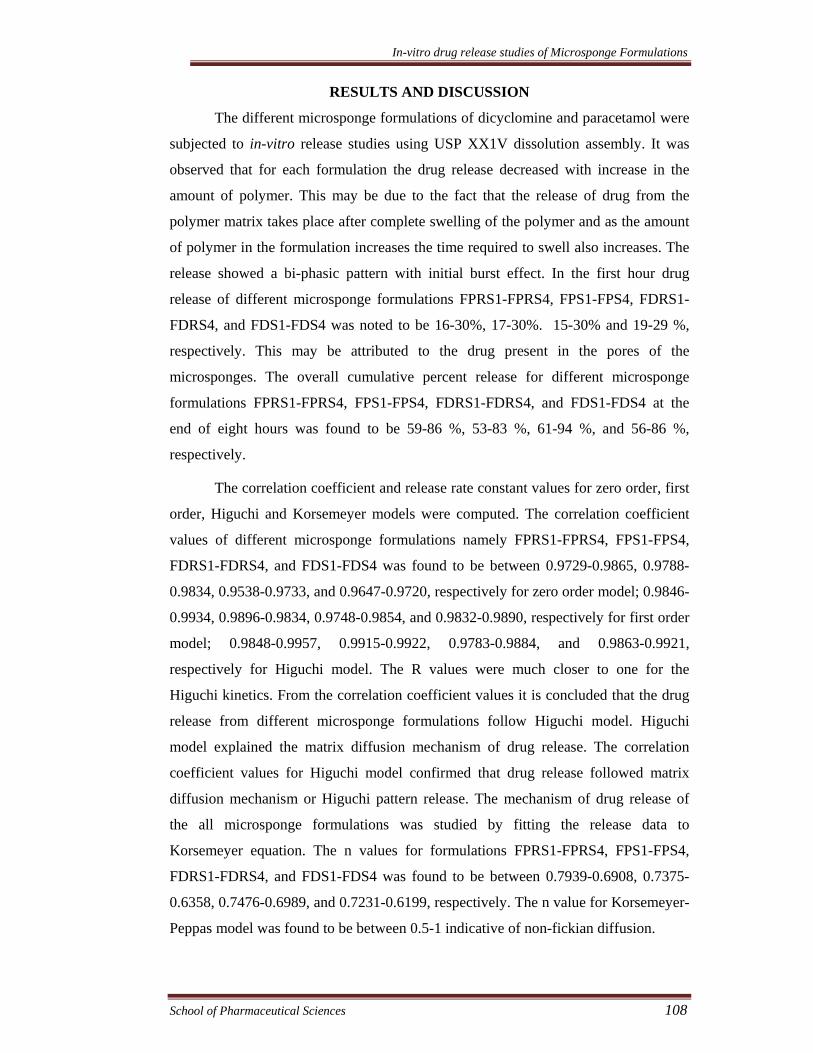
RESULTS AND DISCUSSION
The different microsponge formulations of dicyclomine and paracetamol were
subjected to in-vitro release studies using USP XX1V dissolution assembly. It was
observed that for each formulation the drug release decreased with increase in the
amount of polymer. This may be due to the fact that the release of drug from the
polymer matrix takes place after complete swelling of the polymer and as the amount
of polymer in the formulation increases the time required to swell also increases. The
release showed a bi-phasic pattern with initial burst effect. In the first hour drug
release of different microsponge formulations FPRS1-FPRS4, FPS1-FPS4, FDRS1-
FDRS4, and FDS1-FDS4 was noted to be 16-30%, 17-30%. 15-30% and 19-29 %,
respectively. This may be attributed to the drug present in the pores of the
microsponges. The overall cumulative percent release for different microsponge
formulations FPRS1-FPRS4, FPS1-FPS4, FDRS1-FDRS4, and FDS1-FDS4 at the
end of eight hours was found to be 59-86 %, 53-83 %, 61-94 %, and 56-86 %,
respectively.
The correlation coefficient and release rate constant values for zero order, first
order, Higuchi and Korsemeyer models were computed. The correlation coefficient
values of different microsponge formulations namely FPRS1-FPRS4, FPS1-FPS4,
FDRS1-FDRS4, and FDS1-FDS4 was found to be between 0.9729-0.9865, 0.9788-
0.9834, 0.9538-0.9733, and 0.9647-0.9720, respectively for zero order model; 0.9846-
0.9934, 0.9896-0.9834, 0.9748-0.9854, and 0.9832-0.9890, respectively for first order
model; 0.9848-0.9957, 0.9915-0.9922, 0.9783-0.9884, and 0.9863-0.9921,
respectively for Higuchi model. The R values were much closer to one for the
Higuchi kinetics. From the correlation coefficient values it is concluded that the drug
release from different microsponge formulations follow Higuchi model. Higuchi
model explained the matrix diffusion mechanism of drug release. The correlation
coefficient values for Higuchi model confirmed that drug release followed matrix
diffusion mechanism or Higuchi pattern release. The mechanism of drug release of
the all microsponge formulations was studied by fitting the release data to
Korsemeyer equation. The n values for formulations FPRS1-FPRS4, FPS1-FPS4,
FDRS1-FDRS4, and FDS1-FDS4 was found to be between 0.7939-0.6908, 0.7375-
0.6358, 0.7476-0.6989, and 0.7231-0.6199, respectively. The n value for Korsemeyer-
Peppas model was found to be between 0.5-1 indicative of non-fickian diffusion.
In-vitro drug release studies of Microsponge Formulations
School of Pharmaceutical Sciences 109
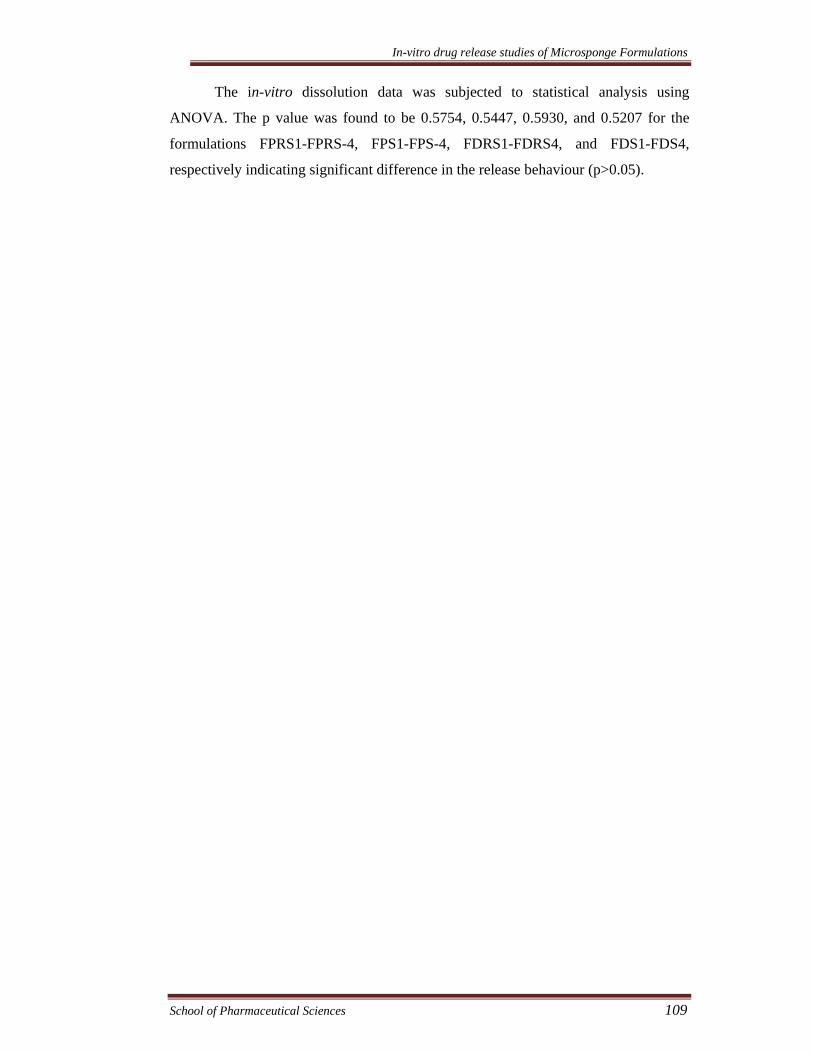
The in-vitro dissolution data was subjected to statistical analysis using
ANOVA. The p value was found to be 0.5754, 0.5447, 0.5930, and 0.5207 for the
formulations FPRS1-FPRS-4, FPS1-FPS-4, FDRS1-FDRS4, and FDS1-FDS4,
respectively indicating significant difference in the release behaviour (p>0.05).
Preparation and Characterization of Colon Specific Formulations
School of Pharmaceutical Sciences 110
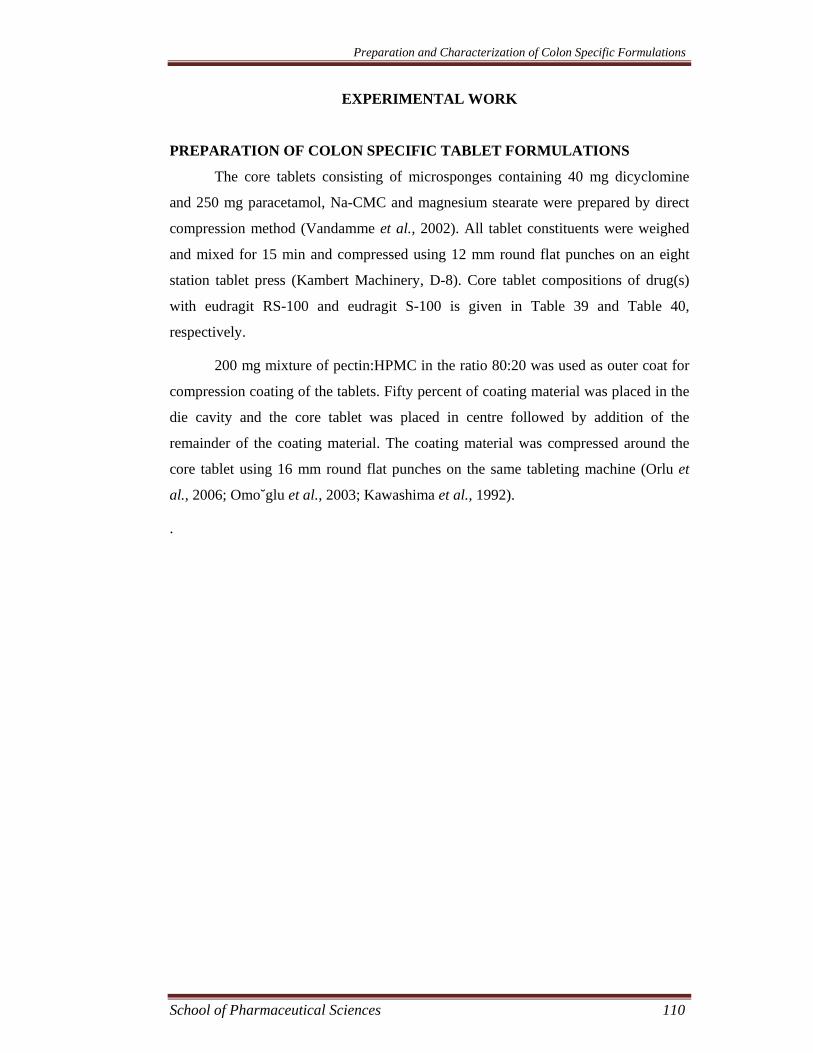
EXPERIMENTAL WORK
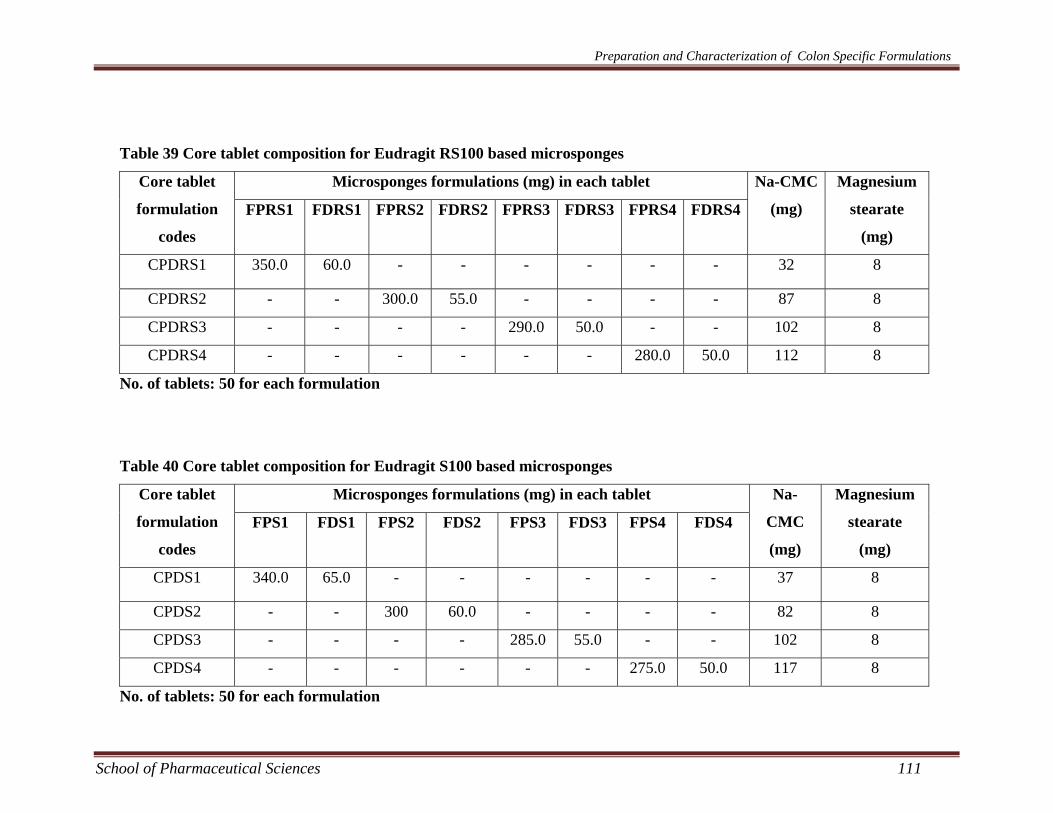
PREPARATION OF COLON SPECIFIC TABLET FORMULATIONS
The core tablets consisting of microsponges containing 40 mg dicyclomine
and 250 mg paracetamol, Na-CMC and magnesium stearate were prepared by direct
compression method (Vandamme et al., 2002). All tablet constituents were weighed
and mixed for 15 min and compressed using 12 mm round flat punches on an eight
station tablet press (Kambert Machinery, D-8). Core tablet compositions of drug(s)
with eudragit RS-100 and eudragit S-100 is given in Table 39 and Table 40,
respectively.
200 mg mixture of pectin:HPMC in the ratio 80:20 was used as outer coat for
compression coating of the tablets. Fifty percent of coating material was placed in the
die cavity and the core tablet was placed in centre followed by addition of the
remainder of the coating material. The coating material was compressed around the
core tablet using 16 mm round flat punches on the same tableting machine (Orlu et
al., 2006; Omo˘glu et al., 2003; Kawashima et al., 1992).
.
Preparation and Characterization of Colon Specific Formulations
School of Pharmaceutical Sciences 111
Table 39 Core tablet composition for Eudragit RS100 based microsponges
Microsponges formulations (mg) in each tablet Core tablet
formulation
codes
FPRS1 FDRS1 FPRS2 FDRS2 FPRS3 FDRS3 FPRS4 FDRS4
Na-CMC
(mg)
Magnesium
stearate
(mg)
CPDRS1 350.0 60.0 - - - - - - 32 8
CPDRS2 - - 300.0 55.0 - - - - 87 8
CPDRS3 - - - - 290.0 50.0 - - 102 8
CPDRS4 - - - - - - 280.0 50.0 112 8
No. of tablets: 50 for each formulation
Table 40 Core tablet composition for Eudragit S100 based microsponges
Microsponges formulations (mg) in each tablet Core tablet
formulation
codes
FPS1 FDS1 FPS2 FDS2 FPS3 FDS3 FPS4 FDS4
Na-
CMC
(mg)
Magnesium
stearate
(mg)
CPDS1 340.0 65.0 - - - - - - 37 8
CPDS2 - - 300 60.0 - - - - 82 8
CPDS3 - - - - 285.0 55.0 - - 102 8
CPDS4 - - - - - - 275.0 50.0 117 8
No. of tablets: 50 for each formulation

Preparation and Characterization of Colon Specific Formulations
School of Pharmaceutical Sciences 112
EVALUATION OF CORE AND COATED TABLETS
Weight Variation
The weight variation test was performed by weighing 20 tablets individually
and collectively, calculating the average weight, and comparing the individual tablet
weight to the average (Pharmacopoeia of India 1996). The data of core and coated
tablets are shown in Table 41 and 42.
Thickness
Thickness of the tablets was determined using verniar calipers. For this
purpose thickness of 10 tablets was individually measured (Lachman 1991). The data
of core and coated tablets are shown in Table 41 and 42.
Hardness
Hardness of the tablet was determined with the help of Monsanto hardness
tester. The tester consists of a barrel containing a compressible spring held between
two plungers. The lower plunger is placed in contact with the tablet, and a zero
reading is taken. The upper plunger is then forced against a spring by turning a
threaded bolt until the tablet fractured. The force of fracture was recorded by
monitoring a pointer which rides along a guage in the barrel to indicate the force. The
values of hardness of core and coated tablets are shown in Table 41 and 42.
Friability
The friability of the tablets was determined using Roche friabilator. It was
expressed in percentage (%). 10 tablets were weighed and transferred to the
friabilator. The friabilator was operated at 25 rpm for four minutes. After four minutes
the tablets were weighed again. The % friability was then calculated using the
formula;
The values of friability of core and coated tablets are shown in Table 41 and
42.
Preparation and Characterization of Colon Specific Formulations
School of Pharmaceutical Sciences 113
Drug content
The drug content of the tablets was measured spectrophotometrically. For this
purpose 5 tablets were collectively weighed, and crushed. The weighed amount of
powder containing equivalent to 250 mg of paracetamol and 40 mg of dicyclomine
was suspended in 100 ml simulated intestinal fluid (SIF) pH 6.8 for 12 h (sample I)
with occasional stirring and filtered using 0.45_m membrane filter.
For paracetamol, 1 ml of sample I was diluted with 10 ml SIF pH 6.8 (sample
II). Further, one ml of sample II was diluted up to 10 ml SIF pH 6.8 and analyzed at
243 nm against blank using UV spectrophotometer (UV 1700, Shimadzu, Japan).
For dicyclomine, 5 ml of sample I was diluted with 5 ml of 0.1N HCl (sample-
2). Further, 5 ml of sample II was diluted with 25 ml of methyl orange (1%w/v) and
extracted with chloroform (3x7.5 ml), then the volume of sample was made up to 50
ml with sodium acetate solution. The solution was filtered using 0.45_m membrane
filter. The absorbance was taken at 420 nm against blank UV spectrophotometer (UV
1700, Shimadzu, Japan).
The drug content was calculated using the following formula.
Actual drug content (%) =Mact/Mms × 100
Where Mact is the actual drug content of the tablet, Mms is the total amount of drug.
All analyses were carried out in triplicate. The values of drug content of core tablets
are shown in Table 41.
Preparation and Characterization of Colon Specific Formulations
School of Pharmaceutical Sciences 114
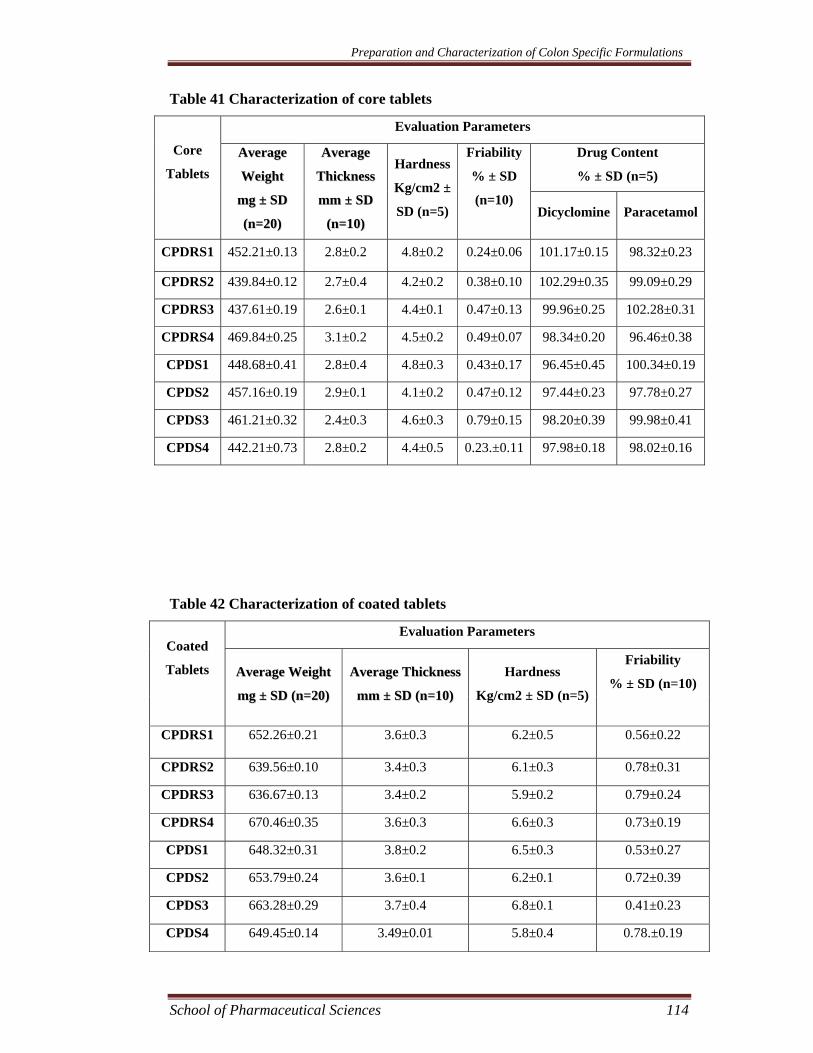
Table 41 Characterization of core tablets
Evaluation Parameters
Drug Content
% ± SD (n=5)
Core
Tablets
AAvveerraaggee
WWeeiigghhtt
mmgg ±± SSDD
((nn==2200))
AAvveerraaggee
TThhiicckknneessss
mmmm ±± SSDD
((nn==1100))
Hardness
Kg/cm2 ±
SD (n=5)
Friability
% ± SD
(n=10)
Dicyclomine Paracetamol
CPDRS1 452.21±0.13 2.8±0.2 4.8±0.2 0.24±0.06 101.17±0.15 98.32±0.23
CPDRS2 439.84±0.12 2.7±0.4 4.2±0.2 0.38±0.10 102.29±0.35 99.09±0.29
CPDRS3 437.61±0.19 2.6±0.1 4.4±0.1 0.47±0.13 99.96±0.25 102.28±0.31
CPDRS4 469.84±0.25 3.1±0.2 4.5±0.2 0.49±0.07 98.34±0.20 96.46±0.38
CPDS1 448.68±0.41 2.8±0.4 4.8±0.3 0.43±0.17 96.45±0.45 100.34±0.19
CPDS2 457.16±0.19 2.9±0.1 4.1±0.2 0.47±0.12 97.44±0.23 97.78±0.27
CPDS3 461.21±0.32 2.4±0.3 4.6±0.3 0.79±0.15 98.20±0.39 99.98±0.41
CPDS4 442.21±0.73 2.8±0.2 4.4±0.5 0.23.±0.11 97.98±0.18 98.02±0.16
Table 42 Characterization of coated tablets
Evaluation Parameters Coated
Tablets
AAvveerraaggee WWeeiigghhtt
mmgg ±± SSDD ((nn==2200))
AAvveerraaggee TThhiicckknneessss
mmmm ±± SSDD ((nn==1100))
Hardness
Kg/cm2 ± SD (n=5)
Friability
% ± SD (n=10)
CPDRS1 652.26±0.21 3.6±0.3 6.2±0.5 0.56±0.22
CPDRS2 639.56±0.10 3.4±0.3 6.1±0.3 0.78±0.31
CPDRS3 636.67±0.13 3.4±0.2 5.9±0.2 0.79±0.24
CPDRS4 670.46±0.35 3.6±0.3 6.6±0.3 0.73±0.19
CPDS1 648.32±0.31 3.8±0.2 6.5±0.3 0.53±0.27
CPDS2 653.79±0.24 3.6±0.1 6.2±0.1 0.72±0.39
CPDS3 663.28±0.29 3.7±0.4 6.8±0.1 0.41±0.23
CPDS4 649.45±0.14 3.49±0.01 5.8±0.4 0.78.±0.19
Preparation and Characterization of Colon Specific Formulations
School of Pharmaceutical Sciences 115
RESULTS AND DISCUSSION
The core tablets consisting of microsponges containing 40 mg dicyclomine
and 250 mg paracetamol, Na-CMC and magnesium stearate were prepared by direct
compression method. The core tablets were evaluated for weight variation, thickness,
hardness, friability, and drug content.
The average weight of the core tablet formulations CPDRS1-CPDRS4 and
CPDS1-CPDS4 were found to be between 438 to 470 and 442 to 461 mg,
respectively. The variation in weight was within the range of < 5% complying the
pharmacopoeial specifications (Pharmacopoeia of India 1996). The hardness was
found to between 4.1 kg/cm2 to 4.8 kg/cm2 indicating satisfactory mechanical
strength. The friability of the core tablet formulations were found to be between 0.23
% to 0.79 %. The friability was below 1% which indicated good mechanical
resistance. The thickness was found to between 2.76-3.01 mm.
The coated tablets were prepared by compression coating the tablets with
Pectin:HPMC (80:20) mixture as outer shell. The coated tablet formulations were also
evaluated for weight variation, thickness, hardness, and friability.
The average weights of the coated tablet formulations CPDRS1-CPDRS4 and
CPDS1-CPDS4 were found to be between 637 to 670 and 648 to 663 mg,
respectively. The variation in weight was within the range of < 5% complying the
pharmacopoeial specifications. The hardness was found to between 5.8 kg/cm2 to 6.8
kg/cm2 indicating satisfactory mechanical strength. The friability of the core tablet
formulations were found to be between 0.41 % to 0.79 %. The friability was below
1% which indicated good mechanical resistance. The thickness was found to between
3.40 to 3.67 mm.
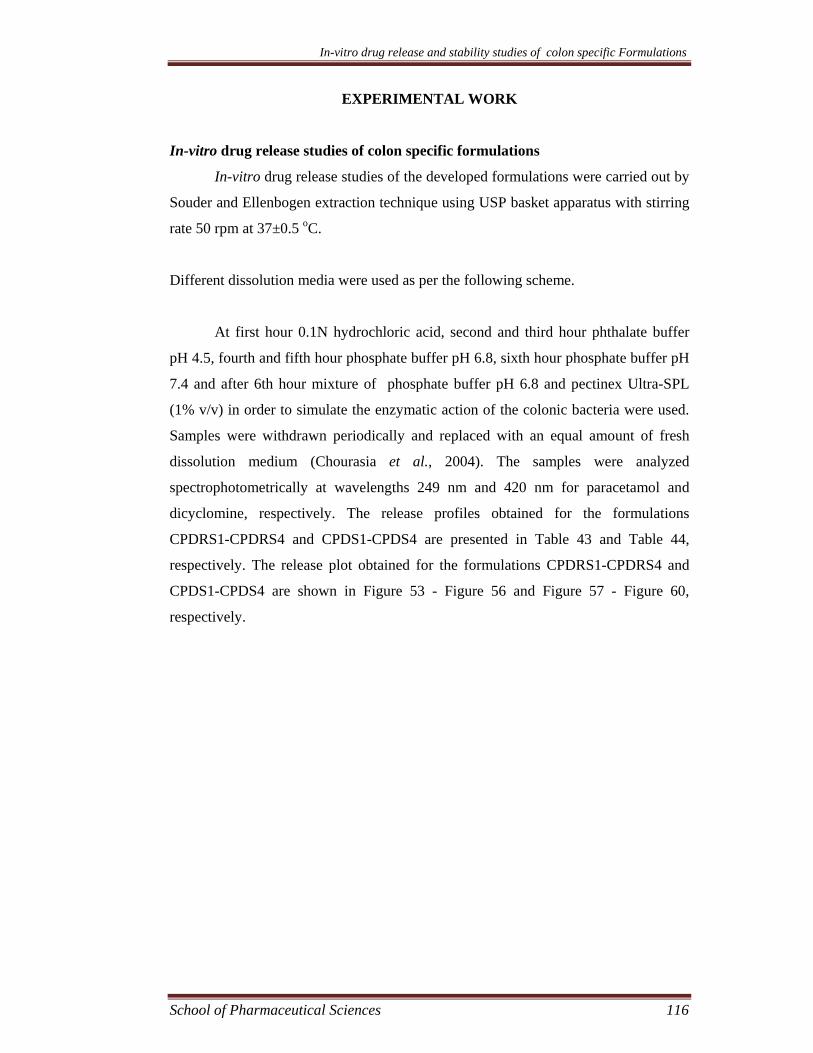
In-vitro drug release and stability studies of colon specific Formulations
School of Pharmaceutical Sciences 116
EXPERIMENTAL WORK
In-vitro drug release studies of colon specific formulations
In-vitro drug release studies of the developed formulations were carried out by
Souder and Ellenbogen extraction technique using USP basket apparatus with stirring
rate 50 rpm at 37±0.5 oC.
Different dissolution media were used as per the following scheme.
At first hour 0.1N hydrochloric acid, second and third hour phthalate buffer
pH 4.5, fourth and fifth hour phosphate buffer pH 6.8, sixth hour phosphate buffer pH
7.4 and after 6th hour mixture of phosphate buffer pH 6.8 and pectinex Ultra-SPL
(1% v/v) in order to simulate the enzymatic action of the colonic bacteria were used.
Samples were withdrawn periodically and replaced with an equal amount of fresh
dissolution medium (Chourasia et al., 2004). The samples were analyzed
spectrophotometrically at wavelengths 249 nm and 420 nm for paracetamol and
dicyclomine, respectively. The release profiles obtained for the formulations
CPDRS1-CPDRS4 and CPDS1-CPDS4 are presented in Table 43 and Table 44,
respectively. The release plot obtained for the formulations CPDRS1-CPDRS4 and
CPDS1-CPDS4 are shown in Figure 53 - Figure 56 and Figure 57 - Figure 60,
respectively.
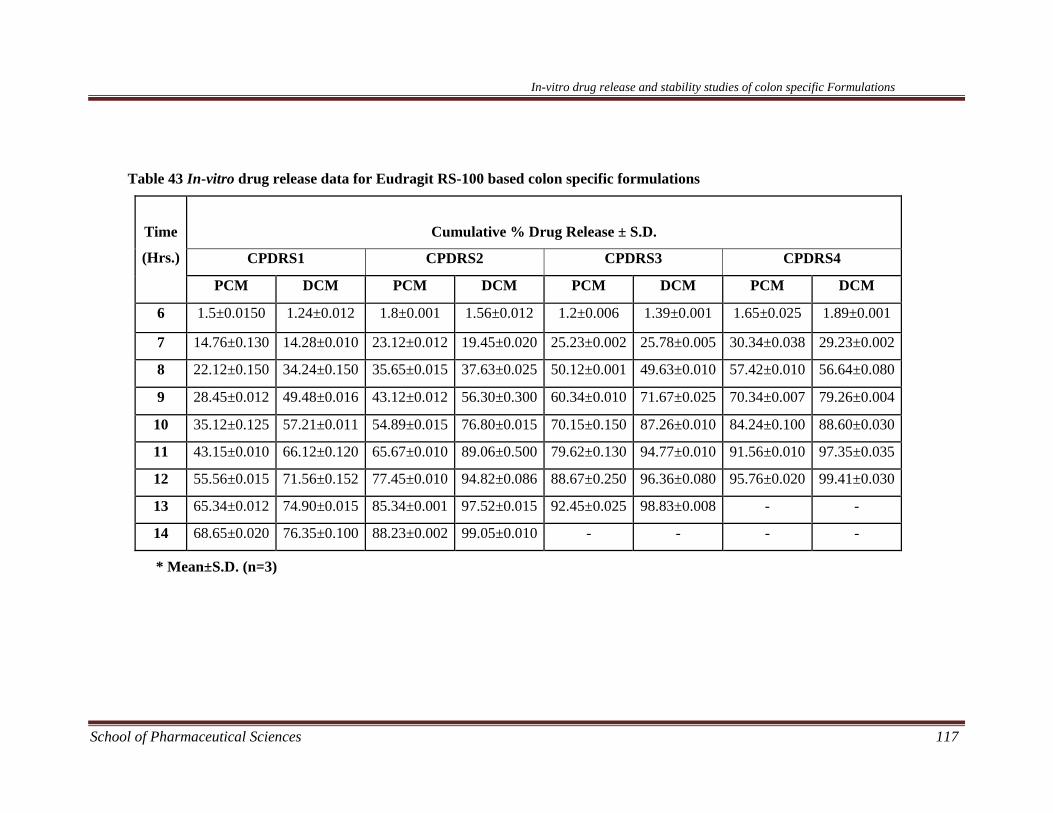
In-vitro drug release and stability studies of colon specific Formulations
School of Pharmaceutical Sciences 117
Table 43 In-vitro drug release data for Eudragit RS-100 based colon specific formulations
Cumulative % Drug Release ± S.D.
CPDRS1 CPDRS2 CPDRS3 CPDRS4
Time
(Hrs.)
PCM DCM PCM DCM PCM DCM PCM DCM
6 1.5±0.0150 1.24±0.012 1.8±0.001 1.56±0.012 1.2±0.006 1.39±0.001 1.65±0.025 1.89±0.001
7 14.76±0.130 14.28±0.010 23.12±0.012 19.45±0.020 25.23±0.002 25.78±0.005 30.34±0.038 29.23±0.002
8 22.12±0.150 34.24±0.150 35.65±0.015 37.63±0.025 50.12±0.001 49.63±0.010 57.42±0.010 56.64±0.080
9 28.45±0.012 49.48±0.016 43.12±0.012 56.30±0.300 60.34±0.010 71.67±0.025 70.34±0.007 79.26±0.004
10 35.12±0.125 57.21±0.011 54.89±0.015 76.80±0.015 70.15±0.150 87.26±0.010 84.24±0.100 88.60±0.030
11 43.15±0.010 66.12±0.120 65.67±0.010 89.06±0.500 79.62±0.130 94.77±0.010 91.56±0.010 97.35±0.035
12 55.56±0.015 71.56±0.152 77.45±0.010 94.82±0.086 88.67±0.250 96.36±0.080 95.76±0.020 99.41±0.030
13 65.34±0.012 74.90±0.015 85.34±0.001 97.52±0.015 92.45±0.025 98.83±0.008 - -
14 68.65±0.020 76.35±0.100 88.23±0.002 99.05±0.010 - - - -
* Mean±S.D. (n=3)

In-vitro drug release and stability studies of colon specific Formulations
School of Pharmaceutical Sciences 118
Table 44 In-vitro drug release data for Eudragit S100 based colon specific formulations
Cumulative % Drug Release ± S.D.
CPDS1 CPDS2 CPDS3 CPDS4
Time
(Hrs.)
PCM DCM PCM DCM PCM DCM PCM DCM
6 1.24±0.001 2.03±0.130 2.08±0.001 1.67±0.010 1.78±0.007 1.59±0.001 1.97±0.025 1.780.01
7 19.32±0.040 15.89±0.110 18.58±0.060 18.06±0.015 23.66±0.003 24.01±0.020 29.67±0.065 36.77±0.015
8 27.45±0.060 27.56±0.012 31.97±0.001 33.87±0.025 51.89±0.020 43.82±0.001 55.75±0.250 54.88±0.010
9 43.67±0.002 41.64±0.015 51.08±0.004 51.54±0.010 77.84±0.090 65.29±0.050 79.40±0.028 74.58±0.010
10 57.43±0.009 52.56±0.062 72.34±0.002 66.72±0.100 87.10±0.001 79.06±0.003 92.07±0.012 83.46±0.001
11 67.16±0.001 59.27±0.010 84.90±0.020 77.80±0.150 94.07±0.015 87.50±0.002 97.57±0.013 93.73±0.001
12 71.69±0.001 65.83±0.101 91.32±0.060 85.44±0.121 97.37±0.065 93.22±0.001 99.45±0.005 97.59±0.004
13 74.90±0.008 69.08±0.011 94.30±0.010 89.91±0.010 99.04±0.071 97.01±0.010 - -
14 76.08±0.080 72.39±0.010 97.43±0.007 91.36±0.001 - - - -
* Mean±S.D. (n=3)
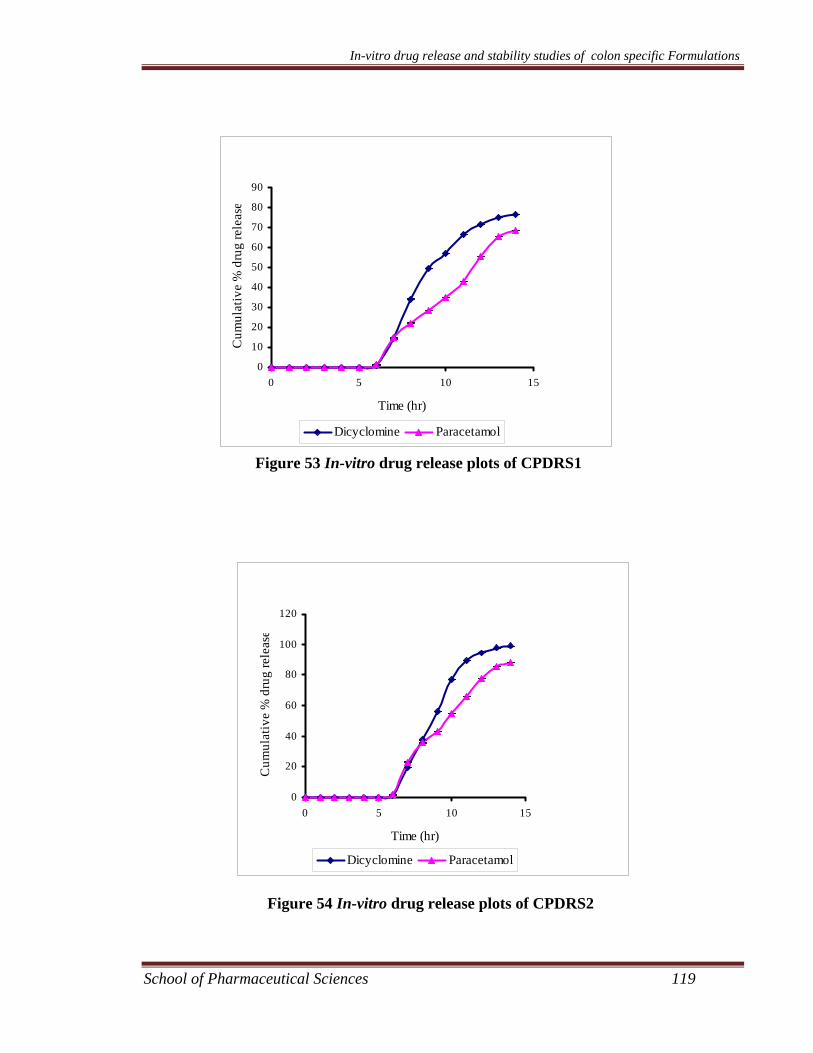
In-vitro drug release and stability studies of colon specific Formulations
School of Pharmaceutical Sciences 119
Figure 53 In-vitro drug release plots of CPDRS1
Figure 54 In-vitro drug release plots of CPDRS2
0
20
40
60
80
100
120
0 5 10 15
Time (hr)
Cum
ulat
ive
% d
rug
rele
ase
Dicyclomine Paracetamol
0
10
20
30
40
50
60
70
80
90
0 5 10 15
Time (hr)
Cum
ulat
ive
% d
rug
rele
ase
Dicyclomine Paracetamol
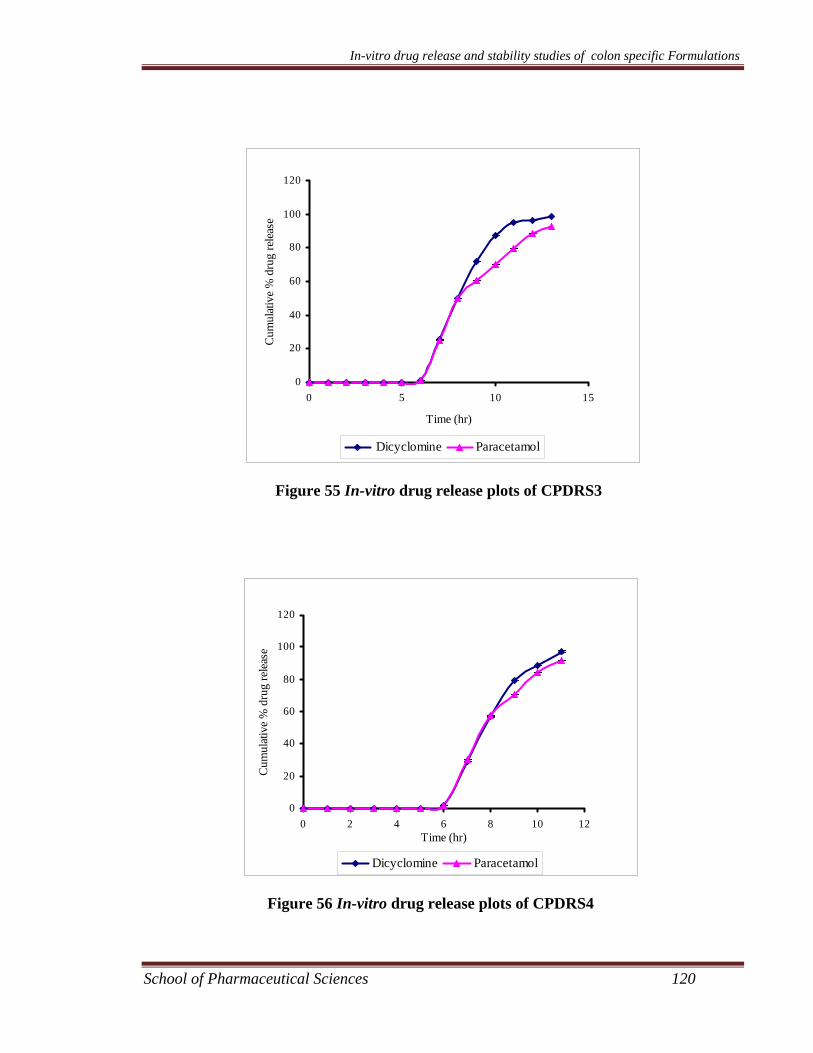
In-vitro drug release and stability studies of colon specific Formulations
School of Pharmaceutical Sciences 120
Figure 55 In-vitro drug release plots of CPDRS3
Figure 56 In-vitro drug release plots of CPDRS4
0
20
40
60
80
100
120
0 5 10 15
Time (hr)
Cum
ulat
ive
% d
rug
rele
ase
Dicyclomine Paracetamol
0
20
40
60
80
100
120
0 2 4 6 8 10 12Time (hr)
Cum
ulat
ive
% d
rug
rele
ase
Dicyclomine Paracetamol
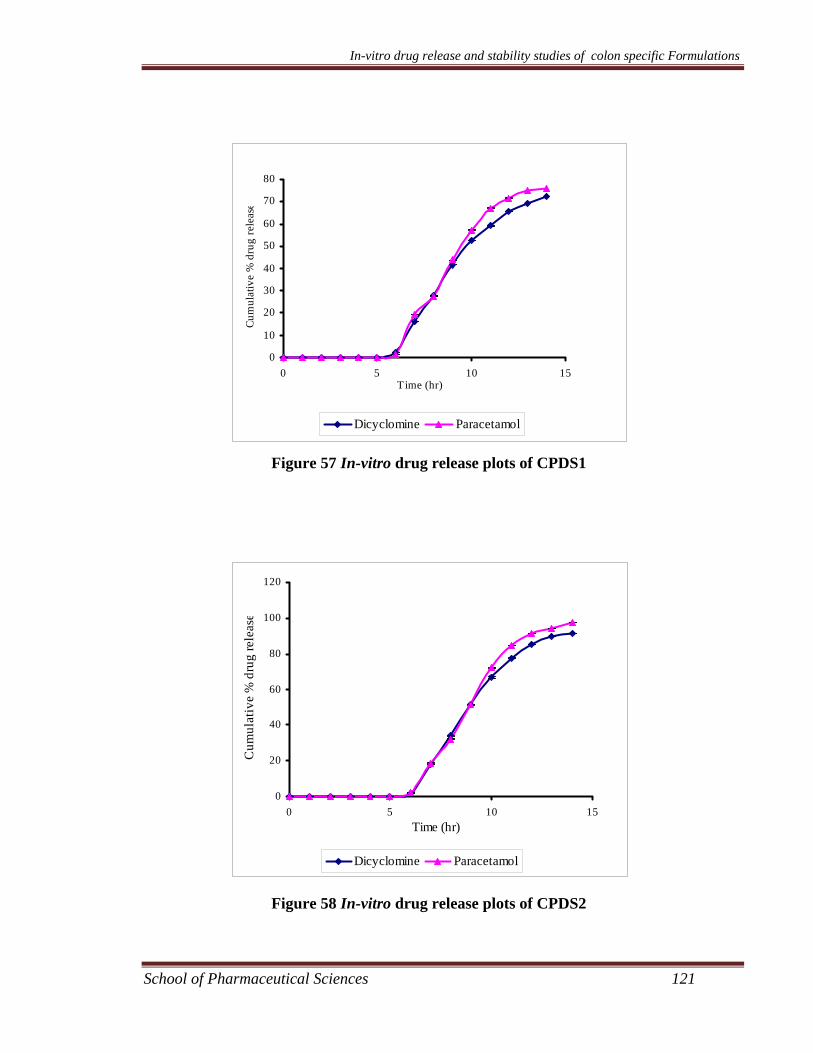
In-vitro drug release and stability studies of colon specific Formulations
School of Pharmaceutical Sciences 121
Figure 57 In-vitro drug release plots of CPDS1
Figure 58 In-vitro drug release plots of CPDS2
0
10
20
30
40
50
60
70
80
0 5 10 15Time (hr)
Cum
ulat
ive
% d
rug
rele
ase
Dicyclomine Paracetamol
0
20
40
60
80
100
120
0 5 10 15Time (hr)
Cum
ulat
ive
% d
rug
rele
ase
Dicyclomine Paracetamol
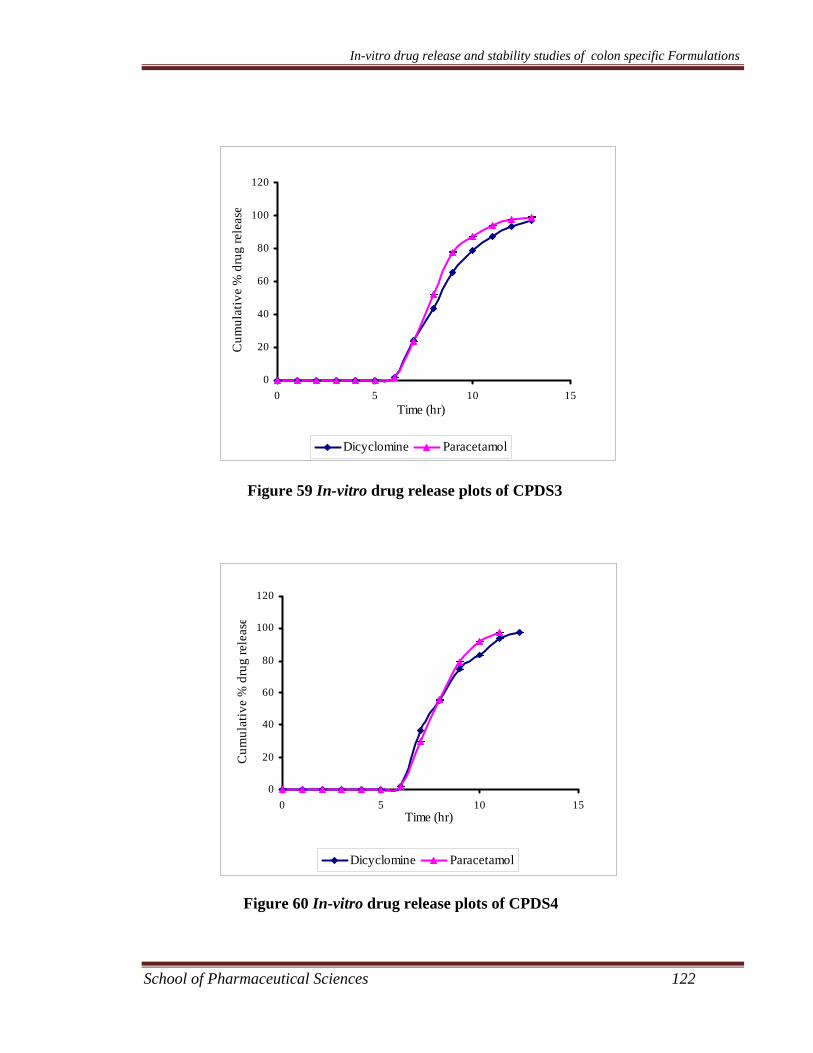
In-vitro drug release and stability studies of colon specific Formulations
School of Pharmaceutical Sciences 122
Figure 59 In-vitro drug release plots of CPDS3
Figure 60 In-vitro drug release plots of CPDS4
0
20
40
60
80
100
120
0 5 10 15Time (hr)
Cum
ulat
ive
% d
rug
rele
ase
Dicyclomine Paracetamol
0
20
40
60
80
100
120
0 5 10 15Time (hr)
Cum
ulat
ive
% d
rug
rele
ase
Dicyclomine Paracetamol
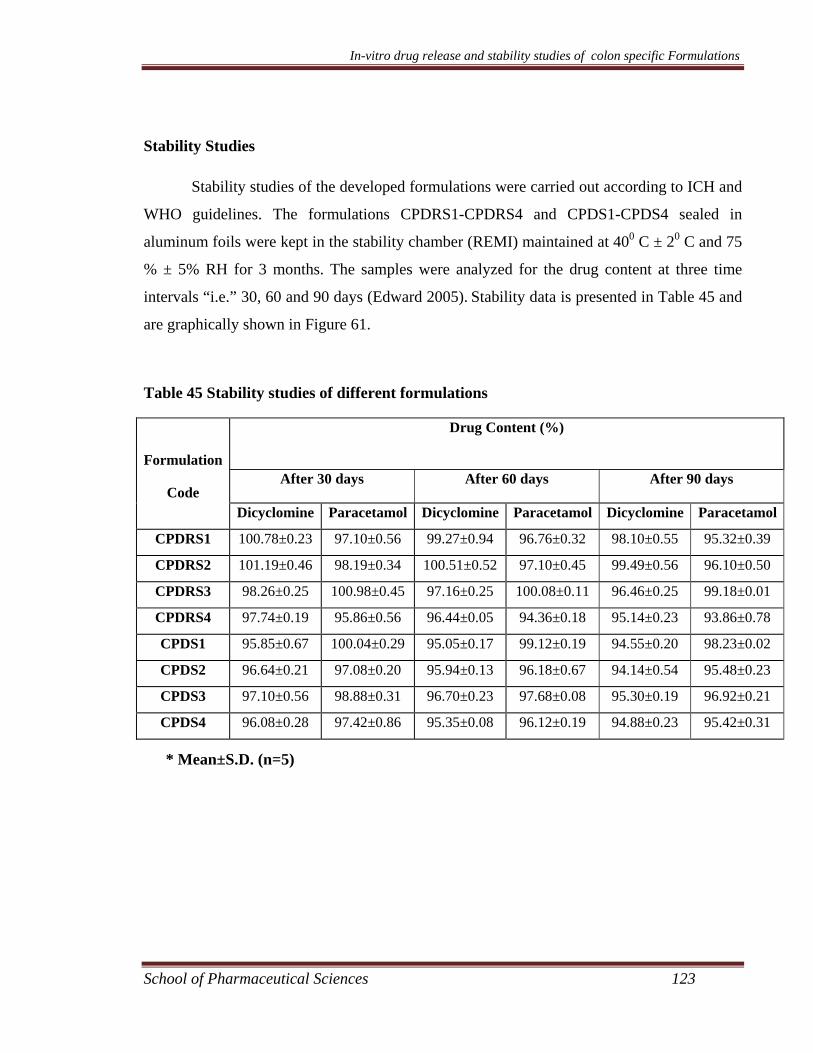
In-vitro drug release and stability studies of colon specific Formulations
School of Pharmaceutical Sciences 123
Stability Studies
Stability studies of the developed formulations were carried out according to ICH and
WHO guidelines. The formulations CPDRS1-CPDRS4 and CPDS1-CPDS4 sealed in
aluminum foils were kept in the stability chamber (REMI) maintained at 400 C ± 20 C and 75
% ± 5% RH for 3 months. The samples were analyzed for the drug content at three time
intervals “i.e.” 30, 60 and 90 days (Edward 2005). Stability data is presented in Table 45 and
are graphically shown in Figure 61.
Table 45 Stability studies of different formulations
Drug Content (%)
After 30 days After 60 days After 90 days
Formulation
Code Dicyclomine Paracetamol Dicyclomine Paracetamol Dicyclomine Paracetamol
CPDRS1 100.78±0.23 97.10±0.56 99.27±0.94 96.76±0.32 98.10±0.55 95.32±0.39
CPDRS2 101.19±0.46 98.19±0.34 100.51±0.52 97.10±0.45 99.49±0.56 96.10±0.50
CPDRS3 98.26±0.25 100.98±0.45 97.16±0.25 100.08±0.11 96.46±0.25 99.18±0.01
CPDRS4 97.74±0.19 95.86±0.56 96.44±0.05 94.36±0.18 95.14±0.23 93.86±0.78
CPDS1 95.85±0.67 100.04±0.29 95.05±0.17 99.12±0.19 94.55±0.20 98.23±0.02
CPDS2 96.64±0.21 97.08±0.20 95.94±0.13 96.18±0.67 94.14±0.54 95.48±0.23
CPDS3 97.10±0.56 98.88±0.31 96.70±0.23 97.68±0.08 95.30±0.19 96.92±0.21
CPDS4 96.08±0.28 97.42±0.86 95.35±0.08 96.12±0.19 94.88±0.23 95.42±0.31
* Mean±S.D. (n=5)

In-vitro drug release and stability studies of colon specific Formulations
School of Pharmaceutical Sciences 124
90
92
94
96
98
100
102
DCM PCM DCM PCM DCM PCM
After 30days
After 60days
After 90days
Time (in days)
Drug
Con
tent
(%)
CPDRS1CPDRS2CPDRS3CPDRS4CPDS1CPDS2CPDS3CPDS4
Figure 61 Stability studies of different formulations at 400±20 C & 75±5% RH
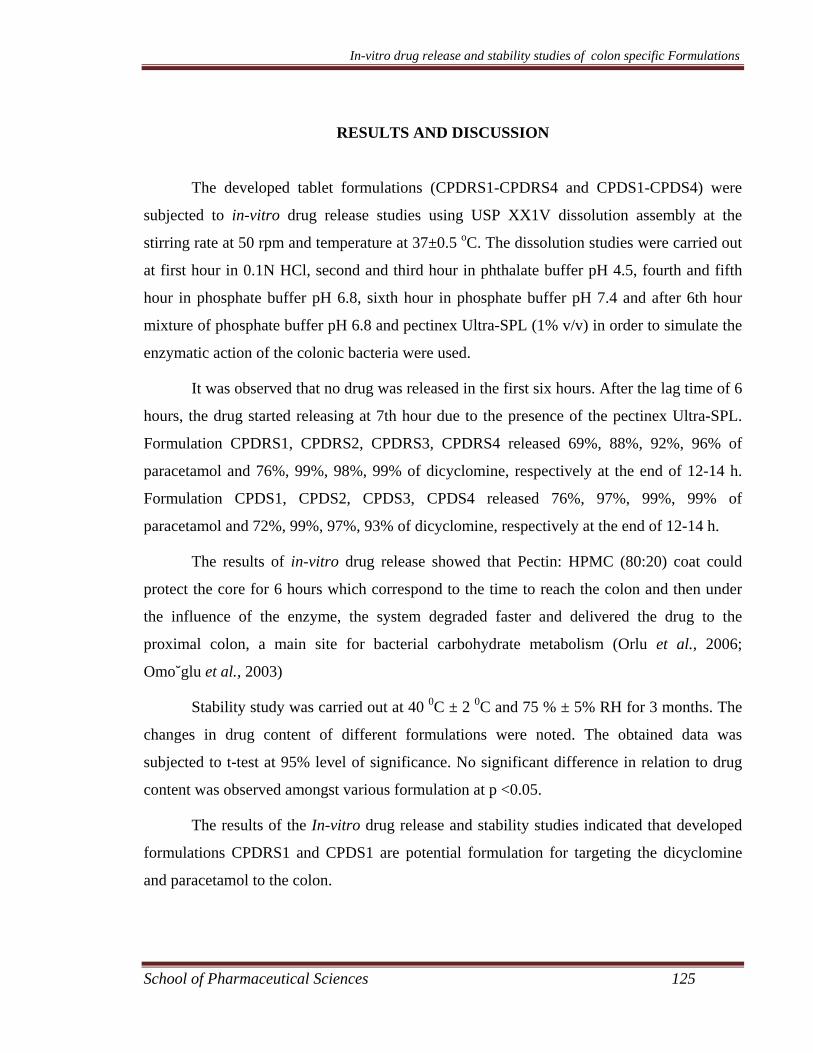
In-vitro drug release and stability studies of colon specific Formulations
School of Pharmaceutical Sciences 125
RESULTS AND DISCUSSION
The developed tablet formulations (CPDRS1-CPDRS4 and CPDS1-CPDS4) were
subjected to in-vitro drug release studies using USP XX1V dissolution assembly at the
stirring rate at 50 rpm and temperature at 37±0.5 oC. The dissolution studies were carried out
at first hour in 0.1N HCl, second and third hour in phthalate buffer pH 4.5, fourth and fifth
hour in phosphate buffer pH 6.8, sixth hour in phosphate buffer pH 7.4 and after 6th hour
mixture of phosphate buffer pH 6.8 and pectinex Ultra-SPL (1% v/v) in order to simulate the
enzymatic action of the colonic bacteria were used.
It was observed that no drug was released in the first six hours. After the lag time of 6
hours, the drug started releasing at 7th hour due to the presence of the pectinex Ultra-SPL.
Formulation CPDRS1, CPDRS2, CPDRS3, CPDRS4 released 69%, 88%, 92%, 96% of
paracetamol and 76%, 99%, 98%, 99% of dicyclomine, respectively at the end of 12-14 h.
Formulation CPDS1, CPDS2, CPDS3, CPDS4 released 76%, 97%, 99%, 99% of
paracetamol and 72%, 99%, 97%, 93% of dicyclomine, respectively at the end of 12-14 h.
The results of in-vitro drug release showed that Pectin: HPMC (80:20) coat could
protect the core for 6 hours which correspond to the time to reach the colon and then under
the influence of the enzyme, the system degraded faster and delivered the drug to the
proximal colon, a main site for bacterial carbohydrate metabolism (Orlu et al., 2006;
Omo˘glu et al., 2003)
Stability study was carried out at 40 0C ± 2 0C and 75 % ± 5% RH for 3 months. The
changes in drug content of different formulations were noted. The obtained data was
subjected to t-test at 95% level of significance. No significant difference in relation to drug
content was observed amongst various formulation at p <0.05.
The results of the In-vitro drug release and stability studies indicated that developed
formulations CPDRS1 and CPDS1 are potential formulation for targeting the dicyclomine
and paracetamol to the colon.