Embed Size (px)
Citation preview
DMD #49023
1
Drug-drug interactions between rosuvastatin and oral antidiabetic drugs occurring at
the level of OATP1B1
E. van de Steeg, R. Greupink, M. Schreurs, I.H.G. Nooijen, K.C.M. Verhoeckx, R.
Hanemaaijer, D. Ripken, M. Monshouwer, M.L.H. Vlaming, J. DeGroot, M. Verwei, F.G.M.
Russel, M.T. Huisman, and H.M. Wortelboer
TNO, Zeist, The Netherlands (E.S., I.H.G.N., K.C.M.V., R.H., D.R., M.L.H.V., J.D., M.V.,
and H.M.W.); Pharmacology and Toxicology, Radboud University Nijmegen Medical
Centre, Nijmegen, The Netherlands (R.G., M.S., and F.G.M.R); Drug Metabolism and
Pharmacokinetics, Janssen Pharmaceutical Companies of Johnson & Johnson, Beerse,
Belgium (M.T.H. and M.M)
DMD Fast Forward. Published on December 17, 2012 as doi:10.1124/dmd.112.049023
Copyright 2012 by the American Society for Pharmacology and Experimental Therapeutics.
This article has not been copyedited and formatted. The final version may differ from this version.DMD Fast Forward. Published on December 17, 2012 as DOI: 10.1124/dmd.112.049023
at ASPE
T Journals on M
ay 31, 2018dm
d.aspetjournals.orgD
ownloaded from
DMD #49023
2
Running title: Drug-drug interaction with oral antidiabetics
Corresponding author: Dr. Evita van de Steeg
TNO
Utrechtseweg 48
P.O. Box 360
3700 AJ Zeist
The Netherlands
E-mail: [email protected]
phone: +31 88 866 2322
Number of pages: 35
Number of tables: 3
Number of figures: 6
Number of supplemental figures: 1
Number of references: 40
Number of words in the Abstract: 217
Number of words in the Introduction: 621
Number of words in the Discussion: 1380
Non-standard abbreviations: BSA, bovine serum albumin; DMEM, Dulbecco's modified
Eagle medium; EDTA, ethylenediaminetetraacetic acid; E217β-G, estradiol 17β-D-
glucuronide; HBSS, Hank’s balanced salt solution; HEK, human embryonic kidney; LC-
MS/MS, liquid chromatography–tandem mass spectrometry; MRM, multiple reaction
monitoring; NTCP, Na+-taurocholate co-transporting polypeptide; OATP, organic anion-
transporting polypeptide; PBS, phosphate buffered saline; SLC, solute carrier; SNP, single-
nucleotide polymorphism; UPLC, ultra performance liquid chromatography
This article has not been copyedited and formatted. The final version may differ from this version.DMD Fast Forward. Published on December 17, 2012 as DOI: 10.1124/dmd.112.049023
at ASPE
T Journals on M
ay 31, 2018dm
d.aspetjournals.orgD
ownloaded from
DMD #49023
3
ABSTRACT
Organic anion-transporting polypeptide 1B1 (OATP1B1) is an important hepatic
uptake transporter, of which the polymorphic variant OATP1B1*15 (Asn130Asp and
Val174Ala) has been associated with decreased transport activity. Rosuvastatin is an
OATP1B1 substrate and often concomitantly prescribed with oral antidiabetics in the clinic.
The aim of this study was to investigate possible drug-drug interactions between these drugs
at the level of OATP1B1 and OATP1B1*15. We generated HEK293 cells stably
overexpressing OATP1B1 or OATP1B1*15, which showed similar protein expression levels
of OATP1B1 and OATP1B1*15 at the cell membrane as measured by LC-MS/MS. In HEK-
OATP1B1*15 cells, the Vmax for OATP1B1-mediated transport of E217β-G was decreased
>60%, whereas Km values were comparable. Uptake of rosuvastatin in HEK-OATP1B1 cells
(Km 13.1 ± 0.43 µM) was nearly absent in HEK-OATP1B1*15 cells. Interestingly, several
oral antidiabetics (glyburide, glimepiride, troglitazone, pioglitazone, glipizide, gliclazide and
tolbutamide), but not metformin, were identified as significant inhibitors of the OATP1B1-
mediated transport of rosuvastatin. The IC50 values for inhibition of E217β-G uptake were
similar between OATP1B1 and OATP1B1*15. In conclusion, these studies indicate that
several oral antidiabetic drugs affect the OATP1B1-mediated uptake of rosuvastatin in vitro.
The next step will be to translate these data to the clinical situation, as it remains to be
established whether the studied oral antidiabetics indeed affect the clinical pharmacokinetic
profile of rosuvastatin in patients.
This article has not been copyedited and formatted. The final version may differ from this version.DMD Fast Forward. Published on December 17, 2012 as DOI: 10.1124/dmd.112.049023
at ASPE
T Journals on M
ay 31, 2018dm
d.aspetjournals.orgD
ownloaded from
DMD #49023
4
INTRODUCTION
The prevalence of diabetes is overwhelming nowadays, with worldwide more than
345 million people suffering from diabetes (Anonymous, 2012). Type 2 diabetes comprises
90% of people with diabetes around the world, and is largely the result of excess body weight
and physical inactivity (Anonymous, 2012). Although life-style interventions, such as dietary
adjustments and increased exercise, are initially very effective (and with low costs), long-
term adherence is in general poor. Therefore, most type 2 diabetic patients will inevitably
need treatment with one or more antidiabetic drugs to manage their hyperglycemia. This
treatment mainly includes drugs from the class of oral antidiabetics such as metformin,
sulfonylureas, and thiazolidinediones (Kalliokoski et al., 2010). The American Diabetes
Association and the European Association for the Study of Diabetes recently published a
consensus statement providing a guidance for treatment of hyperglycemia in type diabetic
patients (Nathan et al., 2009). According to this guideline, treatment of type 2 diabetes with
metformin or sulfonylureas belongs to the class 1 category of well-validated core therapies as
it has been in clinical use for over 50 years now, whereas treatment with thiazolidinediones is
less well validated and has been associated with serious cardiovascular side effects
(Aquilante, 2010; Nathan et al., 2009). Notably, type 2 diabetic patients often concomitantly
receive therapeutic drugs directed against other coincident features, such as dyslipidemia and
hypertension, and it is therefore important to investigate possible drug-drug interactions.
Many oral drugs (including oral antidiabetics and the lipid-lowering statins) are
extracted from the portal blood by the liver before they reach their target, which can either be
intrahepatic (e.g. statins, metformin) or extrahepatic (e.g. pancreatic cells in case of
sulfonylureas, or adipocytes in case of thiazolidinediones). In this study we focus on the
organic anion transporting polypeptide 1B1 (OATP1B1; gene SLCO1B1) as one of the main
hepatic uptake transporters (Hagenbuch and Meier, 2004). OATP1B1 can transport a wide
This article has not been copyedited and formatted. The final version may differ from this version.DMD Fast Forward. Published on December 17, 2012 as DOI: 10.1124/dmd.112.049023
at ASPE
T Journals on M
ay 31, 2018dm
d.aspetjournals.orgD
ownloaded from
DMD #49023
5
variety of drugs, including many statins (e.g. rosuvastatin, pravastatin, pitavastatin) and some
oral antidiabetics (repaglinide, troglitazone) (Fahrmayr et al., 2010; König et al., 2006; Niemi
et al., 2005; Nozawa et al., 2004). The clinical importance of OATP1B1 in the
pharmacokinetics of drugs has been confirmed by several studies that focused on the effect of
commonly occurring single nucleotide polymorphisms in OATP1B1. In particular, the
OATP1B1*15 variant (Asn130Asp and Val174Ala), with an average haplotype frequency of
16-24% in Europe and America (Pasanen et al., 2008), is generally known to have a strongly
reduced transport activity and has been associated with markedly increased plasma levels of
certain OATP1B1 substrates. This might be advantageous for some drugs that do not have a
target in the liver, resulting in an increased pharmacological response. However, for drugs
that have a target inside the liver, decreased hepatic uptake by OATP1B1*15 might result in
decreased pharmacological response and give rise to unforeseen toxic side effects. Indeed, it
has been demonstrated that patients carrying the OATP1B1*15 variant show markedly
increased plasma levels, decreased pharmacological response and even increased extra-
hepatic toxicity for instance after pravastatin, pitavastatin or rosuvastatin treatment (Choi et
al., 2008; Chung et al., 2005; Fahrmayr et al., 2010; Igel et al., 2006; Niemi et al., 2004;
Niemi et al., 2011).
Although glyburide, troglitazone and pioglitazone have previously been reported as
inhibitors of OATP1B1 (Bednarczyk, 2010; Gui et al., 2009; Hirano et al., 2006; Nozawa et
al., 2004), the effects of a complete set of oral antidiabetic drugs on both OATP1B1 and
OATP1B1*15 have not been systematically studied before. In this study we therefore aimed
to reveal the possible drug-drug interactions between several oral antidiabetic drugs
belonging to the class of sulphonylureas and thiazolidinediones and the lipid-lowering drug
rosuvastatin at the level of OATP1B1.We also included studies that explore the influence of
the *15 haplotype on this interaction.
This article has not been copyedited and formatted. The final version may differ from this version.DMD Fast Forward. Published on December 17, 2012 as DOI: 10.1124/dmd.112.049023
at ASPE
T Journals on M
ay 31, 2018dm
d.aspetjournals.orgD
ownloaded from
DMD #49023
6
MATERIALS & METHODS
Chemicals and reagents
[3H]-estradiol 17β-D-glucuronide ([3H]-E217β-G; 1.85 TBq/mmol) was purchased
from PerkinElmer Life and Analytical Sciences (Waltham, MA), and [3H]-rosuvastatin (40.7
GBq/mmol) was custom synthesized by Moravek Biochemicals (California). Glyburide,
glipizide, gliclazide, glimepiride, tolbutamide, pioglitazone, troglitazone, metformin, E217β-
G, cyclosporine A, rifampicin, and pravastatin were obtained from Sigma-Aldrich (St Louis,
MO), rosuvastatin was from Sequoia Research Products (Pangbourne, UK).
Construction of HEK293 cells stably expressing OATP1B1*1a or OATP1B1*15
Subcloning of human OATP1B1*1a (NM_006446.4 referring to wild-type; hereafter
named OATP1B1) or OATP1B1*15 cDNA into the pIRESpuro vector was performed by
GeneArt (Invitrogen, Germany). HEK293 (ATTC, Germany; lot# 57954093) cells were
seeded in 6-wells plates at a density of 9*105 cells/well and grown for 24 hours, followed by
co-transfection with pcDNA3.1-Ukcol (0.3 µg/well) and pIRESpuro-OATP1B1 or -
OATP1B1*15 (2.7 µg/well) using 6 equivalents of Exgen 500 (Fermentas, MBI). Parental
HEK293 cells co-transfected with pcDNA3.1-Ukcol and empty pIRESpuro vector (HEK-
MOCK) served as control. After 24 hours, the transfected cell lines were cultured in medium
containing puromycin (1 µg/mL), and after 3-4 weeks several colonies were selected and
grown into 75 cm2 tissue culture flasks. Excretion of UKcol into the medium of cells of the
different colonies was used to select colonies for further analyses.
This article has not been copyedited and formatted. The final version may differ from this version.DMD Fast Forward. Published on December 17, 2012 as DOI: 10.1124/dmd.112.049023
at ASPE
T Journals on M
ay 31, 2018dm
d.aspetjournals.orgD
ownloaded from
DMD #49023
7
Cell culture
Cells were grown in 75 cm2 tissue culture flasks containing culture medium consisting
of Dulbecco's modified Eagle medium (DMEM) with L-GlutaMax (4.5 g of glucose per
liter), supplemented with heat-inactivated fetal calf serum (10% v/v; Lonza), 100 U/mL
penicillin (Invitrogen) and 100 µg/mL streptomycin (Invitrogen) at approximately 37°C in
approximately 95% air/5% CO2. Near confluent cell cultures were harvested by
trypsinisation, re-suspended in culture medium and the process was repeated once or twice
weekly to provide sufficient cells for use.
Immunocytochemical staining
HEK-MOCK, HEK-OATP1B1, and HEK-OATP1B1*15 cells were seeded on
Thermanox plastic coverslips (NUNC, Rochester) coated with 0.1 mg/mL Poly-D-Lysine
(Sigma-Aldrich) in 24-well plates at a density of 4*105 cells/well and grown for 48 hours at
37˚C with 5% CO2. Cells were fixated with ice-cold methanol for 30 minutes at -20°C,
followed by incubation with the mouse monoclonal primary OATP1B1 antibody (1:100; ESL
clone, ab15441, AbCam) for 1 hour at RT. After removal of the primary antibody, cells were
incubated for 1 hour at RT with the secondary goat anti-mouse antibody (1:100; Alexa 488,
Invitrogen). Cells were washed three times with PBS and de-mineralized water, followed by
step-wise dehydration with 50% and 100% methanol. Subsequently, the cover glasses were
removed from the wells, mounted on slides with 4.8% Mowiol (Polysciences Inc.) mounting
medium and used for analyses by fluorescent microscopy (Leica, Rijswijk, The Netherlands).
Membrane isolations
To determine the active transporter protein expression levels in transfected cells, the
outer cellular membranes were isolated using a sucrose density gradient centrifugation
This article has not been copyedited and formatted. The final version may differ from this version.DMD Fast Forward. Published on December 17, 2012 as DOI: 10.1124/dmd.112.049023
at ASPE
T Journals on M
ay 31, 2018dm
d.aspetjournals.orgD
ownloaded from
DMD #49023
8
protocol. After trypsinisation (~5 x 10⁷ cells), cell pellets were re-suspended in hypotonic
buffer (0.5 mM sodium phosphate, 0.1 mM EDTA, and a cocktail of protease inhibitors
containing 2 mM phenylmethylsulfonylfluoride, aprotinin, leupeptin, and pepstatin). After
one hour of incubation at 4°C, the homogenized cells were centrifuged at 100,000 x g for 30
minutes at 4°C using a LE-80k Centrifuge with SW28 rotor (Beckman Counter, USA). The
pellet was re-suspended in hypotonic buffer followed by the addition of two volumes of
isotonic buffer (10 mM Tris-Hepes and 250 mM sucrose (pH 7.4)). The extract was again
homogenized using a Potter-Elvehjem homogenizer and centrifuged at 12,000 x g for 10
minutes at 4°C. The supernatant was collected and centrifuged at 100,000 x g for 30 minutes
at 4°C. The pellet was re-suspended in isotonic buffer and was layered on top of a 38%
sucrose solution and centrifuged at 100,000 x g for 90 minutes at 4 °C. The turbid layer at the
interface, containing the plasma membranes, was recovered, diluted with isotonic buffer and
centrifuged at 100,000 x g for 40 minutes at 4°C. The plasma membrane fraction was
obtained from the resulting pellet, which was re-suspended in 50 µL isotonic buffer. Protein
levels were measured using the Bradford method (Biorad, USA).
Protein digestion
Isolated plasma membrane extracts (~50 µg) from individual cell lines were diluted
with 2 volumes of 90% methanol. The proteins were subsequently reduced with 0.01 M
dithiothreitol at 37°C for 60 minutes and alkylated with 0.04 M iodoacetamide for 20
minutes at room temperature in the dark. Digestion was performed after addition of CaCl2
(final concentration 1 nM) and 0.5 µg trypsin (Promega) in 17% methanol by diluting the
solution with 50 mM NH4HCO3. After overnight incubation the samples were incubated for
another 2 hours with 0.5 µg trypsin. The efficiency of the tryptic digestion was checked
using SDS-PAGE followed by silver stain. Finally the protein digests were evaporated by
This article has not been copyedited and formatted. The final version may differ from this version.DMD Fast Forward. Published on December 17, 2012 as DOI: 10.1124/dmd.112.049023
at ASPE
T Journals on M
ay 31, 2018dm
d.aspetjournals.orgD
ownloaded from
DMD #49023
9
vacuum centrifugation (Scanvac, DK) and dissolved in 100 µL 15% acetonitrile containing
0.1% formic acid (Merck, DE) and 5 ng/mL internal standard (AQUA peptide mix, see
below).
LC-MS/MS analysis
The peptide analysis was performed on a UPLC coupled to a Xevo TQ-S mass
spectrometer (Waters). The extract (7.5 µL) was injected on a Acquity C18 BEH UPLC
column (2.1 x 100 mm, 1.7 µm) and was separated using gradient elution with a stable flow
of 600 µL/minute. The gradient started with 95% A (milliQ water with 0.1% formic acid)
and 5% B (acetonitrile with 0.1% formic acid) followed by a linear increase to 45% B which
was achieved at 5.0 minutes. Subsequently, the gradient was linearly increased within 0.1
minutes to 100% B and maintained for 2 minutes. The system subsequently switched to 5%
B, which was achieved at 7.1 minutes, after which the column equilibrated at 95% A for
approximately 3 minutes. The column was maintained at 50°C during analysis, and the
samples were kept at 10°C. Blank injections were run after each sample and the needle and
tubing’s were washed with strong wash 0.1% formic acid in methanol:H2O (8:2) and weak
wash 0.25% trifluoroacetic acid in acetonitrile:H2O (4:6). The MS was operating in selective
reaction mode using electrospray ionization in positive ion mode, with a capillary voltage of
3.3 kV, a source temperature of 150°C and a desolvation temperature of 600°C. Cone voltage
and collision energy were optimized for each compound individually. The multiple reaction
monitoring (MRM) transitions were determined from MS/MS spectra obtained by direct
infusion of 0.5 µg/mL peptide solution. Per peptide 4 transitions were chosen (Q3-1, Q3-2,
Q3-3, and Q3-4) for quantitation and confirmation. The transitions for OATP1B1 are listed
in Table 1. A peptide labeled with 15N and 13C (AQUA peptide) was synthesized (Sigma
This article has not been copyedited and formatted. The final version may differ from this version.DMD Fast Forward. Published on December 17, 2012 as DOI: 10.1124/dmd.112.049023
at ASPE
T Journals on M
ay 31, 2018dm
d.aspetjournals.orgD
ownloaded from
DMD #49023
10
Aldrich Chemie, Steinheim DE) and used as an internal standard for quantification. Peak
identification and quantification was performed using Masslynx software version 4.1.
Transport and inhibition assays
Transport and inhibition assays were performed at different labs, with minor
differences. At TNO, cells were seeded at a density of 4*105 cells/well on Poly-D-Lysine
coated 24-wells plates (BD biosciences) and grown to confluence for 48 hours. All
incubations were performed at 37°C. For initial characterization of the cell lines and for
inhibition of [3H]-rosuvastatin uptake by selected oral antidiabetic drugs, we used the
following method. Prior to the start of the experiment cells were pre-incubated for 15-30
minutes with pre-warmed incubation medium (145 mM NaCl, 3 mM KCl, 1 mM CaCl2,
0.5 mM MgCl2, 5 mM D-glucose, 5 mM HEPES (pH 7.4)), containing appropriate
concentrations of the inhibitor where applicable. The uptake was initiated after removal of the
pre-incubation medium and addition of incubation medium containing substrate (and
inhibitor, if applicable) concentrations as described, spiked with [3H]-labeled substrate (~10
kBq/µL). The uptake was terminated by washing the cells twice with 1 mL ice-cold
incubation medium, followed by the addition of 0.5 ml 0.5 M NaOH, of which 0.4 mL of the
cell lysate was transferred to a 20 mL plastic scintillation vial for radioactivity measurement
by liquid scintillation counting (Perkin Elmer).
For the inhibition of [3H]-E217β-G uptake by selected oral antidiabetic drugs, cells
were seeded at a density of 4*105 cells/well on Poly-D-Lysine coated 24-wells plates (BD
biosciences) and grown to confluence for 48 hours. Prior to the start of the experiment cells
were washed twice with pre-warmed HBSS/HEPES (pH 7.4) buffer, followed by the addition
of HBSS/HEPES containing substrate (and inhibitor) concentrations as described, spiked
with [3H]-labeled substrate (~10 kBq/µL, final concentration 1 µM). The uptake was
This article has not been copyedited and formatted. The final version may differ from this version.DMD Fast Forward. Published on December 17, 2012 as DOI: 10.1124/dmd.112.049023
at ASPE
T Journals on M
ay 31, 2018dm
d.aspetjournals.orgD
ownloaded from
DMD #49023
11
terminated by washing the cells with 0.4 ml ice-cold HBSS/HEPES + 0.5% BSA and twice
with 0.4 ml ice-cold HBSS/HEPES, followed by the addition of 0.2 mL 0.5% Triton X-100,
of which 0.15 mL of the cell lysate was transferred to a 5 mL plastic scintillation vial for
radioactivity measurement by liquid scintillation counting (Perkin Elmer).
Experiments performed in the laboratory of Janssen Pharmaceutical Companies of
Johnson & Johnson (J&J) were carried out according to the above mentioned protocol, with
three minor differences: cells were seeded at a density of 4*105 cells/well on collagen coated
24-wells plates (BD biosciences) and grown to confluence for 24 hours, the uptake was
terminated by washing the cells with 1.5 ml ice-cold HBSS/HEPES, followed by the addition
of 0.2 mL mPER-lysis (Thermo Scientific).
Data analysis
Uptake into mock-transfected cells served as a control in all experiments to correct for
uptake that was not related to OATP1B1-mediated transport. Concentration-dependent uptake
of compounds is expressed as pmol/mg protein/minute. Inhibition of OATP1B1-mediated
uptake is expressed as the % of uptake into HEK-OATP1B1 cells incubated with vehicle and
plotted against the nominal inhibitor concentration. To determine Km and Vmax values for
radiolabeled substrates, the Michaelis-Menten model was fitted to the corrected data. To
estimate IC50 values, a one-site binding model was fitted to the data, assuming a Hill slope of
-1. To investigate whether inhibitory potency was related to compound lipophilicity, logP
values of sulfonylurea-type oral antidiabetics were calculated according to the algorithms
described by Cheng et al. (Cheng et al., 2011) and were obtained from the Pubchem database
(National Centre for Biotechnology Information, Bethesda, MD, USA). The calculated logP
values were as follows [drug (xlogP)]: glyburide (4.8), glipizide (1.9), gliclazide (1.5),
glimepiride (3.9) and tolbutamide (2.3).
This article has not been copyedited and formatted. The final version may differ from this version.DMD Fast Forward. Published on December 17, 2012 as DOI: 10.1124/dmd.112.049023
at ASPE
T Journals on M
ay 31, 2018dm
d.aspetjournals.orgD
ownloaded from
DMD #49023
12
The two-sided unpaired Student’s t-test was used to assess the statistical significance
of differences between two sets of data. Results are presented as the means ± S.D.
Differences were considered to be statistically significant when P < 0.05.
This article has not been copyedited and formatted. The final version may differ from this version.DMD Fast Forward. Published on December 17, 2012 as DOI: 10.1124/dmd.112.049023
at ASPE
T Journals on M
ay 31, 2018dm
d.aspetjournals.orgD
ownloaded from
DMD #49023
13
RESULTS
Cellular localization and absolute protein expression of recombinant OATP1B1 in HEK-
OATP1B1 and HEK-OATP1B1*15 cells
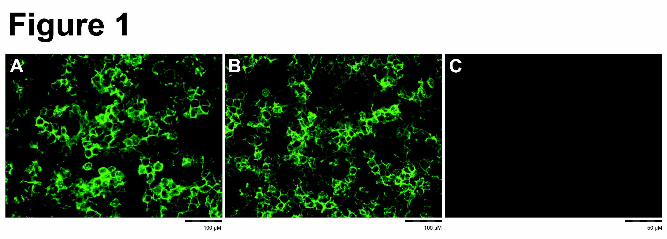
Subcellular localization of the human OATP1B1 protein in transfected HEK-
OATP1B1 and HEK-OATP1B1*15 cells was investigated by immunocytochemical staining
and fluorescence microscopy. Results clearly indicate that in the HEK-OATP1B1 and HEK-
OATP1B1*15 cells the transfected protein is mainly expressed at the cell membrane (Figure
1A and 1B). No staining was observed in the vector-transfected control cells (HEK-mock;
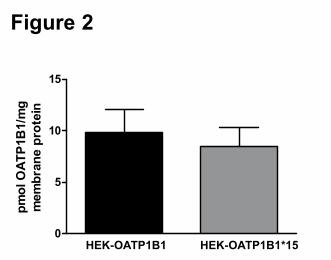
Figure 1C). The absolute protein expression of OATP1B1 at the cell membrane of HEK-
OATP1B1 and HEK-OATP1B1*15 cells was determined using a LC-MS/MS method, based
on the method previously described by Kamiie et al. (Kamiie et al., 2008). Importantly, the
protein expression of OATP1B1 and OATP1B1*15 at the outer cell membrane of both cell
lines was comparable (9.8 ± 2.3 and 8.5 ± 1.9 pmol OATP1B1/mg membrane protein,
respectively; Figure 2), justifying direct comparison of these two cell lines without further
corrections.
Functional characterization of the HEK-OATP1B1 and HEK-OATP1B1*15 cells
The uptake of the control substrate [3H]-E217β-G by HEK293 cells stably expressing
OATP1B1 or OATP1B1*15 was determined in a time- and concentration-dependent manner.
Uptake of [3H]-E217β-G was significantly higher in the transfected cell lines compared to the
control cells, and was linear up to 2 minutes (data not shown). Analyses of the kinetic
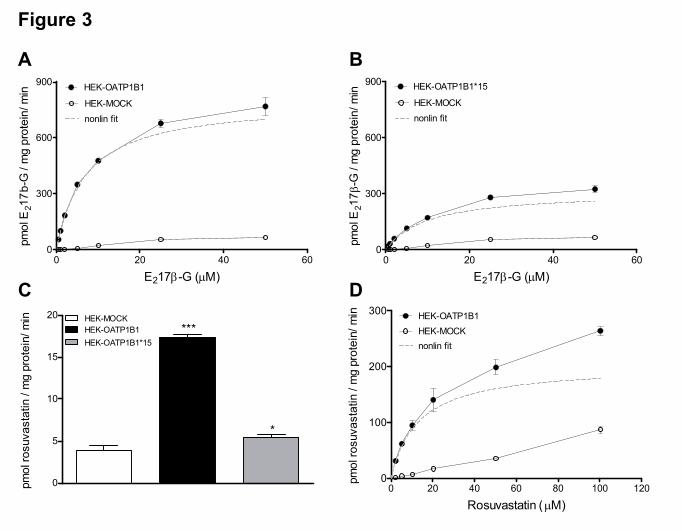
parameters are shown in Figure 3A and 3B and revealed similar Km values for the transport
of [3H]-E217β-G by OATP1B1 and OATP1B1*15 (7.0 ± 0.3 and 10.0 ± 0.6 µM,
respectively), whereas the Vmax value for OATP1B1*15 was decreased by more than 60%
This article has not been copyedited and formatted. The final version may differ from this version.DMD Fast Forward. Published on December 17, 2012 as DOI: 10.1124/dmd.112.049023
at ASPE
T Journals on M
ay 31, 2018dm
d.aspetjournals.orgD
ownloaded from
DMD #49023
14
(798 ± 11 and 311 ± 7.2 pmol/mg protein/minute for OATP1B1 and OATP1B1*15,
respectively). These results are consistent with a previous report of Iwai et al. (Iwai et al.,
2004).
Uptake of [3H]-rosuvastatin was significantly higher in HEK-OATP1B1 cells
compared to HEK-MOCK, but was only minimal in HEK-OATP1B1*15 cells (Figure 3C), as
published before (Choi et al., 2011; Ho et al., 2006). Due to the small difference in
rosuvastatin uptake between HEK-MOCK and HEK-OATP1B1*15 cells, the Km and Vmax of
OATP1B1*15-mediated rosuvastatin transport could not be determined. The Km for uptake of
[3H]-rosuvastatin by OATP1B1 was 13.1 ± 0.43 µM with a Vmax of 202 ± 2.1 pmol/mg
protein/min (Figure 3D).
Our results were independently verified by experiments performed at J&J laboratories
using the same cell lines. Despite minor protocol differences (see Materials and Methods),
the Km and Vmax values for the OATP1B1- and OATP1B1*15 mediated transport of [3H]-
E217β-G and [3H]-rosuvastatin were highly comparable between the two independent
laboratories (results are summarized in Table 2), demonstrating the stability and robustness of
the transfected cell lines.
Interestingly, inhibition of E217β-G transport by known OATP1B1 inhibitors was
comparable between HEK-OATP1B1 and HEK-OATP1B1*15 cells, with IC50 values for
cyclosporine A (1.64 and 1.25 µM) and rifampicin (3.49 and 2.19) for OATP1B1 and
OATP1B1*15, respectively (Supplemental Figure 1). The uptake of the lipid-lowering drug
[3H]-rosuvastatin was also inhibited by cyclosporine A, with an IC50 value of 0.89 µM
(Supplemental Figure 1).
This article has not been copyedited and formatted. The final version may differ from this version.DMD Fast Forward. Published on December 17, 2012 as DOI: 10.1124/dmd.112.049023
at ASPE
T Journals on M
ay 31, 2018dm
d.aspetjournals.orgD
ownloaded from
DMD #49023
15
Inhibition of OATP1B1 and OATP1B1*15 by several oral anti-diabetics
In a preliminary in vitro inhibition screen we investigated the inhibitory effects of a
library of 640 FDA-approved drugs on the transport of [3H]-E217β-G by OATP1B1 (data not
shown), and identified a set of oral anti-diabetic drugs as (novel) inhibitors of this uptake
transporter. We therefore selected these drugs and determined their inhibitory effect on the
uptake of [3H]-E217β-G and [3H]-rosuvastatin by OATP1B1 and OATP1B1*15 (Figure 4 and
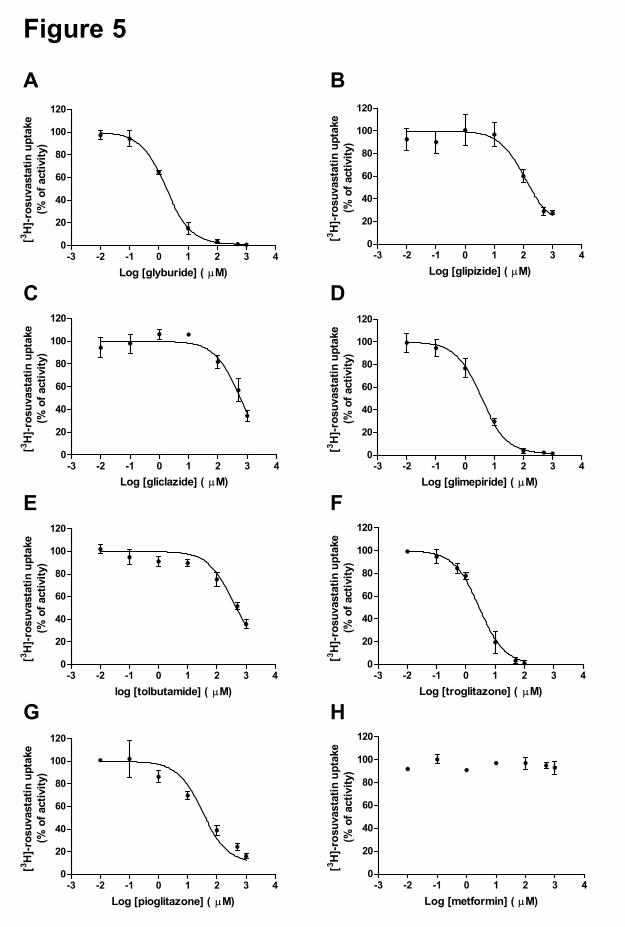
5). The oral anti-diabetic drugs can be grouped into three classes and the obtained IC50 values
are summarized in Table 3. OATP1B1-mediated transport of [3H]-E217β-G was significantly
inhibited by glyburide (IC50 2.99 µM), glimepiride (IC50 3.55 µM), troglitazone (IC50 2.50
µM), pioglitazone (IC50 5.09 µM) and glipizide (estimated IC50 ~45.3 µM, with high 95%
confidence interval). These compounds were also identified as significant inhibitors of
OATP1B1-mediated transport of [3H]-rosuvastatin: glyburide (IC50 1.77 µM), glimepiride
(IC50 3.62 µM), troglitazone (IC50 2.84 µM), pioglitazone (IC50 32.2 µM) and glipizide (IC50
110 µM). Gliclazide, tolbutamide and metformin did not significantly affect the uptake of
[3H]-E217β-G by OATP1B1 or OATP1B1*15 up to the highest concentration tested (100
µM). The inhibitory effect of these three compounds on wild-type OATP1B1-mediated
rosuvastatin uptake was tested up to higher concentrations (1000 µM). Also in these studies,
metformin did not display any effect, whereas gliclazide and tolbutamide were only weak
inhibitors (IC50 of 580 and 368 µM, respectively). Interestingly, the IC50 values for inhibition
of [3H]-E217β-G uptake by the several oral anti-diabetics were similar for OATP1B1 and its
polymorphic variant OATP1B1*15 (Figure 4, Table 2). Notably, at low concentrations
gliclazide (< 1 µM) appeared to stimulate OATP1B1*15-mediated transport of [3H]-E217β-
G. Drug-induced stimulation of OATP1B1 (and several other transporters) in vitro has been
reported several times (Kindla et al., 2011; Roth et al., 2011), however the underlying
molecular mechanism and clinical relevance has remained unclear.
This article has not been copyedited and formatted. The final version may differ from this version.DMD Fast Forward. Published on December 17, 2012 as DOI: 10.1124/dmd.112.049023
at ASPE
T Journals on M
ay 31, 2018dm
d.aspetjournals.orgD
ownloaded from
DMD #49023
16
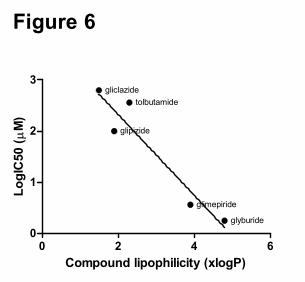
Within the class of sulfonylureas it appeared that increased lipophilicity of these anti
diabetic drugs was associated with a more potent inhibition of OATP1B1-mediated transport
of rosuvastatin (Figure 6).
This article has not been copyedited and formatted. The final version may differ from this version.DMD Fast Forward. Published on December 17, 2012 as DOI: 10.1124/dmd.112.049023
at ASPE
T Journals on M
ay 31, 2018dm
d.aspetjournals.orgD
ownloaded from
DMD #49023
17
DISCUSSION
Rosuvastatin belongs to the class of statins, which are widely prescribed drugs that act
by inhibiting HMG-CoA reductase resulting in reduced plasma concentrations of low-density
lipoprotein cholesterol (McKenney et al., 2003). After oral dosage, the rather hydrophilic
rosuvastatin is efficiently and rapidly taken up from the portal vein into hepatocytes, which is
predominantly mediated by the uptake transporter OATP1B1 (Choi et al., 2011; Ho et al.,
2006; Kitamura et al., 2008). Since statins lower cholesterol levels by inhibiting HMG-CoA
reductase within hepatocytes, and the transport processes in hepatocytes are key drivers of the
clearance of statins as well, it is clear that the process of hepatic uptake is crucial for both
drug efficacy and toxicity. It has been estimated that hepatic elimination of rosuvastatin in
humans accounts for approximately 70% of its total clearance (Martin et al., 2003). The
clinical importance of OATP1B1 in the pharmacokinetics of rosuvastatin has been
demonstrated by several studies showing that subjects carrying the polymorphic variant
OATP1B1*15 (Asn130Asp and Val174Ala), which has generally been associated with
decreased transport activity, have more than 2-fold higher plasma levels of rosuvastatin (Choi
et al., 2008; Lee et al., 2005; Pasanen et al., 2007). Due to its wide prescription, but also due
the combined prevalence of hypercholesterolemia and type-2 diabetes (e.g. in
overweight/obese patients), rosuvastatin is often concomitantly prescribed with oral
antidiabetic drugs. In this study we therefore investigated the possible drug-drug interaction
between rosuvastatin and several oral antidiabetics in vitro by generating and characterizing
HEK293 cells stably overexpressing OATP1B1 or its polymorphic variant OATP1B1*15.
Immunohistochemical characterization of the HEK-OATP1B1 and HEK-
OATP1B1*15 cells demonstrated similar cellular surface expression patterns of the
transfected proteins in both cell lines, as was previously reported (Iwai et al., 2004). The
absolute protein expression levels of OATP1B1 in the outer cell membrane were determined
This article has not been copyedited and formatted. The final version may differ from this version.DMD Fast Forward. Published on December 17, 2012 as DOI: 10.1124/dmd.112.049023
at ASPE
T Journals on M
ay 31, 2018dm
d.aspetjournals.orgD
ownloaded from
DMD #49023
18
by LCMS/MS. The importance of determining the absolute expression levels of transfected
transport proteins in different cell lines has been demonstrated before by Iwai et al. (Iwai et
al., 2004), who found that in their generated HEK293 transfected cell lines the protein
expression of OATP1B1*15 at the cell membrane was 11-times higher than the expression of
wild-type OATP1B1 as measured by Western blotting. Without correction for this increased
expression of OATP1B1*15, the Vmax of E217β-G uptake by OATP1B1*15 was comparable
to that of OATP1B1, whereas after correction for the increased expression the Vmax of
OATP1B1*15 was only 10% of that of wild-type OATP1B1. Importantly, in the current
study similar absolute protein expression levels of OATP1B1 and OATP1B1*15 at the cell
surface membrane in both cell lines were measured, justifying direct comparison of these two
cell lines. This direct comparison prevents overcorrection for increased expression levels, and
we observed that the Vmax of E217β-G uptake by OATP1B1*15 was <40% of its wild-type
variant, while the Km values were comparable. Together, our results demonstrate that the
reduced transport of E217β-G by OATP1B1*15 is most likely caused by a reduction in
translocation ability, instead of a reduced intrinsic affinity or reduced protein expression in
the cell membrane.
To assess whether the established IC50 values in the current study are of clinical
relevance, we compared the obtained IC50 values with reported Cmax values of the studied oral
antidiabetics after the maximum dose in patients. Since the concentration of orally taken
drugs is the highest in the portal vein (resulting from intestinal absorption), we estimated the
drug concentration in portal venous blood by the method described by Ito et al. (Ito et al.,
1998). The Cmax in patients taking glyburide (1.25 mg), glipizide (5 mg), glimepiride (5 mg)
or troglitazone (600 mg) has been reported at 0.77, 1.04, 0.73 and 6.4 μM (Brunton et al.,
2011; Spencer and Markham, 1997; Zheng et al., 2009), respectively, with predicted portal
vein concentrations of 0.95, 1.88, 1.15 and 100 μM. These concentrations are within the same
This article has not been copyedited and formatted. The final version may differ from this version.DMD Fast Forward. Published on December 17, 2012 as DOI: 10.1124/dmd.112.049023
at ASPE
T Journals on M
ay 31, 2018dm
d.aspetjournals.orgD
ownloaded from
DMD #49023
19
(low) micromolar range as some of the IC50 values for OATP1B1-mediated uptake of
rosuvastatin as measured in this study (glyburide: 1.77 μM; glimepiride: 3.62 μM) and even
35-times higher than the IC50 values for troglitazone (2.84 μM). This might suggest that these
oral antidiabetic drugs can cause clinically relevant drug-drug interactions when
concomitantly taken with rosuvastatin, or other OATP1B1 drug substrates. However, due the
high plasma protein binding of these oral antidiabetics (>98%) (Brunton et al., 2011; Spencer
and Markham, 1997; Zheng et al., 2009), the unbound concentration is expected to be only a
fraction of the total plasma concentration and are mainly below the IC50 values observed in
this study. Similar conclusions were drawn by Hirano et al (Hirano et al., 2006), who stated
that although OATP1B1-mediated pitavastatin uptake was inhibited by glyburide in vitro, it
was unlikely that - due to high plasma protein binding of glyburide - a drug-drug interaction
occurs in the clinical stage. Importantly however, the plasma protein binding of the well-
known OATP1B1 inhibitor cyclosporine A is high as well, with a predicted unbound portal
vein concentration of cyclosporine A of ~0.5 µM (Cmax 1900 ng/ml at 400 mg dose with
98.6% plasma protein binding (Akhlaghi et al., 1997; Falck et al., 2008). Whereas this value
is also below the determined IC50 value for inhibition of rosuvastain uptake into HEK-
OATP1B1 cells (1.64 µM), co-administration of rosuvastatin with cyclosporine A in the
clinic resulted in 5- to 10-fold higher systemic exposure to rosuvastatin, which could mainly
be explained by inhibition of OATP1B1-mediated hepatic uptake of rosuvastatin (Asberg,
2003; Neuvonen et al., 2006; Simonson et al., 2004). This indicates that a straightforward
comparison of the unbound maximum plasma concentration of a drug with in vitro measured
IC50 parameters alone might not always be predictive for potential drug-drug interactions in
vivo. The clinical relevance of the drug-drug interactions between rosuvastatin and oral
antidiabetic drugs therefore needs to be established, as there are no clinical trials present in
the literature today. Results of the present study can well be used to setup an intelligent drug
This article has not been copyedited and formatted. The final version may differ from this version.DMD Fast Forward. Published on December 17, 2012 as DOI: 10.1124/dmd.112.049023
at ASPE
T Journals on M
ay 31, 2018dm
d.aspetjournals.orgD
ownloaded from
DMD #49023
20
development strategy to predict the clinical relevance of drug-drug interactions, as the
combination with physiologically based pharmacokinetic (PBPK) models enables a
prediction of pharmacokinetic profiles of the (unbound) drug over time and whether drug-
drug interactions are to be expected in patients. In addition to in vitro studies and PBPK
modeling, preclinical animal studies (such as humanized mice) could also contribute to an
efficient preclinical phase in drug development leading to an optimized clinical trial.
The frequency of the low-activity OATP1B1*15 differs between various geographical
populations, ranging from only 2% and 9% in Sub-Saharan African and South/Central Asian
population, respectively, to 15-24% in populations from North Africa, Europe, Middle East
and America (Pasanen et al., 2008). This rather high frequency of the OATP1B1*15
haplotype in selected populations demonstrates the importance of studying its effect on the
disposition of drugs. Importantly, the effect of the *15 variation on drug-drug interaction at
the level of OATP1B1 has never been systematically studied in vitro before. We found
similar IC50 values for inhibition of E217β-G uptake into HEK-OATP1B1 and HEK-
OATP1B1*15 cells for the different studied oral antidiabetics and the known inhibitors
cyclosporine A, rifampicin and pravastatin. This indicates that the intrinsic affinity of
OATP1B1 for these inhibitors is not affected by the amino acid changes in the *15 variant.
Further studies are needed to explore whether this is a general finding, or whether it is
dependent on the substrate/inhibitor combination.
It has previously been reported that the lipophilicity of compounds can determine
their inhibition capacity, as was reported for the metabolic enzyme CYP3A4 (Lewis et al.,
2006; Regev-Shoshani et al., 2004). We therefore explored whether this is also the case for
inhibition of the transport protein OATP1B1, and indeed found that within the class of
sulfonylureas an increased lipophilicity of the antidiabetic drugs was associated with an
increased potency to inhibit OATP1B1-mediated transport of rosuvastatin.
This article has not been copyedited and formatted. The final version may differ from this version.DMD Fast Forward. Published on December 17, 2012 as DOI: 10.1124/dmd.112.049023
at ASPE
T Journals on M
ay 31, 2018dm
d.aspetjournals.orgD
ownloaded from
DMD #49023
21
In summary, we generated and fully characterized HEK-OATP1B1 and HEK-
OATP1B1*15 cells and provide evidence for potentially important drug-drug interactions
between rosuvastatin and selected sulfonylureas and thiazolidinediones. It remains to be
established, however, whether the studied oral antidiabetics affect the clinical
pharmacokinetic profile of rosuvastatin in patients. The in vitro studies as described can be
considered as an important step in an intelligent pre-clinical test strategy to detect potential
drug-drug interactions which need to be confirmed in subsequent (preclinical and/or clinical)
studies to provide a decisive answer.
This article has not been copyedited and formatted. The final version may differ from this version.DMD Fast Forward. Published on December 17, 2012 as DOI: 10.1124/dmd.112.049023
at ASPE
T Journals on M
ay 31, 2018dm
d.aspetjournals.orgD
ownloaded from
DMD #49023
22
ACKNOWLEDGEMENTS
The authors thank J.M. Snabel ( TNO, Leiden, The Netherlands) for transfecting the
HEK293 with pIRESpuro-OATP1B1 or pIRESpuro-OATP1B1*15 in order to generate stably
transfected cell lines, and N. Browne and A. Stikkelman for their technical support in the
transport and inhibition studies.
This article has not been copyedited and formatted. The final version may differ from this version.DMD Fast Forward. Published on December 17, 2012 as DOI: 10.1124/dmd.112.049023
at ASPE
T Journals on M
ay 31, 2018dm
d.aspetjournals.orgD
ownloaded from
DMD #49023
23
AUTHORSHIP CONTRIBUTIONS
Participated in research design: Steeg, Greupink, Verhoeckx,
Monshouwer, Vlaming, DeGroot, Verwei,
Russel, Huisman, and Wortelboer
Conducted experiments: Steeg, Schreurs, Nooijen, Verhoeckx,
Hanemaaijer, and Ripken
Performed data analysis: Steeg, Greupink, Schreurs, Nooijen, and
Verhoeckx
Wrote the manuscript: Steeg and Greupink
Contributed to the writing of the manuscript: Verwei, Russel, Huisman and Wortelboer
This article has not been copyedited and formatted. The final version may differ from this version.DMD Fast Forward. Published on December 17, 2012 as DOI: 10.1124/dmd.112.049023
at ASPE
T Journals on M
ay 31, 2018dm
d.aspetjournals.orgD
ownloaded from
DMD #49023
24
REFERENCES
Anonymous. (2012) Diabetes. WHO fact sheet 312. World Health Organization, Geneva,
Switzerland. http://www.who.int/mediacentre/factsheets/fs312/en/
Akhlaghi F, McLachlan AJ, Keogh AM, Brown KF. (1997) Effect of simvastatin on
cyclosporine unbound fraction and apparent blood clearance in heart transplant recipients. Br
J Clin Pharmacol 44:537-542.
Aquilante CL. (2010) Sulfonylurea pharmacogenomics in type 2 diabetes: The influence of
drug target and diabetes risk polymorphisms. Expert Rev Cardiovasc Ther 8:359-372.
Asberg A. (2003) Interactions between cyclosporin and lipid-lowering drugs: Implications for
organ transplant recipients. Drugs 63:367-378.
Bachmakov I, Glaeser H, Fromm MF, Konig J. (2008) Interaction of oral antidiabetic drugs
with hepatic uptake transporters: Focus on organic anion transporting polypeptides and
organic cation transporter 1. Diabetes 57:1463-1469.
Bednarczyk D. (2010) Fluorescence-based assays for the assessment of drug interaction with
the human transporters OATP1B1 and OATP1B3. Anal Biochem 405:50-58.
Brunton LL, Chabner BA, Knollmann BC. (2011) Goodman & Gilman’s the pharmacological
basis of therapeutics.
Cheng F, Yu Y, Zhou Y, Shen Z, Xiao W, Liu G, Li W, Lee PW, Tang Y. (2011) Insights
into molecular basis of cytochrome p450 inhibitory promiscuity of compounds. J Chem Inf
Model 51:2482-2495.
This article has not been copyedited and formatted. The final version may differ from this version.DMD Fast Forward. Published on December 17, 2012 as DOI: 10.1124/dmd.112.049023
at ASPE
T Journals on M
ay 31, 2018dm
d.aspetjournals.orgD
ownloaded from
DMD #49023
25
Choi JH, Lee MG, Cho JY, Lee JE, Kim KH, Park K. (2008) Influence of OATP1B1
genotype on the pharmacokinetics of rosuvastatin in koreans. Clin Pharmacol Ther 83:251-
257.
Choi MK, Shin HJ, Choi YL, Deng JW, Shin JG, Song IS. (2011) Differential effect of
genetic variants of na(+)-taurocholate co-transporting polypeptide (NTCP) and organic
anion-transporting polypeptide 1B1 (OATP1B1) on the uptake of HMG-CoA reductase
inhibitors. Xenobiotica 41:24-34.
Chung JY, Cho JY, Yu KS, Kim JR, Oh DS, Jung HR, Lim KS, Moon KH, Shin SG, Jang IJ.
(2005) Effect of OATP1B1 (SLCO1B1) variant alleles on the pharmacokinetics of
pitavastatin in healthy volunteers. Clin Pharmacol Ther 78:342-350.
Fahrmayr C, Fromm MF, König J. (2010) Hepatic OATP and OCT uptake transporters: Their
role for drug-drug interactions and pharmacogenetic aspects. Drug Metab Rev 42:380-401.
Falck P, Vethe NT, Asberg A, Midtvedt K, Bergan S, Reubsaet JL, Holdaas H. (2008)
Cinacalcet's effect on the pharmacokinetics of tacrolimus, cyclosporine and mycophenolate in
renal transplant recipients. Nephrol Dial Transplant 23:1048-1053.
Gui C, Wahlgren B, Lushington GH, Hagenbuch B. (2009) Identification, ki determination
and CoMFA analysis of nuclear receptor ligands as competitive inhibitors of OATP1B1-
mediated estradiol-17beta-glucuronide transport. Pharmacol Res 60:50-56.
Hagenbuch B and Meier PJ. (2004) Organic anion transporting polypeptides of the OATP/
SLC21 family: Phylogenetic classification as OATP/ SLCO superfamily, new nomenclature
and molecular/functional properties. Pfl�gers Arch 447:653-665.
This article has not been copyedited and formatted. The final version may differ from this version.DMD Fast Forward. Published on December 17, 2012 as DOI: 10.1124/dmd.112.049023
at ASPE
T Journals on M
ay 31, 2018dm
d.aspetjournals.orgD
ownloaded from
DMD #49023
26
Hirano M, Maeda K, Shitara Y, Sugiyama Y. (2006) Drug-drug interaction between
pitavastatin and various drugs via OATP1B1. Drug Metab Dispos 34:1229-1236.
Ho RH, Tirona RG, Leake BF, Glaeser H, Lee W, Lemke CJ, Wang Y, Kim RB. (2006) Drug
and bile acid transporters in rosuvastatin hepatic uptake: Function, expression, and
pharmacogenetics. Gastroenterology 130:1793-1806.
Igel M, Arnold KA, Niemi M, Hofmann U, Schwab M, Lutjohann D, von BK, Eichelbaum
M, Kivisto KT. (2006) Impact of the SLCO1B1 polymorphism on the pharmacokinetics and
lipid-lowering efficacy of multiple-dose pravastatin. Clin Pharmacol Ther 79:419-426.
Ito K, Iwatsubo T, Kanamitsu S, Ueda K, Suzuki H, Sugiyama Y. (1998) Prediction of
pharmacokinetic alterations caused by drug-drug interactions: Metabolic interaction in the
liver. Pharmacol Rev 50:387-412.
Iwai M, Suzuki H, Ieiri I, Otsubo K, Sugiyama Y. (2004) Functional analysis of single
nucleotide polymorphisms of hepatic organic anion transporter OATP1B1 (OATP-C).
Pharmacogenetics 14:749-757.
Kalliokoski A, Neuvonen PJ, Niemi M. (2010) SLCO1B1 polymorphism and oral
antidiabetic drugs. Basic Clin Pharmacol Toxicol 107:775-781.
Kamiie J, Ohtsuki S, Iwase R, Ohmine K, Katsukura Y, Yanai K, Sekine Y, Uchida Y, Ito S,
Terasaki T. (2008) Quantitative atlas of membrane transporter proteins: Development and
application of a highly sensitive simultaneous LC/MS/MS method combined with novel in-
silico peptide selection criteria. Pharm Res 25:1469-1483.
This article has not been copyedited and formatted. The final version may differ from this version.DMD Fast Forward. Published on December 17, 2012 as DOI: 10.1124/dmd.112.049023
at ASPE
T Journals on M
ay 31, 2018dm
d.aspetjournals.orgD
ownloaded from
DMD #49023
27
Kindla J, Muller F, Mieth M, Fromm MF, Konig J. (2011) Influence of non-steroidal anti-
inflammatory drugs on organic anion transporting polypeptide (OATP) 1B1- and OATP1B3-
mediated drug transport. Drug Metab Dispos 39:1047-1053.
Kitamura S, Maeda K, Wang Y, Sugiyama Y. (2008) Involvement of multiple transporters in
the hepatobiliary transport of rosuvastatin. Drug Metab Dispos 36:2014-2023.
König J, Seithel A, Gradhand U, Fromm MF. (2006) Pharmacogenomics of human OATP
transporters. Naunyn Schmiedebergs Arch Pharmacol 372:432-443.
Lee E, Ryan S, Birmingham B, Zalikowski J, March R, Ambrose H, Moore R, Lee C, Chen
Y, Schneck D. (2005) Rosuvastatin pharmacokinetics and pharmacogenetics in white and
asian subjects residing in the same environment. Clin Pharmacol Ther 78:330-341.
Lewis DF, Lake BG, Dickins M. (2006) Quantitative structure-activity relationships (QSars)
in CYP3A4 inhibitors: The importance of lipophilic character and hydrogen bonding. J
Enzyme Inhib Med Chem 21:127-132.
Martin PD, Warwick MJ, Dane AL, Brindley C, Short T. (2003) Absolute oral bioavailability
of rosuvastatin in healthy white adult male volunteers. Clin Ther 25:2553-2563.
McKenney JM, Jones PH, Adamczyk MA, Cain VA, Bryzinski BS, Blasetto JW. (2003)
Comparison of the efficacy of rosuvastatin versus atorvastatin, simvastatin, and pravastatin in
achieving lipid goals: Results from the STELLAR trial. Curr Med Res Opin 19:689-698.
Nathan DM, Buse JB, Davidson MB, Ferrannini E, Holman RR, Sherwin R, Zinman B.
(2009) Medical management of hyperglycemia in type 2 diabetes: A consensus algorithm for
the initiation and adjustment of therapy: A consensus statement of the american diabetes
association and the european association for the study of diabetes. Diabetes Care 32:193-203.
This article has not been copyedited and formatted. The final version may differ from this version.DMD Fast Forward. Published on December 17, 2012 as DOI: 10.1124/dmd.112.049023
at ASPE
T Journals on M
ay 31, 2018dm
d.aspetjournals.orgD
ownloaded from
DMD #49023
28
Neuvonen PJ, Niemi M, Backman JT. (2006) Drug interactions with lipid-lowering drugs:
Mechanisms and clinical relevance. Clin Pharmacol Ther 80:565-581.
Niemi M, Backman JT, Kajosaari LI, Leathart JB, Neuvonen M, Daly AK, Eichelbaum M,
Kivisto KT, Neuvonen PJ. (2005) Polymorphic organic anion transporting polypeptide 1B1 is
a major determinant of repaglinide pharmacokinetics. Clin Pharmacol Ther 77:468-478.
Niemi M, Pasanen MK, Neuvonen PJ. (2011) Organic anion transporting polypeptide 1B1: A
genetically polymorphic transporter of major importance for hepatic drug uptake. Pharmacol
Rev 63:157-181.
Niemi M, Schaeffeler E, Lang T, Fromm MF, Neuvonen M, Kyrklund C, Backman JT, Kerb
R, Schwab M, Neuvonen PJ, Eichelbaum M, Kivisto KT. (2004) High plasma pravastatin
concentrations are associated with single nucleotide polymorphisms and haplotypes of
organic anion transporting polypeptide-C (OATP-C, SLCO1B1). Pharmacogenetics 14:429-
440.
Nozawa T, Sugiura S, Nakajima M, Goto A, Yokoi T, Nezu J, Tsuji A, Tamai I. (2004)
Involvement of organic anion transporting polypeptides in the transport of troglitazone
sulfate: Implications for understanding troglitazone hepatotoxicity. Drug Metab Dispos
32:291-294.
Pasanen MK, Fredrikson H, Neuvonen PJ, Niemi M. (2007) Different effects of SLCO1B1
polymorphism on the pharmacokinetics of atorvastatin and rosuvastatin. Clin Pharmacol
Ther 82:726-733.
Pasanen MK, Neuvonen PJ, Niemi M. (2008) Global analysis of genetic variation in
SLCO1B1. Pharmacogenomics 9:19-33.
This article has not been copyedited and formatted. The final version may differ from this version.DMD Fast Forward. Published on December 17, 2012 as DOI: 10.1124/dmd.112.049023
at ASPE
T Journals on M
ay 31, 2018dm
d.aspetjournals.orgD
ownloaded from
DMD #49023
29
Regev-Shoshani G, Shoseyov O, Kerem Z. (2004) Influence of lipophilicity on the
interactions of hydroxy stilbenes with cytochrome P450 3A4. Biochem Biophys Res Commun
323:668-673.
Roth M, Araya JJ, Timmermann BN, Hagenbuch B. (2011) Isolation of modulators of the
liver-specific organic anion-transporting polypeptides (OATPs) 1B1 and 1B3 from rollinia
emarginata schlecht (annonaceae). J Pharmacol Exp Ther 339:624-632.
Simonson SG, Raza A, Martin PD, Mitchell PD, Jarcho JA, Brown CD, Windass AS,
Schneck DW. (2004) Rosuvastatin pharmacokinetics in heart transplant recipients
administered an antirejection regimen including cyclosporine. Clin Pharmacol Ther 76:167-
177.
Spencer CM and Markham A. (1997) Troglitazone. Drugs 54:89-101.
Zheng HX, Huang Y, Frassetto LA, Benet LZ. (2009) Elucidating rifampin's inducing and
inhibiting effects on glyburide pharmacokinetics and blood glucose in healthy volunteers:
Unmasking the differential effects of enzyme induction and transporter inhibition for a drug
and its primary metabolite. Clin Pharmacol Ther 85:78-85.
This article has not been copyedited and formatted. The final version may differ from this version.DMD Fast Forward. Published on December 17, 2012 as DOI: 10.1124/dmd.112.049023
at ASPE
T Journals on M
ay 31, 2018dm
d.aspetjournals.orgD
ownloaded from
DMD #49023
30
FOOTNOTES
E. van de Steeg en R. Greupink contributed equally to this manuscript. E. van de
Steeg was supported by a grant of the Centre for Medical Systems Biology, and R. Greupink
and M. Schreurs were supported by an unconditional grant of Janssen Pharmaceutical
Companies of Johnson & Johnson. The HEK-OATP1B1 and HEK-OATP1B1*15 cells used
in these studies were generated and characterized within a collaboration between TNO,
Janssen Pharmaceutical Companies of Johnson & Johnson and Radboud University Nijmegen
Medical Centre, partly funded by the Dutch government (Ministry of Economic Affairs,
project number [EZ1560]).
This article has not been copyedited and formatted. The final version may differ from this version.DMD Fast Forward. Published on December 17, 2012 as DOI: 10.1124/dmd.112.049023
at ASPE
T Journals on M
ay 31, 2018dm
d.aspetjournals.orgD
ownloaded from
DMD #49023
31
FIGURES LEGENDS
Figure 1. Immunocytochemical staining of OATP1B1 in HEK-OATP1B1 (A), HEK-
OATP1B1*15 (B) and HEK-MOCK (C) cells. For detection the monoclonal primary
OATP1B1 antibody (ESL clone) and a goat-anti-mouse Alexa488 secondary antibody were
used. Note the similar membrane expression pattern in the HEK-OATP1B1 and HEK-
OATP1B1*15 cell lines.
Figure 2. Absolute plasma membrane protein expression levels of OATP1B1 in HEK-
OATP1B1 and HEK-OATP1B1*15 cells as measured by UPLC/MS/MS. No expression of
OATP1B1 protein was detected in HEK-MOCK cells (data not shown). Data are presented as
mean ± SD (n=3).
Figure 3. OATP1B1- and OATP1B1*15-mediated uptake of [3H]-E217β-G and [3H]-
rosuvastatin. A and B, concentration-dependent uptake of [3H]-E217β-G into HEK-MOCK,
HEK-OATP1B1, and HEK-OATP1B1*15 cells after 2 minutes incubation. C, uptake of 1
µM [3H]-rosuvastatin into HEK-MOCK, HEK-OATP1B1 and HEK-OATP1B1*15 cells after
1 minute incubation. D, concentration-dependent uptake of [3H]-rosuvastatin in HEK-MOCK
and HEK-OATP1B1 cells after 1 minute incubation. The dotted line represents the nonlinear
fit of the uptake into the transfected cells corrected for the uptake in the mock-transfected
cells. The dotted line therefore represents the OATP1B1- or OATP1B1*15-mediated uptake
of [3H]-E217β-G or [3H]-rosuvastatin. Data are presented as mean ± SD (n=3; *, P < 0.05;
***, P < 0.001 when compared with HEK-MOCK).
This article has not been copyedited and formatted. The final version may differ from this version.DMD Fast Forward. Published on December 17, 2012 as DOI: 10.1124/dmd.112.049023
at ASPE
T Journals on M
ay 31, 2018dm
d.aspetjournals.orgD
ownloaded from
DMD #49023
32
Figure 4. Inhibition of [3H]-E217β-G uptake (1 µM) in HEK-OATP1B1 (black closed
circles) and HEK-OATP1B1*15 (grey open circles) cells by glyburide (A), glipizide (B),
gliclazide (C), glimepiride (D), tolbutamide (E), troglitazone (F), pioglitazone (G), and
metformin (H). Results are presented as mean ± SEM of three independent experiments each
performed in duplo).
Figure 5. Inhibition of [3H]-rosuvastatin (1 µM) uptake in HEK-OATP1B1 cells by
glyburide (A), glipizide (B), gliclazide (C), glimepiride (D), tolbutamide (E), troglitazone
(F), pioglitazone (G), and metformin (H). Results are presented as mean ± SD (n=3).
Figure 6. Relation between inhibition potency of selected oral antidiabetic drugs for
OATP1B1-mediated rosuvastatin uptake (LogIC50) and the lipophilicity of these compounds
(xlogP), r2=0.91, p < 0.05.
This article has not been copyedited and formatted. The final version may differ from this version.DMD Fast Forward. Published on December 17, 2012 as DOI: 10.1124/dmd.112.049023
at ASPE
T Journals on M
ay 31, 2018dm
d.aspetjournals.orgD
ownloaded from
DMD #49023
33
TABLES
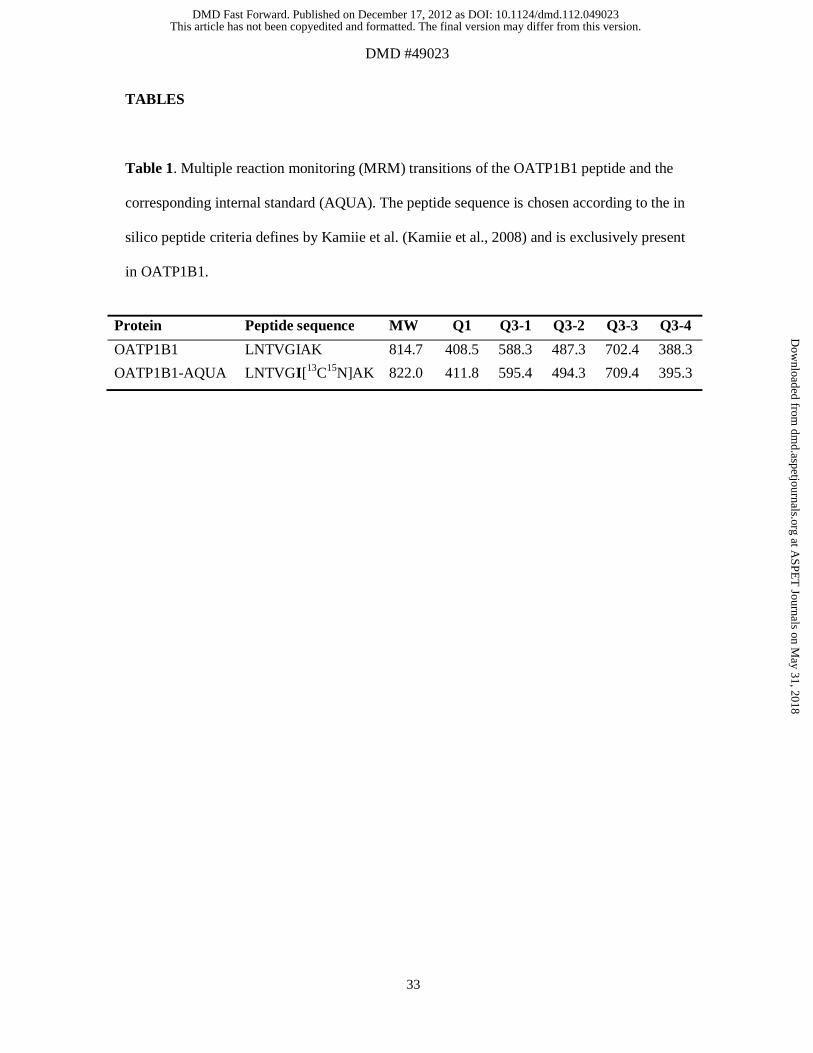
Table 1. Multiple reaction monitoring (MRM) transitions of the OATP1B1 peptide and the
corresponding internal standard (AQUA). The peptide sequence is chosen according to the in
silico peptide criteria defines by Kamiie et al. (Kamiie et al., 2008) and is exclusively present
in OATP1B1.
Protein Peptide sequence MW Q1 Q3-1 Q3-2 Q3-3 Q3-4
OATP1B1 LNTVGIAK 814.7 408.5 588.3 487.3 702.4 388.3
OATP1B1-AQUA LNTVGI[13C15N]AK 822.0 411.8 595.4 494.3 709.4 395.3
This article has not been copyedited and formatted. The final version may differ from this version.DMD Fast Forward. Published on December 17, 2012 as DOI: 10.1124/dmd.112.049023
at ASPE
T Journals on M
ay 31, 2018dm
d.aspetjournals.orgD
ownloaded from
DMD #49023
34
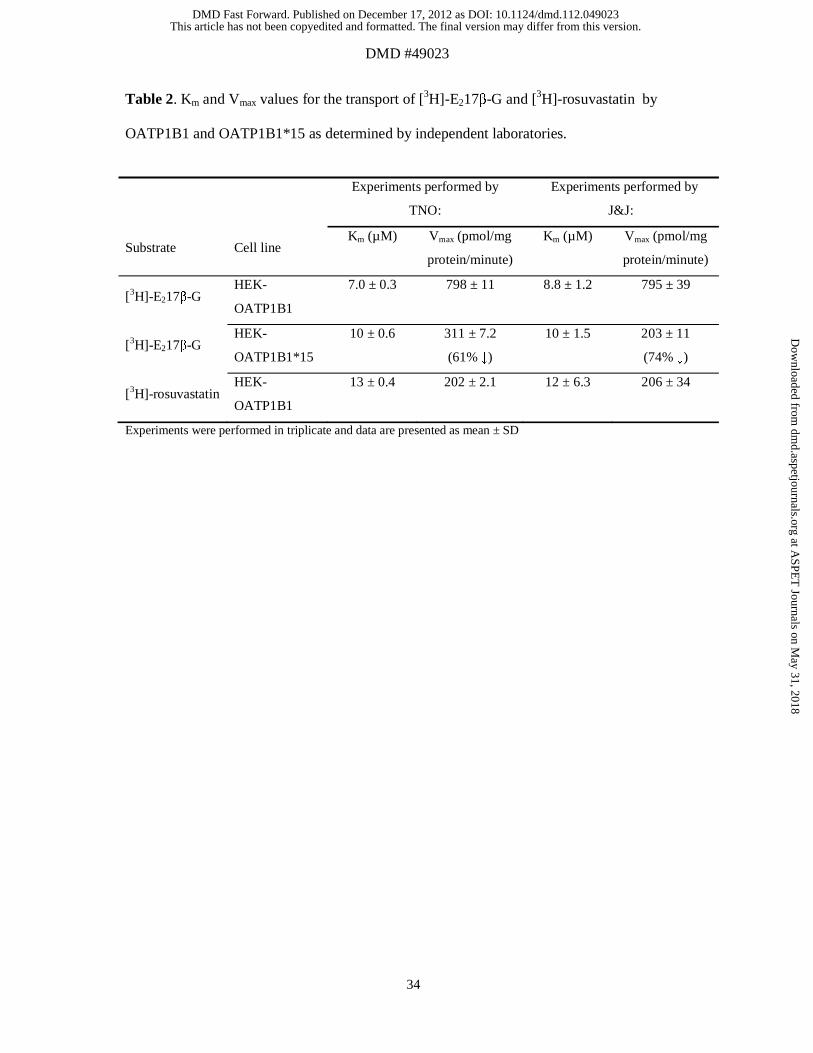
Table 2. Km and Vmax values for the transport of [3H]-E217β-G and [3H]-rosuvastatin by
OATP1B1 and OATP1B1*15 as determined by independent laboratories.
Experiments performed by
TNO:
Experiments performed by
J&J:
Substrate Cell line Km (µM) Vmax (pmol/mg
protein/minute)
Km (µM) Vmax (pmol/mg
protein/minute)
[3H]-E217β-G HEK-
OATP1B1
7.0 ± 0.3 798 ± 11 8.8 ± 1.2 795 ± 39
[3H]-E217β-G HEK-
OATP1B1*15
10 ± 0.6 311 ± 7.2
(61% ↓)
10 ± 1.5 203 ± 11
(74% ↓)
[3H]-rosuvastatin HEK-
OATP1B1
13 ± 0.4 202 ± 2.1 12 ± 6.3 206 ± 34
Experiments were performed in triplicate and data are presented as mean ± SD
This article has not been copyedited and formatted. The final version may differ from this version.DMD Fast Forward. Published on December 17, 2012 as DOI: 10.1124/dmd.112.049023
at ASPE
T Journals on M
ay 31, 2018dm
d.aspetjournals.orgD
ownloaded from
DMD #49023
35
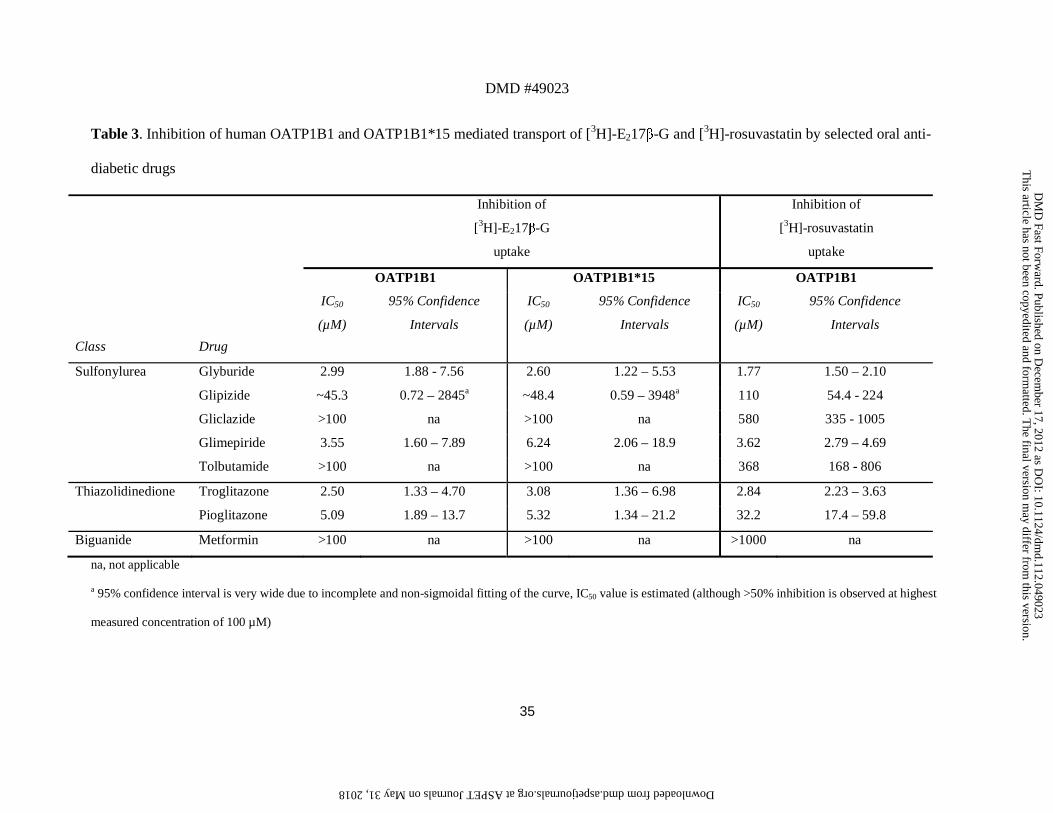
Table 3. Inhibition of human OATP1B1 and OATP1B1*15 mediated transport of [3H]-E217β-G and [3H]-rosuvastatin by selected oral anti-
diabetic drugs
Class
Drug
Inhibition of
[3H]-E217β-G
uptake
Inhibition of
[3H]-rosuvastatin
uptake
OATP1B1 OATP1B1*15 OATP1B1
IC50
(µM)
95% Confidence
Intervals
IC50
(µM)
95% Confidence
Intervals
IC50
(µM)
95% Confidence
Intervals
Sulfonylurea Glyburide 2.99 1.88 - 7.56 2.60 1.22 – 5.53 1.77 1.50 – 2.10
Glipizide ~45.3 0.72 – 2845a ~48.4 0.59 – 3948a 110 54.4 - 224
Gliclazide >100 na >100 na 580 335 - 1005
Glimepiride 3.55 1.60 – 7.89 6.24 2.06 – 18.9 3.62 2.79 – 4.69
Tolbutamide >100 na >100 na 368 168 - 806
Thiazolidinedione Troglitazone 2.50 1.33 – 4.70 3.08 1.36 – 6.98 2.84 2.23 – 3.63
Pioglitazone 5.09 1.89 – 13.7 5.32 1.34 – 21.2 32.2 17.4 – 59.8
Biguanide Metformin >100 na >100 na >1000 na
na, not applicable
a 95% confidence interval is very wide due to incomplete and non-sigmoidal fitting of the curve, IC50 value is estimated (although >50% inhibition is observed at highest
measured concentration of 100 µM)
This article has not been copyedited and form
atted. The final version m
ay differ from this version.
DM
D Fast Forw
ard. Published on Decem
ber 17, 2012 as DO
I: 10.1124/dmd.112.049023
at ASPET Journals on May 31, 2018 dmd.aspetjournals.org Downloaded from
This article has not been copyedited and formatted. The final version may differ from this version.DMD Fast Forward. Published on December 17, 2012 as DOI: 10.1124/dmd.112.049023
at ASPE
T Journals on M
ay 31, 2018dm
d.aspetjournals.orgD
ownloaded from
HEK-OATP1B1 HEK-OATP1B1*150
5
10
15
Figure 2p
mo
l OA
TP
1B1/
mg
mem
bra
ne
pro
tein
This article has not been copyedited and formatted. The final version may differ from this version.DMD Fast Forward. Published on December 17, 2012 as DOI: 10.1124/dmd.112.049023
at ASPE
T Journals on M
ay 31, 2018dm
d.aspetjournals.orgD
ownloaded from
0 20 40 600
300
600
900
HEK-MOCK
HEK-OATP1B1
nonlin fit
E217b-G (mM)
pmo
l E21
7b
-G /
mg
pro
tein
/ min
0 20 40 600
300
600
900
HEK-MOCK
HEK-OATP1B1*15
nonlin fit
E217b-G (mM)
pmo
l E21
7b-
G /
mg
pro
tein
/ min
0
5
10
15
20 HEK-MOCKHEK-OATP1B1
HEK-OATP1B1*15
***
*
pmo
l ro
suva
sta
tin /
mg
pro
tein
/ min
0 20 40 60 80 100 1200
100
200
300 HEK-OATP1B1
HEK-MOCK
nonlin fit
Rosuvastatin ( mM)
pmo
l ro
suva
sta
tin /
mg
pro
tein
/ min
A B
C D
Figure 3
This article has not been copyedited and formatted. The final version may differ from this version.DMD Fast Forward. Published on December 17, 2012 as DOI: 10.1124/dmd.112.049023
at ASPE
T Journals on M
ay 31, 2018dm
d.aspetjournals.orgD
ownloaded from

-2 -1 0 1 2 30
20
40
60
80
100
120
Log [glyburide] ( mM)
[3H
]-E
217
b-G
up
take
(% o
f ac
tivi
ty)
-2 -1 0 1 2 30
20
40
60
80
100
120
log [glipizide] ( mM)
[3H
]-E
217
b-G
up
take
(% o
f ac
tivi
ty)
-2 -1 0 1 2 30
20
40
60
80
100
120
140
Log [gliclazide] ( mM)
[3H
]-E
217
b-G
up
take
(% o
f ac
tivi
ty)
-2 -1 0 1 2 30
20
40
60
80
100
120
Log [glimepiride] ( mM)
[3H
]-E
217
b-G
up
take
(% o
f ac
tivi
ty)
-2 -1 0 1 2 30
20
40
60
80
100
120
log [tolbutamide] ( mM)
[3H
]-E
217
b-G
up
take
(% o
f ac
tivi
ty)
-2 -1 0 1 2 30
20
40
60
80
100
120
Log [troglitazone] ( mM)
[3H
]-E
217
b-G
up
take
(% o
f ac
tivi
ty)
-2 -1 0 1 2 30
20
40
60
80
100
120
Log [pioglitazone] ( mM)
[3H
]-E
217
b-G
up
take
(% o
f ac
tivi
ty)
-2 -1 0 1 2 30
20
40
60
80
100
120
Log [metformin] ( mM)
[3H
]-E
217
b-G
up
take
(% o
f ac
tivi
ty)
A
C
E
G
B
D
F
H
Figure 4
This article has not been copyedited and formatted. The final version may differ from this version.DMD Fast Forward. Published on December 17, 2012 as DOI: 10.1124/dmd.112.049023
at ASPE
T Journals on M
ay 31, 2018dm
d.aspetjournals.orgD
ownloaded from
-3 -2 -1 0 1 2 3 40
20
40
60
80
100
120
Log [glyburide] ( mM)
[3 H]-
rosu
vast
atin
up
take
(% o
f ac
tivi
ty)
-3 -2 -1 0 1 2 3 40
20
40
60
80
100
120
Log [glipizide] ( mM)
[3H
]-ro
suva
stat
in u
pta
ke(%
of
acti
vity
)
-3 -2 -1 0 1 2 3 40
20
40
60
80
100
120
Log [gliclazide] ( mM)
[3H
]-ro
suva
stat
in u
pta
ke(%
of
acti
vity
)
-3 -2 -1 0 1 2 3 40
20
40
60
80
100
120
Log [glimepiride] ( mM)
[3H
]-ro
suva
stat
in u
pta
ke(%
of
acti
vity
)
-3 -2 -1 0 1 2 3 40
20
40
60
80
100
120
log [tolbutamide] ( mM)
[3H
]-ro
suva
stat
in u
pta
ke(%
of
acti
vity
)
-3 -2 -1 0 1 2 3 40
20
40
60
80
100
120
Log [troglitazone] ( mM)
[3H
]-ro
suva
stat
in u
pta
ke(%
of
acti
vity
)
-3 -2 -1 0 1 2 3 40
20
40
60
80
100
120
Log [pioglitazone] ( mM)
[3H
]-ro
suva
stat
in u
pta
ke(%
of
acti
vity
)
-3 -2 -1 0 1 2 3 40
20
40
60
80
100
120
Log [metformin] ( mM)
[3H
]-ro
suva
stat
in u
pta
ke(%
of
acti
vity
)
A
C
E
G
B
D
F
H
Figure 5
This article has not been copyedited and formatted. The final version may differ from this version.DMD Fast Forward. Published on December 17, 2012 as DOI: 10.1124/dmd.112.049023
at ASPE
T Journals on M
ay 31, 2018dm
d.aspetjournals.orgD
ownloaded from
0 2 4 60
1
2
3
glyburide
glipizide
gliclazide
glimepiride
tolbutamide
Figure 6
Compound lipophilicity (xlogP)
Lo
gIC
50 (
mM)
This article has not been copyedited and formatted. The final version may differ from this version.DMD Fast Forward. Published on December 17, 2012 as DOI: 10.1124/dmd.112.049023
at ASPE
T Journals on M
ay 31, 2018dm
d.aspetjournals.orgD
ownloaded from