Embed Size (px)
Citation preview

Drug Discovery & Development
How new bioactive molecules are discoveredHow candidates are developed into drugs How drugs find their way to the market
WS 2017/18 University of Vienna, Austria Martin Hintersteiner1

Goals:
• Comprehensive picture of the Drug Discovery & Development process.
• Get a «feeling» for what is a good molecule &what molecules are good for.
• Develop an understanding on how it works & what processes are involved.
2

3
Di 12.12 8:30 bis 10:00 SR 2Mi 13.12 8.30 bis 10:00 SR 1Und 10.30 bis 13:00 SR 2Do 14.12 8.30 bis 10:00 SR 2UND 10:30 bis 13:00 SR 1Fr 15.12 9:00 bis 13:00 SR 4
Mo 15.01. 9:00 bis 12:00 SR 4Di 16.01. 9:00 bis 12:00 SR 4Mi 17.01. 10:00 bis 12:00 SR 4D0 18.01. 9:00 bis 12:00 SR 4Backup 19.1.

4
?

The Beginnings
5

6

7
Cahn, Hepp 1886: «Ein glücklicher Zufall hat uns einPräparat in die Hand gespielt» Klin. Med. 7: 561–64.
Acetanilid (Antifebrin) analgesic, antipyretic
metabolized
PhenylhydroxylamineToxic via haemoglobin mod.
activeParacetamol
What was the problem?

8
When Bayer wanted to mimick paracetamol they had access to large quantities of a precursor which would give phenacetin.
Although phenacetin is mainly metabolized to paracetamol (active form)a side reactions lead to toxic metabolites similar to phenylhydroxylamine

9
Fever & Pain, InfectionPhsychotic drugs

10

11
?

12
Success rates

13
Clinical
I
Clinical
II
Pre-
Clinical Registration LaunchClinical
III
Success rates per development phase
60% 40% 60% 85%

14
Success rates per development phase
Prediction v AttritionDDW 2008, Fall

15
Number of annual approvals & costs
Clin Pharmacol Ther. Mar 2010; 87(3): 356–361

16
Costs & time for bringing a drug to the market
Source: Joseph A. DiMasi, “New Drug Development; Cost, Risk and Complexity”, Drug Information Journal, May 1995. (From R&D Directions, 1996)
1975 1985 2005
Costs
in m
illio
n $
0
200
400
600
800
1000
1200
1400
Clinical P I-III
Pre-clinical
17
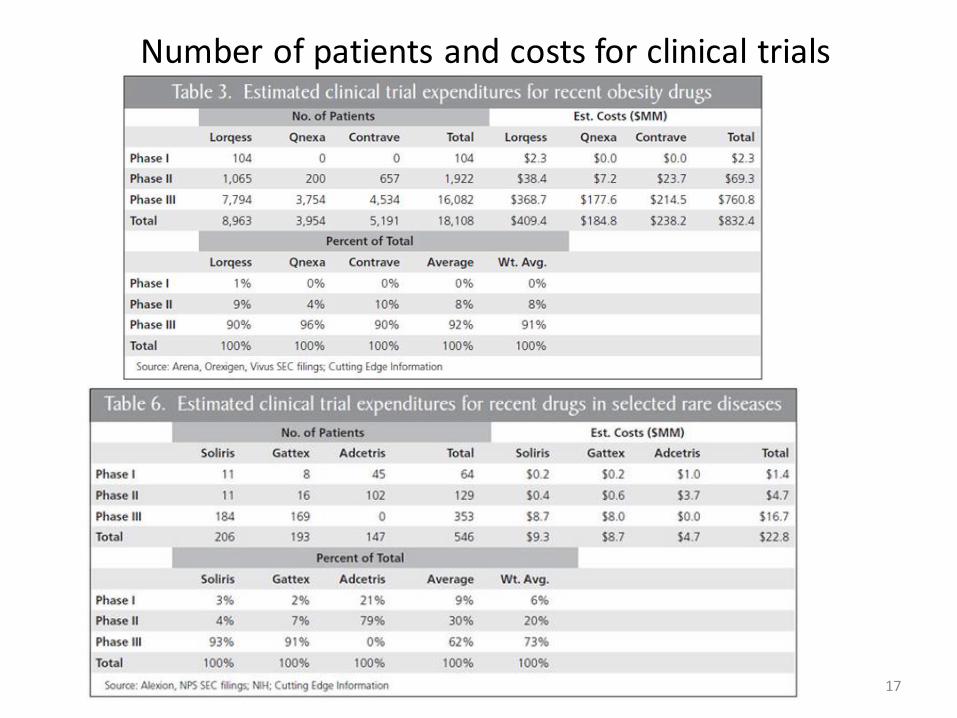
Number of patients and costs for clinical trials

Summary Process characteristics
• Process is highly fragmented (specialized)
• Standardized (regulatory & heuristic reasons)
• Chases a rare event – success (complexity)
• Unidirectional – failure to progress is failure (no going back)
18
Let’s look at some significant benchmark figures…

19
What goes wrong, when things go wrong.... (case study from Astra Zeneca – Nat. Rev. DD 2014, 13, 420).

20

21
Rationaletarget
competitor
Preclinical models
Exposure?
Tox signs
Limit phase II dose
No prove moleculebinds target invivo
Stop in phase II

22
What goes wrong, when things go wrong.... (case study from Astra Zeneca – Nat. Rev. DD 2014, 13, 420).
Nat. Biot. 2014, 32 (1), 40
Phase 0 – II: Phase III/Reg:

23
No 1 reason for failure - SAFETY

24
No 2 reason for failure - Efficacy

25
Lessons learned
Additional problem: «truth seeking vs progression-seeking behavior»

26

27
Why is it so hard /getting harder to bring a drug to market?( Nat. Rev. DD 2012, 11, 191).
The case:
Despite technology improvments – it gets harder & harder:

28
Unique situation of Pharmaceutical products:1. The «better than the beatles» problem
2. The «cautious regulator» problem
3. The «more money will solve it» attitude
Unlike in most other industries, previous developments generate a back-catalogue of approved medciation. Any new one needs to have a clear benefit i.e. any new medicine must be better than the standard-of-care available.
Very similar to the above, the advance in standards also leads to an ever tightening environment of regulations which slows down the process, makes additional testing necessary and prolonges the cycle time.
The tendency to react to increased challenges from 1 & 2 by increasing resources increases also the costs. Increasing resources however, does not necessarily lead to more efficient processes.
In line with 3 there is the tendency to try and compensate the low success rates by increasing the number of projects (i.e. If it gets harder, try to run faster). However, each project is a scientific endeavour and needs to be treated like it, not like a «factory for manufacturing standard parts » where effort/speed = output.
4. The «numbers instead of science» tendency

Idialized Drug Discovery & development flow chart
29
Disease area basic research;Medical disease understanding
Assay strategy Assay developmentAssay validation
Screening
Compound repository Archive
Hit confirmation,Hit validation«counter screening»
Hit SelectionHit to «Lead»early chemistry
Lead Selectionbased on
«lead criteria»
Med. Chem. optimization
Animal ModelsPreclinical in-vivoprofiling
Clinical Phase I Process development, Disease marker, endpoint definition
INDInvestigational New Drug application
Clinical Phase II Clinical Phase IIINDA
NEW DRUG APPLICATION

The beginnings – serendipidty & natural molecules
30

31
?

32
1. Antipyretic/analgesic: Aspirin, Parcetamol,
Local anaesthetic: Cocain (first applied by Carl Kollerfriend of Sigumnd Freud)
2. Antiparasitic: Quinine Malaria was endemic in southern parts of Europesince 17th century ground bark of cinchona was usedIn 1820 Pelletier and Caventou isolated for the first time Quinine
Cocain
Quinine
« We know how advantageous it is in the treatment of diseaseto be certain of the precise dose of all active remedies; this advantage especially appliesto the prsent case, because the quantitiy of the alkalis contained in the cinchonas bark varies, according to the nature and quality of the bark. it is often also very desirable to administer this medicine in a small volume, and in an agreeable form. Patients often die of malignant fevers because they cannot swallow the necessaryquantity of the bark in powder. Some throw it up after having taken it. «From «Formulaire pour la Preparation et l’Emploi de Plusiers Nouvaux Mèdicaments», the first compendium describing pure chemicals instead of plant mixtures.

33
2: Antiparasitic: Salvasarn - The first safe and effective medicine against syphilis. The active structure was based onearlier work with dyes.
Salvarsan
3. Barbiturates: Hypnotics, aneasthetics, anticonvulsant, anxiolytic
Joseph von Mering studied earlier hypnotics and was convinced that a carbon atom (3 or 4 substituents, containing two ethyl-groups would be the central active feature of hypnotics. He worked with Emil Fischer and synthesized diethylacetylurea – and it was found to be have the desired activity.
He then prepared 5,5-dethylbaributic acid. Because Emil Fisher doubted the synthesis of his student, he re-synthesized the compound. It was found much more active therefore, Fished called it «Veronal» The compound was later marketed by Bayer as «Veronal»
5,5-dethylbarbituric acid
Barbituric acid, first syntheized 1864 by Adolf von Bayer

34
4. Corticosteroids: looking for molecules in a new way..
19th century, a condition called Addison’s disease was first described. Symptoms: weakness, abdominal pain, progression to coma. Cause: insufficient adrenal cortex hormons. Originally , adrenal glands were used to extract such hormons.
1941: American intelligence agents picked up a rumor that Germany was purchasing high quantities of adrenal glands from slaughterhouses in Argentina, supposedly for the production of extracts to enable Luftwaffe pilots to withstand stress of flights at high altitutdes. -> a collaboration with pharmaceutical industry (Merck) was started to synthesize the corticosteroids. 1948: 17-hydroxy-11-dehydrocorticosterone was synthesized. Observations that woman suffering from athritis did generally experience less pain during pregnancy led to tests with this compound in arthritis. Merk commercialized the compound as Cortison -> within 5 years -> 50 indications. 1950 Nobel price of Medicine for all involved (Kendall, Reichenstein, Hench).
Cortison

35
Rational targeting of disease – a man ahead of his time

• Rational drug discovery is based on the following reductionistic hypthesis :
In the network of protein interactions and signal-transductions it is possible to identify individual proteins (genes) which are disease causing. It is further assumed
that a specific inhibition/activation of the function of such proteins/genes is possible using molecules (drugs). The selected proteins are called target.
36
The concept of target proteins in drug discovery
pp
On
p
OFF
Disease state
No OncogeneProductHealthy state
«Oncogen»
stabilizing

37
The classics aera (1950s- 1990s)phenotypic screening/»body own molecules» as example
Heart ArrhythmiasAntihypterensives

38
Discovery of Rapamycin J. Antibiot. 1975, 28, 721
Sirolimus, Rapamune (Pfizer 1999)

39
Discovery in the «classical» aera –phenotypic screening and mimicking
• Standard approach was to collect soil/martitime samples from different locations (often collected by researcher on their holidays) for islation of natural products & testing
• No target protein required; initially applied predominantly for infectious diseases
• Alternative approach: starting from known molecules with known activities
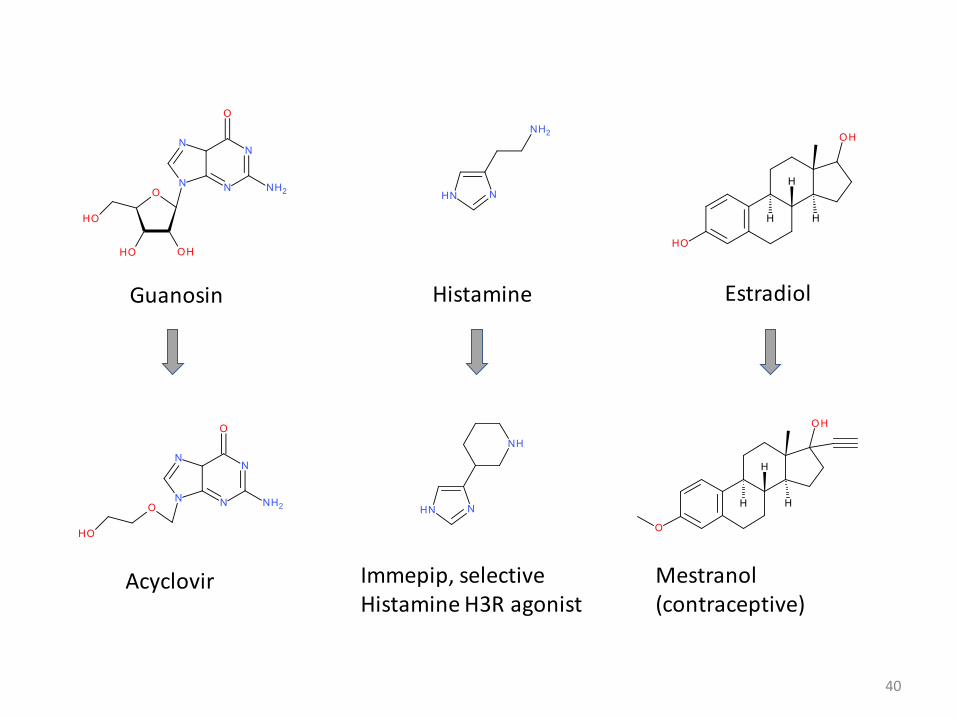
40
Guanosin
Acyclovir Immepip, selective Histamine H3R agonist
Histamine
Mestranol (contraceptive)
Estradiol

Case study - beta-blockers
41
Adrenalin
Adrenergic receptors in cardiac tissue (pacemakers)Ohter functions: general sympathic nervous system: Flight-and-fight syndrom, blood-flow regulation, fat-metabolism.
Tyrosin Dopamin
Adrenalin
L-Dopa
Biosynthesis of Adrenalin
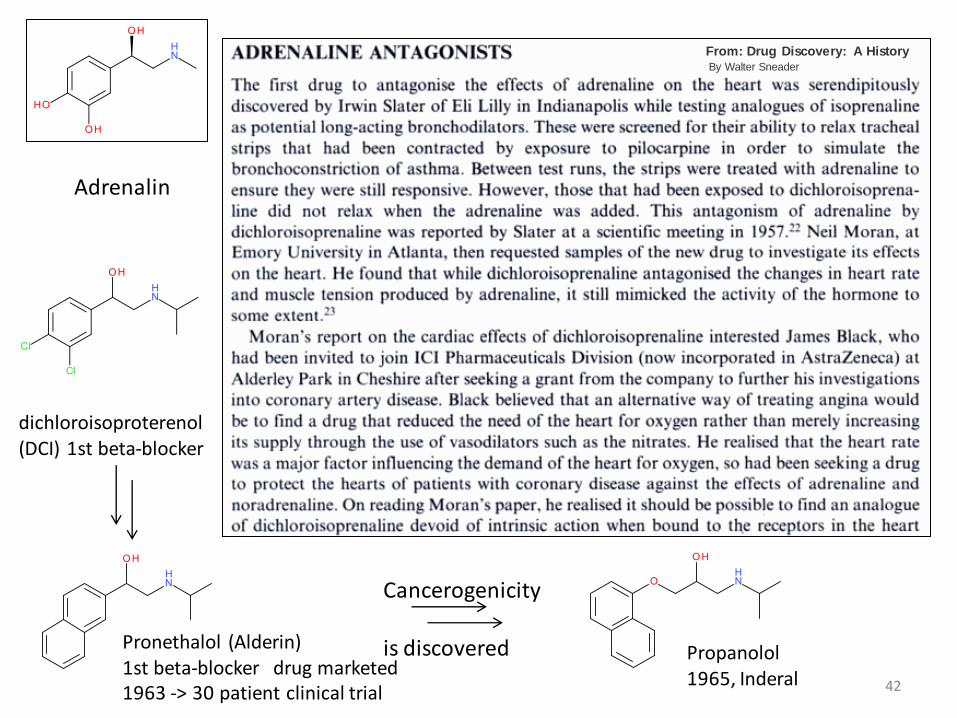
42
Adrenalin
dichloroisoproterenol (DCI) 1st beta-blocker
Pronethalol (Alderin)1st beta-blocker drug marketed1963 -> 30 patient clinical trial
Cancerogenicity
is discovered Propanolol1965, Inderal
From: Drug Discovery: A HistoryBy Walter Sneader
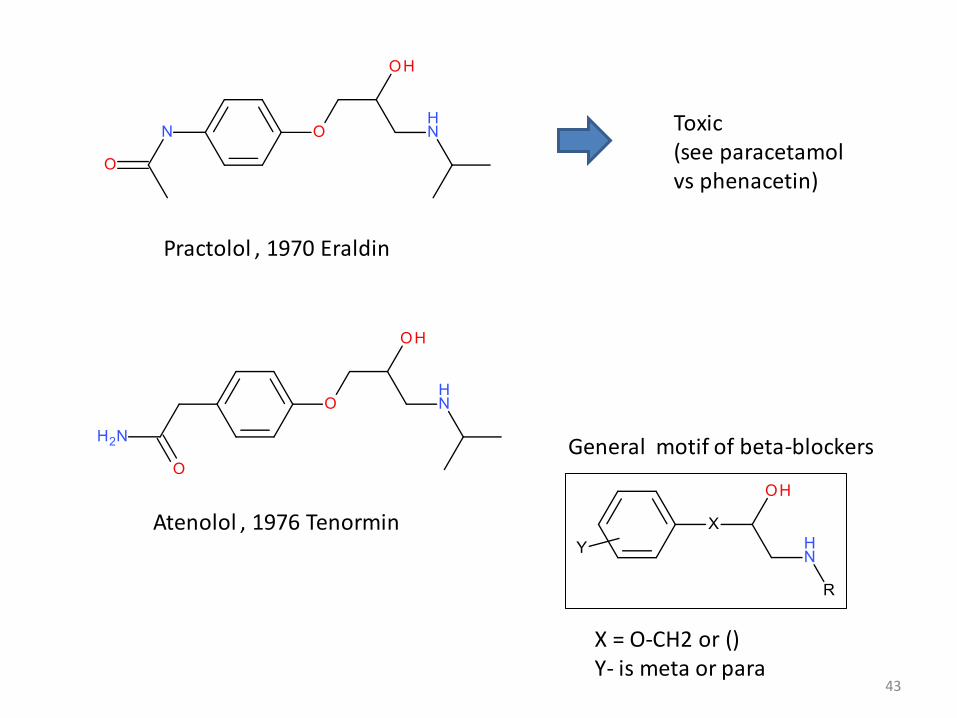
43
Practolol , 1970 Eraldin
Toxic (see paracetamolvs phenacetin)
Atenolol , 1976 Tenormin
General motif of beta-blockers
X = O-CH2 or ()Y- is meta or para

44
Case study - Antihistaminergica
Histamine
Wide variety of activities . Among others, control of acid secretionIn the stomach. -> Ulcers of the intestine are highly prevalent in the poplulation. Historical treatment: surgery
Guanylhistamine (partial agonist)
Higher potency(still partial agonist)
Still partial agonist
Burimamid (first clinical candidate)
Low Bioavailability
Metiamid5-10x more potent
GranulozytopenieSide effect (low granulozytes)
Thiourea suspected problem

45
Case study - Antihistaminergica
Metiamid
GranulozytopenieSide effect (low granulozytes)
Much less potent
Thiourea suspected problem
More potentCimetidin, 1977 (Tagamet)
Ranitidine (Zantac 1981) 4-5 x more potent
AR
General motif of H2 antihistamines

46
Case study - Statines
In the • 1950s & 60s it became apparent that elevated plasma choesterol as a consequence of improved diet are a major risk factor for coranary hear diseases. Working hypothesis: search for drugs which reduce cholesterol biosynthesis •
Rate• -limiting enzyme in the pathway is 3-hydroxy-3-methyl-glutaryl-CoA (HMG-CoA) reductase -> target
Nat. Rev. DD. 2003, 2, 517

47
HMG-CoA reductase
In contrast to late stage intermediates, Hydroxymethylglutarate is well soluble and there is no build-up expected if HMG-CoAis inhibited.
1970s: Japanese group identifies «compactin», a compound with significant HMG-CoA reductase inhibition, from fermentation broth of Penicillium citrinum:
compactinCo-A

48
Compactin showed cholesterol lowering in animal models: rabbit, dog, monkey.
First doubts were casted by the fact that no lowering in rat was seen.
1978: Researchers at Merck found a related natural product: Lovastatin in fermentaiton broth from Aspergillus terreus (Lovastatin).
Lovastatin
Japanese company Sankyo demonstrates effectiveness of compactin for total LDL and cholesterol lowering in patients with heterozygous familial hypercholesterinaemia.
1980: Phae I trail by Merck for Lovastatin. Drug reducesLDL and cholesterol levels dramatically, no obviousadverse reactions.
1980: Sankyo stops clinical trials with compactin
1980: Merck promptly suspends clinical trails
1984: After academic trials in high-risk patients, Merck resumes tials.
1987: Lovastatin is marketed (first in class statin).

49
Early statins are very similar to compactin.Later developments retain substrate/produduct motif but rely on common synthetic scaffolds.

50
The postgenomics aera (2000s -)Targets – Targets – Targets – Molecular modes of action
Heart ArrhythmiasAntihypterensives

• Rational drug discovery based on concept of specific interaction of a protein with a traget protein – one drug – one target – one disease
51
Rational Drug Discovery – Targets..Targets..Targets
Q: What makes a good drug target?
Q: How many targets are there?

52
Number of genes in organisms of different «complexity»

53
Lessons from past targets -how many & what works best?
Nat. Rev. DD. 2011, 10, 579)
• over past 150 years 1500 drugsgenerated
• acting on ~ 400 targets
• this collection provides data set of «successful cases»
• How many more are there?
• Human genome: 30 000 genes

54
Lessons from past targets -success cases – target classes
Receptors44%
Enzymes29%
Transporters12%
Other15%
Current Drug Target classes

55
Breakdown into protein classes
56
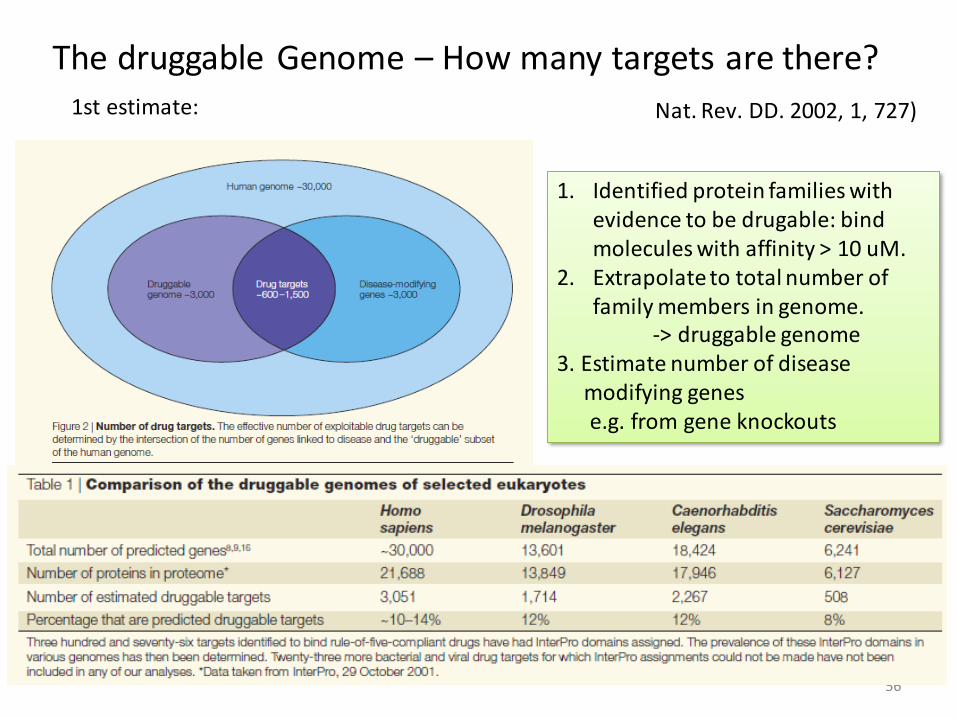
The druggable Genome – How many targets are there?
Nat. Rev. DD. 2002, 1, 727)1st estimate:
1. Identified protein families withevidence to be drugable: bind molecules with affinity > 10 uM.
2. Extrapolate to total number of family members in genome.
-> druggable genome3. Estimate number of disease
modifying genes e.g. from gene knockouts

Case study: Our own drug discovery program:Hu protein R
Background: We have identified a veryinteresting protein. It seems to have somedisease relation and we are thinking ofchoosing this protein as our target for our drugdiscovery program. The protein is called HuR,a family of Hu proteins.
It contains 3 domains, all from the RRM fold, a
57
Hu protein R
Binds & stabilizes mRNAs in the ARE region (AU rich element )
AAAAA
fold which binds RNAs. HuR binds RNAs (in a region containing a defined binding motif and we can masure this interaction in-vitro using a fluorescence assay.
[HuRfl] nM0 40 80 120
Anis
otr
op
y
0.14
0.16
0.18
0.2
0.22
0.24
0.26
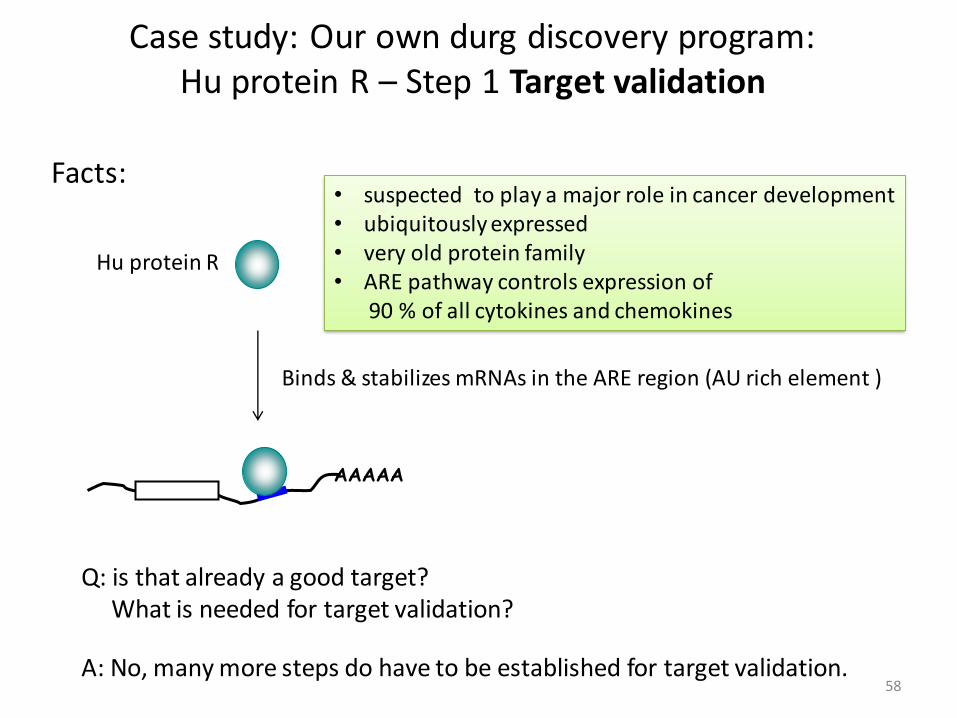
Case study: Our own durg discovery program:Hu protein R – Step 1 Target validation
Facts:
58
Hu protein R
Binds & stabilizes mRNAs in the ARE region (AU rich element )
AAAAA
suspected to play a major role in cancer development•
ubiquitously expressed •
very old protein family•
ARE • pathway controls expression of90 % of all cytokines and chemokines
Q: is that already a good target? What is needed for target validation?
A: No, many more steps do have to be established for target validation.

59
HuR– Step 1 Target validationchecklist – initial
Disase link • - plausibility
Genetics data•
Proteomics data•
Biomarkers•
Disease models•
in• -vitro assays on the function
Structural biology information•
Protein class •
✓
✓
-
-
-
-
-
-
RNA binding can be monitored in vitro

60 11 December 2017
HuR in cancer
• Hu proteins originally identified in 1965 as tumor antigens
in patients with cerebrellar carcinomas, carcinomatous
neuropathies and systemic lupus erythomatosis
• HuR overexpression and increased activity of relevance
in colon cancer1, ovarian cancer2, CNS tumours3,
neoplastic lung cancer4, renal carcinoma5, prostate
cancer, adenocarcinoma, papillary carcinoma, malignant
melanoma, breast cancer, squamous cell carcinoma, …
• Increased HuR activity involved in the onset,
progression, metastasis and vascularization of tumors
• Expression level and cytoplasmic localization of HuR
correlated with tumor grade, malignancy and survival
• Proof-of-concept with siRNA knockdown of HuR in
in vivo colon cancer model
DeSilanes et al, Oncogene. 2003,
22(46):7146-54
Immunohistochemical HuR staining (20x magnification)
Survival of 133 breast cancer patients in
correlation with cytoplasmic HuR expression
Heinonen, M. et al. Cancer Res
2005;65:2157-2161
high and cytoplasmic HuR expression
(29 %)
low HuRexpression

61Taylor GA et al, Immunity. 1996 May;4(5):445-54.
• ARE pathway controls expression of 90 % of all cytokines and chemokines
• ARE mediated rapid decay compromised during allergic inflammatory responses
(eg allergic asthma), leading to persistently high levels of cytokines and chemokines
• Knockout mice of HuR antagonist tristetraprolin (TTP) develop chronic inflammatory syndroms
(cachexia, rheumatoid arthritis, autoimmunity, dermatitis, conjunctivitis) due to excess in TNFa,
GM-CSF and Cox-2 (‘TTP-deficiency syndrome‘)
• Phenotype can be prevented by weekly i.p. administration of TNFa antibody
Carballo E et al, Blood. 2001 Oct 15;98(8):2389-95.
WT
TTP KO
KO + aTNFa
KO +
aTNFa

62
HuR– Step 1 Target validationfinal checklist
• Disase link - plausibility
• Genetics data
• Proteomics data
• Biomarkers
• Disease models
• in-vitro assays on the function
• Structural biology information
• Protein class
✓
✓
-
-
✓
✓
✓
✓

Idialized Drug Discovery & development flow chart
63
Disease area basic research;Medical disease understanding
Assay strategy Assay developmentAssay validation
Screening
Compound repository Archive
Hit confirmation,Hit validation«counter screening»
Hit SelectionHit to «Lead»early chemistry
Lead Selectionbased on
«lead criteria»
Med. Chem. optimization
Animal ModelsPreclinical in-vivoprofiling
Clinical Phase I Process development, Disease marker, endpoint definition
INDInvestigational New Drug application
Clinical Phase II Clinical Phase IIINDA
NEW DRUG APPLICATION

Assay development and Screening
Biology
Probing Biology vs. Chemistry
30 000 400 exploitedfor all current drugs, all belonging to 6 target classes
The „drug-like“ chemical
Universe: ~ 1060 cpds
Chemistry
O
OH
O
O
PtNH
3Cl
Cl NH3
humangenes
Current drugs
«Screening» in this context is any form of testing molecules for a biological effect•
«Assay» is the testing method which allows to see the potential effect of a compound•
The Screening strategy defines what specific assay development is needed •
How to probe Biology vs chemistry

65
Different Screening approaches – non-target based
1. Phenotypic screening: Oldest method. Effect of compounds on cells/organism tested
+ holistic view of the system; + many proteins tested for each compund + in-vivo/cellular efficacy tested as well
- Unfocused discovery of known compounds/targets- identification of target often extremely difficult - what if no clear target?
2. In-vivo model screening: Requires model organism with specific properties: e.g. Zebrafish development model
+ holistic view of the system; + ensure compound hits desired pathway+ in-vivo/cellular efficacy tested as well
- Complicated to set-up - Slow testing- target difficult to find

66
Different Screening approaches – target based
3. Cellular screening: a) generic reporter gene assay: a luciferase/GFP/etc. is cloned under control of a
promotor which is linked to the activity of the protein of interest. b) specific cellular assay: e.g. T-cell activation, fluorescence based imaging, etc..
+ medium fast /rel. easy setup + cellular efficacy tested+ automation
- Off-traget effects (other than desired target/multiple) - Limited in-vivo relevance- false negatives
3. In-vitro screening: a) enzymatic or competition screening
b) affinity based screening
+ easyly automated+ fast+ target focussed
- Target needs to be an enzyme /or have natural ligand- Reductionistic (no in-vivo relevance per se)
+ very fast/automated+ target focussed+ generic
Hits selected for binding not biol. Activity-Highest degree of reductionism-

69
Screening – miniaturization and automation of testing
1994 1998 2000
96 wells 384 wells 1536 wells
Compounds / day: 10.000 40.000 200.000Volume / well: 100-200 µl 30-100 µl 2.5-10 µl
The History of Microplate Formats
• From early 1990s, Screening increasingly developed into an automated process with standardized elements and a focus on throughput
• Fluorescence developed into one of the key detection technologies

70 11 December 2017
Cybi-Well (mL)
Biomek FX (mL)
NPRS System (50nL)
MITONA System (24 nL)Key Features:AccuracyPrecision Speed
Liquid Handling (3) – Automated Systems
Slide: NIBR – DT LDC

71 11 December 2017
ViewLux/LeadSeeker
FLIPR
Mark III SCARINA
Mark II SCARINAKey Features:AutomationFlexibility Speed
Automated Screening Systems

72 11 December 2017
Key Features:IntegrationFlexibility
“Big data” handling
Tool Prod. 1
Tool Prod. 2
Assay Dev.
HTS
Project Proposal: Project Tracking:
ex pec. timeactual time
web-based tool for all of Novartis research community
hyper-linked to chemistry/biology/literature databases
project management functionalities
Target
HTS Data Evaluation/Handling
Slide: NIBR – DT LDC
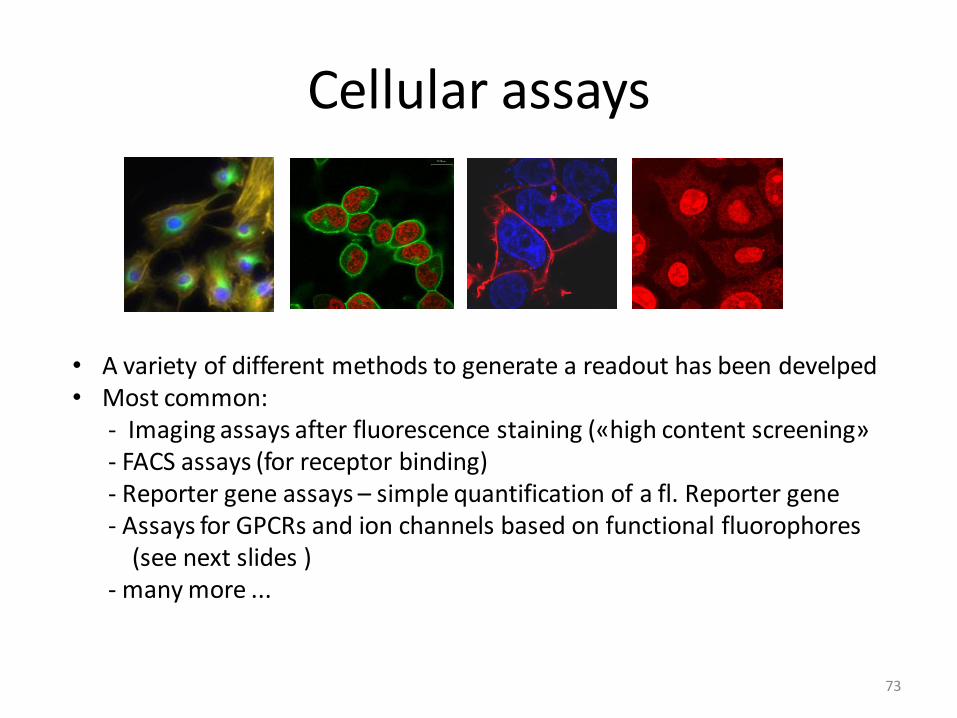
Cellular assays
73
• A variety of different methods to generate a readout has been develped• Most common:
- Imaging assays after fluorescence staining («high content screening»- FACS assays (for receptor binding) - Reporter gene assays – simple quantification of a fl. Reporter gene - Assays for GPCRs and ion channels based on functional fluorophores
(see next slides )- many more ...

74
Cellular screening – “high content screening”
Camera 1: Cell identification
Camera 2: Cell signal
Data Integration and Analysis
General principle of HCS:
- advanced optics to scan wells very fast
- 2-3 color channels
- Automated pattern recognition and quantification softwareto compare intensities, etcs in different channels.

75
• The over-expression of a transmembrane transporter, the ATP-
dependent P-glycoprotein (Pgp), is one of the reasons for multi drug resistance (MDR). The Pgp pump actively decreases the intracellular concentration of the therapeutic agent.
• Assay: Non-fluorescent calcein acetoxymethyl ester (CaAM) diffuses through a MDR cell containing the Pgp pump. Upon active transport,
the ligand is extruded from the cell. Adding a Pgp inhibitor (e.g., verapamil, cyclosporinA) results in an accumulation of CaAM in the cytoplasm where it is hydrolyzed by intracellular esterases yielding
fluorescent calcein. HCS readout parameter: total cellular fluorescence.
CaAMPgp
Calcein*
Active extrusion
from the cell
Inhibited extrusion > hydrolysis >
enrichment of fluorescent calcein
Pgp+Inhibitor
Example: P-glycoprotein pump-inhibitor assay
Calcein

76
Cell viability assay
• In drug development, compounds may fail because of their
toxicity => cytotoxic potential of a compound has to be assessed.
• Homogeneous cell viability assay: automated, simultaneous
determination of the total number of live and dead cells with high
throughput. Readout signal: total cellular fluorescence in green and red
detection channel.
• Cells are pre-stained with 5-chloromethylfluorescein diacetate (CMFDA).
The wells of 1536 NanoCarrier plates are preloaded with Ethidium
homodimer. Ethidium homodimer diffuses through the cell membrane
into dead cells, giving rise to red cell fluorescence (red = dead cells).
DeadLive
CMFDA pre-stained cells
(green = live cells)Ethidium
homodimer (red)

77
• The ß2-adrenergic receptor is an
example for a G-protein coupled
receptor which represents an important
target for drug discovery.
• Binding activity of compounds to this
receptor is determined using a
fluorescently labeled ligand which
specifically binds to ß2-adrenergic
receptors on the plasma membrane.
• In a second color channel the identity,
number and location of cells is
determined using a cell staining dye.
HCS readout: spectral cell
fluorescence intensity.
• The ability of non-fluorescent
compounds to compete for binding to
the ß2-adrenergic receptor with a
specific ligand can be assessed with
high throughput.
Ligand Binding Assay for the ß2-Adrenergic Receptor
Cell identification Ligand binding/competition
receptor
Ligand*
inhibitor

78
• Imaging: 384 wells recorded simultaneously
• Integrated fluidics:
injection of compound during measurement
• Kinetic data (1 second updates);
detection of fast responses
• Rich data output; possibility for multiplexing
from same assay well (selectivity, toxicity)
• Sensitivity (laser, CCD, patented optics)
• Automated platform: 2 FLIPRs integrated
FLIPR: Fluorescence Imaging Plate Reader

79
Targets
G protein coupled receptors (GPCRs)➢
Ligand➢ -gated ion channels
Assay Types
Measurement of intracellular calcium (Fluo➢ -4)
Membrane potential assay (MP dye)➢
Other specific assays (➢ e.g. pore formation via P2X7/ YoPro-1)
Assay Formats
Discovery of agonists, antagonists, positive modulators➢
Multiplex assays (Agonist/Antagonist, Agonist/Modulator, ➢
Receptor1/Receptor2)
Agonist fishing in orphan receptor research➢
FLIPR: main applications
80
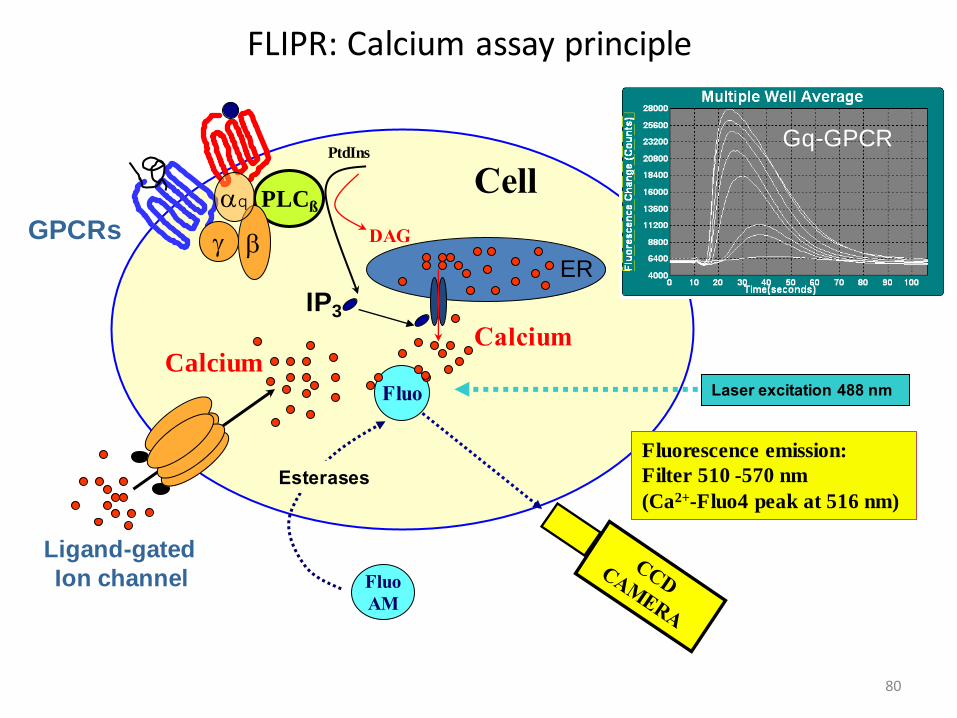
FLIPR: Calcium assay principle
IP3
Fluorescence emission:
Filter 510 -570 nm
(Ca2+-Fluo4 peak at 516 nm)
CellPLCß
Fluo
AM
Esterases
Ligand-gated
Ion channel
bg
Fluo
PtdIns
DAG
Laser excitation 488 nm
Gq-GPCR
GPCRs
aq
CalciumCalcium
ER

81
FLIPR: Membrane potential assay
Fluorescence emission:
Filter 540 -590 nm
Cell
MP
dye
Na+/ K+/
Cation Channel
Laser excitation 488 nm
Cl- Channel/Depolarisation
Cl- Channel
Resting Potential
protein
+
++
++ + +
+++++ +
+
+++
+
++
+
+
+
+
+
+
+
++
- --
Depolarisation
Hyperpolarisation
------
----- -
----- ---
-----
+
++
+++
++
+++
------
--------
- - -------
---
+
-
--
- -
+++
+ + +++
++-- ----
-- - - -- -

Reporter gene assay principle
82
promotor
Target interaction
compound

In-vitro assays
83
Generally • 2 types: competition screening & direct binding assays
Competition screening:• based on the displacement of a ligand from the target protein. Ligand can be either a natural or a «surrogate» ligand.
Measurement format: most common: fl. based for screening alternatives exist: e.g. chip-based biacore
• Direct binding assayFormats: a) fl. Ligands (uncommon)
b) ligand immobilized (bead based, chip based)c) protein immobilized (chip, bead e.g. alpha screen)d) size-exlusion
protein
protein
O
O NH2
O
O NH2
O
O NH2
O
ONH2
O
ONH2
O
ONH2
O
ONH2
O
O
NH2
O
O NH2
a)
b)
c)

Practical approach for fluorescence competition assay
84
Target interaction:
Step 1: generate «surrogate ligand»: natural or already known ligandhere, take p53 helix and use fl. labeled form.
hDm2 (proto-oncogen)interacts via a helix with p53 (tumor suppressor)
Goal: find inhibitors of hDM2-p53interaction
Determine best labeling site

85
Step 2: measure affinity/binding of ligand to protein
+
Step 3: perform assay in presence of high concentrations of compounds (to be screened)
Receptor concentration [uM]
0 2 4 6 8 10
Perc
ent
bin
din
g
0
20
40
60
80
100
+
Receptor concentration [uM]
0 2 4 6 8 10
Perc
ent
bin
din
g
0
20
40
60
80
100

86
Receptor concentration [uM]
0 2 4 6 8 10
Perc
ent
bin
din
g
0
20
40
60
80
100Absence of cpd
Presence of cpd 1
Presence of cpd 2
Presence of cpd 3
Assay set-up:
Normally, concentration of Protein is chosen to be at 50-80% saturation with signal. If compound is active, it will reduce the signal depending on it’s affinity.
Well #
1 2 3 4
sign
al

87
1. Incubation Pool of 400 compounds + protein
60 min
2. 96-well format SECSeparation of protein/ligand complexfrom non-binders
~ 10 sec
3. LC/MS analysisMass spectrometry of ligand (binder)
mass spectrumof ligand 10 min
SEC
Protein+
compoundpool
Loading
SEC
Collecting Protein+
Ligand
G:\DDC\...\LCQ\Vydac PKA CA\Pka_ca_01
A01
PKA_CA_01 #235 RT: 5.61 AV: 1 SB: 178
T: + c ESI Full ms [ 100.00-1000.00]
500 1000
m/z
0
100000
200000
300000
400000
500000
600000
Inte
nsity
338.17
271.13 466.97
690.42954.69
LC-MS
N
N
N
N
O
O
4. Database QueryIdentification of binder
“Sandwich” Technology
Source: I. Muckenschnabel et al. (2004)
Affinity based screening using size exclusion

88
Binding is detectable•
at any time point
Sensitivity depends on•
cmpd properties and detection accuracy only
The principle: Diffusion vs binding
2
11
c
ccp
bf
Exchange between • 3 “compartments“:
V1, V2, and target protein
Described as two parallel pseudo• -first order
binding reactions; Diff.eq. solved
Concentration ratio between upper and lower •
compartment partitioning p
fc1
bc1
2c
'onk
12k
time [h]5 10 15 20co
nce
ntr
atio
n
c0
+ target
control
1cp1cp
equilibratednon-eq.
1tpct pp
binding
c upper well
c lower well
± target
protein
cmpd
10% 30%
target
30%
control
• Dialysis 24h
• Sample 50µl + 10µl ACN in
vials
• HPLC upper and lower
conc.
• Calculate partitioning pt, pc, ps
quality
check
@HPLC
first
30%
specificity
Compound
The process:
Example: Using simple dialysis for analyzing direct binding

89
6
4
3
0
20
40
60
80
retention time [min]
6 7 8 9 10 11 12 8
target
control control
target
0 0
0 0
10
0
4
0
spec.
control
spec.
control
pc = 52 pc = 1.56
pt = 2.49
ps = 1.57
control
non• -dialysable
• pc >>1
aggregated
Cpd 1
• pt > pc
little binding
• ps = pt > pc
unspecific
Cpd 3 Cpd 4
• pt > pc
binding
• ps = pc
specific
pc = 2.97
pt = 17.6
ps = 16.1
HPLC trace integration partitioning
upper peak area
lower peak area
______________≡ p
pc = control
pt = target
ps = specificity
0
12
control
target0
12
pt = 1.13
• dialysable
• pt = pc
no binding
Cpd 2
pc = 1.16
Example: Dialysis results with 4 different compounds:
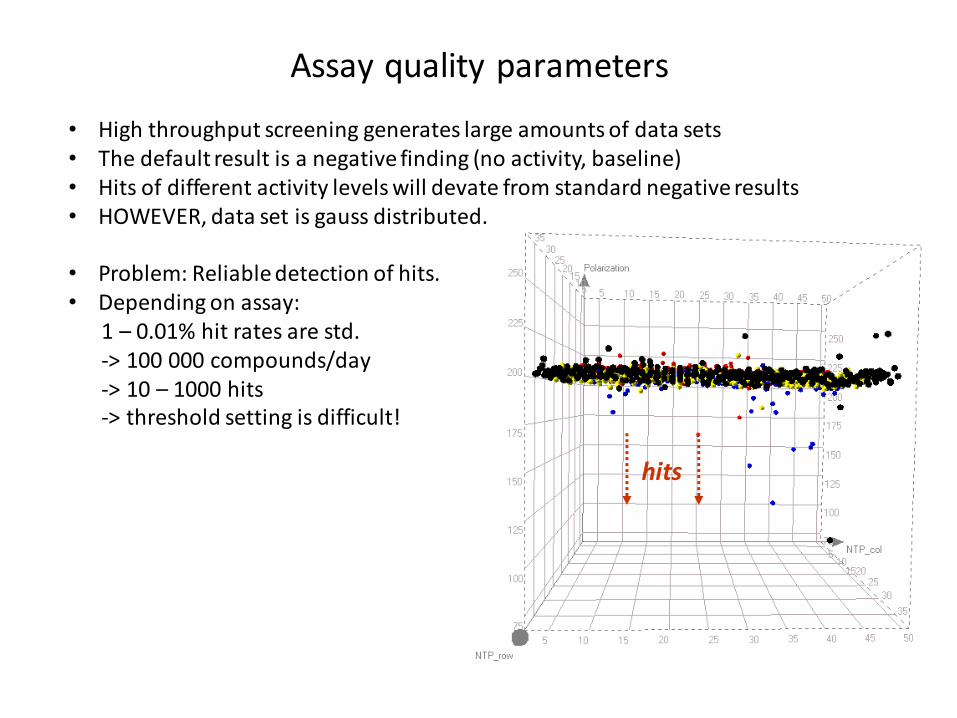
Assay quality parameters
hits
• High throughput screening generates large amounts of data sets • The default result is a negative finding (no activity, baseline)• Hits of different activity levels will devate from standard negative results • HOWEVER, data set is gauss distributed.
• Problem: Reliable detection of hits. • Depending on assay:
1 – 0.01% hit rates are std. -> 100 000 compounds/day -> 10 – 1000 hits-> threshold setting is difficult!

How to judge if an assay is suitable?
91
cpd
a) generate standards using a positive and a negative control
cpd
Rea
do
ut
Rea
do
ut
Postive control Negative control
«Good assay»«Bad assay»
False positives: a lot of additional workFalse negatives: a missed opportunity
92
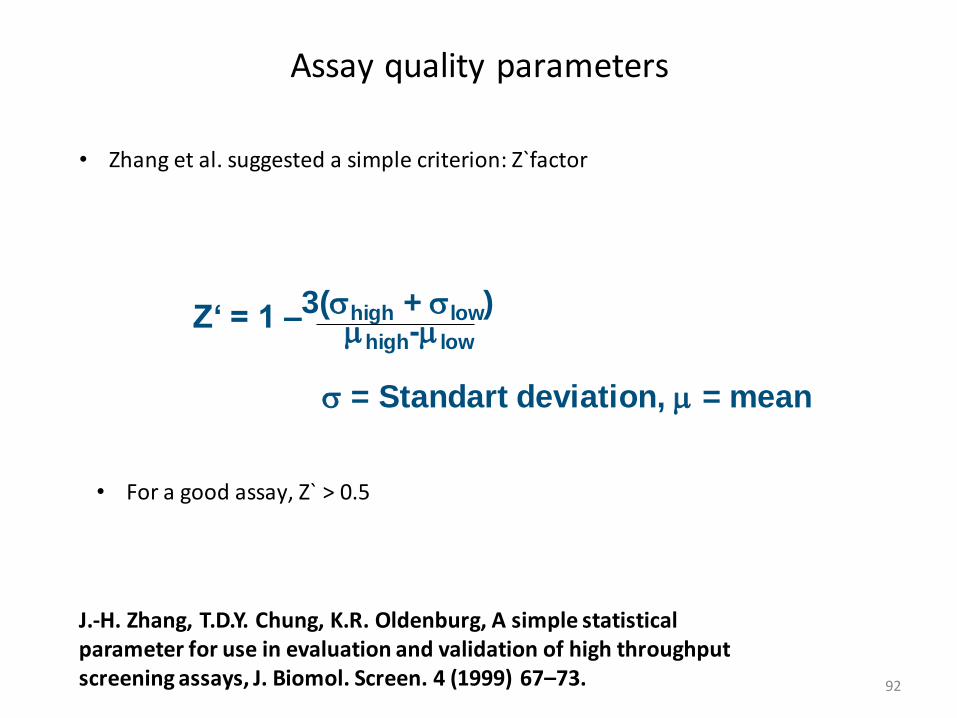
Assay quality parameters
J.-H. Zhang, T.D.Y. Chung, K.R. Oldenburg, A simple statisticalparameter for use in evaluation and validation of high throughputscreening assays, J. Biomol. Screen. 4 (1999) 67–73.
Z‘ = 1 –3(high + low)mhigh-mlow
= Standart deviation, m = mean
• Zhang et al. suggested a simple criterion: Z`factor
For a good assay, Z` > • 0.5

Basis for Z`factor = Gauss distribution
93
Histogram of negative controls
At an inhibition of > m + 3 the probability to find a positive hit is > 99 %
At the inhibition level of > m + 3 the probability for a false positive is < 1%
µ µ+ µ+3
Gaussian distribution
threshold
Inhibition

Rational for Z`factor
94
cpd
Rea
do
ut
Std. deviation 100% activity
Std. deviation 0% activity
Average pos. control
Average neg. control
Assay window
• For a good assay, the assay window must be at least 2x of (3 posC. + 3 negC.) ! • Z` = 0.5 means Assay window is exactly 2x of sum of 3x sigma posC + 3 sigma negC

Assay quality can be improved by measuring more than • 1 readout!
95
Assay quality – multiple dimensions
cpd
Rea
do
ut
Rea
do
ut 1
(e.g
in
ten
sity
cel
l nu
cleu
s)Readout 2 (e.g. Intensity cytoplasm)

Real life example of screening data
96
Time-Resolved Anisotropy (cTRA)
Neg. control
Pos. control
HTS Hits
Assay development data:
Pos. & neg. control

Fluorescence as essential detection technology in Drug Discovery
97

Fluorescent dyesA fluorescent dye = a «molecular maschine» which absorbes •
light and emits light at a higher wavelength than it takes it up (stokes shift).
Phenomenon is coupled to molecular structure. •
Pi• -electrons and «non-bonded orbitals» absorb light, molecules get «colored», but only if radiative decay occurs, fluorescence emission is seen.
-- 210-220 nm 220 nm 254 nm 280/320 320/500
98

99
Fluorescence SpectroscopyVibrational Relaxation
Absorption Fluorescence
Intersystem
Crossing
Vibrational Relaxation
Phosphorescence
T1
S1
S0
Fluorescence
Energy TransferCollisional Quenching
Chemical
Reaction
Internal Conversion
HEAT!
Intersystem Xing
Phosphorescence

14121086420
104
103
102
101
100
[time] nsec
CPM
0.0
0.2
0.4
0.6
0.8
1.0
1.2
Re
lative
In
ten
sity
300 320 340 360 380 400 420
Wavelength (nm)
A
B
C
D
E
A: Steady StateB: 2.2 nsC: 5.2 nsD: 0.68 nsE: 56 ps (10X intensity)
Steady State Fluorescence Spectroscopy
Time-resolved Fluorescence Spectroscopy
Continuous
Pulsed t1
t2
t3
t4
a1
a2
a3
a4
I(t) = I0 S . ai exp(- t/ti)
Steady State and Time-Resolved Fluorescence Spectroscopy

Advantages of fluorescence
101
• Homogeneous Mixtures of Reagents
• High Sensitivity
• True Equilibrium
• Wide Range of Solution Conditions
• Picosecond to Microsecond Timescale = Timesscale of Dynamic Events in Molecules:
– Rotational Diffusion
– Solvent Reorientation
– Energy Transfer
– Motion of Domains

Push-pull p-electron systems are particularly efficient for fluorescence
e-rich Donor(push)
e-»deficient» Akzeptor (pull)
p System
630/660 nm
102

Example: Cy5 dye
solubility
p-electron system
Attachmentpoint
103

Fluorescence wavelength change with pi-electron system
Cy5
Cy3
Ex/Em = 550nm/570Quantum yield water = 0.04
Ex/Em = 649nm/670Quantum yield water = 0.28
1
2
3
4
5
104

Important crieteria and properties
• Type of assays (Cellular, in-vitro, Intensity, Anisotropy, Lifetime)• Excitation/Emission wavelength• Solvatochromism• Solubility• Size• Cell-penetration, subcellular localization• Chemical Stability• Type of functionalization (see chapter Bioconjugation)• Price
105

Most important class of fluorescent dyes and their properties
Oxazines,small, pos. charge
CyaninesChemically sensitive
RhodaminesChemically stable, hydrophobic
Fluoresceinphotosensitive
Alexa-488Photostable, 2x negatively charged
106

Quenchers
• Have similar structural features as fluorescent dyes (extended p-system) but also contain a group which allows them to pass the energy on to the environment (solvent) without emitting photons.
Nitro group is «quenching group»
Example:
BHQ-1:
107

108
Fluorescent Labels on Biomolecules
The Many Benefits of Fluorescent Labels:
– easy to handle in standard research laboratories
(via PMT- or CCD-based detection equipment)
– relatively cheap reagent costs
(compared to radionucleotides; cf. waste disposal/containment)
– large linear dynamic range for detection
(well suited for detection)
– high sensitivity for detection
(dependent on readout technology)
– well suited for miniaturization/parallelization
(increasing importance for Pharmaceutical & Basic Research;
many examples from Systems Biology, Genomics, Proteomics, HTS)
An Important Tool in Pharmaceutical Research
109
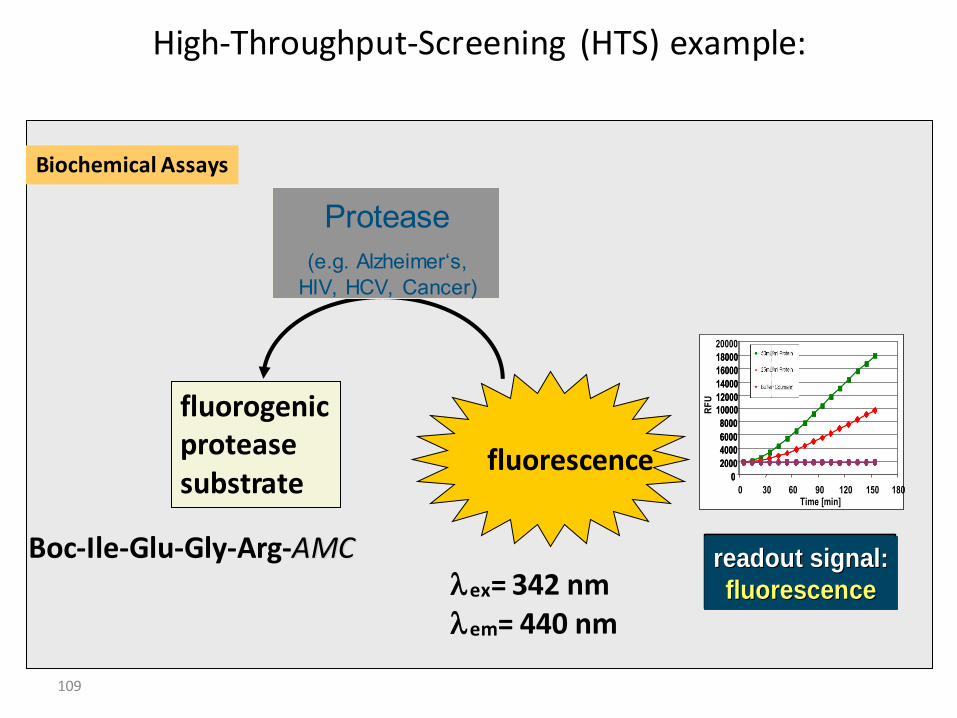
High-Throughput-Screening (HTS) example:
fluorescence
fluorogenicproteasesubstrate
Boc-Ile-Glu-Gly-Arg-AMClex= 342 nmlem= 440 nm
Protease
(e.g. Alzheimer‘s,
HIV, HCV, Cancer)
Biochemical Assays
0
2000
4000
6000
8000
10000
12000
14000
16000
18000
20000
0 30 60 90 120 150 180Time [min]
RF
U
readout signal:readout signal:
fluorescencefluorescence
0
2000
4000
6000
8000
10000
12000
14000
16000
18000
0
2000
4000
6000
8000
10000
12000
14000
16000
18000
20000
0 30 60 90 120 150 180Time [min]
RF
U
readout signal:readout signal:
fluorescencefluorescencereadout signal:readout signal:
fluorescencefluorescence

110
Figure 2. Basic principles of fluorescence-based homogenous assays for measuring protease activity. (a) Fluorescence intensity assay in which a fluorogenicgroup is linked to the carboxyl end of a peptide via an amide bond, and its fluorescence increases upon release by the action of a protease; (b) Resonance-energy-transfer-based assay in which a FRET signal can be detected when the donor and acceptor are in close proximity. The pair separates upon peptide cleavage and the FRET signal decreases; (c) Dual-label quenched-pair fluorescent assay in which the fluorescence intensity of the reporter is suppressed by the quencher because of its close proximity. The pair separates upon peptide cleavage and the fluorescence intensity from the reporter group is significantly increased; (d) Fluorescence polarization assay in which the substrate and the product give different emission polarization signals because of their different sizes (“digestive” fluorescence polarization assay) .From Protease Assays, Assay Guidance Manual Sittampalam GS, Coussens NP, Nelson H, et al.,
editors. Bethesda (MD): 2004.
Basic principles of fluorescence based protease assays

111
The fluorescence contribution comes from the entire well
AM/NFI/DERM/IMM/02/99
Interference from:
• surface interactions
• fluorescent
compounds
• light-scattering
particles
• inner-filter effect
< ~ 5 µl
AM/NFI/DERM/ALD/05/00
Detection of Fluorescence Intensity

112
Assay Interference Main Cause Fluorescence Effect Luminescence Effect
Inner Filter Effect Anything in the assay that absorbs
excitation light (e.g. buffer components,
colored compounds, biological tissues,
plates, etc.) and reduces the amount of
light that reaches a tracer, including
absorption by the tracer itself (e.g. at
high concentrations) or reduction in the
light emitted by the tracer
Fluorescence Intensity Emitted Light
Quenching Non-radiative deactivation of the excited
state of the tracerFluorescence Intensity Emitted Light
Auto-Fluorescence Anything in the assay, other than tracer,
that adds fluorescence intensity at the
assay wavelengths (e.g. buffer
components, compounds, biological
tissues, plates, etc.)
Fluorescence Intensity None
Light Scattering Turbidity resulting from particulates
(insoluble compounds, but also some
beads and cells, etc.) in the medium
Fluorescence Intensity Emitted Light
Photo Bleaching Light-induced reaction with tracer (e.g.
oxidation) resulting in loss of ability to
fluoresce or absorb light
Fluorescence Intensity None
Main Assay Interferences in Fluoro-/Luminescence