Embed Size (px)
Citation preview
DDrruugg aanndd AAllccoohhoollUUssee aanndd RReellaatteeddMMaatttteerrss AAmmoonngg
AArrrreesstteeeess
22000000
AAcckknnoowwlleeddggeemmeenntt
The methodology employed for this publication was developed for the National Institute of Justice (NIJ), Office of Justice Programs, U.S. Department of Justice by the National Opinion Research Center (NORC) at the University of Chicago. This project was supported by Contract No. 2001C-003 for the Arrestee Drug Abuse Monitoring (ADAM) program. The lead author of previous reports from which this report derives its content was Zhiwei Zhang, ADAM analytic task leader, who designed and wrote the estimation programs for all tables. The NIJ ADAM staff includes Christine Crossland (COTR), Henry Brownstein, Natalie Lu, Diana Noone, and Sandra Woerle.
OOvveerrvviieeww
The Arrestee Drug Abuse Monitoring program (ADAM) measures the extent of drug and alcohol use in the high-risk population of people who have been arrested and booked as adults in city and county detention facilities operated by local police and sheriff departments. The data are collected by civilian research teams through probability-based sampling of male arrestees and purposive sampling of female arrestees. Information is obtained from personal interviews and urinalyses obtained voluntarily and confidentially, usually on the day of arrest and always within 48 hours of arrest.
As part of this process, research teams in the participating counties interview arrestees in each facility during one- to three-week periods in each quarter of the year. Interviewers collect demographic data and ask arrestees about what drugs they use, how often they use them, and how and where they acquire illicit drugs. Other questions ask about housing situation during the past year, method of support, and health insurance. After the interview, each respondent is asked to provide a urine sample, which is then analyzed to detect drug use.
This data report presents findings from 35 ADAM sites that collected data during one or more quarters in 2000. The report covers male and female arrestees separately. The data for men cover all 35 sites; the data for women cover the 25 sites where 25 or more female interviews were completed in 2000. Each section has 14 tables organized by site location, indicating the percentage of arrestees who qualified for the listed variables. An overview of the tables on adult arrestees is as follows:
• Table 1 arrays the ADAM sites by their geographic location, number of booking facilities, and number of interviews completed in each quarter.
• Table 2 provides demographic data about ADAM interviewees.
• Table 3 displays the percentage of arrestees who tested positive for any drug or multiple use of one or more of the most commonly reported drugs or alcohol.
• Tables 4 through 8 indicate drug-specific urinalysis and market acquisition data, which encompass the percentage of arrestees who tested positive on the selected drugs, the frequency that arrestees self-reported using selected drug use, and the intensity and mode of acquiring selected drugs during periods that range up to the past year.
• Tables 9 and 10 show rates of arrestee alcohol and drug use and risk of dependence, as determined by a clinically based dependence screen.
• Tables 11 through 13 detail arrestees’ drug market participation, including failed attempts to purchase drugs.
• Finally, Table 14 displays the proportion of arrestees who reported receiving drug, alcohol, or mental health treatment in the prior year.
MMaallee AArrrreesstteeee TTaabblleess
Description of Sample Table 1. ADAM Booking Facilities, Completed Interviews, and Weighted Total
Numbers—Adult Male Arrestees, 2000
Table 2. Demographic Characteristics of Adult Male Arrestee Respondents, 2000
Drug Test Results Table 3. Urine Test Results on Any or Multiple Drug or Alcohol Use Among Adult Male
Arrestees, 2000
Drug and Alcohol Use and Acquisition Table 4. Use and Acquisition of CRACK COCAINE Among Adult Male Arrestees, 2000
Table 5. Use and Acquisition of POWDER COCAINE Among Adult Male Arrestees,
Table 7. Use and Acquisition of METHAMPHETAMINE Among Adult Male Arrestees,
2000
Table 6. Use and Acquisition of MARIJUANA Among Adult Male Arrestees, 2000
2000
Table 8. Use and Acquisition of OPIATES/HEROIN Among Adult Male Arrestees, 2000
Table 9. Heavy Drug Use and Risk for Dependence Among Adult Male Arrestees, 2000
Table 10. ALCOHOL Use and Risk for Dependence Among Adult Male Arrestees, 2000
Drug Market Behavior Table 11. Last Drug Buy with Cash Was Outdoors Among Adult Male Arrestees, 2000
Table 12. Any Failed Drug Buy in the Past 30 Days Among Adult Male Arrestees, 2000
Table 13. Failed Drug Buy Due to Police Activity Among Adult Male Arrestees, 2000
Treatment Table 14. Drug, Alcohol, and Mental Health Treatment Status Among Adult Male
Arrestees, 2000

FFeemmaallee AArrrreesstteeee TTaabblleess
Description of Sample Table 1. ADAM Booking Facilities and Completed Interviews—Adult Female Arrestees,
2000
Table 2. Demographic Characteristics of Adult Female Arrestee Respondents, 2000
Drug Test Results Table 3. Urine Test Results on Any or Multiple Drug or Alcohol Use Among Adult
Female Arrestees, 2000
Drug and Alcohol Use and Acquisition Table 4. Use and Acquisition of CRACK COCAINE Among Adult Female Arrestees,
2000
Table 5. Use and Acquisition of POWDER COCAINE Among Adult Female Arrestees,
Table 7. Use and Acquisition of METHAMPHETAMINE Among Adult Female
2000
Table 6. Use and Acquisition of MARIJUANA Among Adult Female Arrestees, 2000
Arrestees, 2000
Table 8. Use and Acquisition of OPIATES/HEROIN Among Adult Female Arrestees, 2000
Table 9. Heavy Drug Use and Risk for Dependence Among Adult Female Arrestees,2000
Table 10. ALCOHOL Use and Risk for Dependence Among Adult Female Arrestees, 2000
Drug Market Behavior Table 11. Last Drug Buy with Cash Was Outdoors Among Adult Female Arrestees, 2000
Table 12. Any Failed Drug Buy in the Past 30 Days Among Adult Female Arrestees,2000
Table 13. Failed Drug Buy Due to Police Activity Among Adult Female Arrestees, 2000
Treatment Table 14. Drug, Alcohol, and Mental Health Treatment Status Among Adult Female
Arrestees, 2000
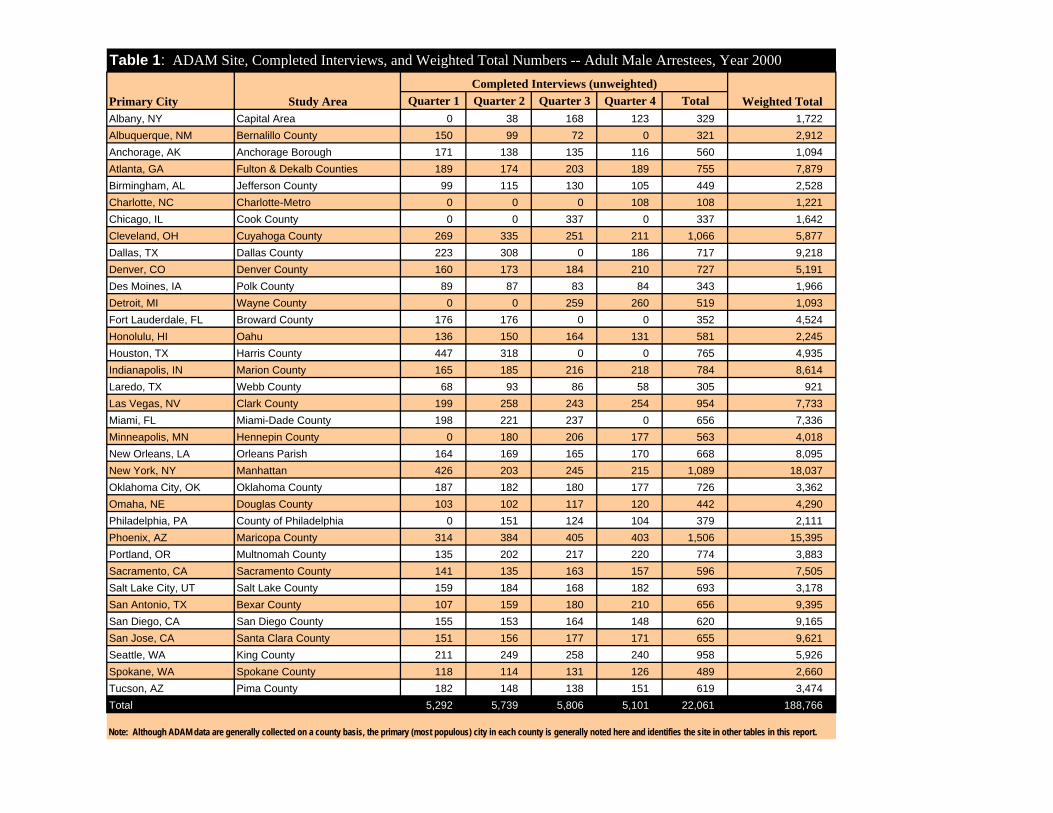
Table 1: ADAM Site, Completed Interviews, and Weighted Total Numbers -- Adult Male Arrestees, Year 2000
Primary City Study Area Completed Interviews (unweighted)
Weighted TotalQuarter 1 Quarter 2 Quarter 3 Quarter 4 Total Albany, NY Capital Area 0 38 168 123 329 1,722 Albuquerque, NM Bernalillo County 150 99 72 0 321 2,912 Anchorage, AK Anchorage Borough 171 138 135 116 560 1,094 Atlanta, GA Fulton & Dekalb Counties 189 174 203 189 755 7,879 Birmingham, AL Jefferson County 99 115 130 105 449 2,528 Charlotte, NC Charlotte-Metro 0 0 0 108 108 1,221 Chicago, IL Cook County 0 0 337 0 337 1,642 Cleveland, OH Cuyahoga County 269 335 251 211 1,066 5,877 Dallas, TX Dallas County 223 308 0 186 717 9,218 Denver, CO Denver County 160 173 184 210 727 5,191 Des Moines, IA Polk County 89 87 83 84 343 1,966 Detroit, MI Wayne County 0 0 259 260 519 1,093 Fort Lauderdale, FL Broward County 176 176 0 0 352 4,524 Honolulu, HI Oahu 136 150 164 131 581 2,245 Houston, TX Harris County 447 318 0 0 765 4,935 Indianapolis, IN Marion County 165 185 216 218 784 8,614 Laredo, TX Webb County 68 93 86 58 305 921 Las Vegas, NV Clark County 199 258 243 254 954 7,733 Miami, FL Miami-Dade County 198 221 237 0 656 7,336 Minneapolis, MN Hennepin County 0 180 206 177 563 4,018 New Orleans, LA Orleans Parish 164 169 165 170 668 8,095 New York, NY Manhattan 426 203 245 215 1,089 18,037 Oklahoma City, OK Oklahoma County 187 182 180 177 726 3,362 Omaha, NE Douglas County 103 102 117 120 442 4,290 Philadelphia, PA County of Philadelphia 0 151 124 104 379 2,111 Phoenix, AZ Maricopa County 314 384 405 403 1,506 15,395 Portland, OR Multnomah County 135 202 217 220 774 3,883 Sacramento, CA Sacramento County 141 135 163 157 596 7,505 Salt Lake City, UT Salt Lake County 159 184 168 182 693 3,178 San Antonio, TX Bexar County 107 159 180 210 656 9,395 San Diego, CA San Diego County 155 153 164 148 620 9,165 San Jose, CA Santa Clara County 151 156 177 171 655 9,621 Seattle, WA King County 211 249 258 240 958 5,926 Spokane, WA Spokane County 118 114 131 126 489 2,660 Tucson, AZ Pima County 182 148 138 151 619 3,474 Total 5,292 5,739 5,806 5,101 22,061 188,766
Note: Although ADAM data are generally collected on a county basis, the primary (most populous) city in each county is generally noted here and identifies the site in other tables in this report.

Table 2: Demographic Characteristics of Adult Male Arrestee Respondents, 2000 (Weighted To Represent Booked Arrestees*)
Primary City Mean Age
Race/Ethnicity (%)
Employed (%)
High School Diploma or GED (%)
Prior Arrests (%)** Health Insurance,
Past Year (%)
Stable Housing, Past 30 Days (%)Hispanic
Non-Hispanic Ever
Past Year White Black Other 1+ times 2+ times
Albany, NY 31.6 11.9 44.0 37.9 6.2 61.5 70.2 77.0 50.3 17.6 42.6 89.6 Albuquerque, NM 32.0 60.2 16.4 8.1 15.3 69.2 75.8 81.8 54.2 22.3 33.8 87.0 Anchorage, AK 32.8 8.0 41.3 12.5 38.2 52.6 80.3 87.6 51.6 16.6 35.6 74.5 Atlanta, GA 34.2 3.8 9.8 84.1 2.3 66.0 68.2 82.6 51.3 22.7 42.7 79.4 Birmingham, AL 31.1 2.9 21.5 75.2 0.4 64.9 66.6 84.3 51.2 16.8 46.1 93.1 Charlotte, NC 27.6 10.7 22.4 64.5 2.4 60.9 67.3 78.3 58.1 25.5 39.6 79.9 Chicago, IL 30.3 15.9 10.8 72.1 1.1 59.6 60.6 61.8 35.6 14.1 38.6 92.5 Cleveland, OH 32.0 5.8 19.5 71.9 2.8 63.8 66.5 82.6 43.5 12.3 41.5 93.1 Dallas, TX 29.7 28.6 23.8 44.2 3.4 69.6 65.2 80.9 49.2 16.2 24.9 90.4 Denver, CO 32.6 42.2 22.3 25.6 10.0 67.5 65.9 84.9 60.9 31.1 32.1 76.0 Des Moines, IA 31.9 8.3 58.7 25.8 7.1 63.2 75.9 82.4 51.4 24.5 39.7 85.6 Detroit, MI 30.3 2.8 13.9 77.2 6.1 65.6 68.2 82.4 47.6 16.2 49.8 94.4 Fort Lauderdale, FL 32.2 16.7 34.6 41.8 6.9 74.9 65.1 77.3 42.7 15.1 43.3 88.9 Honolulu, HI 33.2 15.4 21.7 3.3 59.6 48.6 81.1 82.1 46.8 22.8 49.3 75.0 Houston, TX 29.3 33.4 18.4 44.4 3.7 74.3 66.2 77.9 46.9 16.7 37.4 89.8 Indianapolis, IN 32.1 5.5 38.4 51.6 4.5 59.9 57.9 86.4 55.2 22.1 40.2 90.6 Laredo, TX 29.9 95.8 2.5 0.5 1.2 65.5 46.4 72.1 41.2 9.7 30.7 94.7 Las Vegas, NV 33.0 20.0 42.5 24.3 13.3 65.7 76.0 84.0 53.7 24.4 34.3 81.6 Miami, FL 32.2 41.1 10.7 44.1 4.1 66.6 65.9 77.6 48.9 19.8 36.4 87.8 Minneapolis, MN 29.4 8.1 29.8 49.7 12.4 58.0 74.4 84.3 58.0 27.0 48.3 84.5 New Orleans, LA 29.6 0.9 12.7 84.8 1.6 61.5 50.7 86.3 58.7 24.8 39.1 93.8 New York, NY 32.8 31.2 9.0 56.7 3.1 44.9 60.3 84.5 53.1 18.2 41.8 85.2 Oklahoma City, OK 31.9 6.0 47.7 33.7 12.6 71.7 75.4 84.6 51.0 18.9 35.4 90.5 Omaha, NE 30.2 12.9 38.8 41.9 6.4 77.3 76.3 79.0 46.8 12.0 42.9 93.1 Philadelphia, PA 31.2 10.3 15.9 69.1 4.7 54.2 71.5 67.5 35.8 12.0 45.9 93.1 Phoenix, AZ 32.0 36.3 41.7 10.8 11.2 69.4 67.4 85.6 55.5 23.0 35.7 83.1 Portland, OR 33.3 8.6 58.2 22.3 10.9 51.3 73.0 86.6 55.4 27.0 48.4 74.8 Sacramento, CA 33.6 20.7 35.1 32.0 12.2 53.2 75.4 90.6 55.7 21.5 39.3 82.5 Salt Lake City, UT 30.9 26.2 57.6 4.7 11.6 69.7 64.3 84.8 59.4 27.9 30.9 85.8 San Antonio, TX 30.0 67.9 17.1 13.6 1.5 69.4 67.2 74.9 45.6 20.1 34.9 89.6 San Diego, CA 33.2 38.6 31.2 19.8 10.5 60.5 76.6 83.0 43.4 14.6 35.2 76.3 San Jose, CA 32.0 43.7 28.9 12.3 15.1 68.8 79.3 78.4 45.8 18.2 38.8 82.4 Seattle, WA 32.3 14.7 44.1 22.9 18.4 60.8 79.0 88.9 56.9 24.0 40.5 77.2 Spokane, WA 31.9 6.7 67.5 10.0 15.7 52.8 77.6 88.9 56.9 24.9 40.5 86.6 Tucson, AZ 32.0 42.1 38.8 9.5 9.6 64.0 67.3 86.8 49.0 18.8 39.5 81.5 Median 32.0 15.4 28.9 33.7 6.9 64.0 68.2 82.6 51.2 19.8 39.5 86.6 * All estimations in this table and subsequent tables are weighted to represent booked arrested men. ** Does not include arrests as a juvenile.
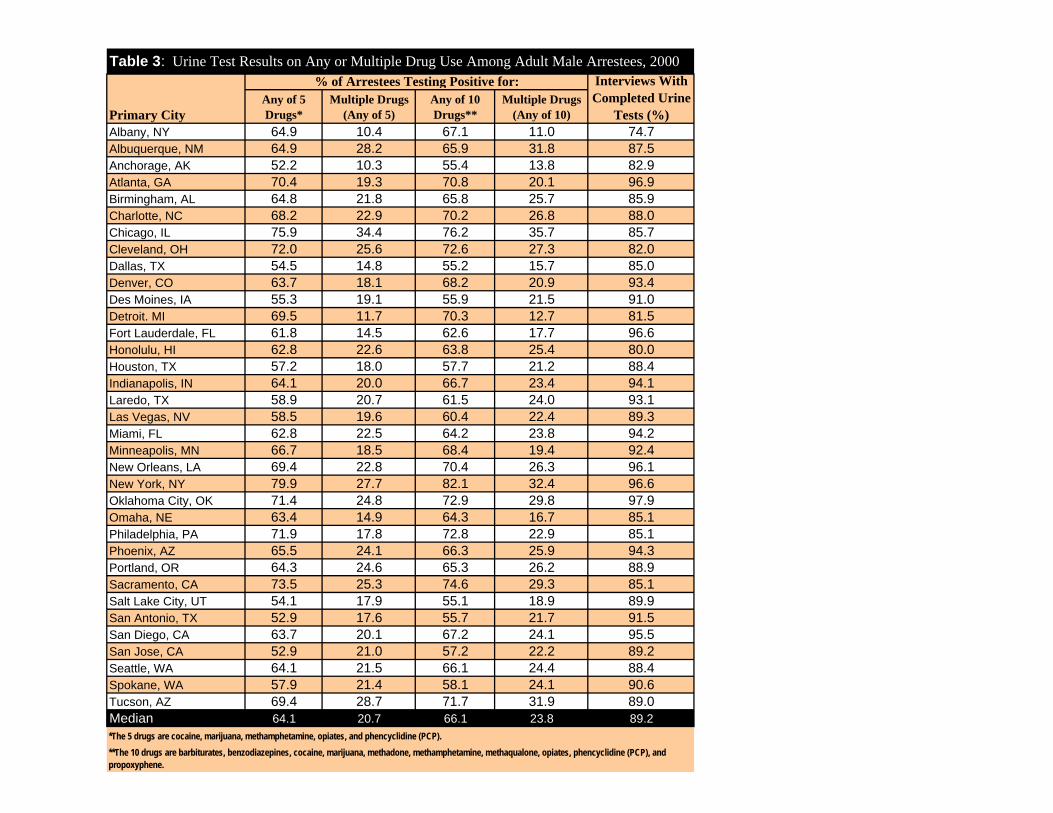
Table 3: Urine Test Results on Any or Multiple Drug Use Among Adult Male Arrestees, 2000
Primary City
% of Arrestees Testing Positive for: Interviews With Completed Urine
Tests (%) Any of 5 Drugs*
Multiple Drugs (Any of 5)
Any of 10 Drugs**
Multiple Drugs (Any of 10)
Albany, NY 64.9 10.4 67.1 11.0 74.7 Albuquerque, NM 64.9 28.2 65.9 31.8 87.5 Anchorage, AK 52.2 10.3 55.4 13.8 82.9 Atlanta, GA 70.4 19.3 70.8 20.1 96.9 Birmingham, AL 64.8 21.8 65.8 25.7 85.9 Charlotte, NC 68.2 22.9 70.2 26.8 88.0 Chicago, IL 75.9 34.4 76.2 35.7 85.7 Cleveland, OH 72.0 25.6 72.6 27.3 82.0 Dallas, TX 54.5 14.8 55.2 15.7 85.0 Denver, CO 63.7 18.1 68.2 20.9 93.4 Des Moines, IA 55.3 19.1 55.9 21.5 91.0 Detroit. MI 69.5 11.7 70.3 12.7 81.5 Fort Lauderdale, FL 61.8 14.5 62.6 17.7 96.6 Honolulu, HI 62.8 22.6 63.8 25.4 80.0 Houston, TX 57.2 18.0 57.7 21.2 88.4 Indianapolis, IN 64.1 20.0 66.7 23.4 94.1 Laredo, TX 58.9 20.7 61.5 24.0 93.1 Las Vegas, NV 58.5 19.6 60.4 22.4 89.3 Miami, FL 62.8 22.5 64.2 23.8 94.2 Minneapolis, MN 66.7 18.5 68.4 19.4 92.4 New Orleans, LA 69.4 22.8 70.4 26.3 96.1 New York, NY 79.9 27.7 82.1 32.4 96.6 Oklahoma City, OK 71.4 24.8 72.9 29.8 97.9 Omaha, NE 63.4 14.9 64.3 16.7 85.1 Philadelphia, PA 71.9 17.8 72.8 22.9 85.1 Phoenix, AZ 65.5 24.1 66.3 25.9 94.3 Portland, OR 64.3 24.6 65.3 26.2 88.9 Sacramento, CA 73.5 25.3 74.6 29.3 85.1 Salt Lake City, UT 54.1 17.9 55.1 18.9 89.9 San Antonio, TX 52.9 17.6 55.7 21.7 91.5 San Diego, CA 63.7 20.1 67.2 24.1 95.5 San Jose, CA 52.9 21.0 57.2 22.2 89.2 Seattle, WA 64.1 21.5 66.1 24.4 88.4 Spokane, WA 57.9 21.4 58.1 24.1 90.6 Tucson, AZ 69.4 28.7 71.7 31.9 89.0 Median 64.1 20.7 66.1 23.8 89.2
**The 10 drugs are barbiturates, benzodiazepines, cocaine, marijuana, methadone, methamphetamine, methaqualone, opiates, phencyclidine (PCP), and propoxyphene.
*The 5 drugs are cocaine, marijuana, methamphetamine, opiates, and phencyclidine (PCP).
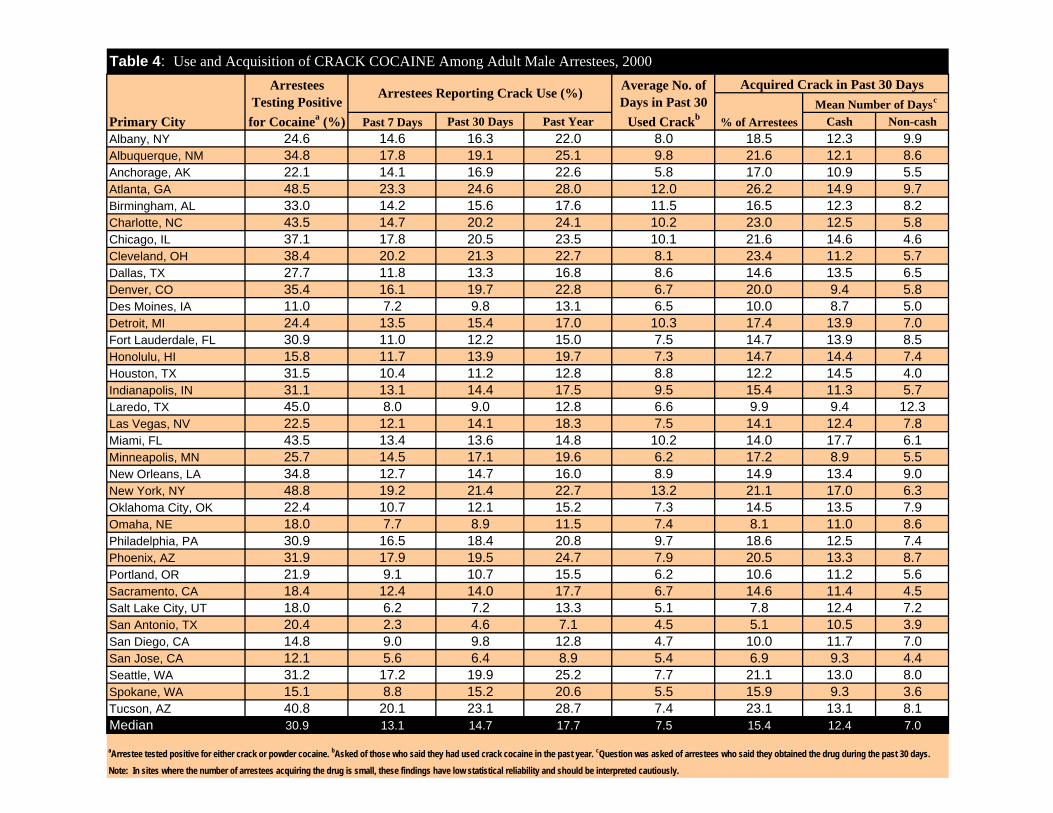
Table 4: Use and Acquisition of CRACK COCAINE Among Adult Male Arrestees, 2000
Primary City
Arrestees Testing Positive for Cocainea (%)
Arrestees Reporting Crack Use (%) Average No. of Days in Past 30
Used Crackb
Acquired Crack in Past 30 Days
% of Arrestees Mean Number of Daysc
Past 7 Days Past 30 Days Past Year Cash Non-cash Albany, NY 24.6 14.6 16.3 22.0 8.0 18.5 12.3 9.9 Albuquerque, NM 34.8 17.8 19.1 25.1 9.8 21.6 12.1 8.6 Anchorage, AK 22.1 14.1 16.9 22.6 5.8 17.0 10.9 5.5 Atlanta, GA 48.5 23.3 24.6 28.0 12.0 26.2 14.9 9.7 Birmingham, AL 33.0 14.2 15.6 17.6 11.5 16.5 12.3 8.2 Charlotte, NC 43.5 14.7 20.2 24.1 10.2 23.0 12.5 5.8 Chicago, IL 37.1 17.8 20.5 23.5 10.1 21.6 14.6 4.6 Cleveland, OH 38.4 20.2 21.3 22.7 8.1 23.4 11.2 5.7 Dallas, TX 27.7 11.8 13.3 16.8 8.6 14.6 13.5 6.5 Denver, CO 35.4 16.1 19.7 22.8 6.7 20.0 9.4 5.8 Des Moines, IA 11.0 7.2 9.8 13.1 6.5 10.0 8.7 5.0 Detroit, MI 24.4 13.5 15.4 17.0 10.3 17.4 13.9 7.0 Fort Lauderdale, FL 30.9 11.0 12.2 15.0 7.5 14.7 13.9 8.5 Honolulu, HI 15.8 11.7 13.9 19.7 7.3 14.7 14.4 7.4 Houston, TX 31.5 10.4 11.2 12.8 8.8 12.2 14.5 4.0 Indianapolis, IN 31.1 13.1 14.4 17.5 9.5 15.4 11.3 5.7 Laredo, TX 45.0 8.0 9.0 12.8 6.6 9.9 9.4 12.3 Las Vegas, NV 22.5 12.1 14.1 18.3 7.5 14.1 12.4 7.8 Miami, FL 43.5 13.4 13.6 14.8 10.2 14.0 17.7 6.1 Minneapolis, MN 25.7 14.5 17.1 19.6 6.2 17.2 8.9 5.5 New Orleans, LA 34.8 12.7 14.7 16.0 8.9 14.9 13.4 9.0 New York, NY 48.8 19.2 21.4 22.7 13.2 21.1 17.0 6.3 Oklahoma City, OK 22.4 10.7 12.1 15.2 7.3 14.5 13.5 7.9 Omaha, NE 18.0 7.7 8.9 11.5 7.4 8.1 11.0 8.6 Philadelphia, PA 30.9 16.5 18.4 20.8 9.7 18.6 12.5 7.4 Phoenix, AZ 31.9 17.9 19.5 24.7 7.9 20.5 13.3 8.7 Portland, OR 21.9 9.1 10.7 15.5 6.2 10.6 11.2 5.6 Sacramento, CA 18.4 12.4 14.0 17.7 6.7 14.6 11.4 4.5 Salt Lake City, UT 18.0 6.2 7.2 13.3 5.1 7.8 12.4 7.2 San Antonio, TX 20.4 2.3 4.6 7.1 4.5 5.1 10.5 3.9 San Diego, CA 14.8 9.0 9.8 12.8 4.7 10.0 11.7 7.0 San Jose, CA 12.1 5.6 6.4 8.9 5.4 6.9 9.3 4.4 Seattle, WA 31.2 17.2 19.9 25.2 7.7 21.1 13.0 8.0 Spokane, WA 15.1 8.8 15.2 20.6 5.5 15.9 9.3 3.6 Tucson, AZ 40.8 20.1 23.1 28.7 7.4 23.1 13.1 8.1 Median 30.9 13.1 14.7 17.7 7.5 15.4 12.4 7.0
aArrestee tested positive for either crack or powder cocaine. bAsked of those who said they had used crack cocaine in the past year. cQuestion was asked of arrestees who said they obtained the drug during the past 30 days.
Note: In sites where the number of arrestees acquiring the drug is small, these findings have low statistical reliability and should be interpreted cautiously.

Table 5: Use and Acquisition of POWDER COCAINE Among Adult Male Arrestees, 2000
Primary City
Arrestees Testing Positive for Cocainea (%)
Arrestees Reporting Powder Cocaine Use (%)
Average No. of Days in Past 30 Used Powder
Cocaineb
Acquired Powder Cocaine in Past 30 Days
% of Arrestees
Mean Number of Daysc
Past 7 Days Past 30 Days Past Year Cash Non-cash Albany, NY 24.6 5.0 7.4 11.4 2.9 9.5 8.4 6.2 Albuquerque, NM 34.8 11.6 18.0 24.9 4.8 19.0 6.2 3.5 Anchorage, AK 22.1 7.4 11.7 19.2 3.1 13.6 6.1 3.9 Atlanta, GA 48.5 7.3 8.9 12.6 7.2 9.5 10.3 4.3 Birmingham, AL 33.0 4.1 5.9 9.0 4.8 6.4 5.2 4.3 Charlotte, NC 43.5 9.8 12.1 27.3 4.4 14.6 7.6 4.4 Chicago, IL 37.1 3.9 5.2 7.0 3.8 5.4 2.8 3.1 Cleveland, OH 38.4 5.1 6.8 9.2 5.1 7.3 4.8 2.3 Dallas, TX 27.7 9.2 11.3 17.5 4.5 12.3 8.5 2.6 Denver, CO 35.4 10.3 12.5 18.5 3.7 13.0 7.4 2.9 Des Moines, IA 11.0 2.9 5.4 8.6 3.1 5.0 1.7 1.4 Detroit, MI 24.4 2.6 3.6 6.2 5.2 4.4 4.2 4.0 Fort Lauderdale, FL 30.9 10.6 13.8 16.9 4.4 14.5 7.9 3.3 Honolulu, HI 15.8 3.3 5.5 10.1 4.5 6.8 7.9 4.7 Houston, TX 31.5 4.9 7.0 10.0 3.8 8.3 4.3 1.7 Indianapolis, IN 31.1 4.6 8.4 11.1 4.3 9.3 5.7 2.6 Laredo, TX 45.0 28.7 33.9 39.3 5.7 35.1 8.6 5.6 Las Vegas, NV 22.5 6.0 8.6 13.2 4.7 8.7 10.1 4.5 Miami, FL 43.5 15.3 17.9 22.6 7.0 18.1 10.6 5.4 Minneapolis, MN 25.7 5.4 8.2 13.3 2.5 8.5 2.6 2.5 New Orleans, LA 34.8 7.7 9.2 11.9 6.3 9.6 10.1 6.2 New York, NY 48.8 14.7 16.7 19.2 9.3 16.5 12.5 2.6 Oklahoma City, OK 22.4 5.2 7.2 11.8 4.2 8.2 6.9 3.9 Omaha, NE 18.0 2.8 5.1 8.5 3.0 4.3 3.8 2.4 Philadelphia, PA 30.9 5.3 7.1 9.7 6.5 7.8 11.1 10.4 Phoenix, AZ 31.9 10.3 13.8 20.7 4.8 14.5 7.5 4.6 Portland, OR 21.9 5.9 7.8 11.4 4.6 8.4 9.2 4.4 Sacramento, CA 18.4 1.8 3.2 4.5 4.5 3.6 4.2 2.9 Salt Lake City, UT 18.0 9.3 12.0 20.8 3.5 13.4 6.6 3.6 San Antonio, TX 20.4 8.0 12.4 20.7 5.6 13.0 9.6 3.1 San Diego, CA 14.8 3.2 5.8 11.2 1.6 7.2 3.7 3.8 San Jose, CA 12.1 3.0 5.6 12.9 2.4 5.9 3.1 2.1 Seattle, WA 31.2 9.5 12.1 18.1 4.1 14.1 6.2 3.5 Spokane, WA 15.1 6.4 12.3 18.7 3.8 13.7 6.2 3.0 Tucson, AZ 40.8 20.9 26.4 35.9 4.3 28.7 7.5 4.2 Median 30.9 6.0 8.6 12.9 4.4 9.5 6.9 3.6
aArrestee tested positive for either crack or powder cocaine. bAsked of those who said they had used powder cocaine in the past year. cQuestion was asked of arrestees who said they obtained the drug during the past 30 days.
Note: In sites where the number of arrestees acquiring the drug is small, these findings have low statistical reliability and should be interpreted cautiously.
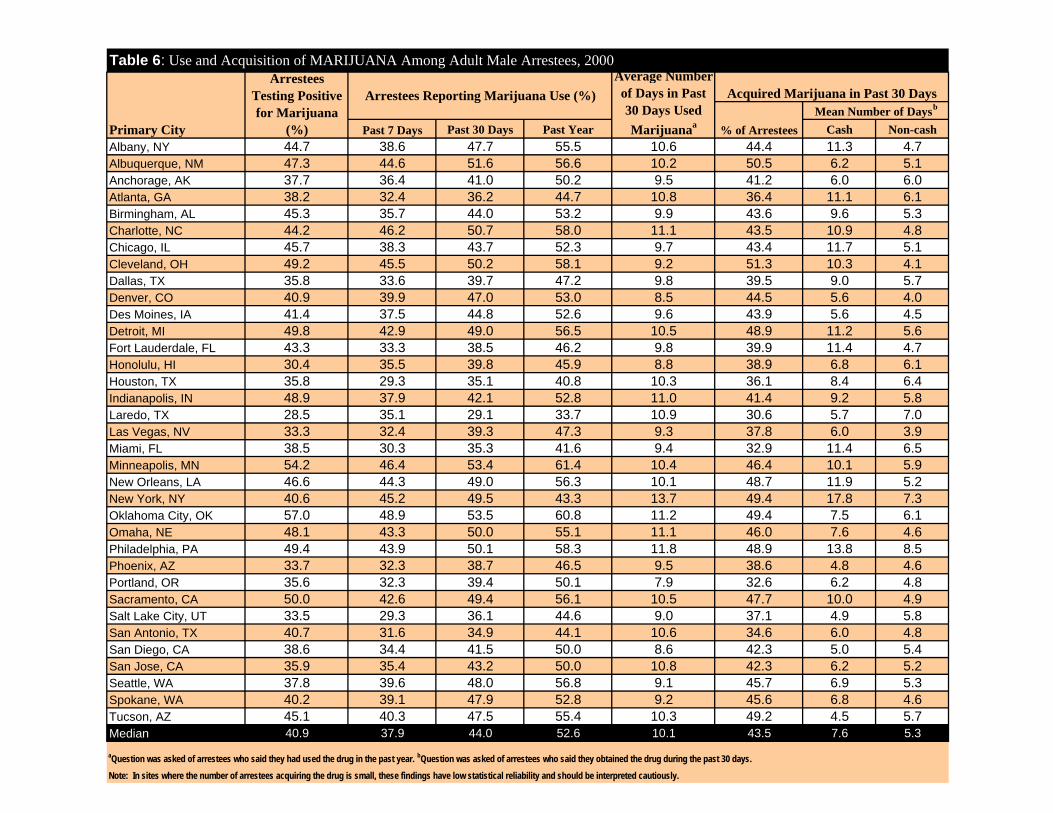
Table 6: Use and Acquisition of MARIJUANA Among Adult Male Arrestees, 2000
Primary City
Arrestees Testing Positive for Marijuana
(%)
Arrestees Reporting Marijuana Use (%) Average Number of Days in Past 30 Days Used Marijuanaa
Acquired Marijuana in Past 30 Days
% of Arrestees Mean Number of Daysb
Past 7 Days Past 30 Days Past Year Cash Non-cash Albany, NY 44.7 38.6 47.7 55.5 10.6 44.4 11.3 4.7 Albuquerque, NM 47.3 44.6 51.6 56.6 10.2 50.5 6.2 5.1 Anchorage, AK 37.7 36.4 41.0 50.2 9.5 41.2 6.0 6.0 Atlanta, GA 38.2 32.4 36.2 44.7 10.8 36.4 11.1 6.1 Birmingham, AL 45.3 35.7 44.0 53.2 9.9 43.6 9.6 5.3 Charlotte, NC 44.2 46.2 50.7 58.0 11.1 43.5 10.9 4.8 Chicago, IL 45.7 38.3 43.7 52.3 9.7 43.4 11.7 5.1 Cleveland, OH 49.2 45.5 50.2 58.1 9.2 51.3 10.3 4.1 Dallas, TX 35.8 33.6 39.7 47.2 9.8 39.5 9.0 5.7 Denver, CO 40.9 39.9 47.0 53.0 8.5 44.5 5.6 4.0 Des Moines, IA 41.4 37.5 44.8 52.6 9.6 43.9 5.6 4.5 Detroit, MI 49.8 42.9 49.0 56.5 10.5 48.9 11.2 5.6 Fort Lauderdale, FL 43.3 33.3 38.5 46.2 9.8 39.9 11.4 4.7 Honolulu, HI 30.4 35.5 39.8 45.9 8.8 38.9 6.8 6.1 Houston, TX 35.8 29.3 35.1 40.8 10.3 36.1 8.4 6.4 Indianapolis, IN 48.9 37.9 42.1 52.8 11.0 41.4 9.2 5.8 Laredo, TX 28.5 35.1 29.1 33.7 10.9 30.6 5.7 7.0 Las Vegas, NV 33.3 32.4 39.3 47.3 9.3 37.8 6.0 3.9 Miami, FL 38.5 30.3 35.3 41.6 9.4 32.9 11.4 6.5 Minneapolis, MN 54.2 46.4 53.4 61.4 10.4 46.4 10.1 5.9 New Orleans, LA 46.6 44.3 49.0 56.3 10.1 48.7 11.9 5.2 New York, NY 40.6 45.2 49.5 43.3 13.7 49.4 17.8 7.3 Oklahoma City, OK 57.0 48.9 53.5 60.8 11.2 49.4 7.5 6.1 Omaha, NE 48.1 43.3 50.0 55.1 11.1 46.0 7.6 4.6 Philadelphia, PA 49.4 43.9 50.1 58.3 11.8 48.9 13.8 8.5 Phoenix, AZ 33.7 32.3 38.7 46.5 9.5 38.6 4.8 4.6 Portland, OR 35.6 32.3 39.4 50.1 7.9 32.6 6.2 4.8 Sacramento, CA 50.0 42.6 49.4 56.1 10.5 47.7 10.0 4.9 Salt Lake City, UT 33.5 29.3 36.1 44.6 9.0 37.1 4.9 5.8 San Antonio, TX 40.7 31.6 34.9 44.1 10.6 34.6 6.0 4.8 San Diego, CA 38.6 34.4 41.5 50.0 8.6 42.3 5.0 5.4 San Jose, CA 35.9 35.4 43.2 50.0 10.8 42.3 6.2 5.2 Seattle, WA 37.8 39.6 48.0 56.8 9.1 45.7 6.9 5.3 Spokane, WA 40.2 39.1 47.9 52.8 9.2 45.6 6.8 4.6 Tucson, AZ 45.1 40.3 47.5 55.4 10.3 49.2 4.5 5.7 Median 40.9 37.9 44.0 52.6 10.1 43.5 7.6 5.3
aQuestion was asked of arrestees who said they had used the drug in the past year. bQuestion was asked of arrestees who said they obtained the drug during the past 30 days.
Note: In sites where the number of arrestees acquiring the drug is small, these findings have low statistical reliability and should be interpreted cautiously.

Table 7: Use and Acquisition of METHAMPHETAMINE Among Adult Male Arrestees, 2000
Primary City
Arrestees Testing Positive
for Methamphetamine (%)
Arrestees Reporting Methamphetamine Use (%)
Avg. No. of Days in Past 30 Days Used Metham
phetaminea
Acquired Methamphetamine in Past 30 Days
% of Arrestees Mean Number of Daysb
Past 7 Days Past 30 Days Past Year Cash Non-cash Albany, NY 0.0 0.7 0.8 1.4 16.2 0.8 0.0 1.4 Albuquerque, NM 4.7 4.3 6.3 10.8 4.4 7.4 6.0 9.2 Anchorage, AK 0.2 1.1 2.5 4.9 4.5 2.2 6.0 6.3 Atlanta, GA 0.5 0.5 0.7 0.8 9.1 0.6 25.8 4.7 Birmingham, AL 0.2 0.0 0.0 0.3 0.5 0.1 0.0 0.0 Charlotte, NC 1.4 0.6 0.6 2.5 4.3 0.6 20.0 20.0 Chicago, IL 0.0 0.0 0.3 0.3 1.3 0.2 1.0 0.0 Cleveland, OH 0.1 0.3 0.5 0.7 2.9 0.5 5.8 4.2 Dallas, TX 2.1 1.7 2.6 4.1 6.2 3.0 12.6 7.5 Denver, CO 2.6 2.9 4.2 5.2 3.8 3.9 2.5 3.2 Des Moines, IA 18.6 17.8 21.2 24.7 7.7 21.0 7.0 6.0 Detroit, MI 0.0 0.5 0.5 0.7 15.0 0.2 10.0 5.0 Fort Lauderdale, FL 0.0 0.0 0.0 0.0 0.0 0.0 0.0 0.0 Honolulu, HI 35.9 27.3 32.2 37.0 10.6 31.6 10.0 8.2 Houston, TX 0.5 1.3 1.4 2.6 2.0 1.6 2.4 1.5 Indianapolis, IN 0.7 0.7 1.3 2.5 2.3 1.7 1.9 1.4 Laredo, TX 0.0 0.3 0.3 0.7 2.4 0.5 0.0 2.0 Las Vegas, NV 17.8 16.6 19.5 26.4 8.2 18.7 8.6 5.1 Miami, FL 0.0 0.3 0.3 0.9 3.5 0.4 2.6 0.0 Minneapolis, MN 1.6 2.2 4.0 6.5 3.7 3.5 1.9 1.5 New Orleans, LA 0.2 0.2 0.3 0.5 8.7 0.3 19.0 0.0 New York, NY 0.0 0.0 0.2 0.3 3.2 0.2 0.0 0.0 Oklahoma City, OK 11.3 9.1 12.1 16.7 6.9 12.0 8.8 7.5 Omaha, NE 11.0 8.6 9.9 11.7 12.9 9.7 12.1 8.3 Philadelphia, PA 0.0 0.2 0.5 2.1 3.3 0.5 6.0 11.6 Phoenix, AZ 19.1 17.2 20.1 23.7 9.9 20.3 10.4 7.7 Portland, OR 21.4 18.4 20.4 26.0 7.9 19.2 8.0 5.8 Sacramento, CA 29.3 21.0 24.7 29.6 9.2 24.7 9.9 6.1 Salt Lake City, UT 17.1 14.9 18.6 26.2 8.2 18.5 8.1 8.0 San Antonio, TX 0.2 0.5 2.9 4.4 4.4 3.0 4.0 1.1 San Diego, CA 26.3 21.0 24.7 31.4 7.1 26.1 8.8 4.4 San Jose, CA 21.5 17.0 23.2 31.1 7.2 24.3 4.8 4.0 Seattle, WA 9.2 8.4 11.2 17.2 6.5 10.5 7.7 6.7 Spokane, WA 20.4 19.5 25.0 31.0 8.3 25.6 8.0 6.0 Tucson, AZ 6.9 7.4 10.3 15.2 7.6 10.0 6.9 6.8 Median 1.6 1.7 2.9 4.9 6.5 3.0 6.9 5.0 aQuestion was asked of arrestees who said they had used the drug in the past year. bQuestion was asked of arrestees who said they obtained the drug during the past 30 days. Note: In sites where the number of arrestees acquiring the drug is small, these findings have low statistical reliability and should be interpreted cautiously.

Table 8: Use and Acquisition of HEROIN Among Adult Male Arrestees, 2000
Primary City
Arrestees Testing Positive for Opiates (%)
Arrestees Reporting Heroin Use (%) Average No. of Days in Past 30
Days Used Heroina
Acquired Heroin in Past 30 Days
% of Arrestees
Mean Number of Daysb
Past 7 Days Past 30 Days Past Year Cash Non-cash Albany, NY 6.5 3.0 3.1 4.4 11.6 3.7 17.0 2.8 Albuquerque, NM 11.7 10.8 12.2 15.3 9.9 13.4 16.5 8.8 Anchorage, AK 3.5 0.7 1.4 2.7 5.3 1.0 14.2 2.0 Atlanta, GA 2.8 1.4 1.5 1.9 11.9 1.9 20.5 7.8 Birmingham, AL 10.2 1.2 1.2 1.4 17.5 1.3 26.5 17.8 Charlotte, NC 1.9 0.0 0.0 1.2 0.3 0.0 0.0 0.0 Chicago, IL 27.0 21.3 23.1 24.9 15.9 24.2 22.2 7.8 Cleveland, OH 3.7 3.9 4.2 4.8 8.9 4.5 14.3 2.7 Dallas, TX 3.0 2.6 2.8 3.9 9.6 3.2 20.9 4.4 Denver, CO 3.4 2.8 3.0 5.2 7.9 3.3 15.2 4.8 Des Moines, IA 2.7 0.5 0.5 1.0 11.8 0.5 5.0 4.0 Detroit, MI 7.8 6.2 6.7 7.0 14.8 7.5 20.7 8.8 Fort Lauderdale, FL 2.1 0.9 0.9 1.6 5.5 0.9 17.9 2.0 Honolulu, HI 6.8 5.9 6.5 8.6 11.2 6.6 23.2 4.0 Houston, TX 7.4 0.5 0.8 1.9 9.0 1.3 6.8 1.0 Indianapolis, IN 3.4 0.9 1.4 1.9 11.9 2.0 12.7 6.5 Laredo, TX 9.9 7.5 8.8 11.5 11.8 9.1 23.1 7.6 Las Vegas, NV 4.8 3.1 4.4 5.8 8.5 4.5 16.3 4.1 Miami, FL 4.0 3.6 4.2 4.7 13.1 4.2 24.6 4.1 Minneapolis, MN 3.0 1.8 2.4 4.1 6.5 2.6 13.7 8.3 New Orleans, LA 15.5 12.7 13.7 14.6 12.0 13.5 20.3 5.9 New York, NY 20.5 17.6 18.3 19.4 15.2 18.3 21.1 6.6 Oklahoma City, OK 3.2 0.5 0.8 1.4 5.0 0.7 10.1 12.0 Omaha, NE 2.0 0.3 1.4 1.7 5.8 1.2 5.9 3.4 Philadelphia, PA 11.8 8.5 9.5 9.5 14.7 9.4 21.7 9.4 Phoenix, AZ 6.6 6.5 7.4 9.3 12.9 7.9 21.8 7.6 Portland, OR 14.1 8.5 10.4 13.2 10.0 10.0 17.2 5.2 Sacramento, CA 3.3 4.1 5.1 5.8 7.8 5.3 12.5 7.5 Salt Lake City, UT 6.6 2.9 4.1 7.7 8.5 4.4 14.2 5.9 San Antonio, TX 10.2 6.5 6.9 9.8 15.4 7.3 22.9 8.1 San Diego, CA 6.0 4.3 5.0 6.5 8.4 5.1 22.8 7.7 San Jose, CA 5.9 2.4 2.4 3.5 12.9 2.4 22.9 5.5 Seattle, WA 9.9 8.0 10.1 14.2 8.8 10.3 18.9 5.9 Spokane, WA 7.9 5.4 7.9 10.8 6.6 8.4 14.4 4.3 Tucson, AZ 8.8 6.0 7.1 10.8 10.5 7.7 19.1 7.0 Median 6.5 3.6 4.2 5.8 10.0 4.5 17.9 5.9 aQuestion was asked of arrestees who said they had used the drug in the past year. bQuestion was asked of arrestees who said they obtained the drug during the past 30 days.
Note: In sites where the number of arrestees acquiring the drug is small, these findings have low statistical reliability and should be interpreted cautiously. N/A = Not Applicable.
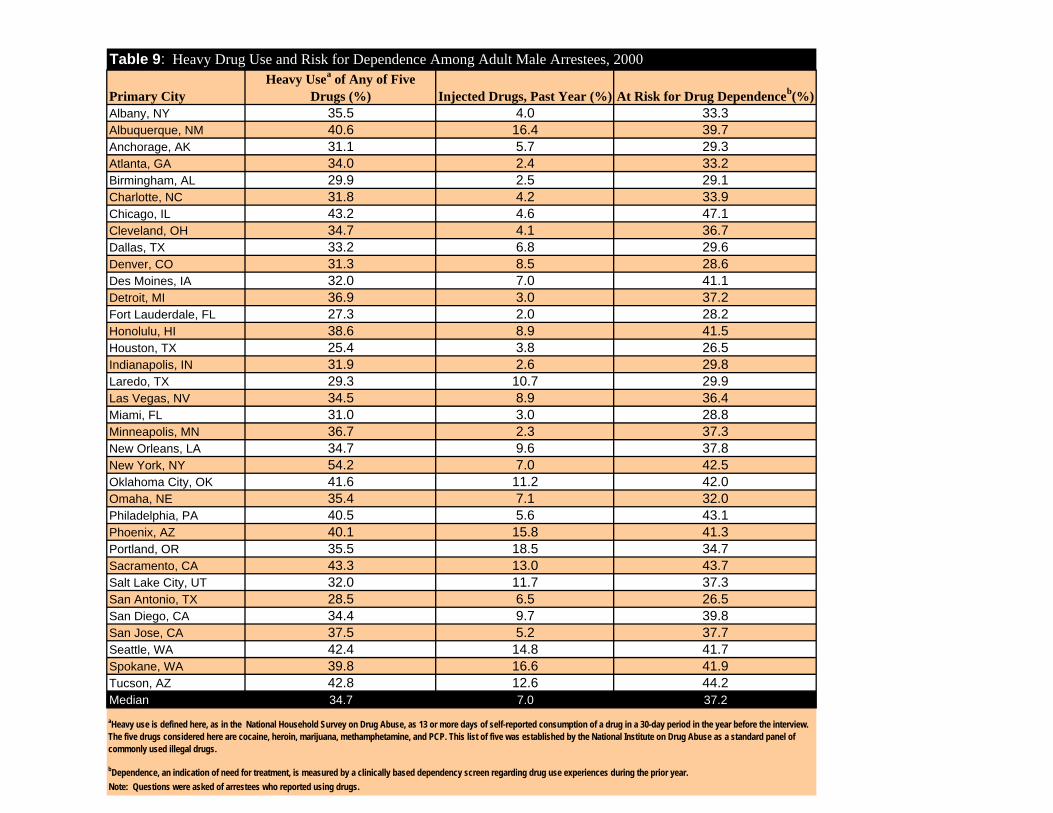
Table 9: Heavy Drug Use and Risk for Dependence Among Adult Male Arrestees, 2000
Primary City Heavy Usea of Any of Five
Drugs (%) Injected Drugs, Past Year (%) At Risk for Drug Dependenceb(%) Albany, NY 35.5 4.0 33.3 Albuquerque, NM 40.6 16.4 39.7 Anchorage, AK 31.1 5.7 29.3 Atlanta, GA 34.0 2.4 33.2 Birmingham, AL 29.9 2.5 29.1 Charlotte, NC 31.8 4.2 33.9 Chicago, IL 43.2 4.6 47.1 Cleveland, OH 34.7 4.1 36.7 Dallas, TX 33.2 6.8 29.6 Denver, CO 31.3 8.5 28.6 Des Moines, IA 32.0 7.0 41.1 Detroit, MI 36.9 3.0 37.2 Fort Lauderdale, FL 27.3 2.0 28.2 Honolulu, HI 38.6 8.9 41.5 Houston, TX 25.4 3.8 26.5 Indianapolis, IN 31.9 2.6 29.8 Laredo, TX 29.3 10.7 29.9 Las Vegas, NV 34.5 8.9 36.4 Miami, FL 31.0 3.0 28.8 Minneapolis, MN 36.7 2.3 37.3 New Orleans, LA 34.7 9.6 37.8 New York, NY 54.2 7.0 42.5 Oklahoma City, OK 41.6 11.2 42.0 Omaha, NE 35.4 7.1 32.0 Philadelphia, PA 40.5 5.6 43.1 Phoenix, AZ 40.1 15.8 41.3 Portland, OR 35.5 18.5 34.7 Sacramento, CA 43.3 13.0 43.7 Salt Lake City, UT 32.0 11.7 37.3 San Antonio, TX 28.5 6.5 26.5 San Diego, CA 34.4 9.7 39.8 San Jose, CA 37.5 5.2 37.7 Seattle, WA 42.4 14.8 41.7 Spokane, WA 39.8 16.6 41.9 Tucson, AZ 42.8 12.6 44.2 Median 34.7 7.0 37.2 aHeavy use is defined here, as in the National Household Survey on Drug Abuse, as 13 or more days of self-reported consumption of a drug in a 30-day period in the year before the interview. The five drugs considered here are cocaine, heroin, marijuana, methamphetamine, and PCP. This list of five was established by the National Institute on Drug Abuse as a standard panel of commonly used illegal drugs.
bDependence, an indication of need for treatment, is measured by a clinically based dependency screen regarding drug use experiences during the prior year. Note: Questions were asked of arrestees who reported using drugs.
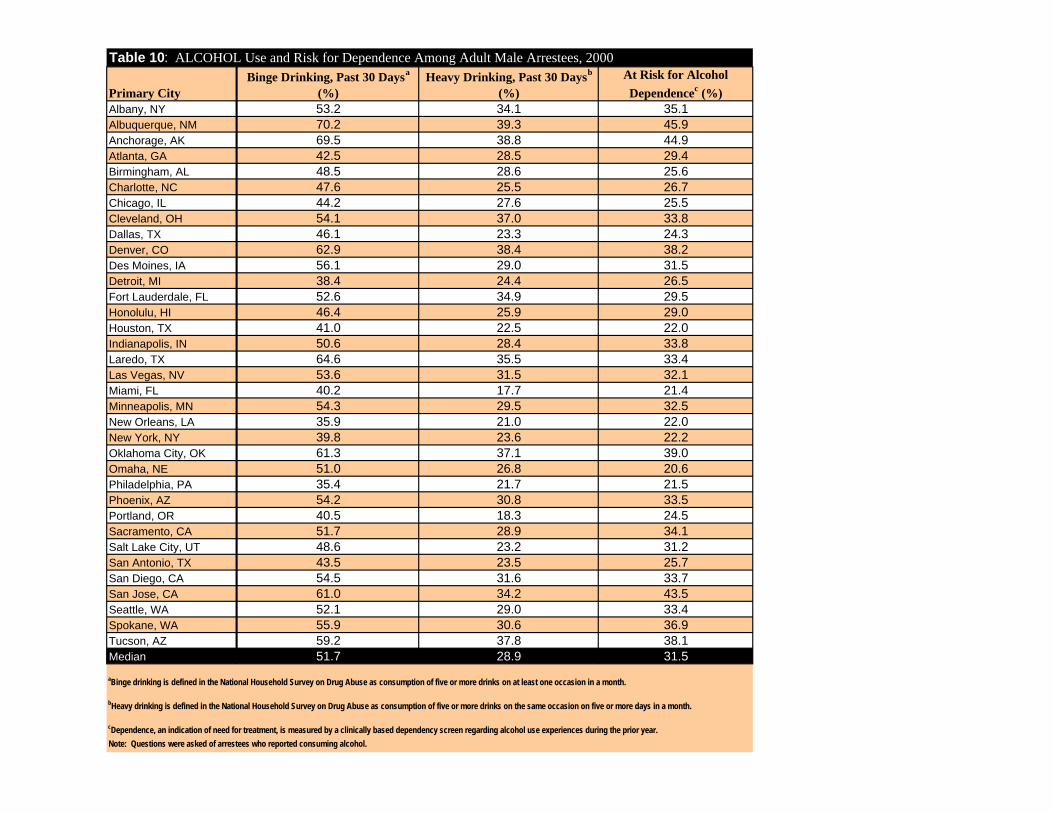
Table 10: ALCOHOL Use and Risk for Dependence Among Adult Male Arrestees, 2000
Primary City Binge Drinking, Past 30 Daysa
(%) Heavy Drinking, Past 30 Daysb
(%) At Risk for Alcohol Dependencec (%)
Albany, NY 53.2 34.1 35.1 Albuquerque, NM 70.2 39.3 45.9 Anchorage, AK 69.5 38.8 44.9 Atlanta, GA 42.5 28.5 29.4 Birmingham, AL 48.5 28.6 25.6 Charlotte, NC 47.6 25.5 26.7 Chicago, IL 44.2 27.6 25.5 Cleveland, OH 54.1 37.0 33.8 Dallas, TX 46.1 23.3 24.3 Denver, CO 62.9 38.4 38.2 Des Moines, IA 56.1 29.0 31.5 Detroit, MI 38.4 24.4 26.5 Fort Lauderdale, FL 52.6 34.9 29.5 Honolulu, HI 46.4 25.9 29.0 Houston, TX 41.0 22.5 22.0 Indianapolis, IN 50.6 28.4 33.8 Laredo, TX 64.6 35.5 33.4 Las Vegas, NV 53.6 31.5 32.1 Miami, FL 40.2 17.7 21.4 Minneapolis, MN 54.3 29.5 32.5 New Orleans, LA 35.9 21.0 22.0 New York, NY 39.8 23.6 22.2 Oklahoma City, OK 61.3 37.1 39.0 Omaha, NE 51.0 26.8 20.6 Philadelphia, PA 35.4 21.7 21.5 Phoenix, AZ 54.2 30.8 33.5 Portland, OR 40.5 18.3 24.5 Sacramento, CA 51.7 28.9 34.1 Salt Lake City, UT 48.6 23.2 31.2 San Antonio, TX 43.5 23.5 25.7 San Diego, CA 54.5 31.6 33.7 San Jose, CA 61.0 34.2 43.5 Seattle, WA 52.1 29.0 33.4 Spokane, WA 55.9 30.6 36.9 Tucson, AZ 59.2 37.8 38.1 Median 51.7 28.9 31.5
Note: Questions were asked of arrestees who reported consuming alcohol.
aBinge drinking is defined in the National Household Survey on Drug Abuse as consumption of five or more drinks on at least one occasion in a month.
bHeavy drinking is defined in the National Household Survey on Drug Abuse as consumption of five or more drinks on the same occasion on five or more days in a month.
cDependence, an indication of need for treatment, is measured by a clinically based dependency screen regarding alcohol use experiences during the prior year.
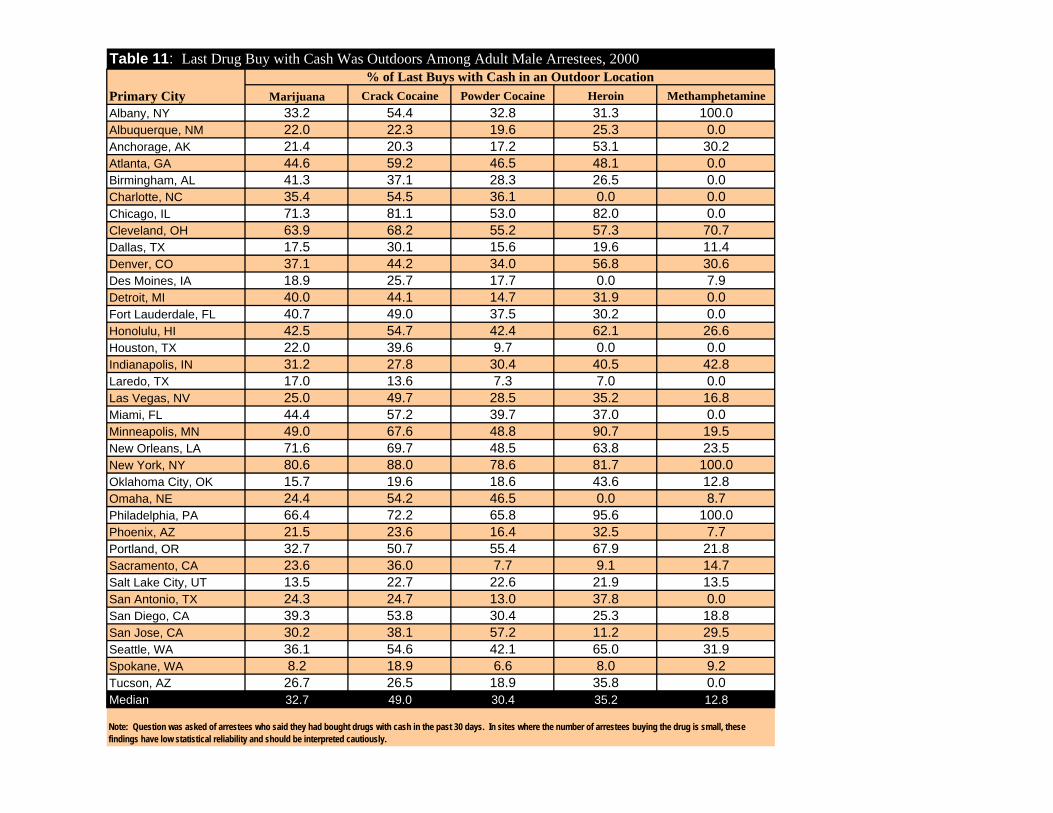
Table 11: Last Drug Buy with Cash Was Outdoors Among Adult Male Arrestees, 2000
Primary City % of Last Buys with Cash in an Outdoor Location
Marijuana Crack Cocaine Powder Cocaine Heroin Methamphetamine Albany, NY 33.2 54.4 32.8 31.3 100.0 Albuquerque, NM 22.0 22.3 19.6 25.3 0.0 Anchorage, AK 21.4 20.3 17.2 53.1 30.2 Atlanta, GA 44.6 59.2 46.5 48.1 0.0 Birmingham, AL 41.3 37.1 28.3 26.5 0.0 Charlotte, NC 35.4 54.5 36.1 0.0 0.0 Chicago, IL 71.3 81.1 53.0 82.0 0.0 Cleveland, OH 63.9 68.2 55.2 57.3 70.7 Dallas, TX 17.5 30.1 15.6 19.6 11.4 Denver, CO 37.1 44.2 34.0 56.8 30.6 Des Moines, IA 18.9 25.7 17.7 0.0 7.9 Detroit, MI 40.0 44.1 14.7 31.9 0.0 Fort Lauderdale, FL 40.7 49.0 37.5 30.2 0.0 Honolulu, HI 42.5 54.7 42.4 62.1 26.6 Houston, TX 22.0 39.6 9.7 0.0 0.0 Indianapolis, IN 31.2 27.8 30.4 40.5 42.8 Laredo, TX 17.0 13.6 7.3 7.0 0.0 Las Vegas, NV 25.0 49.7 28.5 35.2 16.8 Miami, FL 44.4 57.2 39.7 37.0 0.0 Minneapolis, MN 49.0 67.6 48.8 90.7 19.5 New Orleans, LA 71.6 69.7 48.5 63.8 23.5 New York, NY 80.6 88.0 78.6 81.7 100.0 Oklahoma City, OK 15.7 19.6 18.6 43.6 12.8 Omaha, NE 24.4 54.2 46.5 0.0 8.7 Philadelphia, PA 66.4 72.2 65.8 95.6 100.0 Phoenix, AZ 21.5 23.6 16.4 32.5 7.7 Portland, OR 32.7 50.7 55.4 67.9 21.8 Sacramento, CA 23.6 36.0 7.7 9.1 14.7 Salt Lake City, UT 13.5 22.7 22.6 21.9 13.5 San Antonio, TX 24.3 24.7 13.0 37.8 0.0 San Diego, CA 39.3 53.8 30.4 25.3 18.8 San Jose, CA 30.2 38.1 57.2 11.2 29.5 Seattle, WA 36.1 54.6 42.1 65.0 31.9 Spokane, WA 8.2 18.9 6.6 8.0 9.2 Tucson, AZ 26.7 26.5 18.9 35.8 0.0 Median 32.7 49.0 30.4 35.2 12.8
Note: Question was asked of arrestees who said they had bought drugs with cash in the past 30 days. In sites where the number of arrestees buying the drug is small, these findings have low statistical reliability and should be interpreted cautiously.
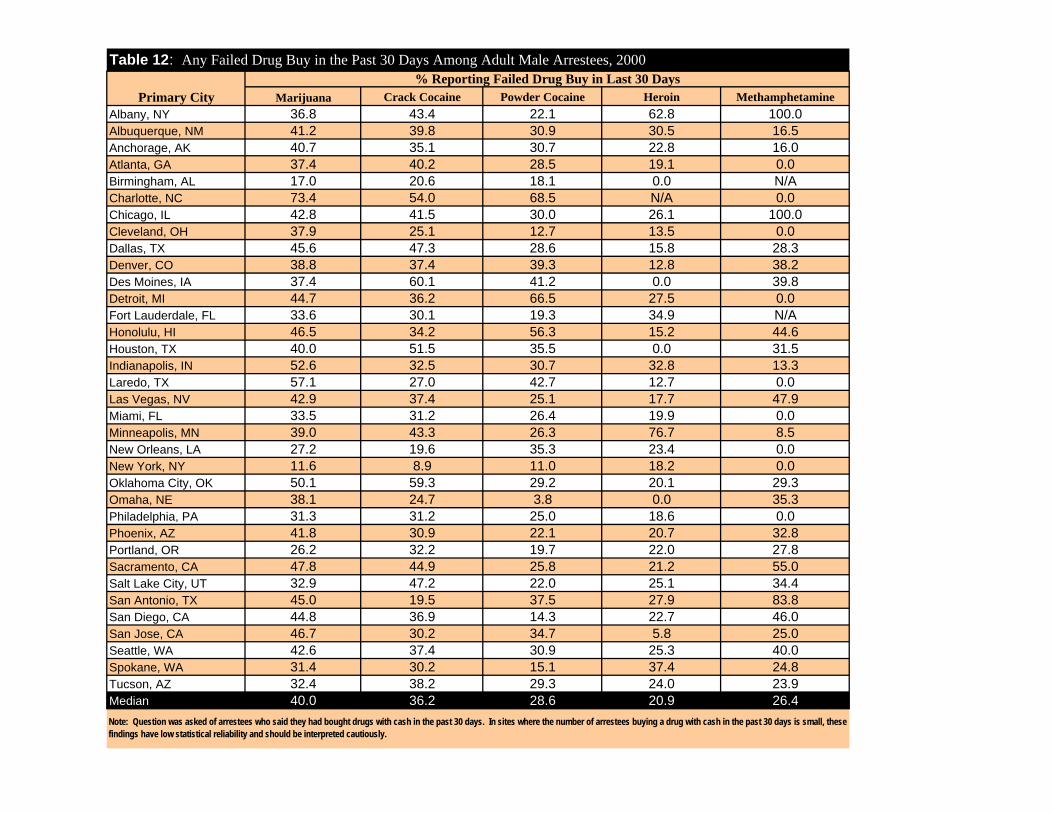
Table 12: Any Failed Drug Buy in the Past 30 Days Among Adult Male Arrestees, 2000
Primary City % Reporting Failed Drug Buy in Last 30 Days
Marijuana Crack Cocaine Powder Cocaine Heroin Methamphetamine Albany, NY 36.8 43.4 22.1 62.8 100.0 Albuquerque, NM 41.2 39.8 30.9 30.5 16.5 Anchorage, AK 40.7 35.1 30.7 22.8 16.0 Atlanta, GA 37.4 40.2 28.5 19.1 0.0 Birmingham, AL 17.0 20.6 18.1 0.0 N/A Charlotte, NC 73.4 54.0 68.5 N/A 0.0 Chicago, IL 42.8 41.5 30.0 26.1 100.0 Cleveland, OH 37.9 25.1 12.7 13.5 0.0 Dallas, TX 45.6 47.3 28.6 15.8 28.3 Denver, CO 38.8 37.4 39.3 12.8 38.2 Des Moines, IA 37.4 60.1 41.2 0.0 39.8 Detroit, MI 44.7 36.2 66.5 27.5 0.0 Fort Lauderdale, FL 33.6 30.1 19.3 34.9 N/A Honolulu, HI 46.5 34.2 56.3 15.2 44.6 Houston, TX 40.0 51.5 35.5 0.0 31.5 Indianapolis, IN 52.6 32.5 30.7 32.8 13.3 Laredo, TX 57.1 27.0 42.7 12.7 0.0 Las Vegas, NV 42.9 37.4 25.1 17.7 47.9 Miami, FL 33.5 31.2 26.4 19.9 0.0 Minneapolis, MN 39.0 43.3 26.3 76.7 8.5 New Orleans, LA 27.2 19.6 35.3 23.4 0.0 New York, NY 11.6 8.9 11.0 18.2 0.0 Oklahoma City, OK 50.1 59.3 29.2 20.1 29.3 Omaha, NE 38.1 24.7 3.8 0.0 35.3 Philadelphia, PA 31.3 31.2 25.0 18.6 0.0 Phoenix, AZ 41.8 30.9 22.1 20.7 32.8 Portland, OR 26.2 32.2 19.7 22.0 27.8 Sacramento, CA 47.8 44.9 25.8 21.2 55.0 Salt Lake City, UT 32.9 47.2 22.0 25.1 34.4 San Antonio, TX 45.0 19.5 37.5 27.9 83.8 San Diego, CA 44.8 36.9 14.3 22.7 46.0 San Jose, CA 46.7 30.2 34.7 5.8 25.0 Seattle, WA 42.6 37.4 30.9 25.3 40.0 Spokane, WA 31.4 30.2 15.1 37.4 24.8 Tucson, AZ 32.4 38.2 29.3 24.0 23.9 Median 40.0 36.2 28.6 20.9 26.4 Note: Question was asked of arrestees who said they had bought drugs with cash in the past 30 days. In sites where the number of arrestees buying a drug with cash in the past 30 days is small, these findings have low statistical reliability and should be interpreted cautiously.
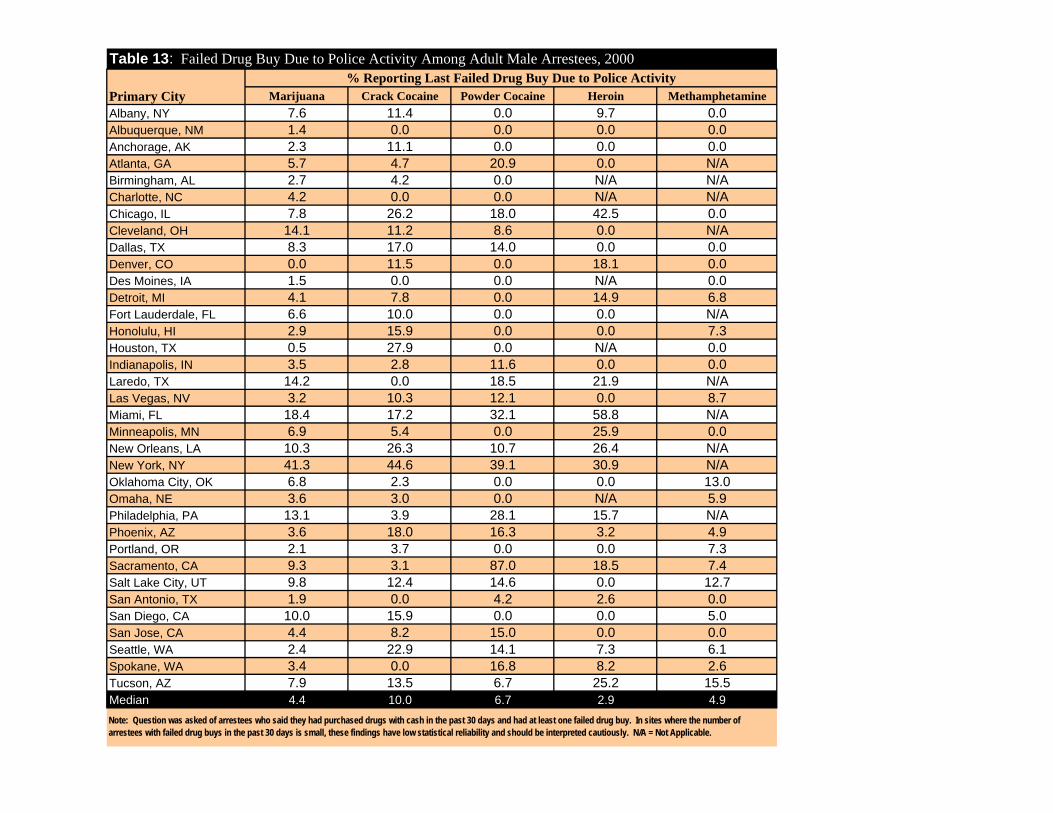
Table 13: Failed Drug Buy Due to Police Activity Among Adult Male Arrestees, 2000
Primary City % Reporting Last Failed Drug Buy Due to Police Activity
Marijuana Crack Cocaine Powder Cocaine Heroin Methamphetamine Albany, NY 7.6 11.4 0.0 9.7 0.0 Albuquerque, NM 1.4 0.0 0.0 0.0 0.0 Anchorage, AK 2.3 11.1 0.0 0.0 0.0 Atlanta, GA 5.7 4.7 20.9 0.0 N/A Birmingham, AL 2.7 4.2 0.0 N/A N/A Charlotte, NC 4.2 0.0 0.0 N/A N/A Chicago, IL 7.8 26.2 18.0 42.5 0.0 Cleveland, OH 14.1 11.2 8.6 0.0 N/A Dallas, TX 8.3 17.0 14.0 0.0 0.0 Denver, CO 0.0 11.5 0.0 18.1 0.0 Des Moines, IA 1.5 0.0 0.0 N/A 0.0 Detroit, MI 4.1 7.8 0.0 14.9 6.8 Fort Lauderdale, FL 6.6 10.0 0.0 0.0 N/A Honolulu, HI 2.9 15.9 0.0 0.0 7.3 Houston, TX 0.5 27.9 0.0 N/A 0.0 Indianapolis, IN 3.5 2.8 11.6 0.0 0.0 Laredo, TX 14.2 0.0 18.5 21.9 N/A Las Vegas, NV 3.2 10.3 12.1 0.0 8.7 Miami, FL 18.4 17.2 32.1 58.8 N/A Minneapolis, MN 6.9 5.4 0.0 25.9 0.0 New Orleans, LA 10.3 26.3 10.7 26.4 N/A New York, NY 41.3 44.6 39.1 30.9 N/A Oklahoma City, OK 6.8 2.3 0.0 0.0 13.0 Omaha, NE 3.6 3.0 0.0 N/A 5.9 Philadelphia, PA 13.1 3.9 28.1 15.7 N/A Phoenix, AZ 3.6 18.0 16.3 3.2 4.9 Portland, OR 2.1 3.7 0.0 0.0 7.3 Sacramento, CA 9.3 3.1 87.0 18.5 7.4 Salt Lake City, UT 9.8 12.4 14.6 0.0 12.7 San Antonio, TX 1.9 0.0 4.2 2.6 0.0 San Diego, CA 10.0 15.9 0.0 0.0 5.0 San Jose, CA 4.4 8.2 15.0 0.0 0.0 Seattle, WA 2.4 22.9 14.1 7.3 6.1 Spokane, WA 3.4 0.0 16.8 8.2 2.6 Tucson, AZ 7.9 13.5 6.7 25.2 15.5 Median 4.4 10.0 6.7 2.9 4.9 Note: Question was asked of arrestees who said they had purchased drugs with cash in the past 30 days and had at least one failed drug buy. In sites where the number of arrestees with failed drug buys in the past 30 days is small, these findings have low statistical reliability and should be interpreted cautiously. N/A = Not Applicable.
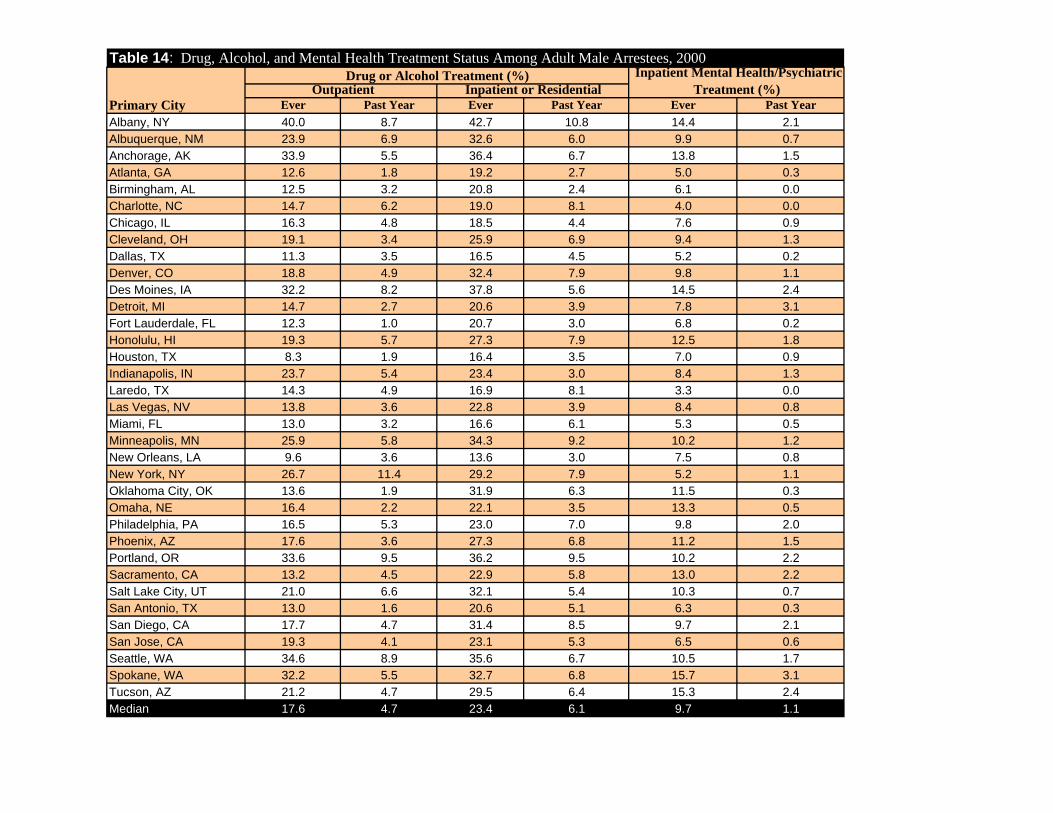
Table 14: Drug, Alcohol, and Mental Health Treatment Status Among Adult Male Arrestees, 2000
Primary City
Drug or Alcohol Treatment (%) Inpatient Mental Health/Psychiatric Treatment (%)Outpatient Inpatient or Residential
Ever Past Year Ever Past Year Ever Past Year Albany, NY 40.0 8.7 42.7 10.8 14.4 2.1 Albuquerque, NM 23.9 6.9 32.6 6.0 9.9 0.7 Anchorage, AK 33.9 5.5 36.4 6.7 13.8 1.5 Atlanta, GA 12.6 1.8 19.2 2.7 5.0 0.3 Birmingham, AL 12.5 3.2 20.8 2.4 6.1 0.0 Charlotte, NC 14.7 6.2 19.0 8.1 4.0 0.0 Chicago, IL 16.3 4.8 18.5 4.4 7.6 0.9 Cleveland, OH 19.1 3.4 25.9 6.9 9.4 1.3 Dallas, TX 11.3 3.5 16.5 4.5 5.2 0.2 Denver, CO 18.8 4.9 32.4 7.9 9.8 1.1 Des Moines, IA 32.2 8.2 37.8 5.6 14.5 2.4 Detroit, MI 14.7 2.7 20.6 3.9 7.8 3.1 Fort Lauderdale, FL 12.3 1.0 20.7 3.0 6.8 0.2 Honolulu, HI 19.3 5.7 27.3 7.9 12.5 1.8 Houston, TX 8.3 1.9 16.4 3.5 7.0 0.9 Indianapolis, IN 23.7 5.4 23.4 3.0 8.4 1.3 Laredo, TX 14.3 4.9 16.9 8.1 3.3 0.0 Las Vegas, NV 13.8 3.6 22.8 3.9 8.4 0.8 Miami, FL 13.0 3.2 16.6 6.1 5.3 0.5 Minneapolis, MN 25.9 5.8 34.3 9.2 10.2 1.2 New Orleans, LA 9.6 3.6 13.6 3.0 7.5 0.8 New York, NY 26.7 11.4 29.2 7.9 5.2 1.1 Oklahoma City, OK 13.6 1.9 31.9 6.3 11.5 0.3 Omaha, NE 16.4 2.2 22.1 3.5 13.3 0.5 Philadelphia, PA 16.5 5.3 23.0 7.0 9.8 2.0 Phoenix, AZ 17.6 3.6 27.3 6.8 11.2 1.5 Portland, OR 33.6 9.5 36.2 9.5 10.2 2.2 Sacramento, CA 13.2 4.5 22.9 5.8 13.0 2.2 Salt Lake City, UT 21.0 6.6 32.1 5.4 10.3 0.7 San Antonio, TX 13.0 1.6 20.6 5.1 6.3 0.3 San Diego, CA 17.7 4.7 31.4 8.5 9.7 2.1 San Jose, CA 19.3 4.1 23.1 5.3 6.5 0.6 Seattle, WA 34.6 8.9 35.6 6.7 10.5 1.7 Spokane, WA 32.2 5.5 32.7 6.8 15.7 3.1 Tucson, AZ 21.2 4.7 29.5 6.4 15.3 2.4 Median 17.6 4.7 23.4 6.1 9.7 1.1
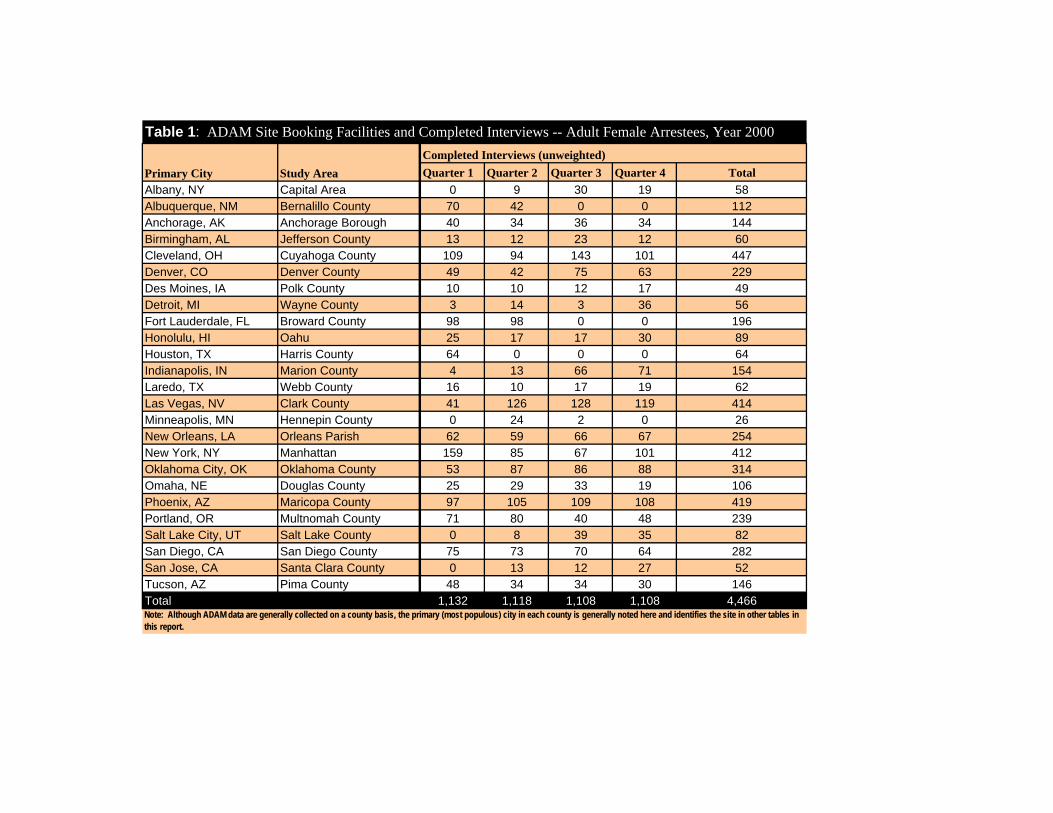
Table 1: ADAM Site Booking Facilities and Completed Interviews -- Adult Female Arrestees, Year 2000
Primary City Study Area Completed Interviews (unweighted) Quarter 1 Quarter 2 Quarter 3 Quarter 4 Total
Albany, NY Capital Area 0 9 30 19 58 Albuquerque, NM Bernalillo County 70 42 0 0 112 Anchorage, AK Anchorage Borough 40 34 36 34 144 Birmingham, AL Jefferson County 13 12 23 12 60 Cleveland, OH Cuyahoga County 109 94 143 101 447 Denver, CO Denver County 49 42 75 63 229 Des Moines, IA Polk County 10 10 12 17 49 Detroit, MI Wayne County 3 14 3 36 56 Fort Lauderdale, FL Broward County 98 98 0 0 196 Honolulu, HI Oahu 25 17 17 30 89 Houston, TX Harris County 64 0 0 0 64 Indianapolis, IN Marion County 4 13 66 71 154 Laredo, TX Webb County 16 10 17 19 62 Las Vegas, NV Clark County 41 126 128 119 414 Minneapolis, MN Hennepin County 0 24 2 0 26 New Orleans, LA Orleans Parish 62 59 66 67 254 New York, NY Manhattan 159 85 67 101 412 Oklahoma City, OK Oklahoma County 53 87 86 88 314 Omaha, NE Douglas County 25 29 33 19 106 Phoenix, AZ Maricopa County 97 105 109 108 419 Portland, OR Multnomah County 71 80 40 48 239 Salt Lake City, UT Salt Lake County 0 8 39 35 82 San Diego, CA San Diego County 75 73 70 64 282 San Jose, CA Santa Clara County 0 13 12 27 52 Tucson, AZ Pima County 48 34 34 30 146 Total 1,132 1,118 1,108 1,108 4,466 Note: Although ADAM data are generally collected on a county basis, the primary (most populous) city in each county is generally noted here and identifies the site in other tables in this report.
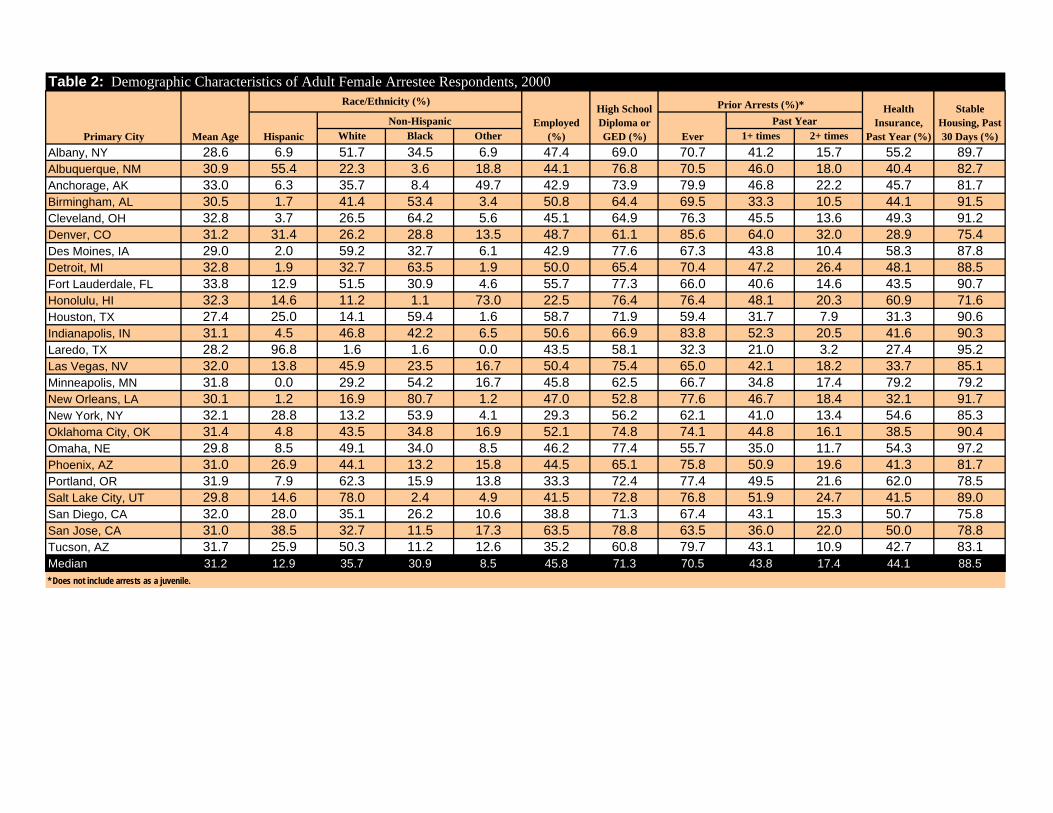
Table 2: Demographic Characteristics of Adult Female Arrestee Respondents, 2000 Race/Ethnicity (%)
High School Prior Arrests (%)* Health Stable
Primary City Mean Age Hispanic Non-Hispanic Employed
(%) Diploma or GED (%) Ever
Past Year Insurance, Past Year (%)
Housing, Past 30 Days (%)White Black Other 1+ times 2+ times
Albany, NY 28.6 6.9 51.7 34.5 6.9 47.4 69.0 70.7 41.2 15.7 55.2 89.7 Albuquerque, NM 30.9 55.4 22.3 3.6 18.8 44.1 76.8 70.5 46.0 18.0 40.4 82.7 Anchorage, AK 33.0 6.3 35.7 8.4 49.7 42.9 73.9 79.9 46.8 22.2 45.7 81.7 Birmingham, AL 30.5 1.7 41.4 53.4 3.4 50.8 64.4 69.5 33.3 10.5 44.1 91.5 Cleveland, OH 32.8 3.7 26.5 64.2 5.6 45.1 64.9 76.3 45.5 13.6 49.3 91.2 Denver, CO 31.2 31.4 26.2 28.8 13.5 48.7 61.1 85.6 64.0 32.0 28.9 75.4 Des Moines, IA 29.0 2.0 59.2 32.7 6.1 42.9 77.6 67.3 43.8 10.4 58.3 87.8 Detroit, MI 32.8 1.9 32.7 63.5 1.9 50.0 65.4 70.4 47.2 26.4 48.1 88.5 Fort Lauderdale, FL 33.8 12.9 51.5 30.9 4.6 55.7 77.3 66.0 40.6 14.6 43.5 90.7 Honolulu, HI 32.3 14.6 11.2 1.1 73.0 22.5 76.4 76.4 48.1 20.3 60.9 71.6 Houston, TX 27.4 25.0 14.1 59.4 1.6 58.7 71.9 59.4 31.7 7.9 31.3 90.6 Indianapolis, IN 31.1 4.5 46.8 42.2 6.5 50.6 66.9 83.8 52.3 20.5 41.6 90.3 Laredo, TX 28.2 96.8 1.6 1.6 0.0 43.5 58.1 32.3 21.0 3.2 27.4 95.2 Las Vegas, NV 32.0 13.8 45.9 23.5 16.7 50.4 75.4 65.0 42.1 18.2 33.7 85.1 Minneapolis, MN 31.8 0.0 29.2 54.2 16.7 45.8 62.5 66.7 34.8 17.4 79.2 79.2 New Orleans, LA 30.1 1.2 16.9 80.7 1.2 47.0 52.8 77.6 46.7 18.4 32.1 91.7 New York, NY 32.1 28.8 13.2 53.9 4.1 29.3 56.2 62.1 41.0 13.4 54.6 85.3 Oklahoma City, OK 31.4 4.8 43.5 34.8 16.9 52.1 74.8 74.1 44.8 16.1 38.5 90.4 Omaha, NE 29.8 8.5 49.1 34.0 8.5 46.2 77.4 55.7 35.0 11.7 54.3 97.2 Phoenix, AZ 31.0 26.9 44.1 13.2 15.8 44.5 65.1 75.8 50.9 19.6 41.3 81.7 Portland, OR 31.9 7.9 62.3 15.9 13.8 33.3 72.4 77.4 49.5 21.6 62.0 78.5 Salt Lake City, UT 29.8 14.6 78.0 2.4 4.9 41.5 72.8 76.8 51.9 24.7 41.5 89.0 San Diego, CA 32.0 28.0 35.1 26.2 10.6 38.8 71.3 67.4 43.1 15.3 50.7 75.8 San Jose, CA 31.0 38.5 32.7 11.5 17.3 63.5 78.8 63.5 36.0 22.0 50.0 78.8 Tucson, AZ 31.7 25.9 50.3 11.2 12.6 35.2 60.8 79.7 43.1 10.9 42.7 83.1 Median 31.2 12.9 35.7 30.9 8.5 45.8 71.3 70.5 43.8 17.4 44.1 88.5 * Does not include arrests as a juvenile.
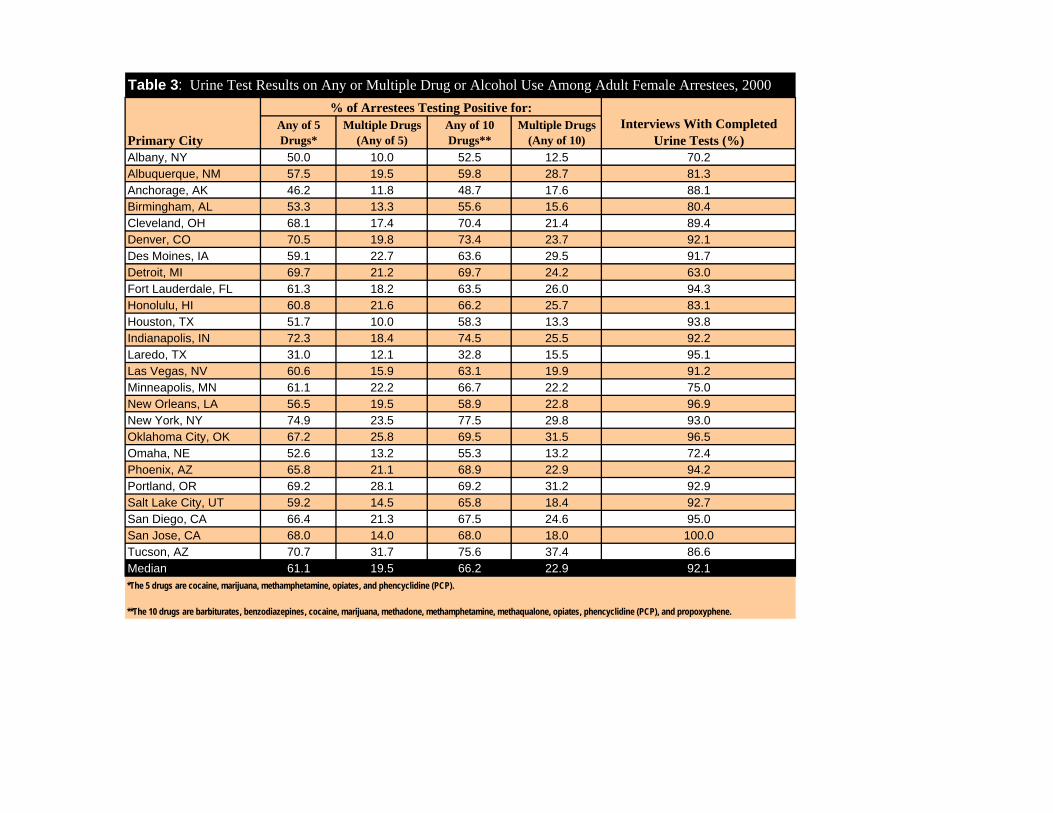
Table 3: Urine Test Results on Any or Multiple Drug or Alcohol Use Among Adult Female Arrestees, 2000
Primary City
% of Arrestees Testing Positive for: Interviews With Completed
Urine Tests (%) Any of 5 Drugs*
Multiple Drugs (Any of 5)
Any of 10 Drugs**
Multiple Drugs (Any of 10)
Albany, NY 50.0 10.0 52.5 12.5 70.2 Albuquerque, NM 57.5 19.5 59.8 28.7 81.3 Anchorage, AK 46.2 11.8 48.7 17.6 88.1 Birmingham, AL 53.3 13.3 55.6 15.6 80.4 Cleveland, OH 68.1 17.4 70.4 21.4 89.4 Denver, CO 70.5 19.8 73.4 23.7 92.1 Des Moines, IA 59.1 22.7 63.6 29.5 91.7 Detroit, MI 69.7 21.2 69.7 24.2 63.0 Fort Lauderdale, FL 61.3 18.2 63.5 26.0 94.3 Honolulu, HI 60.8 21.6 66.2 25.7 83.1 Houston, TX 51.7 10.0 58.3 13.3 93.8 Indianapolis, IN 72.3 18.4 74.5 25.5 92.2 Laredo, TX 31.0 12.1 32.8 15.5 95.1 Las Vegas, NV 60.6 15.9 63.1 19.9 91.2 Minneapolis, MN 61.1 22.2 66.7 22.2 75.0 New Orleans, LA 56.5 19.5 58.9 22.8 96.9 New York, NY 74.9 23.5 77.5 29.8 93.0 Oklahoma City, OK 67.2 25.8 69.5 31.5 96.5 Omaha, NE 52.6 13.2 55.3 13.2 72.4 Phoenix, AZ 65.8 21.1 68.9 22.9 94.2 Portland, OR 69.2 28.1 69.2 31.2 92.9 Salt Lake City, UT 59.2 14.5 65.8 18.4 92.7 San Diego, CA 66.4 21.3 67.5 24.6 95.0 San Jose, CA 68.0 14.0 68.0 18.0 100.0 Tucson, AZ 70.7 31.7 75.6 37.4 86.6 Median 61.1 19.5 66.2 22.9 92.1
**The 10 drugs are barbiturates, benzodiazepines, cocaine, marijuana, methadone, methamphetamine, methaqualone, opiates, phencyclidine (PCP), and propoxyphene.
*The 5 drugs are cocaine, marijuana, methamphetamine, opiates, and phencyclidine (PCP).
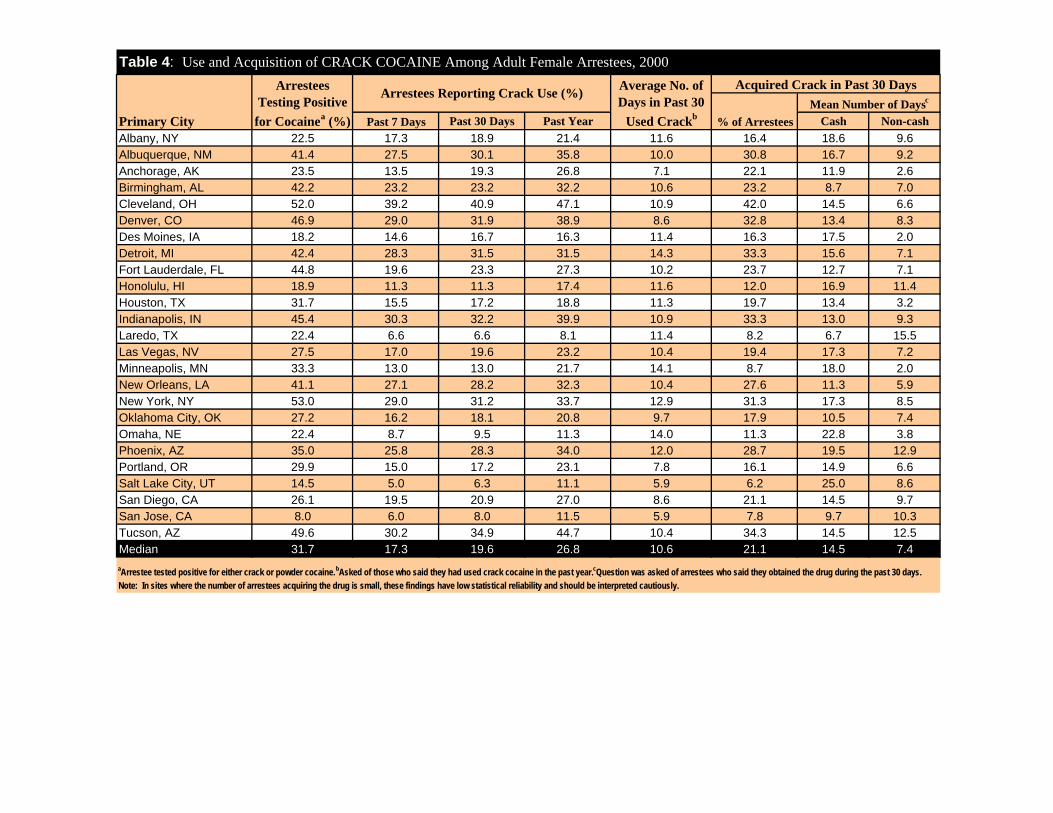
Table 4: Use and Acquisition of CRACK COCAINE Among Adult Female Arrestees, 2000
Primary City
Arrestees Testing Positive
for Cocainea (%)
Arrestees Reporting Crack Use (%) Average No. of Days in Past 30
Used Crackb
Acquired Crack in Past 30 Days
% of Arrestees Mean Number of Daysc
Past 7 Days Past 30 Days Past Year Cash Non-cash Albany, NY 22.5 17.3 18.9 21.4 11.6 16.4 18.6 9.6 Albuquerque, NM 41.4 27.5 30.1 35.8 10.0 30.8 16.7 9.2 Anchorage, AK 23.5 13.5 19.3 26.8 7.1 22.1 11.9 2.6 Birmingham, AL 42.2 23.2 23.2 32.2 10.6 23.2 8.7 7.0 Cleveland, OH 52.0 39.2 40.9 47.1 10.9 42.0 14.5 6.6 Denver, CO 46.9 29.0 31.9 38.9 8.6 32.8 13.4 8.3 Des Moines, IA 18.2 14.6 16.7 16.3 11.4 16.3 17.5 2.0 Detroit, MI 42.4 28.3 31.5 31.5 14.3 33.3 15.6 7.1 Fort Lauderdale, FL 44.8 19.6 23.3 27.3 10.2 23.7 12.7 7.1 Honolulu, HI 18.9 11.3 11.3 17.4 11.6 12.0 16.9 11.4 Houston, TX 31.7 15.5 17.2 18.8 11.3 19.7 13.4 3.2 Indianapolis, IN 45.4 30.3 32.2 39.9 10.9 33.3 13.0 9.3 Laredo, TX 22.4 6.6 6.6 8.1 11.4 8.2 6.7 15.5 Las Vegas, NV 27.5 17.0 19.6 23.2 10.4 19.4 17.3 7.2 Minneapolis, MN 33.3 13.0 13.0 21.7 14.1 8.7 18.0 2.0 New Orleans, LA 41.1 27.1 28.2 32.3 10.4 27.6 11.3 5.9 New York, NY 53.0 29.0 31.2 33.7 12.9 31.3 17.3 8.5 Oklahoma City, OK 27.2 16.2 18.1 20.8 9.7 17.9 10.5 7.4 Omaha, NE 22.4 8.7 9.5 11.3 14.0 11.3 22.8 3.8 Phoenix, AZ 35.0 25.8 28.3 34.0 12.0 28.7 19.5 12.9 Portland, OR 29.9 15.0 17.2 23.1 7.8 16.1 14.9 6.6 Salt Lake City, UT 14.5 5.0 6.3 11.1 5.9 6.2 25.0 8.6 San Diego, CA 26.1 19.5 20.9 27.0 8.6 21.1 14.5 9.7 San Jose, CA 8.0 6.0 8.0 11.5 5.9 7.8 9.7 10.3 Tucson, AZ 49.6 30.2 34.9 44.7 10.4 34.3 14.5 12.5 Median 31.7 17.3 19.6 26.8 10.6 21.1 14.5 7.4 aArrestee tested positive for either crack or powder cocaine.bAsked of those who said they had used crack cocaine in the past year.cQuestion was asked of arrestees who said they obtained the drug during the past 30 days. Note: In sites where the number of arrestees acquiring the drug is small, these findings have low statistical reliability and should be interpreted cautiously.
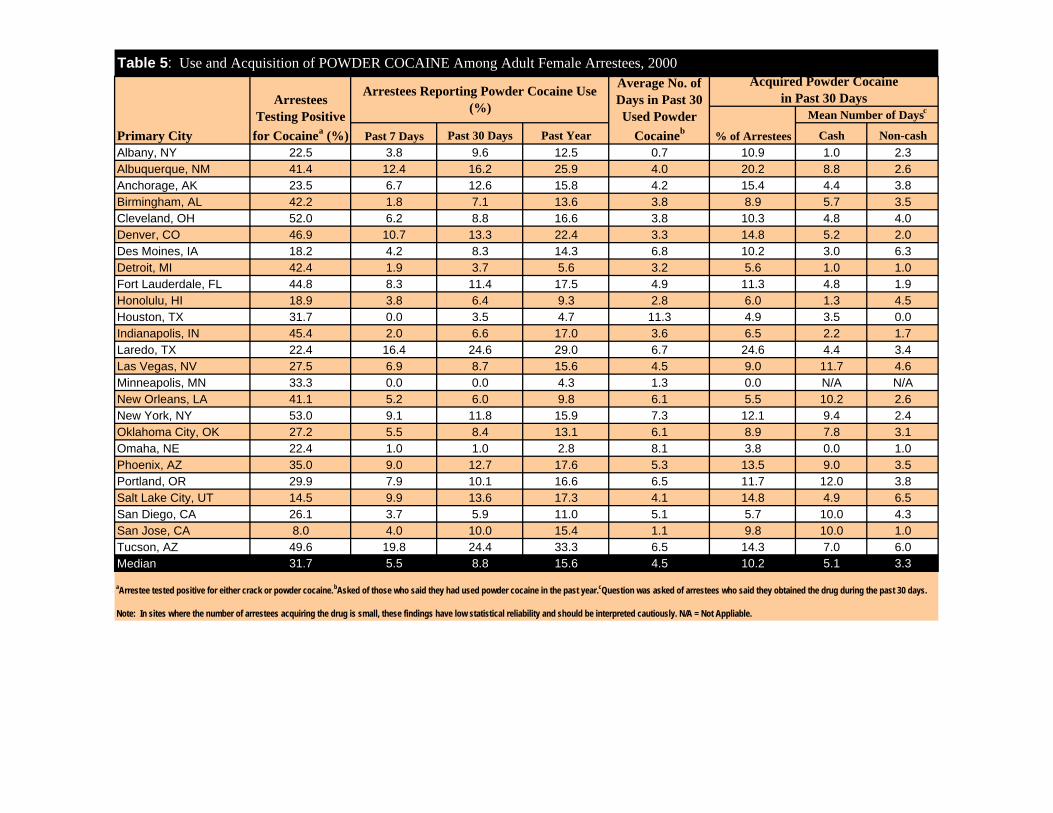
Table 5: Use and Acquisition of POWDER COCAINE Among Adult Female Arrestees, 2000
Primary City
Arrestees Testing Positive
for Cocainea (%)
Arrestees Reporting Powder Cocaine Use (%)
Average No. of Days in Past 30 Used Powder
Cocaineb
Acquired Powder Cocaine in Past 30 Days
% of Arrestees
Mean Number of Daysc
Past 7 Days Past 30 Days Past Year Cash Non-cash Albany, NY 22.5 3.8 9.6 12.5 0.7 10.9 1.0 2.3 Albuquerque, NM 41.4 12.4 16.2 25.9 4.0 20.2 8.8 2.6 Anchorage, AK 23.5 6.7 12.6 15.8 4.2 15.4 4.4 3.8 Birmingham, AL 42.2 1.8 7.1 13.6 3.8 8.9 5.7 3.5 Cleveland, OH 52.0 6.2 8.8 16.6 3.8 10.3 4.8 4.0 Denver, CO 46.9 10.7 13.3 22.4 3.3 14.8 5.2 2.0 Des Moines, IA 18.2 4.2 8.3 14.3 6.8 10.2 3.0 6.3 Detroit, MI 42.4 1.9 3.7 5.6 3.2 5.6 1.0 1.0 Fort Lauderdale, FL 44.8 8.3 11.4 17.5 4.9 11.3 4.8 1.9 Honolulu, HI 18.9 3.8 6.4 9.3 2.8 6.0 1.3 4.5 Houston, TX 31.7 0.0 3.5 4.7 11.3 4.9 3.5 0.0 Indianapolis, IN 45.4 2.0 6.6 17.0 3.6 6.5 2.2 1.7 Laredo, TX 22.4 16.4 24.6 29.0 6.7 24.6 4.4 3.4 Las Vegas, NV 27.5 6.9 8.7 15.6 4.5 9.0 11.7 4.6 Minneapolis, MN 33.3 0.0 0.0 4.3 1.3 0.0 N/A N/A New Orleans, LA 41.1 5.2 6.0 9.8 6.1 5.5 10.2 2.6 New York, NY 53.0 9.1 11.8 15.9 7.3 12.1 9.4 2.4 Oklahoma City, OK 27.2 5.5 8.4 13.1 6.1 8.9 7.8 3.1 Omaha, NE 22.4 1.0 1.0 2.8 8.1 3.8 0.0 1.0 Phoenix, AZ 35.0 9.0 12.7 17.6 5.3 13.5 9.0 3.5 Portland, OR 29.9 7.9 10.1 16.6 6.5 11.7 12.0 3.8 Salt Lake City, UT 14.5 9.9 13.6 17.3 4.1 14.8 4.9 6.5 San Diego, CA 26.1 3.7 5.9 11.0 5.1 5.7 10.0 4.3 San Jose, CA 8.0 4.0 10.0 15.4 1.1 9.8 10.0 1.0 Tucson, AZ 49.6 19.8 24.4 33.3 6.5 14.3 7.0 6.0 Median 31.7 5.5 8.8 15.6 4.5 10.2 5.1 3.3
aArrestee tested positive for either crack or powder cocaine.bAsked of those who said they had used powder cocaine in the past year.cQuestion was asked of arrestees who said they obtained the drug during the past 30 days.
Note: In sites where the number of arrestees acquiring the drug is small, these findings have low statistical reliability and should be interpreted cautiously. N/A = Not Appliable.
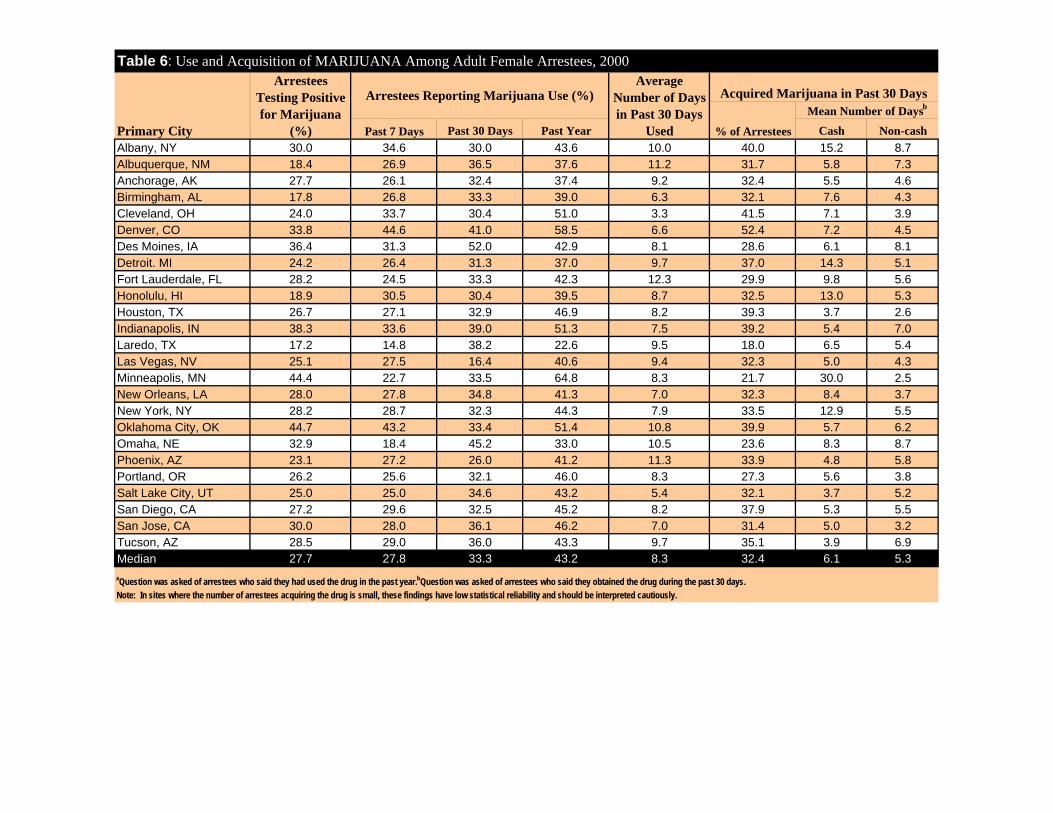
Past 7 Days Past 30 Days Past Year Cash Non-cash Albany, NY 30.0 34.6 30.0 43.6 10.0 40.0 15.2 8.7 Albuquerque, NM 18.4 26.9 36.5 37.6 11.2 31.7 5.8 7.3 Anchorage, AK 27.7 26.1 32.4 37.4 9.2 32.4 5.5 4.6 Birmingham, AL 17.8 26.8 33.3 39.0 6.3 32.1 7.6 4.3 Cleveland, OH 24.0 33.7 30.4 51.0 3.3 41.5 7.1 3.9 Denver, CO 33.8 44.6 41.0 58.5 6.6 52.4 7.2 4.5 Des Moines, IA 36.4 31.3 52.0 42.9 8.1 28.6 6.1 8.1 Detroit. MI 24.2 26.4 31.3 37.0 9.7 37.0 14.3 5.1 Fort Lauderdale, FL 28.2 24.5 33.3 42.3 12.3 29.9 9.8 5.6 Honolulu, HI 18.9 30.5 30.4 39.5 8.7 32.5 13.0 5.3 Houston, TX 26.7 27.1 32.9 46.9 8.2 39.3 3.7 2.6 Indianapolis, IN 38.3 33.6 39.0 51.3 7.5 39.2 5.4 7.0 Laredo, TX 17.2 14.8 38.2 22.6 9.5 18.0 6.5 5.4 Las Vegas, NV 25.1 27.5 16.4 40.6 9.4 32.3 5.0 4.3 Minneapolis, MN 44.4 22.7 33.5 64.8 8.3 21.7 30.0 2.5 New Orleans, LA 28.0 27.8 34.8 41.3 7.0 32.3 8.4 3.7 New York, NY 28.2 28.7 32.3 44.3 7.9 33.5 12.9 5.5 Oklahoma City, OK 44.7 43.2 33.4 51.4 10.8 39.9 5.7 6.2 Omaha, NE 32.9 18.4 45.2 33.0 10.5 23.6 8.3 8.7 Phoenix, AZ 23.1 27.2 26.0 41.2 11.3 33.9 4.8 5.8 Portland, OR 26.2 25.6 32.1 46.0 8.3 27.3 5.6 3.8 Salt Lake City, UT 25.0 25.0 34.6 43.2 5.4 32.1 3.7 5.2 San Diego, CA 27.2 29.6 32.5 45.2 8.2 37.9 5.3 5.5 San Jose, CA 30.0 28.0 36.1 46.2 7.0 31.4 5.0 3.2 Tucson, AZ 28.5 29.0 36.0 43.3 9.7 35.1 3.9 6.9 Median 27.7 27.8 33.3 43.2 8.3 32.4 6.1 5.3
Average Number of Days in Past 30 Days
Used
aQuestion was asked of arrestees who said they had used the drug in the past year.bQuestion was asked of arrestees who said they obtained the drug during the past 30 days. Note:
Table 6: Use and Acquisition of MARIJUANA Among Adult Female Arrestees, 2000
Acquired Marijuana in Past 30 Days
% of Arrestees
Mean Number of Daysb
Primary City
Arrestees Testing Positive for Marijuana
(%)
Arrestees Reporting Marijuana Use (%)
In sites where the number of arrestees acquiring the drug is small, these findings have low statistical reliability and should be interpreted cautiously.
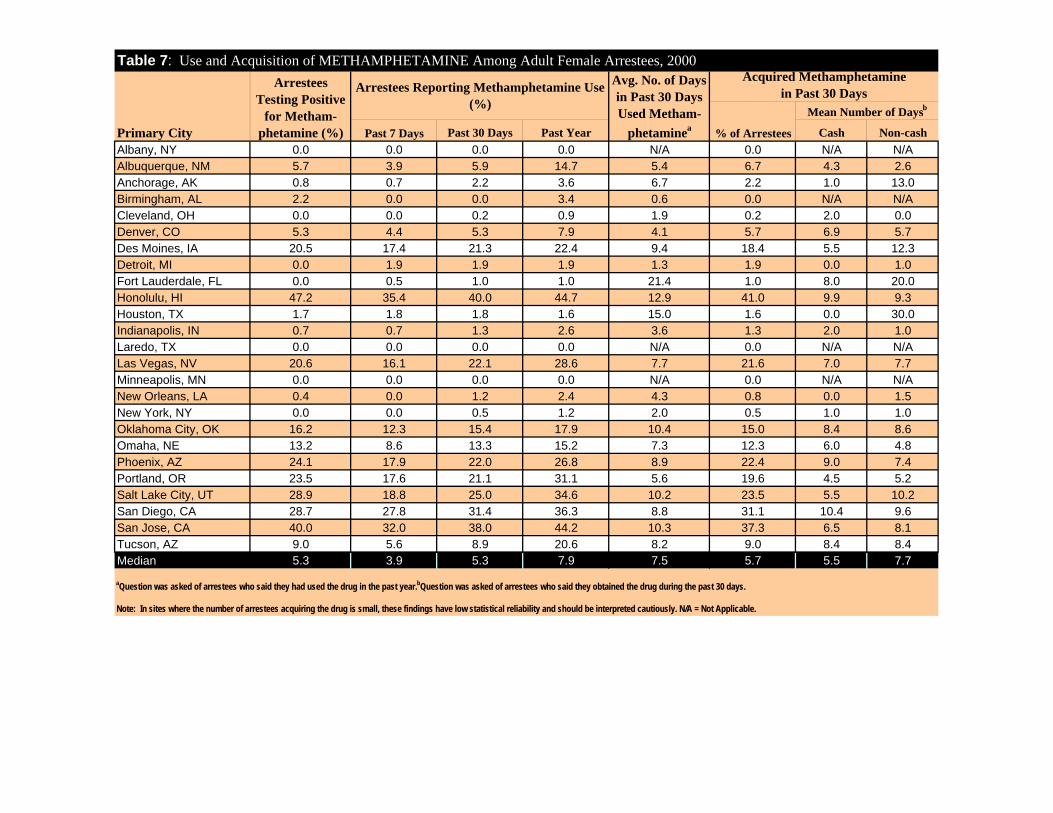
Past 7 Days Past 30 Days Past Year Cash Non-cash Albany, NY 0.0 0.0 0.0 0.0 N/A 0.0 N/A N/A Albuquerque, NM 5.7 3.9 5.9 14.7 5.4 6.7 4.3 2.6 Anchorage, AK 0.8 0.7 2.2 3.6 6.7 2.2 1.0 13.0 Birmingham, AL 2.2 0.0 0.0 3.4 0.6 0.0 N/A N/A Cleveland, OH 0.0 0.0 0.2 0.9 1.9 0.2 2.0 0.0 Denver, CO 5.3 4.4 5.3 7.9 4.1 5.7 6.9 5.7 Des Moines, IA 20.5 17.4 21.3 22.4 9.4 18.4 5.5 12.3 Detroit, MI 0.0 1.9 1.9 1.9 1.3 1.9 0.0 1.0 Fort Lauderdale, FL 0.0 0.5 1.0 1.0 21.4 1.0 8.0 20.0 Honolulu, HI 47.2 35.4 40.0 44.7 12.9 41.0 9.9 9.3 Houston, TX 1.7 1.8 1.8 1.6 15.0 1.6 0.0 30.0 Indianapolis, IN 0.7 0.7 1.3 2.6 3.6 1.3 2.0 1.0 Laredo, TX 0.0 0.0 0.0 0.0 N/A 0.0 N/A N/A Las Vegas, NV 20.6 16.1 22.1 28.6 7.7 21.6 7.0 7.7 Minneapolis, MN 0.0 0.0 0.0 0.0 N/A 0.0 N/A N/A New Orleans, LA 0.4 0.0 1.2 2.4 4.3 0.8 0.0 1.5 New York, NY 0.0 0.0 0.5 1.2 2.0 0.5 1.0 1.0 Oklahoma City, OK 16.2 12.3 15.4 17.9 10.4 15.0 8.4 8.6 Omaha, NE 13.2 8.6 13.3 15.2 7.3 12.3 6.0 4.8 Phoenix, AZ 24.1 17.9 22.0 26.8 8.9 22.4 9.0 7.4 Portland, OR 23.5 17.6 21.1 31.1 5.6 19.6 4.5 5.2 Salt Lake City, UT 28.9 18.8 25.0 34.6 10.2 23.5 5.5 10.2 San Diego, CA 28.7 27.8 31.4 36.3 8.8 31.1 10.4 9.6 San Jose, CA 40.0 32.0 38.0 44.2 10.3 37.3 6.5 8.1 Tucson, AZ 9.0 5.6 8.9 20.6 8.2 9.0 8.4 8.4 Median 5.3 3.9 5.3 7.9 7.5 5.7 5.5 7.7
Avg. No. of Days in Past 30 Days Used Metham
phetaminea
Table 7: Use and Acquisition of METHAMPHETAMINE Among Adult Female Arrestees, 2000
aQuestion was asked of arrestees who said they had used the drug in the past year.bQuestion was asked of arrestees who said they obtained the drug during the past 30 days.
Note:
Acquired Methamphetamine in Past 30 Days
% of Arrestees
Mean Number of Daysb
Primary City
Arrestees Testing Positive
for Methamphetamine (%)
Arrestees Reporting Methamphetamine Use (%)
In sites where the number of arrestees acquiring the drug is small, these findings have low statistical reliability and should be interpreted cautiously. N/A = Not Applicable.

Past 7 Days Past 30 Days Past Year Cash Non-cash Albany, NY 7.5 3.8 5.8 7.1 9.0 5.5 10.0 1.0 Albuquerque, NM 13.8 15.5 16.5 22.2 9.3 17.3 13.9 8.9 Anchorage, AK 8.4 1.5 1.5 2.9 10.6 1.5 19.5 3.0 Birmingham, AL 4.4 0.0 0.0 3.4 9.8 0.0 N/A N/A Cleveland, OH 6.6 4.5 5.0 6.8 9.6 5.6 16.0 3.6 Denver, CO 5.8 4.0 5.3 7.0 9.9 5.2 21.7 3.3 Des Moines, IA 6.8 2.1 2.1 2.0 2.2 2.0 0.0 0.0 Detroit, MI 24.2 11.3 13.0 14.8 18.0 13.0 27.0 14.3 Fort Lauderdale, FL 7.2 2.1 3.1 5.2 6.9 3.1 16.0 1.0 Honolulu, HI 8.1 2.6 3.8 8.1 9.4 3.6 15.5 16.5 Houston, TX 3.3 0.0 0.0 0.0 0.0 0.0 N/A N/A Indianapolis, IN 6.4 1.3 1.3 3.3 16.6 1.3 30.0 0.0 Laredo, TX 6.9 3.3 3.3 4.8 15.9 3.3 20.5 0.0 Las Vegas, NV 4.9 2.6 3.6 4.9 10.0 4.2 19.8 7.2 Minneapolis, MN 5.6 0.0 0.0 0.0 0.0 0.0 N/A N/A New Orleans, LA 8.5 7.2 8.0 11.1 10.4 7.5 26.3 10.2 New York, NY 19.1 14.4 15.6 16.9 15.3 16.3 19.6 5.2 Oklahoma City, OK 4.6 1.0 1.0 1.6 8.6 1.0 30.0 1.0 Omaha, NE 1.3 1.0 1.0 0.9 19.2 0.9 30.0 0.0 Phoenix, AZ 6.4 5.8 6.5 8.2 9.8 6.6 21.2 8.0 Portland, OR 22.2 15.0 16.7 19.6 14.0 15.2 19.8 12.1 Salt Lake City, UT 9.2 4.9 6.2 7.4 14.6 8.6 22.7 2.2 San Diego, CA 7.5 6.6 8.8 10.4 8.0 8.9 14.3 2.6 San Jose, CA 4.0 2.0 2.0 5.8 8.3 2.0 27.0 0.0 Tucson, AZ 17.9 9.6 10.4 14.2 13.4 11.9 19.7 14.3 Median 6.9 3.3 3.8 6.8 9.8 4.2 19.8 3.2
Primary City
aQuestion was asked of arrestees who said they had used the drug in the past year. bQuestion was asked of arrestees who said they obtained the drug during the past 30 days.
Note:
Table 8: Use and Acquisition of HEROIN Among Adult Female Arrestees, 2000 Acquired Heroin in Past 30 Days
% of Arrestees
Mean Number of Daysb
Average No. of Days in Past 30
Days Used Heroina
Arrestees Reporting Heroin Use (%)Arrestees Testing Positive for Opiates (%)
In sites where the number of arrestees acquiring the drug is small, these findings have low statistical reliability and should be interpreted cautiously. N/A = Not Applicable.
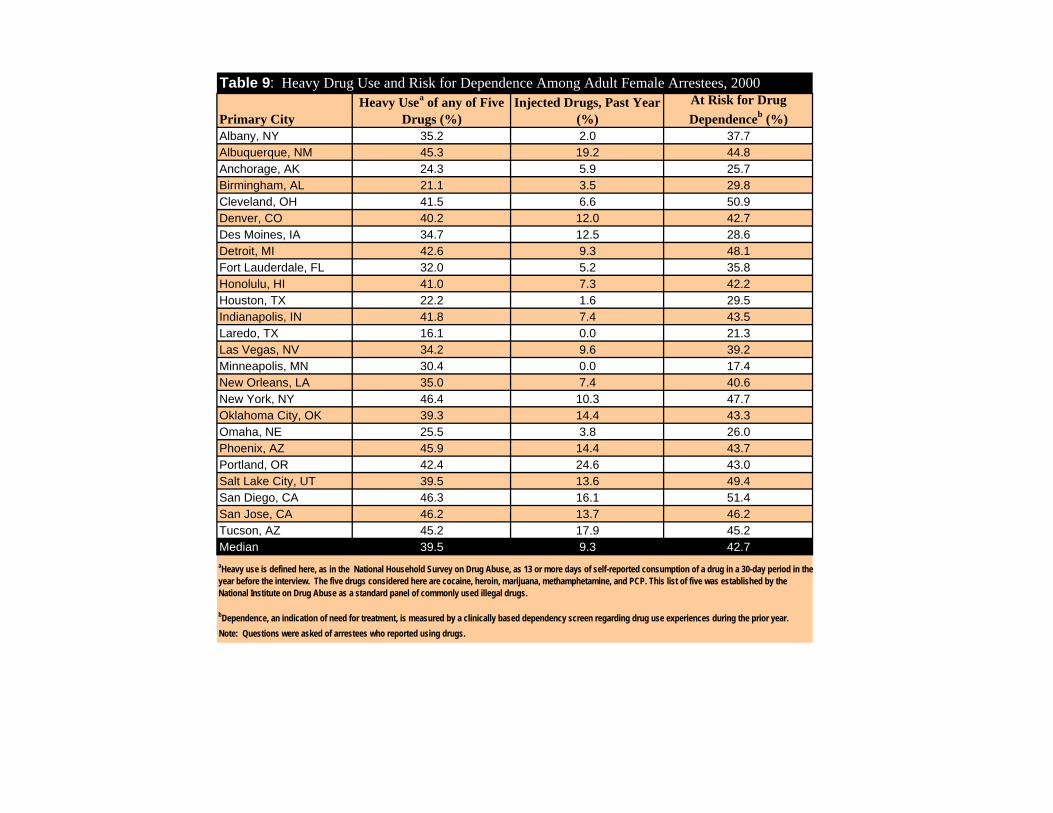
Table 9: Heavy Drug Use and Risk for Dependence Among Adult Female Arrestees, 2000
Primary City Heavy Usea of any of Five
Drugs (%) Injected Drugs, Past Year
(%) At Risk for Drug Dependenceb (%)
Albany, NY 35.2 2.0 37.7 Albuquerque, NM 45.3 19.2 44.8 Anchorage, AK 24.3 5.9 25.7 Birmingham, AL 21.1 3.5 29.8 Cleveland, OH 41.5 6.6 50.9 Denver, CO 40.2 12.0 42.7 Des Moines, IA 34.7 12.5 28.6 Detroit, MI 42.6 9.3 48.1 Fort Lauderdale, FL 32.0 5.2 35.8 Honolulu, HI 41.0 7.3 42.2 Houston, TX 22.2 1.6 29.5 Indianapolis, IN 41.8 7.4 43.5 Laredo, TX 16.1 0.0 21.3 Las Vegas, NV 34.2 9.6 39.2 Minneapolis, MN 30.4 0.0 17.4 New Orleans, LA 35.0 7.4 40.6 New York, NY 46.4 10.3 47.7 Oklahoma City, OK 39.3 14.4 43.3 Omaha, NE 25.5 3.8 26.0 Phoenix, AZ 45.9 14.4 43.7 Portland, OR 42.4 24.6 43.0 Salt Lake City, UT 39.5 13.6 49.4 San Diego, CA 46.3 16.1 51.4 San Jose, CA 46.2 13.7 46.2 Tucson, AZ 45.2 17.9 45.2 Median 39.5 9.3 42.7 aHeavy use is defined here, as in the National Household Survey on Drug Abuse, as 13 or more days of self-reported consumption of a drug in a 30-day period in the year before the interview. The five drugs considered here are cocaine, heroin, marijuana, methamphetamine, and PCP. This list of five was established by the National Institute on Drug Abuse as a standard panel of commonly used illegal drugs.
bDependence, an indication of need for treatment, is measured by a clinically based dependency screen regarding drug use experiences during the prior year. Note: Questions were asked of arrestees who reported using drugs.

Table 10: ALCOHOL Use and Risk for Dependence Among Adult Female Arrestees, 2000
Primary City Binge Drinking,
Past 30 Daysa (%) Heavy Drinking,
Past 30 Daysb (%) At Risk for Alcohol Dependencec
(%) Albany, NY 40.7 13.2 16.7 Albuquerque, NM 46.7 24.8 36.5 Anchorage, AK 60.0 27.6 45.0 Birmingham, AL 28.6 14.3 17.5 Cleveland, OH 39.9 23.5 30.8 Denver, CO 52.9 26.4 36.3 Des Moines, IA 39.6 16.7 19.6 Detroit, MI 40.7 33.3 26.4 Fort Lauderdale, FL 43.8 22.9 26.3 Honolulu, HI 26.5 12.2 22.0 Houston, TX 16.9 6.8 4.9 Indianapolis, IN 33.6 17.2 23.3 Laredo, TX 27.9 13.3 18.3 Las Vegas, NV 34.4 18.8 25.2 Minneapolis, MN 43.5 13.0 23.8 New Orleans, LA 28.0 16.3 19.3 New York, NY 18.8 11.3 15.5 Oklahoma City, OK 43.1 22.4 31.3 Omaha, NE 33.3 16.2 21.0 Phoenix, AZ 37.5 21.5 25.1 Portland, OR 22.6 12.4 18.1 Salt Lake City, UT 25.6 11.5 13.8 San Diego, CA 33.1 18.0 26.6 San Jose, CA 33.3 11.8 23.1 Tucson, AZ 44.2 25.6 31.1 Median 34.4 16.3 23.3
Note: Questions were asked of arrestees who reported consuming alcohol. N/A = Not Applicable.
aBinge drinking is defined in the National Household Survey on Drug Abuse as consumption of five or more drinks on at least one occasion in a month. bHeavy drinking is defined in the National Household Survey on Drug Abuse as consumption of five or more drinks on the same occasion on five or more days in a month.
cDependence, an indication of need for treatment, is measured by a clinically based dependency screen regarding alcohol use experiences during the prior year.
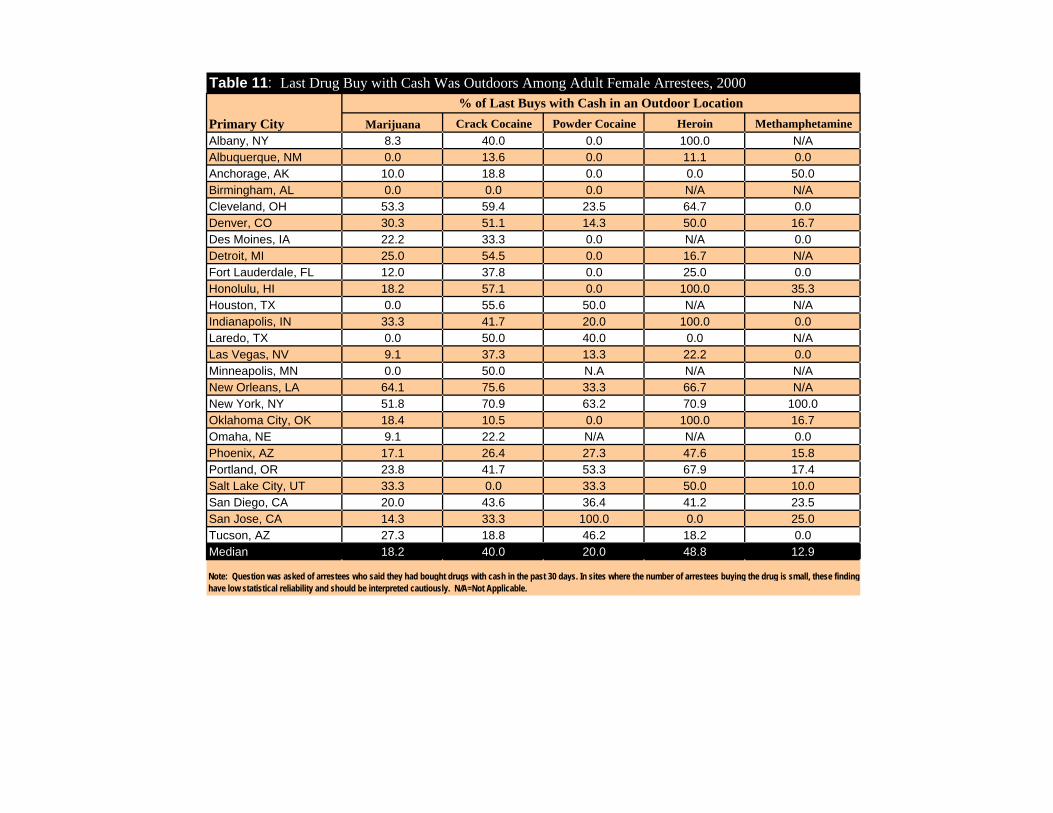
Table 11: Last Drug Buy with Cash Was Outdoors Among Adult Female Arrestees, 2000
Primary City % of Last Buys with Cash in an Outdoor Location
Marijuana Crack Cocaine Powder Cocaine Heroin Methamphetamine Albany, NY 8.3 40.0 0.0 100.0 N/A Albuquerque, NM 0.0 13.6 0.0 11.1 0.0 Anchorage, AK 10.0 18.8 0.0 0.0 50.0 Birmingham, AL 0.0 0.0 0.0 N/A N/A Cleveland, OH 53.3 59.4 23.5 64.7 0.0 Denver, CO 30.3 51.1 14.3 50.0 16.7 Des Moines, IA 22.2 33.3 0.0 N/A 0.0 Detroit, MI 25.0 54.5 0.0 16.7 N/A Fort Lauderdale, FL 12.0 37.8 0.0 25.0 0.0 Honolulu, HI 18.2 57.1 0.0 100.0 35.3 Houston, TX 0.0 55.6 50.0 N/A N/A Indianapolis, IN 33.3 41.7 20.0 100.0 0.0 Laredo, TX 0.0 50.0 40.0 0.0 N/A Las Vegas, NV 9.1 37.3 13.3 22.2 0.0 Minneapolis, MN 0.0 50.0 N.A N/A N/A New Orleans, LA 64.1 75.6 33.3 66.7 N/A New York, NY 51.8 70.9 63.2 70.9 100.0 Oklahoma City, OK 18.4 10.5 0.0 100.0 16.7 Omaha, NE 9.1 22.2 N/A N/A 0.0 Phoenix, AZ 17.1 26.4 27.3 47.6 15.8 Portland, OR 23.8 41.7 53.3 67.9 17.4 Salt Lake City, UT 33.3 0.0 33.3 50.0 10.0 San Diego, CA 20.0 43.6 36.4 41.2 23.5 San Jose, CA 14.3 33.3 100.0 0.0 25.0 Tucson, AZ 27.3 18.8 46.2 18.2 0.0 Median 18.2 40.0 20.0 48.8 12.9
Note: Question was asked of arrestees who said they had bought drugs with cash in the past 30 days. In sites where the number of arrestees buying the drug is small, these findings have low statistical reliability and should be interpreted cautiously. N/A=Not Applicable.

Table 12: Any Failed Drug Buy in the Past 30 Days Among Adult Female Arrestees, 2000
Primary City % Reporting Failed Drug Buy in Last 30 Days
Marijuana Crack Cocaine Powder Cocaine Heroin Methamphetamine Albany, NY 42.9 22.2 50.0 0.0 N/A Albuquerque, NM 23.1 64.0 18.2 18.2 33.3 Anchorage, AK 43.8 50.0 60.0 50.0 0.0 Birmingham, AL 40.0 27.3 33.3 N/A N/A Cleveland, OH 31.7 40.8 33.3 31.6 100.0 Denver, CO 28.2 48.1 36.8 10.0 37.5 Des Moines, IA 60.0 50.0 0.0 N/A 25.0 Detroit, MI 50.0 56.3 100.0 50.0 N/A Fort Lauderdale, FL 41.4 45.2 60.0 20.0 100.0 Honolulu, HI 45.5 57.1 100.0 50.0 42.1 Houston, TX 33.3 50.0 100.0 N/A N/A Indianapolis, IN 41.7 48.8 20.0 50.0 100.0 Laredo, TX 25.0 33.3 50.0 0.0 N/A Las Vegas, NV 35.8 57.4 38.9 30.8 56.1 Minneapolis, MN 100.0 0.0 N/A N/A N/A New Orleans, LA 34.7 27.1 50.0 20.0 N/A New York, NY 38.9 46.2 34.1 37.7 0.0 Oklahoma City, OK 53.0 54.3 33.3 0.0 50.0 Omaha, NE 58.3 44.4 N/A 100.0 0.0 Phoenix, AZ 41.7 29.6 22.2 29.2 42.0 Portland, OR 16.0 23.1 40.0 21.9 29.2 Salt Lake City, UT 60.0 0.0 14.3 33.3 27.3 San Diego, CA 58.6 38.6 36.4 47.1 43.2 San Jose, CA 75.0 66.7 0.0 100.0 7.7 Tucson, AZ 33.3 52.8 43.8 25.0 25.0 Median 41.7 46.2 36.8 30.8 35.4 Note: Question was asked of arrestees who said they had bought drugs with cash in the past 30 days. In sites where the number of arrestees buying a drug with cash in the past 30 days is small, these findings have low statistical reliability and should be interpreted cautiously. N/A = Not Applicable.
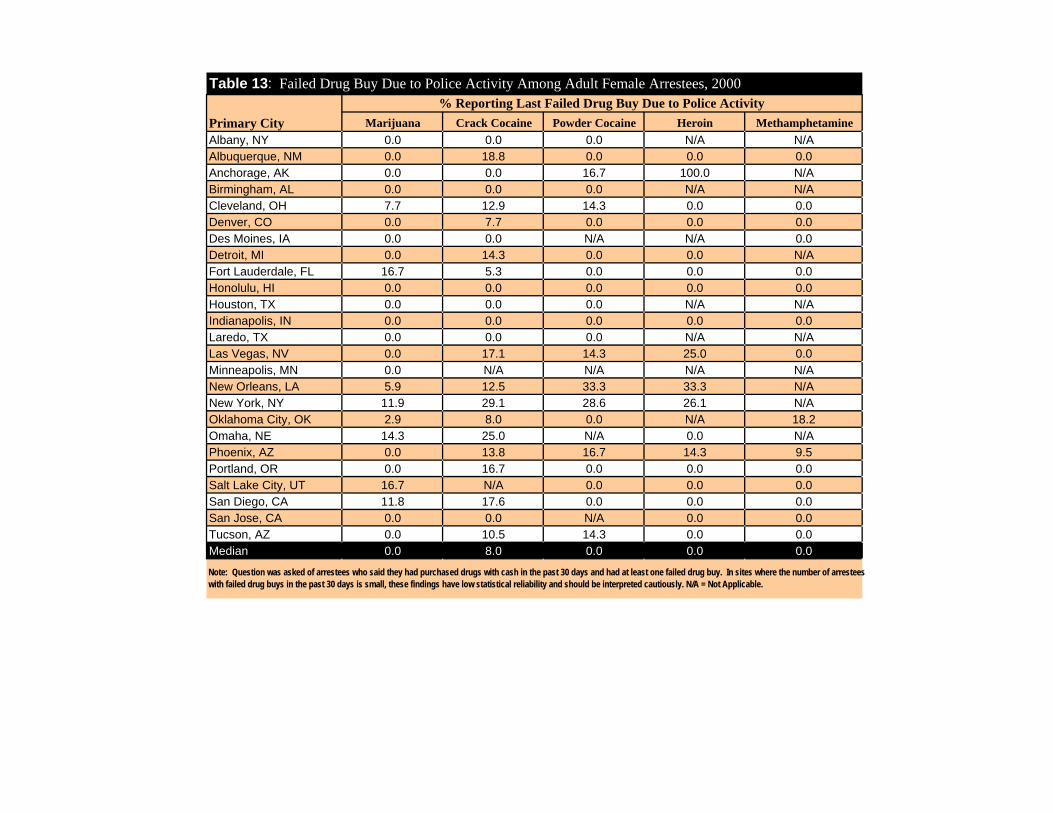
Table 13: Failed Drug Buy Due to Police Activity Among Adult Female Arrestees, 2000
Primary City % Reporting Last Failed Drug Buy Due to Police Activity
Marijuana Crack Cocaine Powder Cocaine Heroin Methamphetamine Albany, NY 0.0 0.0 0.0 N/A N/A Albuquerque, NM 0.0 18.8 0.0 0.0 0.0 Anchorage, AK 0.0 0.0 16.7 100.0 N/A Birmingham, AL 0.0 0.0 0.0 N/A N/A Cleveland, OH 7.7 12.9 14.3 0.0 0.0 Denver, CO 0.0 7.7 0.0 0.0 0.0 Des Moines, IA 0.0 0.0 N/A N/A 0.0 Detroit, MI 0.0 14.3 0.0 0.0 N/A Fort Lauderdale, FL 16.7 5.3 0.0 0.0 0.0 Honolulu, HI 0.0 0.0 0.0 0.0 0.0 Houston, TX 0.0 0.0 0.0 N/A N/A Indianapolis, IN 0.0 0.0 0.0 0.0 0.0 Laredo, TX 0.0 0.0 0.0 N/A N/A Las Vegas, NV 0.0 17.1 14.3 25.0 0.0 Minneapolis, MN 0.0 N/A N/A N/A N/A New Orleans, LA 5.9 12.5 33.3 33.3 N/A New York, NY 11.9 29.1 28.6 26.1 N/A Oklahoma City, OK 2.9 8.0 0.0 N/A 18.2 Omaha, NE 14.3 25.0 N/A 0.0 N/A Phoenix, AZ 0.0 13.8 16.7 14.3 9.5 Portland, OR 0.0 16.7 0.0 0.0 0.0 Salt Lake City, UT 16.7 N/A 0.0 0.0 0.0 San Diego, CA 11.8 17.6 0.0 0.0 0.0 San Jose, CA 0.0 0.0 N/A 0.0 0.0 Tucson, AZ 0.0 10.5 14.3 0.0 0.0 Median 0.0 8.0 0.0 0.0 0.0
Note: Question was asked of arrestees who said they had purchased drugs with cash in the past 30 days and had at least one failed drug buy. In sites where the number of arrestees with failed drug buys in the past 30 days is small, these findings have low statistical reliability and should be interpreted cautiously. N/A = Not Applicable.
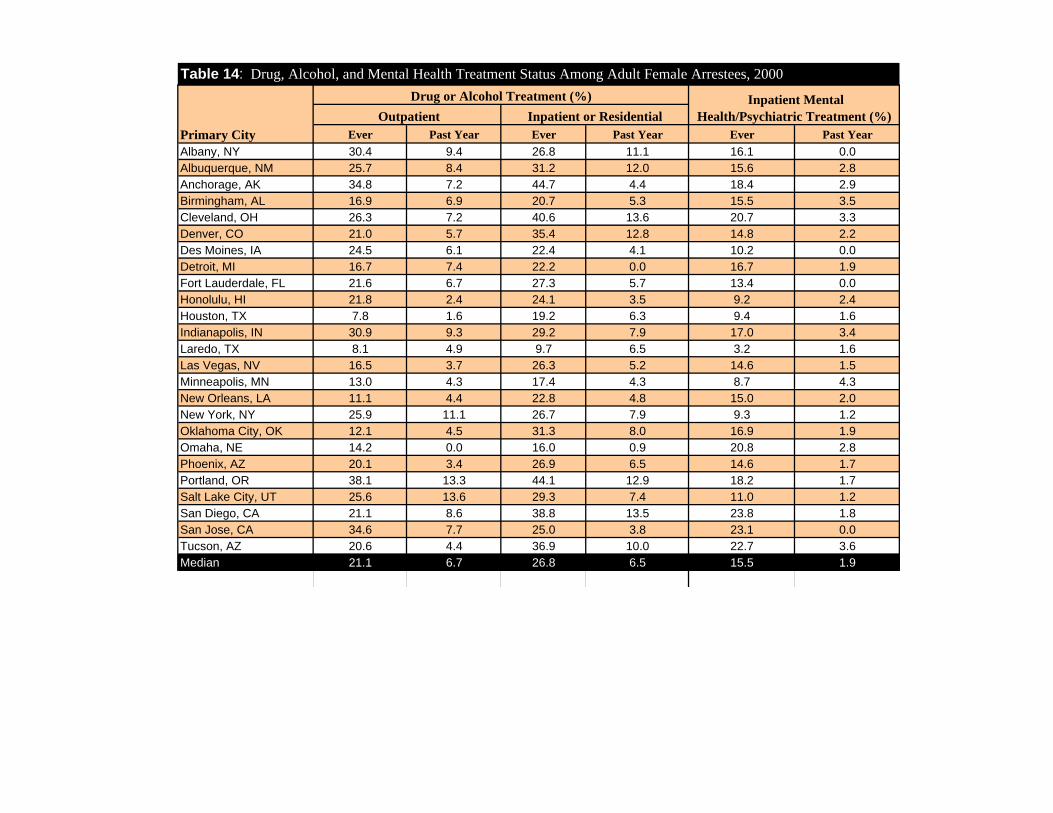
Ever Past Year Ever Past Year Ever Past Year Albany, NY 30.4 9.4 26.8 11.1 16.1 0.0 Albuquerque, NM 25.7 8.4 31.2 12.0 15.6 2.8 Anchorage, AK 34.8 7.2 44.7 4.4 18.4 2.9 Birmingham, AL 16.9 6.9 20.7 5.3 15.5 3.5 Cleveland, OH 26.3 7.2 40.6 13.6 20.7 3.3 Denver, CO 21.0 5.7 35.4 12.8 14.8 2.2 Des Moines, IA 24.5 6.1 22.4 4.1 10.2 0.0 Detroit, MI 16.7 7.4 22.2 0.0 16.7 1.9 Fort Lauderdale, FL 21.6 6.7 27.3 5.7 13.4 0.0 Honolulu, HI 21.8 2.4 24.1 3.5 9.2 2.4 Houston, TX 7.8 1.6 19.2 6.3 9.4 1.6 Indianapolis, IN 30.9 9.3 29.2 7.9 17.0 3.4 Laredo, TX 8.1 4.9 9.7 6.5 3.2 1.6 Las Vegas, NV 16.5 3.7 26.3 5.2 14.6 1.5 Minneapolis, MN 13.0 4.3 17.4 4.3 8.7 4.3 New Orleans, LA 11.1 4.4 22.8 4.8 15.0 2.0 New York, NY 25.9 11.1 26.7 7.9 9.3 1.2 Oklahoma City, OK 12.1 4.5 31.3 8.0 16.9 1.9 Omaha, NE 14.2 0.0 16.0 0.9 20.8 2.8 Phoenix, AZ 20.1 3.4 26.9 6.5 14.6 1.7 Portland, OR 38.1 13.3 44.1 12.9 18.2 1.7 Salt Lake City, UT 25.6 13.6 29.3 7.4 11.0 1.2 San Diego, CA 21.1 8.6 38.8 13.5 23.8 1.8 San Jose, CA 34.6 7.7 25.0 3.8 23.1 0.0 Tucson, AZ 20.6 4.4 36.9 10.0 22.7 3.6 Median 21.1 6.7 26.8 6.5 15.5 1.9
Drug or Alcohol Treatment (%) Inpatient Mental Health/Psychiatric Treatment (%)
Table 14: Drug, Alcohol, and Mental Health Treatment Status Among Adult Female Arrestees, 2000
Primary City Inpatient or ResidentialOutpatient