Embed Size (px)
Citation preview
DRUG ANALYSIS
1
Drug Analysis:
Using HPLC to Identify Two Common Cutting Agents Often Found Illegal within Drugs
Jedidiah Black
A Senior Thesis submitted in partial fulfillment
of the requirements for graduation
in the Honors Program
Liberty University
Fall 2021
DRUG ANALYSIS
2
Acceptance of Senior Honors Thesis
This Senior Honors Thesis is accepted in partial
fulfillment of the requirements for graduation from the
Honors Program of Liberty University.
___________________________
Chad Snyder, Ph.D.
Thesis Chair
___________________________
James T. McClintock, Ph.D.
Committee Member
___________________________
James H. Nutter, D.A.
Honors Director
___________________________
Date
DRUG ANALYSIS
3
Abstract
Oftentimes, illegal drugs are cut with additional substances, known as cutting agents.
These cutting agents fall into two categories: Diluents and adulterants. Diluents have no
physiological effect on the user and simply allow the distributor to give the perception of “more
product made.” Common examples of diluents are usually everyday house-hold commodities
(i.e., sugar or corn starch). On the other hand, adulterants are used to mimic or enhance the drugs
physiological effects (i.e., caffeine in cocaine). As such, these do have drug-like properties (i.e.,
CNS stimulation or depression, etc.). This thesis seeks to use High-Performance Liquid
Chromatography (HPLC) to efficiently detect and quantify mixtures of these cutting agents. It
must be stated that this research did not examine any drug (over-the-counter or illegal). Instead
this research focused on two legal cutting agents only. In summary, there are three goals for this
project: (1) Research HPLC methods that can detect known concentrations of two common
cutting agents, (2) identify these cutting agents as compared to the standards made in the
laboratory, and (3) determine a method of analysis that can successfully detect these cutting
agents in under ten minutes.
DRUG ANALYSIS
4
Drug Analysis:
Using HPLC to Identify Two Common Cutting Agents Often Found within Illegal Drugs
Introduction
Drug use is prevalent throughout the world and especially in America. According to The
National Survey on Drug Use Health, there were 19.7 million adults in America that struggled
with drug abuse in 2017 (Substance Abuse, 2018). Another survey, performed by the National
Institute on Drug Abuse, showed that nearly half of all high schoolers at some point used
marijuana (Kaliszewski, 2019). The use of illicit drugs is a common occurrence throughout the
U.S., and with multiple states beginning to legalize the use of certain hard drugs, it is only to be
expected that drug usage will increase. Therefore, being able to identify and locate the source of
drug production is imperative. By identifying trends in drug distribution, prosecutors and law
enforcement can use this information as a possible method of identifying clandestine sources. A
way these original drug sources can be revealed is through the chemical makeup of the illicit
drug: Specifically, through identifying their respective adulterant and diluent ratios.
Cutting Agents: Adulterants and Diluents
Illicit drugs, which at times can be sold in pure form, are often instead combined, or
“cut,” with an additional substance besides the drug itself. These additional substances are
divided into two categories: Adulterants and diluents. While both are used to cut drug supplies,
adulterants and diluents have different effects. However, before defining them, it is important to
address a common misconception regarding cutting agents. Frequently, the public perceives drug
dealers as angry, sneaky criminals that are always seeking to harm their customers by cutting
their drugs with harmful, dangerous materials (for example, household cleaning products, brick
DRUG ANALYSIS
5
dust, ground glass, etc.) (Broséus et. al., 2016). Cutting is believed to harm consumers and to
increase profit. While it is true that the use of cutting stems from a dealer’s desire to increase
profits, it is important to remember that drug dealing is a business at its core. Although certainly
illegal, drug dealing still relies on repeat customers, just as in a business. As J. Broséus et. al.
(2016) points out, “poisoning customers does not make good business sense regarding income
supply or reputation” (p. 2). Some dealers, they state, even express concern over their customers’
well-being (Broséus et. Al., 2016). Therefore, when speaking of cutting drugs, it is important to
dispel the idea that drug dealers are seeking to harm their customers. As it was already pointed
out, that would be bad for business.
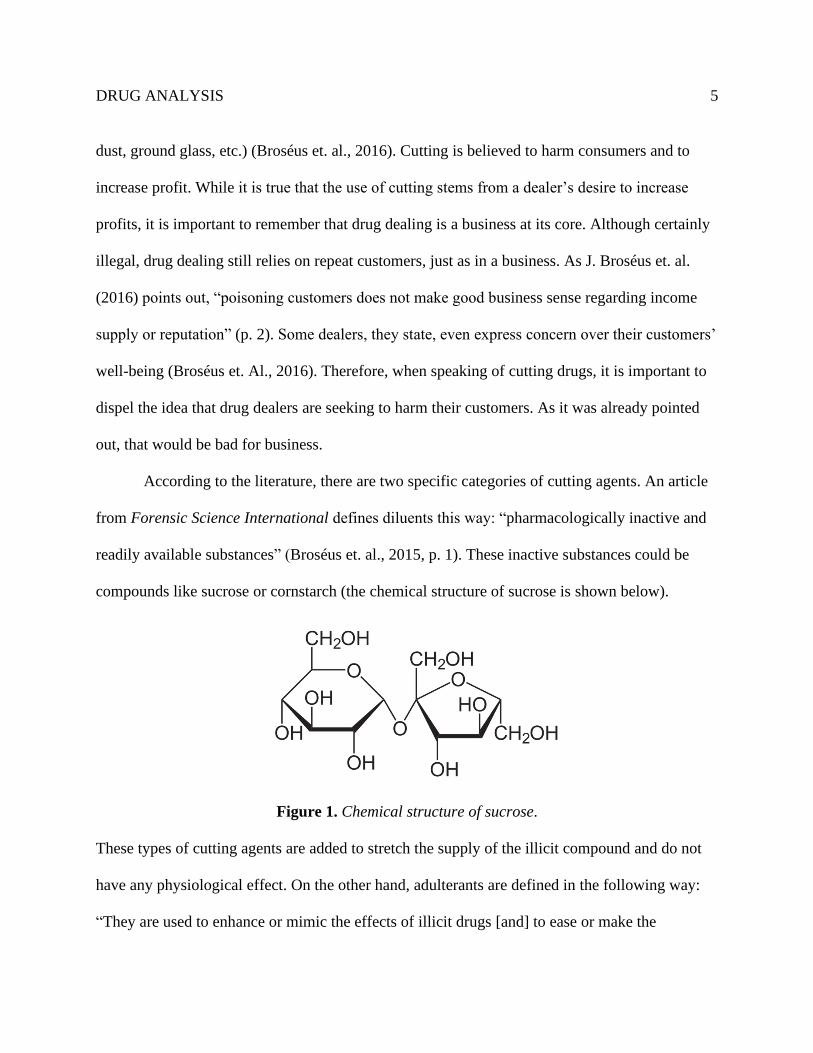
According to the literature, there are two specific categories of cutting agents. An article
from Forensic Science International defines diluents this way: “pharmacologically inactive and
readily available substances” (Broséus et. al., 2015, p. 1). These inactive substances could be
compounds like sucrose or cornstarch (the chemical structure of sucrose is shown below).
Figure 1. Chemical structure of sucrose.
These types of cutting agents are added to stretch the supply of the illicit compound and do not
have any physiological effect. On the other hand, adulterants are defined in the following way:
“They are used to enhance or mimic the effects of illicit drugs [and] to ease or make the
DRUG ANALYSIS
6
administration of the illicit drug more efficient” (Broséus et. Al., 2016, p. 4). Furthermore,
adulterants are “pharmacologically active substances, usually more expensive and less available
than diluents” (Broséus et. al., 2016, p. 4). For example, an adulterant for cocaine could be
caffeine.
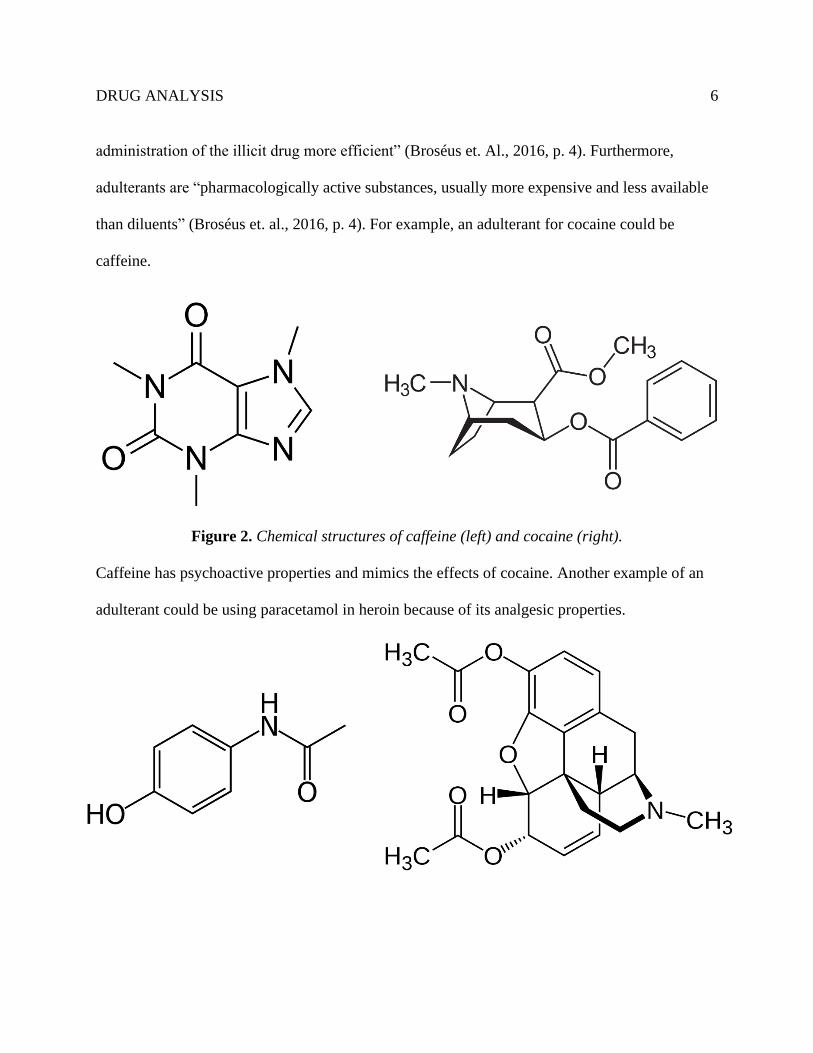
Figure 2. Chemical structures of caffeine (left) and cocaine (right).
Caffeine has psychoactive properties and mimics the effects of cocaine. Another example of an
adulterant could be using paracetamol in heroin because of its analgesic properties.
DRUG ANALYSIS
7
Because these compounds’ properties mimic the illicit drug’s properties, adulterants are added
strategically. Diluents have no physiological or psychoactive effects. As such, are added only to
stretch supply.
Identification of adulterants and diluents in illicit drug samples may be able to help
identify the distributor and distribution patterns. As mentioned already, adulterants are added
strategically to the drug samples, both in type and amounts. This implies some consistency in the
way that these drugs are produced. If cutting methods can be studied, as Broséus (2016) points
out, at the production level, country of origin and country of consumption, then this information
may be able to help incriminate dealers. For example, lidocaine and sugar were the two major
cutting agents found in cocaine in the 1980s; this changed in the 1990s when lidocaine was no
longer found in cocaine samples in Spain (Broséus et. al., 2016). If a drug sample was seized in
Spain in the 1990s, but was found to contain lidocaine, this would indicate that the drug was
produced in the 1980s. Therefore, this information would help investigators to potentially
determine the time the illicit drugs were produced and narrow the list of suspects. Some
countries also have specific adulterants that are used during drug production, which may also be
able to reveal the geographical origin of the drug itself (Broséus, 2015). An efficient method of
analysis for adulterant or diluent identification would be beneficial to investigators by helping
locate sources of drug distribution.
Drug Analysis Methods
There have been different methods of analysis put forth in the literature. The following
are a few that will be briefly discussed: Capillary Electrophoresis, SPE/TLC, TLC, Gas
Chromatography, and HPLC (spell out acronymns).
DRUG ANALYSIS
8
Capillary electrophoresis was put forth as a method of screening drugs for cutting agents.
Barreto et al. (2020) performed experiments using Capillary Electrophoresis with capacity
coupled contactless conductivity detection to quantify different drugs (some examples were
cocaine, lidocaine, chloride, etc.). The researchers developed an expedient method of analysis,
under two and a half minutes, and saw their method used in the field in 2018 (Barreto et al.,
2020). Time is an important issue as forensic labs need to analyze a constant, heavy stream of
drug samples quickly and accurately.
Another method mentioned in the literature is thin-layered chromatography (TLC).
Kochana et al. used TLC to identify the active components in ecstasy tablets (10 March 2005).
Ecstasy, or 3,4-methylenedioxy-methamphetamine (MDMA), is a psychoactive drug made
synthetically to alter mood and perception. Very popular as a nightclub drug, ecstasy produces
feelings of increased energy, warm feelings, and distorted sensory perception, among other
effects (MDMA, 2020). Ecstasy is often laced with cutting agents. Using a methanol and
phosphate buffer, Kochana and her team were able to isolate ecstasy from its adulterants and
diluents (caffeine, glucose, and starch to name a few). Another research group used TLC along
with solid phase extraction (SPE) to separate and profile the additional components of ecstasy
(14 September 2005). Specifically, this group used SPE/TLC to separate the impurities in 3,4-
methylenedioxy-methamphetamine, which is the main active component in ecstasy.
Gas chromatography was performed as an additional method of drug screening.
Amphetamines (central nervous stimulants that can affect brain activity and induce higher
energy, focus, and confidence) (Editorial Staff, 2021) have become the most popular illegal drug
second only to cannabis (Aljohar et. al., 2019). Fenethylline, a type of amphetamine, typically
DRUG ANALYSIS
9
contains several adulterants and diluents. Aljohar et. al., (2019) experimented with fenethylline
samples from Saudi Arabia. Aljohar et. al. used gas chromatography coupled with mass
spectrometry and were able to separate the amphetamine from its diluents and adulterants.
The final analytical method to be discussed is High Performance Liquid Chromatography
(HPLC). One technique put forth in the literature is micro-HPLC. Vinkovic et. al. (2018)
analyzed the purity of cocaine seized by Austrian police from 2012 until 2017 using this method.
Employing gradient elution and UV detection at four different wavelengths, the researchers
developed a method to quantify 110 cocaine samples. They also analyzed the adulterants found
in cocaine, among which were caffeine and lidocaine (Vinkovic et. al., 2018).
HPLC has also been used to analyze components of soft drinks, namely quinine
(Samanidou et al., 2004). Samanidou et. al. used a simple and reverse-phase high performance
liquid chromatography to quantify analytical standards of quinine and salicylic acid. This method
will be examined in more depth than the other methods discussed later because of its relevance to
this thesis.
High Performance Liquid Chromatography
Samanidou et. al. (2004) used the following instrumentation: An SSI 222D pump to pass
their mobile phase to a Kromasil, C18, 5m, 250 x 4 mm2, MZ analytical column. A Rheodyne
9125 injection valve with a 50 L loop was used along with an RF-551 Shimadzu fluorescence
detector. An HP3396A integrator quantitatively determined the eluted peaks. An Alltech
Associates glass vacuum-filtration apparatus was used for the filtration of the buffer solution
through Whatman 0.2-m-membrane filters. Solvents were degassed by helium sparging prior to
DRUG ANALYSIS
10
use. A Transonic 460/H Ultrasonic bath sonicated the compounds to help with dissolution
(Samanidou et. al., 2004).
As far as materials, the quinine that was used for this experiment was acquired from
Sigma Aldrich. Methanol, acetonitrile, ammonium acetate, and salicylic acid were all acquired
from Merck. Deionised water was used for all dilutions. Soft drinks were purchased that
contained quinine: Ivi tonic water (Pepsico-Ivi, Athens, Greece), Britvic Indian tonic and Britvic
bitter lemon drink (Britvic Soft Drinks LtD), Tuborg tonic water, Schweppes Indian tonic,
Schweppes bitter lemon, and tonic water (DIA) (Samanidou et. al., 2004).
Analytical standards were prepared by the researchers from a stock standard solution of
100 ng/L. The standards themselves ranged from 0.01-0.7 ng/L in concentration and were all
diluted from the stock solution (Samanidou et. al., 2004).
The seven drinks were analyzed over eight consecutive days. The data showed that HPLC
was unaffected by food additives (sugar, glucose, artificial sweeteners, etc…) and that the
concentration levels of quinine were able to be quantified. This method allowed for analysis to
be completed within five minutes (Samanidou et. al., 2004).
The article by Samanidou et. al. (2004) was examined in depth because our research
sought to conduct similar experimentation using the laboratory equipment in Liberty
University’s Center for Natural Sciences. There are three goals for this project: (1) Research
HPLC methods that can detect known concentrations of the cutting agent, (2) identify these
cutting agents as compared to the standards made in the laboratory, and (3) determine a method
of analysis that can be run successfully in under ten minutes.
Quinine and Salicylic Acid
DRUG ANALYSIS
11
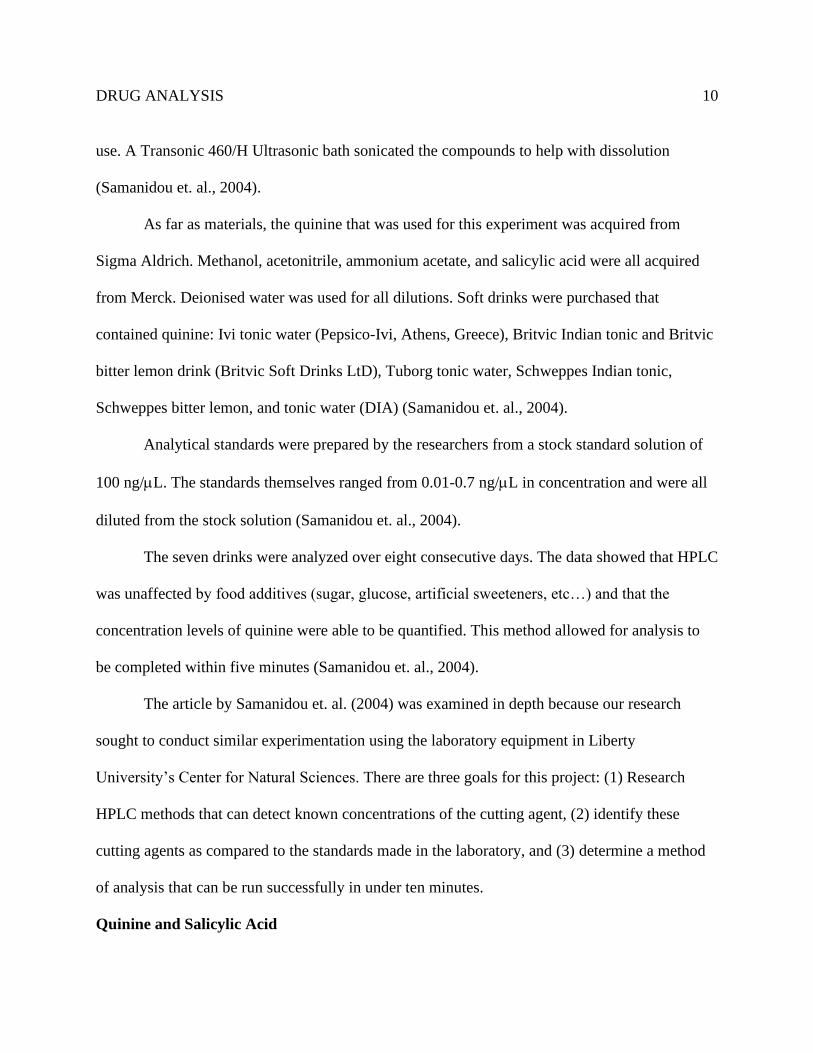
Quinine is a naturally-occurring alkaloid derived from the bark of the Cinchonca tree that
grows in South America. Quinine is a white crystalline solid that is made up of two major fused-
ring systems. The following figure shows the chemical structure:
Figure 1. Chemical structure of quinine.
Quinine has multiple medicinal properties, among which are painkilling and anti-inflammatory
properties. It is also used in bitter tasting drinks like soda and tonics (Dawidowicz et. al., 2018).
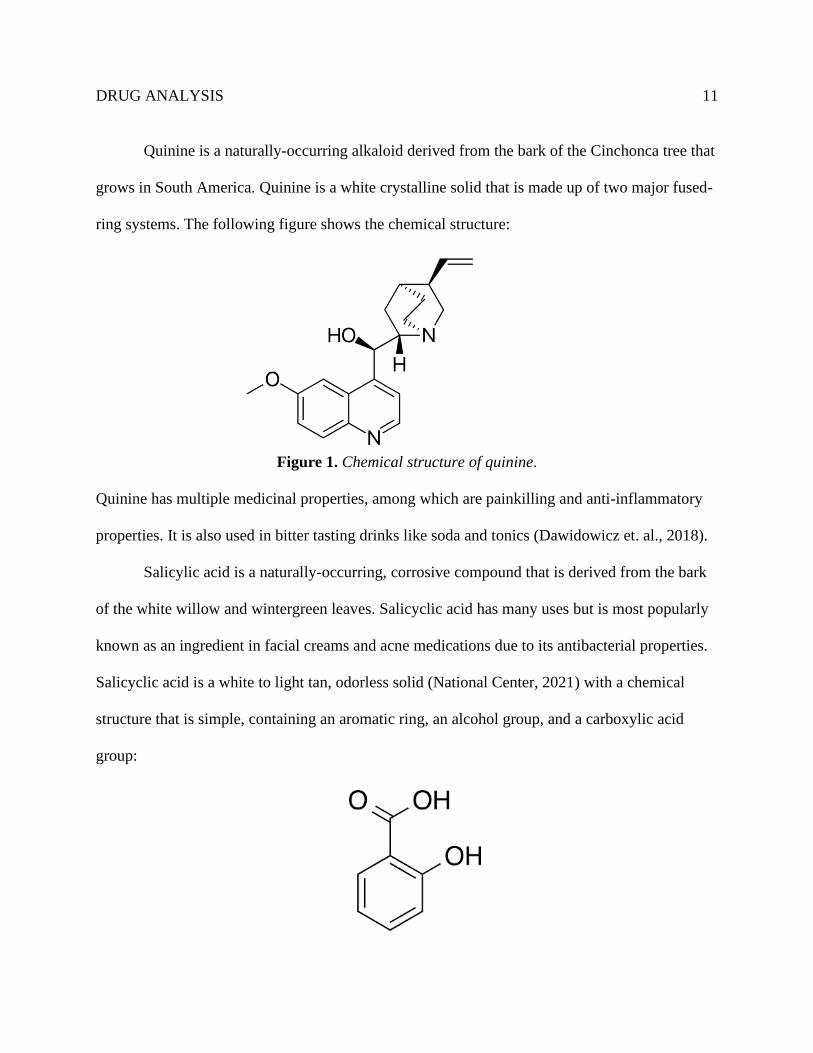
Salicylic acid is a naturally-occurring, corrosive compound that is derived from the bark
of the white willow and wintergreen leaves. Salicyclic acid has many uses but is most popularly
known as an ingredient in facial creams and acne medications due to its antibacterial properties.
Salicyclic acid is a white to light tan, odorless solid (National Center, 2021) with a chemical
structure that is simple, containing an aromatic ring, an alcohol group, and a carboxylic acid
group:
DRUG ANALYSIS
12
Figure 2. Chemical structure of salicylic acid.
Experimental
Instrumentation
Experimentation was carried out using an Agilent 1260 Infinity Quaternary pump, type
ID G1311B, serial number DEADO 16907 (Agilent, Santa Clara, California). This pump was
used to carry the mobile phase through the analytical column, Bondapak, C18, 1 m, 3.9 x 150
mm2, Waters Corporation (Milford, Massachuesetts). Injection was carried out through the built-
in injection valve and sample detection was achieved by an Agilent Diode Array Detector, Type
ID G1315C, serial number DEAA 203238. Solvents were degassed through the built-in
integrated vacuum degassing unit.
Reagents and Materials
The following reagents were used: Quinine (ACROS Organics, 99% anhydrous), salicylic
acid (ACROS Organics, 99+%). The mobile phase was comprised of the following reagents:
Acetic acid (RICCA Chemical, glacial ACS grade), Methanol (ACROS Organics, 100%),
Deionized water, and 10 mM Na2HPO4 – 10 mM Na2B4O4 (CAD prepared). All water was
deionized through a Millipore Sigma Milli-Q® Direct 8 Water Purification System (Darmstadt,
Germany).
Standardization
Standardization Definition
DRUG ANALYSIS
13
Standardization, as defined by the American Chemical Society’s Committee on
Environmental Improvement, is the process of determining the relationship between a signal and
an amount of an analyte present in a sample (ACS Committee, 1980). A standard is divided into
two categories: Primary standards and secondary standards. Harvey (2008) provides three
requirements a standard must satisfy in order to be primary: It must have a known stoichiometry,
have a known purity, and must be stable for long term storage. If a standard fails to meet these
criteria, it is a secondary standard, and these are made relative to primary standards. Typically,
standards are prepared using a pure compound with a known concentration in a suitable solvent.
Oftentimes, multiple concentrations are needed for experimentation. Thus, the original standard
is then serially diluted from a stock solution to obtain multiple, desired concentrations of
standard. In our research, standards were made from using a stock solution of both quinine and
salicylic acid. Both stock solutions were serially diluted with water to obtain 0.1 ppm, 0.3 ppm,
0.5 ppm, and 0.7 ppm of each (8 standards in total).
Preparation of Experimental Standard Solutions
Standards were prepared using a 1 L stock solution of each salicylic acid and quinine
(each with a concentration of 100 ppm in DI water). Working standards were prepared using
these stock solutions by appropriate dilution to yield an individual standard of each at 0.1 ppm,
0.3 ppm, 0.5 ppm, and 0.7 ppm respectively. An additional standard was made that was 0.3 ppm
quinine and 0.3 ppm salicylic acid combined. Each standard was 100 mL and stored in a Pyrex,
A grade, 100 .08 mL volumetric flask. Standards were stoppered, covered with parafilm, and
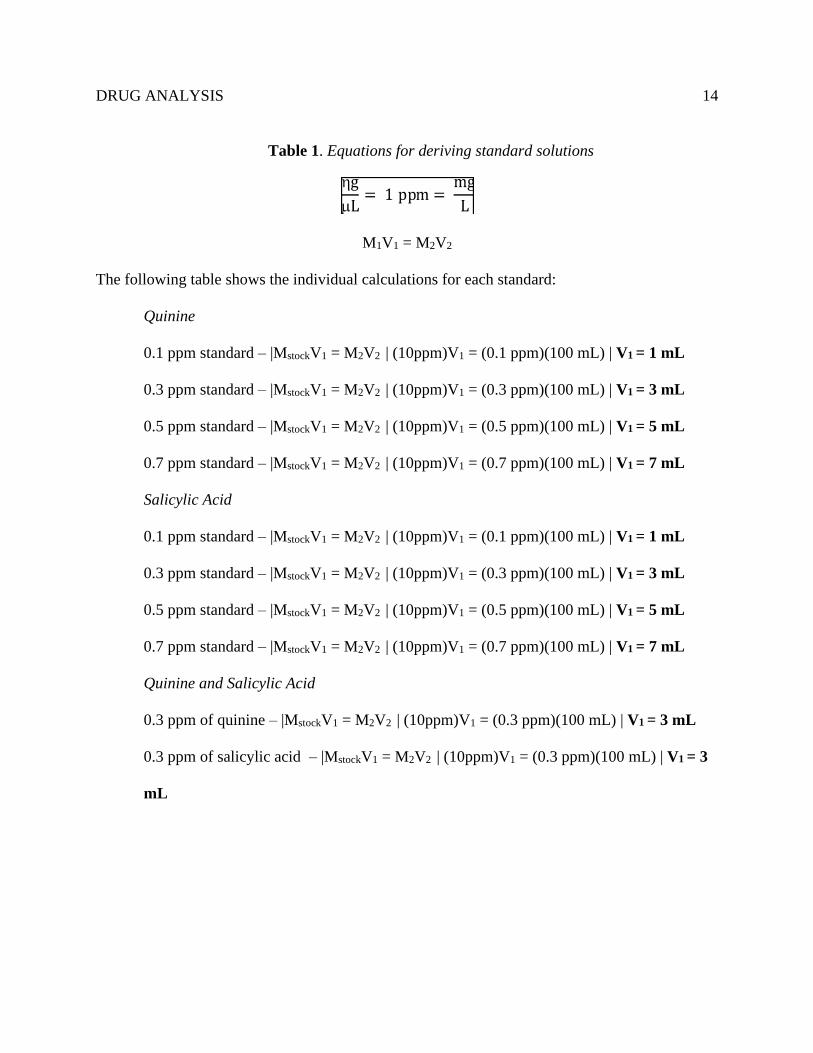
refrigerated for storage. The following table shows the equation and conversions that were used:
DRUG ANALYSIS
14
Table 1. Equations for deriving standard solutions
M1V1 = M2V2
The following table shows the individual calculations for each standard:
Quinine
0.1 ppm standard – |MstockV1 = M2V2 | (10ppm)V1 = (0.1 ppm)(100 mL) | V1 = 1 mL
0.3 ppm standard – |MstockV1 = M2V2 | (10ppm)V1 = (0.3 ppm)(100 mL) | V1 = 3 mL
0.5 ppm standard – |MstockV1 = M2V2 | (10ppm)V1 = (0.5 ppm)(100 mL) | V1 = 5 mL
0.7 ppm standard – |MstockV1 = M2V2 | (10ppm)V1 = (0.7 ppm)(100 mL) | V1 = 7 mL
Salicylic Acid
0.1 ppm standard – |MstockV1 = M2V2 | (10ppm)V1 = (0.1 ppm)(100 mL) | V1 = 1 mL
0.3 ppm standard – |MstockV1 = M2V2 | (10ppm)V1 = (0.3 ppm)(100 mL) | V1 = 3 mL
0.5 ppm standard – |MstockV1 = M2V2 | (10ppm)V1 = (0.5 ppm)(100 mL) | V1 = 5 mL
0.7 ppm standard – |MstockV1 = M2V2 | (10ppm)V1 = (0.7 ppm)(100 mL) | V1 = 7 mL
Quinine and Salicylic Acid
0.3 ppm of quinine – |MstockV1 = M2V2 | (10ppm)V1 = (0.3 ppm)(100 mL) | V1 = 3 mL
0.3 ppm of salicylic acid – |MstockV1 = M2V2 | (10ppm)V1 = (0.3 ppm)(100 mL) | V1 = 3
mL
DRUG ANALYSIS
15
For the combined standard of both quinine and salicylic acid, 0.3 ppm salicylic acid were
combined with 0.3 ppm quinine to produce a combined total of 0.6 ppm of solution in DI water.
Then, 6 mL of this solution was combined with 94-mL of DI water to produce a stock that was a
combined 0.3 ppm of quinine and 0.3 ppm of salicylic acid.
Chromatographic Conditions
The analytical column was a Bondapak, C18, 1 m, 3.9 x 150 mm2 column. The mobile
phase consisted of acetic acid, methanol, CAD prepared Na2HPO4 – Na2B4O4, and deionized
water. The method was varied in order to find the optimal ratio of the mobile phase for the
fastest procedural time.
Results and Discussion
Trial 1
Experimentation
Experimentation was carried out using an Agilent 1260 Infinity Quaternary pump, type
ID G1311B, serial number DEADO 16907 (Agilent, Santa Clara, California). This pump was
used to carry the mobile phase through the analytical column, Bondapak, C18, 1 m, 3.9 x 150
mm2, Waters Corporation (Milford, Massachusetts). Injection was carried out through the built-
in injection valve and sample detection was achieved by an Agilent Diode Array Detector, Type
ID G1315C, serial number DEAA 203238. Solvents were degassed through the built-in
integrated vacuum degassing unit. The method used was 70% DiH2O (.1% TFA), 20% Methanol
(100% BASILE), 9% acetonitrile (.1% TFA), and 1.0% glacial acetic acid (100% RICA), with a
run time of 10 minutes per sample. Standard HPLC vials were used and 200 L samples of the
standards were pipetted into the vials using a Poseidon, Genesee Scientific, 20-200 L transfer
DRUG ANALYSIS
16
pipette. Nine samples in total were run, which were one of each of the following: 0.1 ppm
salicylic acid, 0.3 ppm salicylic acid, 0.5 ppm salicylic acid, 0.7 ppm salicylic acid, 0.1
ppm quinine, 0.3 ppm quinine, 0.5 ppm quinine, 0.7 ppm quinine, and a .03 ppm salicylic
acid/quinine mix.
Results
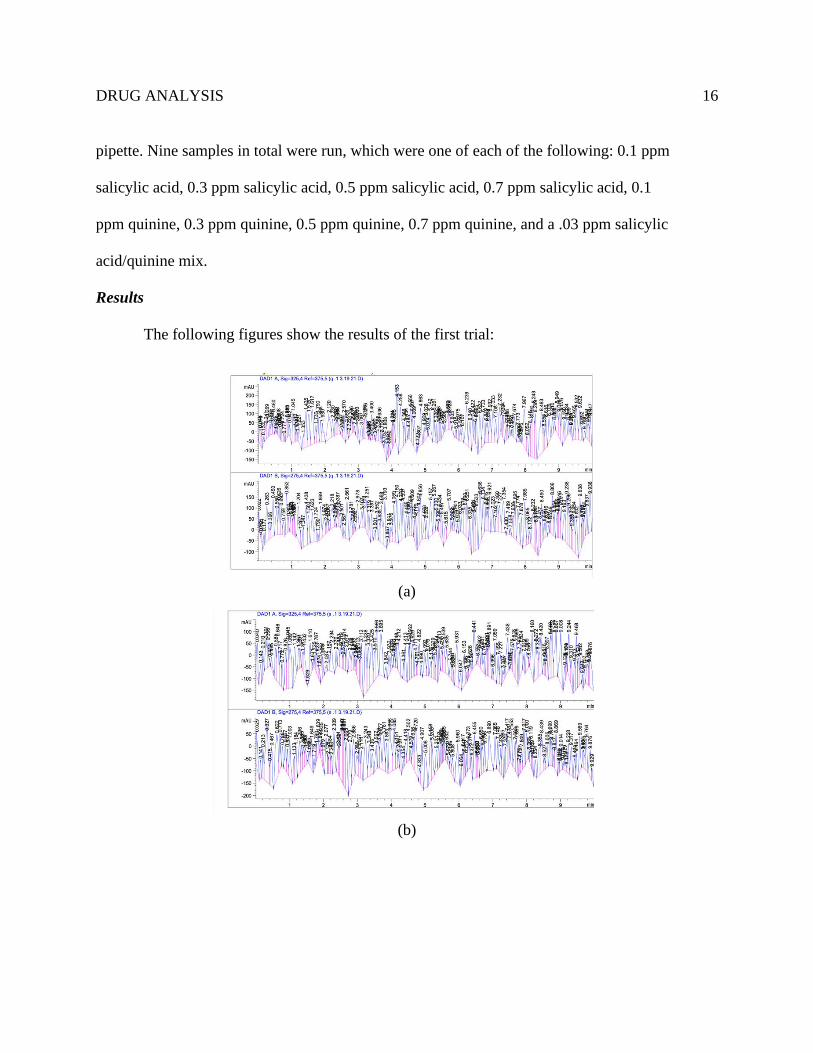
The following figures show the results of the first trial:
(a)
(b)
DRUG ANALYSIS
17
(c)
Figure 6. The HPLC results of (a) 0.1 ppm quinine standard (b) 0.1 ppm salicylic acid standard
and (c) the combined 0.3 ppm quinine, 0.3 ppm salicylic acid standard.
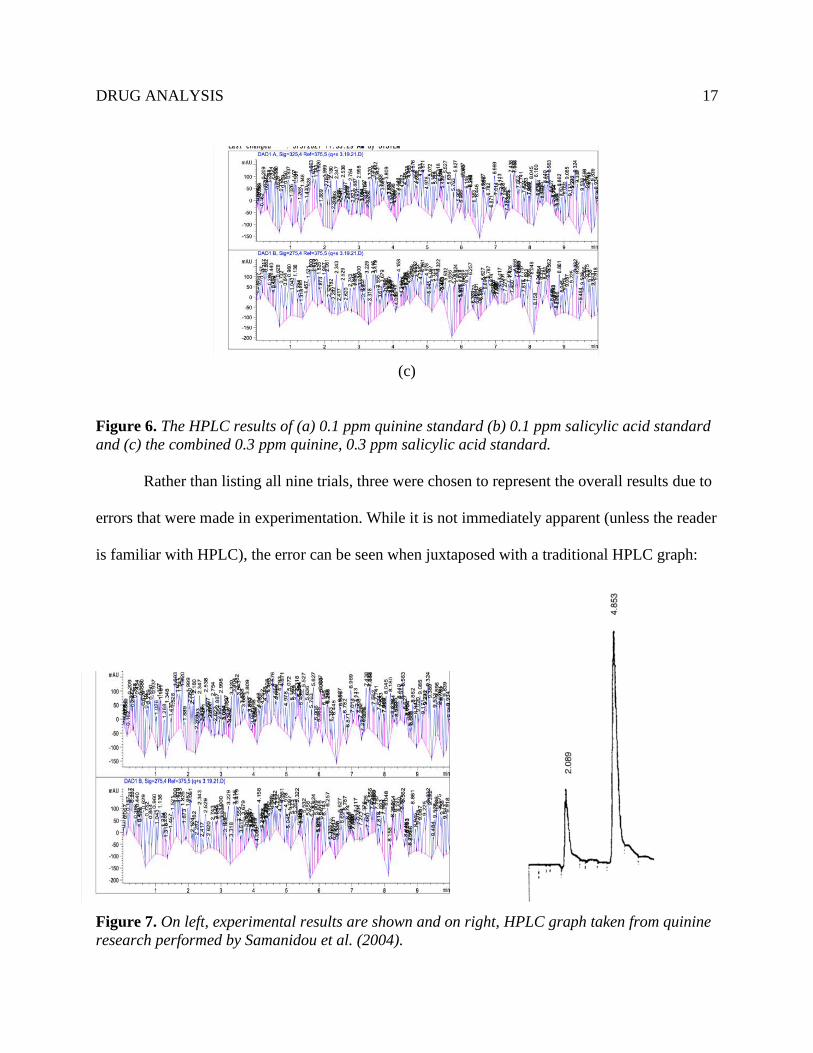
Rather than listing all nine trials, three were chosen to represent the overall results due to
errors that were made in experimentation. While it is not immediately apparent (unless the reader
is familiar with HPLC), the error can be seen when juxtaposed with a traditional HPLC graph:
Figure 7. On left, experimental results are shown and on right, HPLC graph taken from quinine
research performed by Samanidou et al. (2004).
DRUG ANALYSIS
18
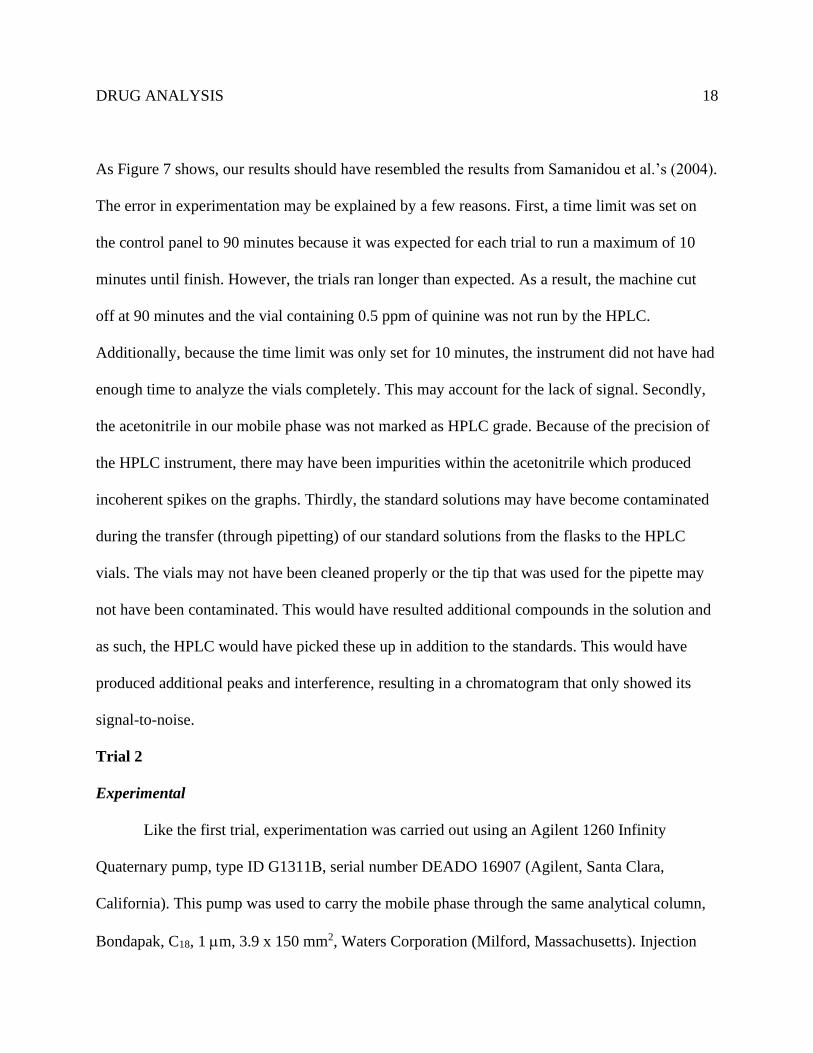
As Figure 7 shows, our results should have resembled the results from Samanidou et al.’s (2004).
The error in experimentation may be explained by a few reasons. First, a time limit was set on
the control panel to 90 minutes because it was expected for each trial to run a maximum of 10
minutes until finish. However, the trials ran longer than expected. As a result, the machine cut
off at 90 minutes and the vial containing 0.5 ppm of quinine was not run by the HPLC.
Additionally, because the time limit was only set for 10 minutes, the instrument did not have had
enough time to analyze the vials completely. This may account for the lack of signal. Secondly,
the acetonitrile in our mobile phase was not marked as HPLC grade. Because of the precision of
the HPLC instrument, there may have been impurities within the acetonitrile which produced
incoherent spikes on the graphs. Thirdly, the standard solutions may have become contaminated
during the transfer (through pipetting) of our standard solutions from the flasks to the HPLC
vials. The vials may not have been cleaned properly or the tip that was used for the pipette may
not have been contaminated. This would have resulted additional compounds in the solution and
as such, the HPLC would have picked these up in addition to the standards. This would have
produced additional peaks and interference, resulting in a chromatogram that only showed its
signal-to-noise.
Trial 2
Experimental
Like the first trial, experimentation was carried out using an Agilent 1260 Infinity
Quaternary pump, type ID G1311B, serial number DEADO 16907 (Agilent, Santa Clara,
California). This pump was used to carry the mobile phase through the same analytical column,
Bondapak, C18, 1 m, 3.9 x 150 mm2, Waters Corporation (Milford, Massachusetts). Injection
DRUG ANALYSIS
19
was carried out through the built-in injection valve and sample detection was achieved by an
Agilent Diode Array Detector, Type ID G1315C, serial number DEAA 203238. Solvents were
degassed through the built-in integrated vacuum degassing unit. The same method was used as
the previous trial (70% DiH2O, 0.1% TFA, 20% Methanol, 100% BASILE, 9% acetonitrile, and
1.0% glacial acetic acid, 100% RICA) except this time the acetonitrile that was used was HPLC
grade pure acetonitrile supplied by Eastman Kodak Company. The run time was extended in this
trial to 15 minutes per sample instead of 10 minutes. The same standard HPLC vials were used
and 200 L samples of the standards were pipetted into the vials using a Poseidon, Genesee
Scientific, 20-200 L transfer pipette. The same nine trials were run.
Results
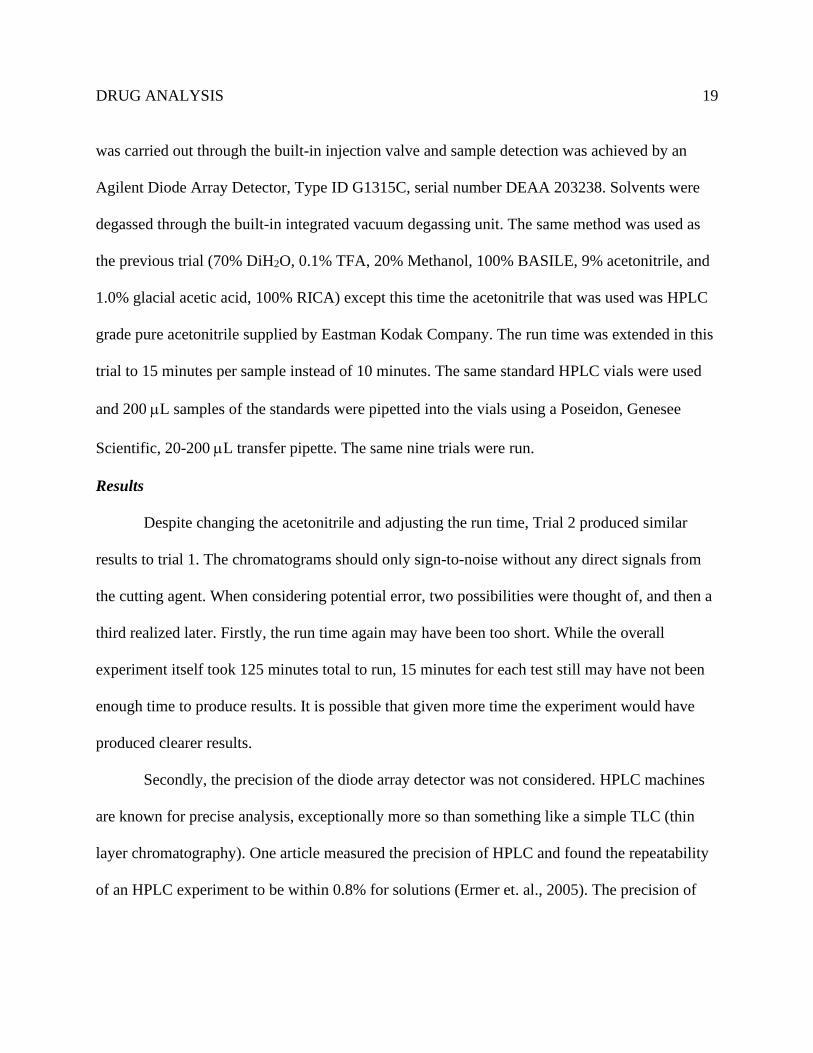
Despite changing the acetonitrile and adjusting the run time, Trial 2 produced similar
results to trial 1. The chromatograms should only sign-to-noise without any direct signals from
the cutting agent. When considering potential error, two possibilities were thought of, and then a
third realized later. Firstly, the run time again may have been too short. While the overall
experiment itself took 125 minutes total to run, 15 minutes for each test still may have not been
enough time to produce results. It is possible that given more time the experiment would have
produced clearer results.
Secondly, the precision of the diode array detector was not considered. HPLC machines
are known for precise analysis, exceptionally more so than something like a simple TLC (thin
layer chromatography). One article measured the precision of HPLC and found the repeatability
of an HPLC experiment to be within 0.8% for solutions (Ermer et. al., 2005). The precision of
DRUG ANALYSIS
20
detection for fluorescent detectors/diode array detectors may account for the disruptions in the
chromatograms.
The third possibility was discovered soon after the other two. The machine must be
flushed with water prior to experimentation to eliminate any bubbles in the analytical column. It
was also discovered the bulb in the diode array detector was not functioning, which as such
would not allow for detection. All these issues were considered and adjusted for in trial 3.
Trial 3
Experimental
Experimentation in this trial was carried out using an Agilent 1260 Infinity Quaternary
pump, type ID G1311B, serial number DEADO 16907 (Agilent, Santa Clara, California) just like
before. This pump was used to carry the mobile phase through the analytical column, Bondapak,
C18, 1 m, 3.9 x 150 mm2, Waters Corporation (Milford, Massachusetts). Injection was carried
out through the built-in injection valve, sample detection was achieved by an Agilent Diode
Array Detector, Type ID G1315C, serial number DEAA 203238, and the bulb in the detector was
replaced. Solvents were degassed through the built-in integrated vacuum degassing unit. The
method this time was a simple 60% DiH2O (.1% TFA) and 40% Methanol (100% BASILE) with
a run time of 30 minutes per sample. Standard HPLC vials were used and 200 L samples of the
standards were pipetted into the vials using a Poseidon, Genesee Scientific, 20-200 L transfer
pipette. Two samples in total were run: 0.7 ppm of salicylic acid and 0.7 ppm of quinine, and the
analytical column was flushed prior to the trial.
DRUG ANALYSIS
21
Results
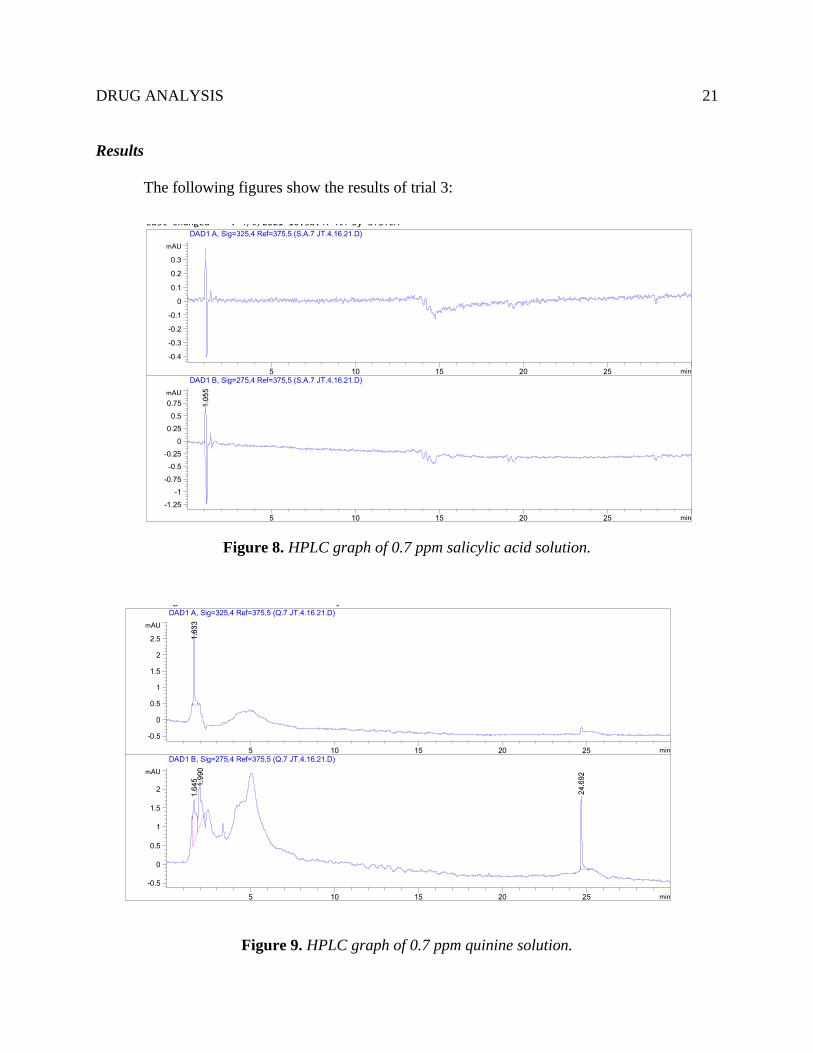
The following figures show the results of trial 3:
Figure 8. HPLC graph of 0.7 ppm salicylic acid solution.
Figure 9. HPLC graph of 0.7 ppm quinine solution.
DRUG ANALYSIS
22
Peaks were achieved in both runs. In figure 8, salicylic acid was detected within 2 minutes and in
figure 9, quinine was detected in less than 5 minutes. The peaks are clear, readable, and are
similar to the peak from Samanidou’s research shown in figure 7.
Conclusion
The goal of experimentation was to establish a method of analysis that could detect cutting
agents within 10 minutes. The method used in this final trial (60% water/40% methanol mobile
phase) and flushing the analytical column prior to use presented a quick and effective way to
analyze known and unknown solutions. While the combined solution of quinine and salicylic
acid was not run, the method was successful for these separately. Further research should be
performed with the same method to attempt to analyze mixtures of solutions to see if these
solutions could be identified from one another. This could be extremely beneficial in profiling
illicit drugs and cutting agents, especially because the method was able to be performed in less
than 5 minutes.
DRUG ANALYSIS
23
References
ACS Committee on Environmental Improvement (1980). Guidelines for data acquisition and
data quality evaluation in environmental chemistry, Anal. Chem., 52, 2242–2249.
Aljohar, H. I., Abuhaimed, S. N., Maher, H. M., Nafisah, B. A., & Alkhalaf, A. M. (2019). Gas
chromatography tandem mass spectrometry for the screening of adulterants in seized
captagon™ tablets. Null, 42(11-12), 358-366. https://10.1080/10826076.2019.1610433
Barreto, D. N., Ribeiro, Michelle M. A. C., Sudo, J. T. C., Richter, E. M., Muñoz, R. A. A., &
Silva, S. G. (2020). High-throughput screening of cocaine, adulterants, and diluents in
seized samples using capillary electrophoresis with capacitively coupled contactless
conductivity detection. Talanta, 217, 120987. https://doi.org/10.1016/j.talanta.2020.120987
Broséus, J., Gentile, N., Bonadio Pont, F., Garcia Gongora, J. M., Gasté, L., & Esseiva, P.
(2015). Qualitative, quantitative and temporal study of cutting agents for cocaine and
heroin over 9 years. Forensic Science International (Online), 257, 307-313.
http://dx.doi.org/10.1016/j.forsciint.2015.09.014
Broséus, J., Gentile, N., & Esseiva, P. (2016). The cutting of cocaine and heroin: A critical
review. Forensic Science International, 262, 73-83.
https://https://doi.org/10.1016/j.forsciint.2016.02.033
Dawidowicz, A. L., Bernacik, K., Typek, R., & Stankevič, M. (2018). Possibility of quinine
transformation in food products: LC–MS and NMR techniques in analysis of quinine
derivatives. European Food Research and Technology = Zeitschrift Für Lebensmittel-
Untersuchung Und -Forschung.A, 244(1), 105-116. http://dx.doi.org/10.1007/s00217-
017-2940-0
DRUG ANALYSIS
24
Editorial Staff, (July 21, 2021). What’s an amphetamine? Addiction: Signs, symptoms, and
treatment. American Addiction Centers. Retrieved from
https://americanaddictioncenters.org/amphetamine.
Ermer, J., Arth, C., De Raeve, P., Dill, D., Friedel, H., Höwer-Fritzen, H., Kleinschmidt, G.,
Köller, G., Köppel, H., Kramer, M., Maegerlein, M., Schepers, U., & Wätzig, H. (2005).
Precision from drug stability studies: Investigation of reliable repeatability and
intermediate precision of HPLC assay procedures. Journal of Pharmaceutical and
Biomedical Analysis, 38(4), 653-663. https://https://doi.org/10.1016/j.jpba.2005.02.009
Harvey, D. (2008). Modern analytical chemistry. McGraw-Hill.
Kaliszewski, Michael (14 October 2019). Statistics of Drug Use in High School. American
Addiction Centers. Retrieved from https://americanaddictioncenters.org/blog/statistics-of-
drug-use-in-high-school
Kochana, J., Zakrzewska, A., Parczewski, A., & Wilamowski, J. (2005). TLC screening method
for identification of active components of “Ecstasy” tablets. influence of diluents and
adulterants. Null, 28(18), 2875-2886. https://10.1080/10826070500269984
Kochana, J., Parczewski, A., & Wilamowski, J. (2006). SPE/TLC profiling of the impurities of
MDMA: The influence of an agglutinant, diluents, and adulterants. Null, 29(9), 1247-1256.
https://10.1080/10826070600598894
MDMA (Ecstasy/Molly) (June 15, 2020). National Institute on Drug Abuse. Retrieved from
https://www.drugabuse.gov/publications/drugfacts/mdma-ecstasymolly
DRUG ANALYSIS
25
National Center for Biotechnology Information (2021). PubChem Compound Summary for CID
338, Salicylic acid. Retrieved September 12, 2021
from https://pubchem.ncbi.nlm.nih.gov/compound/Salicylic-acid.
Substance Abuse and Mental Health Services Administration. (2018). Key Substance Use and
Mental Health Indicators in the United States: Results from the 2017 National Survey on
Drug Use and Health. Retrieved fromhttps://americanaddictioncenters.org/rehab-
guide/addiction-statistics
Vinkovic, K., Galic, N., & Schmid, M. G. (2018). Micro-HPLC–UV analysis of cocaine and its
adulterants in illicit cocaine samples seized by austrian police from 2012 to
2017. Null, 41(1), 6-13. https://10.1080/10826076.2017.1409237