Embed Size (px)
Citation preview
8/6/2019 Drowsy Driver
http://slidepdf.com/reader/full/drowsy-driver 1/23
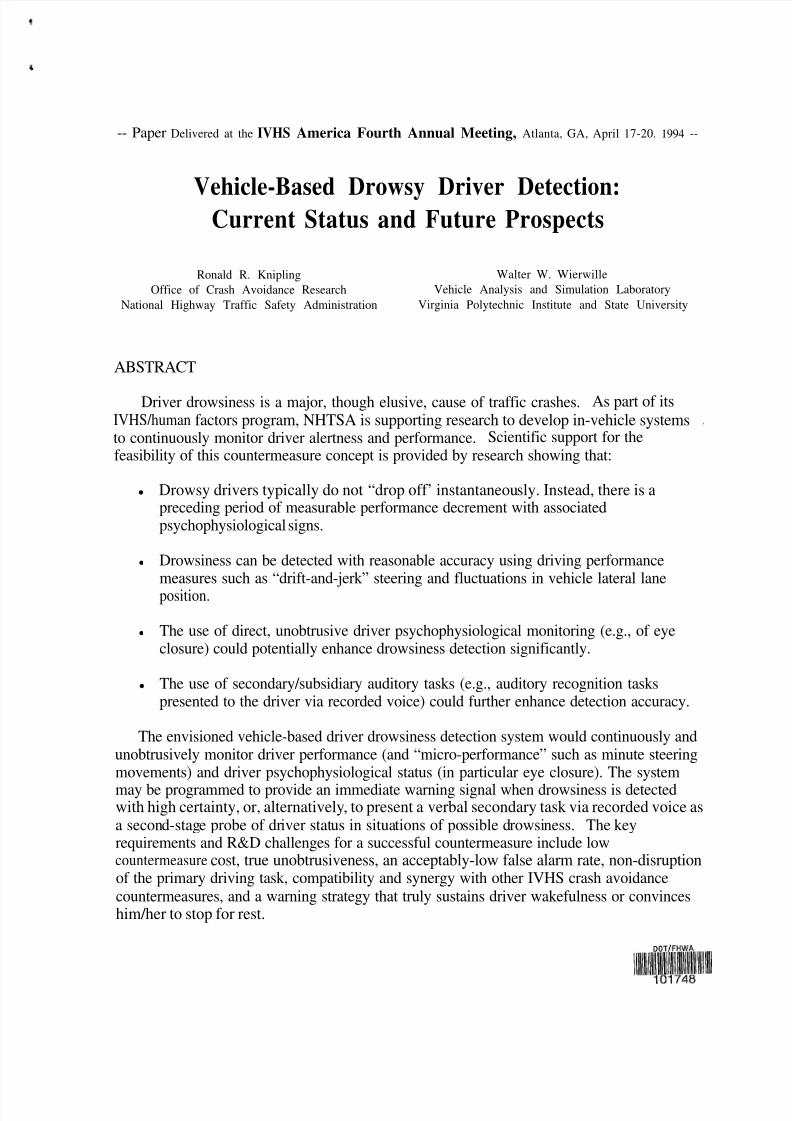
-- Paper Delivered at the IVHS America Fourth Annual Meeting, Atlanta, GA, April 17-20, 1994 --
Vehicle-Based Drowsy Driver Detection:Current Status and Future Prospects
Ronald R. Knipling Walter W. Wierwille
Office of Crash Avoidance Research Vehicle Analysis and Simulation Laboratory
National Highway Traffic Safety Administration Virginia Polytechnic Institute and State University
ABSTRACT
Driver drowsiness is a major, though elusive, cause of traffic crashes. As part of itsIVHS/human factors program, NHTSA is supporting research to develop in-vehicle systems .
to continuously monitor driver alertness and performance. Scientific support for thefeasibility of this countermeasure concept is provided by research showing that:
l Drowsy drivers typically do not “drop off’ instantaneously. Instead, there is apreceding period of measurable performance decrement with associatedpsychophysiological signs.
l Drowsiness can be detected with reasonable accuracy using driving performancemeasures such as “drift-and-jerk” steering and fluctuations in vehicle lateral laneposition.
l The use of direct, unobtrusive driver psychophysiological monitoring (e.g., of eyeclosure) could potentially enhance drowsiness detection significantly.
l The use of secondary/subsidiary auditory tasks (e.g., auditory recognition taskspresented to the driver via recorded voice) could further enhance detection accuracy.
The envisioned vehicle-based driver drowsiness detection system would continuously andunobtrusively monitor driver performance (and “micro-performance” such as minute steeringmovements) and driver psychophysiological status (in particular eye closure). The system
may be programmed to provide an immediate warning signal when drowsiness is detectedwith high certainty, or, alternatively, to present a verbal secondary task via recorded voice asa second-stage probe of driver status in situations of possible drowsiness. The keyrequirements and R&D challenges for a successful countermeasure include lowcountermeasure cost, true unobtrusiveness, an acceptably-low false alarm rate, non-disruptionof the primary driving task, compatibility and synergy with other IVHS crash avoidancecountermeasures, and a warning strategy that truly sustains driver wakefulness or convinceshim/her to stop for rest.
8/6/2019 Drowsy Driver
http://slidepdf.com/reader/full/drowsy-driver 2/23
Knipling and Wierwille Page 3
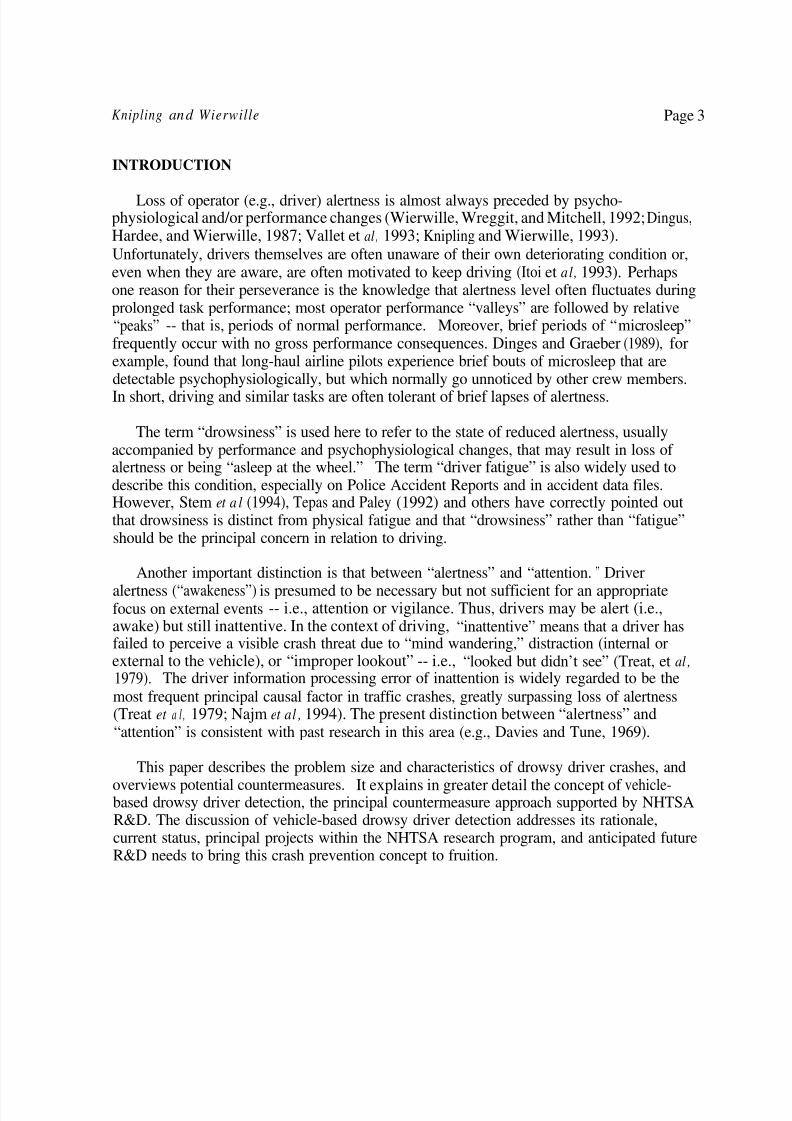
INTRODUCTION
Loss of operator (e.g., driver) alertness is almost always preceded by psycho-physiological and/or performance changes (Wierwille, Wreggit, and Mitchell, 1992; Dingus,Hardee, and Wierwille, 1987; Vallet et al, 1993; Knipling and Wierwille, 1993).Unfortunately, drivers themselves are often unaware of their own deteriorating condition or,even when they are aware, are often motivated to keep driving (Itoi et al, 1993). Perhapsone reason for their perseverance is the knowledge that alertness level often fluctuates duringprolonged task performance; most operator performance “valleys” are followed by relative“peaks” -- that is, periods of normal performance. Moreover, brief periods of “microsleep”frequently occur with no gross performance consequences. Dinges and Graeber (1989), forexample, found that long-haul airline pilots experience brief bouts of microsleep that aredetectable psychophysiologically, but which normally go unnoticed by other crew members.
In short, driving and similar tasks are often tolerant of brief lapses of alertness.
The term “drowsiness” is used here to refer to the state of reduced alertness, usuallyaccompanied by performance and psychophysiological changes, that may result in loss of alertness or being “asleep at the wheel.” The term “driver fatigue” is also widely used todescribe this condition, especially on Police Accident Reports and in accident data files.However, Stem et a l (1994), Tepas and Paley (1992) and others have correctly pointed outthat drowsiness is distinct from physical fatigue and that “drowsiness” rather than “fatigue”should be the principal concern in relation to driving.
Another important distinction is that between “alertness” and “attention. ” Driver
alertness (“awakeness”) is presumed to be necessary but not sufficient for an appropriatefocus on external events -- i.e., attention or vigilance. Thus, drivers may be alert (i.e.,awake) but still inattentive. In the context of driving, “inattentive” means that a driver hasfailed to perceive a visible crash threat due to “mind wandering,” distraction (internal orexternal to the vehicle), or “improper lookout” -- i.e., “looked but didn’t see” (Treat, et al ,
1979). The driver information processing error of inattention is widely regarded to be themost frequent principal causal factor in traffic crashes, greatly surpassing loss of alertness(Treat et a l , 1979; Najm et al , 1994). The present distinction between “alertness” and“attention” is consistent with past research in this area (e.g., Davies and Tune, 1969).
This paper describes the problem size and characteristics of drowsy driver crashes, and
overviews potential countermeasures. It explains in greater detail the concept of vehicle-based drowsy driver detection, the principal countermeasure approach supported by NHTSAR&D. The discussion of vehicle-based drowsy driver detection addresses its rationale,current status, principal projects within the NHTSA research program, and anticipated futureR&D needs to bring this crash prevention concept to fruition.
8/6/2019 Drowsy Driver
http://slidepdf.com/reader/full/drowsy-driver 3/23
Knipling and W ierw il le Page 4
ACCIDENT DATA: PROBLEM SIZE, CHARACTERISTICS, SCENARIOS
Crash Problem Size and Implications
NHTSA General Estimates System (GES) statistics for 1992 indicate that there were anestimated 50,000 crashes in which driver drowsiness was indicated on the Police AccidentReport (PAR). This was about one percent of the total 6.0 million police-reported crashesoccurring during that year. This 50,000 estimate may be conservative, for the followingreasons:
l GES statistics include police-reported crashes only. Overall, fewer than one-half of all crashes are police-reported (Miller, 1991). Little is known about thecharacteristics of non-police-reported crashes, including the proportion that are
drowsy-driver-related. However, since most drowsy driver crashes are single-vehiclecrashes, it is likely that many go unreported. In single-vehicle crashes withoutserious injury or disabling damage to the vehicle, drivers would have little incentive(and some disincentive) to report the incident to police.
l Even within the police-reported crash category, driver drowsiness may beunderreported since there is generally no physical evidence upon which to base apolice finding of drowsiness. Crash-involved drivers themselves may not be aware of the role that drowsiness played in their crashes. On the other hand, some crash-involved drivers may consider drowsiness to be a more socially-acceptable explanationfor their being involved in a crash than other more censurable errors such as alcohol
use, speeding, or inattention.
The Indiana Tri-Level Study (Treat et al, 1979) reported that two percent of its 420 in-depth cases involved “critical driver non-performance” -- i.e., blackout or dozing.Elsewhere in these conference proceedings, Najm et al (1994) report the results of a reviewof nearly 700 Crashworthiness Data System (CDS) and GES case files; four percent of thesecases were identified as being caused primarily by driver drowsiness. The uncertaintiesattached to PAR data and the wide range of these estimates point out the need for moredefinitive problem size assessment studies.
Data from the 1992 Fatal Accident Reporting System (FARS) indicate that
drowsiness/fatigue was cited as a factor in crashes in which 1,436 fatalities occurred. Thisrepresents approximately four percent of all motor vehicle crash fatalities.
Two vehicle type categories are of greatest interest for crash prevention efforts:passenger vehicles (cars, light trucks, vans) and combination-unit trucks (tractor-trailers).Based on 1992 GES data, drivers of passenger vehicles represented 96% of drowsy drivercrash involvements, while those of combination-unit trucks (tractor-trailers) represented 3 % .
8/6/2019 Drowsy Driver
http://slidepdf.com/reader/full/drowsy-driver 4/23
Knipling and Wierwille Page 5
Combination-unit trucks actually had a lower rate of involvement in these crashes thandid passenger vehicles (1.4 vs. 2.3 per 100M VMT), but these trucks have very high
exposure levels -- an average of about 60,000 miles per year compared to about 11,000 for apassenger vehicle. In addition, they have somewhat longer average operational lives (nearly15 years) than do passenger vehicles (about 13 years) (Miaou, 1990). Thus, even thoughtheir overall crash rat e per VMT is less than that of passenger vehicles, their expected number of involvements per vehicle life cycle is about four times greater. For vehicle-basedcountermeasures that last the life of the vehicle, the latter statistic is much more relevant to adetermination of potential benefits per unit cost. In addition, combination-unit truck drowsydriver crashes are generally more severe in their injury and property damage consequences.“Based on an analysis of “fatal crash equivalents” per crash (Wang & Knipling, 1994), 1992combination-unit truck drowsy driver crashes were, on average, approximately 1.6 timesmore severe than passenger vehicle drowsy driver crashes.”
In short, the problem size per vehicle is much greater for combination-unit trucks.Although passenger vehicles will eventually be the most important platforms for drowsydriver countermeasures from the perspective of potential total benefits, combination-unittrucks are the most promising platform from the perspective of potential cost-benefits of countermeasure deployment. These cost-benefit considerations, along with the comparativeease of conducting field trials on managed truck fleets rather than on groups of individually-owned passenger vehicles, make combination-unit trucks the probable testbed-of-choice for
early deployments of IVHS drowsy driver countermeasures.
Statistical Characteristics
GES statistics from 1992 indicate that drowsy driver crashes peak between midnight anddawn, with a second smaller peak in the afternoon. Most occur in non-urban areas,generally on roadways with 55-65 mph speed limits. Eighty-four percent are single-vehicleroadway departure crashes or collisions with parked vehicles. In most cases, the crashoccurs on a straight section of roadway (Of knowns: 83% straight, 17% curved) with thepre-crash maneuver of “going straight” (85 %). In 78% of crashes the driver is the onlyoccupant of the vehicle, and typically the driver makes no corrective action (i.e., braking orsteering) to avoid the collision. Alcohol is reported by police to be involved in about 12 % of drowsy driver crashes, although this represents primarily legally-intoxicated drivers and doesnot capture sub-legal-limit alcohol use contributing to drowsiness.
Involvement in drowsiness-related crashes is strongly related to both driver sex and driverage. In 1990, male drivers accounted for 77% of the drowsy driver crashes, whilerepresenting only 65 % of VMT and 5 1% of driver registrations. Thus, compared to femaledrivers, male drivers had an overall involvement rate (per VMT) that was 1.8 times greaterand an involvement likelihood (i.e., involvements per registered driver) that was 3.1 timesgreater than that of females.
8/6/2019 Drowsy Driver
http://slidepdf.com/reader/full/drowsy-driver 5/23
Knipling and Wierwille Page 6
Strong age-related trends are also evident. Drivers under thirty accounted for 62 % of drowsy driver crashes in 1990, while accounting for only 28% of both VMT and driverregistrations. Both their involvement rate (per VMT) and likelihood (per registered driver)were more than four times those of drivers 30 or over.
DOT RESEARCH PROGRAMS ON OPERATOR VIGILANCE
All modal administrations of the U.S. Department of Transportation have active researchprograms on operator vigilance. Across the various transportation modes, these programs
generally focus on one of the following four themes:
. Operational policies such as staffing requirements for ships (with implications forwork and watch cycles), hours-of-service regulations for commercial vehicle drivers,and “strategic napping” policies for airline pilots on long flights. In regard to thelatter, studies sponsored by the Federal Aviation Administration (e.g., Rosekind,Gander, and Dinges, 1991) have shown that preplanned cockpit naps for each of thethree crew members on extended flights can significantly improve subsequentalertness and performance on the flightdeck. FAA is encouraging “controlled rest”and has provided guidance for its use as a fatigue countermeasure.
l Fitness-for-duty testing for operators prior to vehicle operation. For example, theFederal Transit Administration is assessing the feasibility of performance-based
fitness-for-duty tests for transit operators that would identify performance deficits dueto a variety of causes including alcohol, drugs, illness, and fatigue.
l Workstation or other vehicle design to reduce operator mental workload andincrease alertness. For example, the U.S. Coast Guard is researching the use of greater automation and other ship control design concepts to reduce ship pilotworkload. Care must be taken however, not to underload the ship pilot, since suchsituations can lead to vigilance problems. A joint Federal HighwayAdministration/National Highway Traffic Safety Administration program is assessingthe effects of longer commercial vehicle (e.g., tractor with triple-trailer) operation ondriver stress and fatigue, including a comparison of the effects of two different trailerhitch designs.
l Continuous monitoring of operator status/performance. The Federal RailroadAdministration is currently sponsoring research to develop new technologies formonitoring railroad engineer alertness on duty. It has been found that currenttechniques can be defeated by drowsy engineers; that is, they can respond correctly tosecondary task probes even when they are functionally asleep.
8/6/2019 Drowsy Driver
http://slidepdf.com/reader/full/drowsy-driver 6/23
Knipling and Wierwille Page 7
NHTSA’s principal drowsy driver research program, described in this paper, also focuses
on continuous vehicle-based monitoring of driver alertness. The first author of this paper isthe NHTSA program manager for this work and the second author is the principalinvestigator of the principal NHTSA-supported research study (Wreggit, Kim, andWierwille, 1993) to develop a vehicle-based capability for unobtrusively monitoring driverperformance. This system entails continuous measurements of driver performance variables(e.g., steering wheel movements), data processing to “decide” whether the driver is drowsy,and an appropriate warning system interface with the driver. Direct, unobtrusivepsychophysiological driver measures (especially of eye activity) and secondary task performance could also be integrated into the measurement/decision regimen to assess driverstatus. A later section of this paper describes the basic elements of this approach.
Potential psychophysiological measures of driver alertness include measures of heart ratevariability, respiration rate, hand grip pressure on steering wheel, head inclination (i.e., thehead tends to tilt backward as neck muscles relax as a result of fatigue), measures of whole-body posture, electroencephalograms (EEGs), electrooculograms (EOGs), and measures of eyelid activity (blinking rate/amplitude as well as measures of “slow closure”). There arenumerous challenges to the development of practical psychophysiological sensors for use bythe public. Such devices must be unobtrusive or at least “ minimally-obtrusive” so thatdrivers will be willing and able to use them regularly without interference with normaldriving. Device cost must be reasonable due to cost-benefit and marketability concerns. Inaddition, they should detect drowsiness prior to the occurrence of critical performancefailures. One concern about head nod detectors, for example, is that they may not detectdrowsiness until a late stage, perhaps after serious performance deterioration has alreadyoccurred (Haworth and Vulcan, 1991).
Through the DOT Small Business Innovation Research (SBIR) program, NHTSA issupporting two R&D efforts to develop devices to directly measure driver eye closure. Oneapproach, under research by Systems Technology, Inc. using a device developed by SRDShorashim Medical Ltd., involves measurement of electroocular and neuromuscular potentials(EOG and EMG) associated with eye closure using a headband/headset device. A secondapproach, under research by MacLeod Technologies, involves detection of eyelid closureusing miniaturized, glasses-mounted opto-electronic emitters and sensors. Both of theseapproaches are minimally obtrusive, employ established technologies, and have the potentialto be very low-cost (e.g., less than $100). Current and future R&D will determine whetherthey are comfortable and unobtrusive enough to be worn for extended times and whether theyprovide reliable data in a real vehicle setting. Ideally, these systems would detect andmeasure eye blinks as well as slow closures since both types of eye closures revealinformation about the operator’s alertness level (e.g., see Stem et al, 1994 for eye blink correlates of drowsiness).
Another approach to eye closure detection involves the use of a dashboard-mounted videocamera and sophisticated image processing. This approach has the potential to be completely
8/6/2019 Drowsy Driver
http://slidepdf.com/reader/full/drowsy-driver 7/23
Knipling and Wierwille Page 8
unobtrusive, and could be adapted for applications other than drowsiness detection. Forexample, it could discern the driver’s point of regard and thus could be used to monitor
driver attention. PC-based prototype systems exist, although at present they may be tooexpensive for widespread commercial use. Extensive image processing is required to dealwith problems such as driver head movements and the partial obstruction caused byeyeglasses. A number of vendors are actively exploring this technology. The NHTSA“DASCAR” project (discussed below) is supporting the use of this technology for drivingresearch applications. Commercial applications may come later as device cost decreases.
The vehicle-based drowsy driver detection system will likely be used to actuate a driverwarning system. The agency is concerned with the human factors aspects of such warningsystems. As part of a comprehensive research program on driver warning systems,preliminary human factors guidelines for driver alertness warning systems have been
developed based on literature review (COMSIS, 1993a, b). These preliminary guidelinesaddress elements such as device activation, calibration, obtrusiveness, warning displaymodality, levels of warnings, and driver override features. For example, the preliminaryguidelines recommend a variable-intensity auditory or tactile primary warning display. Thisstimulus must be capable of overcoming sleep inertia (Tepas and Paley, 1992) but should notcause a startle-response disruption of driver performance.
Another NHTSA program supporting countermeasure development is the Portable DriverPerformance Data Acquisition System for Crash Avoidance Research (“DASCAR”).DASCAR will be an unobtrusive and inconspicuous vehicle instrumentation suite to supportexperiments and field studies on driver performance and psychophysiology, vehicle
parameters, and environmental parameters. A DASCAR prototype, under development byOak Ridge National Laboratory, will be completed in early 1995. The National AdvancedDriving Simulator (NADS) and other advanced driving simulators will also be employed infuture R&D on vehicle-based drowsy driver detection.
Other researchers, including major automotive manufacturers, are pursuing driverstatus/performance measurement concepts similar to those described here. In addition,various aftermarket devices are sold by independent vendors, primarily to long-haul truck drivers (Haworth and Vulcan, 1991). However, it appears that no commercially-availablesystem has established a large market or has rigorously documented system validity,reliability, and effectiveness.
VEHICLEBASED DROWSY DRIVER DETECTION: BASIC CONCEPTS .
Basic Concepts
As indicated earlier, the basic idea behind vehicle-based detection is to monitor the driverunobtrusively by means of an on-board system that can detect when the driver is materiallyimpaired by drowsiness. The concept involves sensing various driver-related and driving-
8/6/2019 Drowsy Driver
http://slidepdf.com/reader/full/drowsy-driver 8/23
Knipling and Wierwille Page 9
related variables. computing measures from these variables on-line, and then using themeasures in a combined manner to detect when drowsiness is occurring. Measures arecombined because no single unobtrusive operational measure appears adequate in reliably
detecting drowsiness. The most promising approach uses mathematical optimizationprocedures to develop algorithms with the highest potential detection accuracy. Techniquesnormally employed include multiple regression and linear discriminant analyses. More exotictechniques could also be employed in the future, including neural networks, patternrecognition. and fuzzy logic.
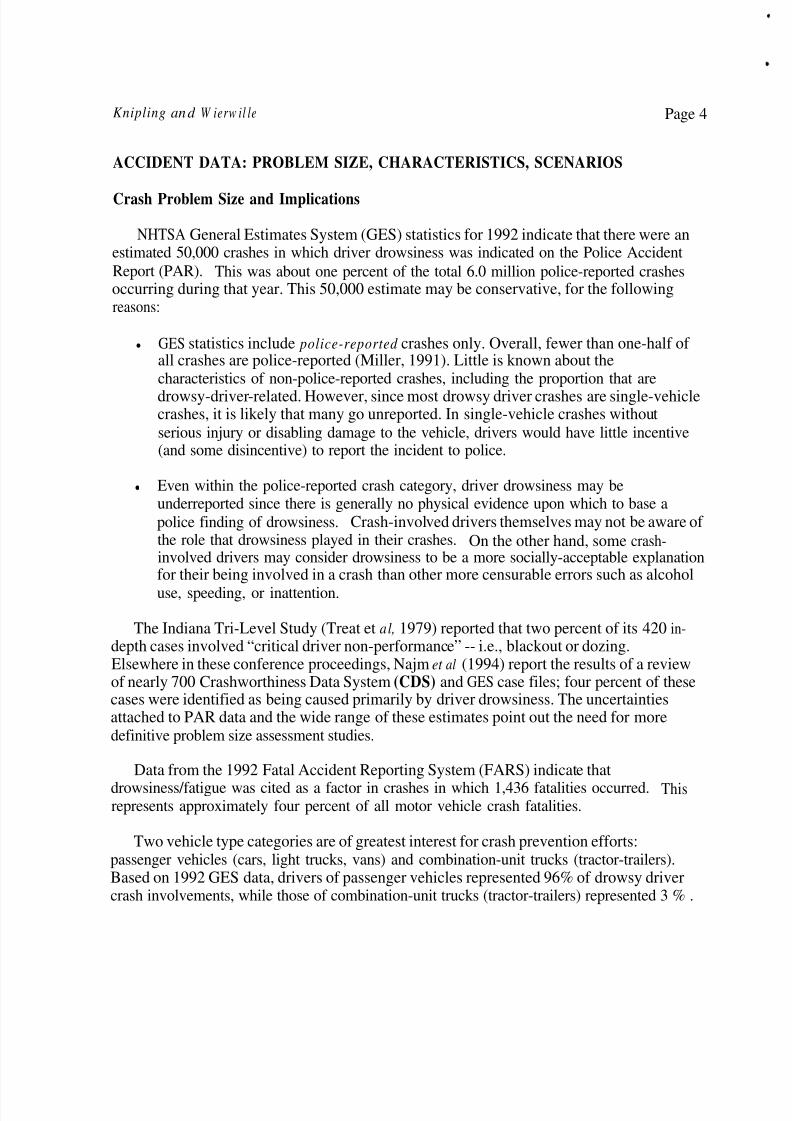
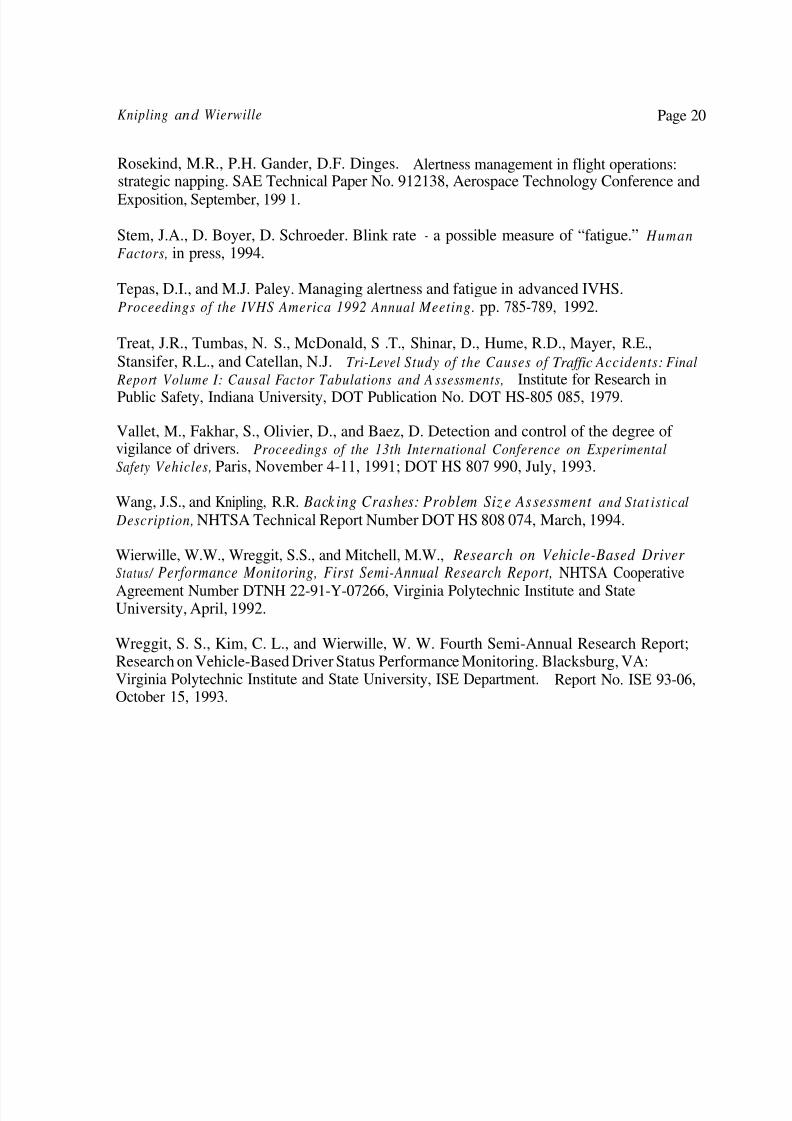
Optimization of algorithms for detection of drowsiness requires a definitional measure of “actual” drowsiness. Such a measure may be based on physiological, performance, orsubjective attributes and need not be obtainable operationally. However, the measure mustbe available in experiments so that operational detection algorithms can be “trained” toindicate the value of the definitional measure. This concept is depicted in Figure 1. On theleft are measures that can be obtained in the driving environment. These measures (with theexception of secondary task measures) are obtainable operationally from the vehicle withoutdisturbing the driver. They can be used in various combinations for algorithm development.On the right are various candidate definitional measures. AVEOBS is an observer ratingmeasure, EYEMEAS and PERCLOS are measures of slow eye-closure, and NEWDEF is ameasure composed of slow eye-closure, various EEG waveform amplitudes (Alpha, Beta, andTheta), and mean heart rate. A given algorithm would be directed at indicating the level of only one definitional measure, or possibly a linear combination of them. In any case,operationally available measures (on the left) are used to detect the level of the definitionalmeasure of drowsiness (on the right), with thresholds set to indicate when drowsiness hasexceeded a pre-specified level.
On-Board Detection System
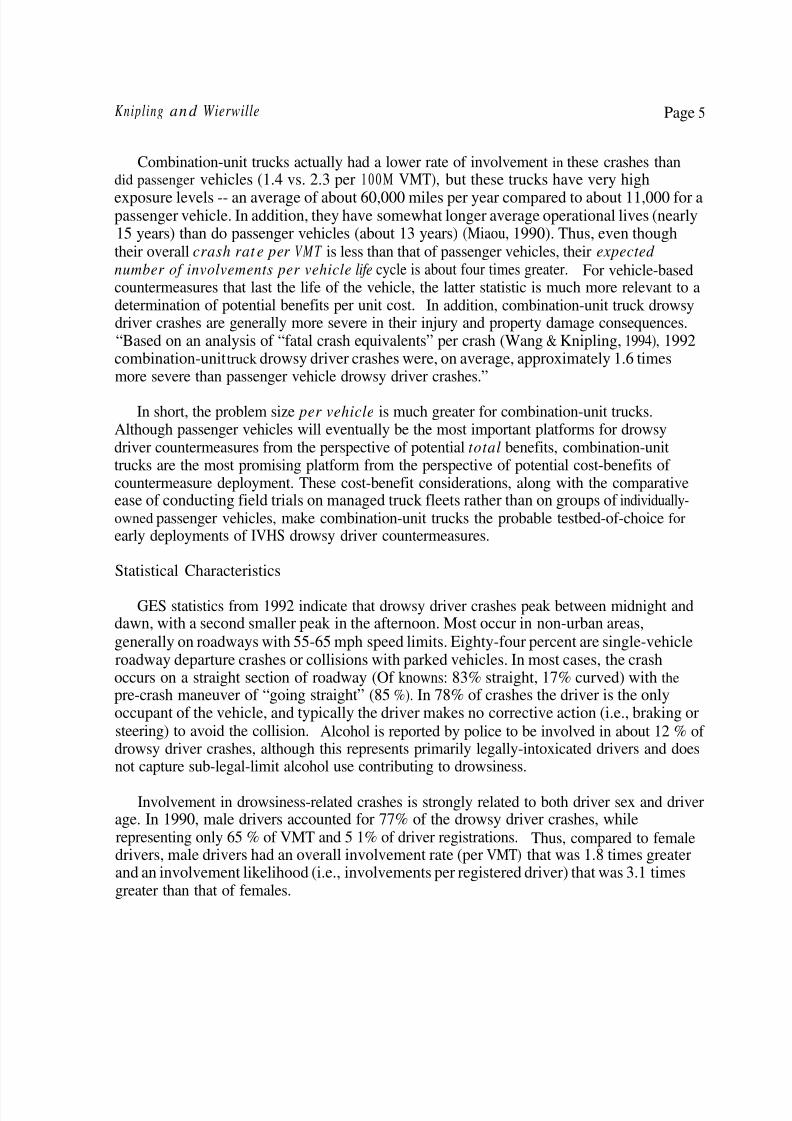
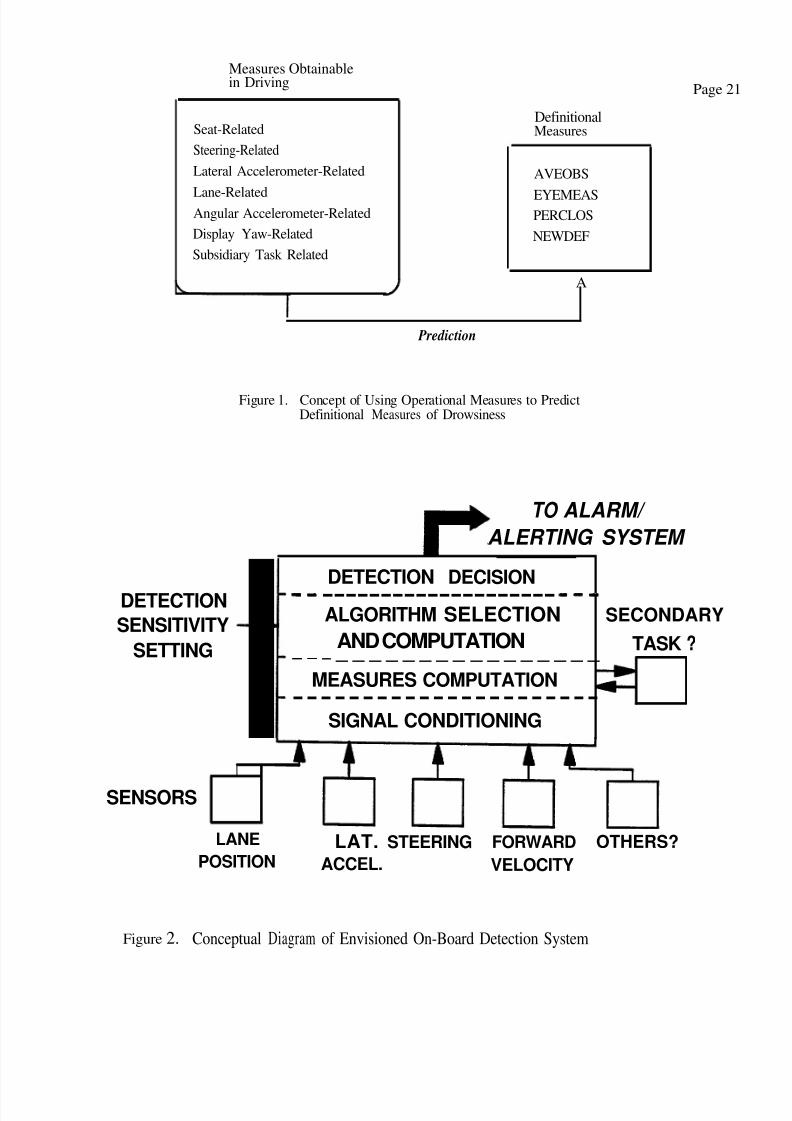
The on-board drowsiness detection system would gather signals from sensors on thevehicle, process these signals into measures, and then compute the algorithm (or algorithms)to determine if the drowsiness threshold has been exceeded.Figure 2 shows a block diagram of the envisioned system. Aspects of the envisioned system already determinedthrough research efforts include the following:
l Signals input to the microcomputer will include:. Steering-related signals0 A lateral accelerometer-related signal and. A lane position signal (assumes availability of machine vision technology for
optical tracking of existing highway lane markings).
l Measures will be computed using six-minute running averages (which provide thebest prediction accuracy).
8/6/2019 Drowsy Driver
http://slidepdf.com/reader/full/drowsy-driver 9/23
Knipling and Wierwille Page 10
l An adjustable drowsiness threshold feature will allow sensitivity to be set accordingto conditions.
. A step-up/step-down routine will ensure that, when all incoming signals are valid,the best algorithm is used. When one or more of the incoming signals is invalid (forexample, inability to establish a lane track), then the best algorithm excluding theinvalid signal(s) would be used. This procedure will ensure that at least onedetection algorithm is always capable of being computed.
. A “baselining” procedure will be used to tailor detection algorithms to the individualdriver. It will record each driver’s performance measures on-line initially and thensubtract such values from all subsequent values. Accordingly, measures obtainedare actually deviations from the driver’s own baseline.
Domain of Application
On-board drowsiness detection systems will be applicable primarily to driving on ruraland other “open” highways, such as limited-access highways, at speeds at or above 50 mph.There are two reasons for limiting the drowsiness detection system to this domain. First, asdiscussed earlier, most drowsiness-related crashes occur on these roads at these speeds.Second, it appears that this domain is the one in which feasibility is maximized. Theinfluences of stop-and-go traffic, traffic signals, turning maneuvers, etc., would probablyintroduce sufficient “noise” into the detection process that unobtrusive detection would beunfeasible. As we can see, we have the fortuitous circumstance of “feasibility in the mostneeded domain,” or in other words “the coin we are searching for was lost under thestreetlamp, where the light gives us the best chance of finding it.”
Nature and Accuracy of Algorithms
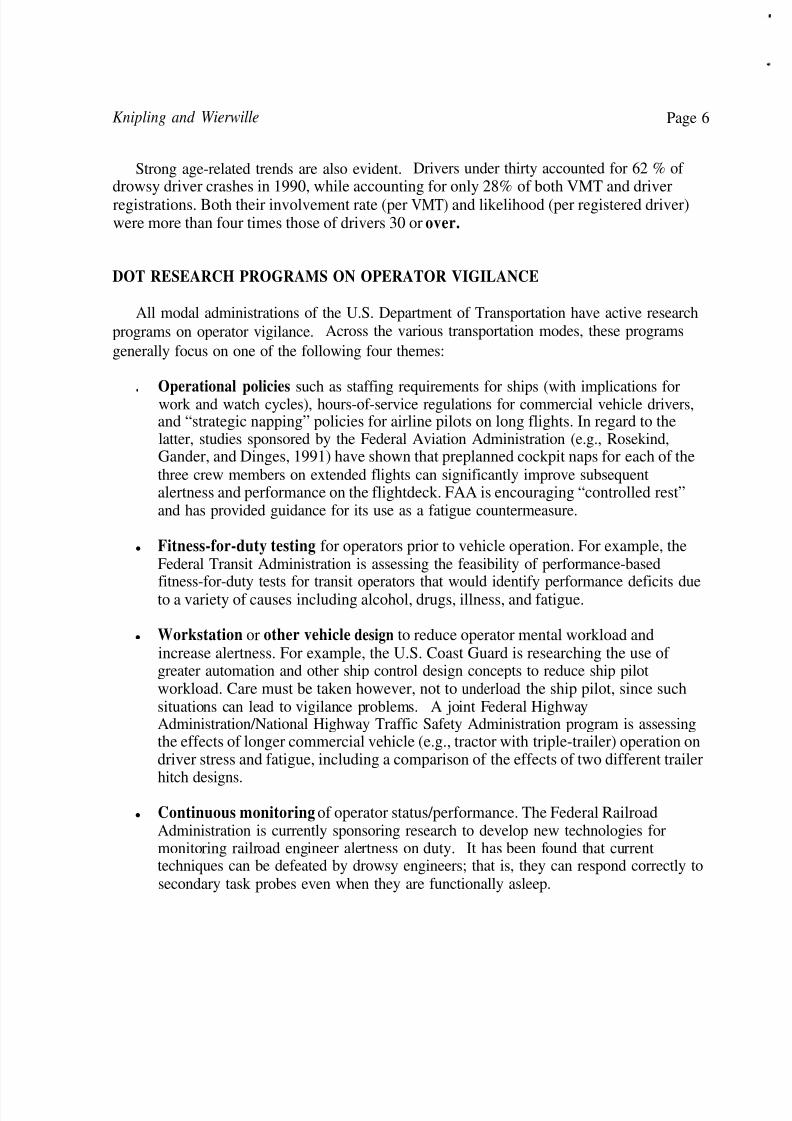
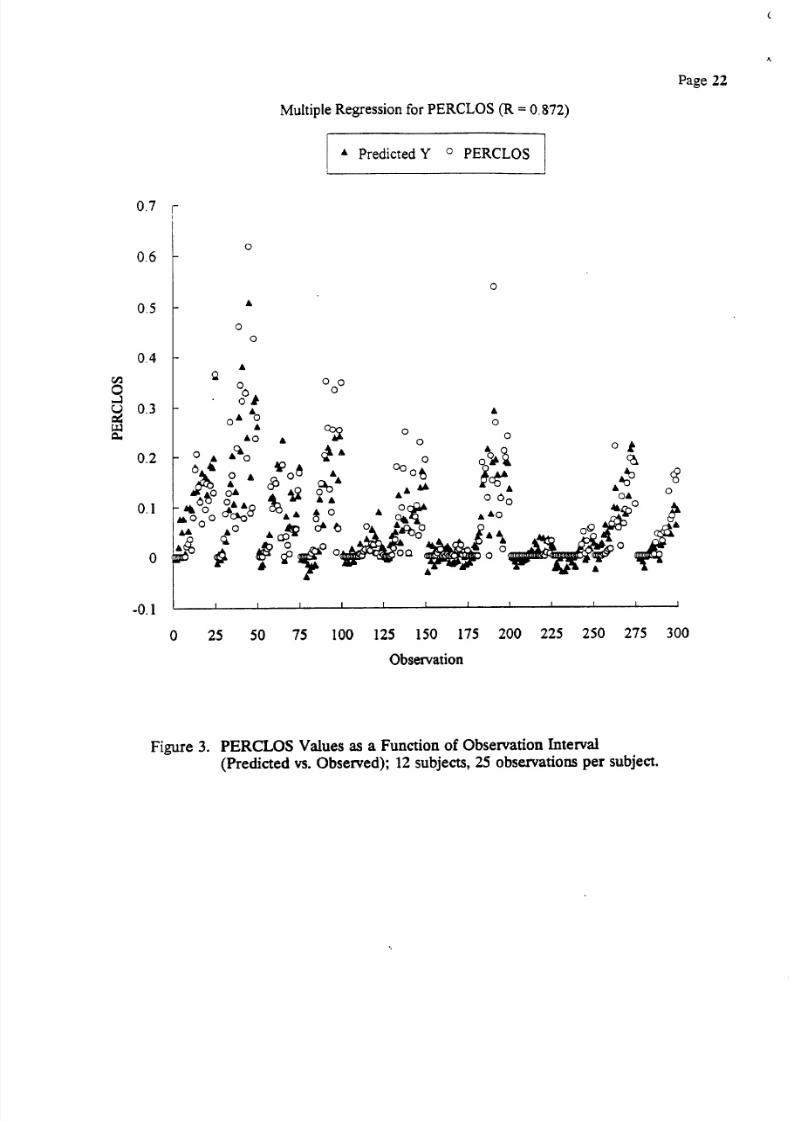
To provide a better idea of what a typical algorithm looks like and what its anticipatedlevel of accuracy would be, a specific algorithm will be described. It is one of perhaps 120that were recently derived in a major, moving-base driving simulator experiment using sleepdeprived drivers (Wreggit, Kim, and Wierwille, 1993). The algorithm was derived usingmultiple regression analysis with PERCLOS (the proportion of total time that the driver’seyelids are closed 80% or more) as the definitional measure.Figure 3 shows the actual
values of PERCLOS (open circles) and the algorithm-predicted values (closed triangles) for12 driver subjects. Each interval on the abscissa corresponds to a six-minute average, with25 intervals per driver-subject. Increasing values of the ordinate represent increasingdrowsiness levels. The algorithm generally does an excellent job of mimicking the values of PERCLOS, particularly in the intermediate ranges of PERCLOS where the threshold wouldmost likely be set.
8/6/2019 Drowsy Driver
http://slidepdf.com/reader/full/drowsy-driver 10/23
Knipling and Wierwille Page 11
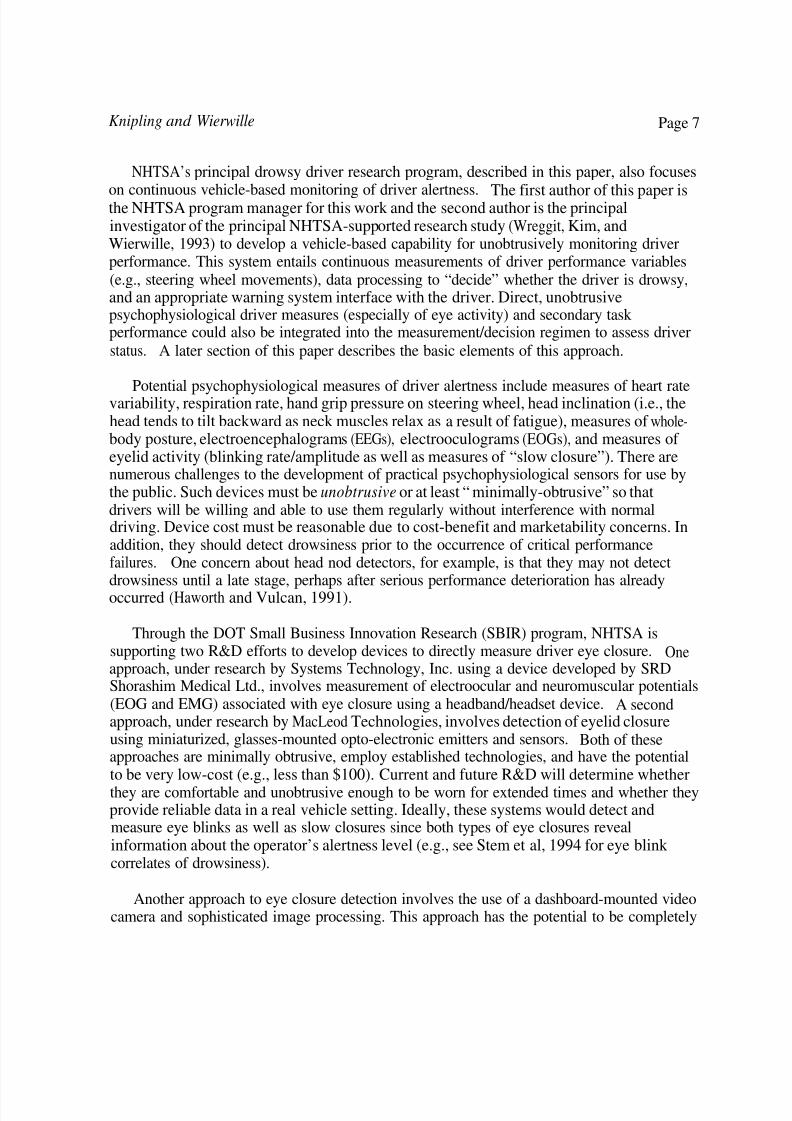
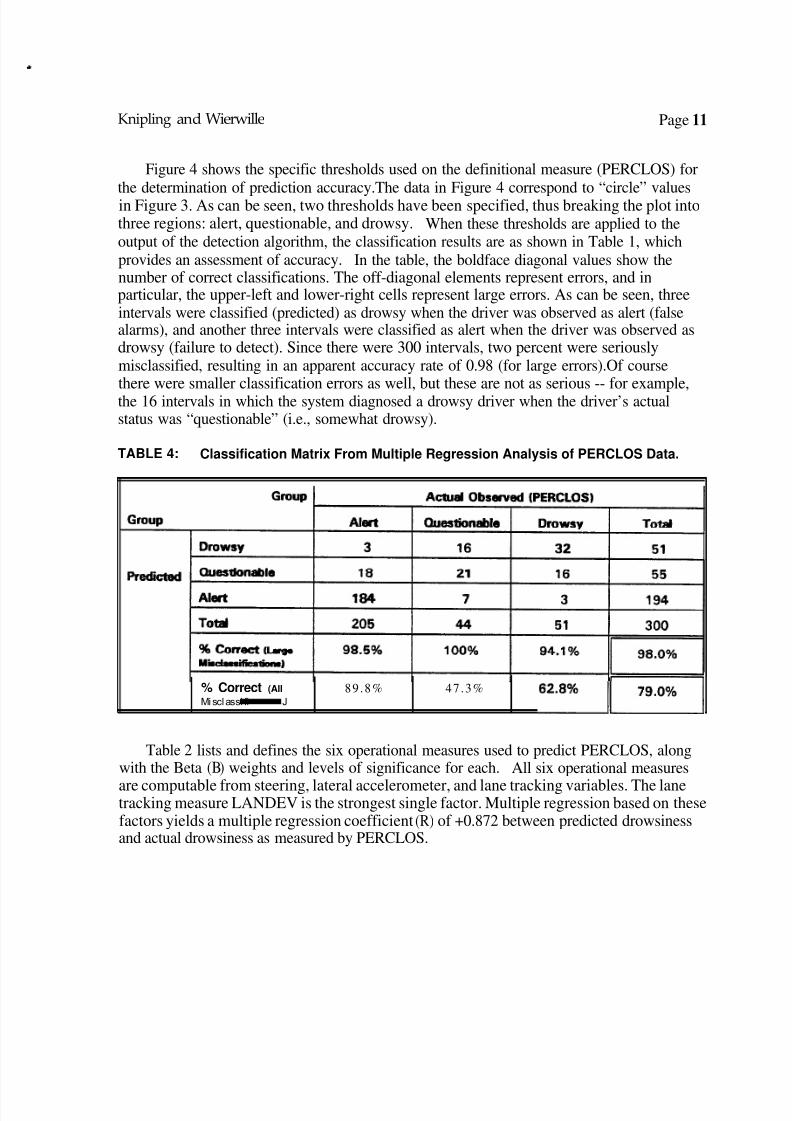
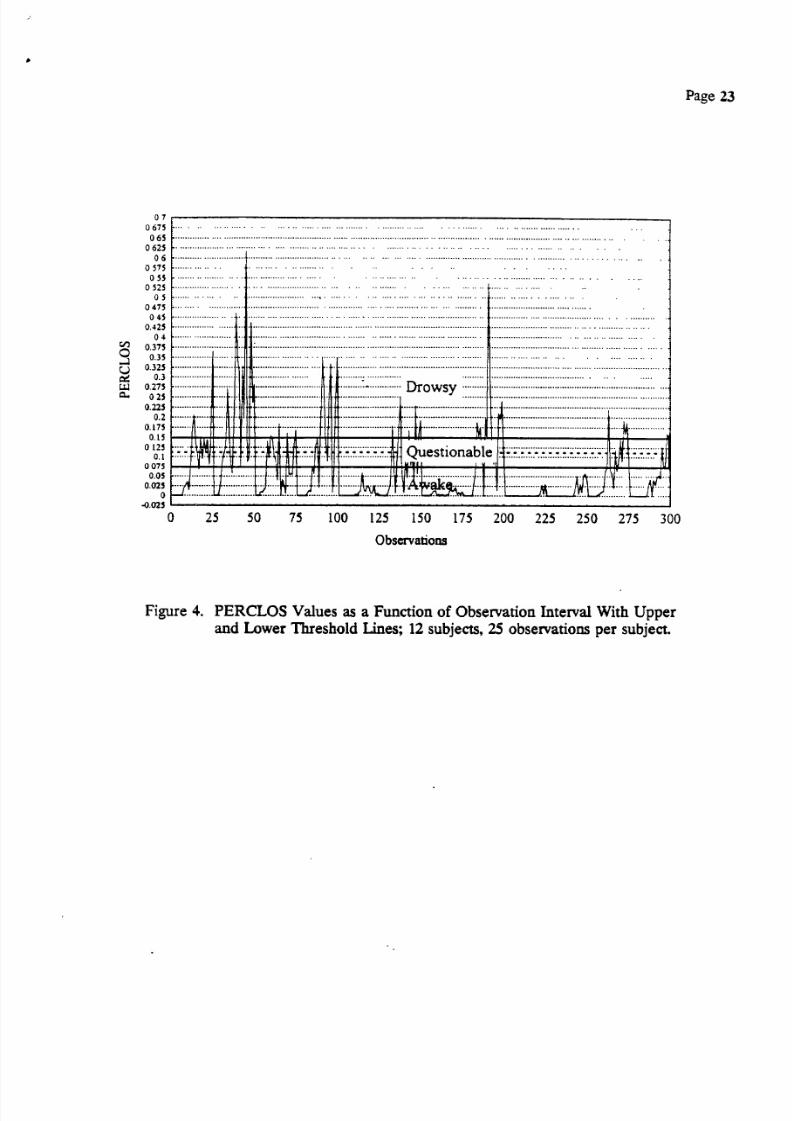
Figure 4 shows the specific thresholds used on the definitional measure (PERCLOS) forthe determination of prediction accuracy.The data in Figure 4 correspond to “circle” valuesin Figure 3. As can be seen, two thresholds have been specified, thus breaking the plot intothree regions: alert, questionable, and drowsy. When these thresholds are applied to theoutput of the detection algorithm, the classification results are as shown in Table 1, whichprovides an assessment of accuracy. In the table, the boldface diagonal values show thenumber of correct classifications. The off-diagonal elements represent errors, and inparticular, the upper-left and lower-right cells represent large errors. As can be seen, threeintervals were classified (predicted) as drowsy when the driver was observed as alert (falsealarms), and another three intervals were classified as alert when the driver was observed asdrowsy (failure to detect). Since there were 300 intervals, two percent were seriouslymisclassified, resulting in an apparent accuracy rate of 0.98 (for large errors).Of coursethere were smaller classification errors as well, but these are not as serious -- for example,the 16 intervals in which the system diagnosed a drowsy driver when the driver’s actualstatus was “questionable” (i.e., somewhat drowsy).
TABLE 4: Classification Matrix From Multiple Regression Analysis of PERCLOS Data.
% Correct (All 89 .8% 47 .3%
Misclassi fi - - J
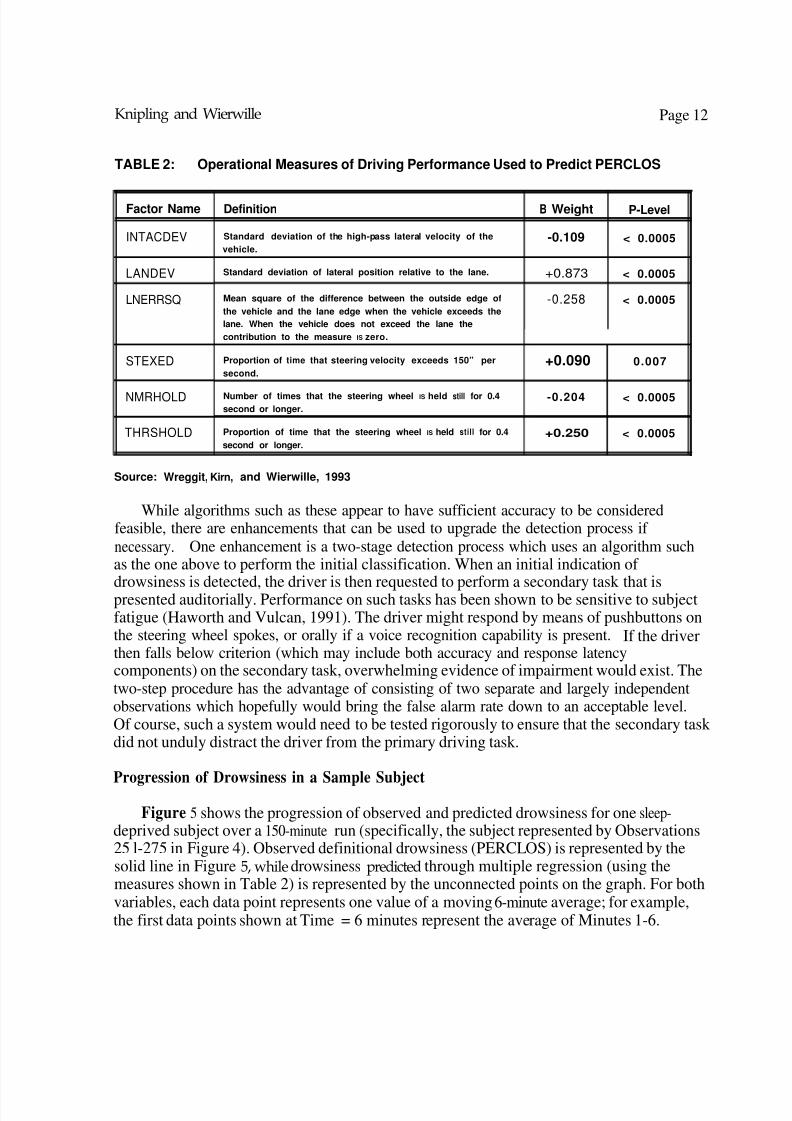
Table 2 lists and defines the six operational measures used to predict PERCLOS, alongwith the Beta (B) weights and levels of significance for each. All six operational measures
are computable from steering, lateral accelerometer, and lane tracking variables. The lanetracking measure LANDEV is the strongest single factor. Multiple regression based on thesefactors yields a multiple regression coefficient (R) of +0.872 between predicted drowsinessand actual drowsiness as measured by PERCLOS.
8/6/2019 Drowsy Driver
http://slidepdf.com/reader/full/drowsy-driver 11/23
Knipling and Wierwille Page 12
TABLE 2: Operational Measures of Driving Performance Used to Predict PERCLOS
Factor Name
INTACDEV
LANDEV
LNERRSQ
STEXED
NMRHOLD
THRSHOLD
Definition
Standard deviation of the high-pass lateral velocity of the
vehicle.
B Weight P-Level
-0.109 < 0.0005
Standard deviation of lateral position relative to the lane.
Mean square of the difference between the outside edge of
the vehicle and the lane edge when the vehicle exceeds the
lane. When the vehicle does not exceed the lane the
contribution to the measure IS zero.
+0.873 < 0.0005
-0.258 < 0.0005
Proportion of time that steering velocity exceeds 150” per
second.
+0.090 0.007
Number of times that the steering wheel IS held still for 0.4
second or longer.-0.204 < 0.0005
Proportion of time that the steering wheel IS held still for 0.4
second or longer.
+0.250 < 0.0005
Source: Wreggit, Kirn, and Wierwille, 1993
While algorithms such as these appear to have sufficient accuracy to be consideredfeasible, there are enhancements that can be used to upgrade the detection process if necessary. One enhancement is a two-stage detection process which uses an algorithm suchas the one above to perform the initial classification. When an initial indication of
drowsiness is detected, the driver is then requested to perform a secondary task that ispresented auditorially. Performance on such tasks has been shown to be sensitive to subjectfatigue (Haworth and Vulcan, 1991). The driver might respond by means of pushbuttons onthe steering wheel spokes, or orally if a voice recognition capability is present. If the driverthen falls below criterion (which may include both accuracy and response latencycomponents) on the secondary task, overwhelming evidence of impairment would exist. Thetwo-step procedure has the advantage of consisting of two separate and largely independentobservations which hopefully would bring the false alarm rate down to an acceptable level.Of course, such a system would need to be tested rigorously to ensure that the secondary task did not unduly distract the driver from the primary driving task.
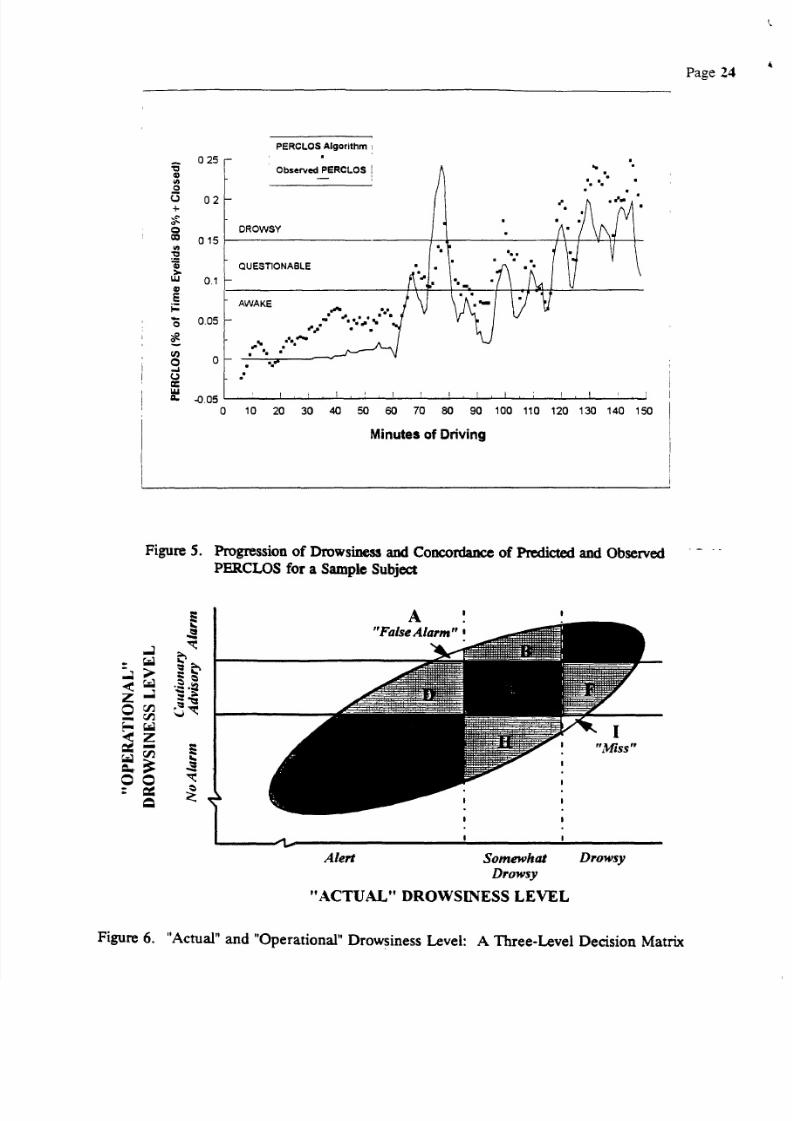
Progression of Drowsiness in a Sample Subject
Figure 5 shows the progression of observed and predicted drowsiness for one sleep-deprived subject over a 150-minute run (specifically, the subject represented by Observations25 l-275 in Figure 4). Observed definitional drowsiness (PERCLOS) is represented by thesolid line in Figure 5, while drowsiness predicted through multiple regression (using themeasures shown in Table 2) is represented by the unconnected points on the graph. For bothvariables, each data point represents one value of a moving 6-minute average; for example,the first data points shown at Time = 6 minutes represent the average of Minutes 1-6.
8/6/2019 Drowsy Driver
http://slidepdf.com/reader/full/drowsy-driver 12/23
Knipling and Wierwille Page 13
Across the 150 minutes of this subject’s session, there was a progressive, but erratic,
trend toward dangerous levels of drowsiness. The first major lapse into high drowsiness(between minutes 70 and 80) was followed by a period of relative alertness. The last 30minutes of the session were characterized by very high drowsiness levels. Numerous laneexceedances and several road departures occurred during this period.
Looking at the unconnected points in Figure 5, one sees that the multiple regressionoutput generally tracks well with PERCLOS (specifically, R = +0.896 for this subject).Early in the session, predicted PERCLOS actually begins to increase before observedPERCLOS. In other words, there are early signs of performance deterioration before theprecipitous increase in eyelid drooping. For this subject, predicted PERCLOS tends to besomewhat higher than actual PERCLOS. Of course, the nature of multiple regressiondictates that across all 12 subjects high-predictions are offset by low predictions.
Overall, the data in Figure 5 demonstrate, for this subject, the potential accuracy of theperformance-based drowsiness prediction in relation to “actual” observed drowsiness. Thedata show also that most drowsiness episodes develop slowly enough (i.e., over a period of minutes rather than seconds) to be potentially addressable through warning and/or alertingsignals issued to the drowsy, but still conscious, driver.
Program Directions
Work on vehicle-based drowsy driver detection at Virginia Tech has been ongoing forabout 30 months. In addition to the primary simulation trials described above, validationtrials have been performed to determine whether the performance-based drowsiness detectionalgorithms derived in the primary trials would transfer to a new set of driver-subjects.Results from these validation trials have generally indicated virtually no loss in detectionaccuracy (i.e., R decrements of less than 0.01) when the original detection algorithms areapplied to a new group of 12 subjects. Additionally, data are being gathered on speedvariation as an additional operational measure and on the effects of cruise control ondetection accuracy and susceptibility to drowsiness. When available, these data may formthe basis for further refinements to the detection algorithms.
Following completion of the simulator experiments, it is anticipated that limited fieldtesting will be undertaken. Of course, ethical issues must be addressed in full-scale testingso that driver subjects are not exposed to risks beyond those that already exist in driving. It
is anticipated that a vehicle will be instrumented with a drowsy driver detection system andequipped with a video recording system for independent assessment of the driver’s alertnesslevel.
8/6/2019 Drowsy Driver
http://slidepdf.com/reader/full/drowsy-driver 13/23
Knipling and Wierwille Page 14
RESEARCH NEEDS
Assessment of Target Crash Problem Size and Characteristics
This paper has cited statistics on the drowsy driver crashes based on PAR data.Admittedly, the validity of PAR data is questionable in relation to many crash causationissues, and is particularly tenuous in relation to transient mental states such as drowsiness.More sophisticated analyses of the drowsy driver crash problem are needed to better estimateits size and reveal its characteristics. Such an effort would also support assessments of thepotential cost-benefits of various drowsy driver crash research and countermeasuredevelopment initiatives. Given the limitations of PAR data, the needed problem analysisresearch would likely require the use of other more innovative data collection approaches to
obtain in-depth information on driver status and its role in crash causation.
System Development/Refinement of Algorithms
As noted above, much of the current research effort must be devoted to enhancingdetection algorithms to increase accuracy (in particular, the reduction of false alarms). Theincorporation of additional primary performance measures (e.g., vehicle speed; Khardi et a l ,
1993), direct psychophysiological measures, and/or secondary task measures would have thecumulative effect of enhancing system accuracy. Future refinements of the auditorysecondary task procedure might incorporate fine temporal analysis of driver speech patternsin addition to the relatively simple measures of latency and accuracy of verbal response.
Kruger et al have reported that driver alertness can be assessed through chronemic analysisof speech; for example, fatigued drivers tend to exhibit longer pauses between phonemes. If eye tracking systems can capture point of regard as well as eye closure, it may even bepossible for the system to evaluate the speed and quality of driver eye-hand coordination asan element of performance monitoring.
Another conceivable way to streamline detection algorithms is to eschewpsychophysiology altogether in favor of a purely performance-based approach. Here, onewould use “process” performance (e.g., steering movements, lateral deviations within thelane) to predict “outcome” performance (e.g., unintended lane departures and, ultimately,crashes). The concept of a purely performance-based approach is parsimonious and may yet
prove viable. The approach described in the current paper is based on the assumption andpractical observation that driver loss-of-alertness, defined by psychophysiological measuressuch as eye closure, is the critical precipitous event leading to these crashes, and thus is thebest target for detection algorithms.
Finally, another way to enhance detection algorithms would be to incorporate data onsituational factors and driver characteristics. Situational factors include time of day (e.g.,highest risk late at night), time since awakening from sleep, and time on driving task (Akerstedt and Folkard, 1993). Relevant driver characteristics include sex and age, although
8/6/2019 Drowsy Driver
http://slidepdf.com/reader/full/drowsy-driver 14/23
Knipling and Wierwille Page 15
research must first show whether the relation of these factors to target crash involvement isdue to true susceptibility differences or are merely artifacts of exposure differences. For
example, the extreme overinvolvement of young male drivers in these crashes may simply bethe result of greater risk exposure -- i.e., young males compile more late-night highwaymiles.
Overcoming the False Alarm Problem
As already indicated, a major research objective will be to overcome the false alarmproblem inherent to the identification/diagnosis of low-probability events. Since drowsinessis infrequent in relation to all time spent driving, false alarm rates must be very low. If not,the number of false alarms will greatly outnumber correct detections (“hits”), even if drowsiness is correctly detected with 100% accuracy (Knipling, 1993).
This problem may be overcome through refinements to the performance measurementalgorithms, addition of qualitatively different measures (i.e., direct psychophysiologicalmeasures and/or secondary tasks), and the use of graded alarm intensities for differentdegrees of drowsiness or levels of certainty. In particular, the false alarm problem appearsless daunting from the perspective of multiple degrees of alertness and intensities of warnings/advisories. Figure 6, which is similar in concept to the two-threshold algorithmconcept shown in Figure 4 and Table 1, shows a theoretical relation between “actual”drowsiness level (and thus actual risk of loss-of-alertness) and “operational” drowsiness levelas measured/derived by a detection system. Three levels of “actual” and “operational”drowsiness are shown in the figure, but note that dashed lines are used for the three “actual”
drowsiness levels since the variable represents a continuum without qualitative breakpoints.Since the system is not perfect, its data points would form an ellipse rather than a straightline. Within this scheme, zones G, E, and C represent’perfect classification, zones D, B, H,and F represent small misclassifications (or “half right” classifications), and zones A and Irepresent large misclassifications. Drowsy driver detection algorithms must be refined to apoint where zones A and I are very small or non-existent. The effects of smallmisclassifications (Zones D, B, H, and F) on crash prevention, driver performance, anddriver acceptance must be determined through further research. For example, the “half-falsealarm” zones D and B may be a source of irritation to drivers or, on the other hand, theymay have the positive effect of reassuring the driver that the system is functioningcontinuously.
Another way to increase detection and reduce false alarms might be to consider not justthe current measurement time interval but also trends evident from preceding intervals.Were there early signs of developing drowsiness based either on the overall operationalmeasure or among specific indicators ? Fuzzy logic may be employed to further enhance theaccuracy of diagnosis by considering the driver’s recent time-history of drowsiness.
8/6/2019 Drowsy Driver
http://slidepdf.com/reader/full/drowsy-driver 15/23
Knipling and Wierwille Page 16
System Response/Driver Interface
Regardless of the performance metrics and decision algorithms used, the system mustrespond to drowsiness detection with some warning signal(s) or, perhaps, vehicle controlinput(s). Research is just beginning to address the optimal characteristics of this systemresponse/driver interface (COMSIS, 1993a, b). One major R&D need is the specification of a driver warning signal (or other system response) that alerts the driver but does not undulystartle him or her (Vallet et al, 1993; Haworth and Vulcan, 1991). There are largeindividual differences in acoustic stimulus intensity (i.e., loudness) necessary for arousalfrom sleep. Thus, it may prove difficult to develop an ideal “standard” warning signal forall drivers.
In addition to concerns about the immediate reaction of drivers to drowsy driver warning
signals, “post-alarm” behavior is also a matter of concern. In many cases, drivers whopersevere in driving after receiving a warning will again be susceptible to recurrent episodesof drowsiness (Haworth and Vulcan, 1991). The successful driver interface will be the onethat changes driver behavior -- for example, convinces the driver to stop for a rest.
Test & Evaluation
Like any other vehicle safety devices, drowsy driver detection systems will requireextensive testing and evaluation before they can be widely deployed. Use of the NADS andother advanced simulators will enable sleep-deprived subjects to be exposed to realistic latenight highway driving situations. Fleet tests in operational settings such as long-haul truck
operations will provide further data. Parametric tests of driver characteristics (sex, age,“baseline” alertness) and system characteristics (e.g., warning signal characteristics) willenable these systems to be customized to different drivers and situations.
Individual Differences
Itoi et al (1993) noted wide differences among individuals in their ability to predictimminent sleep onset and also wide differences in the correlations between physiologicalsigns of drowsiness and the actual onset of sleep. Thus, physiological indices may be muchbetter predictors for some persons than for others. The same may be true for primarydriving task and secondary task performance.
Integration with Related Safety Systems
As currently envisioned, drowsy driver detection systems will not be collision warningsystems per se, but rather will warn of dangerous driving patterns or driver conditions thatmay soon lead to an imminent collision threat. Other systems may soon exist to warn of direct collision threats, such as roadway departure, resulting from drowsiness. Both“crosstalk” and compatibility between such co-existing systems will be necessary. For
8/6/2019 Drowsy Driver
http://slidepdf.com/reader/full/drowsy-driver 16/23
Knipling and Wierwille Page 17
example, a roadway departure countermeasure may be programmed to consider recent dataon driver status as part of its own road departure detection algorithms. In addition, the
driver interfaces for these two systems must be compatible since their target crash threatsituations will likely overlap.
Another example of possible “crosstalk’ mutual enhancement of systems relates toheadway detection systems to prevent rear-end crashes (Knipling et al , 1993). Data ondriver response patterns to vehicles and other objects in the forward path could perhaps beused to help assess driver alertness, and continuous driver alertness data could perhaps beused to determine the optimal distance for issuing a headway detection warning.
Cost-Benefit Considerations
In the long run, drowsy driver countermeasures will be worthwhile only if they are cost-effective. Device cost should be low enough to ensure a favorable ratio of average benefitsto cost. The cost of several key sensor components such as the lateral lane position monitorand psychophysiological measurement devices (if needed) are likely to be the prime driversof the overall system cost.
Since the “per-vehicle” crash problem size is greater for combination-unit trucks than forother vehicle types, the “break-even” device cost (i.e., the device cost which producesaverage crash prevention benefits per vehicle equal to average cost) will be correspondinglygreater for trucks. Of course, an imperfect relation exists between monetary cost-benefitsand actual marketability and driver acceptance. For example, young males as a driver group
would apparently reap greater benefits from drowsiness countermeasures than other drivers,but they may not be the consumer market segment most willing to purchase it.
Relation of “Alertness” to “Attention”
This paper has addressed driver drowsiness or loss of alertness, a significant cause of motor vehicle crashes. A much larger crash cause, addressed only briefly here, is driver“inattention,” the failure of an awake driver to perceive a crash threat when it should beperceptible. Driver inattention/recognition failure is perhaps one order of magnitude moreprevalent as a cause of crashes than is loss of alertness (Treat et al, 1979; Najm et al, 1994).
What is the relation between “inattention” and “loss of alertness?” As noted earlier,driver alertness (“awakeness”) is presumed to be necessary but not sufficient for timelydetection of salient external events -- i.e., attention. Is attention to external events a “higherlevel” of alertness or do alertness and attention represent two different neural/cognitiveprocesses?
Laboratory studies of vigilance in target acquisition settings have shown that acquisitionrates often decline rapidly after just a few minutes on task. Moreover, “local” target
8/6/2019 Drowsy Driver
http://slidepdf.com/reader/full/drowsy-driver 17/23
Knipling and Wierwille Page 18
detection rates for successive time epochs fluctuate considerably and irregularly duringsessions (Makeig and Inlow, 1993). These target acquisition performance fluctuations are
accompanied by fluctuations in electroencephalogram (EEG) patterns. In other words,operator vigilance, as measured both by performance and psychophysiology, seems tofluctuate over time. Studies of driver alertness/drowsiness show similar fluctuations overtime, with some negative fluctuations resulting in total loss of alertness or “asleep at thewheel. ”
An intriguing topic for future research will be the relation between these fluctuations invigilance (attention to specific stimuli) and general alertness. Can IVHS devices designed todetect general loss of alertness be refined to detect more subtle forms of inattention? If theycan, the opportunities for crash prevention through driver status/performance monitoring willbe greatly expanded.
REFERENCES
Akerstedt, T. and Folkard, S. A quantitative model for vigilance regulations and itsapplication in transport operations. Paper presented at the Vigilance and Transport
Conference in Lyon, France, December 9-10, 1993; sponsored by the French NationalInstitute for Transport and Safety Research (INRETS).
COMSIS Corporation. Human Factors Guidelines for Crash Avoidance Warning Devices.NHTSA Contract No. DTNH22-91-C-07004, 1993(a).
COMSIS Corporation. In-Vehicle Crash Avoidance Warnings: Major Research Needs.NHTSA Contract No. DTNH22-91-C-07004, 1993(b).
Davies, D.R. and Tune, G.S. Human Vigilance Performance American Elsevier PublishingCompany, Inc., New York, 1969.
Dinges, D.F. and Graeber, R.C. Crew fatigue monitoring. Flight Safety Digest, pp. 65-75,October, 1989.
Dingus, T.A., Hardee, H.L, and Wierwille, W.W., Development of models for on-board
detection of driver impairment, Accident A naly sis and Prevent ion, 19, No. 4, pp. 271-283,1987.
Haworth, N.L, and Vulcan, P. Testing of commercially-available fatigue monitors. Le Mainien de la Vigilance d a n s les Transports , Transports et Communication 34. Caen:Pardigme, 1991.
8/6/2019 Drowsy Driver
http://slidepdf.com/reader/full/drowsy-driver 18/23
Knipling a n d Wierwiile Page 19
Itoi, A., Cilveti, R. ,Voth, M., Dantz, B., Hyde, P., Gupta, A., Dement, W.C. CanDrivers Avoid Falling Asleep at the Wheel? Technical Report, AAA Foundation for TrafficSafety. February 8, 1993.
Khardi, S., Olivier, D., and Vallet, M. La vigilance en conduite automobile reelle analysepseudo-quantitative des signaux physiologiques et cinematiques. Paper presented at theVigilance and Transport Conference in Lyon, France, December 9-10, 1993; sponsored bythe French National Institute for Transport and Safety Research (INRETS).
Knipling, R.R. IVHS technologies applied to collision avoidance: perspectives on six targetcrash types and countermeasures. Proceedings of t he Third Annual M eeting of IVHS
America. IVHS America. pp. 249-259, 1993.
Knipling, R.R., Mironer, M., Hendricks, D.L., Tijerina, L., Everson, J., Allen, J.C., andWilson, C. Assessment of IVHS Countermeasures For Collision Avoidance: Rear-End
Crashes. NHTSA technical report, Publication Number DOT HS 807 995, May, 1993.
Knipling, R.R. and Wierwille, W.W., U.S. IVHS research: vehicle-based drowsy driverdetection. Paper presented at the Vigilance and Transport Conference in Lyon, France,December 9-10, 1993; sponsored by the French National Institute for Transport and SafetyResearch (INRETS).
Kruger, H.P., Perrine, M.W., and Kazlausky, T. Driver alertness assessment throughspeech chronemics. Paper presented at the 73rd Annual Meeting of the Transportation
Research Board, Washington, DC, January 9-13, 1994.
Mackie, R.R. and Wylie, CD. Countermeasures to loss of alertness in motor vehicledrivers: a taxonomy and evaluation. Proceedings of the Human Factors Society 35th Annual
Meeting -- 1991, pp. 1149-l 153.
Makeig, S. and Inlow, M. Lapses in alertness: coherence of fluctuations in performance andEEG spectrum. Electroencephalography and Clinical Neurophysiology. 86, 23-35, 1993.
Miaou, S.P., “Study of Vehicle Scrappage Rates,” Oak Ridge National Laboratory, Oak Ridge, TN, August 1990.
Miller, T.R., et al., The Costs of Highw ay Crashes, Urban Institute, Contract No.DTFH61-85-C-00107, Report No. FHWA-RD-91-055, June, 1991.
Najm, W.G., Koziol, J.S., Jr., Tijerina, L., Pierowicz, J.A., and Hendricks, D.L.Comparative assessment of crash causal factors and IVHS countermeasures. Proceedings o f
t he Fourth Annual M eeti ng of IVHS America. IVHS America. 1994.
8/6/2019 Drowsy Driver
http://slidepdf.com/reader/full/drowsy-driver 19/23
Knipling and Wierwille Page 20
Rosekind, M.R., P.H. Gander, D.F. Dinges. Alertness management in flight operations:strategic napping. SAE Technical Paper No. 912138, Aerospace Technology Conference and
Exposition, September, 199 1.
Stem, J.A., D. Boyer, D. Schroeder. Blink rate - a possible measure of “fatigue.” Human
Factors, in press, 1994.
Tepas, D.I., and M.J. Paley. Managing alertness and fatigue in advanced IVHS.Proceedings of the IVHS America 1992 Annual Meeting. pp. 785-789, 1992.
Treat, J.R., Tumbas, N. S., McDonald, S .T., Shinar, D., Hume, R.D., Mayer, R.E.,Stansifer, R.L., and Catellan, N.J. Tri-Level Study of the Causes of Traffic Accidents: Final
Report Volume I: Causal Factor Tabulations and A ssessments, Institute for Research in
Public Safety, Indiana University, DOT Publication No. DOT HS-805 085, 1979.
Vallet, M., Fakhar, S., Olivier, D., and Baez, D. Detection and control of the degree of vigilance of drivers. Proceedings of the 13th International Conference on Experimental
Safety Vehicles, Paris, November 4-11, 1991; DOT HS 807 990, July, 1993.
Wang, J.S., and Knipling, R.R. Back ing Crashes: Problem Siz e Assessment and Stat istical
Description, NHTSA Technical Report Number DOT HS 808 074, March, 1994.
Wierwille, W.W., Wreggit, S.S., and Mitchell, M.W., Research on Vehicle-Based Driver Status/ Performance Monitoring, First Semi-Annual Research Report, NHTSA Cooperative
Agreement Number DTNH 22-91-Y-07266, Virginia Polytechnic Institute and StateUniversity, April, 1992.
Wreggit, S. S., Kim, C. L., and Wierwille, W. W. Fourth Semi-Annual Research Report;Research on Vehicle-Based Driver Status Performance Monitoring. Blacksburg, VA:Virginia Polytechnic Institute and State University, ISE Department. Report No. ISE 93-06,October 15, 1993.
8/6/2019 Drowsy Driver
http://slidepdf.com/reader/full/drowsy-driver 20/23
Measures Obtainablein Driving
Page 21
Seat-Related
Steering-Related
Lateral Accelerometer-Related
Lane-RelatedAngular Accelerometer-Related
Display Yaw-Related
Subsidiary Task Related
DefinitionalMeasures
AVEOBS
EYEMEASPERCLOS
NEWDEF
A
Prediction
Figure 1. Concept of Using Operational Measures to PredictDefinitional Measures of Drowsiness
TO ALARM/
ALERTING SYSTEM
DETECTION DECISION
DETECTION--------------------
SENSITIVITY- - ALGORITHM SELECTION- - - SECONDARY
SETTING _ _ _ _ _ _ _ _ _ _ _ _ _ _ _ _ _ _ _ AND COMPUTATION TASK ?
MEASURES COMPUTATION----------------------
SIGNAL CONDITIONING
I
SENSORS
LANE LAT. STEERING FORWARD OTHERS?POSITION ACCEL. VELOCITY
Figure 2. Conceptual Diagram of Envisioned On-Board Detection System
8/6/2019 Drowsy Driver
http://slidepdf.com/reader/full/drowsy-driver 21/23
8/6/2019 Drowsy Driver
http://slidepdf.com/reader/full/drowsy-driver 22/23
8/6/2019 Drowsy Driver
http://slidepdf.com/reader/full/drowsy-driver 23/23