Embed Size (px)
Citation preview
1
2
Drowning In A Sea of Data
Data Vizualization is the key
Data is the lifeblood of business. Its volume, velocity, variety and complexity is bigger and growing faster than ever. Organizations are struggling to keep up and find themselves drowning in data.
Amongst this sea of extensive and complex data, companies search for the useful, quality information held within it. Most have not got the expertise or resources to unearth the insights within.
Is there a means to unearth the hidden value with ease. A way to bring those rich insights to the surface?
What does it do? In simple terms, it makes business easier.
It helps find insights in complex data that may never have been found and communicates complicated messages in a way that can be instantly interpreted.
Data Visualization is the answer, read on learn why!
3
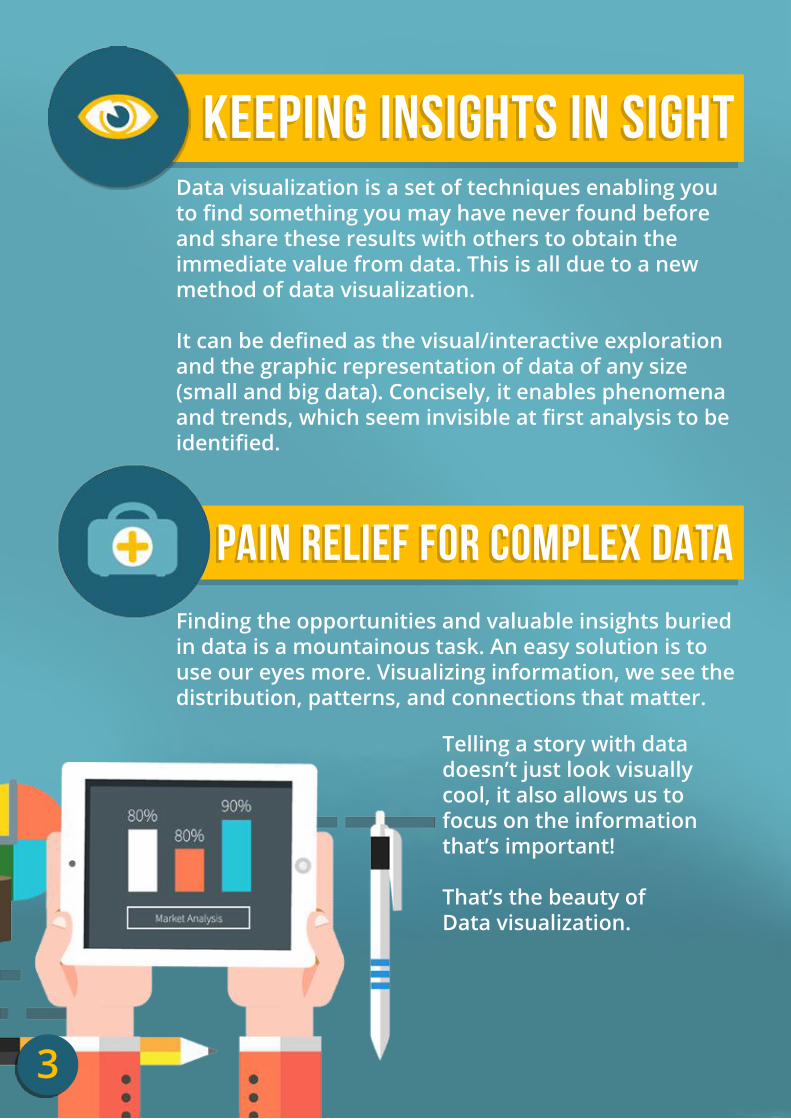
PAIN RELIEF FOR COMPLEX DATA
KEEPING INSIGHTS IN SIGHTData visualization is a set of techniques enabling you to find something you may have never found before and share these results with others to obtain the immediate value from data. This is all due to a new method of data visualization.
It can be defined as the visual/interactive exploration and the graphic representation of data of any size (small and big data). Concisely, it enables phenomena and trends, which seem invisible at first analysis to be identified.
Finding the opportunities and valuable insights buried in data is a mountainous task. An easy solution is to use our eyes more. Visualizing information, we see the distribution, patterns, and connections that matter.
Telling a story with data doesn’t just look visually cool, it also allows us to focus on the information that’s important!
That’s the beauty of Data visualization.
4
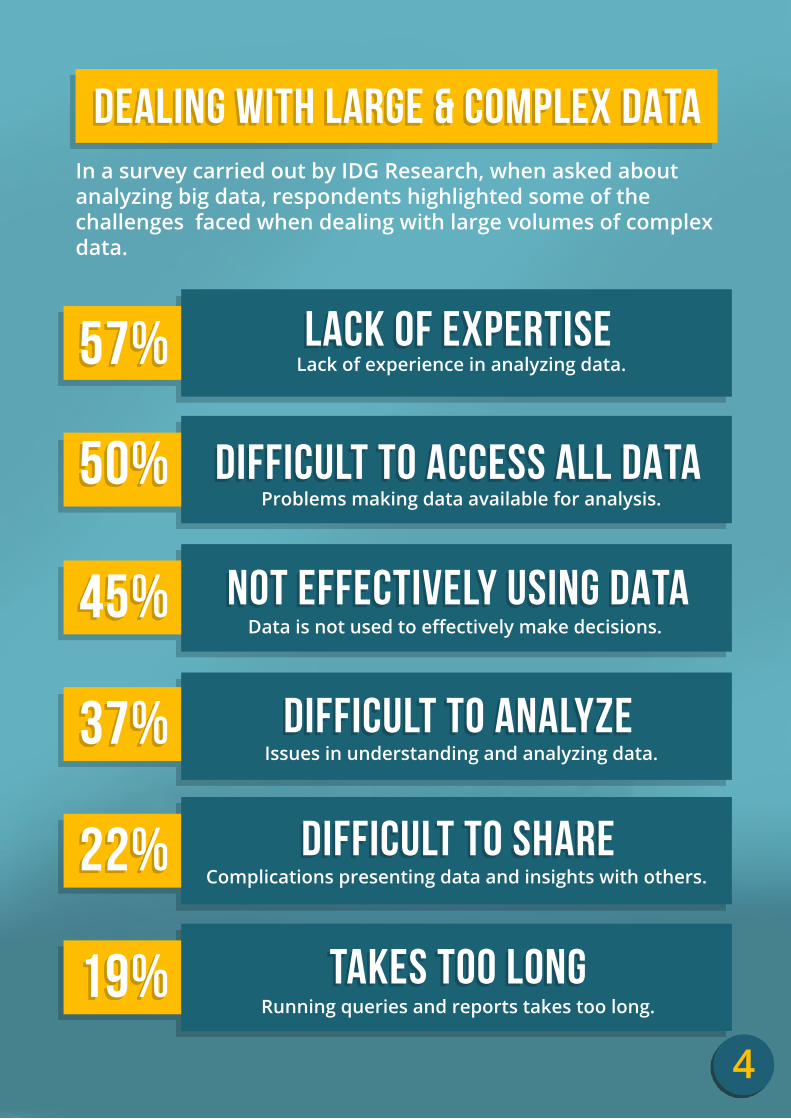
DEALING WITH LARGE & COMPLEX DATAIn a survey carried out by IDG Research, when asked about analyzing big data, respondents highlighted some of the challenges faced when dealing with large volumes of complex data.
57%
50%
45%
37%
22%
19%
LACK OF EXPERTIsE
DIFFICULT TO ACCESS ALL DATA
NOT EFFECTIVELY USING DATA
DIFFICULT TO ANALYZE
DIFFICULT TO SHARE
TAKES TOO LONG
Lack of experience in analyzing data.
Data is not used to effectively make decisions.
Problems making data available for analysis.
Issues in understanding and analyzing data.
Complications presenting data and insights with others.
Running queries and reports takes too long.
5
$$$
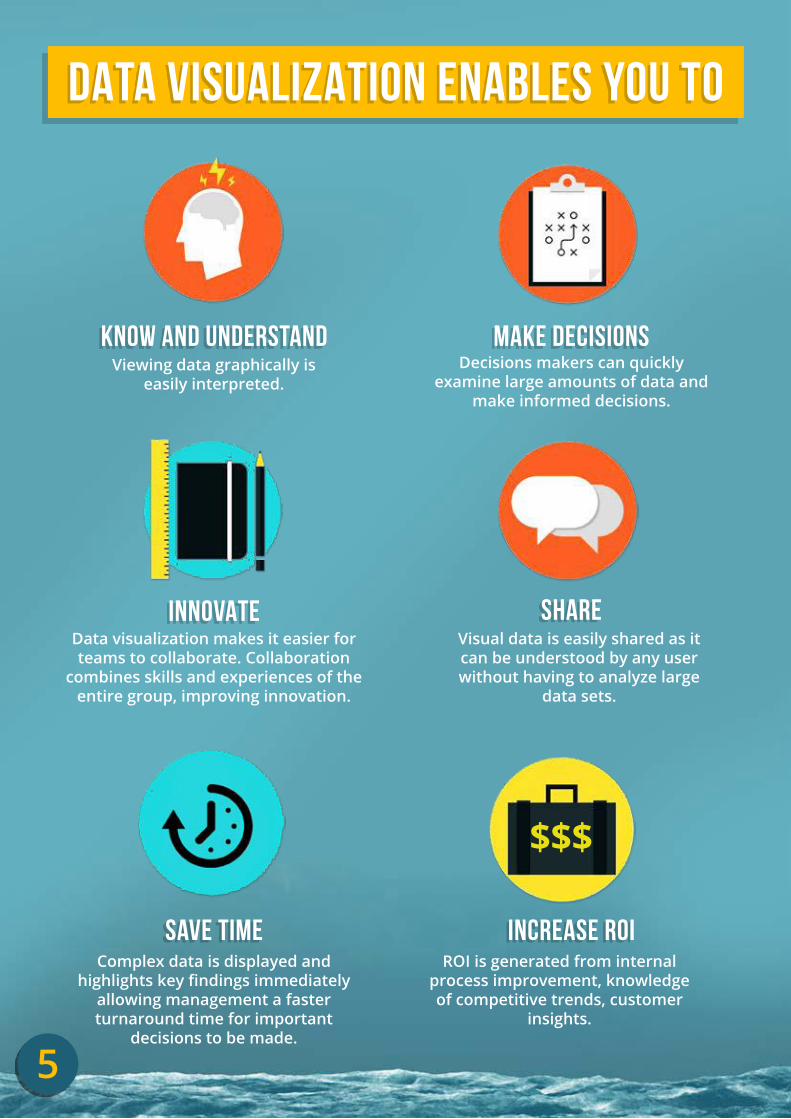
Viewing data graphically is easily interpreted.
Decisions makers can quickly examine large amounts of data and
make informed decisions.
Data visualization makes it easier for teams to collaborate. Collaboration
combines skills and experiences of the entire group, improving innovation.
Visual data is easily shared as it can be understood by any user without having to analyze large
data sets.
Complex data is displayed and highlights key findings immediately
allowing management a faster turnaround time for important
decisions to be made.
ROI is generated from internal process improvement, knowledge of competitive trends, customer
insights.
DATA VISUALIZATION ENABLES YOU TO
KNOW AND UNDERSTAND MAKE Decisions
INNOVATE SHARE
SAVE TIME INCREASE ROI
6
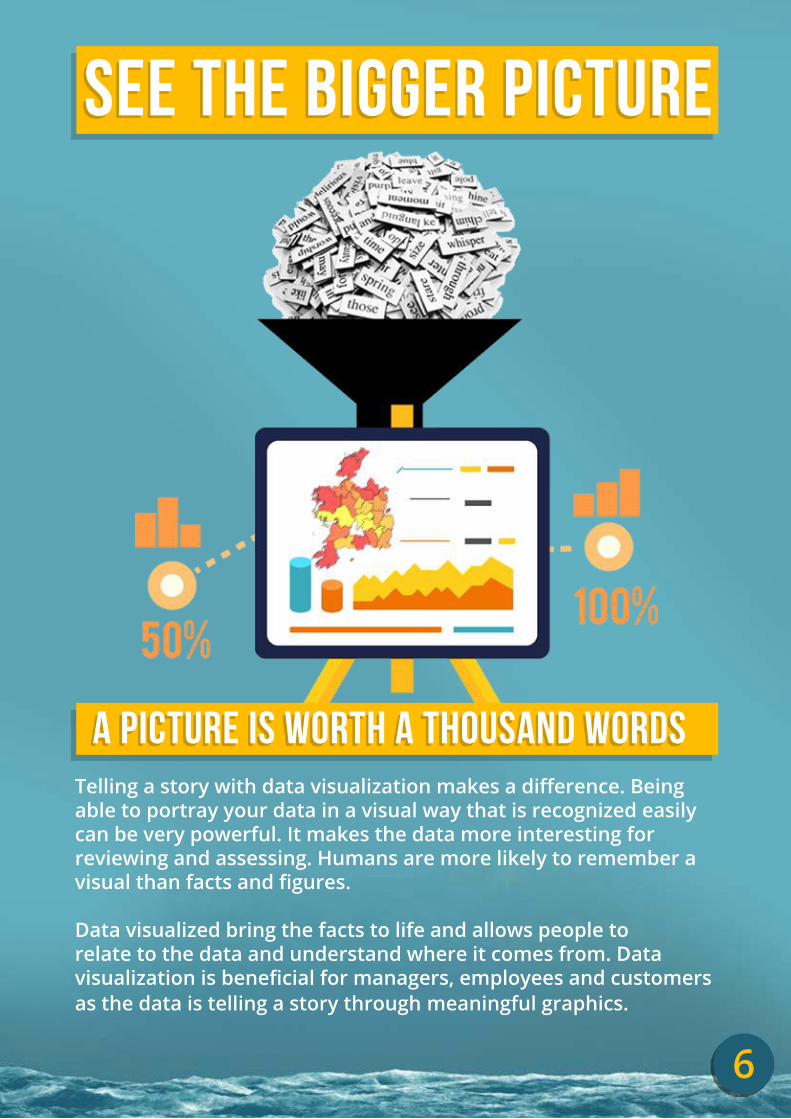
SEE THE BIGGER PICTURE
A PICTURE IS WORTH A THOUSAND WORDSTelling a story with data visualization makes a difference. Being able to portray your data in a visual way that is recognized easily can be very powerful. It makes the data more interesting for reviewing and assessing. Humans are more likely to remember a visual than facts and figures.
Data visualized bring the facts to life and allows people to relate to the data and understand where it comes from. Data visualization is beneficial for managers, employees and customers as the data is telling a story through meaningful graphics.
7
5 REASONSYOUR BUSINESS
NEEDS DATA visualization
It’s been proven that managers who use data visualization tools are 28% more likely to find
relevant information compared to those who do not.
Let’s explore how your business could benefit with data visualization.
8
PATTERNS AND RELATIONSHIPS2
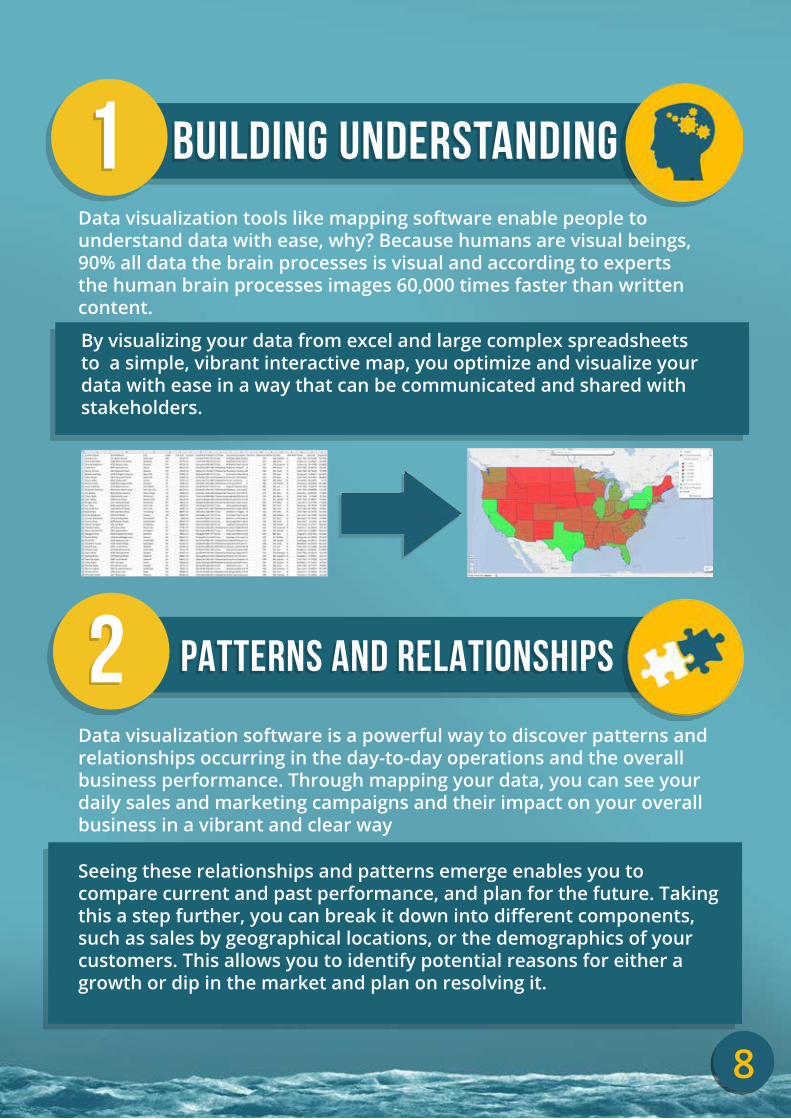
BUILDING UNDERSTANDING1Data visualization tools like mapping software enable people to understand data with ease, why? Because humans are visual beings, 90% all data the brain processes is visual and according to experts the human brain processes images 60,000 times faster than written content.
Data visualization software is a powerful way to discover patterns and relationships occurring in the day-to-day operations and the overall business performance. Through mapping your data, you can see your daily sales and marketing campaigns and their impact on your overall business in a vibrant and clear way
Seeing these relationships and patterns emerge enables you to compare current and past performance, and plan for the future. Taking this a step further, you can break it down into different components, such as sales by geographical locations, or the demographics of your customers. This allows you to identify potential reasons for either a growth or dip in the market and plan on resolving it.
By visualizing your data from excel and large complex spreadsheets to a simple, vibrant interactive map, you optimize and visualize your data with ease in a way that can be communicated and shared with stakeholders.
9
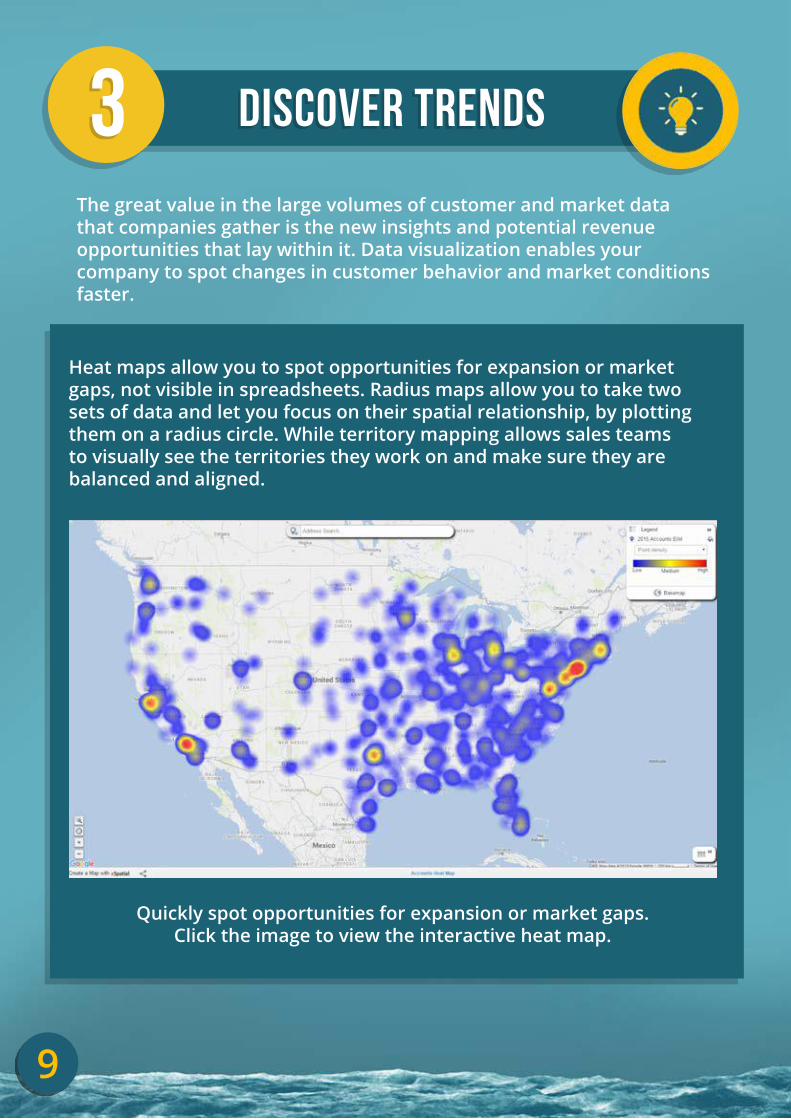
DISCOVER TRENDS 3The great value in the large volumes of customer and market data that companies gather is the new insights and potential revenue opportunities that lay within it. Data visualization enables your company to spot changes in customer behavior and market conditions faster.
Heat maps allow you to spot opportunities for expansion or market gaps, not visible in spreadsheets. Radius maps allow you to take two sets of data and let you focus on their spatial relationship, by plotting them on a radius circle. While territory mapping allows sales teams to visually see the territories they work on and make sure they are balanced and aligned.
Quickly spot opportunities for expansion or market gaps. Click the image to view the interactive heat map.
10
DIRECTLY INTERACT WITH DATA4
EMPOWER YOUR BUSINESS5
Data visualization software enables you to interact with real-time data directly. For example, a spreadsheet may tell you that overall sales for a particular product are, but on a map you may see that these sales are from a particular area, while other areas are underperforming.
Using data visualization software such as territory mapping, you can quickly drill down further into a specific region and realign or change sales territories, or reassign a sales person through the software to cover the underperforming market. With technology today, this can be done on the move from any internet-connected device such as a smartphone, tablet, or laptop, perfect for people on the go, presenting at a meeting, or sharing interactive maps directly with colleagues securely or publicly.
Data visualization can empower your business and employees by giving them new ways at looking at your organization’s data, enabling them to make better and more informed decisions from all aspects of the business, from junior members to senior management.
In this era of information and big data, visualization software allows you to gain insights, indentify gaps and opportunities, target and analyze the important data to drive your business forward.
These are just some of the benefits of data visualization tools for organizations. You can see more features here, but the best way of finding the benefits for your business is to try it out for yourself!
11
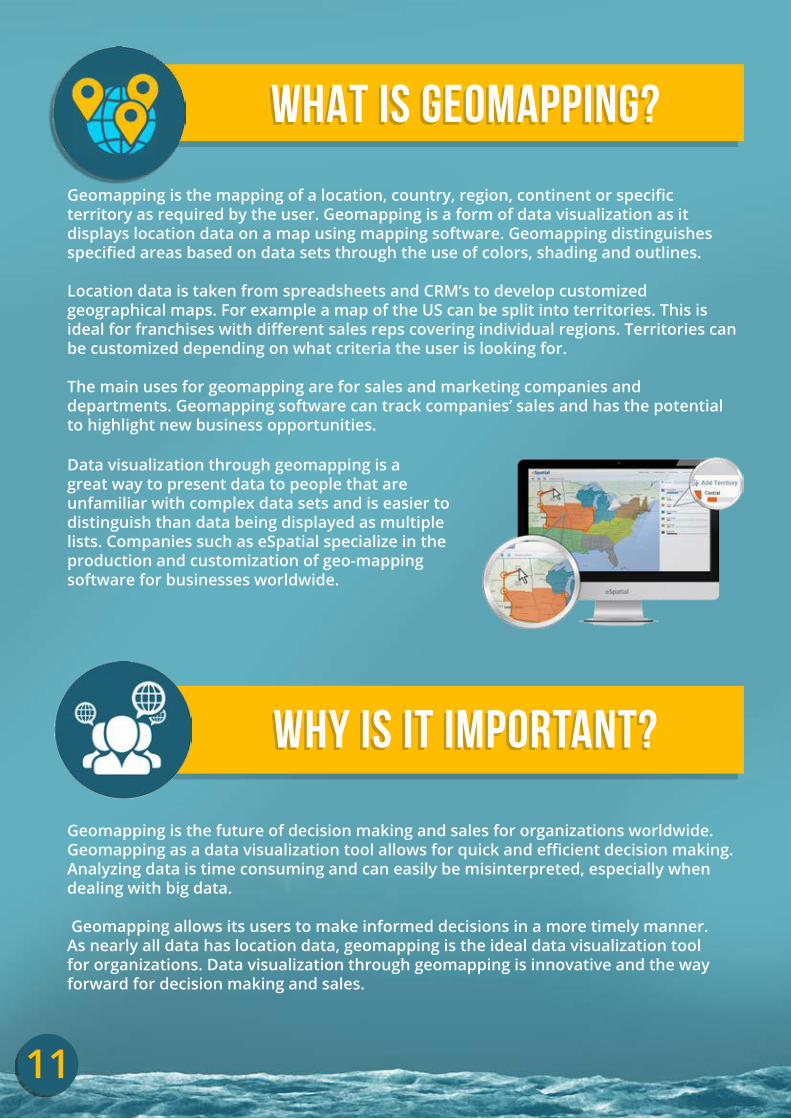
Geomapping is the mapping of a location, country, region, continent or specific territory as required by the user. Geomapping is a form of data visualization as it displays location data on a map using mapping software. Geomapping distinguishes specified areas based on data sets through the use of colors, shading and outlines.
Location data is taken from spreadsheets and CRM’s to develop customized geographical maps. For example a map of the US can be split into territories. This is ideal for franchises with different sales reps covering individual regions. Territories can be customized depending on what criteria the user is looking for.
The main uses for geomapping are for sales and marketing companies and departments. Geomapping software can track companies’ sales and has the potential to highlight new business opportunities.
Data visualization through geomapping is a great way to present data to people that are unfamiliar with complex data sets and is easier to distinguish than data being displayed as multiple lists. Companies such as eSpatial specialize in the production and customization of geo-mapping software for businesses worldwide.
Geomapping is the future of decision making and sales for organizations worldwide. Geomapping as a data visualization tool allows for quick and efficient decision making. Analyzing data is time consuming and can easily be misinterpreted, especially when dealing with big data.
Geomapping allows its users to make informed decisions in a more timely manner. As nearly all data has location data, geomapping is the ideal data visualization tool for organizations. Data visualization through geomapping is innovative and the way forward for decision making and sales.
WHAT IS GEOMAPPING?
WHY IS IT IMPORTANT?
12
Geo mapping software has an endless number of uses, and is capable of being adopted by virtually any business.
Its implementation in sales and marketing, logistics and distribution, health management, retail expansion – and many, many more industries has reaped real benefits.
Geo mapping software is an enabling technology – it takes any business data with a location element and turns it into a visualization that is engaging and self-explanatory – a map. This, in turn, allows for clearer and more in-depth analysis. This analysis promotes better communications, better decision making, more efficient business practices and, in many cases, a better ROI.
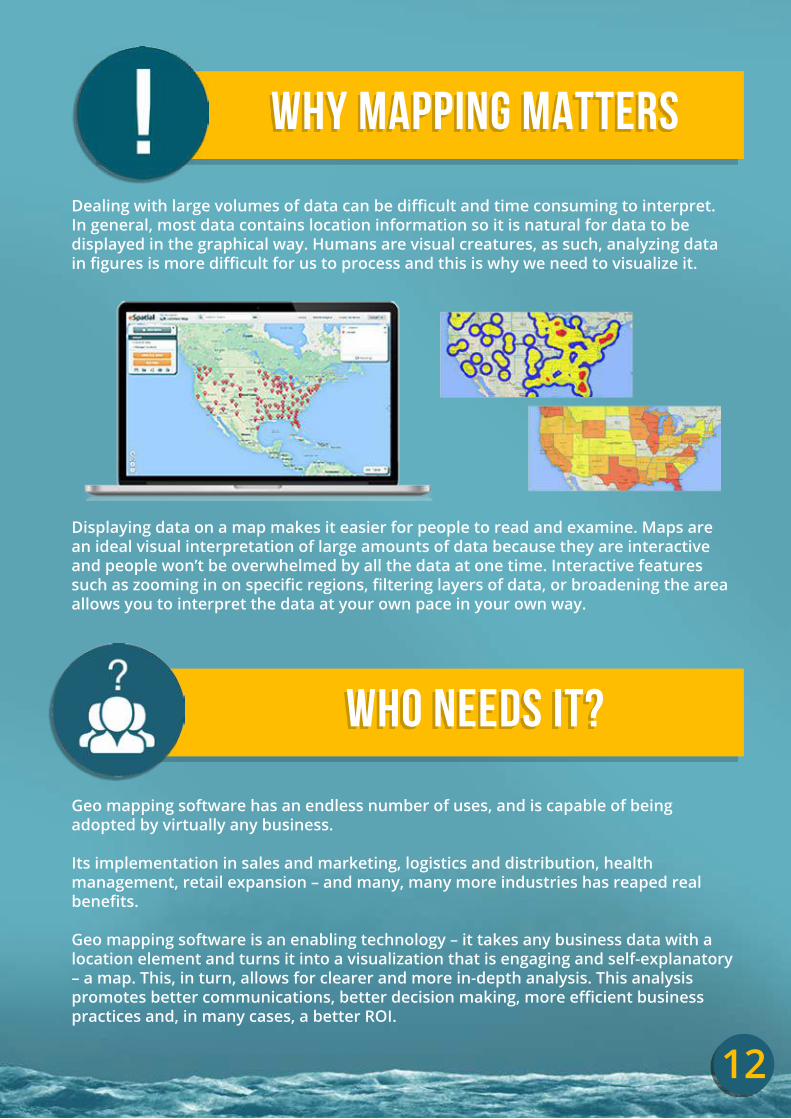
Displaying data on a map makes it easier for people to read and examine. Maps are an ideal visual interpretation of large amounts of data because they are interactive and people won’t be overwhelmed by all the data at one time. Interactive features such as zooming in on specific regions, filtering layers of data, or broadening the area allows you to interpret the data at your own pace in your own way.
WHY MAPPING MATTERS
WHO NEEDS IT?
Dealing with large volumes of data can be difficult and time consuming to interpret. In general, most data contains location information so it is natural for data to be displayed in the graphical way. Humans are visual creatures, as such, analyzing data in figures is more difficult for us to process and this is why we need to visualize it.
13
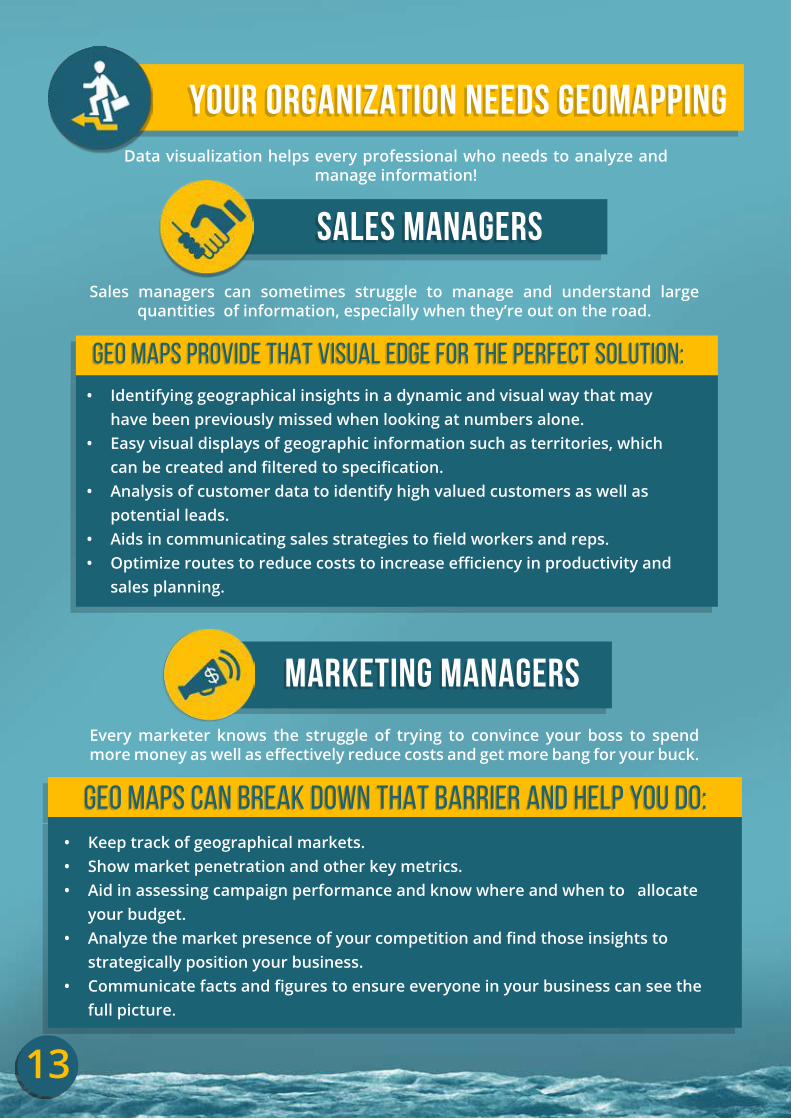
• Identifying geographical insights in a dynamic and visual way that may have been previously missed when looking at numbers alone.
• Easy visual displays of geographic information such as territories, which can be created and filtered to specification.
• Analysis of customer data to identify high valued customers as well as potential leads.
• Aids in communicating sales strategies to field workers and reps. • Optimize routes to reduce costs to increase efficiency in productivity and
sales planning.
YOUR ORGANIZATION NEEDS GEOMAPPING
SALES MANAGERS
MARKETING MANAGERS
GEO MAPS PROVIDE THAT VISUAL EDGE FOR THE PERFECT SOLUTION:
GEO MAPS CAN BREAK DOWN THAT BARRIER AND HELP YOU DO:
Data visualization helps every professional who needs to analyze and manage information!
• Keep track of geographical markets.• Show market penetration and other key metrics.• Aid in assessing campaign performance and know where and when to allocate
your budget.• Analyze the market presence of your competition and find those insights to
strategically position your business.• Communicate facts and figures to ensure everyone in your business can see the
full picture.
Every marketer knows the struggle of trying to convince your boss to spend more money as well as effectively reduce costs and get more bang for your buck.
Sales managers can sometimes struggle to manage and understand large quantities of information, especially when they’re out on the road.
14
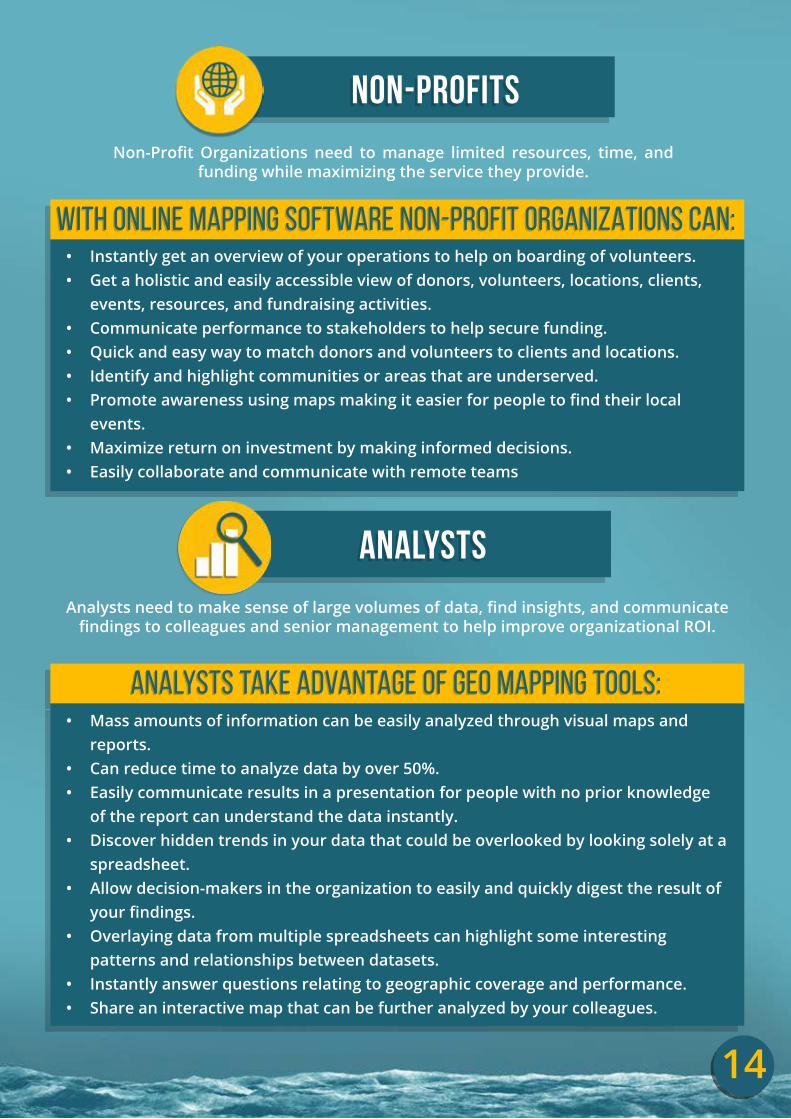
NON-PROFITS
ANALYSTS
WITH ONLINE MAPPING SOFTWARE NON-PROFIT ORGANIZATIONS CAN:
ANALYSTS TAKE ADVANTAGE OF GEO MAPPING TOOLS:
Non-Profit Organizations need to manage limited resources, time, and funding while maximizing the service they provide.
Analysts need to make sense of large volumes of data, find insights, and communicate findings to colleagues and senior management to help improve organizational ROI.
• Instantly get an overview of your operations to help on boarding of volunteers. • Get a holistic and easily accessible view of donors, volunteers, locations, clients,
events, resources, and fundraising activities. • Communicate performance to stakeholders to help secure funding. • Quick and easy way to match donors and volunteers to clients and locations. • Identify and highlight communities or areas that are underserved. • Promote awareness using maps making it easier for people to find their local
events. • Maximize return on investment by making informed decisions. • Easily collaborate and communicate with remote teams
• Mass amounts of information can be easily analyzed through visual maps and reports.
• Can reduce time to analyze data by over 50%.• Easily communicate results in a presentation for people with no prior knowledge
of the report can understand the data instantly. • Discover hidden trends in your data that could be overlooked by looking solely at a
spreadsheet.• Allow decision-makers in the organization to easily and quickly digest the result of
your findings. • Overlaying data from multiple spreadsheets can highlight some interesting
patterns and relationships between datasets. • Instantly answer questions relating to geographic coverage and performance.• Share an interactive map that can be further analyzed by your colleagues.
15
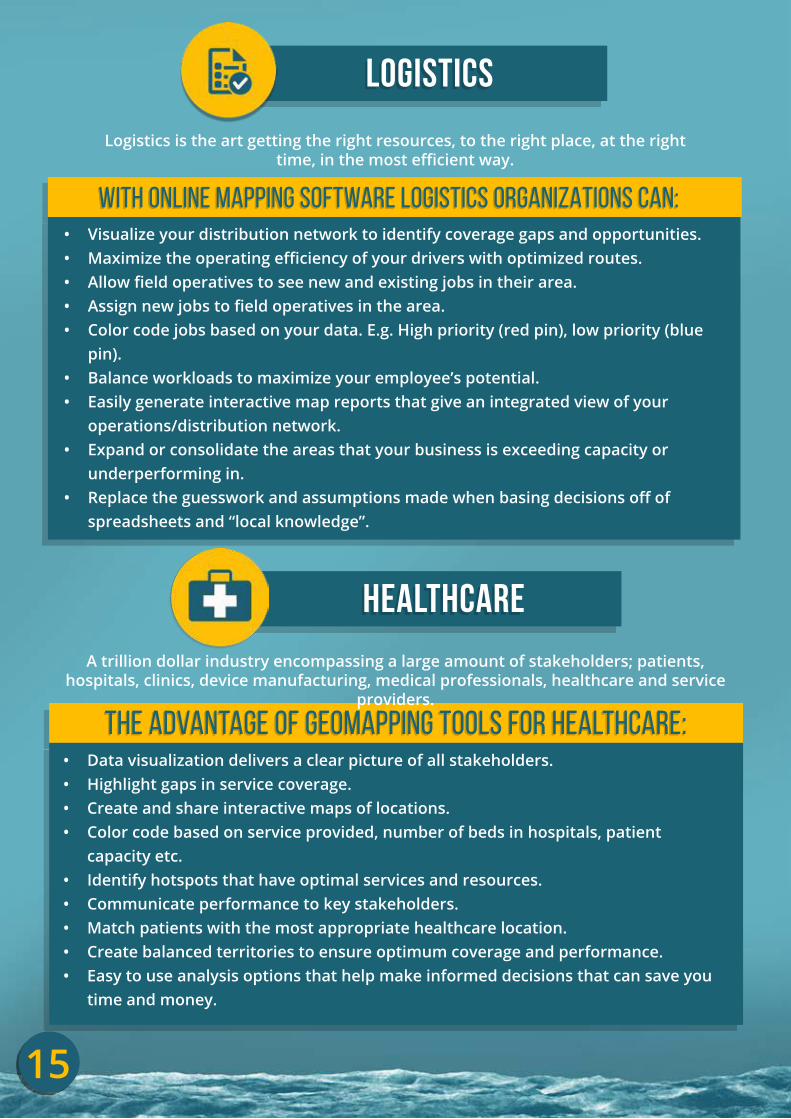
LOGISTICS
HEALTHCARE
WITH ONLINE MAPPING SOFTWARE LOGISTICS ORGANIZATIONS CAN:
THE ADVANTAGE OF GEOMAPPING TOOLS FOR HEALTHCARE:
• Visualize your distribution network to identify coverage gaps and opportunities.• Maximize the operating efficiency of your drivers with optimized routes.• Allow field operatives to see new and existing jobs in their area.• Assign new jobs to field operatives in the area.• Color code jobs based on your data. E.g. High priority (red pin), low priority (blue
pin).• Balance workloads to maximize your employee’s potential.• Easily generate interactive map reports that give an integrated view of your
operations/distribution network.• Expand or consolidate the areas that your business is exceeding capacity or
underperforming in.• Replace the guesswork and assumptions made when basing decisions off of
spreadsheets and “local knowledge”.
Logistics is the art getting the right resources, to the right place, at the right time, in the most efficient way.
• Data visualization delivers a clear picture of all stakeholders. • Highlight gaps in service coverage.• Create and share interactive maps of locations.• Color code based on service provided, number of beds in hospitals, patient
capacity etc.• Identify hotspots that have optimal services and resources. • Communicate performance to key stakeholders. • Match patients with the most appropriate healthcare location.• Create balanced territories to ensure optimum coverage and performance.• Easy to use analysis options that help make informed decisions that can save you
time and money.
A trillion dollar industry encompassing a large amount of stakeholders; patients, hospitals, clinics, device manufacturing, medical professionals, healthcare and service
providers.
16
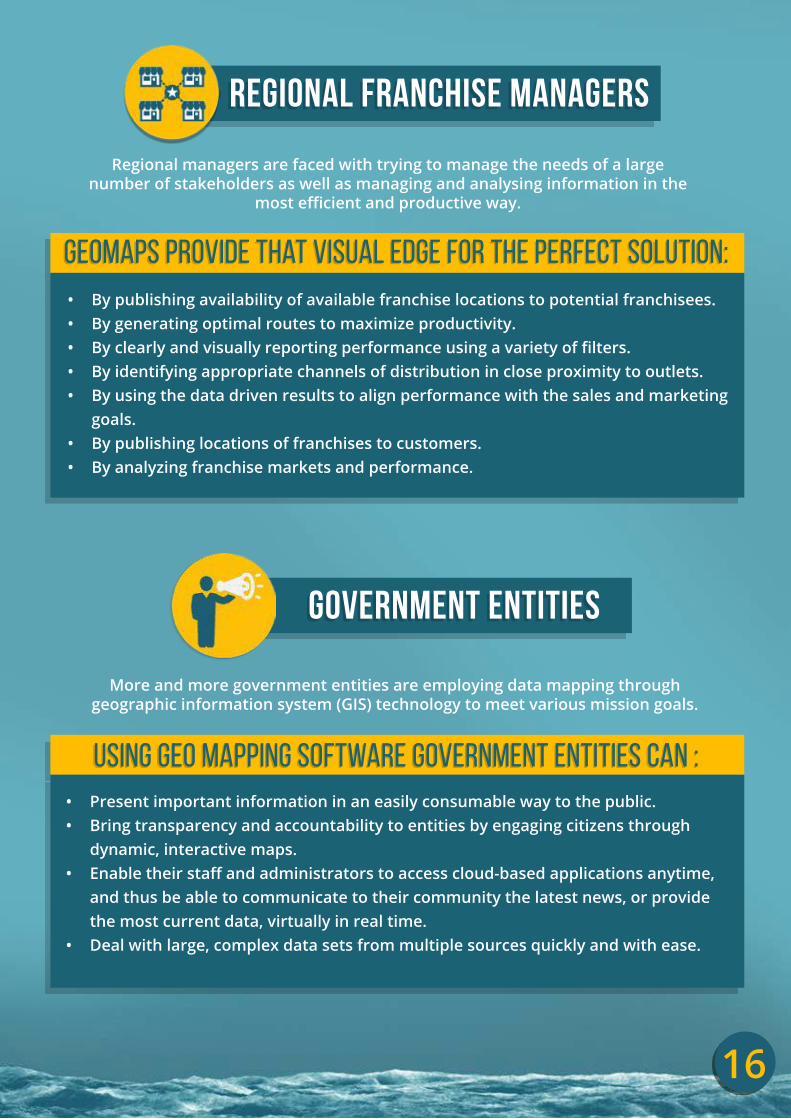
GOVERNMENT ENTITIES
REGIONAL FRANCHISE MANAGERS
Geomaps provide that visual edge for the perfect solution:
USING GEO MAPPING SOFTWARE GOVERNMENT ENTITIES CAN :
• By publishing availability of available franchise locations to potential franchisees.• By generating optimal routes to maximize productivity.• By clearly and visually reporting performance using a variety of filters.• By identifying appropriate channels of distribution in close proximity to outlets.• By using the data driven results to align performance with the sales and marketing
goals.• By publishing locations of franchises to customers.• By analyzing franchise markets and performance.
Regional managers are faced with trying to manage the needs of a large number of stakeholders as well as managing and analysing information in the
most efficient and productive way.
• Present important information in an easily consumable way to the public.• Bring transparency and accountability to entities by engaging citizens through
dynamic, interactive maps.• Enable their staff and administrators to access cloud-based applications anytime,
and thus be able to communicate to their community the latest news, or provide the most current data, virtually in real time.
• Deal with large, complex data sets from multiple sources quickly and with ease.
More and more government entities are employing data mapping through geographic information system (GIS) technology to meet various mission goals.
17
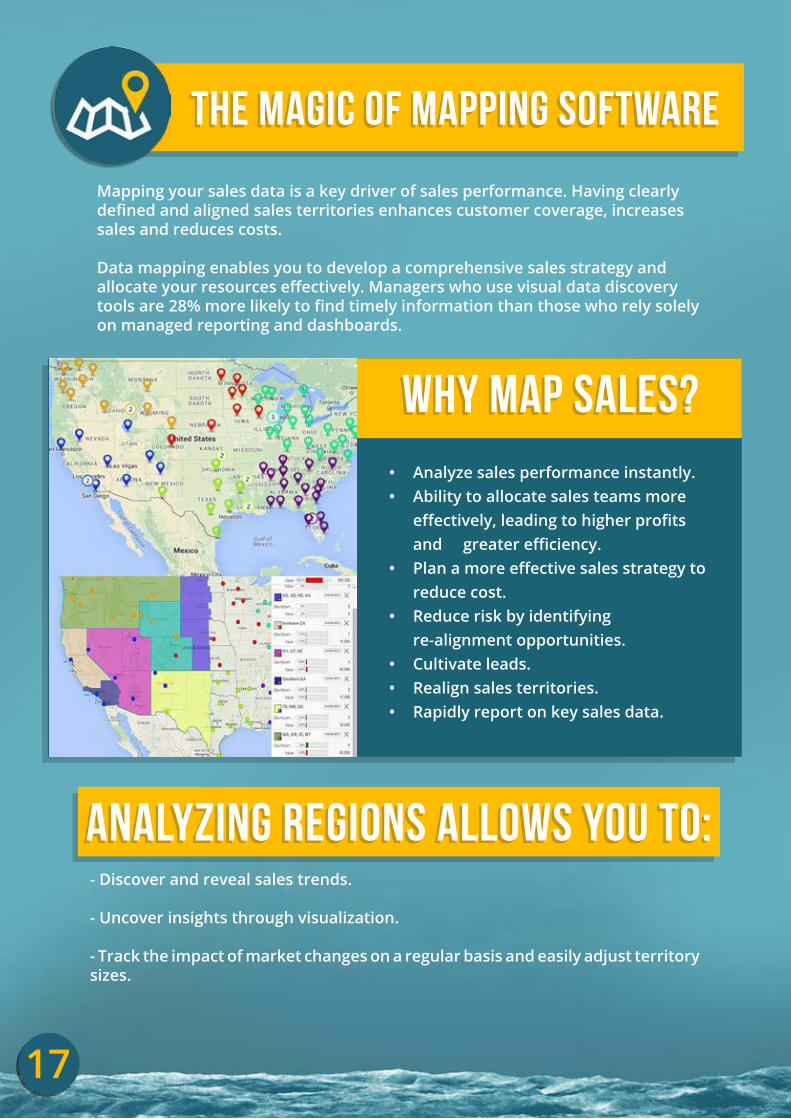
WHY MAP SALES?• Analyze sales performance instantly.• Ability to allocate sales teams more
effectively, leading to higher profits and greater efficiency.
• Plan a more effective sales strategy to reduce cost.
• Reduce risk by identifying re-alignment opportunities.
• Cultivate leads.• Realign sales territories.• Rapidly report on key sales data.
- Discover and reveal sales trends.
- Uncover insights through visualization.
- Track the impact of market changes on a regular basis and easily adjust territory sizes.
THE MAGIC OF MAPPING SOFTWARE
Mapping your sales data is a key driver of sales performance. Having clearly defined and aligned sales territories enhances customer coverage, increases sales and reduces costs.
Data mapping enables you to develop a comprehensive sales strategy and allocate your resources effectively. Managers who use visual data discovery tools are 28% more likely to find timely information than those who rely solely on managed reporting and dashboards.
ANALYZING REGIONS ALLOWS YOU TO:
18
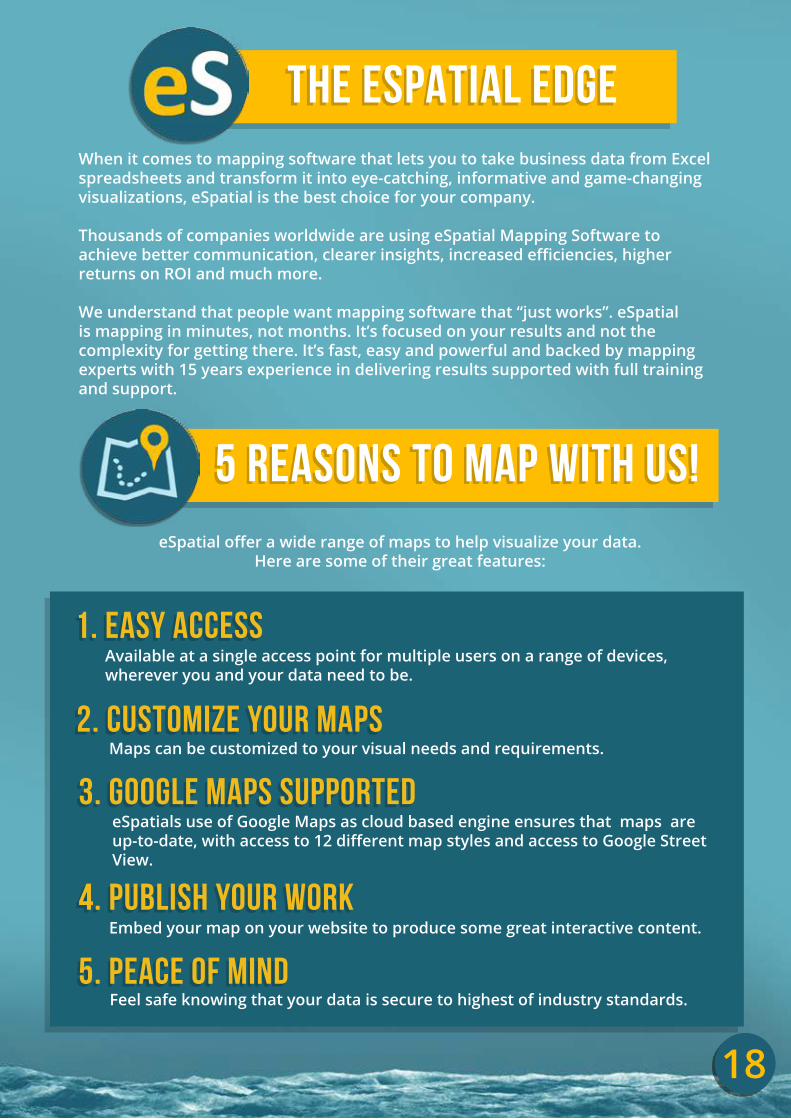
THE ESPATIAL EDGEWhen it comes to mapping software that lets you to take business data from Excel spreadsheets and transform it into eye-catching, informative and game-changing visualizations, eSpatial is the best choice for your company.
Thousands of companies worldwide are using eSpatial Mapping Software to achieve better communication, clearer insights, increased efficiencies, higher returns on ROI and much more.
We understand that people want mapping software that “just works”. eSpatial is mapping in minutes, not months. It’s focused on your results and not the complexity for getting there. It’s fast, easy and powerful and backed by mapping experts with 15 years experience in delivering results supported with full training and support.
5 REASONS TO MAP WITH US!eSpatial offer a wide range of maps to help visualize your data.
Here are some of their great features:
1. Easy Access
2. Customize Your maps
3. Google Maps Supported
4. Publish Your Work
5. Peace of Mind
Available at a single access point for multiple users on a range of devices, wherever you and your data need to be.
Maps can be customized to your visual needs and requirements.
eSpatials use of Google Maps as cloud based engine ensures that maps are up-to-date, with access to 12 different map styles and access to Google Street View.
Embed your map on your website to produce some great interactive content.
Feel safe knowing that your data is secure to highest of industry standards.
19
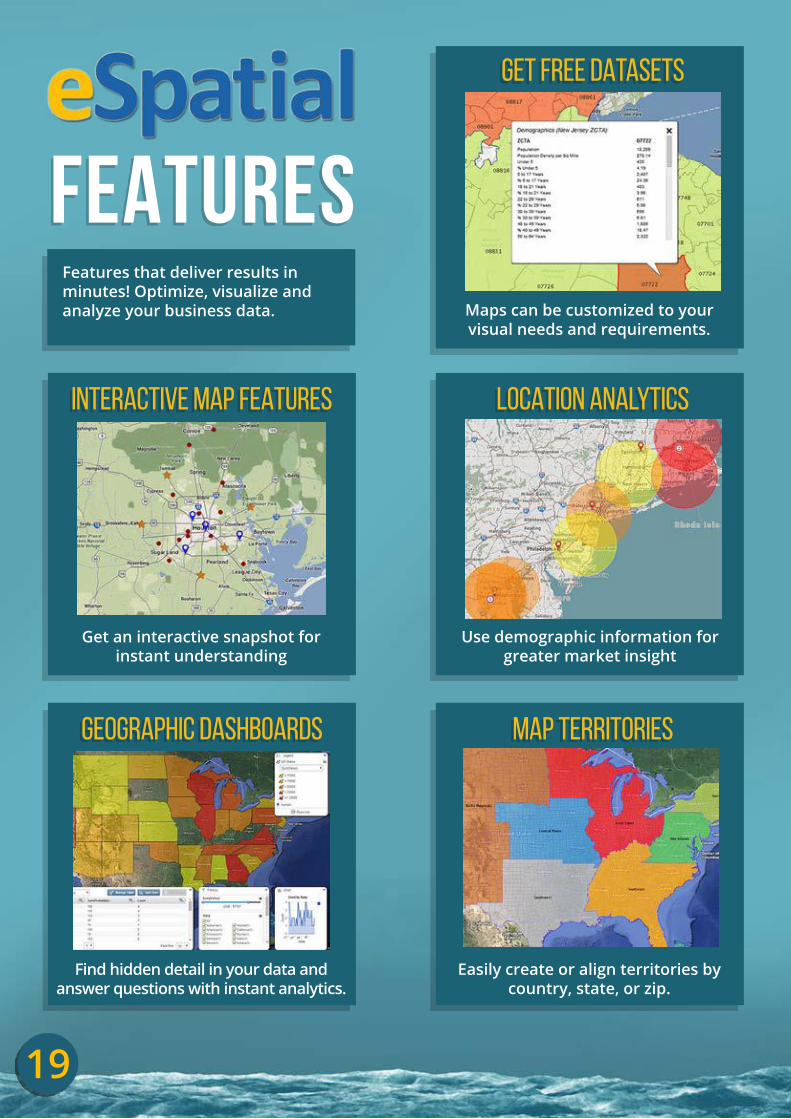
GET FREE DATASETS
INTERACTIVE MAP FEATURES LOCATION ANALYTICS
GEOGRAPHIC DASHBOARDS MAP TERRITORIES
Maps can be customized to your visual needs and requirements.
Get an interactive snapshot for instant understanding
Use demographic information for greater market insight
Find hidden detail in your data and answer questions with instant analytics.
Easily create or align territories by country, state, or zip.
FEATURESFeatures that deliver results in minutes! Optimize, visualize and analyze your business data.
20
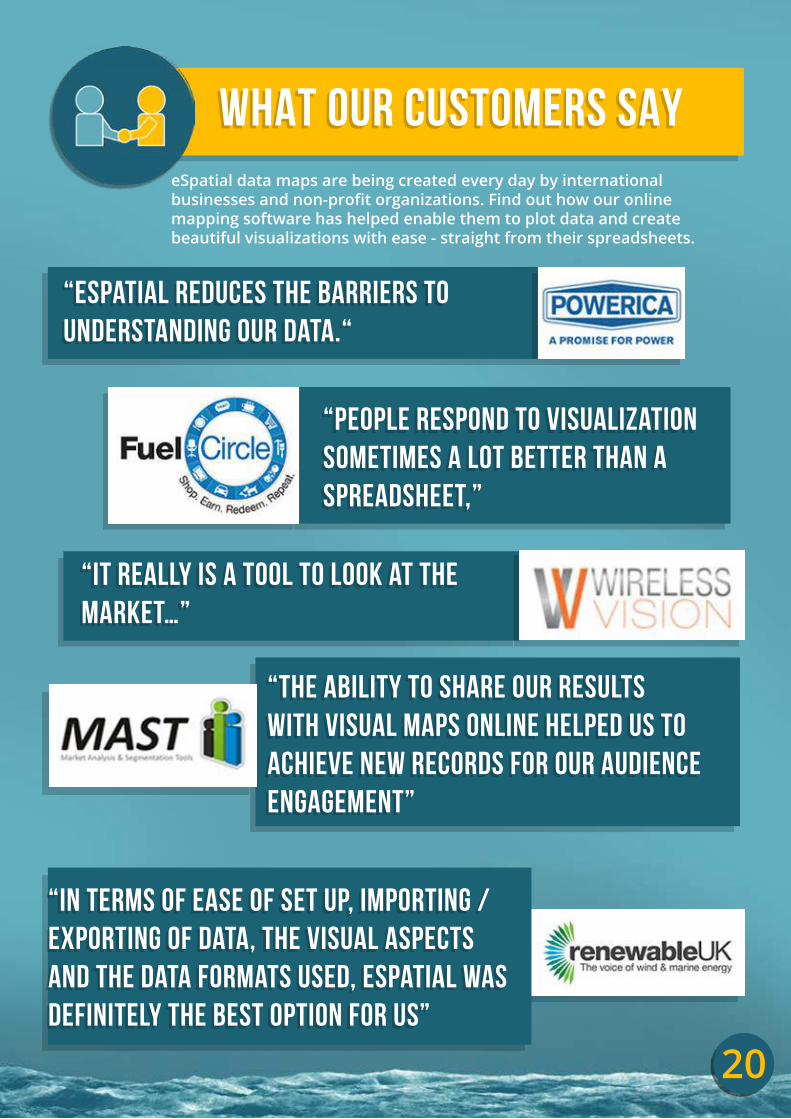
eSpatial data maps are being created every day by international businesses and non-profit organizations. Find out how our online mapping software has helped enable them to plot data and create beautiful visualizations with ease - straight from their spreadsheets.
WHAT OUR CUSTOMERS SAY
“eSpatial reduces the barriers to understanding our data.“
“People respond to visualization sometimes a lot better than a spreadsheet,”
“It really is a tool to look at the market…”
“The ability to share our results with visual maps online helped us to achieve new records for our audience engagement”
“In terms of ease of set up, importing /exporting of data, the visual aspects and the data formats used, eSpatial was definitely the best option for us”