Embed Size (px)
Citation preview
Drought Tabletop/Water Shortage Exercise
September 27th, 2017
SC
Dr
ou
gh
t/
Wa
te
r
Sh
or
ta
ge
Ta
ble
to
p E
xe
rc
ise
20
17
Acknowledgements
• Planning Committee• Hope Mizzell – Department of Natural Resources, State Climatology Office
• Ekaterina Altman, Amanda Farris, Kirsten Lackstrom – Carolinas Integrated Sciences & Assessments (CISA), University of South Carolina
• Robert Burton, Marshall Sykes – Emergency Management Division
• Jeff Allen, Dawn White – SC Water Resources Center, Clemson University
SC
Dr
ou
gh
t/
Wa
te
r
Sh
or
ta
ge
Ta
ble
to
p E
xe
rc
ise
20
17
•SCEMD leads the state emergency management program to minimize the loss of life and property from all-hazard events
•Multi Agency Coordination Center
South Carolina Emergency Management Division
•Upon activation of the Emergency Operations Plan (EOP), the State Emergency Response Team (SERT) comprised of ESFs and other personnel assemble in the SEOC to coordinate the State’s emergency Response
Emergency Support Functions (ESFs)
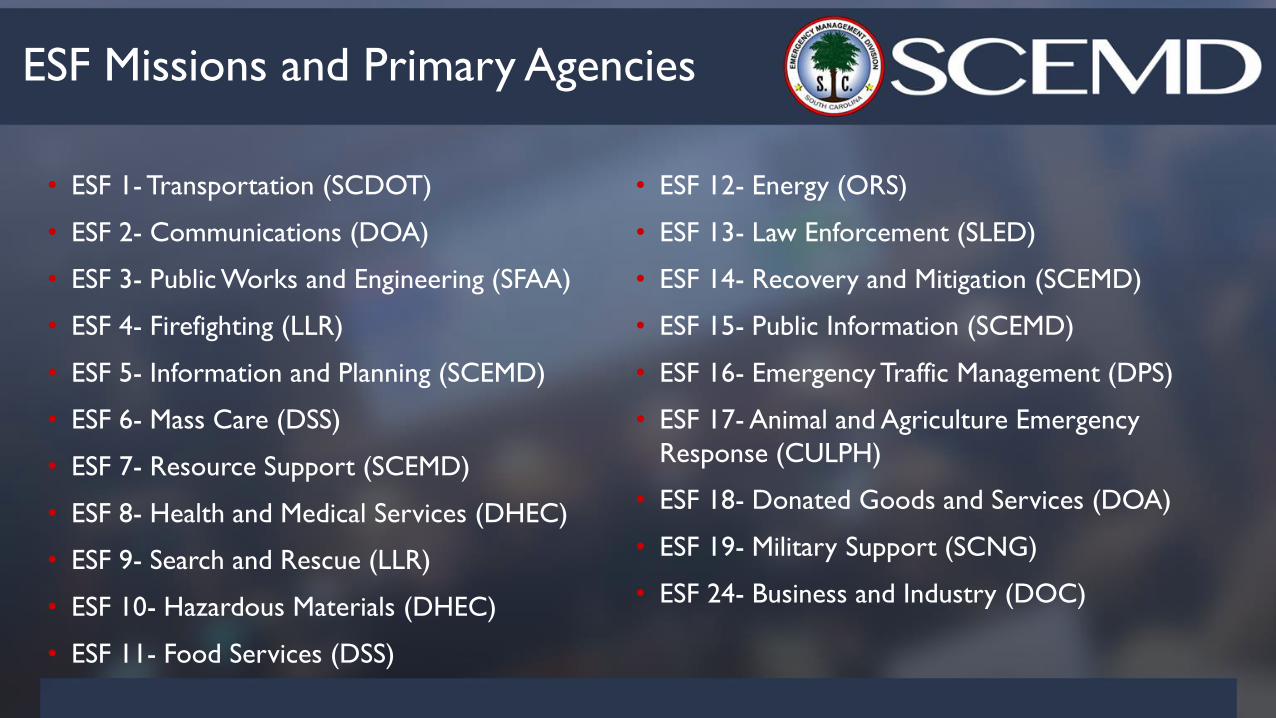
• ESF 1- Transportation (SCDOT)
• ESF 2- Communications (DOA)
• ESF 3- Public Works and Engineering (SFAA)
• ESF 4- Firefighting (LLR)
• ESF 5- Information and Planning (SCEMD)
• ESF 6- Mass Care (DSS)
• ESF 7- Resource Support (SCEMD)
• ESF 8- Health and Medical Services (DHEC)
• ESF 9- Search and Rescue (LLR)
• ESF 10- Hazardous Materials (DHEC)
• ESF 11- Food Services (DSS)
• ESF 12- Energy (ORS)
• ESF 13- Law Enforcement (SLED)
• ESF 14- Recovery and Mitigation (SCEMD)
• ESF 15- Public Information (SCEMD)
• ESF 16- Emergency Traffic Management (DPS)
• ESF 17- Animal and Agriculture Emergency
Response (CULPH)
• ESF 18- Donated Goods and Services (DOA)
• ESF 19- Military Support (SCNG)
• ESF 24- Business and Industry (DOC)
ESF Missions and Primary Agencies
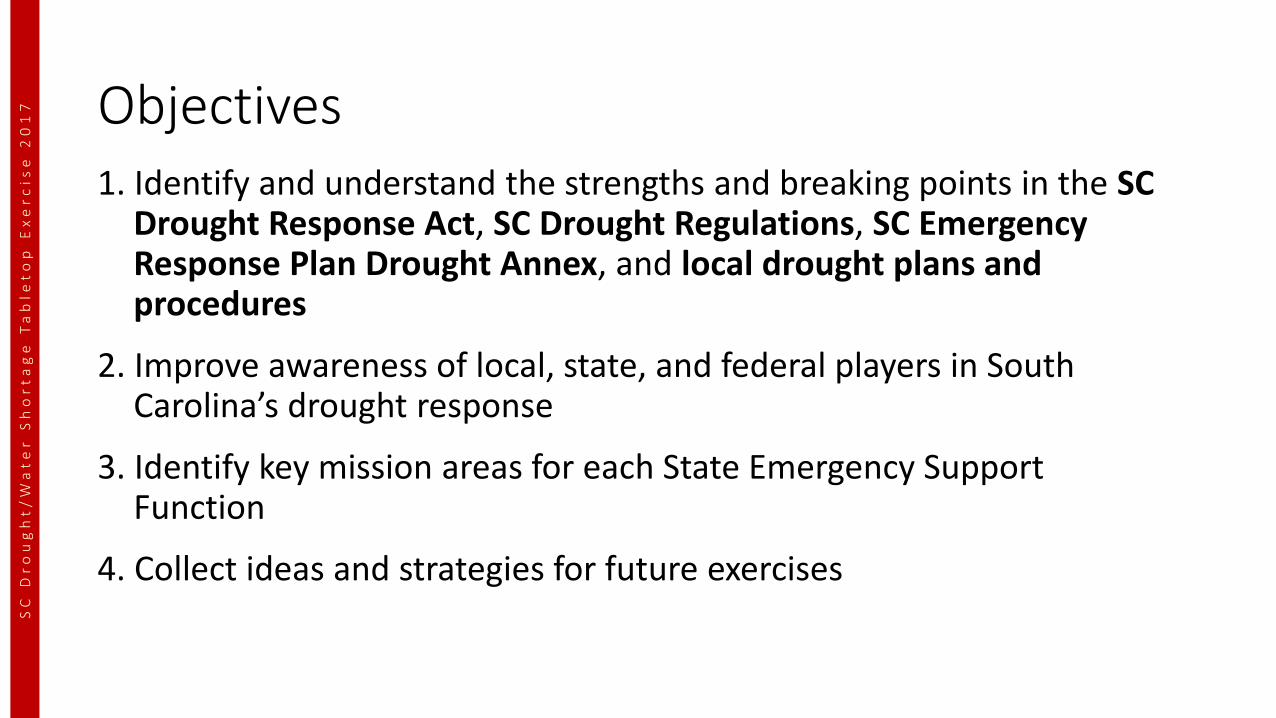
Objectives 1. Identify and understand the strengths and breaking points in the SC
Drought Response Act, SC Drought Regulations, SC Emergency Response Plan Drought Annex, and local drought plans and procedures
2. Improve awareness of local, state, and federal players in South Carolina’s drought response
3. Identify key mission areas for each State Emergency Support Function
4. Collect ideas and strategies for future exercises
SC
Dr
ou
gh
t/
Wa
te
r
Sh
or
ta
ge
Ta
ble
to
p E
xe
rc
ise
20
17
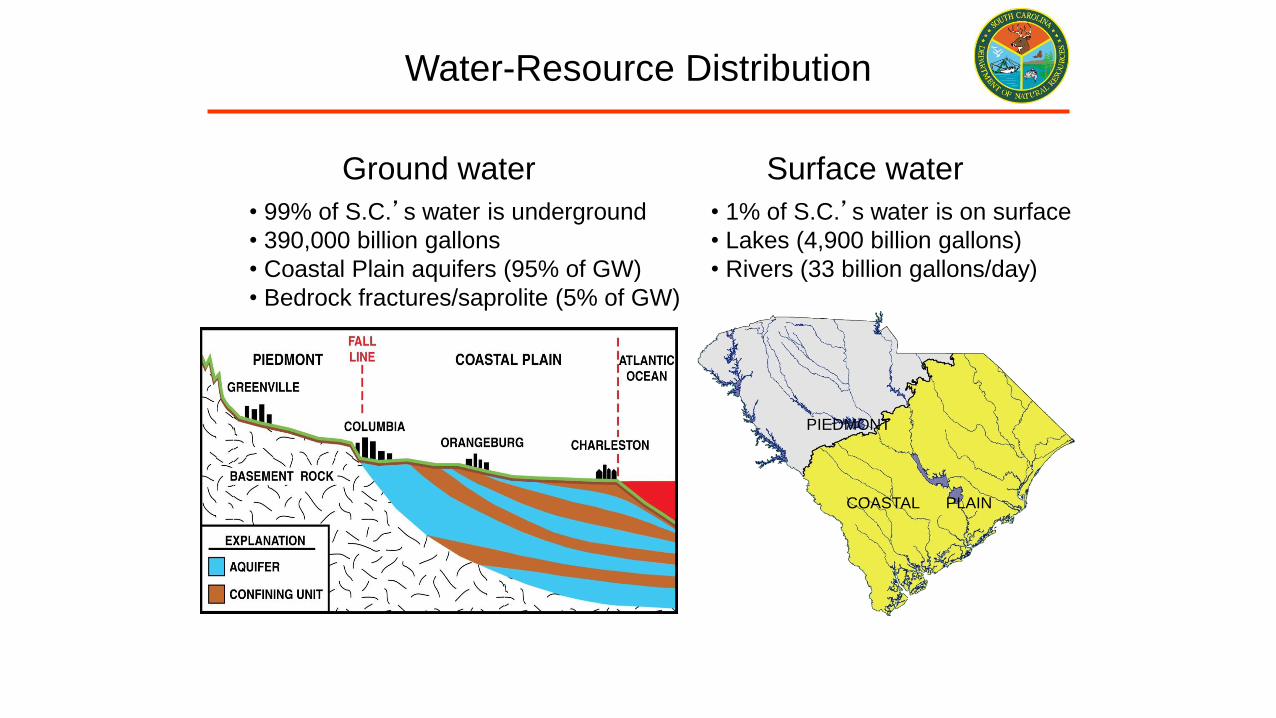
Water-Resource Distribution
Ground water
• 1% of S.C.’s water is on surface
• Lakes (4,900 billion gallons)
• Rivers (33 billion gallons/day)
• 99% of S.C.’s water is underground
• 390,000 billion gallons
• Coastal Plain aquifers (95% of GW)
• Bedrock fractures/saprolite (5% of GW)
Surface water
PIEDMONT
COASTAL PLAIN
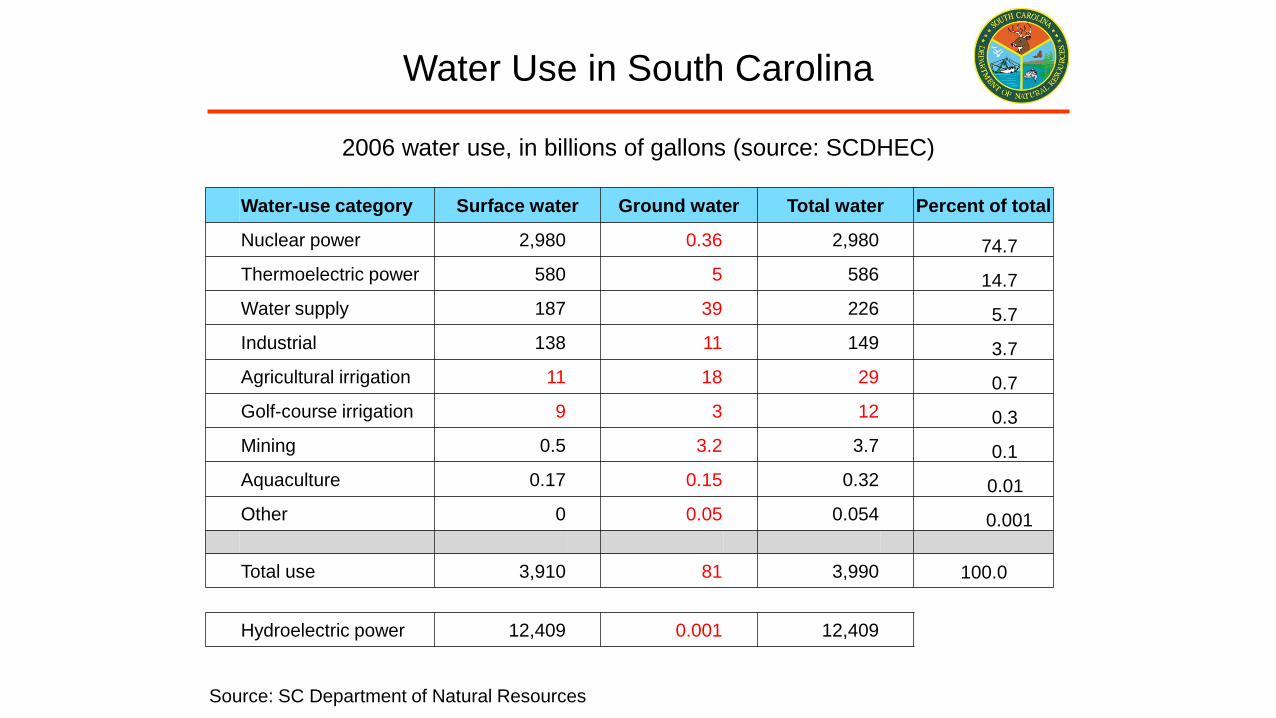
Water Use in South Carolina
2006 water use, in billions of gallons (source: SCDHEC)
Water-use category Surface water Ground water Total water Percent of total
Nuclear power 2,980 0.36 2,980 74.7
Thermoelectric power 580 5 586 14.7
Water supply 187 39 226 5.7
Industrial 138 11 149 3.7
Agricultural irrigation 11 18 29 0.7
Golf-course irrigation 9 3 12 0.3
Mining 0.5 3.2 3.7 0.1
Aquaculture 0.17 0.15 0.32 0.01
Other 0 0.05 0.054 0.001
Total use 3,910 81 3,990 100.00
Hydroelectric power 12,409 0.001 12,409
Source: SC Department of Natural Resources
9
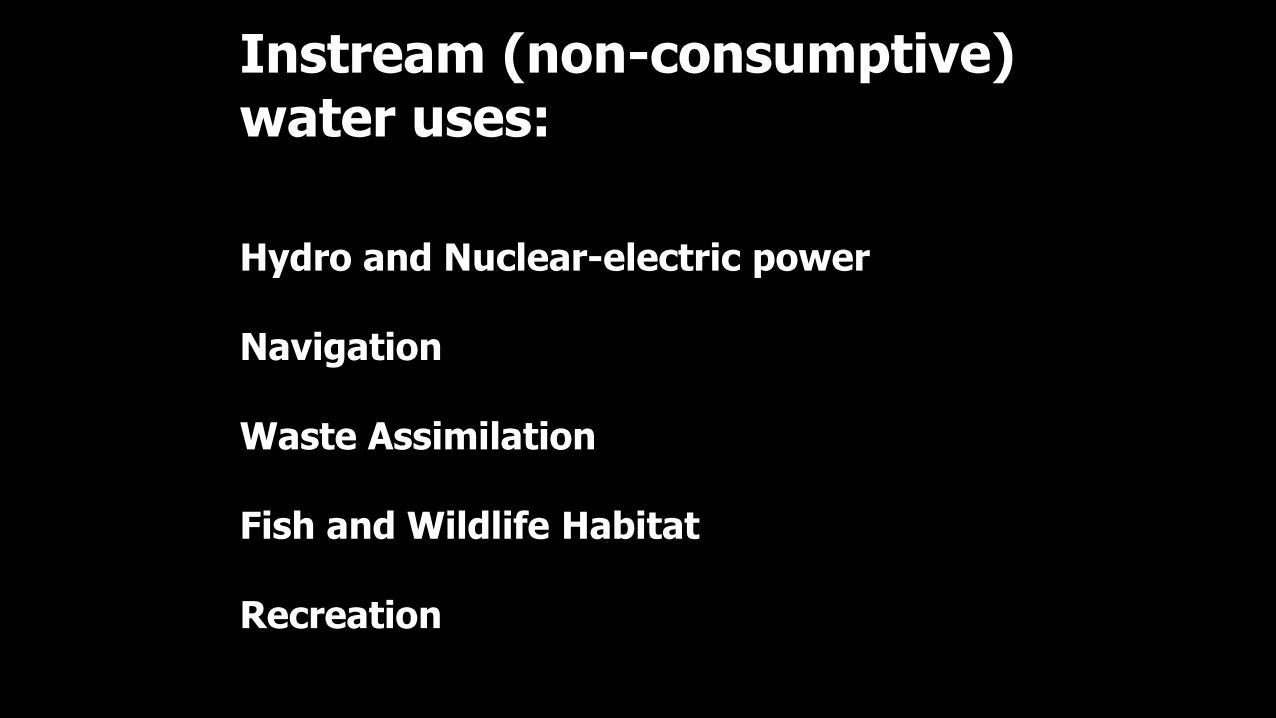
Instream (non-consumptive) water uses:
Hydro and Nuclear-electric power
Navigation
Waste Assimilation
Fish and Wildlife Habitat
Recreation
10
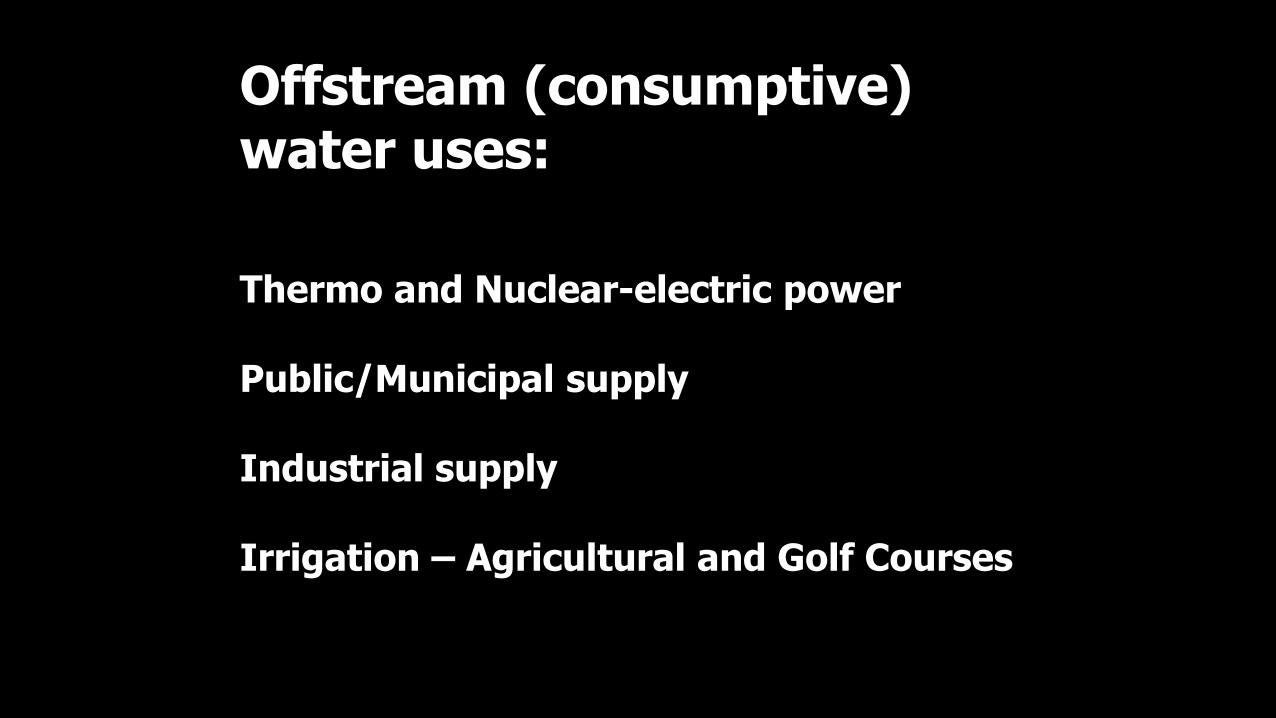
Offstream (consumptive) water uses:
Thermo and Nuclear-electric power
Public/Municipal supply
Industrial supply
Irrigation – Agricultural and Golf Courses
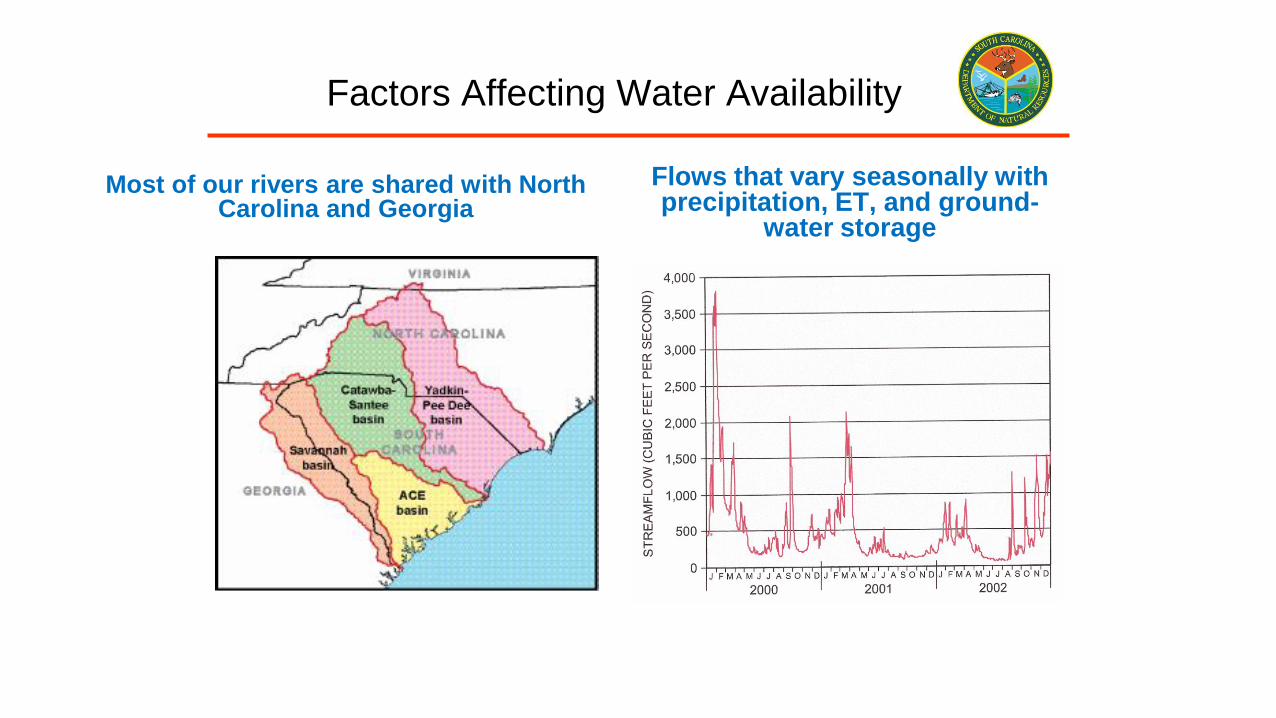
Factors Affecting Water Availability
Most of our rivers are shared with North Carolina and Georgia
Flows that vary seasonally with precipitation, ET, and ground-
water storage
Surface Water Withdrawal Permitting, Registration and Use and Reporting Act
Beginning January 1, 2011, anyone withdrawing more that 3 million gallons or more in any 1 month from surface waters of South Carolina must obtain a surface water withdrawal permit or, for agricultural withdrawals, register their withdrawal with the Department unless exempt under the Act.
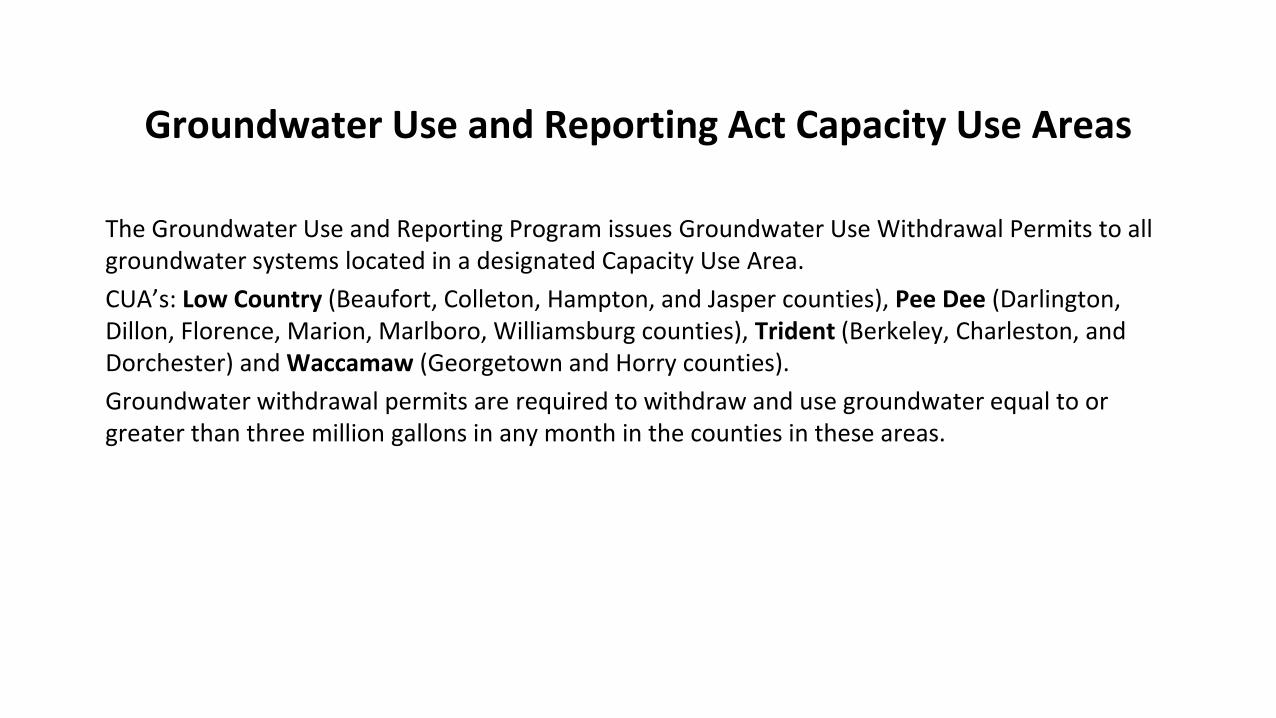
Groundwater Use and Reporting Act Capacity Use Areas
The Groundwater Use and Reporting Program issues Groundwater Use Withdrawal Permits to all groundwater systems located in a designated Capacity Use Area.
CUA’s: Low Country (Beaufort, Colleton, Hampton, and Jasper counties), Pee Dee (Darlington, Dillon, Florence, Marion, Marlboro, Williamsburg counties), Trident (Berkeley, Charleston, and Dorchester) and Waccamaw (Georgetown and Horry counties).
Groundwater withdrawal permits are required to withdraw and use groundwater equal to or greater than three million gallons in any month in the counties in these areas.
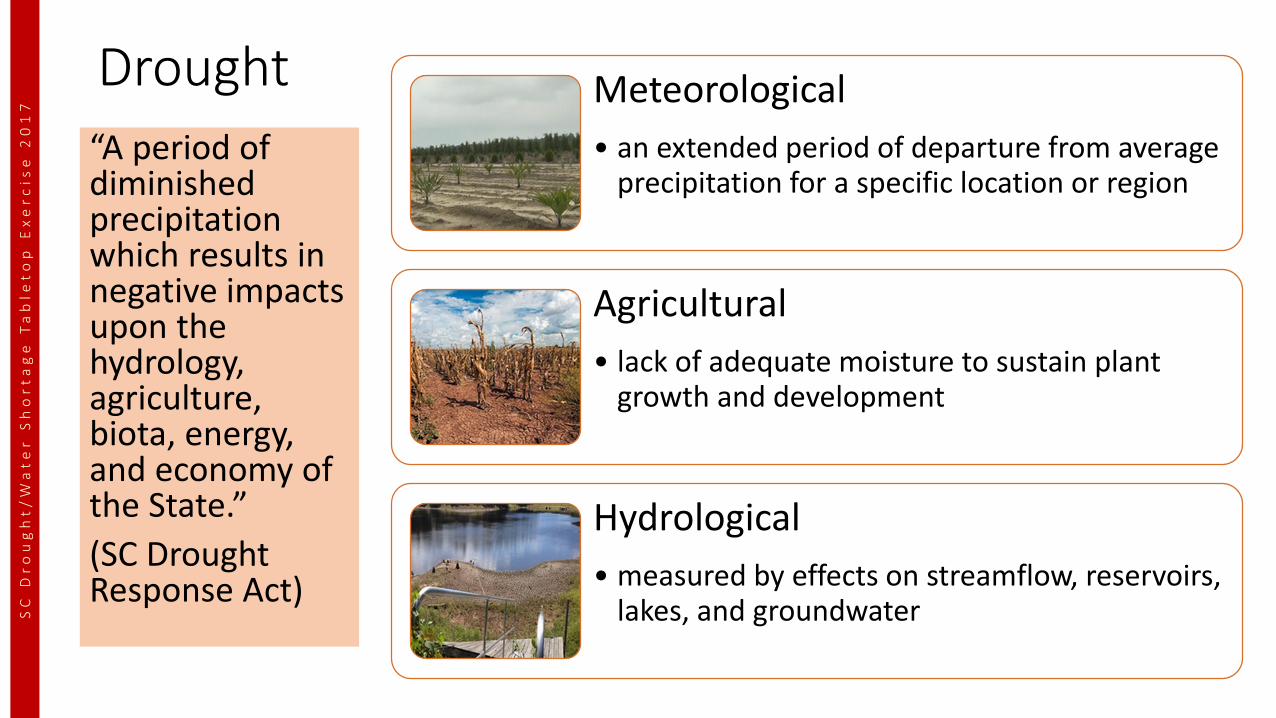
Drought
“A period of diminished precipitation which results in negative impacts upon the hydrology, agriculture, biota, energy, and economy of the State.”
(SC Drought Response Act)
SC
Dr
ou
gh
t/
Wa
te
r
Sh
or
ta
ge
Ta
ble
to
p E
xe
rc
ise
20
17
Meteorological
• an extended period of departure from average precipitation for a specific location or region
Agricultural
• lack of adequate moisture to sustain plant growth and development
Hydrological
• measured by effects on streamflow, reservoirs, lakes, and groundwater
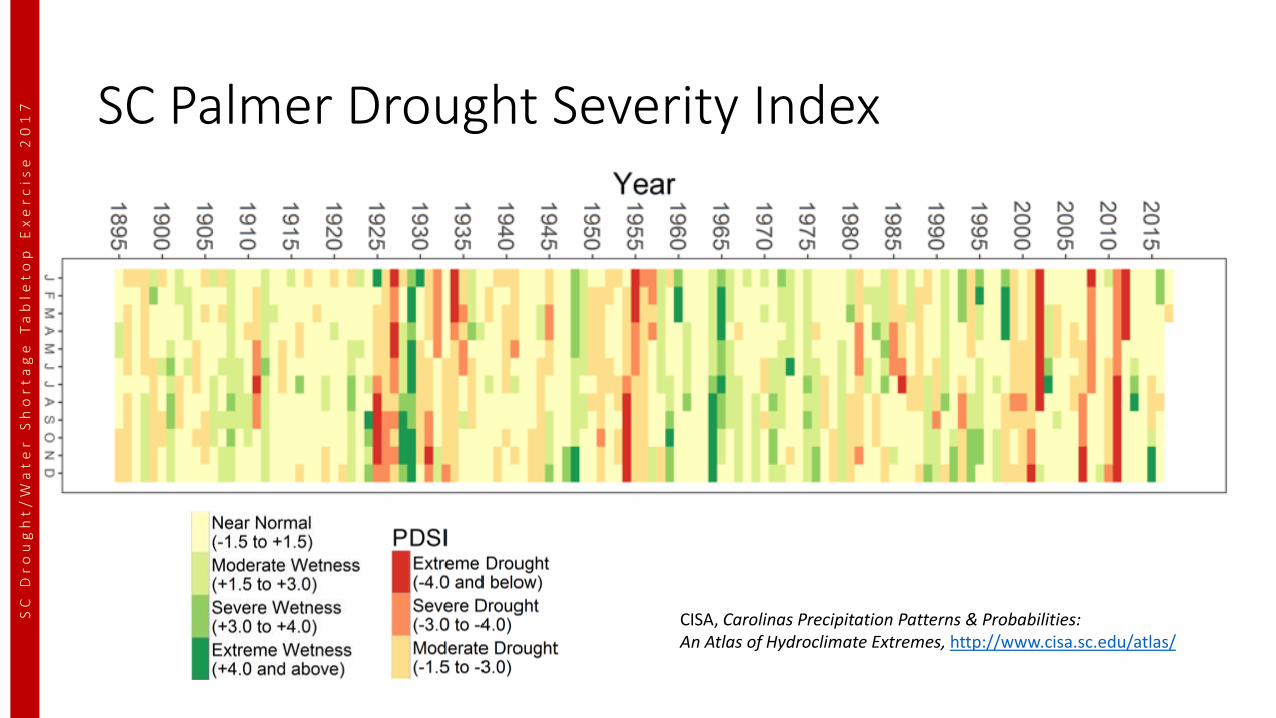
SC Palmer Drought Severity Index
SC
Dr
ou
gh
t/
Wa
te
r
Sh
or
ta
ge
Ta
ble
to
p E
xe
rc
ise
20
17
CISA, Carolinas Precipitation Patterns & Probabilities: An Atlas of Hydroclimate Extremes, http://www.cisa.sc.edu/atlas/
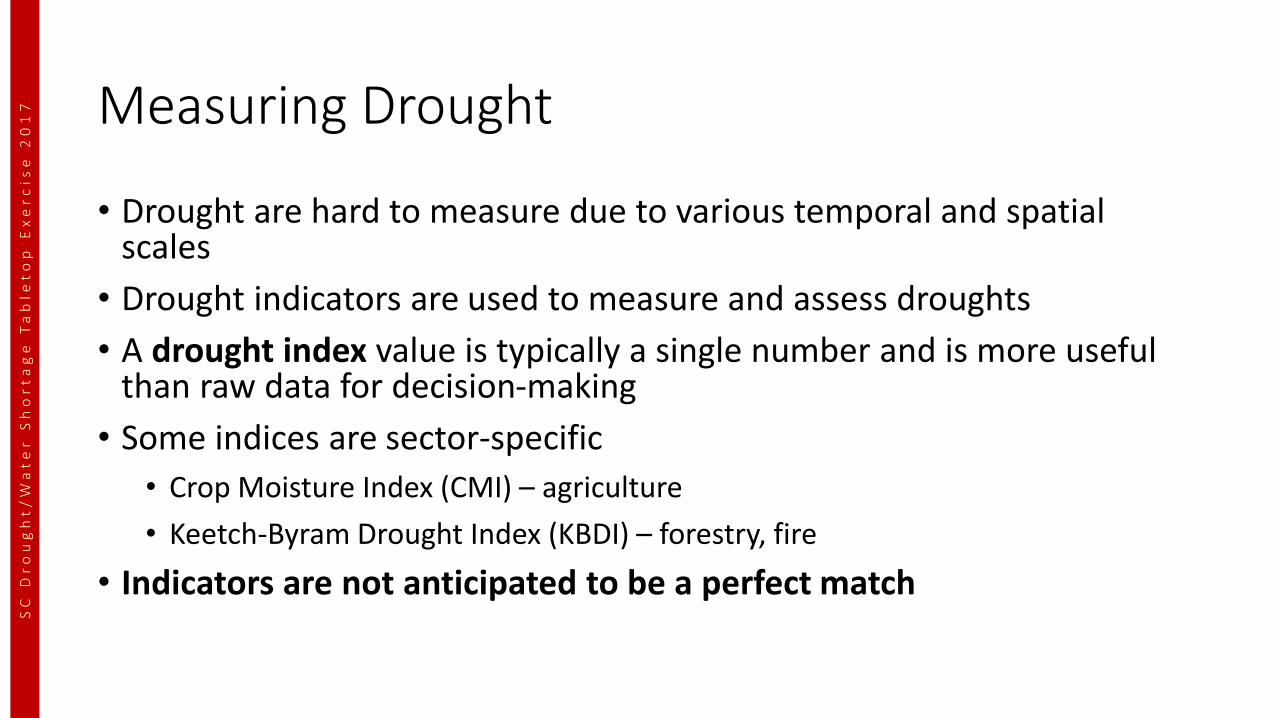
Measuring Drought
• Drought are hard to measure due to various temporal and spatial scales
• Drought indicators are used to measure and assess droughts
• A drought index value is typically a single number and is more useful than raw data for decision-making
• Some indices are sector-specific
• Crop Moisture Index (CMI) – agriculture
• Keetch-Byram Drought Index (KBDI) – forestry, fire
• Indicators are not anticipated to be a perfect match
SC
Dr
ou
gh
t/
Wa
te
r
Sh
or
ta
ge
Ta
ble
to
p E
xe
rc
ise
20
17
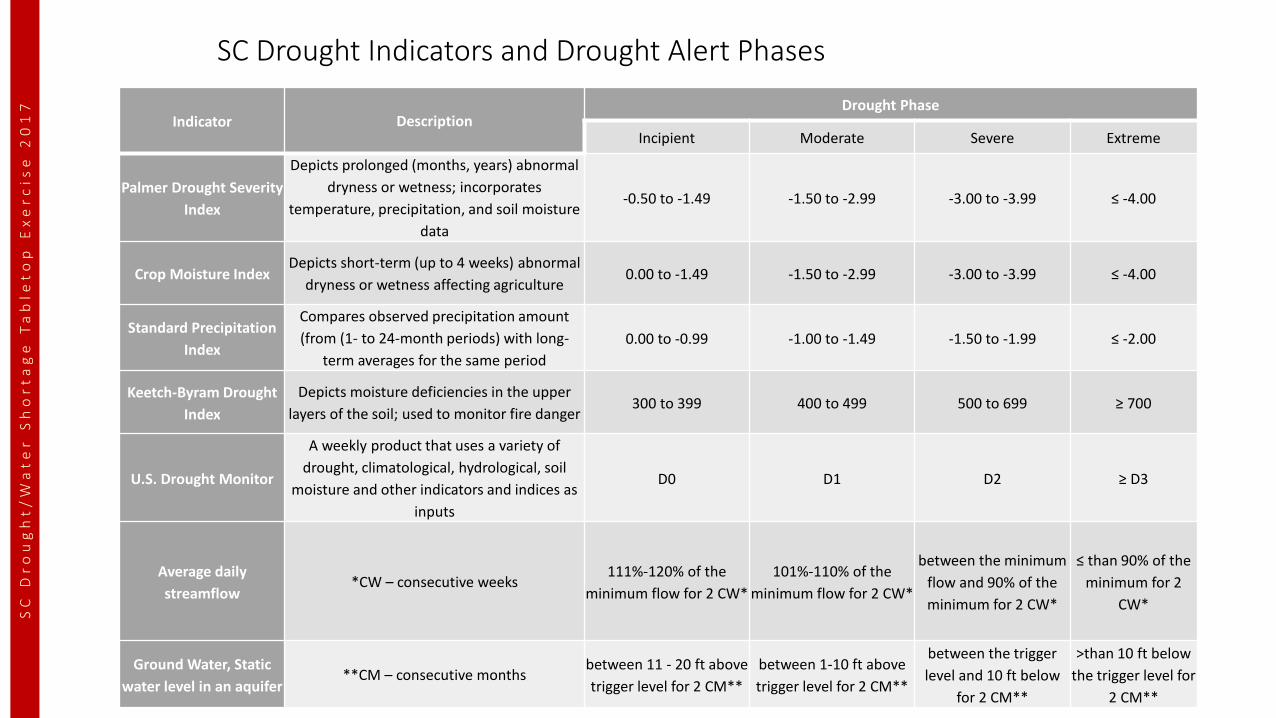
SC Drought Indicators and Drought Alert Phases
Indicator DescriptionDrought Phase
Incipient Moderate Severe Extreme
Palmer Drought Severity
Index
Depicts prolonged (months, years) abnormal
dryness or wetness; incorporates
temperature, precipitation, and soil moisture
data
-0.50 to -1.49 -1.50 to -2.99 -3.00 to -3.99 ≤ -4.00
Crop Moisture IndexDepicts short-term (up to 4 weeks) abnormal
dryness or wetness affecting agriculture0.00 to -1.49 -1.50 to -2.99 -3.00 to -3.99 ≤ -4.00
Standard Precipitation
Index
Compares observed precipitation amount
(from (1- to 24-month periods) with long-
term averages for the same period
0.00 to -0.99 -1.00 to -1.49 -1.50 to -1.99 ≤ -2.00
Keetch-Byram Drought
Index
Depicts moisture deficiencies in the upper
layers of the soil; used to monitor fire danger300 to 399 400 to 499 500 to 699 ≥ 700
U.S. Drought Monitor
A weekly product that uses a variety of
drought, climatological, hydrological, soil
moisture and other indicators and indices as
inputs
D0 D1 D2 ≥ D3
Average daily
streamflow*CW – consecutive weeks
111%-120% of the
minimum flow for 2 CW*
101%-110% of the
minimum flow for 2 CW*
between the minimum
flow and 90% of the
minimum for 2 CW*
≤ than 90% of the
minimum for 2
CW*
Ground Water, Static
water level in an aquifer**CM – consecutive months
between 11 - 20 ft above
trigger level for 2 CM**
between 1-10 ft above
trigger level for 2 CM**
between the trigger
level and 10 ft below
for 2 CM**
>than 10 ft below
the trigger level for
2 CM**
SC
Dr
ou
gh
t/
Wa
te
r
Sh
or
ta
ge
Ta
ble
to
p E
xe
rc
ise
20
17
Drought Response Plans in South Carolina
• Drought Response Act
• Drought Regulations
• Emergency Operations Plan (Appendix 10, SC Drought Response Plan)
SC
Dr
ou
gh
t/
Wa
te
r
Sh
or
ta
ge
Ta
ble
to
p E
xe
rc
ise
20
17
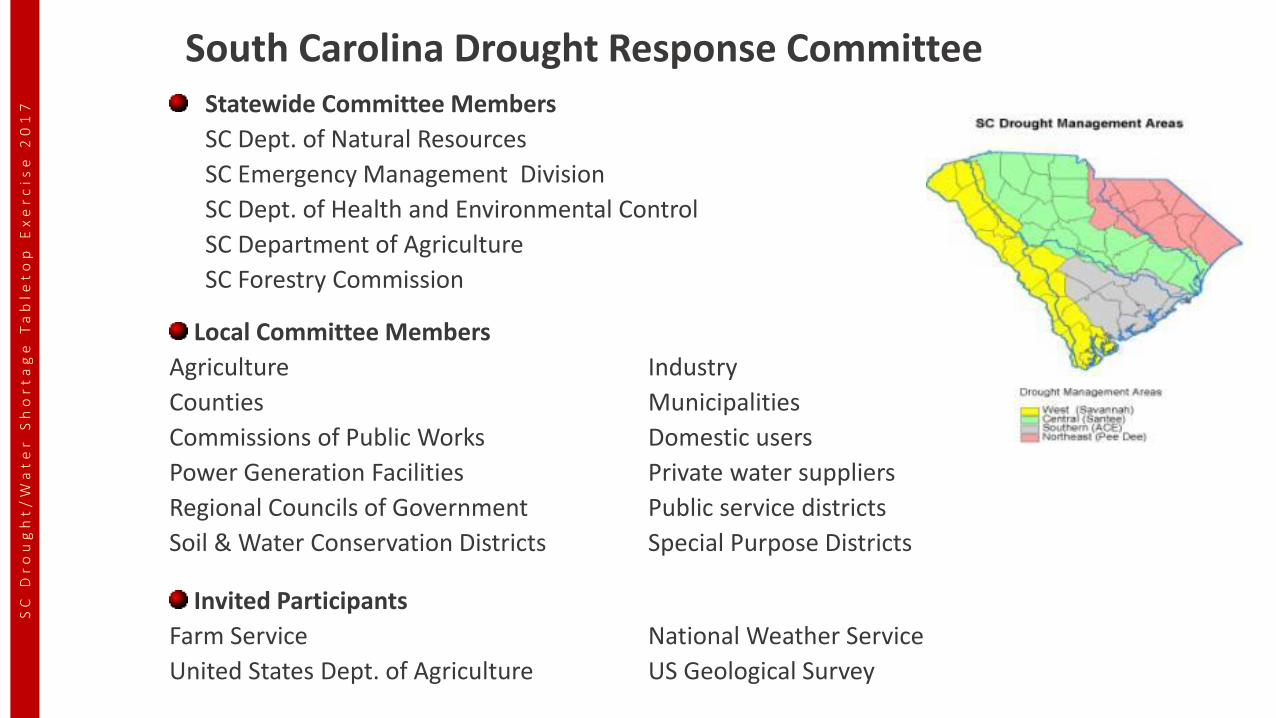
Statewide Committee Members
SC Dept. of Natural Resources
SC Emergency Management Division
SC Dept. of Health and Environmental Control
SC Department of Agriculture
SC Forestry Commission
Local Committee Members
Agriculture Industry
Counties Municipalities
Commissions of Public Works Domestic users
Power Generation Facilities Private water suppliers
Regional Councils of Government Public service districts
Soil & Water Conservation Districts Special Purpose Districts
Invited Participants
Farm Service National Weather Service
United States Dept. of Agriculture US Geological Survey
South Carolina Drought Response CommitteeS
C D
ro
ug
ht
/W
at
er
S
ho
rt
ag
e T
ab
let
op
Ex
er
cis
e 2
01
7
SC
Dr
ou
gh
t/
Wa
te
r
Sh
or
ta
ge
Ta
ble
to
p E
xe
rc
ise
20
17
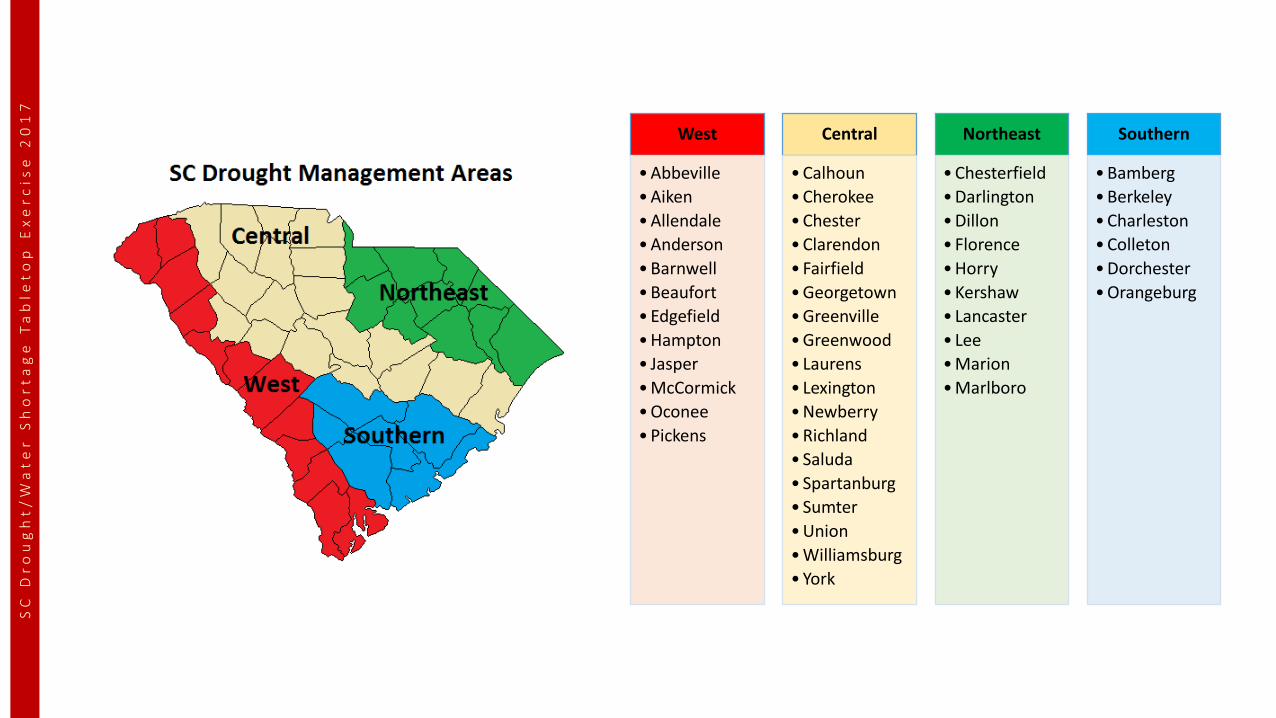
West
• Abbeville
• Aiken
• Allendale
• Anderson
• Barnwell
• Beaufort
• Edgefield
• Hampton
• Jasper
• McCormick
• Oconee
• Pickens
Central
• Calhoun
• Cherokee
• Chester
• Clarendon
• Fairfield
• Georgetown
• Greenville
• Greenwood
• Laurens
• Lexington
• Newberry
• Richland
• Saluda
• Spartanburg
• Sumter
• Union
• Williamsburg
• York
Northeast
• Chesterfield
• Darlington
• Dillon
• Florence
• Horry
• Kershaw
• Lancaster
• Lee
• Marion
• Marlboro
Southern
• Bamberg
• Berkeley
• Charleston
• Colleton
• Dorchester
• Orangeburg
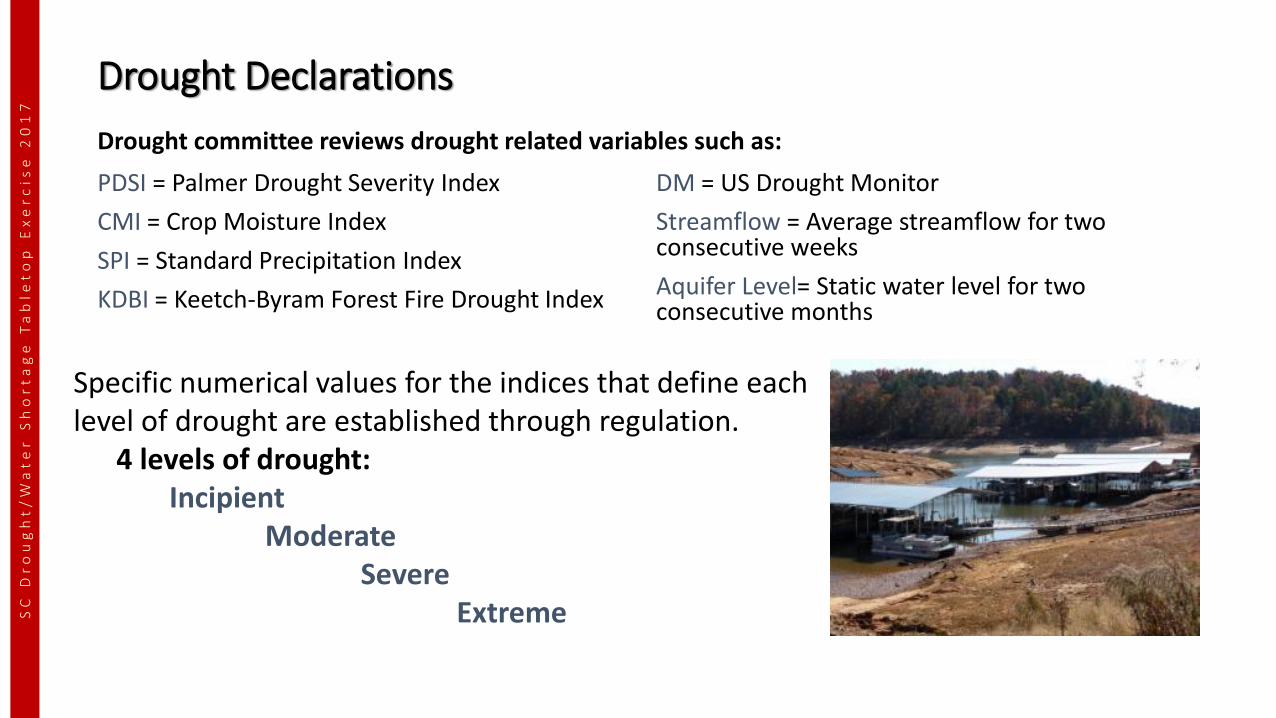
Drought Declarations
PDSI = Palmer Drought Severity Index
CMI = Crop Moisture Index
SPI = Standard Precipitation Index
KDBI = Keetch-Byram Forest Fire Drought Index
DM = US Drought Monitor
Streamflow = Average streamflow for two consecutive weeks
Aquifer Level= Static water level for two consecutive months
Drought committee reviews drought related variables such as:
Specific numerical values for the indices that define each level of drought are established through regulation.
4 levels of drought:Incipient
ModerateSevere
ExtremeSC
Dr
ou
gh
t/
Wa
te
r
Sh
or
ta
ge
Ta
ble
to
p E
xe
rc
ise
20
17
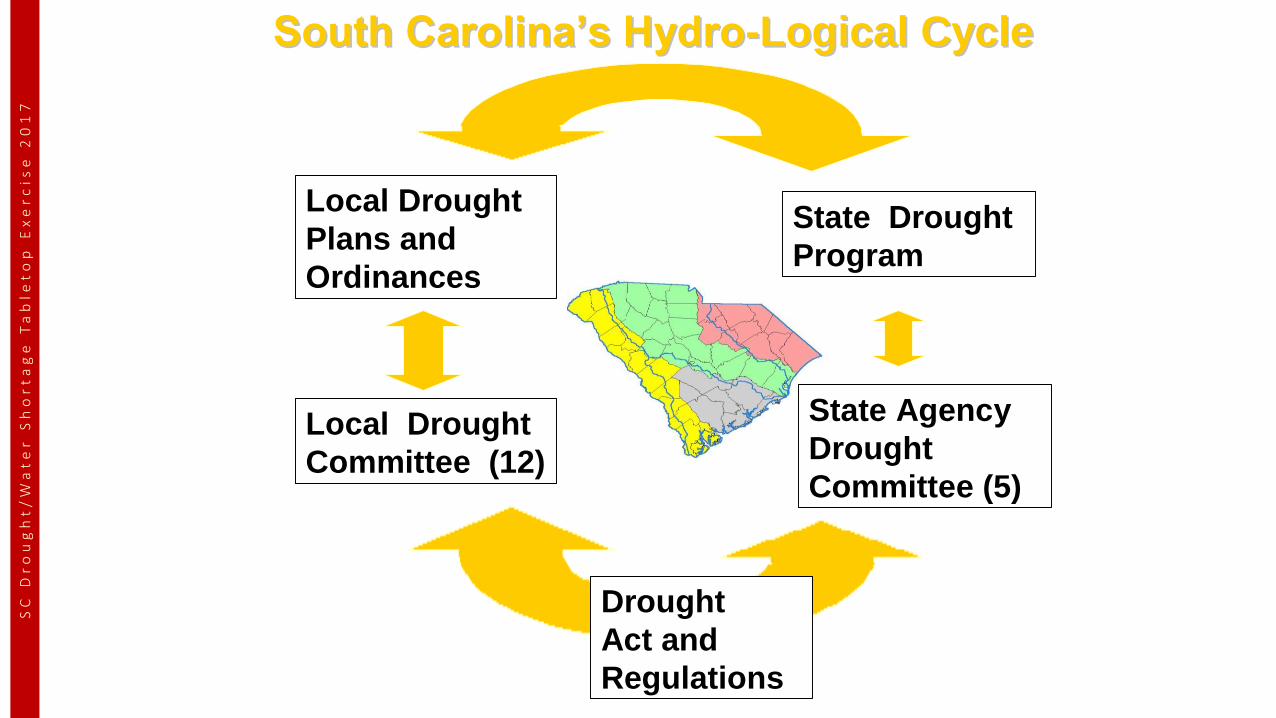
Local Drought
Committee (12)
Local Drought
Plans and
Ordinances
State Drought
Program
State Agency
Drought
Committee (5)
Drought
Act and
Regulations
South Carolina’s HydroSouth Carolina’s Hydro--Logical CycleLogical CycleS
C D
ro
ug
ht
/W
at
er
S
ho
rt
ag
e T
ab
let
op
Ex
er
cis
e 2
01
7
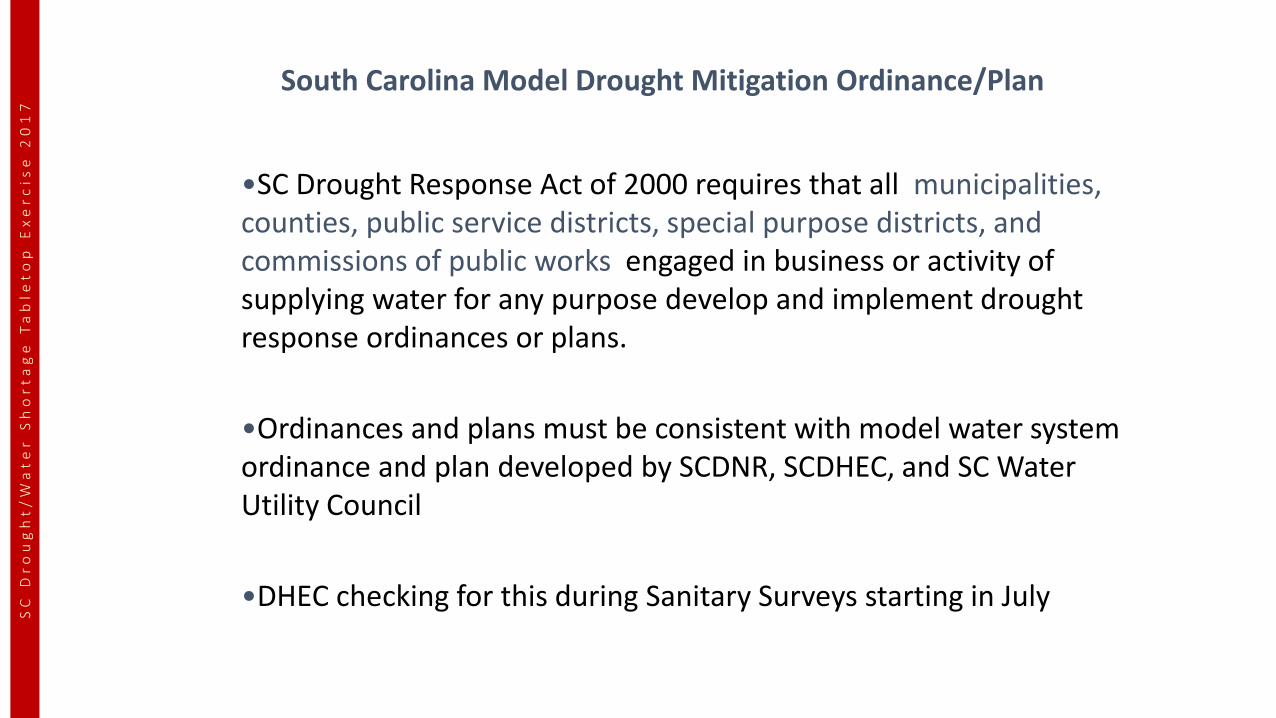
•SC Drought Response Act of 2000 requires that all municipalities, counties, public service districts, special purpose districts, and commissions of public works engaged in business or activity of supplying water for any purpose develop and implement drought response ordinances or plans.
•Ordinances and plans must be consistent with model water system ordinance and plan developed by SCDNR, SCDHEC, and SC Water Utility Council
•DHEC checking for this during Sanitary Surveys starting in July
South Carolina Model Drought Mitigation Ordinance/Plan
SC
Dr
ou
gh
t/
Wa
te
r
Sh
or
ta
ge
Ta
ble
to
p E
xe
rc
ise
20
17
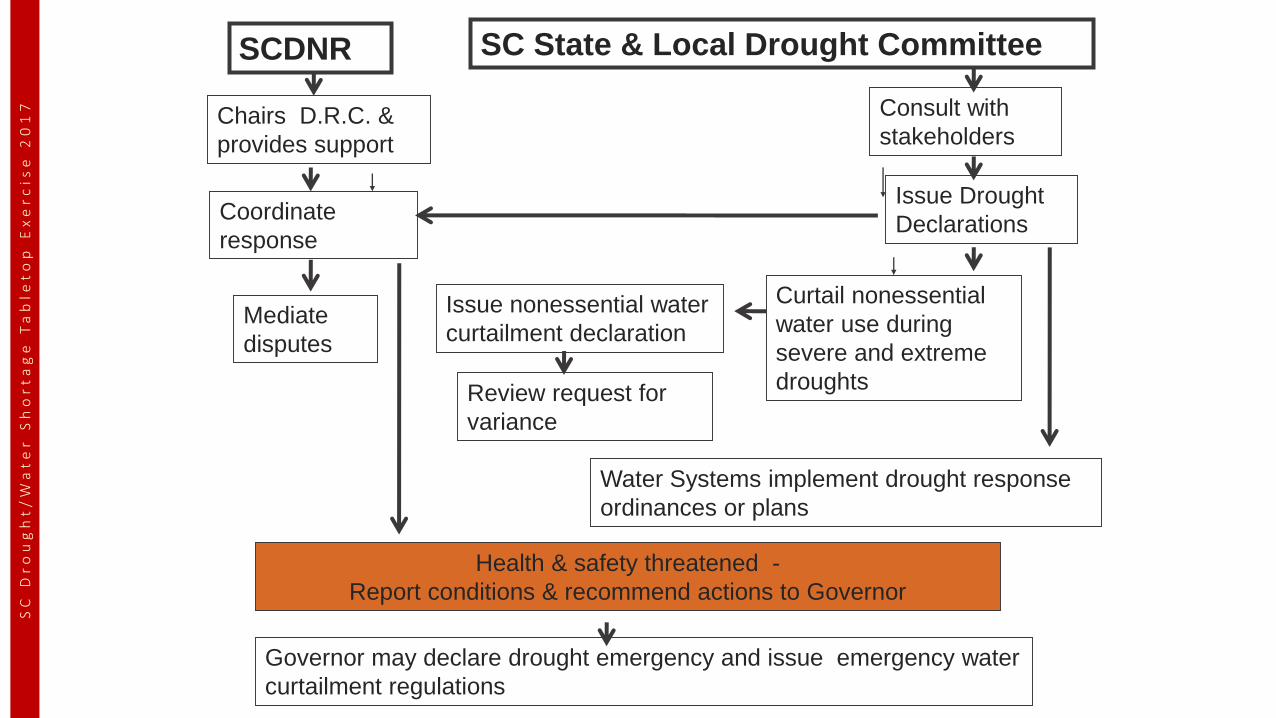
Chairs D.R.C. &
provides support
SC State & Local Drought CommitteeSCDNR
Coordinate
response
Issue Drought
Declarations
Consult with
stakeholders
Issue nonessential water
curtailment declaration
Review request for
variance
Curtail nonessential
water use during
severe and extreme
droughts
Health & safety threatened -
Report conditions & recommend actions to Governor
Mediate
disputes
Governor may declare drought emergency and issue emergency water
curtailment regulations
Water Systems implement drought response
ordinances or plans
SC
Dr
ou
gh
t/
Wa
te
r
Sh
or
ta
ge
Ta
ble
to
p E
xe
rc
ise
20
17
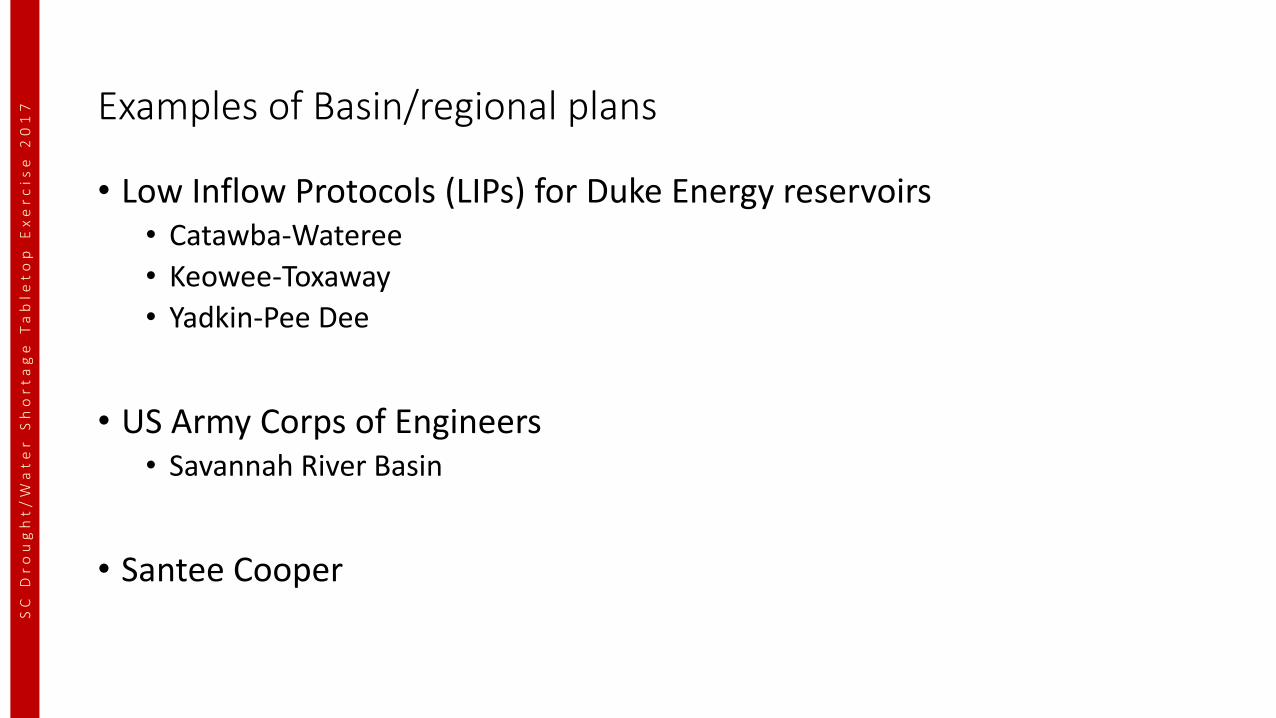
Examples of Basin/regional plans
• Low Inflow Protocols (LIPs) for Duke Energy reservoirs• Catawba-Wateree
• Keowee-Toxaway
• Yadkin-Pee Dee
• US Army Corps of Engineers• Savannah River Basin
• Santee Cooper
SC
Dr
ou
gh
t/
Wa
te
r
Sh
or
ta
ge
Ta
ble
to
p E
xe
rc
ise
20
17
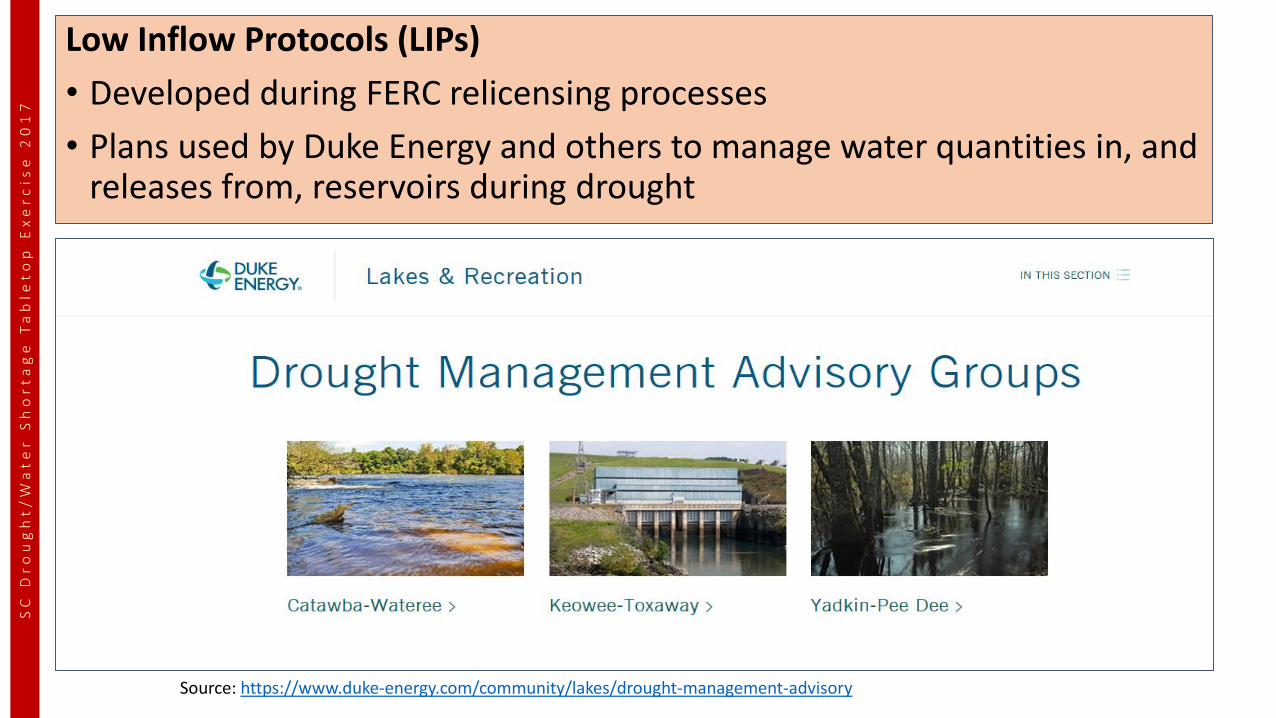
Low Inflow Protocols (LIPs)
• Developed during FERC relicensing processes
• Plans used by Duke Energy and others to manage water quantities in, and releases from, reservoirs during drought
Source: https://www.duke-energy.com/community/lakes/drought-management-advisory
SC
Dr
ou
gh
t/
Wa
te
r
Sh
or
ta
ge
Ta
ble
to
p E
xe
rc
ise
20
17
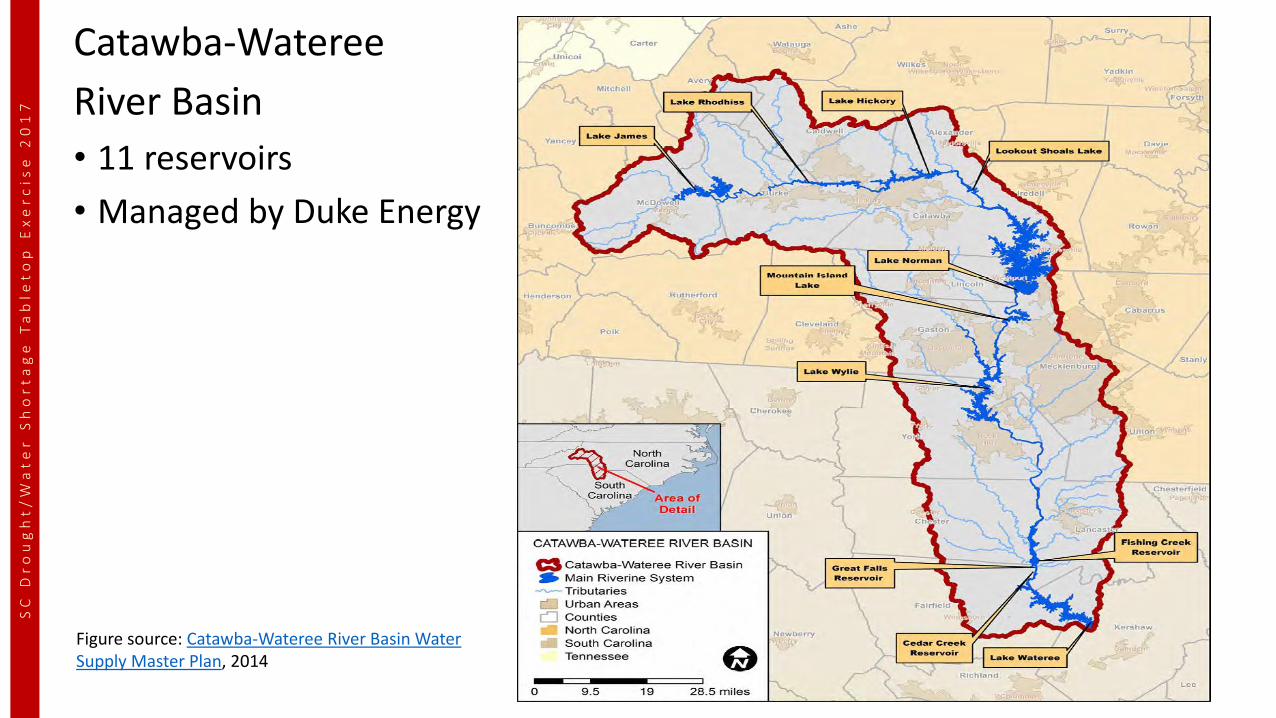
Catawba-Wateree
River Basin
• 11 reservoirs
• Managed by Duke Energy
Figure source: Catawba-Wateree River Basin Water Supply Master Plan, 2014
SC
Dr
ou
gh
t/
Wa
te
r
Sh
or
ta
ge
Ta
ble
to
p E
xe
rc
ise
20
17
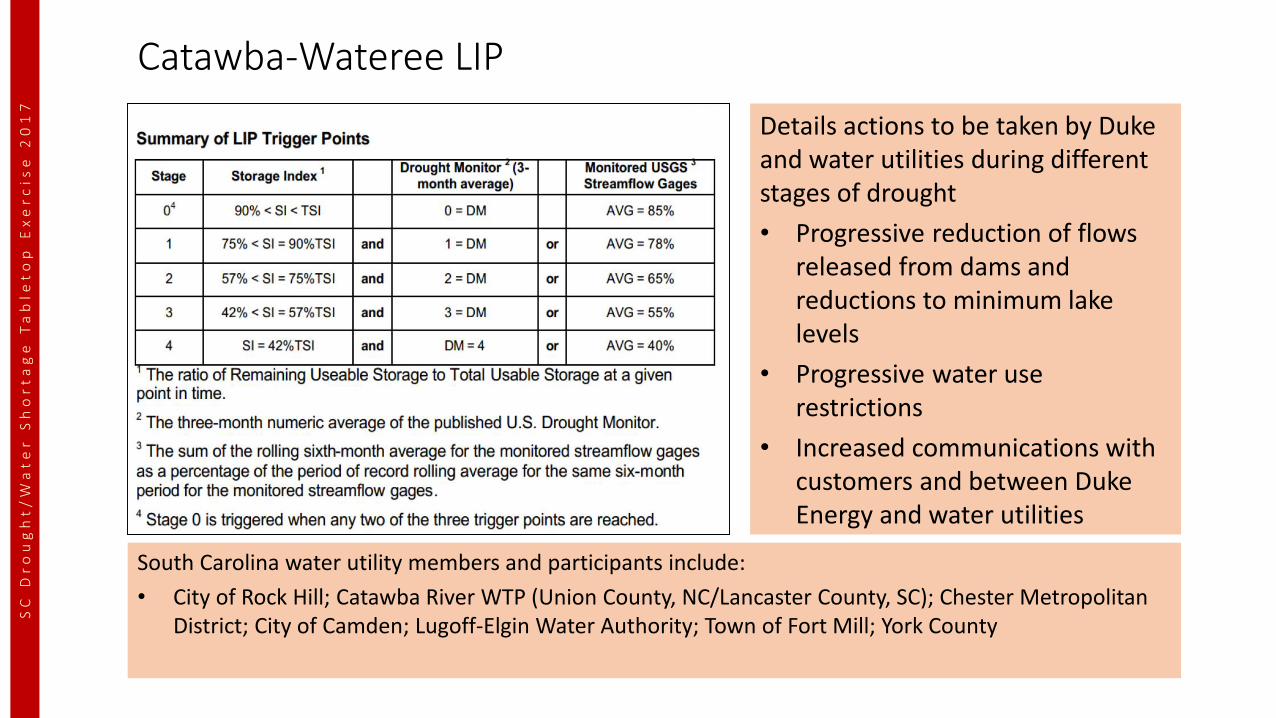
Catawba-Wateree LIP
Details actions to be taken by Duke and water utilities during different stages of drought
• Progressive reduction of flows released from dams and reductions to minimum lake levels
• Progressive water use restrictions
• Increased communications with customers and between Duke Energy and water utilities
South Carolina water utility members and participants include:
• City of Rock Hill; Catawba River WTP (Union County, NC/Lancaster County, SC); Chester Metropolitan District; City of Camden; Lugoff-Elgin Water Authority; Town of Fort Mill; York County
SC
Dr
ou
gh
t/
Wa
te
r
Sh
or
ta
ge
Ta
ble
to
p E
xe
rc
ise
20
17
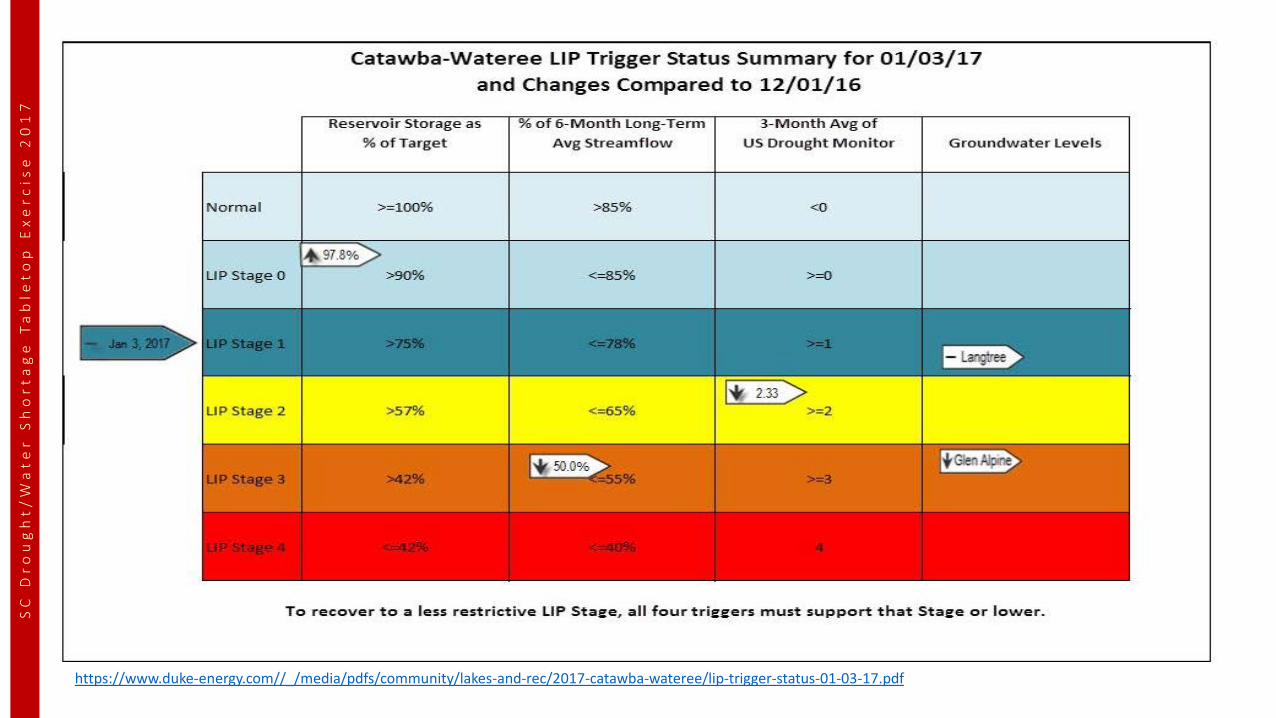
https://www.duke-energy.com//_/media/pdfs/community/lakes-and-rec/2017-catawba-wateree/lip-trigger-status-01-03-17.pdf
SC
Dr
ou
gh
t/
Wa
te
r
Sh
or
ta
ge
Ta
ble
to
p E
xe
rc
ise
20
17
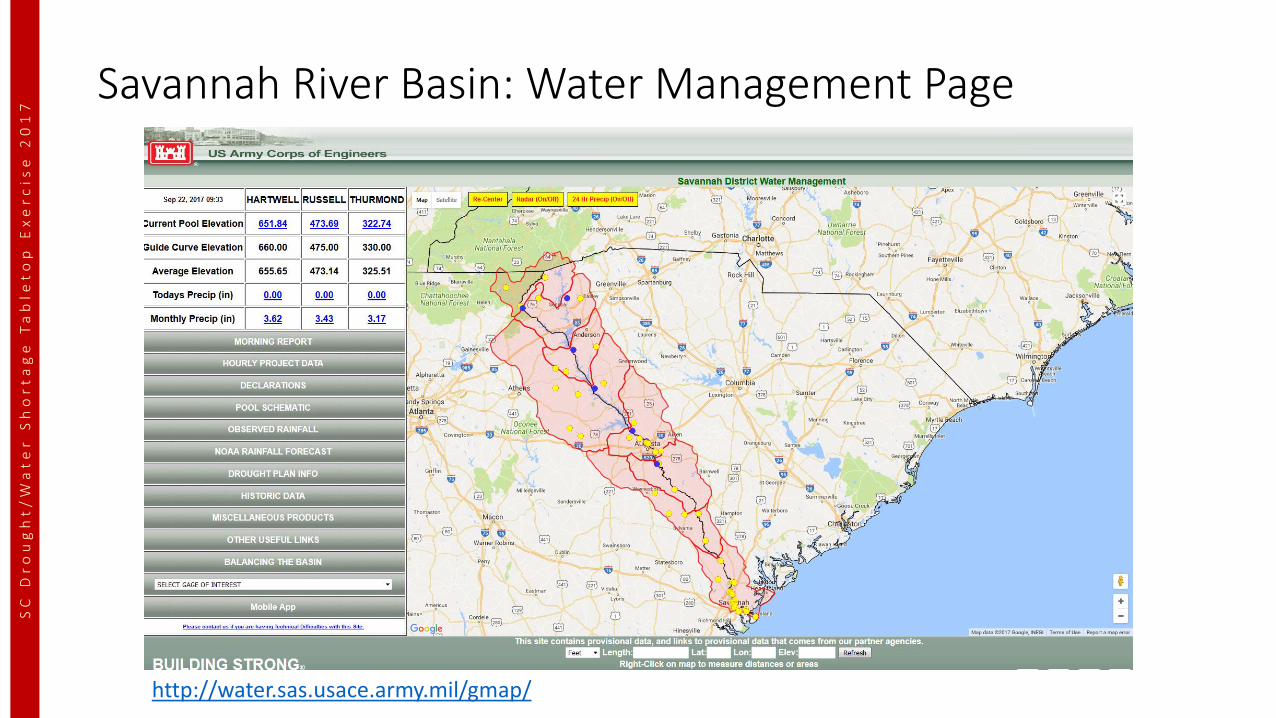
Savannah River Basin: Water Management Page
SC
Dr
ou
gh
t/
Wa
te
r
Sh
or
ta
ge
Ta
ble
to
p E
xe
rc
ise
20
17
http://water.sas.usace.army.mil/gmap/
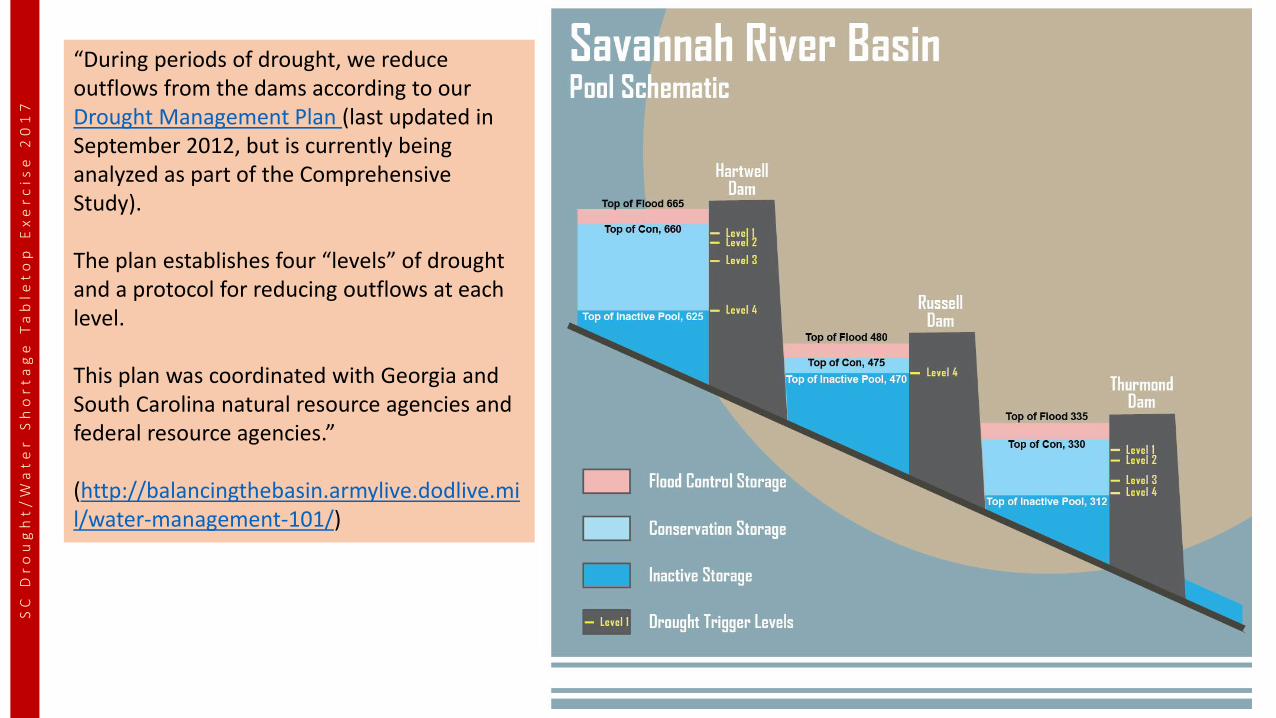
“During periods of drought, we reduce outflows from the dams according to our Drought Management Plan (last updated in September 2012, but is currently being analyzed as part of the Comprehensive Study).
The plan establishes four “levels” of drought and a protocol for reducing outflows at each level.
This plan was coordinated with Georgia and South Carolina natural resource agencies and federal resource agencies.”
(http://balancingthebasin.armylive.dodlive.mil/water-management-101/)
SC
Dr
ou
gh
t/
Wa
te
r
Sh
or
ta
ge
Ta
ble
to
p E
xe
rc
ise
20
17
SC
Dr
ou
gh
t/
Wa
te
r
Sh
or
ta
ge
Ta
ble
to
p E
xe
rc
ise
20
17
http://water.sas.usace.army.mil/images/sets/DroughtPlan.cfm
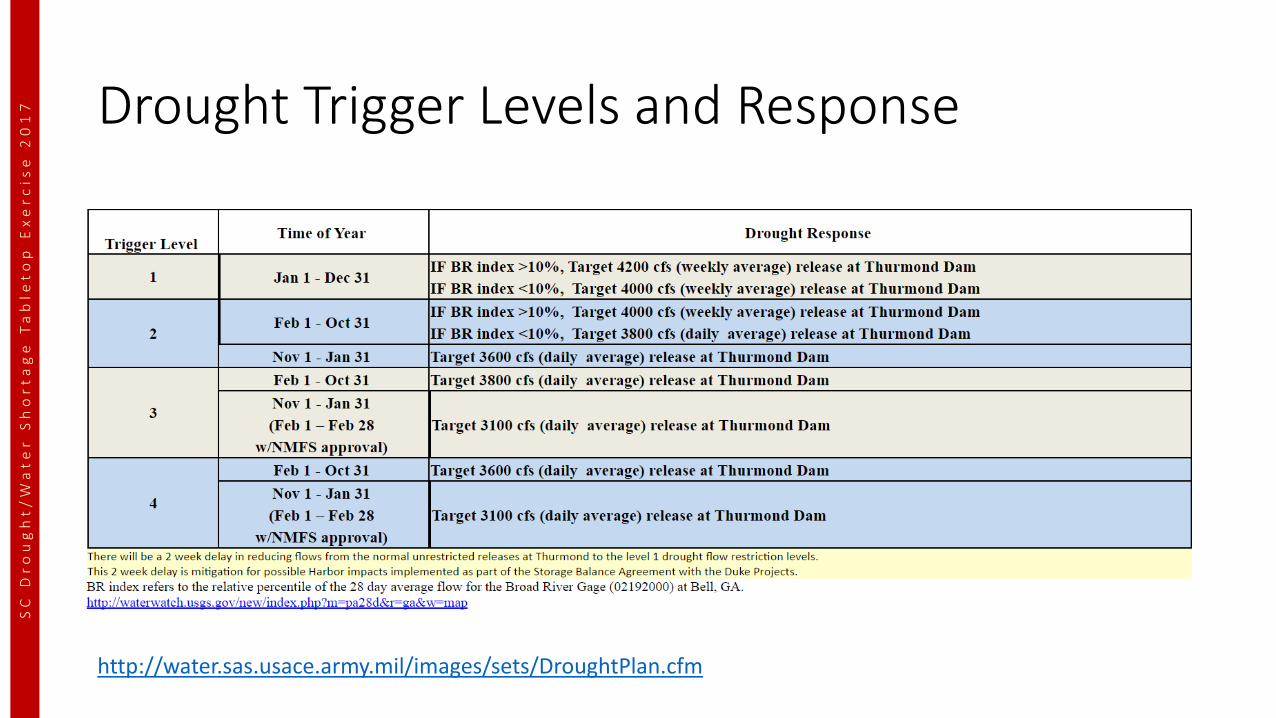
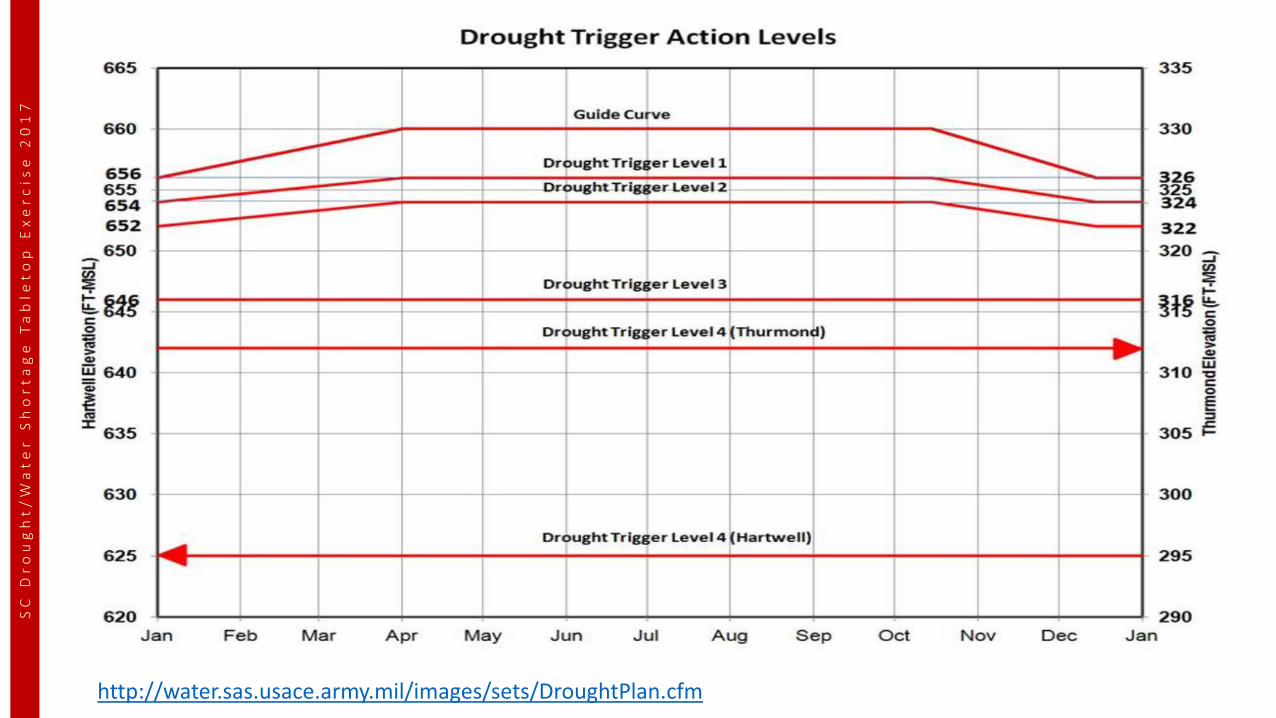
Drought Trigger Levels and Response
SC
Dr
ou
gh
t/
Wa
te
r
Sh
or
ta
ge
Ta
ble
to
p E
xe
rc
ise
20
17
http://water.sas.usace.army.mil/images/sets/DroughtPlan.cfm
SC
Dr
ou
gh
t/
Wa
te
r
Sh
or
ta
ge
Ta
ble
to
p E
xe
rc
ise
20
17
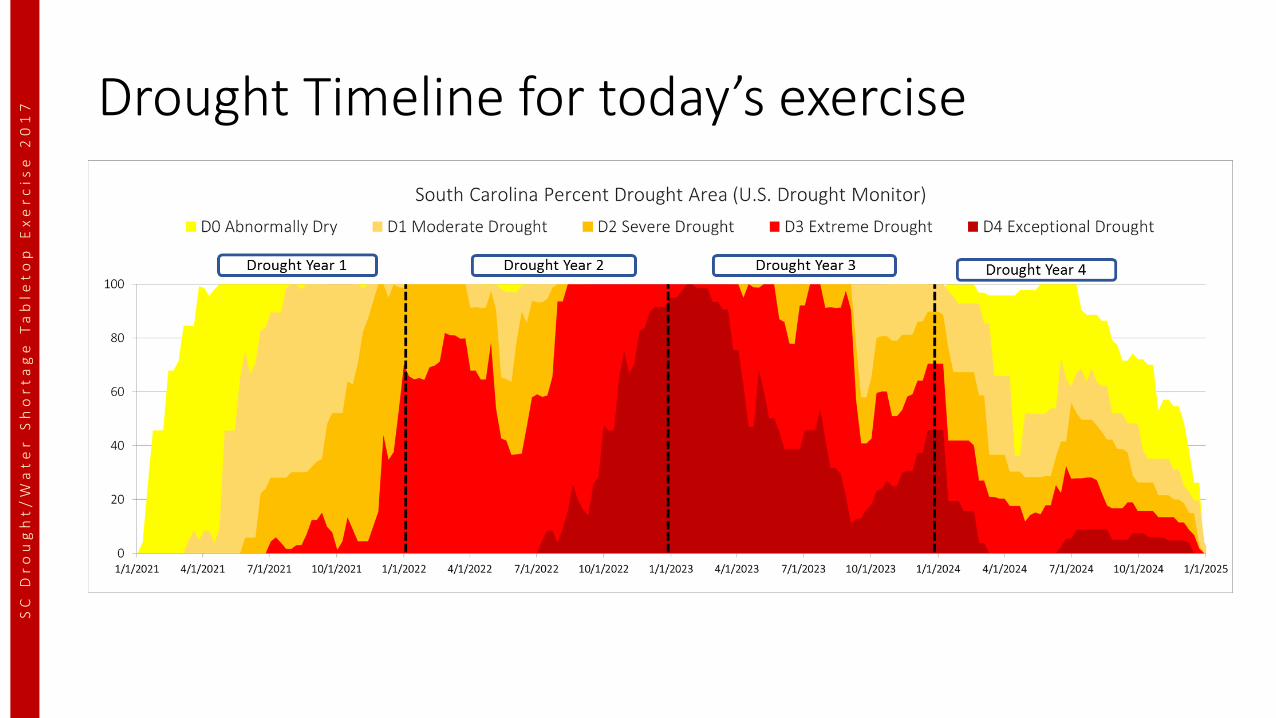
Drought Timeline for today’s exercise


![[INSERT TITLE] TABLETOP EXERCISE (TTX) · CISA Tabletop Exercise Package Brief Slide Deck Created Date: 20200708203419Z](https://img.pdfslide.us/doc/110x75/5fb62a70a98474222f1d1551/insert-title-tabletop-exercise-ttx-cisa-tabletop-exercise-package-brief-slide.jpg)


![STATEWIDE MEDICAL AND HEALTH EXERCISE PHASE III: TABLETOP EXERCISE [Exercise Name/Exercise Date]](https://img.pdfslide.us/doc/110x75/56649e535503460f94b48b86/statewide-medical-and-health-exercise-phase-iii-tabletop-exercise-exercise.jpg)


![EDS Security Tabletop Exercise [Exercise Location] [Exercise Date] [Insert Logo Here]](https://img.pdfslide.us/doc/110x75/56649dbb5503460f94aac3ec/eds-security-tabletop-exercise-exercise-location-exercise-date-insert.jpg)