Embed Size (px)
Citation preview

Drought Preparedness Council
Situation Report
October - 2018

1. Next Council Meeting
November 13, 2018 DPS Headquarters, Training Academy, Building C, Classroom B 5805 North Lamar Blvd, Austin, TX 78752
2. General Conditions
General Conditions September provided a mixture of different average temperature conditions throughout Texas. Most regions within the eastern sector of the state observed mean temperatures within the range of 0 – 2-degree departures from the normal monthly average, while the western half was unseasonably cool by -1 to -3 degrees. Above average temperatures in the Trans-Pecos, Lower Valley, and within the Piney Woods of East Texas were observed with 2 – 4-degree departures from normal September conditions.
The start of what would become a trend of exceptionally moist conditions throughout the state began this month. Record-breaking rainfall was observed in many regions of the state, most notably in North Central, the Upper Coast, and South Texas climate divisions. These regions were in the large range of 5 to 20 inches above the month’s normal conditions. The Trans-Pecos and High-Plains were comparatively much drier with precipitation deficits observed in these regions. Comprehensively, the substantial rainfall totals observed in September 2018 made the month the third wettest in Texas history.
Substantial drought conditions were prevalent in the majority of the state’s climatic regions at the start of the month. Moderate drought (D1) occupied the largest total area, with large patches of severe (D2) in Central Texas and the High Plains. Abnormally to moderately dry conditions in the Panhandle and South Texas allowed for classifications of extreme (D3) drought as well as exceptional (D4) drought, the most extreme classification, in the northern sector of the Brazos River. Record-breaking rainfall accumulation aided in the removal of nearly all of the most severe classifications of drought by the end of the month. D0-D3 was completely removed in the state’s southernmost counties and for most areas along the coastal bend. The majority of severe drought was relieved in Central Texas, reducing to abnormally dry and moderate drought, with a few small areas maintaining D2. Large statewide rainfall accumulations weren’t

enough to completely remove extreme drought in the Panhandle, though by the end of the month no areas were classified as D4.
The month’s significant rain totals improved soil moisture throughout the state as captured by the SPI and KBDI. Large portions of the state had extensively dry soil (400+ KBDI) when the month began, though steady rainfall accumulation and a bit cooler conditions brought values down 300 or less for many areas. Conservation storage was down for the month of September was up to nearly 80% full, 2% more than the previous month. This increase in storage was the result of the aforementioned extensive rainfall observed this month. Current estimates of rainfall for the month of October are suggesting more notable improvement to reservoir storage.
Statewide Drought Condition Update September 30, 2018
1. Current Drought Status
Table2.ClimateregionsindroughtNumberofregionsindroughtcategory
DroughtIndex
Highdrought Lowerdrought Notindrought
ExceptionalDry/DroughtExceptionalHighFireRisk
ExtremeDry/DroughtExtremeHighFireRisk
SevereDry/DroughtVeryHighFireRisk
ModerateorExcessiveDry/DroughtHighFireRisk
AbnormalorMildDry/Drought*AboveAverageFireRisk
NearorAbovenormalcondition
PDSI(10) N/A 0 0 1 1 8SFI(9) 0 0 0 0 0 96-MonthSPI(10)
N/A 0 1 3 0 6
CMI(10) N/A 0 0 0 0 10KBDI(10) 0 0 0 0 0 10
Numberofriverbasins/subbasinsindroughtcategoryRSI(21) 0 0 0 0 3 18*Incipientdryorincipientwetareconsiderednearnormalcondition.
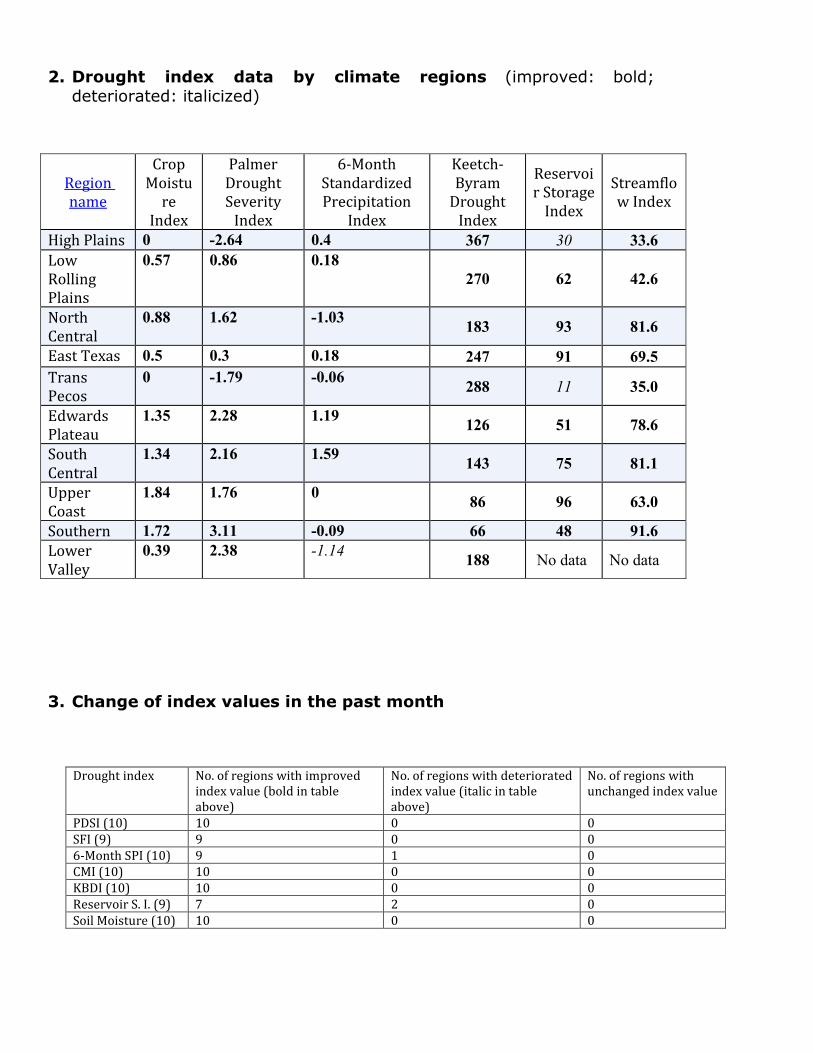
2. Drought index data by climate regions (improved: bold;
deteriorated: italicized)
3. Change of index values in the past month
Droughtindex No.ofregionswithimprovedindexvalue(boldintableabove)
No.ofregionswithdeterioratedindexvalue(italicintableabove)
No.ofregionswithunchangedindexvalue
PDSI(10) 10 0 0SFI(9) 9 0 06-MonthSPI(10) 9 1 0CMI(10) 10 0 0KBDI(10) 10 0 0ReservoirS.I.(9) 7 2 0SoilMoisture(10) 10 0 0
Regionname
CropMoisture
Index
PalmerDroughtSeverityIndex
6-MonthStandardizedPrecipitation
Index
Keetch-ByramDroughtIndex
ReservoirStorageIndex
StreamflowIndex
HighPlains 0 -2.64 0.4 367 30 33.6 LowRollingPlains
0.57 0.86 0.18 270 62 42.6
NorthCentral
0.88 1.62 -1.03 183 93 81.6
EastTexas 0.5 0.3 0.18 247 91 69.5 TransPecos
0 -1.79 -0.06 288 11 35.0
EdwardsPlateau
1.35 2.28 1.19 126 51 78.6
SouthCentral
1.34 2.16 1.59 143 75 81.1
UpperCoast
1.84 1.76 0 86 96 63.0
Southern 1.72 3.11 -0.09 66 48 91.6 LowerValley
0.39 2.38 -1.14 188 No data No data

4. Reservoir Storage Condition
At the end of September 2018, total conservation storage* in 118 of the state’s major water supply reservoirs, plus Elephant Butte Reservoir in New Mexico was 25.09 million acre-feet or 78 percent of total conservation storage capacity. This is approximately 1.66 million acre-feet more than a month ago, a nice increase after a five (5) month decline since April. Although this storage level is a fraction more than our historical median storage since 1990, it is still lower than the storage at the end of September of last year (1.53 million acre-feet less) and September 2016 (approximately 1.56 million acre-feet less). Out of 118 reservoirs in the State, twenty-seven (27) reservoirs held 100 percent of conservation storage capacity. Additionally, twenty-eight (28) were above 90 percent full. These high content reservoirs are basically located in North-Central-East Texas. However, two reservoirs, Palo Duro (1 percent full) and O. C. Fisher (8 percent full) remained below 10 percent full. There were an additional 7 reservoirs below 30 percent. Nevertheless, the low content reservoirs (26 below 70 percent full) are basically in the Panhandle, West, and South Texas. Elephant Butte Reservoir was only 3 percent full. Total regionally-combined storage was at or above normal (storage ≥70 percent full) in the Upper Coast (96 percent full), East (91 percent full), North Central (93 percent full), and South Central (75 percent full) regions. The High Plains (30 percent full), and Trans-Pecos (11 percent full) regions had the lowest percentage of storage. Overall, storage increased in all regions over the past month, except High Plains and Trans-Pecos regions (both lost 1 percent storage). Combined reservoir storage per river basin/sub-basin depicted a similar picture, but the storage in Upper Brazos River Basin was 87.4 percent full.
Reservoirstatusformajormetropolitancenters:

5. Groundwater Condition
Water-level measurements were available for all 18 key monitoring wells in the state.
• Water levels rose in 11 monitoring wells since the beginning of September, ranging from an increase of 0.03 feet in the Martin County Ogallala Aquifer well (#3 on map) to 36.20 feet in the Bexar County Edwards (Balcones Fault Zone) Aquifer well (#8 on map).
• Water levels declined in 5 monitoring wells, ranging from a decline of -0.18 feet in the Harris County Gulf Coast Aquifer well (#11 on map) to -4.71 feet in the La Salle County Carrizo-Wilcox Aquifer well (#10 on map).
• The J-17 well (#8 on map) in San Antonio recorded a water level of 53.71 feet below land surface or 676.89 feet above mean sea level. Water levels rose 17.29 feet above the Stage 1 critical management level for the San Antonio portion of the Edwards (Balcones Fault Zone) Aquifer. Although this report highlights September groundwater conditions, it is important to note that Stage 1 and 2 drought restrictions ended on October 2nd.
MonitoringWell August July MonthChange Year
Change
(1)Hansford0354301 159.97 159.85 -0.12 -1.41 (2)Lamb1053602 149.09 148.92 -0.17 -1.25 (3)Martin2739903 143.00 143.03 0.03 -0.49 (4)Dallas3319101 498.44 496.82 -1.62 -6.03 (5)Coryell4035404 530.72 536.26 5.54 -3.71 (6)Kendall6802609 147.79 159.08 11.29 -13.41 (7)Bell5804816 125.25 128.20 2.95 -2.17 (8)Bexar6837203 53.71 89.91 36.20 12.50 (9)Smith3430907 437.24 438.57 1.33 -3.79 (10)LaSalle7738103 530.90 526.19 -4.71 -35.52 (11)Harris6514409 195.29 195.11 -0.18 -3.76 (12)Victoria8017502 35.43 35.61 0.18 -3.12 (13)ElPaso4913301 294.01 294.20 0.19 -0.22 (14)Reeves4644501 169.00 176.22 7.22 -2.80 (15)Pecos5216802 216.36 231.02 14.66 -2.75 (16)Schleicher5512134 309.49 319.13 9.64 2.57 (17)Haskell2135748 47.41 47.14 -0.27 -0.31 (18)Hudspeth4807516 158.65 157.29 -1.36 -3.20

Groundwaterobservationwellslocationmap
6. Selected Drought Index Maps

StandardizedPrecipitationIndex StandardizedPrecipitationIndex 1-monthforSeptember2018 1-monthforAugust2018

Soil moisture at the end of September 2018 (top image), as compared to that at the end of August 2018 (bottom image), was wet in many areas in eastern half of Texas due to decent amounts of rainfall in the month and less evapotranspiration than in August. On a regional basis, average moisture content increased in all ten regions, varying from 0.02 to 0.11 cubic meter per cubic meter (m3/m3). The Upper Coast received the highest increase and the High Plains received the lowest increase.

Water Utility Status 1. WATER UTILITY STATUS
Overall, there are 1,084 water systems that are asking their customers to restrict water use. Of these systems, 683 are asking customers to follow a mandatory watering schedule and 401 are asking customers to follow a voluntary watering schedule. There are currently 26 PWSs that have prohibited all outside watering by their customers. A total of 1,692 water systems have reported to the TCEQ regarding their status using the online form on the TCEQ public website. Seasonal forecasts extending into late December 2018 indicate that drought remains but improves in patches of West Texas, the panhandle, and northern, north central, and northeastern Texas, and drought removal is likely in portions of West Texas, the panhandle, and northern, central, and eastern Texas. 2. WATER RIGHTS STATEWIDE
Alert letters were mailed to public water suppliers, water rights holders, county judges, and county extension agents in 91 counties on June 6, 18, and 21, 2018, in approximately 44 additional counties on July 13, 2018, and in approximately 69 counties on August 22, 2018. These letters provided notification that dry conditions may persist in the coming months for some parts of Texas and that if a priority call is made, the TCEQ may have to suspend water rights in some areas of the state. Public water systems were strongly encouraged to review, update, and implement Drought Contingency Plans, as necessary, to prepare for the possibility of worsening and/or prolonged drought conditions.
New temporary water use permit applications are being reviewed on a site-specific basis and issued if there is sufficient surplus water at the requested source. The number of applications for new water use permits and amendments to existing permits was normal for the month.
The availability of unappropriated water for new water use permits continues to be limited in all river basins in the state, and the search for long-term, dependable, alternate sources of water remains a high-priority issue.
3. WATER RIGHTS – LOWER RIO GRANDE/RIO GRANDE WATERMASTER (RGWM)
Current Conditions: On September 22, 2018, the U.S. combined ownership at Amistad/Falcon stood at 49.81% of normal conservation capacity, impounding 1,689,520 acre-feet; down from 52.20% (1,770,591 acre-feet) of normal conservation a year ago. Overall, the system is holding 39.16% of normal conservation capacity (impounding 2,319,441 acre-feet). Amistad is at 48.07% of conservation capacity, impounding 1,574,399 acre-feet, and Falcon Lake is at 28.15% of conservation capacity, impounding 745,042 acre-feet. Mexico has 24.89% of normal conservation capacity, impounding 629,922 acre-feet at Amistad/Falcon.
Allocations: As of printing of the August 2018 monthly report, TCEQ has allocated 168,536.9022 acre-feet to Class A & B water rights this year, which includes irrigation, mining, and recreation.
Storage & Loss Amistad vs. Falcon: The U.S. is currently storing approximately 1,102,566 acre-feet at Amistad (59.89% of U.S. capacity); and approximately 586,954 acre-feet (37.84% of U.S. capacity) at Falcon. As of September 22, 2018, U.S. evaporation and seepage losses at Amistad, in the 3rd year of the current 5-year cycle, totaled 204,153 acre-feet. For the same period, the U.S. has lost 158,599 acre-feet at Falcon.

Releases to meet demands: In 2018 (through September 22), Mexico has released 333,250 acre-feet from Amistad and 859,736 acre-feet from Falcon for its own needs. The U.S. has released 936,950 acre-feet from Falcon and 733,610 acre-feet from Amistad for U.S. needs. Combined with gains between Amistad and Falcon, U.S. inflows to Falcon have totaled 804,337 acre-feet. The U.S. demand in the lower Rio Grande has been met at a rate of 85.8% by direct Rio Grande inflows and Amistad releases this year.
Upper Rio Grande (New Mexico): As of October 2, 2018, Elephant Butte, in New Mexico, is storing 59,182 acre-feet (2.92%) and Caballo Dam in New Mexico, downstream of Elephant Butte, is storing 24,321 acre-feet (10.71%). This water storage in part is used to meet water needs in the El Paso area.
Outlook: 53% of all accounts began 2018 at 0% water available, 6% of all accounts began 2018 with greater than 0-50% of their usable balance and 40% of all accounts began 2018 with greater than 50-100% of their usable balance available. Our beginning of the year account balances in 2018 were 16.8% higher compared to the start of 2017. The National Weather Service and the National Drought Mitigation Center report multiple counties within the Rio Grande Basin continue under abnormally dry to extreme conditions, while limited areas are out of the drought.
4. RIVER BASIN REPORTS
Streamflow conditions vary widely across the state. When considering drought conditions, United States Geological Survey (USGS) streamflow data are commonly used as a metric for comparison. This report uses monthly mean river flows in cubic feet per second (cfs) to represent average monthly conditions within each river basin. The historical median flow value for the month (the discharge which is equaled or exceeded 50% of the time) is used to prevent the inclusion of high flow values that would skew the data.
Red River Basin:
Streamflow Conditions:
Site
September mean
(cfs)
September historical median
(cfs)
Red River near Burkburnett*
578 247
Red River near DeKalb** 10,750 2,870 *Gage period of record skips from 9/30/1924 to 12/8/1959 with no data in between **Gage period of record now begins in 2004 due to USGS update
Drought Condition: As of October 2, 48% of the Red River Basin is experiencing at least moderate drought conditions.
Drought Restrictions: Water rights in this area are eligible to impound or divert according to the terms of their permits.

Sulphur River Basin:
Streamflow Conditions:
Site
September mean
(cfs)
September historical median
(cfs)
Sulphur River near Talco 870 11
Drought Conditions: As of October 2, 0% of the Sulphur River Basin is experiencing at least moderate drought conditions.
Drought Restrictions: Water rights in this area are eligible to impound or divert according to the terms of their permits.
Cypress Creek Basin:
Streamflow Conditions:
Site
September mean
(cfs)
September historical median
(cfs)
Little Cypress Creek near Jefferson
3 5
Drought Conditions: As of October 2, 0% of the Cypress Creek Basin is experiencing at least moderate drought conditions.
Drought Restrictions: Water rights in this area are eligible to impound or divert according to the terms of their permits.
Sabine River Basin:
Streamflow Conditions:
Site September mean (cfs)
September historical median (cfs)
Sabine River near Beckville
310 154
Sabine River near Ruliff 1,875 1,860
Drought Conditions: As of October 2, 0% of the Sabine River Basin is experiencing at least moderate drought conditions.
Drought Restrictions: Water rights in this area are eligible to impound or divert according to the terms of their permits.

Neches River Basin:
Streamflow Conditions:
Site September mean (cfs)
September historical median (cfs)
Angelina River near Alto 97 77 Neches River at Evadale 2,877 1,160
Drought Conditions: As of October 2, 3% of the Neches River Basin is experiencing at least moderate drought conditions.
Drought Restrictions: Water rights in this area are eligible to impound or divert according to the terms of their permits.
Trinity River Basin:
Streamflow Conditions:
Site September mean (cfs)
September historical median (cfs)
Trinity River at Dallas 4,873 334
Trinity River near Oakwood
5,273 791
Trinity River near Romayor
3,303 1,200
Drought Conditions: As of October 2, 7% of the Trinity River Basin is experiencing at least moderate drought conditions.
Drought Restrictions: Water rights in this area are eligible to impound or divert according to the terms of their permits.
Brazos River Basin:
Streamflow Conditions:
Site September mean (cfs)
September historical median (cfs)
Double Mountain Fork Brazos River near Aspermont
43 14
Brazos River near Glen Rose
591 268
Little River near Cameron 1,000 204 Navasota near Easterly 15 9 Brazos near Hempstead 1,328 1,430 Brazos near Rosharon 1,804 1,870
Drought Conditions: As of October 2, 32% of the Brazos River Basin is experiencing at least moderate drought conditions.
Drought Restrictions: Water rights in the majority of this area are eligible to impound or divert according to the terms of their permits; however, the Brazos Watermaster continues to monitor the streamflow conditions and modify diversion requests as needed. There are some diversion restrictions on the upper part of the Leon River. Temporary permits are being reviewed and approved on a case-by-case basis.

Colorado River Basin:
Streamflow Conditions:
Site September mean (cfs)
September historical median (cfs)
Colorado River near Ballinger
60 15
San Saba River at San Saba
644 62
Llano River at Llano 625 119 Pedernales River near Johnson City
88 27
Colorado River at Columbus*
1,156 1,250
*Gage period of record skips from 9/29/1917-10/1/1996 and from 8/28/2017-8/31/2017
Drought Conditions: As of October 2, 29% of the Colorado River Basin is experiencing at least moderate drought conditions.
Drought Restrictions: Water rights in this area are eligible to impound or divert according to the terms of their permits; however, in the Concho Watermaster Area, the Concho Watermaster continues to monitor the streamflow conditions and modify diversion requests as needed.
Guadalupe River Basin:
Streamflow Conditions:
Site September mean (cfs)
September historical median (cfs)
Guadalupe River near Spring Branch
507 98
San Marcos River at Luling
302 183
Guadalupe River at Cuero
887 853
Guadalupe River at Victoria
1,000 811
Drought Conditions: As of October 2, 0% of the Guadalupe River Basin is experiencing at least moderate drought conditions.
Drought Restrictions: Water rights in the majority of this area are eligible to impound or divert according to the terms of their permits; however, the South Texas Watermaster continues to monitor the streamflow conditions and modify diversion requests as needed. There are some diversion restrictions on the upper part of the Guadalupe River. All temporary permits are being reviewed on a case-by-case basis.

San Antonio River Basin:
Streamflow Conditions:
Site September mean (cfs)
September historical median (cfs)
San Antonio River near Falls City
2,182 230
Cibolo Creek near Falls City
448 24
Drought Conditions: As of October 2, 0% of the San Antonio River Basin is experiencing at least moderate drought conditions.
Drought Restrictions: Water rights in this area are eligible to impound or divert according to their permits; however, the South Texas Watermaster continues to monitor the streamflow conditions and modify diversion requests as needed. All temporary permits are being reviewed on a case-by-case basis. Nueces River Basin:
Streamflow Conditions:
Site September mean (cfs)
September historical median (cfs)
Nueces River at Tilden 2,551 23 Frio River near Derby 1,619 1
Atascosa River at Whitsett
367 8
Drought Conditions: As of October 2, 0% of the Nueces River Basin is experiencing at least moderate drought conditions.
Drought Restrictions: Water rights in this area are eligible to impound or divert according of their permits; however, the South Texas Watermaster continues to monitor the streamflow conditions and modify diversion requests as needed. All temporary permits are being reviewed on a case-by-case basis.

Statewide Rainfall Totals
September 1-30, 2018
City/Station Rainfall Totals (in)
Brazos River Basin
Lubbock 3.26 Abilene 5.75 Waco 4.90
College Station 8.24 Colorado River Basin
Midland 2.69 San Angelo 6.66
Austin Mabry 7.96 Austin Bergstrom 5.59
Neches River Basin Tyler 5.48 Lufkin 10.25
Sabine River Basin Longview 5.04
Trinity River Basin Dallas/Fort Worth 12.69

Agriculture
CENTRAL: Most fields and pastures had armyworms, and producers were actively spraying between rains. Pastures and crops continued to recuperate following recent rains. Livestock were in good condition. Hay producers should be able to get one or two more cuttings. A majority of cotton producers were done
harvesting. Nearly all counties reported good soil moisture. Overall crop, livestock, rangeland and pasture ratings were good in a majority of counties. ROLLING PLAINS: Recent rains helped replenish soil moisture and fill stock tanks. Pastures and rangelands improved and were in fair to good condition. Armyworms were very active in pastures, lawns and newly sprouted wheat. Winter wheat planting picked up. Producers were applying fertilizer and defoliating cotton. Cotton started to bloom in some areas.
COASTAL BEND: No report. EAST: Scattered thunderstorms paired with steady rains continued to replenish soil moisture levels across the district. Gregg County ponds were filling up, and conditions were extremely wet. Marion County reported ponds were still low as was the quality of grasses in pastures. Anderson County reported cotton was fair, and land preparation for wheat planting was at a standstill. Pasture and rangeland conditions were poor in Wood, Anderson and Marion counties and good in Sabine and Shelby counties. All other counties reported pasture and rangeland conditions were fair. Sabine County reported warm-season grasses rebounded, and producers were hopeful about forage and hay crops and chances of a good third cutting. Subsoil conditions were adequate apart from Marion, Angelina and Houston counties, which reported short conditions. Topsoil conditions were surplus in Panola, Gregg and Polk counties. Anderson, Marion and Houston counties reported short topsoil conditions, and all other counties reported adequate conditions. Anderson and Marion county producers continued supplemental feeding due to drought. Livestock were fair to good in Smith County with some supplementation taking place. Houston County cattle prices were up, and buyers were aggressive with continued optimism for wheat. Gregg County cattle prices were holding steady to lower than average overall. Armyworms were very destructive in all counties despite producers spraying. Cherokee and Panola counties’ producers were reporting the worst infestations they’d ever experienced. Anderson and Shelby counties reported insecticides became hard to find due to armyworm outbreaks.

Feral hogs were still a problem in Anderson, Wood and Henderson counties. Horn files were out in full force in Anderson County. SOUTH PLAINS: Recent frequent rains helped saturate the topsoil and subsoil, but most areas still needed more moisture. Rains varied across counties from 0.5 of an inch to 3-plus inches. Cooler temperatures and more cloudy days prevented moisture evaporation. Crops continued to mature. Producers began the peanut harvest. Armyworms damaged much of the hay crop. Cotton looked very good despite short moisture this season. Producers were beginning to utilize harvest aides and prepare for harvest. Winter wheat needed moisture. Some ranchers reported improved pasture conditions. Pastures and rangelands remained in fair to good condition. Cattle were in good condition. PANHANDLE: Temperatures were near-normal with some moisture in areas. Rain events also brought fall like temperatures. More moisture was still needed throughout the district. Armstrong County was still very dry but was expecting to receive moisture. Sorghum started coloring, and some wheat was planted. Pasture conditions were still dry, but no fires were reported in the past couple of weeks. Carson County received some rain, but conditions were still very dry. Hall County received county-wide rain, which eased drought pressure and helped pasture and cattle conditions. Cotton looked good and continued to develop, but producers were concerned about fiber maturity due to cooler night-time temperatures. Lint yield potential remained very high. Cotton harvest aid applications were expected to start soon. Peanuts were being harvested. Ochiltree County received some general rainfall, which halted early corn harvest and wheat planting activities. Wheat already planted was off to an excellent start. Grain sorghum continued to develop with record-breaking yields expected. Harvest of early planted fields should begin soon. Soybean harvest was halted due to rainfall, but yields so far were very good. NORTH: With the recent rain, most of the counties reported adequate topsoil and subsoil moisture. Over the district, reports of anywhere from 4-6 inches of rain fell during the reporting period. Almost every county reported armyworm numbers were almost insurmountable. Despite a vast outbreak of armyworms, farmers did not report significant damages to crops so far. Grasses were green, and pastures and hayfields had rebounded. Hay producers were ecstatic with recent cuttings. Livestock were in good condition. FAR WEST: No report. WEST CENTRAL: Rains of up to 2 inches were reported, but all areas needed more moisture. Pastures improved, and forage growth increased. Many producers were waiting for conditions to dry enough to plant small grain. Armyworm activity increased. The market continued an upward price trend with stocker steers and
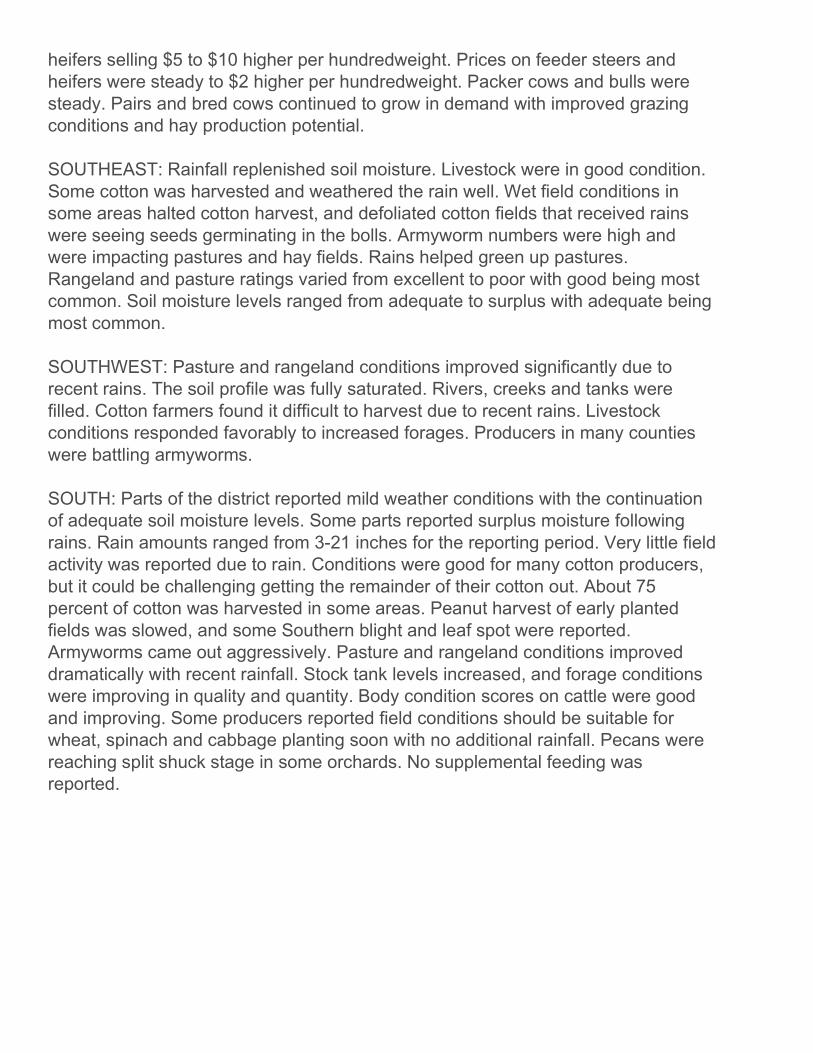
heifers selling $5 to $10 higher per hundredweight. Prices on feeder steers and heifers were steady to $2 higher per hundredweight. Packer cows and bulls were steady. Pairs and bred cows continued to grow in demand with improved grazing conditions and hay production potential. SOUTHEAST: Rainfall replenished soil moisture. Livestock were in good condition. Some cotton was harvested and weathered the rain well. Wet field conditions in some areas halted cotton harvest, and defoliated cotton fields that received rains were seeing seeds germinating in the bolls. Armyworm numbers were high and were impacting pastures and hay fields. Rains helped green up pastures. Rangeland and pasture ratings varied from excellent to poor with good being most common. Soil moisture levels ranged from adequate to surplus with adequate being most common. SOUTHWEST: Pasture and rangeland conditions improved significantly due to recent rains. The soil profile was fully saturated. Rivers, creeks and tanks were filled. Cotton farmers found it difficult to harvest due to recent rains. Livestock conditions responded favorably to increased forages. Producers in many counties were battling armyworms. SOUTH: Parts of the district reported mild weather conditions with the continuation of adequate soil moisture levels. Some parts reported surplus moisture following rains. Rain amounts ranged from 3-21 inches for the reporting period. Very little field activity was reported due to rain. Conditions were good for many cotton producers, but it could be challenging getting the remainder of their cotton out. About 75 percent of cotton was harvested in some areas. Peanut harvest of early planted fields was slowed, and some Southern blight and leaf spot were reported. Armyworms came out aggressively. Pasture and rangeland conditions improved dramatically with recent rainfall. Stock tank levels increased, and forage conditions were improving in quality and quantity. Body condition scores on cattle were good and improving. Some producers reported field conditions should be suitable for wheat, spinach and cabbage planting soon with no additional rainfall. Pecans were reaching split shuck stage in some orchards. No supplemental feeding was reported.

Attachment 1 Climatic Regions


![Compositional Changes in Trans&Pecos Texas … mark the beginning of Basin and Range extension. Price et al. [1987] demonstrated differences in major element chemistry between Trans-Pecos](https://img.pdfslide.us/doc/110x75/5aaef4d47f8b9a190d8cc16f/compositional-changes-in-transpecos-texas-mark-the-beginning-of-basin-and-range.jpg)