Embed Size (px)
Citation preview
GeoJournal 57: 149–157, 2002.© 2003 Kluwer Academic Publishers. Printed in the Netherlands.
149
Drought in Bulgaria and atmospheric synoptic conditions over Europe
Liem Tran∗, C. Gregory Knight & Victoria WesnerThe Pennsylvania State University, Department of Geography and Center for Integrated Regional Assessment, UniversityPark, Pennsylvania, USA; ∗Author for correspondence: E-mail: [email protected]
Key words: Bulgaria, drought, spatial dryness index, synoptic
Abstract
Drought in Bulgaria is analyzed from the multiple viewpoints of statistical occurrence, spatial patterns, and synopticconditions. A new index of drought, the SD (spatial-dryness) index, characterizes drought by both intensity and spatialextent. The occurrence of the SD index is analyzed using global gridded data sets. Examination of transitional probabilitiesof multiple months and years with drought occurrence suggests persistence is sufficiently frequent to be important forclimate-related environmental planning. Finally, it is shown that specific seasonal synoptic patterns are associated with wetand dry conditions in Bulgaria.
Bulgaria is a surprisingly dry European country, subject tofrequent short term and long term drought (Sharov et al.,1994a, b). During the period from 1980 to 2000, Bulgariaexperienced three instances of two or more successive yearsof drought, the latest of which had important environmentaland social consequences. The goal of this paper is to de-velop a deeper understanding of the occurrence of drought inBulgaria. To do so, we develop a new spatial dryness indexthat characterizes drought conditions by both severity andgeographic extent.
In addition, this paper considers connections between at-mospheric synoptic conditions and Bulgarian drought. Dataused in this analysis consist of monthly 2.5◦-resolution grid-based geopotential heights at 500-hPa level (GPH-500), andsea level pressure (SLP) from the National Centers for Envir-onmental Protection-National Center for Atmospheric Re-search (NCEP-NCAR) Global Reanalysis Project (Kalnay,1996). Monthly precipitation data is from the 0.5◦-resolutiongrid-based climatic data from the Climatic Research Unit(CRU) of the University of East Anglia. The NCEP-NCARdata cover the period of 1948–2000 while the CRU dataare from 1901–1995. Hence, when the CRU precipitationdata were used alone, the whole data set of 1901–1995was used. When CRU precipitation data were used in com-bination with NCEP-NCAR reanalysis data, the maximumoverlap between two data sets (1948–1995) was used. In acomparison between CRU precipitation data and monthlyobserved precipitation data from several meteorological sta-tions in Bulgaria, Cavazos (2000) found that the CRU dataset captures well the local annual cycles of precipitation.Furthermore, the spatial distribution of winter precipita-tion from this data set agrees well with those reported inVelev (1996) and Bulgarian atlases (Bulgarian Academy ofSciences, 1973, 1976).
Bulgaria’s climate
Bulgaria is not rich in terms of precipitation. Mean annualrainfall is between 410 mm and 650 mm in lowland areasand between 650 mm and 1,200 mm in semi-mountainousand mountainous areas. Hence topography is a key factorin the distribution of precipitation over Bulgaria. Aboutthree-fourths of Bulgaria is classified as having a contin-ental climate, with peak precipitation in late spring or earlysummer, whereas the southern fringe has a transitionalcontinental-Mediterranean climate with both winter and latespring precipitation peaks (Bulgarian Academy of Sciences,1987; Velev, 1990). Similar to other areas with a continentalclimate regime, the ratio of precipitation to evaporation inBulgaria is less than one (moisture deficit) in summer, exceptat highest elevations, and greater than one (moisture excess)in fall, winter, and spring (Knight et al., 1995).
In addition to topographic and geographic factors, Bul-garia’s climate is mainly determined by atmospheric circu-lation patterns. The movement of air masses over Bulgariais determined by active cyclonic and anticyclonic atmo-spheric centers over Europe (Furlan, 1977). There are twoimportant cyclonic centers affecting Bulgaria’s climate: thepersistent Icelandic low-pressure system and the Mediter-ranean low-pressure system during the winter months. Boththese cyclonic systems account for the movement of humidair masses towards the Balkan Peninsula and considerableweather variability. On the other hand, the anticyclonic cen-ters important to Bulgaria’s climate include the persistentAzores high-pressure system and the East European andSiberian anticyclonic systems during winter months. Gen-erally these anticyclones cause infrequent and below-normalprecipitation.
150
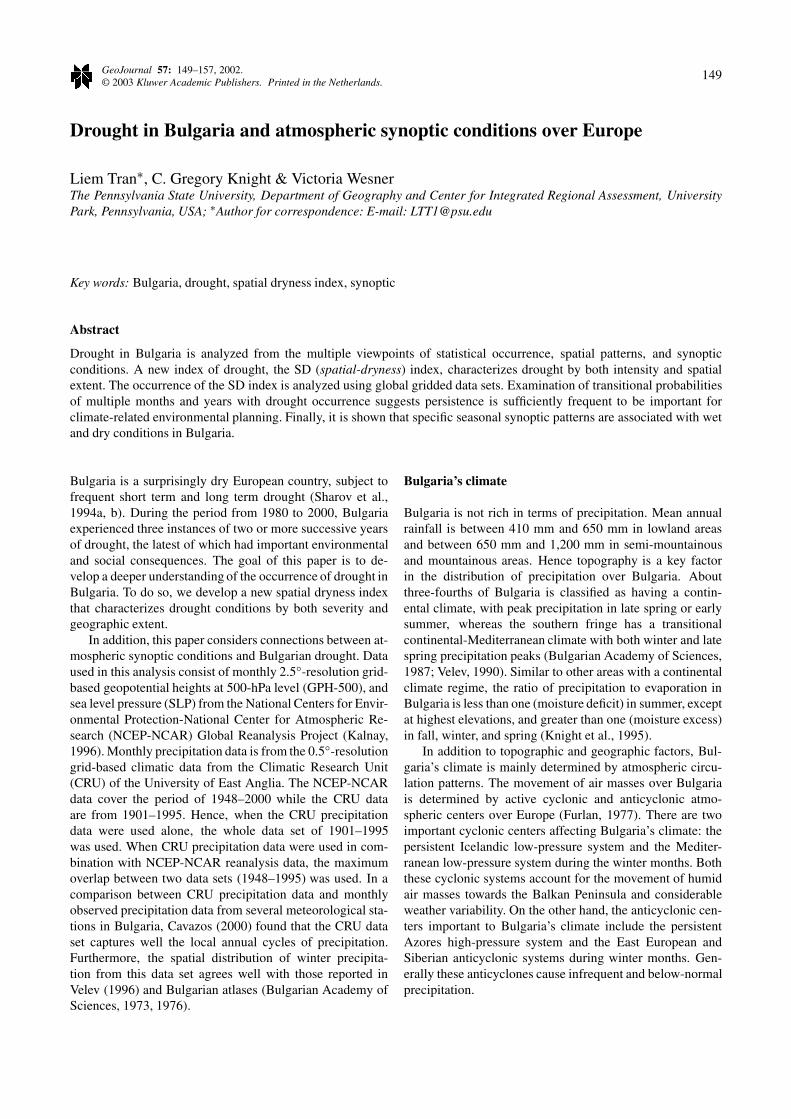
Figure 1. Linear trend of precipitation over the Balkan Peninsula for the period 1960–1995 and 1976–1995.
Changes in precipitation
Using the CRU precipitation data set, we found negativetrends of 0.5 to 1.3 mm/year for monthly precipitation inwinter months (December, January, February, and March) inthe North, Northeast, and South of Bulgaria for the periodof 1960–1995 (Figure 1). When data from the period 1976–1995 were used, the values of these negative trends increasedup to 1.0–2.6 mm/year. These results have some differences
in magnitude, timing, or area of precipitation change com-pared to some other studies. For example, Velev (1996)found that the general pattern of precipitation trends in theperiod of 1954–1993 was uniformly negative with consider-able variation, ranging from 7.5 to 18.0% and the decreasewas greater in the south than in the north. In our analysisusing the CRU data for the same period as Velev, we foundsome negative trends that were not statistically significant.

151
Figure 2. Temporal variation of dry conditions in Bulgaria (Y axis shows % of area with annual precipitation in the lowest quintile (20%) during1901–1995).
Sahsamanoglou et al. (1997) found that winter precipitationover the entire Balkan Peninsula during the period 1982–1991 was decreased by 20% below normal. In another studyof climate trends over Europe for the period 1891–1990,Schonwiese and Rapp (1997) found negative trends of 30–50 mm for annual precipitation and a range of 0–20 mm,0–20 mm, 10–30 mm, and 0–20 mm for seasonal precipita-tion of spring, summer, fall, and winter respectively. In thesame study these negative trends were slightly larger whendata from the period 1961–1990 were used. Divergence inthose analyses might come from differences in data sources,data resolution or other factors. However, a common fea-ture from all studies is that there was a negative trend inprecipitation over the Balkan Peninsula, especially duringwintertime.
Here we introduce a new concept of a spatial-dryness(SD) index which is calculated as the percentage of thestudy area having annual precipitation in the first quintile(lowest 20%) during an observed period. Calculating theSD index with the CRU precipitation data set for the period1901–1995, we found that Bulgaria experienced three ma-jor extremely dry periods in the 1900s, 1940s, and 1980s(Figure 2), where SD values were approximately 70–80%or more. There were two other less severe dry periods in1930s and 1960s. Figure 2 suggests that there is some cyc-lical pattern of dry condition over Bulgaria (for example,a 4-to-5-decadal cycle). However the short length of data(1901–1995) is insufficient for statistical analysis of patternsat a multidecadal scale.
Table 1 provides a list of the twenty driest years ofthe total period 1901–1995 using the SD index. It showsthat the case of two consecutive dry years happened twice
(1985–1986 and 1992–1993) and three dry years, once(1901–1903). In other words, the probability of two or moreconsecutive dry years with respect to the SD index is around3%. In another study, Knight et al. (1995) suggested that theprobability of two successive years of extreme drought (pre-cipitation <10% of the average) is less than 0.1%. These twoprobability estimates are not in conflict as they came fromdifferent indices. For very extreme dry conditions, as in thestudy of Knight et al. (1995), the chance of two consecutiveyears with such drought is very small. However, if one usesthe SD index (e.g., two-thirds of the country with annual pre-cipitation in the first quintile) as in this analysis, the chanceof two consecutive dry years, or even three consecutiveyears, is significant. This probability is sufficiently large toalert environmental managers working in climate-sensitivesectors such as agriculture and water management.
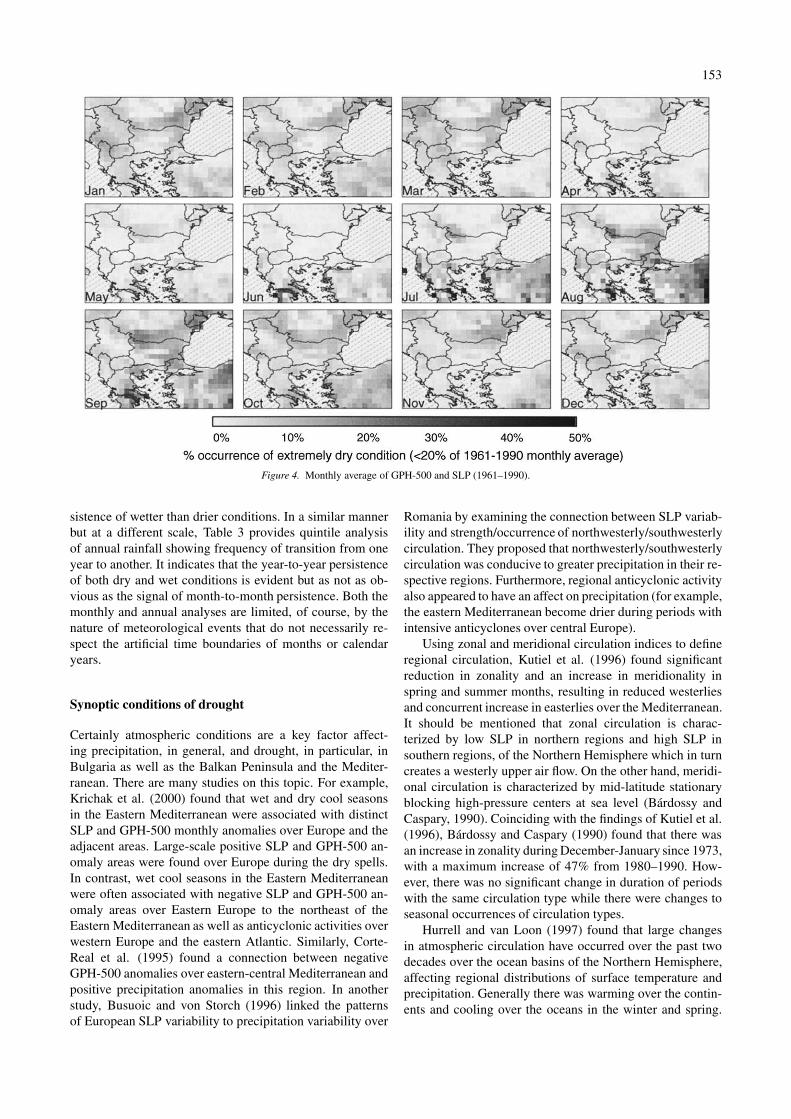
Figure 3 shows the temporal and spatial variability ofdrought over Bulgaria at a monthly scale through percentoccurrence of months in extremely dry conditions (<20% ofthe 1961–1990 monthly averages) at a grid point. One cansee that droughts occurred mainly in winter (January, Febru-ary, and March, affecting seasonal snow accumulation andlater runoff) and late summer to early fall (August, Septem-ber and October). The spatial pattern of drought is variablewith winter droughts occurring over both east and west ofthe country while summer and fall droughts were more overnorth, northeast and east Bulgaria. It should be noted that,in another study using the monthly and seasonal tendenciesof precipitation, Velev (1996) found that droughts occurredprimarily in January, May, September, and October. In termsof season, droughts were more profound in autumn, espe-cially in the first half of the season. On the other hand, the

152
Figure 3. Temporal and spatial variability of drought over Bulgaria at the monthly level (1901–1995).
area along the Black Sea experienced greater numbers of dryconditions in the winter. Hence findings from two studies aresimilar, except for the occurrence of droughts in May foundin Velev’s study, but not seen in this analysis.
Drought persistence
Koleva (1988) studied the fluctuations of monthly precipita-tion during the period 1899–1985 and found that the averageduration of drought is about three months. The drought dur-ation might expand from 6 to 10 consecutive months with
precipitation 90% below normal. However, there was nosingle year in the period 1899–1985 that all 12 monthlyprecipitation records were below normal. We used quintileanalysis of the monthly rainfall SD index showing frequencyof transition from one month to another to explore the per-sistence of drought (Table 2). Class I is dry and class V iswet; expected frequency of each transition is about 20%.One can see a greater persistence of driest (I) than of wettestconditions (V) from the months of January, May, July, andSeptember-November: there are higher numbers at the topleft of each table at the expense of numbers in the oppositecorner. Only April and August have a decidedly greater per-
153
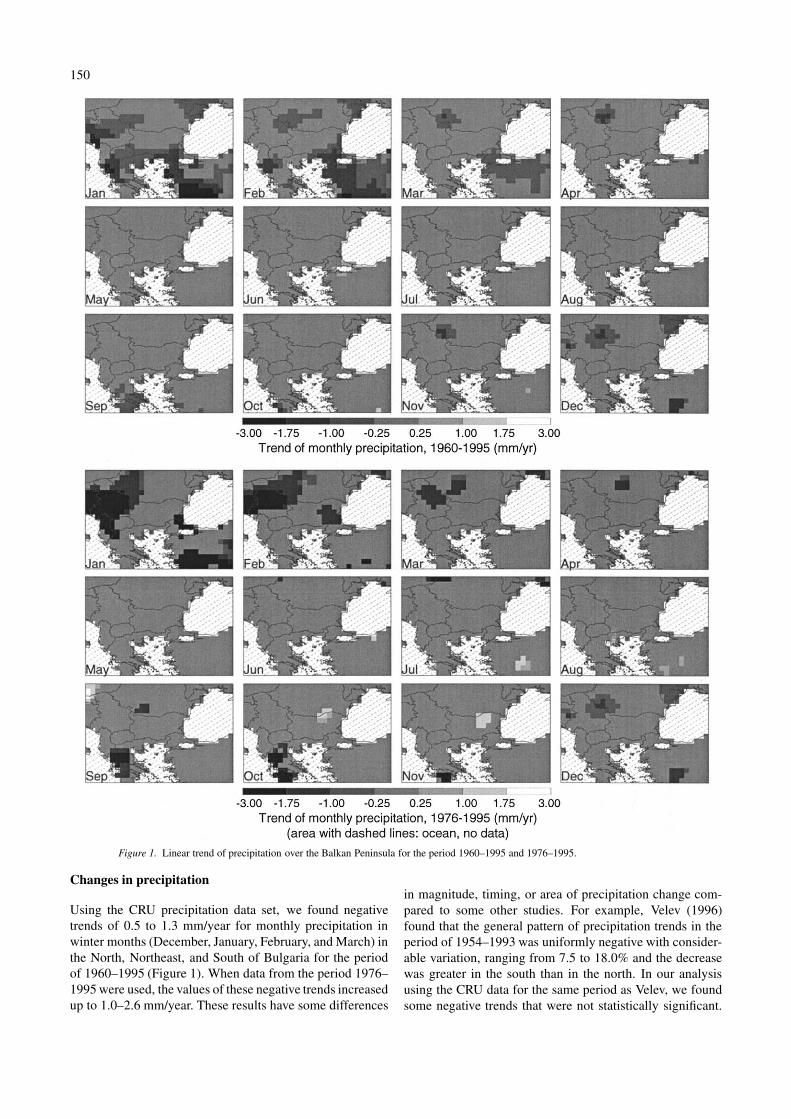
Figure 4. Monthly average of GPH-500 and SLP (1961–1990).
sistence of wetter than drier conditions. In a similar mannerbut at a different scale, Table 3 provides quintile analysisof annual rainfall showing frequency of transition from oneyear to another. It indicates that the year-to-year persistenceof both dry and wet conditions is evident but as not as ob-vious as the signal of month-to-month persistence. Both themonthly and annual analyses are limited, of course, by thenature of meteorological events that do not necessarily re-spect the artificial time boundaries of months or calendaryears.
Synoptic conditions of drought
Certainly atmospheric conditions are a key factor affect-ing precipitation, in general, and drought, in particular, inBulgaria as well as the Balkan Peninsula and the Mediter-ranean. There are many studies on this topic. For example,Krichak et al. (2000) found that wet and dry cool seasonsin the Eastern Mediterranean were associated with distinctSLP and GPH-500 monthly anomalies over Europe and theadjacent areas. Large-scale positive SLP and GPH-500 an-omaly areas were found over Europe during the dry spells.In contrast, wet cool seasons in the Eastern Mediterraneanwere often associated with negative SLP and GPH-500 an-omaly areas over Eastern Europe to the northeast of theEastern Mediterranean as well as anticyclonic activities overwestern Europe and the eastern Atlantic. Similarly, Corte-Real et al. (1995) found a connection between negativeGPH-500 anomalies over eastern-central Mediterranean andpositive precipitation anomalies in this region. In anotherstudy, Busuoic and von Storch (1996) linked the patternsof European SLP variability to precipitation variability over
Romania by examining the connection between SLP variab-ility and strength/occurrence of northwesterly/southwesterlycirculation. They proposed that northwesterly/southwesterlycirculation was conducive to greater precipitation in their re-spective regions. Furthermore, regional anticyclonic activityalso appeared to have an affect on precipitation (for example,the eastern Mediterranean become drier during periods withintensive anticyclones over central Europe).
Using zonal and meridional circulation indices to defineregional circulation, Kutiel et al. (1996) found significantreduction in zonality and an increase in meridionality inspring and summer months, resulting in reduced westerliesand concurrent increase in easterlies over the Mediterranean.It should be mentioned that zonal circulation is charac-terized by low SLP in northern regions and high SLP insouthern regions, of the Northern Hemisphere which in turncreates a westerly upper air flow. On the other hand, meridi-onal circulation is characterized by mid-latitude stationaryblocking high-pressure centers at sea level (Bárdossy andCaspary, 1990). Coinciding with the findings of Kutiel et al.(1996), Bárdossy and Caspary (1990) found that there wasan increase in zonality during December-January since 1973,with a maximum increase of 47% from 1980–1990. How-ever, there was no significant change in duration of periodswith the same circulation type while there were changes toseasonal occurrences of circulation types.
Hurrell and van Loon (1997) found that large changesin atmospheric circulation have occurred over the past twodecades over the ocean basins of the Northern Hemisphere,affecting regional distributions of surface temperature andprecipitation. Generally there was warming over the contin-ents and cooling over the oceans in the winter and spring.
154
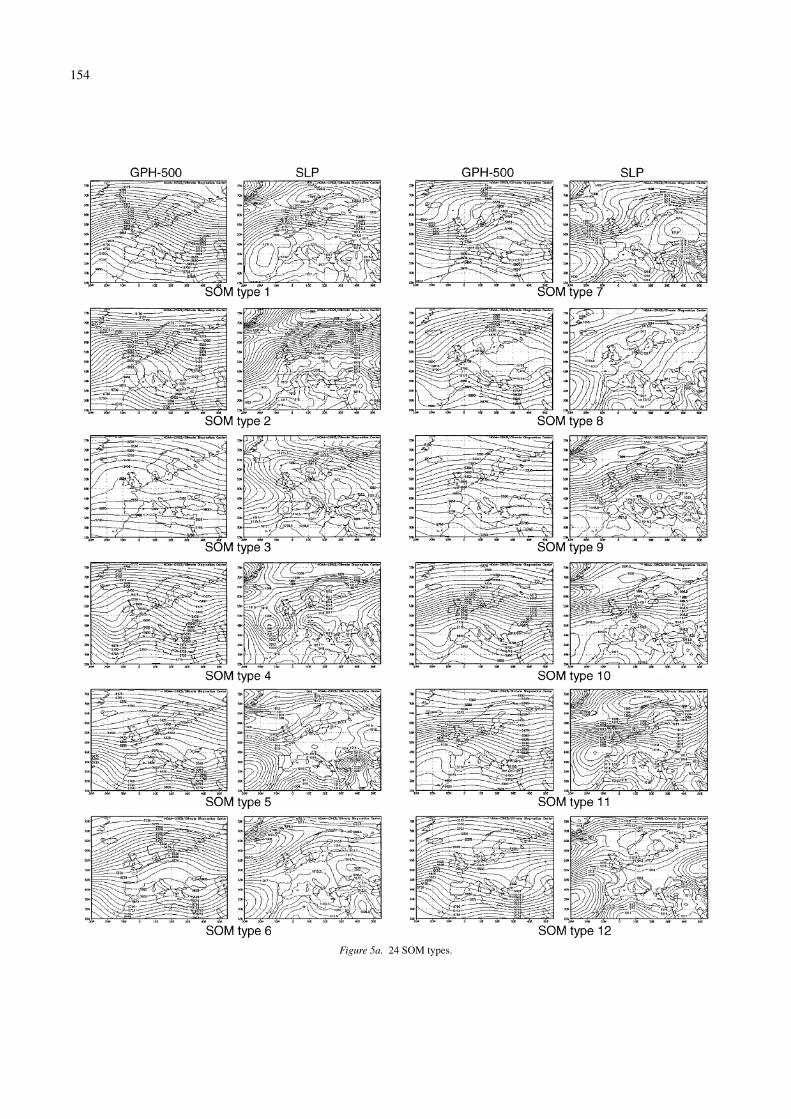
Figure 5a. 24 SOM types.

155
Figure 5b. 24 SOM types (continued).
They also discovered that the North Atlantic Oscillation(NAO) tended to remain in one extreme phase since 1980.During that period, wintertime surface warming and dryconditions over Southern Europe and the Mediterraneanwere observed. It should be noted that, when the NAOresides in the positive phase, stronger than average west-erlies occur over the mid-latitudes, which are associated
with low-pressure anomalies over Iceland and high pressureanomalies over the southern Atlantic. The persistence ofwesterlies over southern Europe was found having a directconnection to the NAO as well as anomalous dry condi-tions in that area. The axis of maximum moisture transportshifted during this time and extended much further northand east over Scandinavia. This shift reduced atmospheric

156
Figure 6. Percent occurrence of SOM types for 1948–2000 and 1982–1994.
moisture transport over southern Europe, therefor reducingprecipitation.
Recently Cavazos (2000) used self-organizing maps(SOM) and neural networks to study the connection betweenwintertime precipitation in the Balkans and the atmo-spheric synoptic conditions. Results showed that the SOMhave great similarity to the Arctic Oscillation (AO) posit-ive/negative fluctuation patterns and the associated GPH-500 patterns proposed by Thompson and Wallace (1998).It also was found that positive GPH-500 anomalies overEurope corresponded to negative precipitation anomalies(dry events) and vice versa.
To analyze the connection between the synoptic condi-tions and precipitation over Bulgaria throughout the yearwe developed an objective classification of the atmosphericpatterns with the use of the self-organizing maps (SOM)neural networks (Kohonen, 1982, 1995) using the CRUmonthly GPH-500 and SLP data for the area of 25.0 N–77.5 N lat and 30.0 W–55.0 E long. It should be noted that,as each certain synoptic condition often persists for onlyseveral days then there is a rapid transition to another differ-ent synoptic condition (Bárdossy and Caspary, 1990), mostof the atmospheric circulation classification schemes are ona daily basis. Some well-known classification schemes forEuropean area include those of Baur et al. (1944), Lamb(1972), and Dzerdzeevskii (1968, 1970). With the idea thata daily basis is insufficient for drought prediction, whichshould be al least on a monthly basis, we attempted todevelop a classification for monthly atmospheric synopticconditions. This idea was supported as our further studyshowed that frequencies and combination of different dailysynoptic types were not random but show some monthly
patterns (Tran et al., in review). Mean monthly synoptic pat-terns affecting Bulgaria in the period 1961–1994 are shownin Figure 4.
The SOM detected 24 distinct types of synoptic patternsover Europe (Figure 5). Results showed that each SOM typeonly occurs in a certain period of the year (e.g., wintertime,summertime or transition) and is associated with a certaindry/wet condition over Bulgaria. For example, the SOMtype 9 occurs only in wintertime and is associated with dryconditions in Bulgaria. Table 4 provides monthly frequen-cies of 24 SOM types over the period 1948–1955 whereasTable 5 provides descriptive statistics of wet/dry conditionsassociated with different SOM types at several locationsin Bulgaria. Figure 6 displays percent occurrence of SOMtypes for two different periods, 1948–2000 and 1982–1994,showing that the SOM types associated with wet conditions(11, 12, 13) reduced significantly while SOM type 9 (drycondition) was dominant during the period of 1982–1994.For the period of 1999–2000, we found that the presence ofsome SOM types associated with dry condition was quiteevident (e.g., SOM type 9 in 2/1999 and 2/2000; SOM type22 in 7–8/1999, 6/2000, and 8/2000), showing agreementbetween synoptic condition and drought in Bulgaria in thisperiod of time.
Table 6 presents frequency of transition from one typeof SOM at one month to another in the following month,showing some interesting patterns which might be usefulfor prediction purpose. For example, the chance for theSOM type 9 which is associated with dry condition in wintermonths, to switch to the SOM type 1 (also associated withdry condition) in the following month is quite high. Onthe other hand, each SOM type appeared to have strong
157
connection with some large-scale atmospheric indices (e.g.,the North Atlantic Oscillation and the Arctic Oscillation,Table 7), suggesting some short-term prediction ability ofthis classification.
Conclusion
This paper provides a visual and quantitative way to un-derstand the connection between wet and dry conditions inBulgaria and atmospheric patterns over Europe. However thephenomenon of drought in Bulgaria still has more questionsthan answers, and several lessons can be learned from thisanalysis. First, drought can occur at any time and extendover a long period and over large areas to a very severe levelin Bulgaria. Hence the best strategy to reduce the country’svulnerability to the impacts of drought is to move from re-lief to readiness, to make preparedness the cornerstone ofdrought policy. Investments in preparedness actions such asplanning and implementation of mitigation measures willreduce risks and conflicts over competition for water duringdrought. From the research viewpoint, more studies whichfocus on the impacts of global climate change on atmo-spheric synoptic conditions as well as precipitation over theMediterranean area and Europe, in general, and Bulgaria,in particular, need to be carried out. Such findings certainlywill help to improve the prediction of drought in Bulgaria.Finally, what we learn here could be very useful in pro-gnostication of drought trends over coming decades throughinterpretion of predicted synoptic conditions from climatechange models.
Acknowledgements
This work was supported by a grant to the PennsylvaniaState University from the U.S. National Science Found-ation Program on Human Dimensions of Global Change(SBR-9521952), Center for Integrated Regional Assess-ment. Views expressed are those of the authors and not thoseof our sponsor.
References
Bárdossy A. and Caspary H.J., 1990: Detection of climate change in Europeby analyzing European atmospheric circulation patterns from 1881 to1989. Theor. Appl. Climatol. 42: 155–167.
Baur F., Hess P. and Nagel H., 1944:Kalender der Großwetterlagen Europas1881–1939. Bad Homburg, 35pp.
Bulgarian Academy of Sciences, 1973; Atlas Narodna Republika Bulgaria(Atlas of the People’s Republic of Bulgaria). Institute of Geography,Bulgarian Academy of Sciences, 168 pp.
Bulgarian Academy of Sciences, 1976; Klimatichen Atlas na Narodna Re-publika Bulgaria (Climate Atlas of the People’s Republic of Bulgaria).Sofia, Bulgaria.
Bulgarian Academy of Sciences, 1987: Vtora natsionalna konferentsia pohidrologica i hidrolozhki aspekti na vodostopanskite problemi. Univer-sity Press ‘Kliment Ochridski’, Sofia.
Busuoic A. and von Storch H., 1996: Changes in the winter precipitation inRomania and its relation to the large-scale circulation. Tellus 48: 539–552.
Cavazos T., 2000: Using self-organizing maps to investigate extreme cli-matic events: an application to wintertime precipitation in the Balkans.J. Climate 13: 1718–1732.
Corte-Real J., Zhang X. and Wang X., 1995: Large-scale circulation re-gimes and surface climatic anomalies over the Mediterranean. Int. J.Climate 15: 1135–1150.
Dzerdzeevskii B.L., 1968, 1970: Circulation mechanisms in the atmosphereof the Northern Hemisphere in the Twentieth Century. Institute for Geo-graphy, Soviet Academy of Sciences, Moscow R. Goedecke, Trans., B.F.Berryman, Ed., University of Wisconsin, 361 pp.
Furlan D., 1997: The climate of southeast Europe. In: Wallen C.C.(ed.), Climates of Central and Southern Europe. pp. 185–231. Elsevier,Amsterdam.
Hurrell J. and van Loon H., 1997: Decadal variations in climate associatedwith the North Atlantic Oscillation. Climate Change 36: 301–326.
Kalnay E., 1996: The NCEP/NCAR 40-year reanalysis project. Bull. Amer.Meteor. Soc. 77: 437–471.
Knight C.G., Velev S. and Staneva M., 1995: The emerging water crisis inBulgaria. GeoJournal 35: 415–423.
Kohonen T., 1982: Self-organized formation of topologically correct fea-tures maps. Bio. Cyber. 43: 59–69.
Kohonen T., 1995: Self-Organizing Maps. Springer Series in InformationSciences, no. 30. Springer-Verlag, 362 pp.
Koleva E., 1988: Osobenosti v razpredelenieto na valezhite v ravninnatachast na Bulgaria. Problemi na meteorlogiata i hidrologiata. Book 5.Bulgarian Academy of Sciences, Sofia.
Krichak S.O., Tsidulko M. and Alpert P., 2000: Monthly synoptic patternsassociated with wet/dry conditions in the eastern Mediterranean. Theor.Appl. Climatol. 65: 215–229.
Kutiel H., Maheras P. and Guika S., 1996: Circulation indices over theMediterranean and Europe and their relationship with rainfall conditionsacross the Mediterranean. Theor. Appl. Climatol. 54: 125–138.
Lamb H.H., 1972: British Isles weather types and a register of the dailysequence of circulation patterns, 1861–1971. Geophysical Memoirs 116,London.
Sahsamanoglou H., Makrogiannis T., Hatzianastasiou N. and Rammos N.,1997: Long term change of precipitation over the Balkan Peninsula.Eastern Europe and Global Climate Change. pp. 111–124. Ghazi et al.(eds), European Commission.
Schonwiese C.D. and Rapp J., 1997: Climate Trend Atlas of Europe. KluwerAcademic Publishers, Boston, MA.
Sharov V., Ivanov P. and Alexandrov V., 1994a: Meteorological and Agro-meteorological Aspects of Drought in Bulgaria. Romanian Journal ofHydrology and Water Resources 1(2): 163–172.
Sharov V., Ivanov P., Slavov N., Koleva E., Dakova S., Moralijski E.,Peneva R., Gocheva A., Latinov L. and Alexandrov V., 1994b. Droughtin Bulgaria. Final report on contract No.NI-NZ-19/1991, Sofia, 80 pp.(in Bulgarian).
Thompson D. and Wallace J., 1998: The Arctic Oscillation signature inthe wintertime geopotential height and temperature fields. Geophys. Res.Letters 25: 1297–1300.
Tran L.T., Knight C.G. and Wesner V., 2001: Connection between monthlyatmospheric conditions over Europe and precipitation in Bulgaria. Inreview.
Velev S., 1990: Klimatut na Bulgaria (The Climate of Bulgaria). NarodnaProsveta, Sofia.
Velev S., 1996: Is Bulgaria becoming warmer and drier? GeoJournal 40:363–370.