Embed Size (px)
Citation preview
Dropout Survey Report
2016
Oregon Department of Education
Salam Noor, Deputy Superintendent


3 | P a g e
Foreword
Oregon leaders are committed to ensuring that each Oregon student graduates from high school
with a plan for the future-whether it’s college, post-secondary job training or the world of work, and
the tools to succeed in their post-secondary goals. Recognizing the landscape in which individual
legislative reports and strategic investments are positioned promotes critical alignment and
coordination needed in Oregon to support student transitions, particularly across Grades 11-14.
In the 2015 session Governor Kate Brown and the Oregon Legislature made significant investments
in the future of Oregon students served by the state’s cradle to career education system. For the
2015-17 biennium, the state not only made key investments in the schools, colleges, and universities
that serve our students, but also took strategic actions to foster improved and seamless pathways
between each sector of the public educational enterprise. In addition to this report on dropout
prevention (HB 3319), work is underway on numerous bills related to the important transition years
for students in grades 11-14, work that is of key and continuing importance to the Chief Education
Office, Oregon Department of Education, and Higher Education Coordinating Commission.
Specifically, the Legislature directed strategic focus on high school graduation, requiring reports on:
dropout prevention, graduation, attendance (HB 3319), and training for school districts and
educational services district staff for reporting high school graduation data (HB 5016). Key
investments were made in student financial aid to improve access to college, and in the redesign of
the state’s need-based grant for college, the Oregon Opportunity Grant (HB 2407). The Oregon
Promise grant program was created to offset tuition at community colleges (SB 81). Additional
actions addressed academic alignment and transferability between sectors, expanded services in the
state’s GED Program, improved college readiness through accelerated learning (SB 418), continued
work on the Transfer Student Bill of Rights and Responsibilities (HB 2525), and processes for
placing students in community college courses (HB 2681).
Improving access to a high quality education for historically underserved students was also a priority.
The Legislature required the development of statewide education plans for African-American
students (HB 2016), American Indian/Alaskan Native students, and English Language Learners (HB
3499), addressing educator equity (HB 3375), expanding eligibility for undocumented students who
would otherwise qualify for in-state tuition at public universities to apply for OOG funds (SB 932)
and directing the HECC to address disparities in higher education (HB 3308).
No one strategy promises to be a singular solution for Oregon, but working in concert, these efforts
are setting the stage for students to have the access and support they need to graduate high school
with the skills and opportunity to move on to higher education or the world of work.

4 | P a g e
5 | P a g e
HB 3319 Dropout Survey Results
House Bill 3319 from the 2015 Legislative Session directed the Oregon Department of Education (ODE) to produce a report that describes best practices school districts use to reduce dropout rates, including best practices to increase high school graduation rates and to reduce chronic absenteeism. The bill directed ODE to survey all school districts to collect this information. Under the provisions of HB 3319, responding to this survey was voluntary.
ODE conducted the survey in December 2015. Eighty-eight of Oregon’s 197 school districts responded to the survey for an overall response rate of 45 percent. Not all of the 88 districts responded to each survey question, so the response rate varies by question. For each question we provide the number of respondents below the graph. The following pages present the results of the survey.

6 | P a g e
7 | P a g e
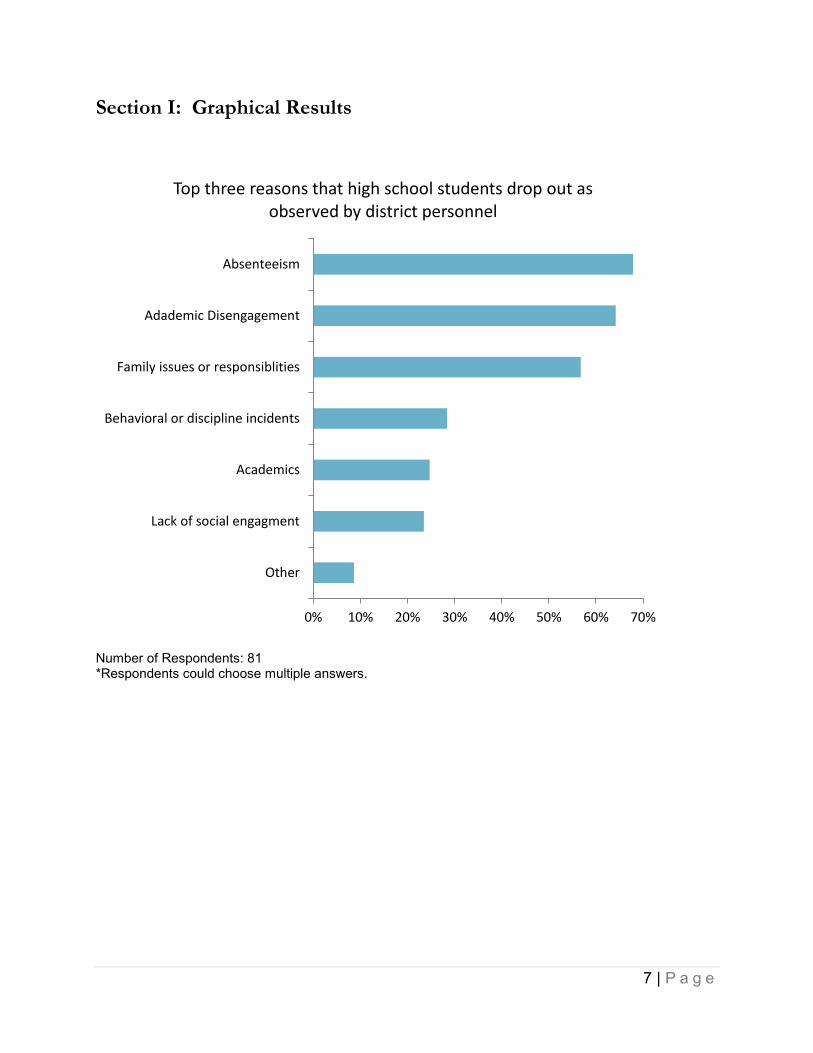
Section I: Graphical Results
Number of Respondents: 81 *Respondents could choose multiple answers.
0% 10% 20% 30% 40% 50% 60% 70%
Other
Lack of social engagment
Academics
Behavioral or discipline incidents
Family issues or responsiblities
Adademic Disengagement
Absenteeism
Top three reasons that high school students drop out as observed by district personnel
8 | P a g e
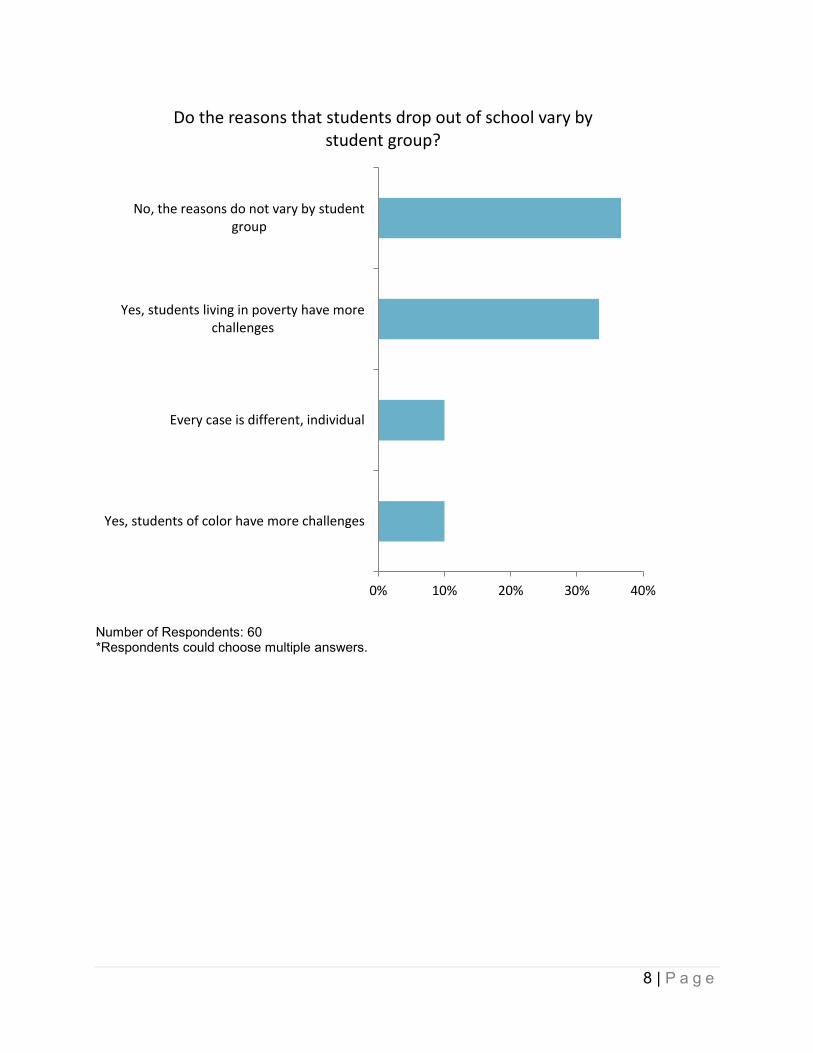
Number of Respondents: 60 *Respondents could choose multiple answers.
0% 10% 20% 30% 40%
Yes, students of color have more challenges
Every case is different, individual
Yes, students living in poverty have morechallenges
No, the reasons do not vary by studentgroup
Do the reasons that students drop out of school vary by student group?

9 | P a g e
Number of Respondents: 56 *Respondents could choose multiple answers.
0% 10% 20% 30% 40% 50%
Every case is individual
No
Yes, respondents reference particularissues in certain high school grades
Do these reasons that students drop out of school vary by student age and grade?
10 | P a g e
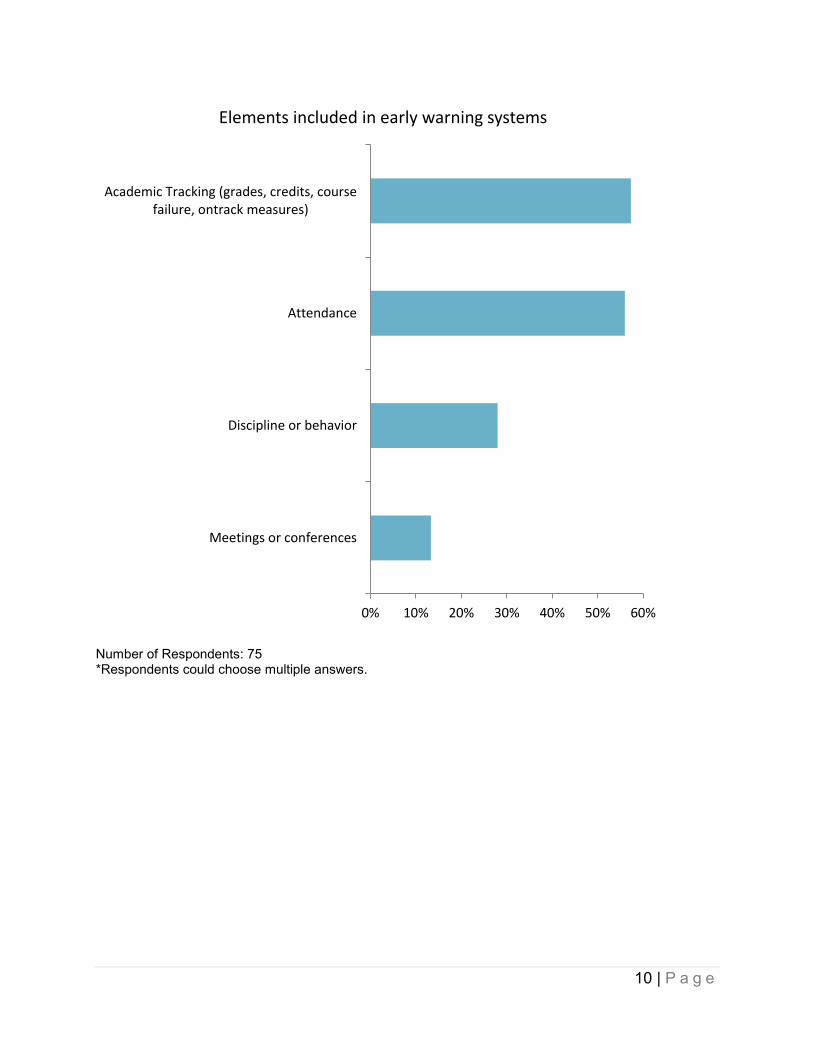
Number of Respondents: 75 *Respondents could choose multiple answers.
0% 10% 20% 30% 40% 50% 60%
Academic Tracking (grades, credits, coursefailure, ontrack measures)
Attendance
Discipline or behavior
Meetings or conferences
Elements included in early warning systems
11 | P a g e
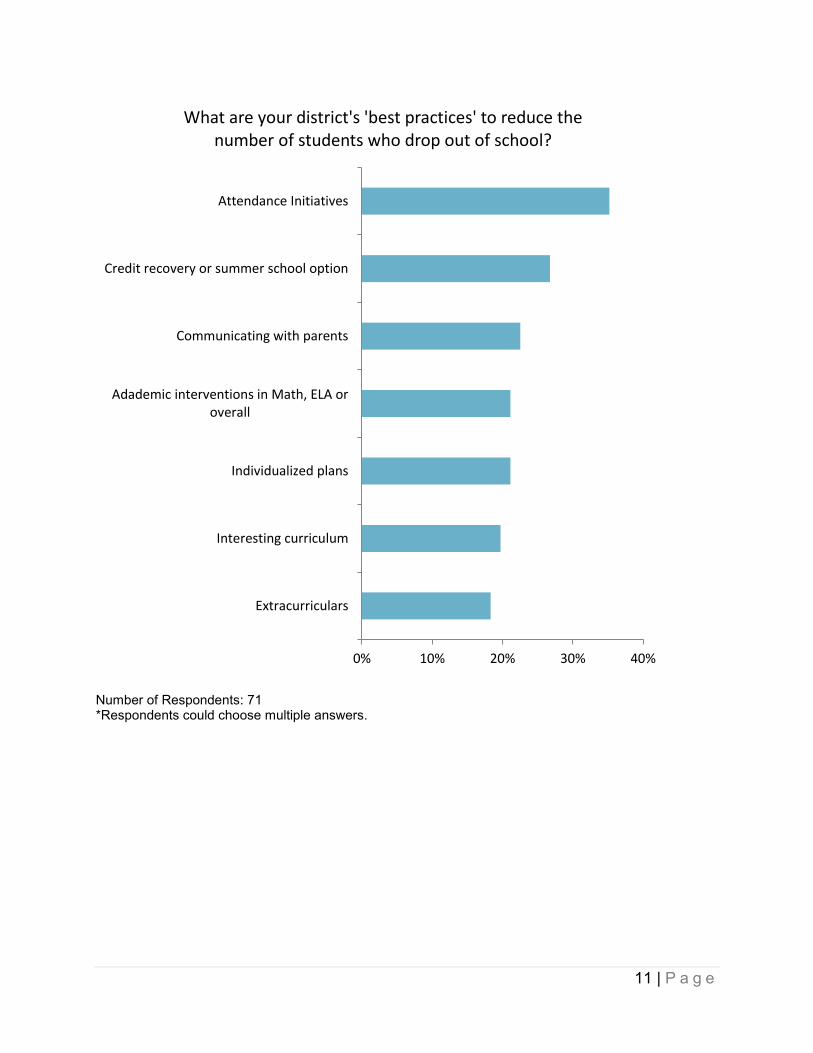
Number of Respondents: 71 *Respondents could choose multiple answers.
0% 10% 20% 30% 40%
Extracurriculars
Interesting curriculum
Individualized plans
Adademic interventions in Math, ELA oroverall
Communicating with parents
Credit recovery or summer school option
Attendance Initiatives
What are your district's 'best practices' to reduce the number of students who drop out of school?
12 | P a g e
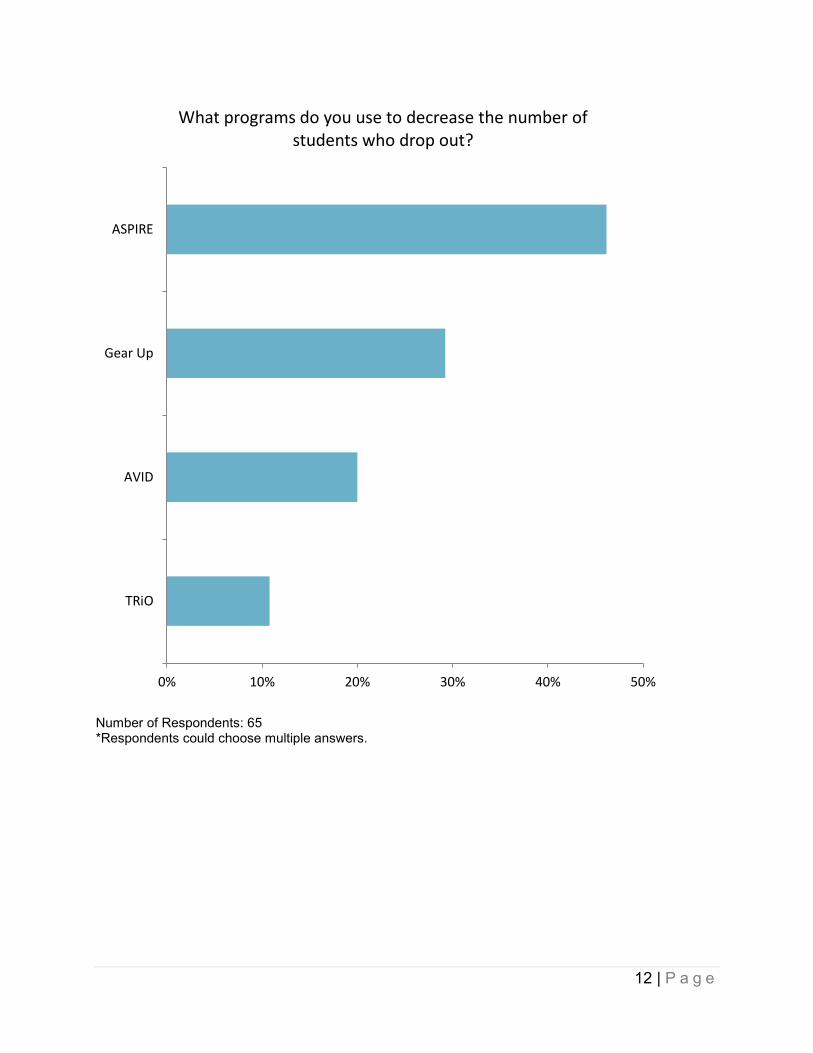
Number of Respondents: 65 *Respondents could choose multiple answers.
0% 10% 20% 30% 40% 50%
ASPIRE
Gear Up
AVID
TRiO
What programs do you use to decrease the number of students who drop out?

13 | P a g e
Number of Respondents: 66 *Respondents could choose multiple answers.
Number of Respondents: 63 *Respondents could choose multiple answers.
0% 10% 20% 30% 40% 50% 60% 70%
No
Yes
Does your district have specific activities or programs to reduce the likelihood that students will drop out at all
levels of schools?
0% 10% 20% 30% 40%
No
Yes, general academic help, alternativeeducation access, and school-level specific
programs referenced
Yes, racial, ethnic student groups, specialprograms for student in poverty referenced
Follow-up: Do you have specific activities or programs for different student groups?
14 | P a g e
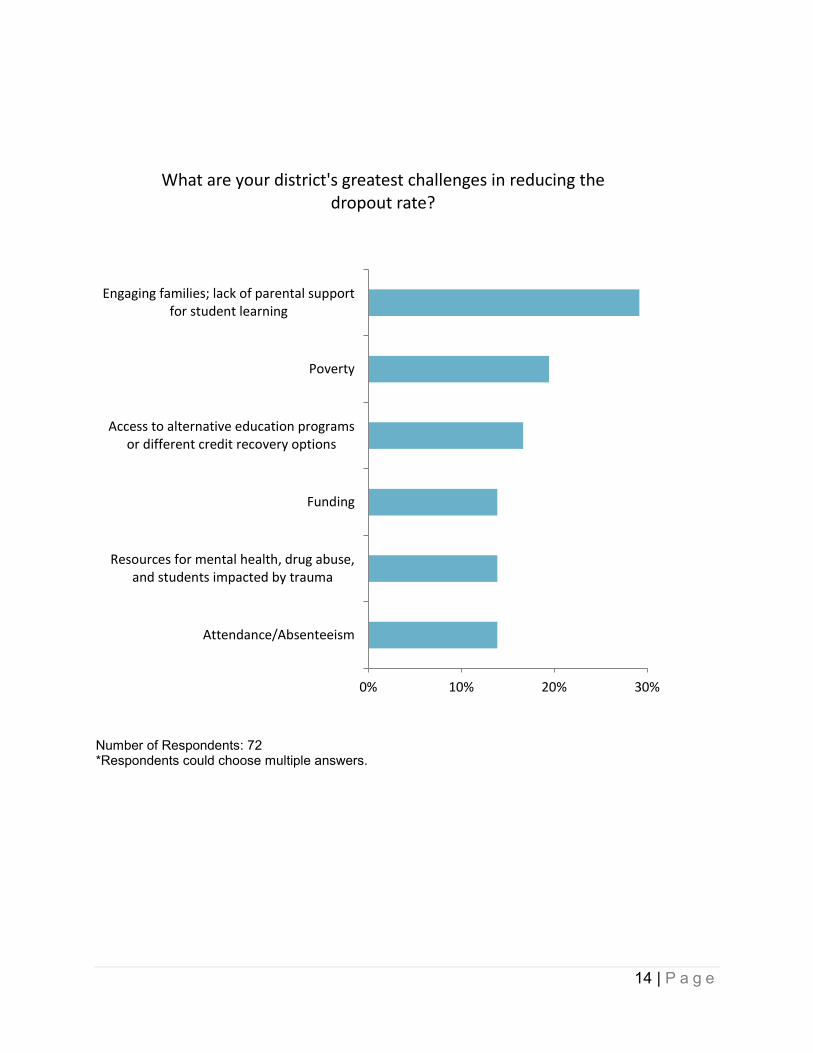
Number of Respondents: 72 *Respondents could choose multiple answers.
0% 10% 20% 30%
Attendance/Absenteeism
Resources for mental health, drug abuse,and students impacted by trauma
Funding
Access to alternative education programsor different credit recovery options
Poverty
Engaging families; lack of parental supportfor student learning
What are your district's greatest challenges in reducing the dropout rate?
15 | P a g e
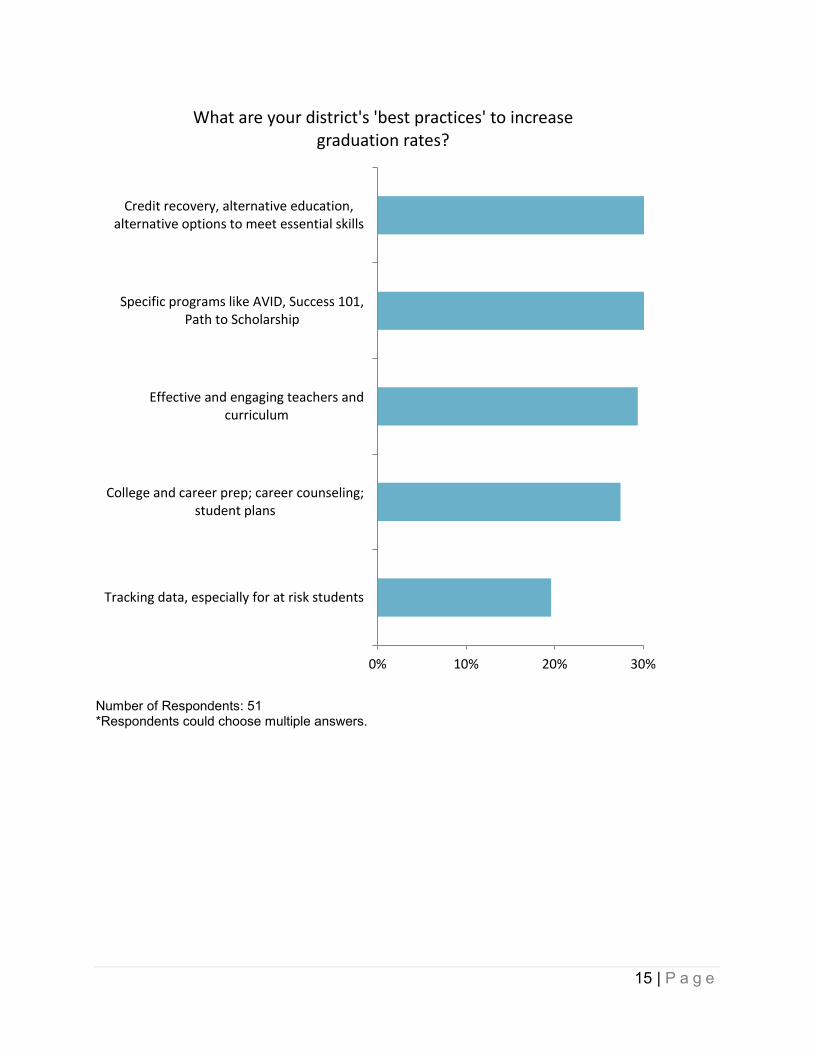
Number of Respondents: 51 *Respondents could choose multiple answers.
0% 10% 20% 30%
Tracking data, especially for at risk students
College and career prep; career counseling;student plans
Effective and engaging teachers andcurriculum
Specific programs like AVID, Success 101,Path to Scholarship
Credit recovery, alternative education,alternative options to meet essential skills
What are your district's 'best practices' to increase graduation rates?
16 | P a g e
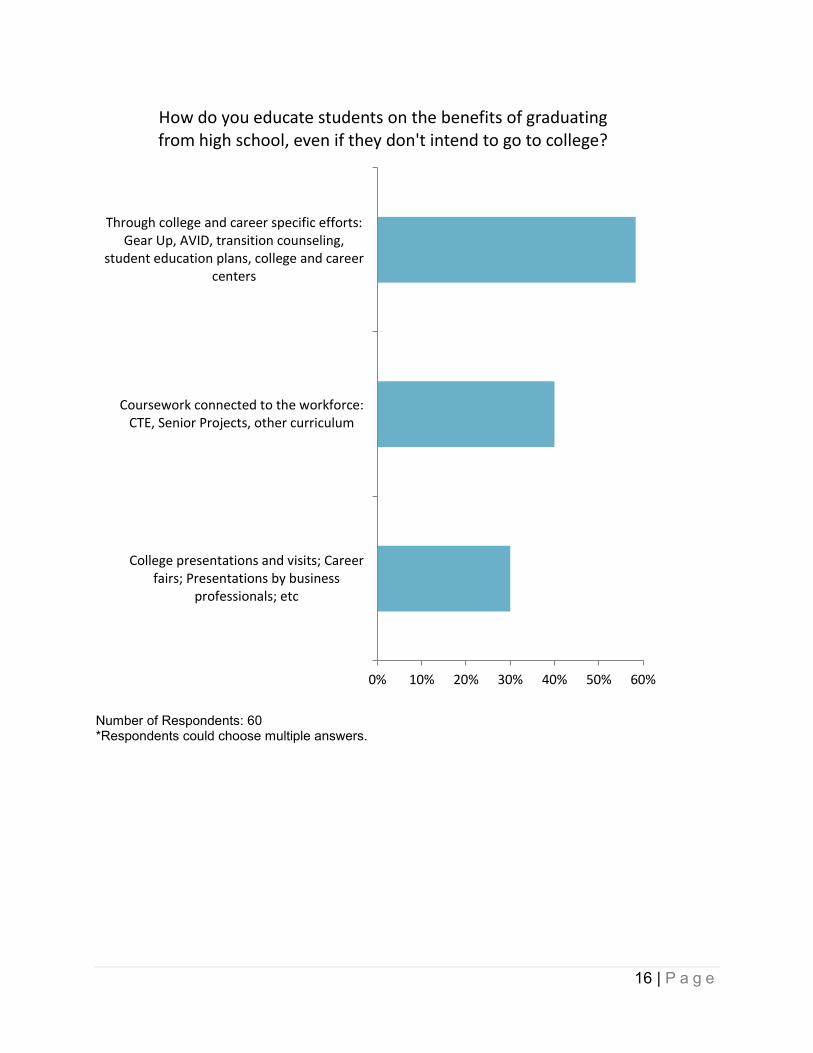
Number of Respondents: 60 *Respondents could choose multiple answers.
0% 10% 20% 30% 40% 50% 60%
College presentations and visits; Careerfairs; Presentations by business
professionals; etc
Coursework connected to the workforce:CTE, Senior Projects, other curriculum
Through college and career specific efforts:Gear Up, AVID, transition counseling,
student education plans, college and careercenters
How do you educate students on the benefits of graduating from high school, even if they don't intend to go to college?
17 | P a g e
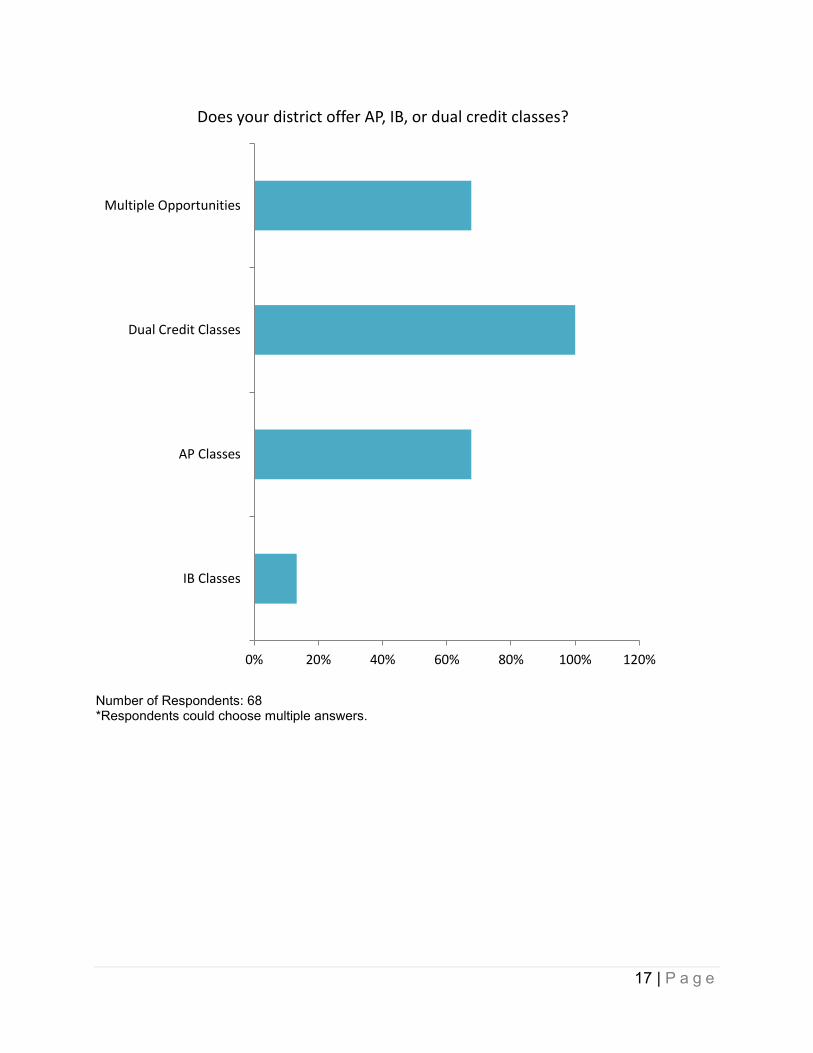
Number of Respondents: 68 *Respondents could choose multiple answers.
0% 20% 40% 60% 80% 100% 120%
IB Classes
AP Classes
Dual Credit Classes
Multiple Opportunities
Does your district offer AP, IB, or dual credit classes?
18 | P a g e
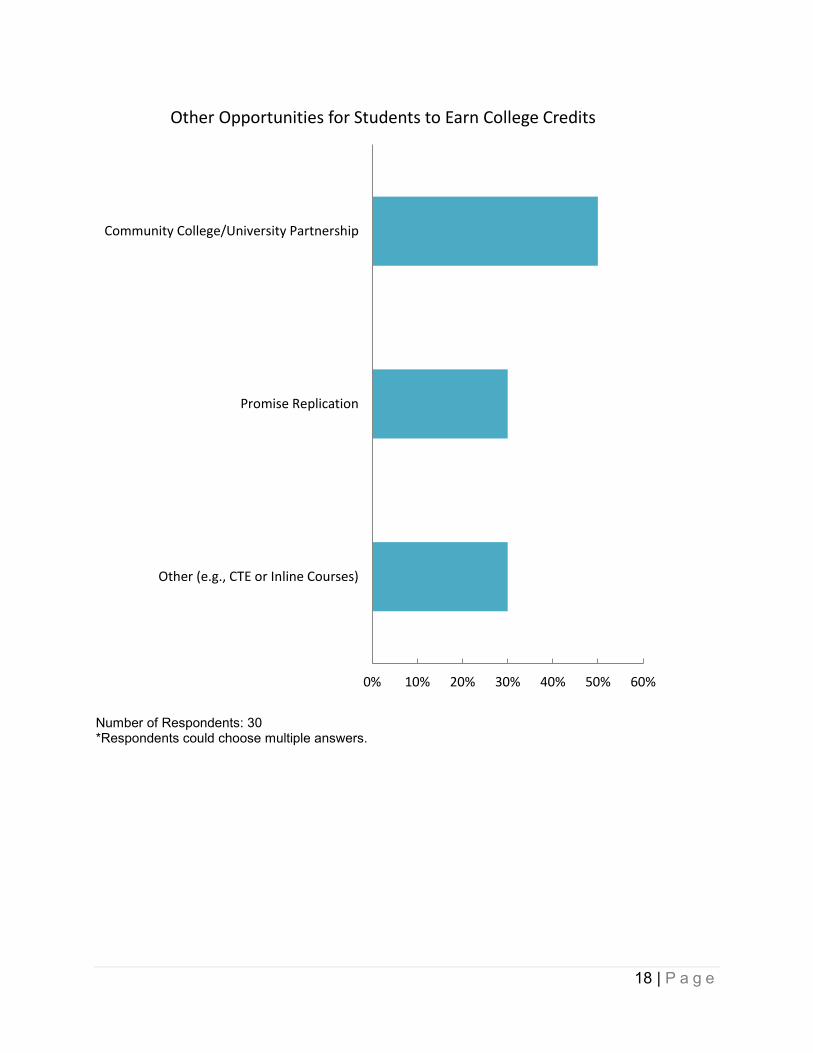
Number of Respondents: 30 *Respondents could choose multiple answers.
0% 10% 20% 30% 40% 50% 60%
Community College/University Partnership
Promise Replication
Other (e.g., CTE or Inline Courses)
Other Opportunities for Students to Earn College Credits
19 | P a g e
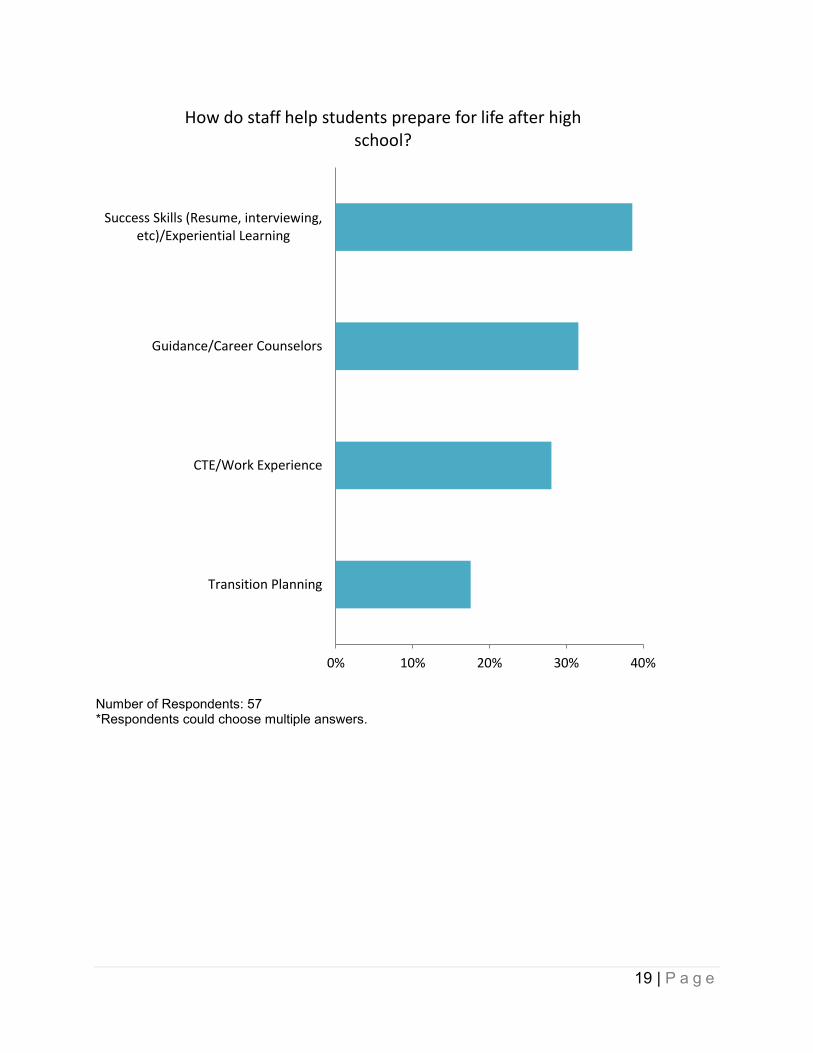
Number of Respondents: 57 *Respondents could choose multiple answers.
0% 10% 20% 30% 40%
Transition Planning
CTE/Work Experience
Guidance/Career Counselors
Success Skills (Resume, interviewing,etc)/Experiential Learning
How do staff help students prepare for life after high school?
20 | P a g e
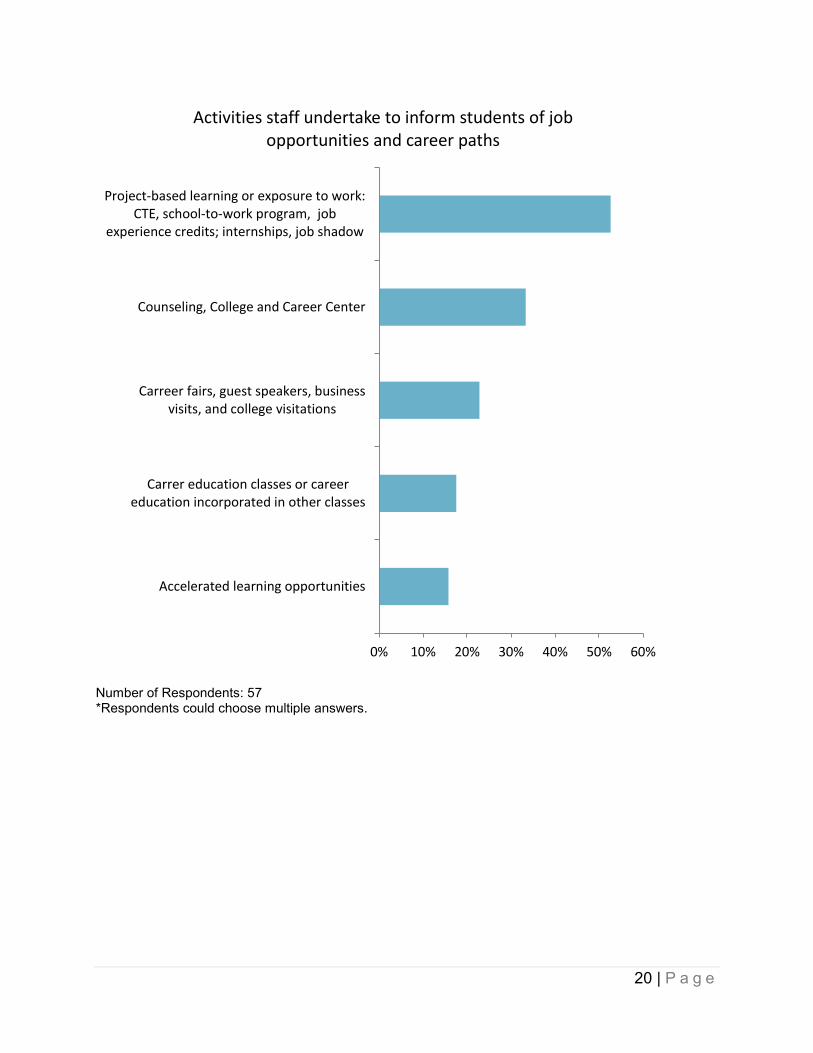
Number of Respondents: 57 *Respondents could choose multiple answers.
0% 10% 20% 30% 40% 50% 60%
Accelerated learning opportunities
Carrer education classes or careereducation incorporated in other classes
Carreer fairs, guest speakers, businessvisits, and college visitations
Counseling, College and Career Center
Project-based learning or exposure to work:CTE, school-to-work program, job
experience credits; internships, job shadow
Activities staff undertake to inform students of job opportunities and career paths

21 | P a g e
Number of Respondents: 50 *Respondents could choose multiple answers.
0% 10% 20% 30% 40%
Student Activities/Extra Curriculars
Broad Course offerings/Electives
Check In's/Reports
Mentoring/Advising
What strategies does your district use to keep students engaged in school?

22 | P a g e
Number of Respondents: 57 *Respondents could choose multiple answers.
0% 10% 20% 30% 40% 50% 60% 70%
Home visits
Recognition or awards
Resource or Truancy Officer
Communication with family: letters, phonecalls, meetings, etc
What are your district's 'best practices' to help students who are struggling with attendance?

23 | P a g e
Number of Respondents: 60 *Respondents may be counted in Small School/ Not Needed and an additional category.
0% 10% 20% 30% 40% 50% 60% 70% 80% 90%
No
Small School/ Not Needed
Yes
Does your district review attendance data in a way that allows staff to identify individual students who may be
struggling with attendance?
24 | P a g e
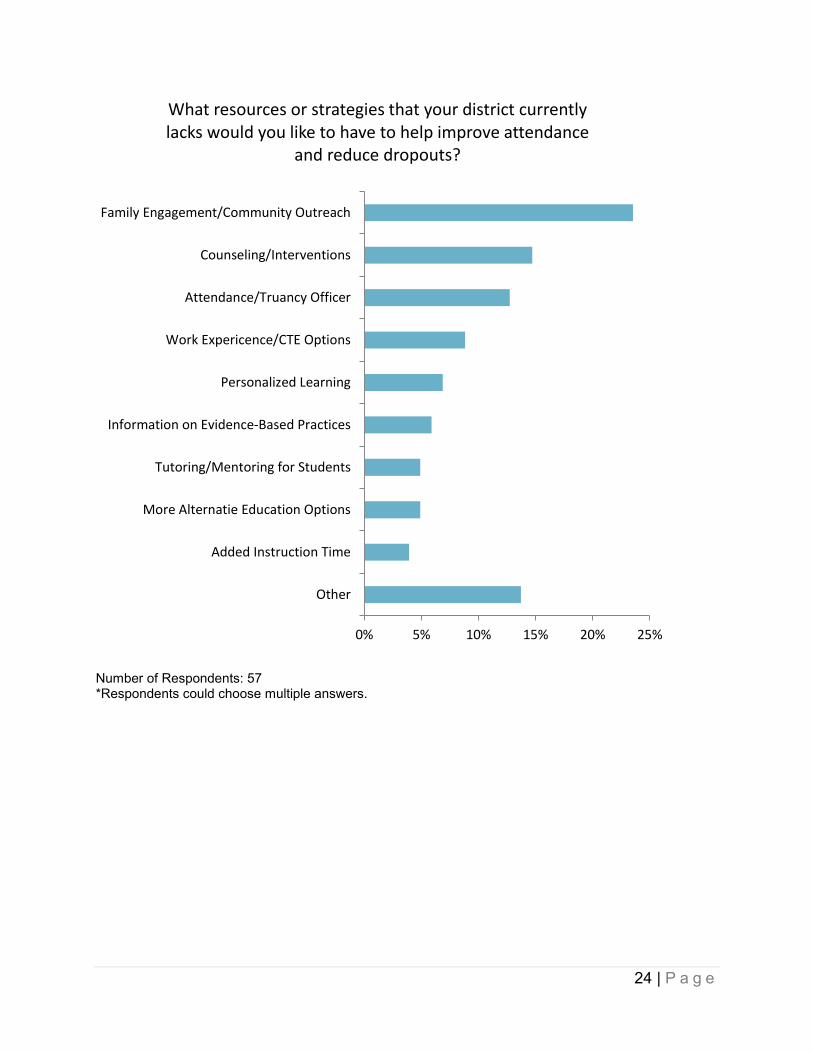
Number of Respondents: 57 *Respondents could choose multiple answers.
0% 5% 10% 15% 20% 25%
Family Engagement/Community Outreach
Counseling/Interventions
Attendance/Truancy Officer
Work Expericence/CTE Options
Personalized Learning
Information on Evidence-Based Practices
Tutoring/Mentoring for Students
More Alternatie Education Options
Added Instruction Time
Other
What resources or strategies that your district currently lacks would you like to have to help improve attendance
and reduce dropouts?
25 | P a g e
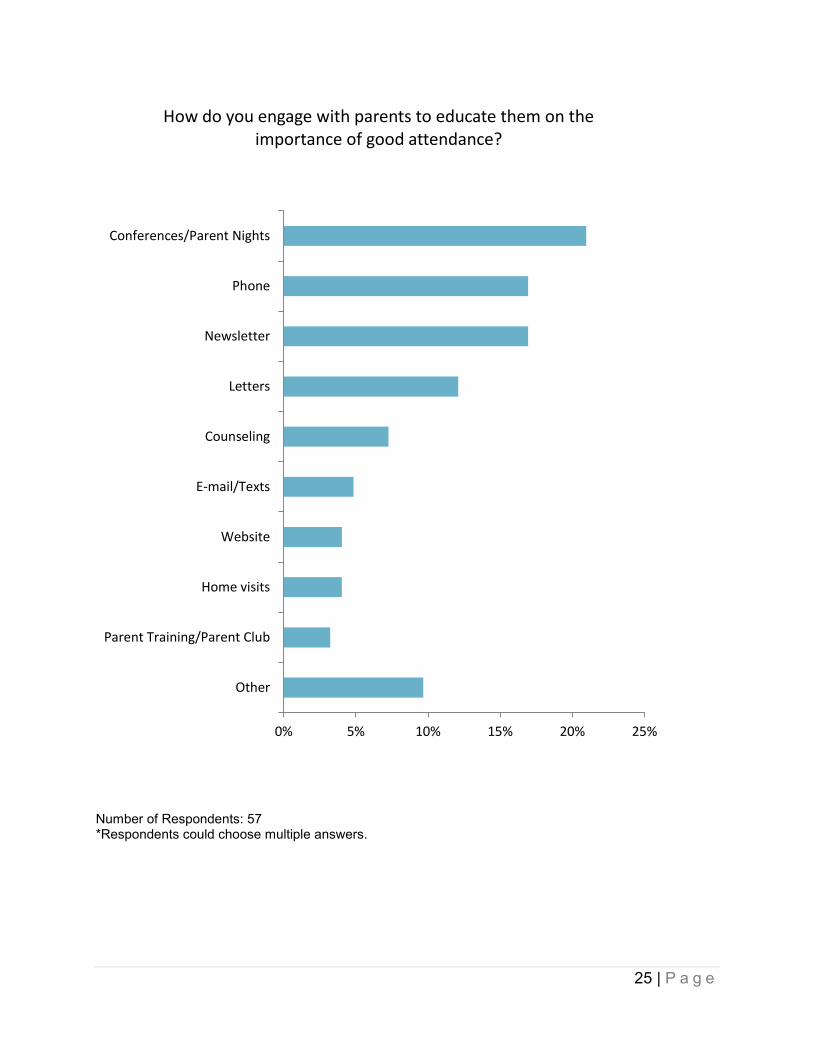
Number of Respondents: 57 *Respondents could choose multiple answers.
0% 5% 10% 15% 20% 25%
Conferences/Parent Nights
Phone
Newsletter
Letters
Counseling
E-mail/Texts
Website
Home visits
Parent Training/Parent Club
Other
How do you engage with parents to educate them on the importance of good attendance?

26 | P a g e
Number of Respondents: 59 *Respondents could choose multiple answers.
0% 10% 20% 30% 40% 50%
Schoolwork provided tostudent
Tutoring
Online courses
Alternative Placement
Extra time with teachersupon return
Counseling
Other
Describe the services you provide to students who are temporarily not attending school because of a suspension

27 | P a g e
Number of Respondents: 53 *Respondents could choose multiple answers.
0% 10% 20% 30% 40% 50% 60%
Phone call/letter to parents
Other re-engagementstrategies
Visit home
Counseling
Other
Do you have a program to contact students (or their families) who appear to have left school permanently? If
yes, please briefly describe the program.
28 | P a g e
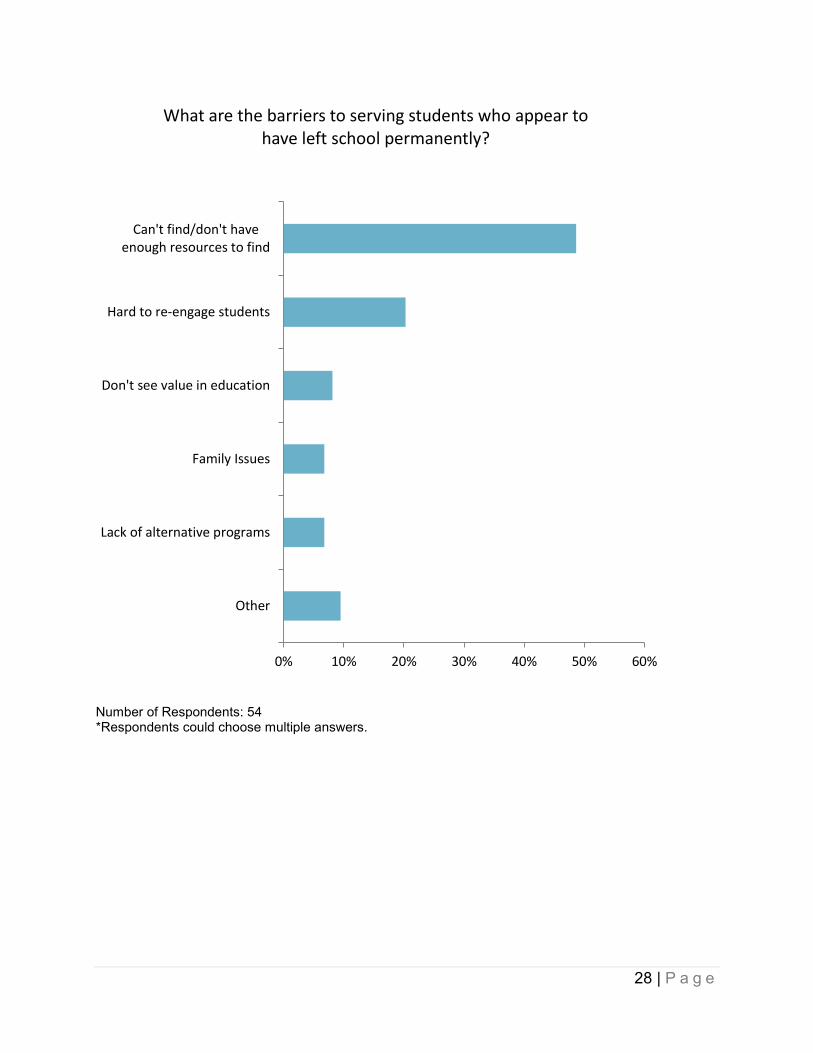
Number of Respondents: 54 *Respondents could choose multiple answers.
0% 10% 20% 30% 40% 50% 60%
Can't find/don't haveenough resources to find
Hard to re-engage students
Don't see value in education
Family Issues
Lack of alternative programs
Other
What are the barriers to serving students who appear to have left school permanently?
29 | P a g e
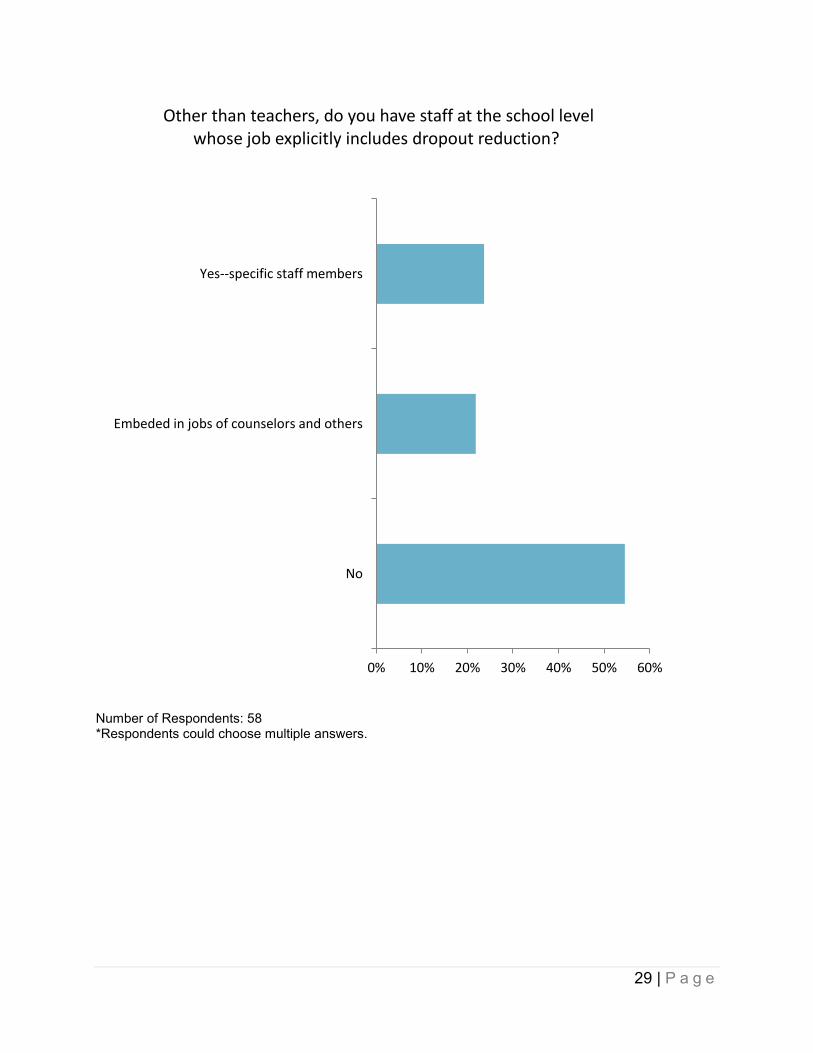
Number of Respondents: 58 *Respondents could choose multiple answers.
0% 10% 20% 30% 40% 50% 60%
Yes--specific staff members
Embeded in jobs of counselors and others
No
Other than teachers, do you have staff at the school level whose job explicitly includes dropout reduction?
30 | P a g e
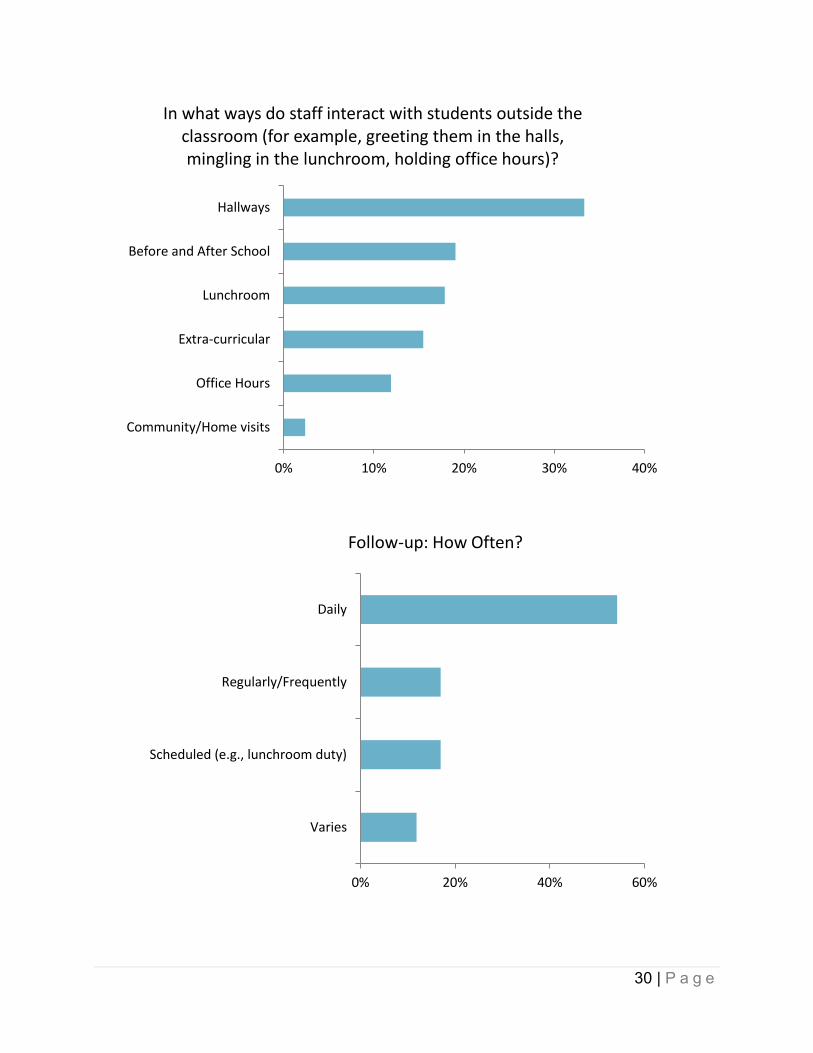
0% 10% 20% 30% 40%
Hallways
Before and After School
Lunchroom
Extra-curricular
Office Hours
Community/Home visits
In what ways do staff interact with students outside the classroom (for example, greeting them in the halls, mingling in the lunchroom, holding office hours)?
0% 20% 40% 60%
Daily
Regularly/Frequently
Scheduled (e.g., lunchroom duty)
Varies
Follow-up: How Often?
31 | P a g e
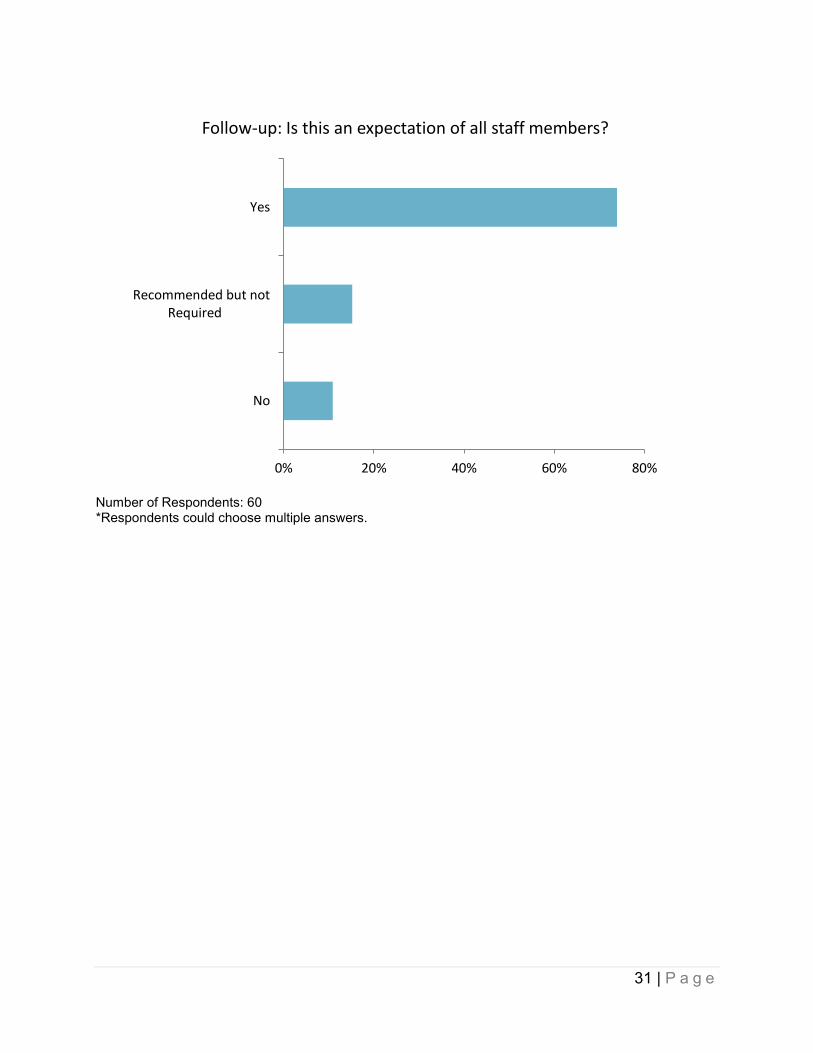
Number of Respondents: 60 *Respondents could choose multiple answers.
0% 20% 40% 60% 80%
Yes
Recommended but notRequired
No
Follow-up: Is this an expectation of all staff members?
32 | P a g e
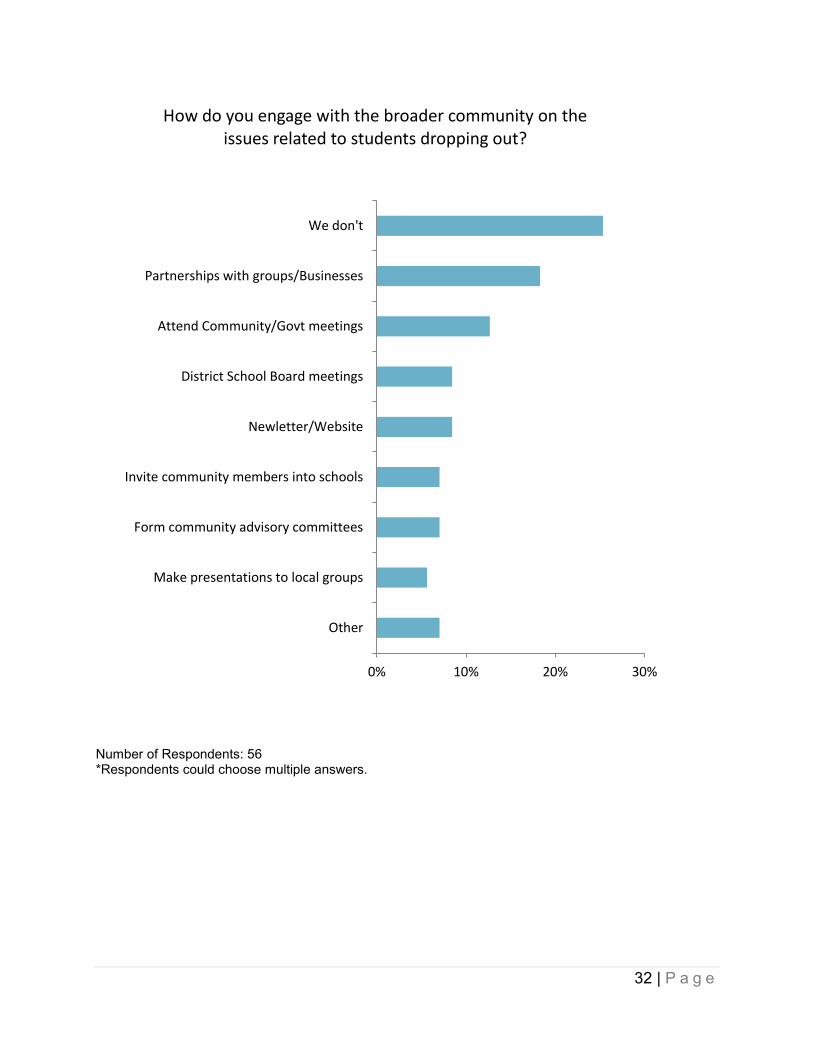
Number of Respondents: 56 *Respondents could choose multiple answers.
0% 10% 20% 30%
We don't
Partnerships with groups/Businesses
Attend Community/Govt meetings
District School Board meetings
Newletter/Website
Invite community members into schools
Form community advisory committees
Make presentations to local groups
Other
How do you engage with the broader community on the issues related to students dropping out?
33 | P a g e
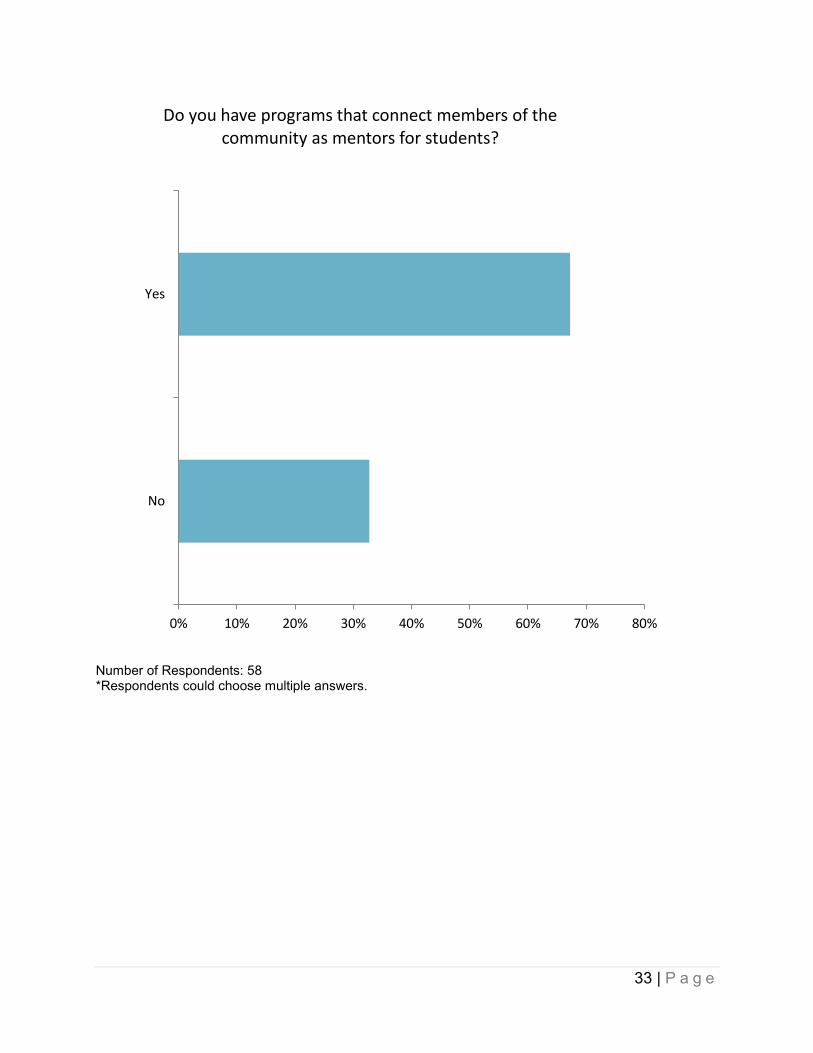
Number of Respondents: 58 *Respondents could choose multiple answers.
0% 10% 20% 30% 40% 50% 60% 70% 80%
Yes
No
Do you have programs that connect members of the community as mentors for students?

34 | P a g e
0% 20% 40% 60% 80% 100%
Yes
No
Are extra-curricular activities an effective tool to keep students engaged in school?
0% 20% 40% 60%
Newsletters/Posters/Web/Mailings/Announcements
Club days
Staff encourage students
At Registration/Orientation
Follow-up: If so, how do you promote those activities?
35 | P a g e
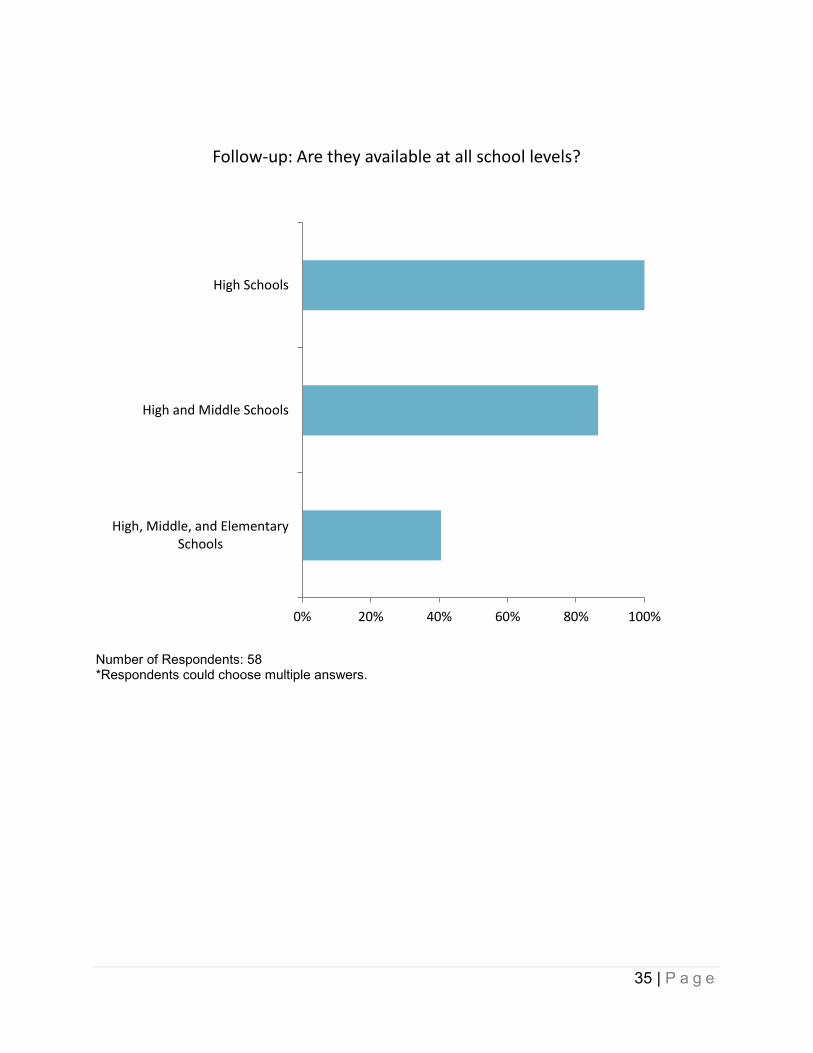
Number of Respondents: 58 *Respondents could choose multiple answers.
0% 20% 40% 60% 80% 100%
High Schools
High and Middle Schools
High, Middle, and ElementarySchools
Follow-up: Are they available at all school levels?
36 | P a g e
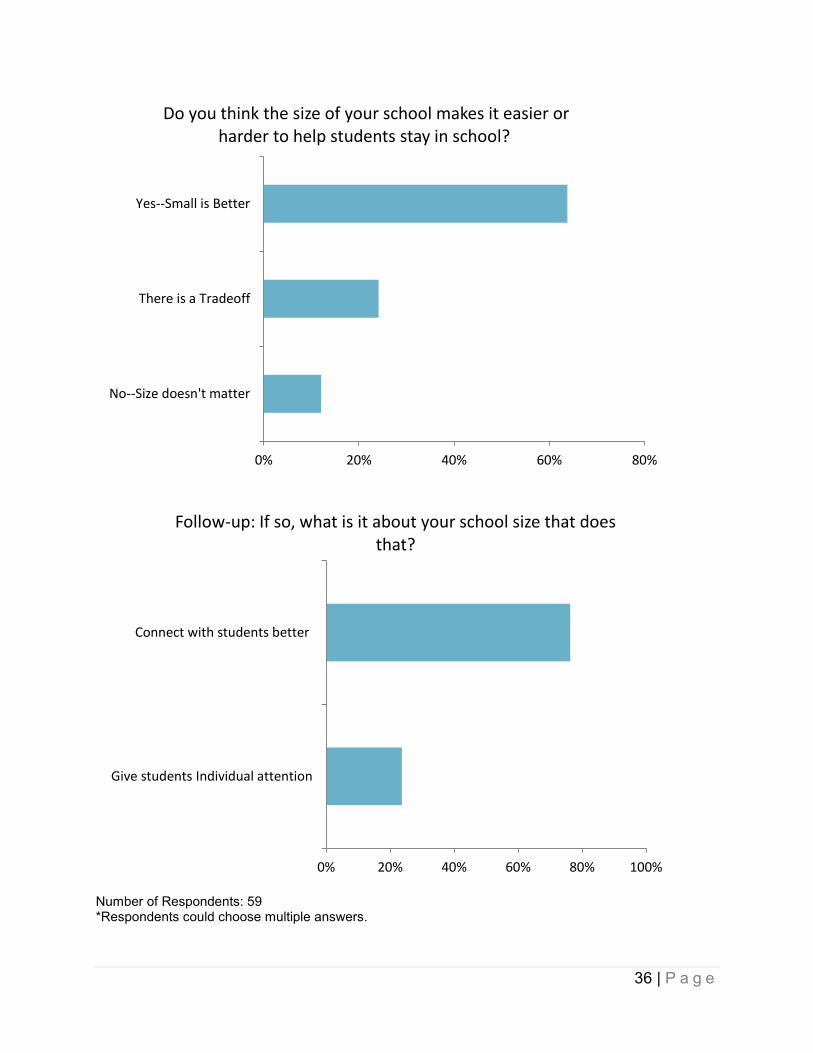
Number of Respondents: 59 *Respondents could choose multiple answers.
0% 20% 40% 60% 80%
Yes--Small is Better
There is a Tradeoff
No--Size doesn't matter
Do you think the size of your school makes it easier or harder to help students stay in school?
0% 20% 40% 60% 80% 100%
Connect with students better
Give students Individual attention
Follow-up: If so, what is it about your school size that does that?

37 | P a g e
Section II: Comments
Do you have any additional comments or information to add that may help ODE complete a
report to the legislature about what school districts are doing to reduce dropouts, increase
attendance, and improve graduation rates?1
1. Limit Class Size
2. We have a 97% graduation rate this year. We are always one of the highest around. We
don't do school like everyone else. I have described some of the major differences. I am
pretty sure the way we do school accounts for our low drop-out rate.
3. We do appreciate your interest in this most important subject. As a bit of feedback, we
found many of the questions in this survey to be redundant, and it took nearly 90 minutes to
complete, rather than the 30 minutes as advertised. Thank you. We need support from the
state (resources, programs, training, etc.)
4. Funding for education is critical. We need to be able to provide FTE and funding for
schools in order to support students in the higher level of rigor and expectations expected
for college and career readiness for all students. Schools need financial support.
5. This is a prevalent issue in all corners of our state. It would be nice to have a work-group
engage in this dilemma and make recommendations to the state board for possible
considerations.
6. We are attempting to implement the many, many unfunded and contradictory laws and
mandates coming from the Legislature and Feds, etc.; thankfully the ESSA law sheds some
light...and yet concurrently doing the key things to reach and engage students and families to
keep relevance in the educational pathway their child is on. Confusing question--I'll flip it
around...what are you doing to achieve the same outcome?
7. Yes we would like a differentiated diploma with a variety of pathways tied to differing
graduation requirements in the junior and senior years depending on the student’s pathway.
This would strengthen our dropout reduction and also strengthen our CTE/ STEAM
pathways. If you would like more details of how this could work please contact me.
8. We recognize we have an issue with attendance and dropout rates and want to correct it.
We need help with the process. FUNDING FUNDING FUNDING We are 25% below
1 The responses were lightly edited for spelling and punctuation.

38 | P a g e
the national average in funding and our results reflect that number. We are getting what we
are paying for. As long as our state continues to give kids the leftover dollars in the budget,
our results will continue to be unacceptable. Our kids deserve the first dollars, not the last
ones. Stabilize our funding and watch what we will be able to achieve. Our results are very
good for the funding we get.
9. Keep class size down, provide for extracurricular actives and provide meaningful electives
such as art, drama and etc.
10. We try to get all staff to have a rapport with students and be the person students will come
to. We will have a SRO next fall and we are looking for someone that can be trusted by
students.
11. Our alternative high school should not be graded on a four-year graduation rate. By design,
they keep students for a 5th year as they all come to that school already credit-deficient.
Alternative methods for accountability must be considered to allow districts the flexibility to
create programs that fit student need. In addition to that, this alternative high school (and
we are adding a middle school model as well), is extremely expensive to run considering the
staff to student ratio is 15:1 compared to our comprehensive schools at 31:1. To fund this
small school, we aren't able to utilize funds in other places. Summer school is a great
option for our students to get back on track for graduation as they catch up on credits.
However, transportation is not reimbursed for summer programs and is cost prohibitive for
us to get all the students we need to summer school. Drug and alcohol prevention
specialists/counselors are key people to add to schools.
12. We know what best practices reduce the dropout rate. Our dropout rate mirrors our
commitment to funding those best practices.
13. Coalition of essential schools principles, size and rigor are essential to make the environment
relevant for all involved in the process of education (students, teachers, parents, students,
staff and administration). Everyone has a critical part in the system and it works because we
have protected the time to "be" together working toward a meaningful goal: our student's
passions.
14. We are doing everything that we can; given the resources we are allocated. We will remain
dedicated to the idea that we can find new ways to engage our students and keep them on
track to graduate and not drop out. In the meantime, we ask that more conversations be
held with state leaders to close the gap that keeps Oregon from having fully funded schools.
39 | P a g e
15. We need more opportunities for students to get high interest classes in the form of electives.
This will help peak their interest in some area and keep them in school. We also need more
help in the area of multi-cultural liaisons to link us to our diverse communities.
16. Something targeted from the state would be great. It is not just a Tillamook problem... it is
all across the state. We need more resources and support specifically for this issue. We have
been cut so much and asked to do more with less over the years. Now is the time to increase
spending on targeted programs for dropout reduction.
17. Funding matters. To truly impact attendance, it takes funding.
18. I welcome the opportunity to discuss in more depth with ODE should they have a need for
me to clarify any of the answers to these questions.
19. It would be nice if all schools had the resources to deal with absenteeism.
20. Tell the legislature that we have more to do in Education than just Testing and Curriculum;
Behavior Specialist, Counselors and "non-core" curriculum are areas that hold HIGH
VALUE for student success.... but have been limited, restricted or eliminated due to
funding!!!!!!!
21. You can't keep all high school students in school because of reading, writing and math. You
have to have technology and elective programs to keep them engaged. Increase the
common school fund to make this happen.
22. Home district refusing to provide a transfer allowing state funding to follow a student and
tuition has become a burden. We allow any transfer, some districts don’t
23. Mental health issues, namely depression and anxiety. Drug use.