Embed Size (px)
Citation preview
Dropout Prevention: How Do We Keep Students from Falling
Through the Proverbial Crack?
Lisa J. Bowman, Ph.D.Juniper Gardens Children’s Project
University of Kansas
Midwest Symposium for Leadership in Behavior Disorders
February 27, 2004

Overview National perspective and statistics
Risk and protective factors
What works?
Research projects
Case study
Ideas and resources for educators

Dropout Reports
National Reports National Center for Education Statistics (U.S.
Department of Education) publishes an annual Dropout Rates in the United States reports
Annual Report to Congress on the Implementation of the Individuals with Disabilities Education Act (www.ed.gov)
State and Local Reports
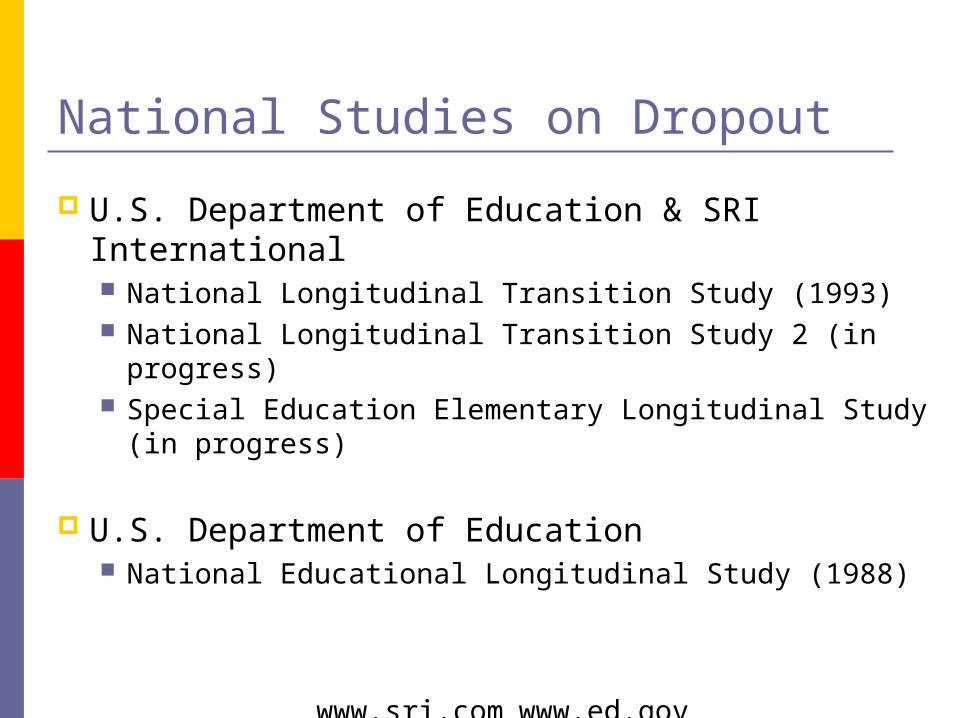
National Studies on Dropout
U.S. Department of Education & SRI International National Longitudinal Transition Study (1993) National Longitudinal Transition Study 2 (in progress) Special Education Elementary Longitudinal Study (in
progress)
U.S. Department of Education National Educational Longitudinal Study (1988)
www.sri.com www.ed.gov
Definition of Dropout
A student who leaves school “for any reason except death, before graduation or completion of a program of studies and without transferring to
another school or institution.”
U.S. Department of Education (2001)
National Education Goals 2000
“…the nation must drastically reduce its dropout rate.”
The nation will increase it’s graduation rate to 90%.
Educate America Act , 1993
National Education Goals 2000 Update
“While progress was made during the 1970s and 1980s in reducing high school dropout rates and increasing high school completion rates, these rates have remained comparatively stable during the 1990s.”
U.S. Department of Education, 2001
Dropout Statistics
The current national dropout rate is 10.9%;
the overall school completion rate is 85%.
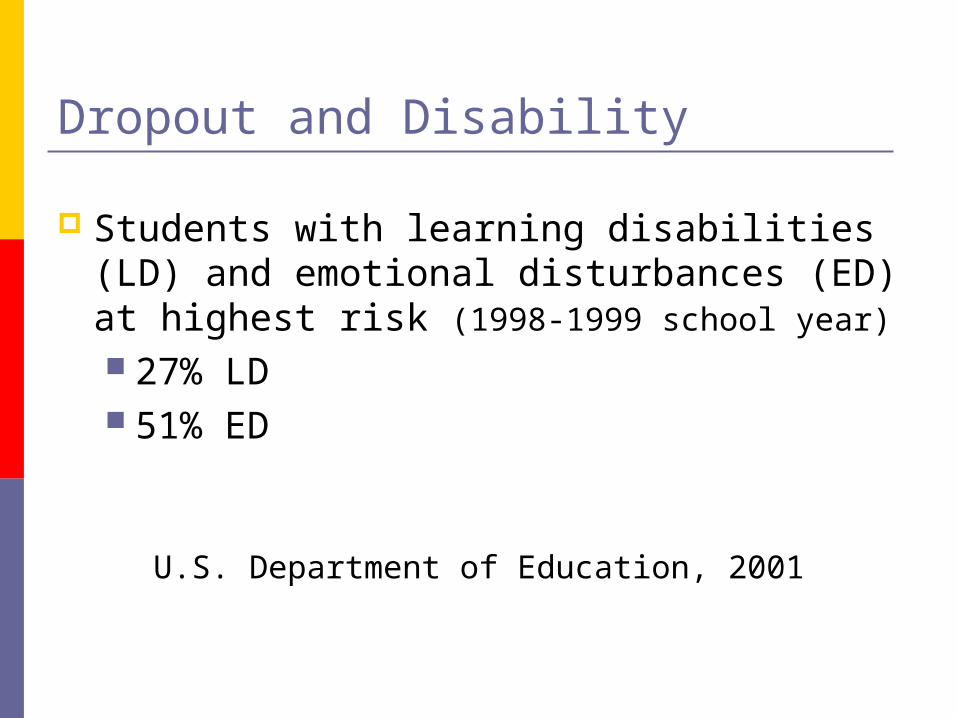
Dropout and Disability
Students with learning disabilities (LD) and emotional disturbances (ED) at highest risk (1998-1999 school year) 27% LD 51% ED
U.S. Department of Education, 2001
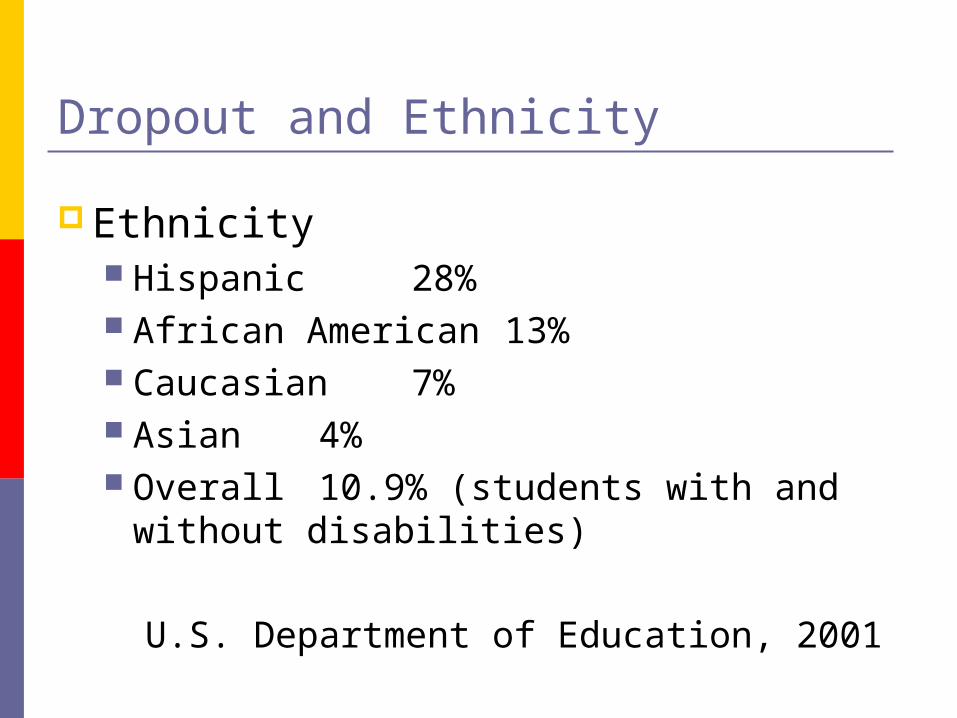
Dropout and Ethnicity
Ethnicity Hispanic 28% African American 13% Caucasian 7% Asian 4% Overall 10.9% (students with and
without disabilities)
U.S. Department of Education, 2001
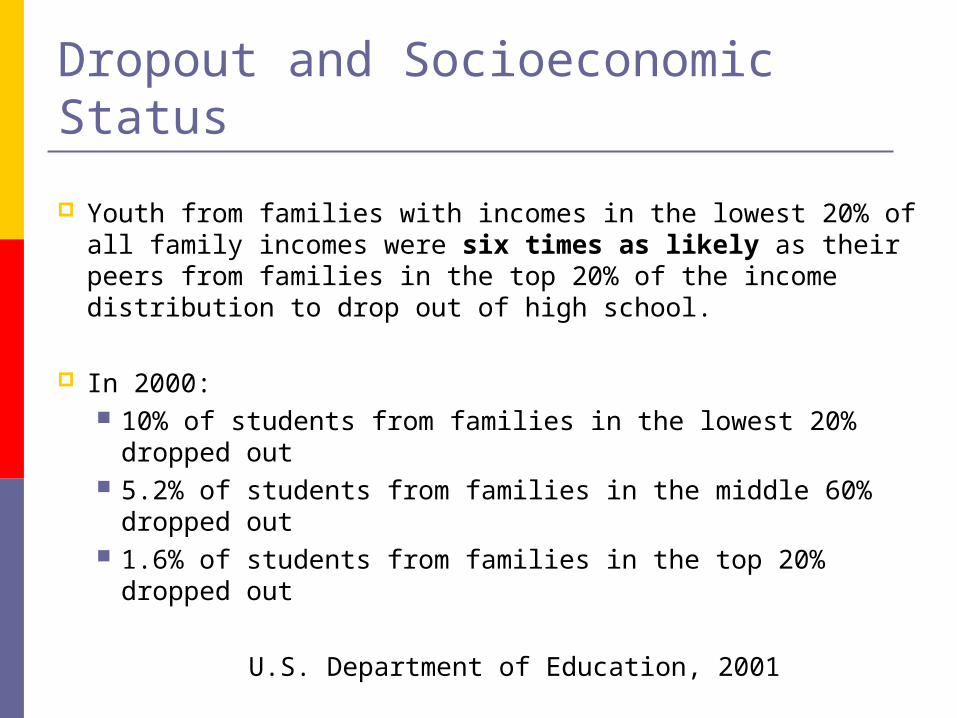
Dropout and Socioeconomic Status
Youth from families with incomes in the lowest 20% of all family incomes were six times as likely as their peers from families in the top 20% of the income distribution to drop out of high school.
In 2000: 10% of students from families in the lowest 20% dropped
out 5.2% of students from families in the middle 60%
dropped out 1.6% of students from families in the top 20% dropped
out
U.S. Department of Education, 2001

Dropout and Retention
Students retained two or more years were nearly four times as likely to drop out as those who had never been retained.
Students who are overage for their grade are at risk for dropping out.
U.S. Department of Education (1997); Ruff (1993)
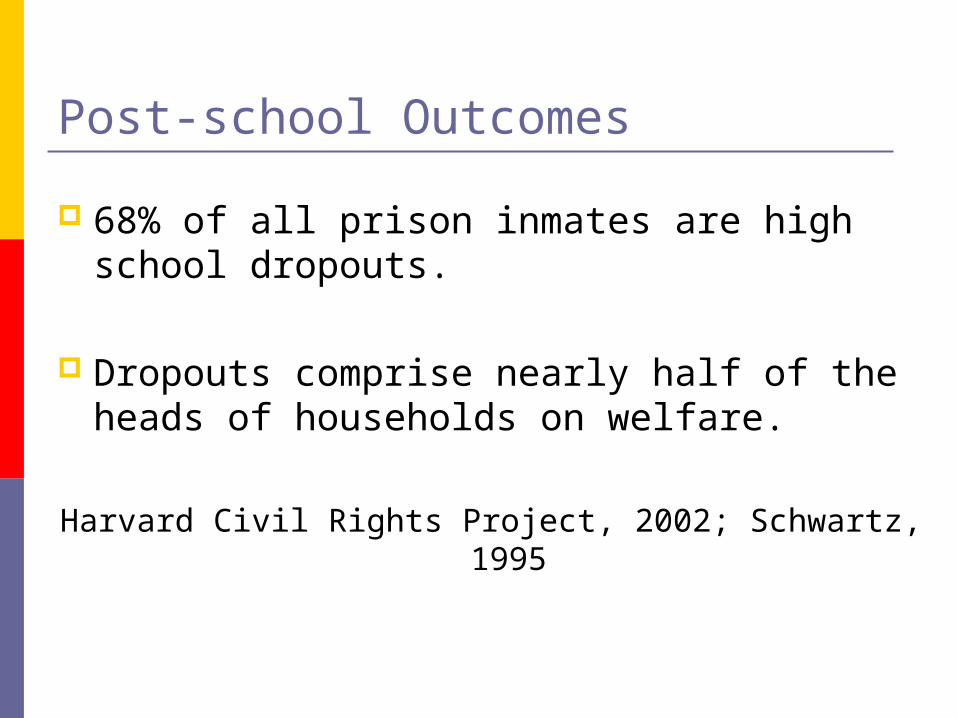
Post-school Outcomes
68% of all prison inmates are high school dropouts.
Dropouts comprise nearly half of the heads of households on welfare.
Harvard Civil Rights Project, 2002; Schwartz, 1995
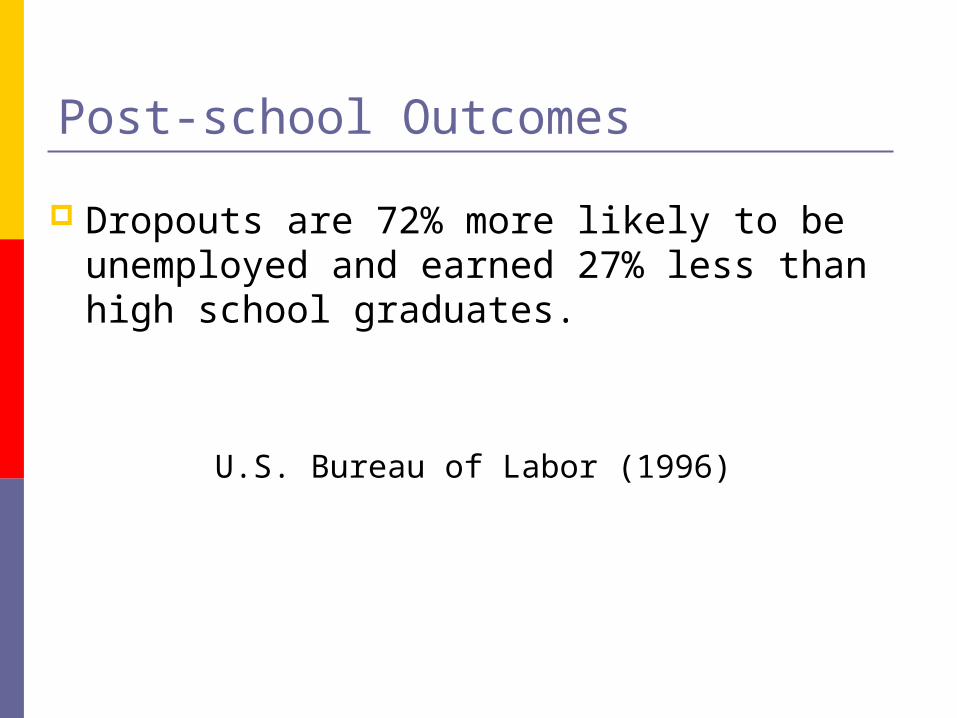
Post-school Outcomes
Dropouts are 72% more likely to be unemployed and earned 27% less than high school graduates.
U.S. Bureau of Labor (1996)
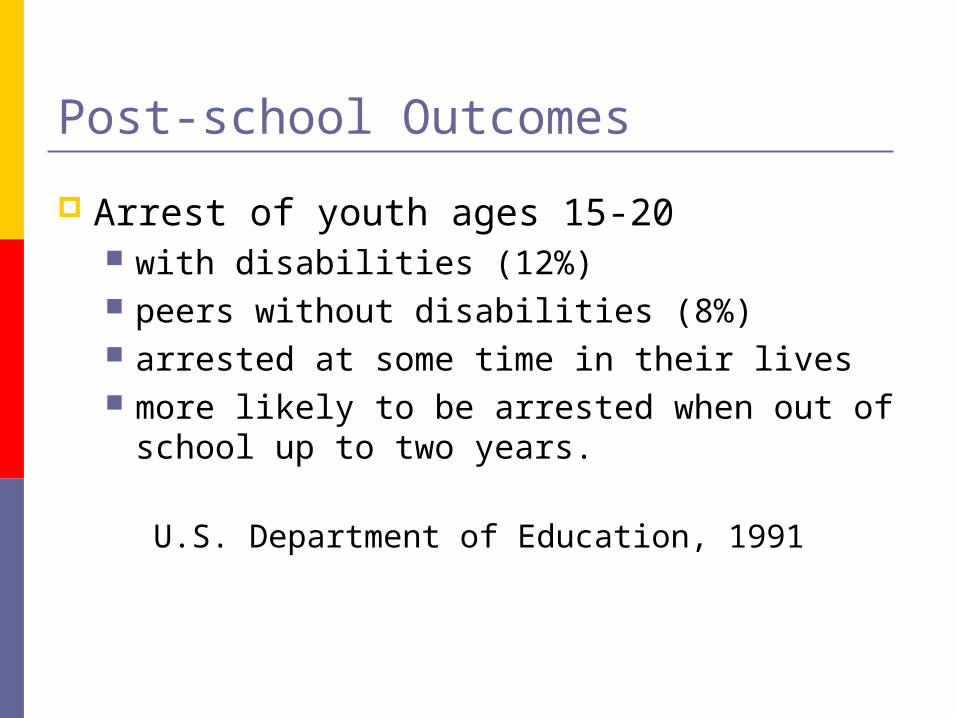
Post-school Outcomes
Arrest of youth ages 15-20 with disabilities (12%) peers without disabilities (8%) arrested at some time in their lives more likely to be arrested when out of school
up to two years.
U.S. Department of Education, 1991
Why Do Students Drop Out?
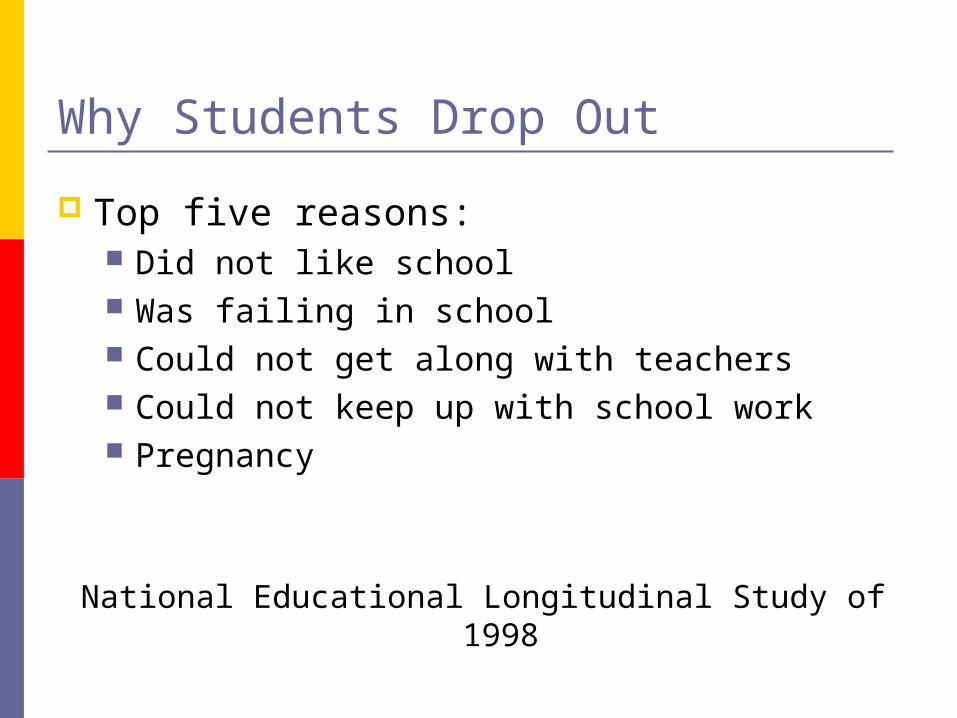
Why Students Drop Out
Top five reasons: Did not like school Was failing in school Could not get along with teachers Could not keep up with school work Pregnancy
National Educational Longitudinal Study of 1998

Risk Factors Include…
Family and Community
Low socioeconomic status Lack of resources and support High mobility (family) Lack of or poor role models
Risk Factors Include…
School
High stakes testing Zero tolerance policies leading to suspension
and expulsion Lack of resources and funding Grade retention Difficult transition from middle to high school
Risk Factors Include… Student
Nonattendance Repeated school failure Behavior problems Delinquency Disengagement from school
Protective Factors Include…
Positive and supportive school climate
High self-esteem
Parental support and involvement
Academic success
Social skills training
Problem-solving skills
High expectations
Goals for the future
What Works?
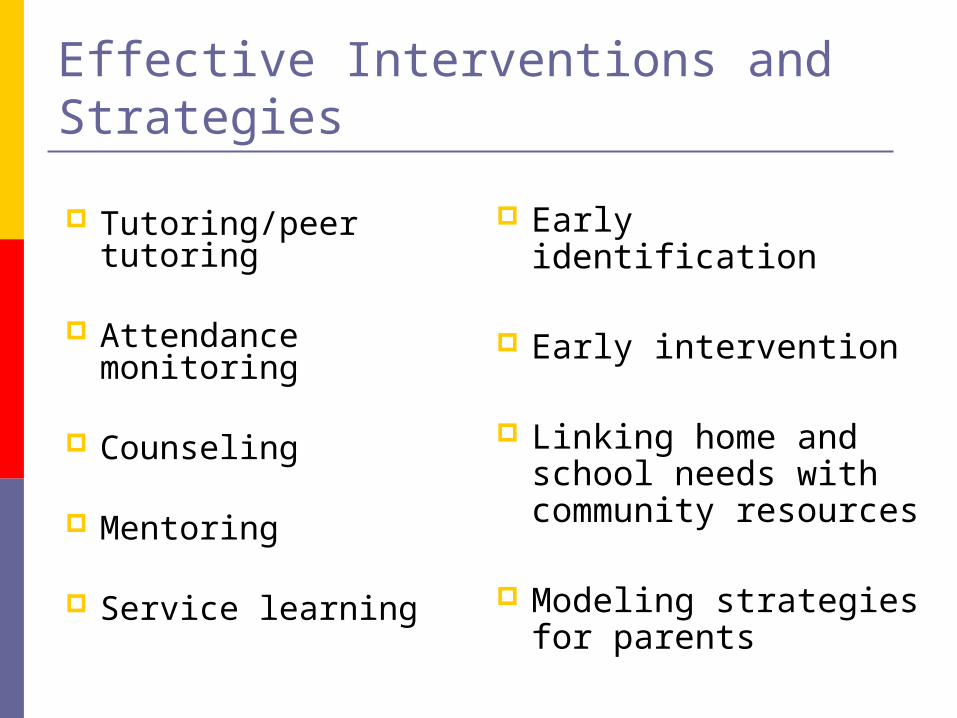
Effective Interventions and Strategies
Tutoring/peer tutoring
Attendance monitoring
Counseling
Mentoring
Service learning
Early identification
Early intervention
Linking home and school needs with community resources
Modeling strategies for parents
Recently Completed andCurrent Research Projects
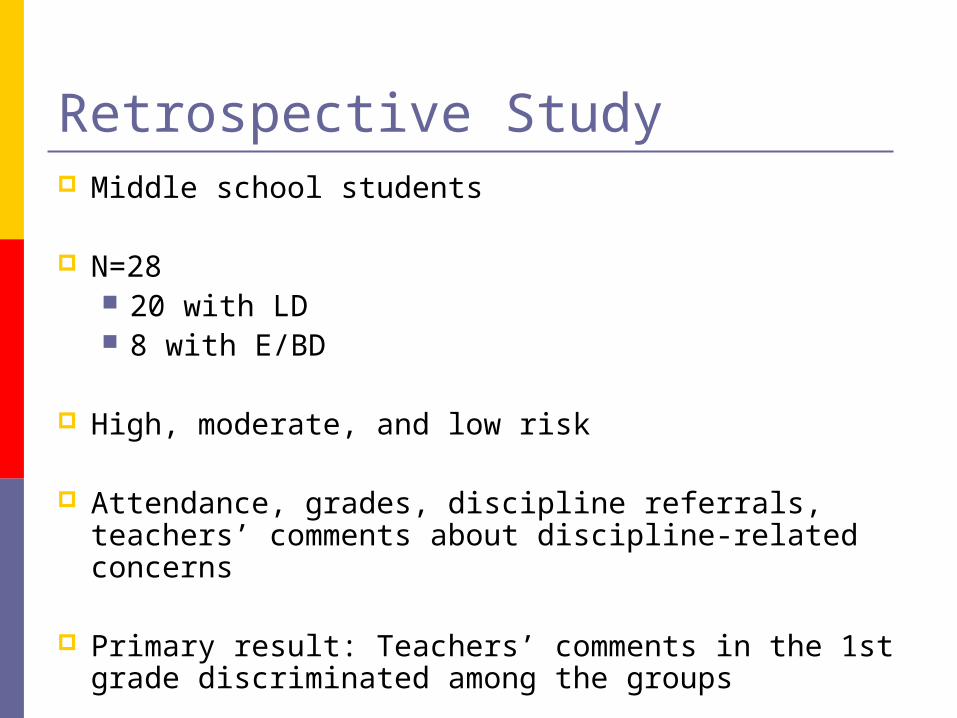
Retrospective Study Middle school students
N=28 20 with LD 8 with E/BD
High, moderate, and low risk
Attendance, grades, discipline referrals, teachers’ comments about discipline-related concerns
Primary result: Teachers’ comments in the 1st grade discriminated among the groups
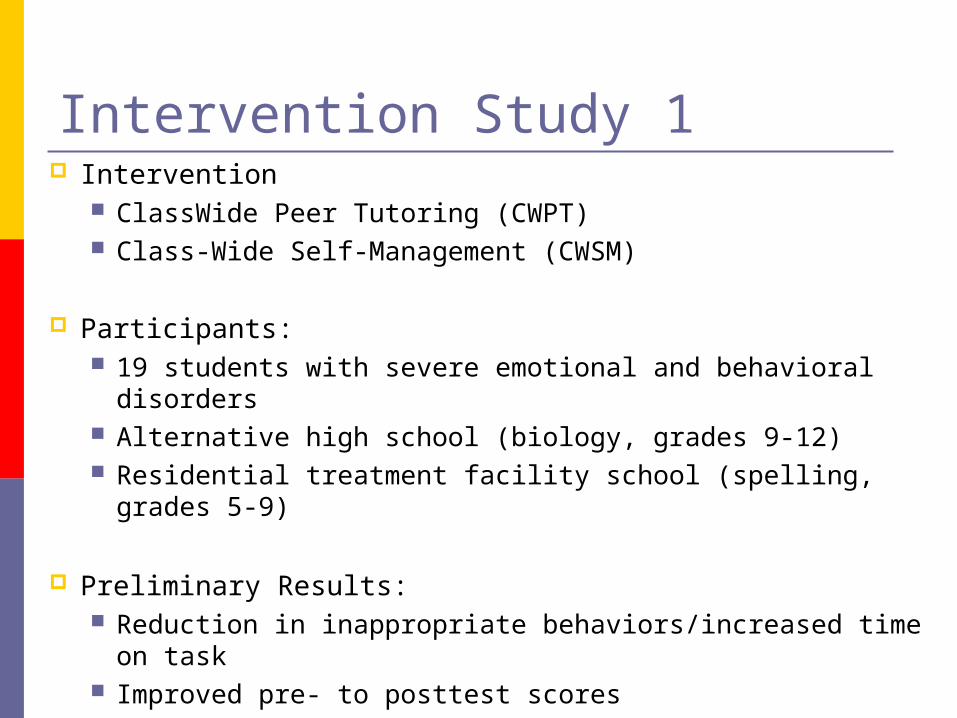
Intervention Study 1 Intervention
ClassWide Peer Tutoring (CWPT) Class-Wide Self-Management (CWSM)
Participants: 19 students with severe emotional and behavioral
disorders Alternative high school (biology, grades 9-12) Residential treatment facility school (spelling, grades 5-
9)
Preliminary Results: Reduction in inappropriate behaviors/increased time on
task Improved pre- to posttest scores
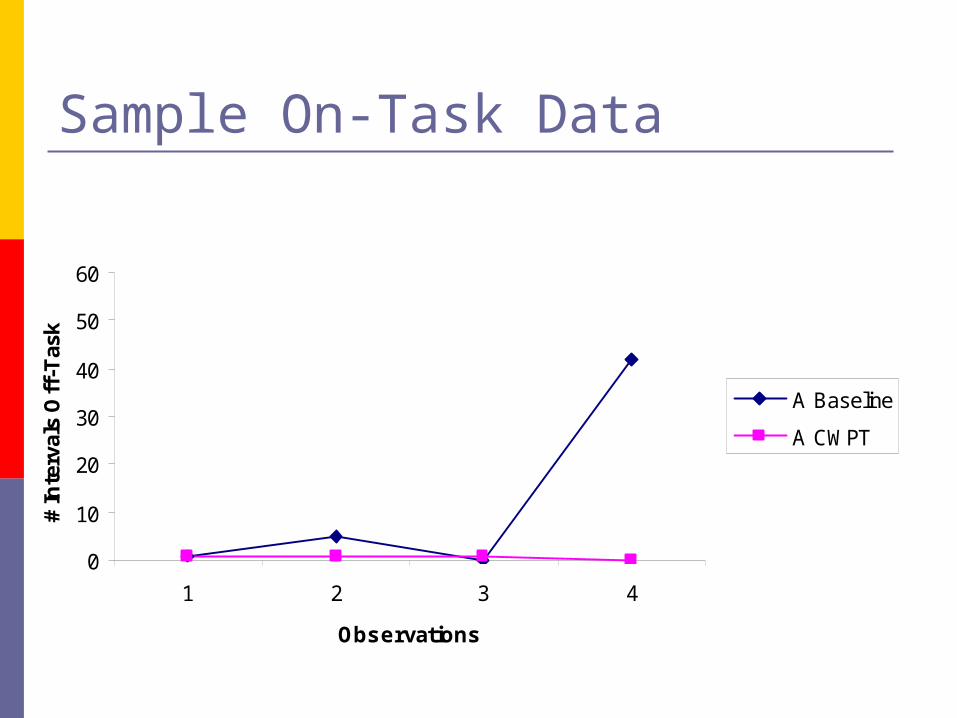
Sample On-Task Data
0
10
20
30
40
50
60
1 2 3 4
Observations
# In
terv
als
Off
-Tas
k
A Baseline
A CWPT
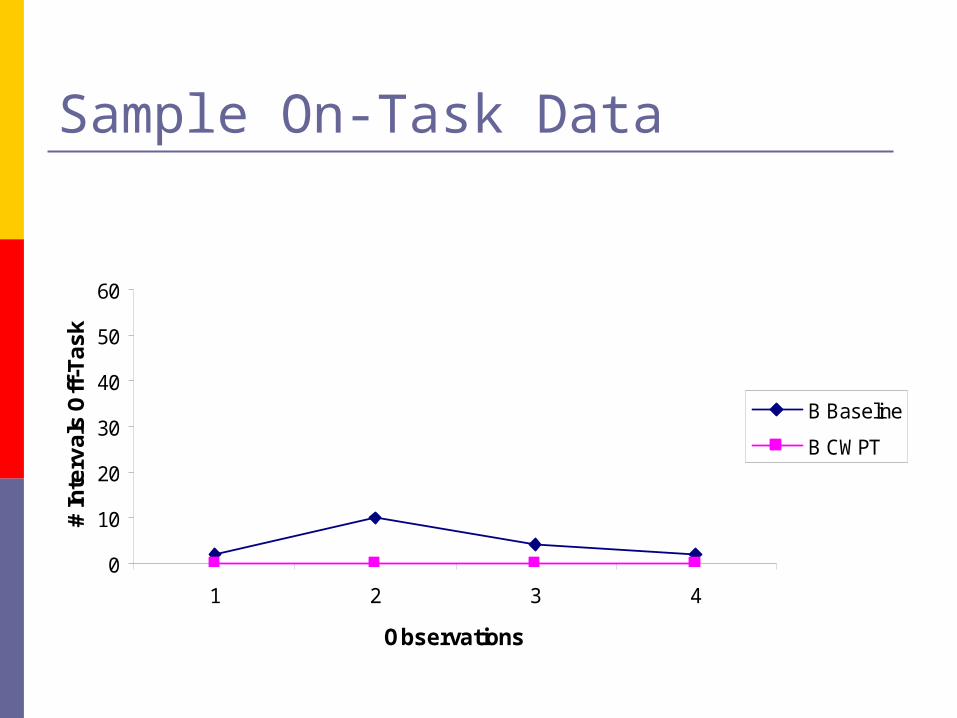
Sample On-Task Data
0
10
20
30
40
50
60
1 2 3 4
Observations
# In
terv
als
Off
-Ta
sk
B Baseline
B CWPT
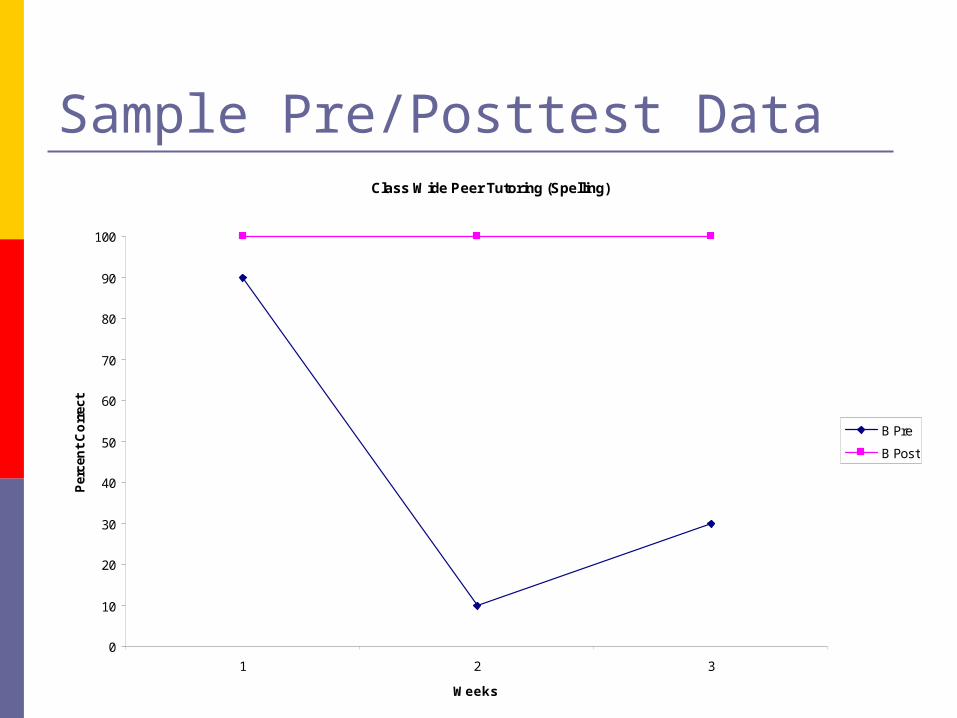
Sample Pre/Posttest DataClass Wide Peer Tutoring (Spelling)
0
10
20
30
40
50
60
70
80
90
100
1 2 3
Weeks
Per
cen
t C
orr
ect
B Pre
B Post
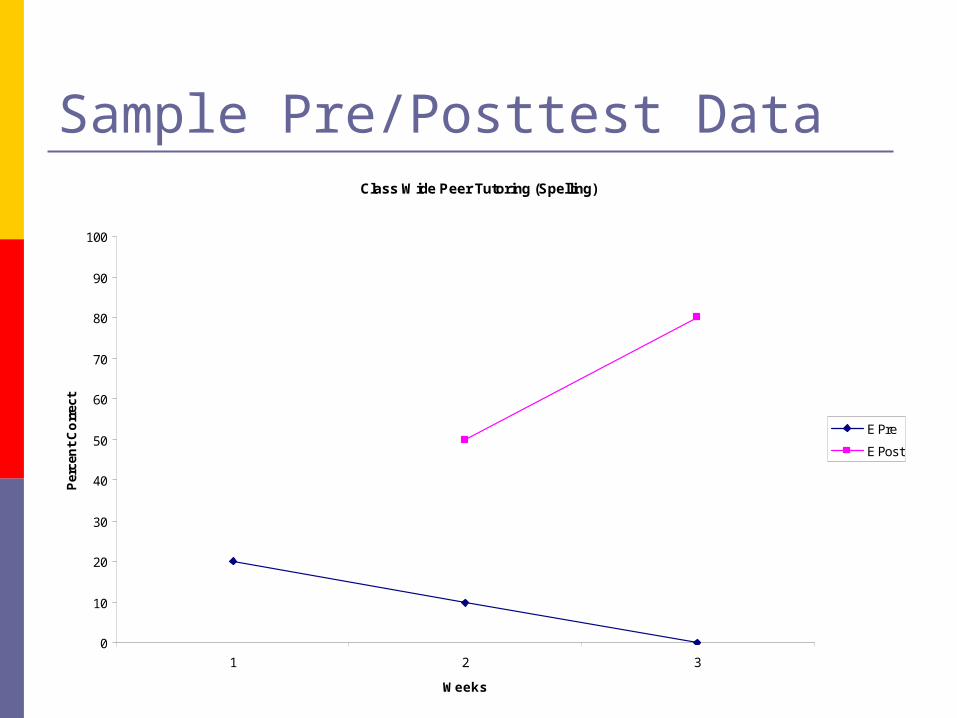
Sample Pre/Posttest DataClass Wide Peer Tutoring (Spelling)
0
10
20
30
40
50
60
70
80
90
100
1 2 3
Weeks
Per
cen
t C
orr
ect
E Pre
E Post
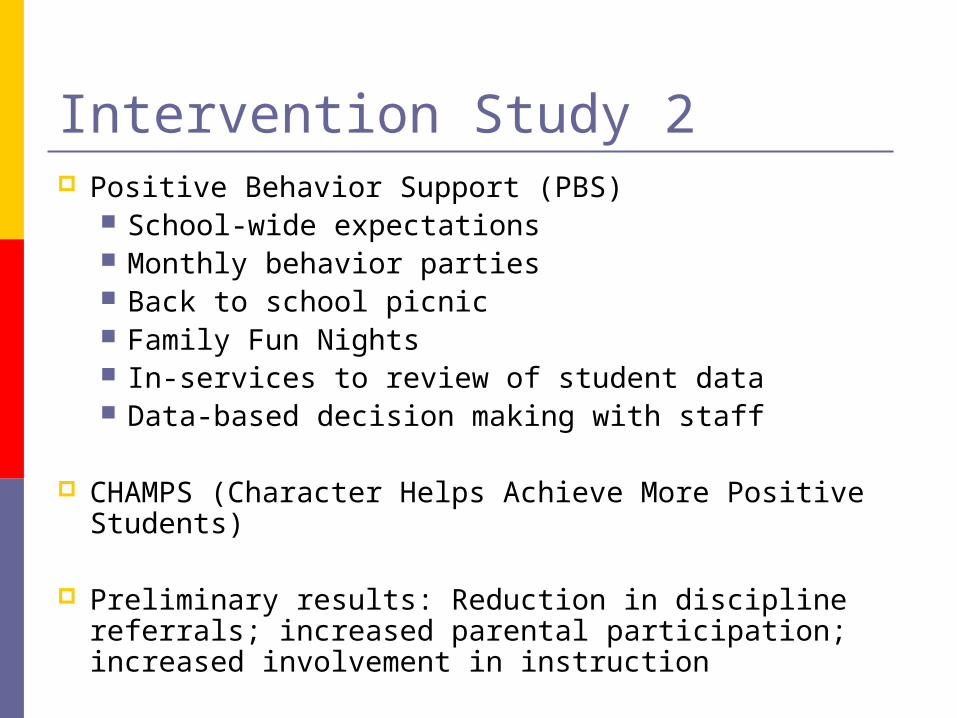
Intervention Study 2 Positive Behavior Support (PBS)
School-wide expectations Monthly behavior parties Back to school picnic Family Fun Nights In-services to review of student data Data-based decision making with staff
CHAMPS (Character Helps Achieve More Positive Students)
Preliminary results: Reduction in discipline referrals; increased parental participation; increased involvement in instruction
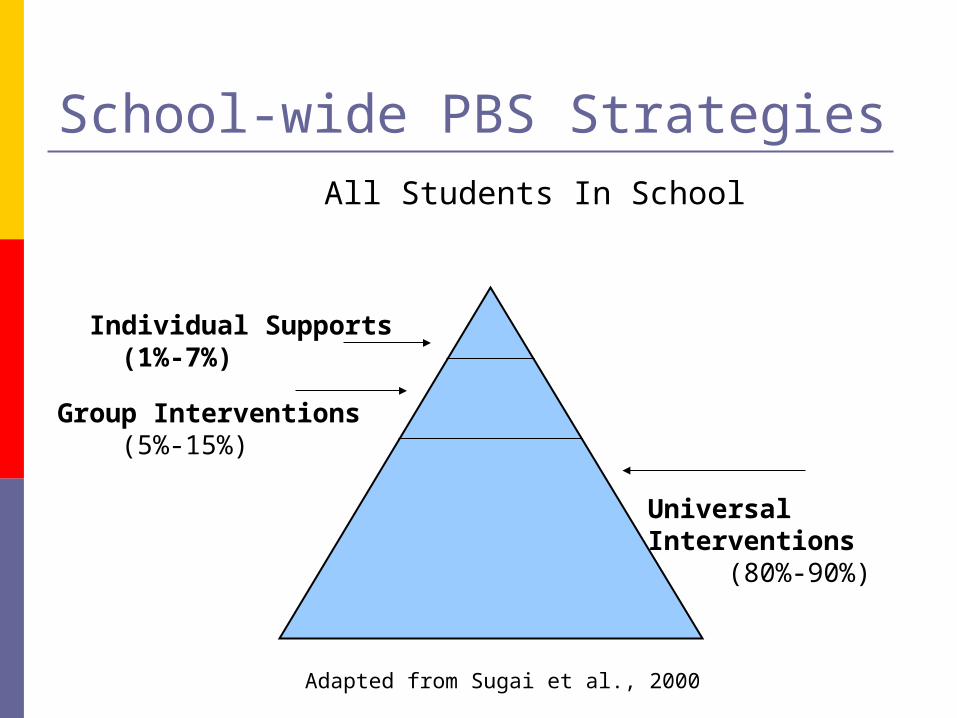
School-wide PBS Strategies All Students In School
Individual Supports (1%-7%)
Group Interventions (5%-15%)
Universal Interventions (80%-90%)
Adapted from Sugai et al., 2000
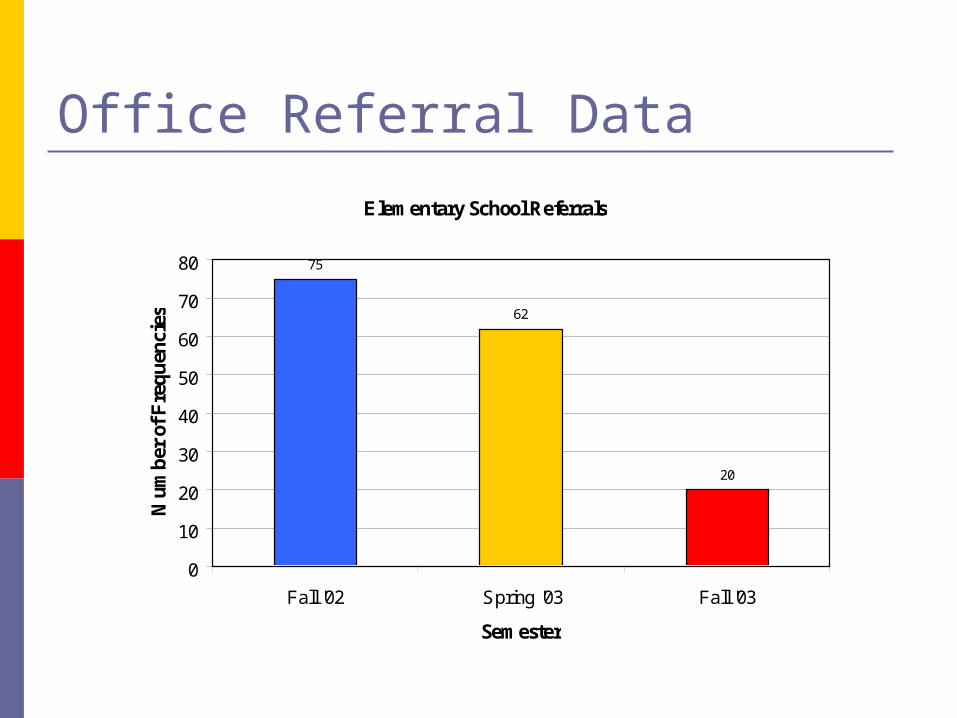
Office Referral Data
Elementary School Referrals
75
62
20
0
10
20
30
40
50
60
70
80
Fall '02 Spring '03 Fall '03
Semester
Num
ber of
Fre
quen
cies

Teacher Preparation/Professional Development Study
LAS ESTRELLAS KU/KSU partnership Secondary content area teachers/English as a
Second Language (ESL) endorsement
Research component focusing on teacher and student outcomes Curriculum-Based Measurement (CBM) Sheltered Instruction Observation Protocol (SIOP) Ecobehavioral System for the Contextual Recording
of Interactional Bilingual Environments (ESCRIBE)
Parent involvement
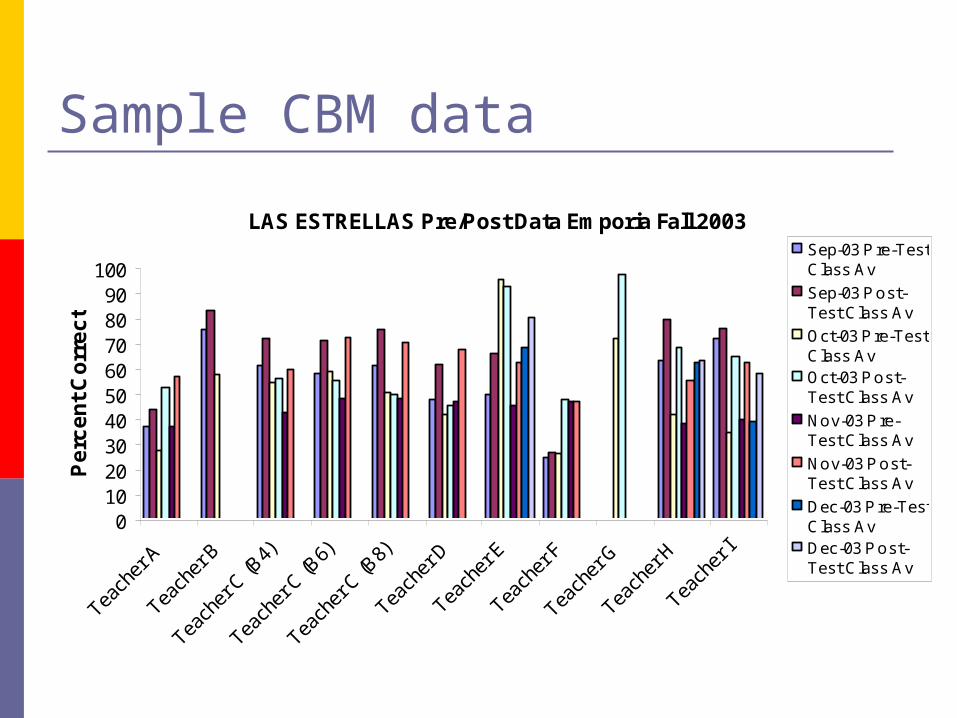
Sample CBM data
LAS ESTRELLAS Pre/Post Data Emporia Fall 2003
0102030405060708090
100
Teach
er A
Teach
er B
Teach
er C
(B4)
Teach
er C
(B6)
Teach
er C
(B8)
Teach
er D
Teach
er E
Teach
er F
Teach
er G
Teach
er H
Teach
er I
Pe
rce
nt
Co
rre
ct
Sep-03 P re-TestClass AvSep-03 P ost-Test Class AvOct-03 P re-TestClass AvOct-03 P ost-Test Class AvNov-03 P re-Test Class AvNov-03 P ost-Test Class AvDec-03 P re-TestClass AvDec-03 P ost-Test Class Av
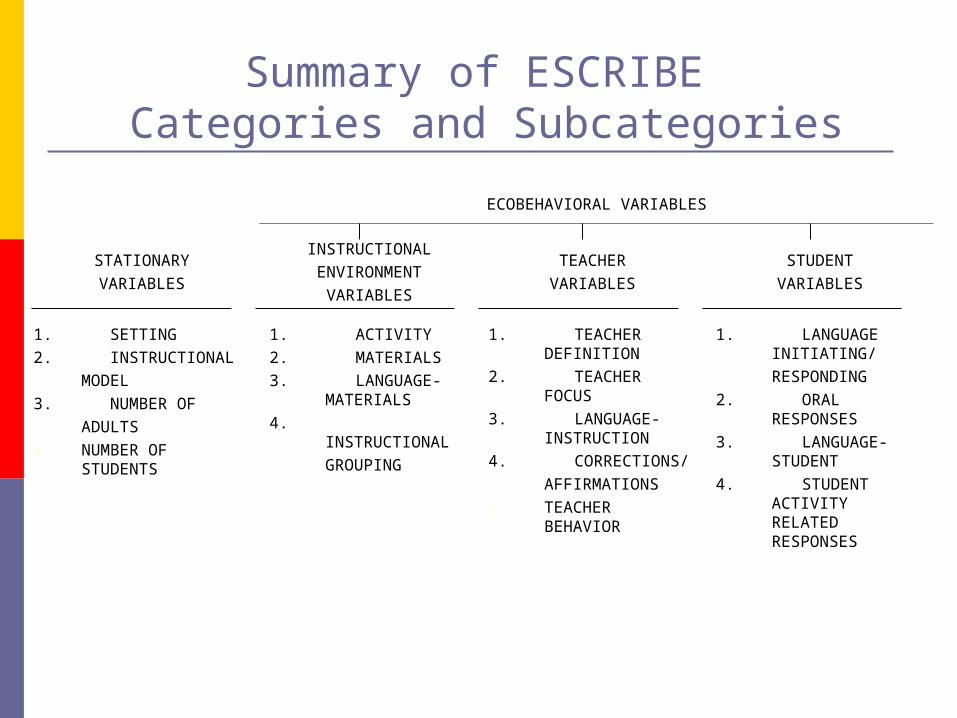
Summary of ESCRIBE Categories and Subcategories
ECOBEHAVIORAL VARIABLES
STATIONARYVARIABLES
INSTRUCTIONALENVIRONMENT
VARIABLES
TEACHERVARIABLES
STUDENTVARIABLES
1. SETTING2. INSTRUCTIONAL
MODEL3. NUMBER OF
ADULTS4. NUMBER OF
STUDENTS
1. ACTIVITY2. MATERIALS3. LANGUAGE-
MATERIALS4. INSTRUCTIONAL
GROUPING
1. TEACHER DEFINITION
2. TEACHER FOCUS3. LANGUAGE-
INSTRUCTION4. CORRECTIONS/
AFFIRMATIONS5. TEACHER
BEHAVIOR
1. LANGUAGE INITIATING/RESPONDING
2. ORAL RESPONSES3. LANGUAGE-
STUDENT4. STUDENT ACTIVITY
RELATED RESPONSES
Ideas for Educators
Establish, communicate, model and reinforce appropriate behaviors
Set and communicate high expectations
Communicate with families
Help students with decision-making and goal setting
Help students explore career and postsecondary educational options
Catch ‘em being good!
Tools for Educators Academic
ClassWide Peer Tutoring (CWPT)
Curriculum-based Measurement (CBM)
Behavioral Systematic
Screening for Behavior Disorders (SSBD)
Positive Behavior Support (PBS)
The Good Student Game
Tough Kid Toolkit

Contact Information
Lisa J. Bowman, Ph.D.Research Assistant Professor
Juniper Gardens Children’s ProjectUniversity of Kansas
650 Minnesota Avenue, Second FloorKansas City, KS 66101
(913) 321-3143 (ext. 235)[email protected]
www.jgcp.ku.edu