Embed Size (px)
Citation preview
Droplets Size and Velocity Measurements in a Spray from a
Common Rail System for DI Diesel Engines
L. Allocca, S.Alfuso, M.Auriemma, G. ValentinoIstituto Motori – CNR, Napoli - ITALY
ISTITUTO MOTORI
Istanbul - Nov. 13th-14th
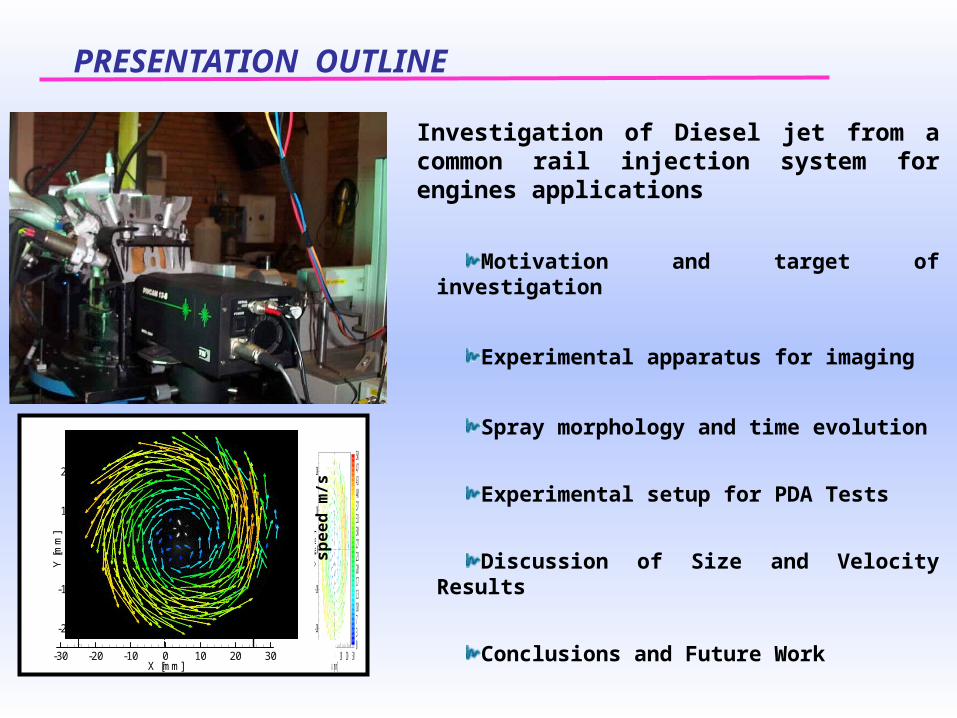
Investigation of Diesel jet from a common rail injection system for engines applications
Motivation and target of investigation
Experimental apparatus for imaging
Spray morphology and time evolution
Experimental setup for PDA Tests
Discussion of Size and Velocity Results
Conclusions and Future Work
PRESENTATION OUTLINE
X [mm]
Y[m
m]
-30 -20 -10 0 10 20 30
-20
-10
0
10
2050474340373330272320171310730
sp
eed
m/s
X [mm]
Y[m
m]
-30 -20 -10 0 10 20 30
-20
-10
0
10
20
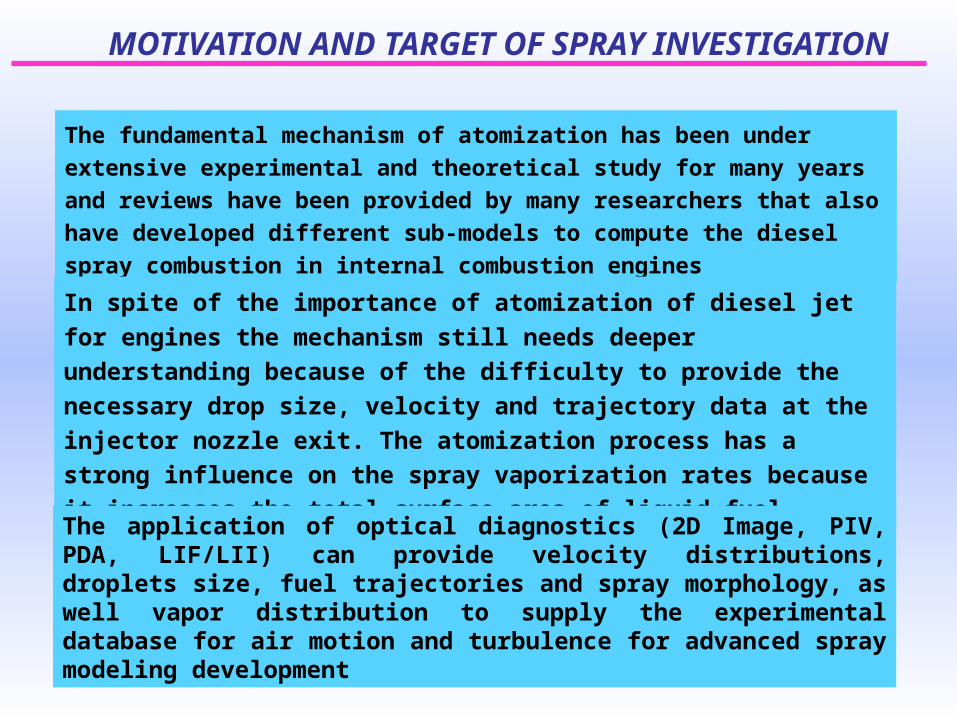
The fundamental mechanism of atomization has been under extensive experimental
and theoretical study for many years and reviews have been provided by many
researchers that also have developed different sub-models to compute the diesel
spray combustion in internal combustion engines
MOTIVATION AND TARGET OF SPRAY INVESTIGATION
In spite of the importance of atomization of diesel jet for engines the mechanism
still needs deeper understanding because of the difficulty to provide the
necessary drop size, velocity and trajectory data at the injector nozzle exit. The
atomization process has a strong influence on the spray vaporization rates
because it increases the total surface area of liquid fuel
The application of optical diagnostics (2D Image, PIV, PDA, LIF/LII) can provide velocity distributions, droplets size, fuel trajectories and spray morphology, as well vapor distribution to supply the experimental database for air motion and turbulence for advanced spray modeling development
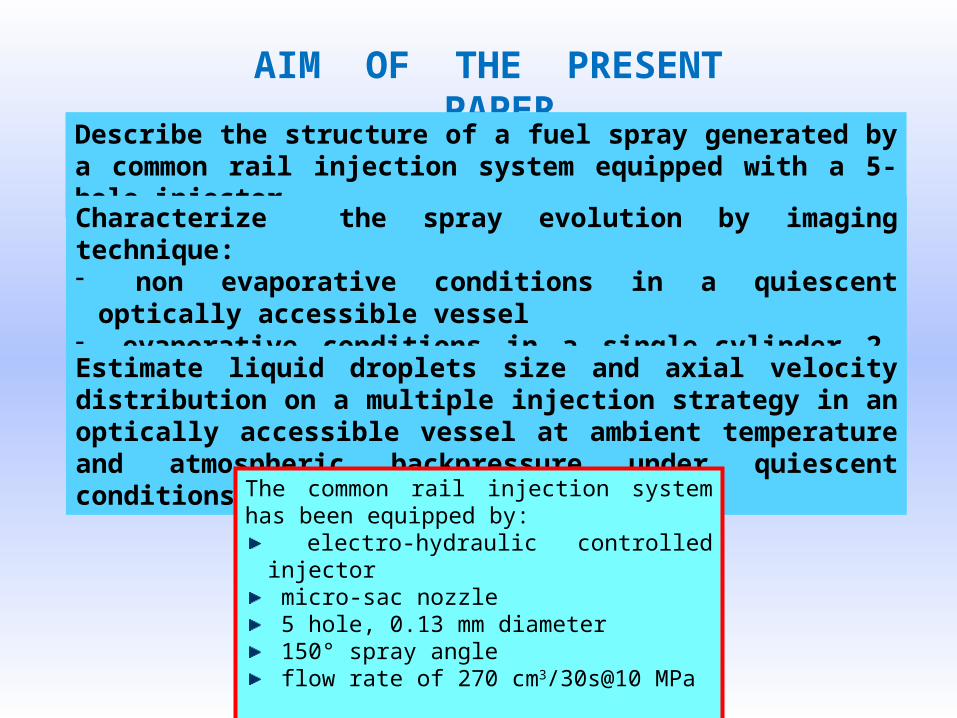
AIM OF THE PRESENT PAPER
Describe the structure of a fuel spray generated by a common rail injection system equipped with a 5-hole injector
Characterize the spray evolution by imaging technique:- non evaporative conditions in a quiescent optically accessible vessel- evaporative conditions in a single-cylinder 2-stroke direct injection
diesel engine provided of optical accesses to the combustion chamber
Estimate liquid droplets size and axial velocity distribution on a multiple injection strategy in an optically accessible vessel at ambient temperature and atmospheric backpressure under quiescent conditions
The common rail injection system has been equipped by:
electro-hydraulic controlled injector micro-sac nozzle 5 hole, 0.13 mm diameter 150° spray angle flow rate of 270 cm3/30s@10 MPa
EXPERIMENTAL SET-UP & OPERATIVE CONDITIONS
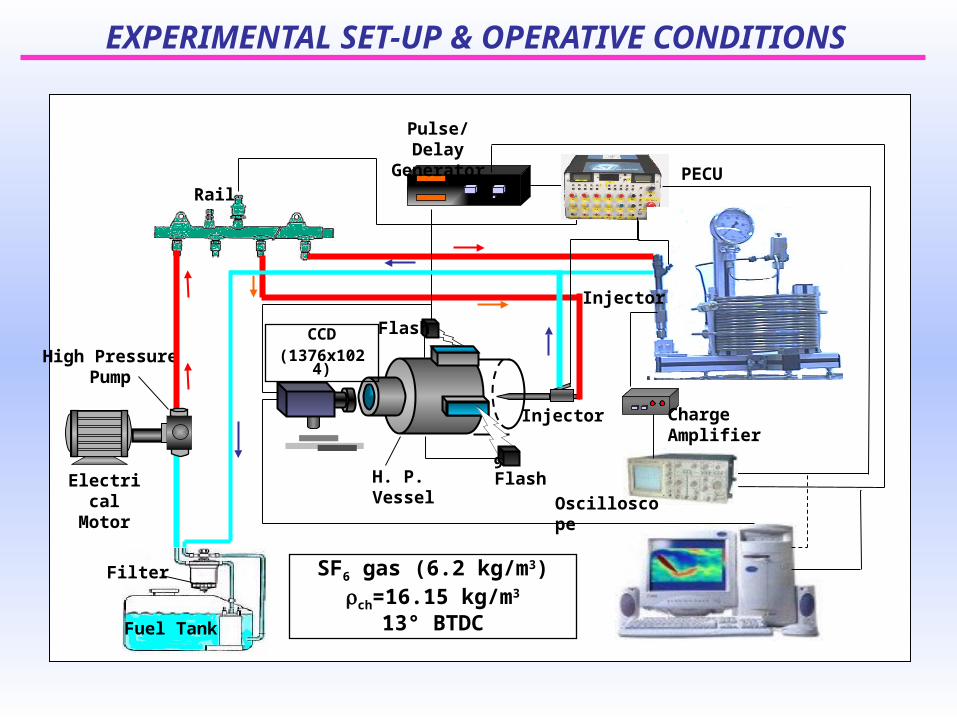
High PressurePump
RailPECU
Pulse/DelayGenerator
Oscilloscope
Fuel Tank
Filter
ElectricalMotor
Injector
ChargeAmplifier19
Injector
CCD(1376x1024)
FlashH. P. Vessel
Flash
SF6 gas (6.2 kg/m3)rch=16.15 kg/m3
13° BTDC
EXPERIMENTAL SET-UP & OPERATIVE CONDITIONS
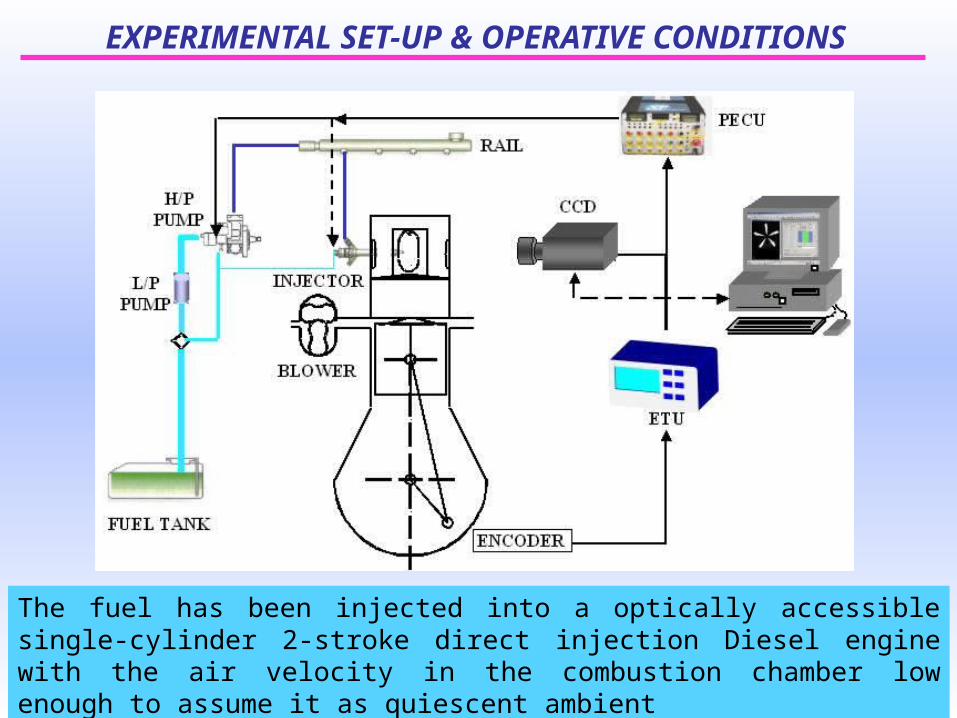
The fuel has been injected into a optically accessible single-cylinder 2-stroke direct injection Diesel engine with the air velocity in the combustion chamber low enough to assume it as quiescent ambient
EXPERIMENTAL SET-UP & OPERATIVE CONDITIONS
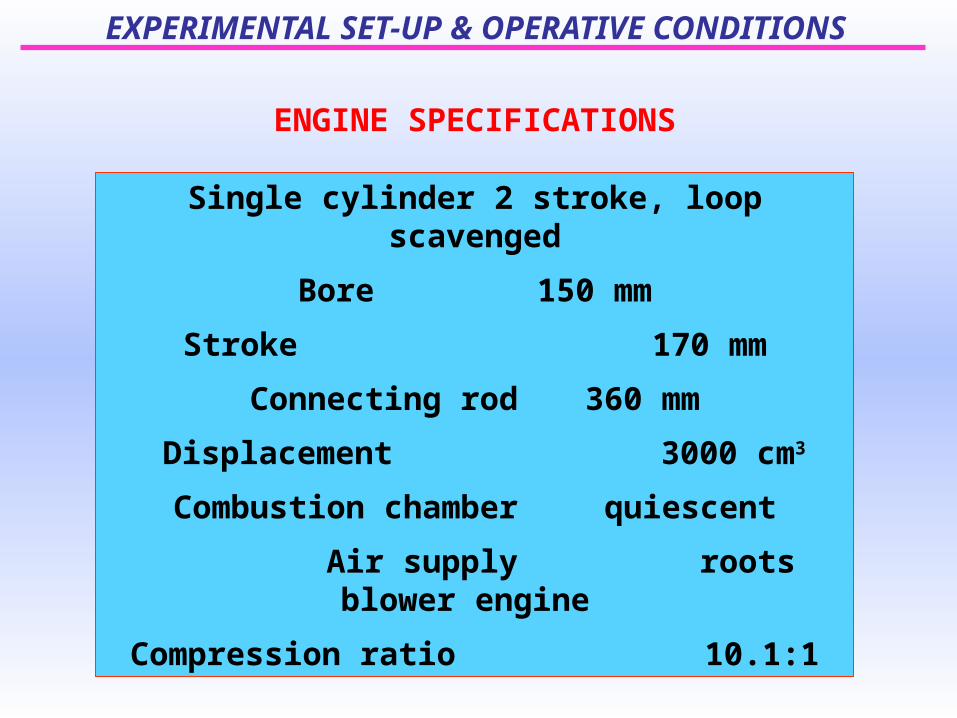
EXPERIMENTAL SET-UP & OPERATIVE CONDITIONS
Single cylinder 2 stroke, loop scavenged
Bore 150 mm
Stroke 170 mm
Connecting rod 360 mm
Displacement 3000 cm3
Combustion chamber quiescent
Air supply roots blower engine
Compression ratio 10.1:1
ENGINE SPECIFICATIONS
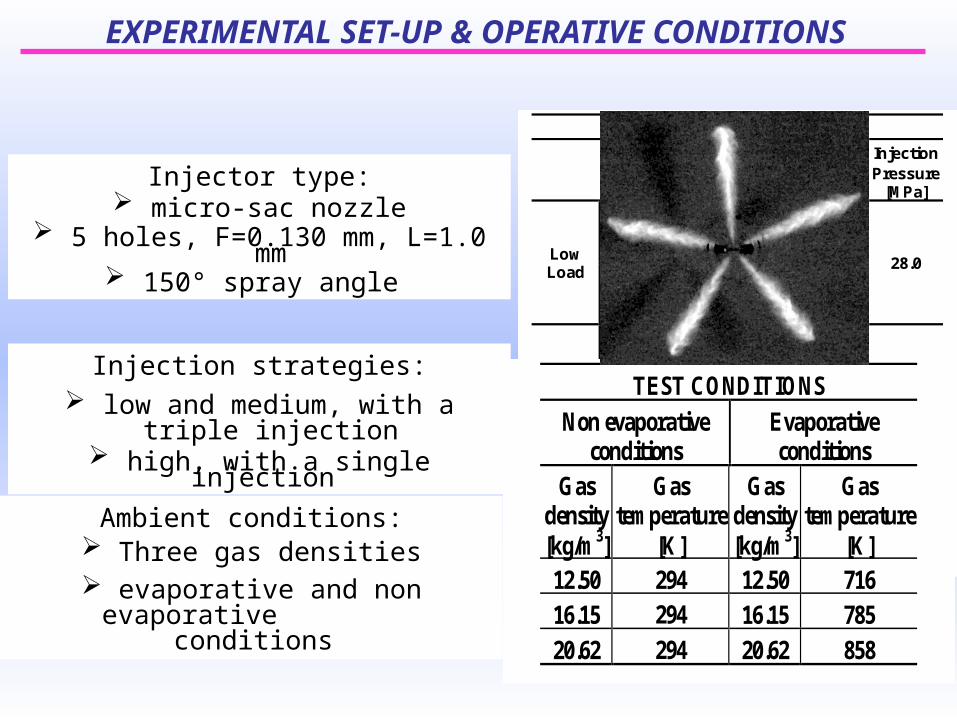
Injector type: micro-sac nozzle
5 holes, F=0.130 mm, L=1.0 mm 150° spray angle
Injection strategies: low and medium, with a triple injection
high, with a single injection
INJECTION STRATEGIES
Pilot Pre Main dw1 [s]
dw2 [s]
Injection Pressure
[MPa]
Solenoid exciting time [s]
375 375 480 Low Load Fuel
injected [mg/str]
0.66 1.15 1.5
200 240 28.0
Solenoid exciting time [s]
270 275 515 Medium
Load Fuel injected [mg/str]
1.65 2.06 8.51
230 230 71.0
Solenoid exciting time [s]
- - 685 High Load Fuel
injected [mg/str]
- - 26.7
- - 140.0
Ambient conditions: Three gas densities
evaporative and non evaporative conditions
TEST CONDITIONS
Non evaporative conditions
Evaporative conditions
Gas density [kg/m3]
Gas temperature
[K]
Gas density [kg/m3]
Gas temperature
[K] 12.50 294 12.50 716 16.15 294 16.15 785 20.62 294 20.62 858
EXPERIMENTAL SET-UP & OPERATIVE CONDITIONS
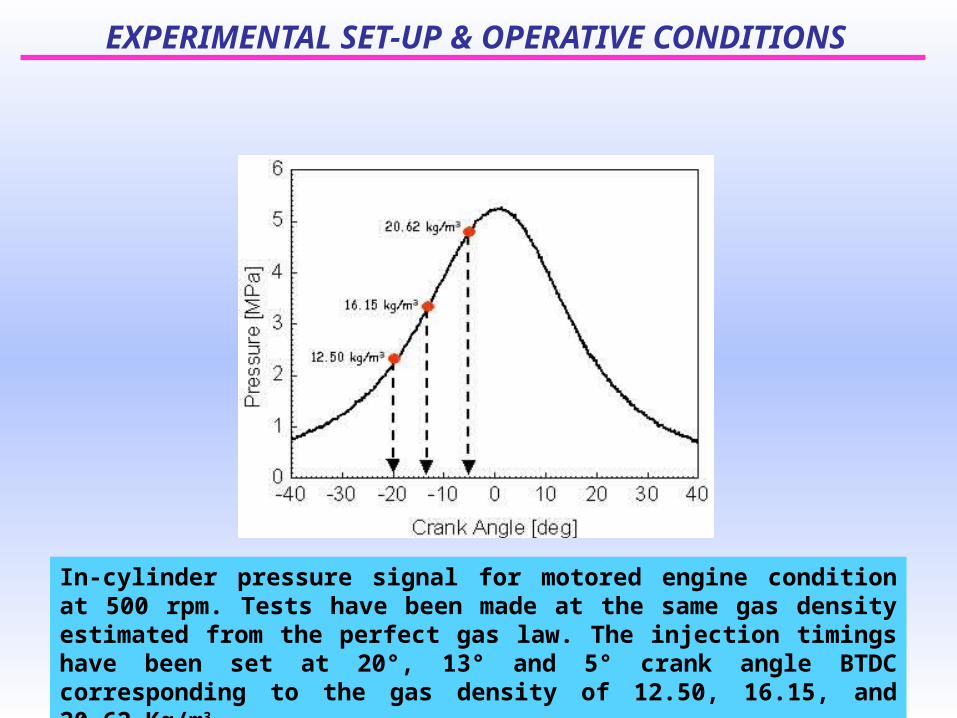
EXPERIMENTAL SET-UP & OPERATIVE CONDITIONS
In-cylinder pressure signal for motored engine condition at 500 rpm. Tests have been made at the same gas density estimated from the perfect gas law. The injection timings have been set at 20°, 13° and 5° crank angle BTDC corresponding to the gas density of 12.50, 16.15, and 20.62 Kg/m3

Jets dispersion measurements
SPRAY CHARACTERIZATION: MORPHOLOGY & EVOLUTION
1 2 3 4 50
5
10
15
20
25
30
35
1 2 3 4 5 1 2 3 4 5
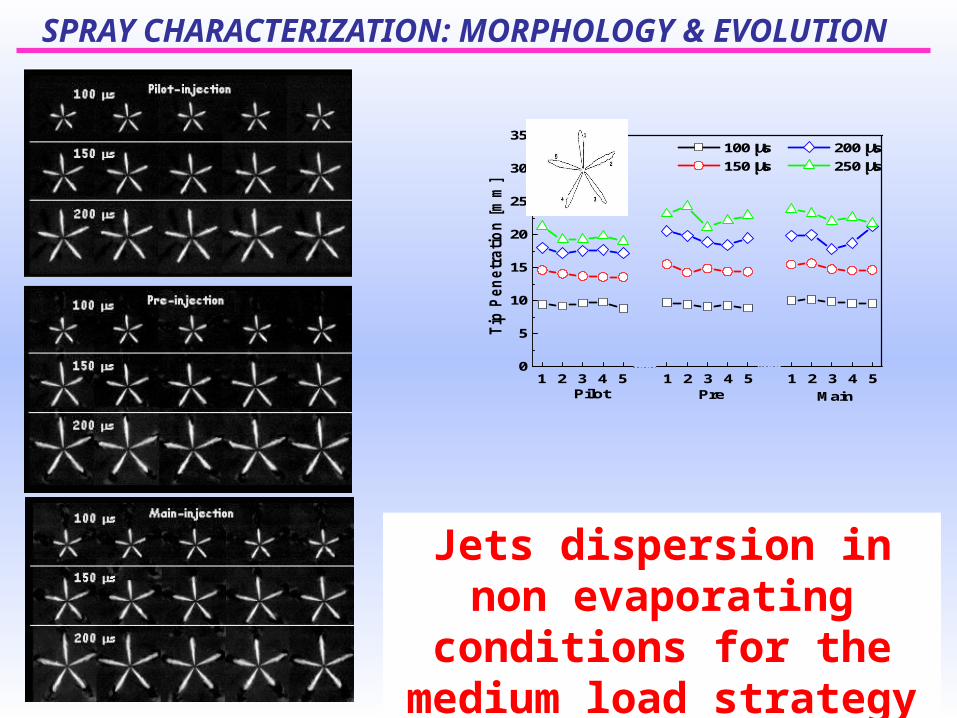
100 s 200 s 150 s 250 s
Pilot
Tip
Pen
etr
ati
on
[m
m]
Main Pre
Jets dispersion in non evaporating conditions for the medium load strategy
SPRAY CHARACTERIZATION: MORPHOLOGY & EVOLUTION
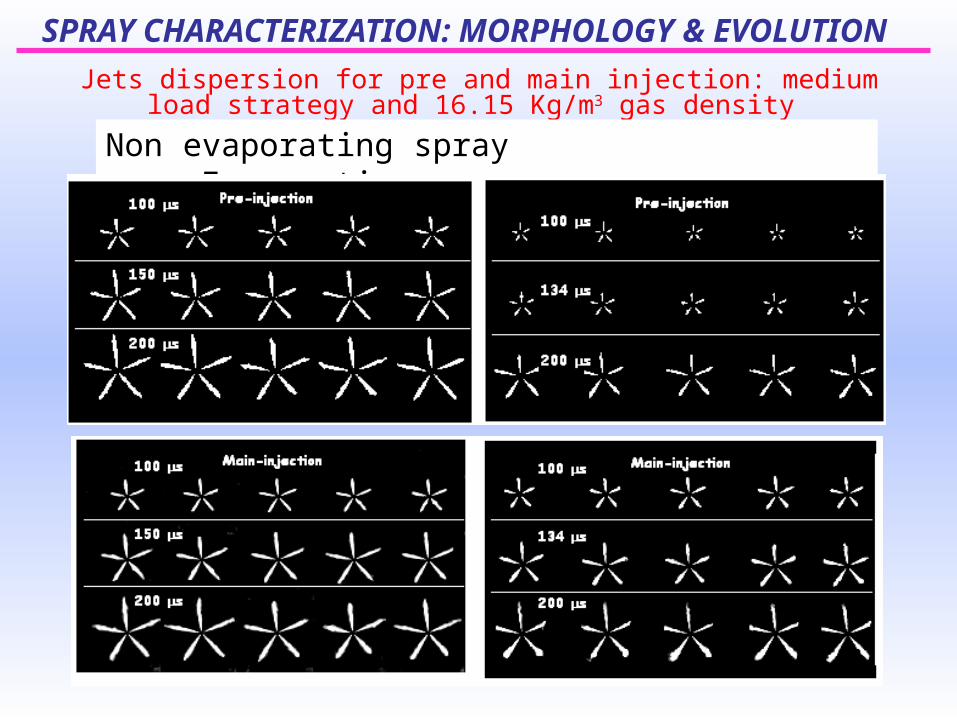
Jets dispersion for pre and main injection: medium load strategy and 16.15 Kg/m3 gas density
Non evaporating spray Evaporating spray
SPRAY CHARACTERIZATION: MORPHOLOGY & EVOLUTION
0 100 200 300 4000
5
10
15
20
25
30
35
0 100 200 300 400 0 100 200 300 400
Medium Load Strategy
Pilot
Ave
rag
ed
Tip
Pen
etr
ati
on
[m
m]
g=20.62 kg/m3
g=16.15 kg/m3
g=12.50 kg/m3
Pre
Time after SOI [s]
Non-evaporating spray
Main
0 100 200 300 4000
5
10
15
20
25
30
35
0 100 200 300 400 0 100 200 300 400
Medium Load Strategy
Pilot
Ave
rag
ed
Tip
Pen
etr
ati
on
[m
m] g=20.62 kg/m3
g=16.15 kg/m3
g=12.50 kg/m3
Pre
Time after SOI [s]
Evaporating spray
Main
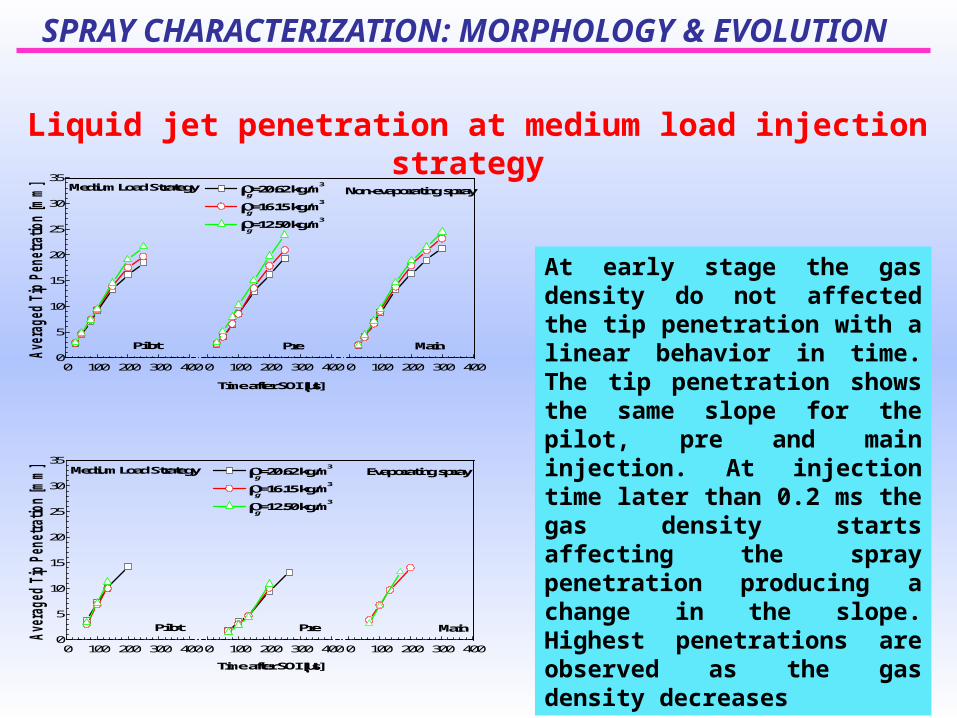
Liquid jet penetration at medium load injection strategy
SPRAY CHARACTERIZATION: MORPHOLOGY & EVOLUTION
At early stage the gas density do not affected the tip penetration with a linear behavior in time. The tip penetration shows the same slope for the pilot, pre and main injection. At injection time later than 0.2 ms the gas density starts affecting the spray penetration producing a change in the slope. Highest penetrations are observed as the gas density decreases
0 100 200 300 4000
5
10
15
20
25
30
35Non-evaporating spray
High Load Strategy
g=20.62 kg/m3
g=16.15 kg/m3
g=12.50 kg/m3
Ave
raged T
ip P
enetr
atio
n [m
m]
Time after SOI [s]
0 100 200 300 4000
5
10
15
20
25
30
35Evaporating spray
High Load Strategy
g=20.62 kg/m3
g=16.15 kg/m3
g=12.50 kg/m3
Ave
raged T
ip P
enetr
atio
n [m
m]
Time after SOI [s]
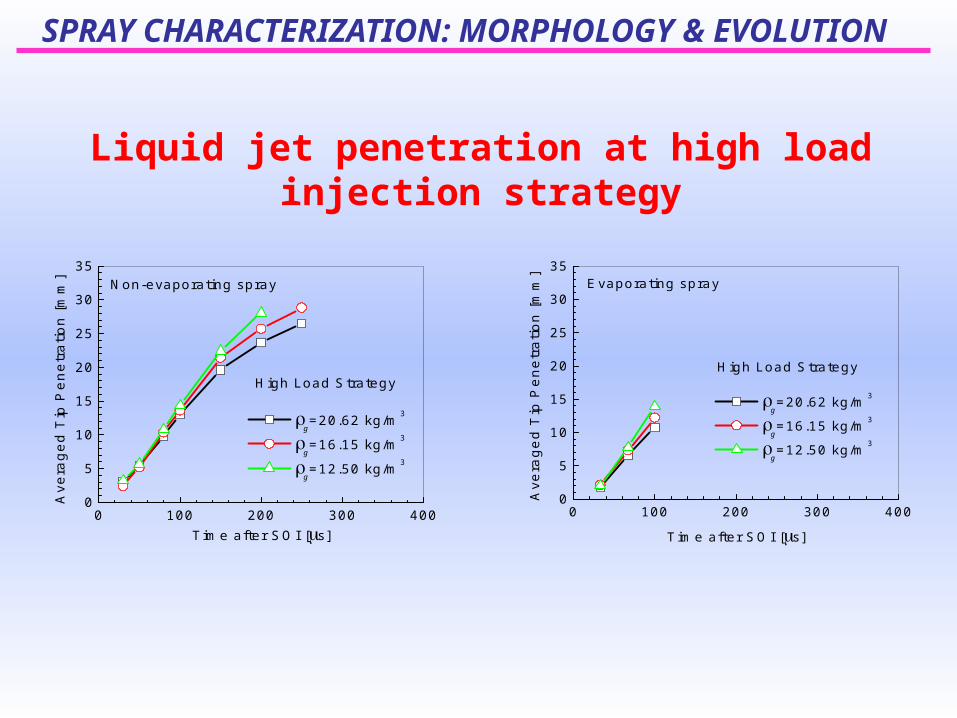
Liquid jet penetration at high load injection strategy
SPRAY CHARACTERIZATION: MORPHOLOGY & EVOLUTION
0 200 400 600 800 1000 1200 1400 16000
10
20
30
40
50
60
70
80
High Load Strategy
Non-evaporating spray
g = 20.62 kg/m3
g= 16.15 kg/m3
g= 12.50 kg/m3
Tip Pe
netrat
ion [m
m]
Time after SOI [s]
Main
0 200 400 600 800 1000 1200 1400 16000
40
80
120
160
200Non-evaporating spray
High Load Strategy
g=20.62 kg/m3
g=16.15 kg/m3
g=12.50 kg/m3
Mean
Tip
Sp
eed
[m
/s]
Time after SOI [s]
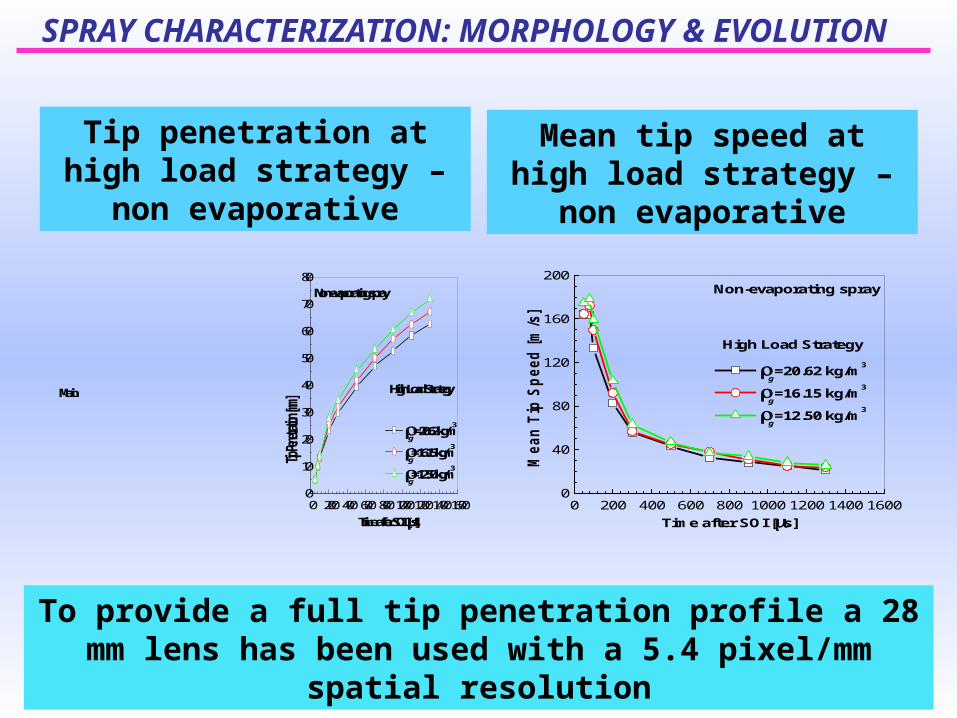
Tip penetration at high load strategy – non evaporative
Mean tip speed at high load strategy – non evaporative
To provide a full tip penetration profile a 28 mm lens has been used with a 5.4 pixel/mm spatial resolution
SPRAY CHARACTERIZATION: MORPHOLOGY & EVOLUTION
Droplet size and velocity measurements
SPRAY CHARACTERIZATION: SIZE & VELOCITY RESULTS
ECU
H/P PUMP
SPECTRUM ANALYZER PHOTOMULTIPLIERS
EXTERNAL INPUT
ARGON-ION LASER
30°
SYNCHRONIZER
ENCODER
TRANSMITTER
RECEIVER
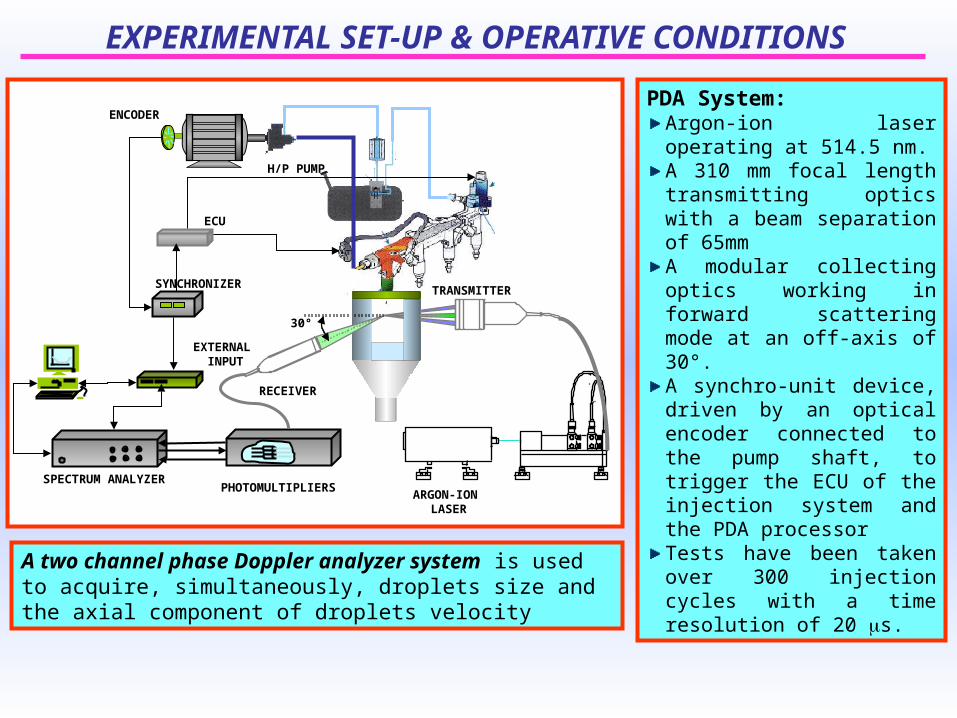
PDA System:Argon-ion laser operating at 514.5 nm.A 310 mm focal length transmitting optics with a beam separation of 65mmA modular collecting optics working in forward scattering mode at an off-axis of 30°.A synchro-unit device, driven by an optical encoder connected to the pump shaft, to trigger the ECU of the injection system and the PDA processorTests have been taken over 300 injection cycles with a time resolution of 20 s.
A two channel phase Doppler analyzer system is used to acquire, simultaneously, droplets size and the axial component of droplets velocity
EXPERIMENTAL SET-UP & OPERATIVE CONDITIONS
EXPERIMENTAL SET-UP & OPERATIVE CONDITIONS
0 250 500 750 1000 1250 1500 1750 2000 2250 2500
0.0
0.5
1.0
1.5
2.0
Time (s)
inst
. gauge p
ress
ure
[M
Pa]
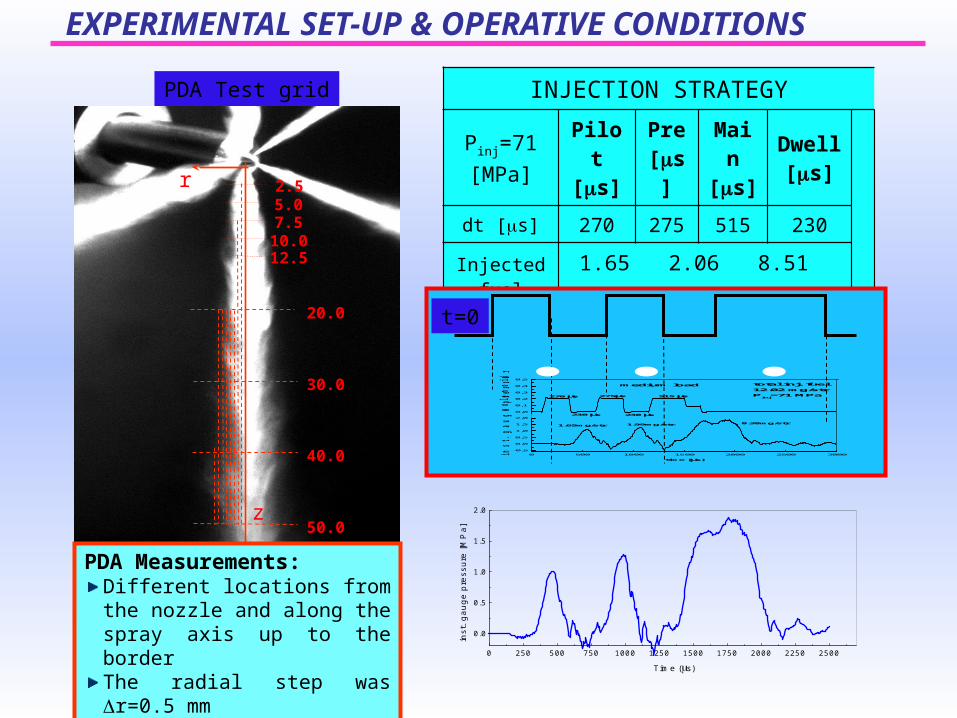
INJECTION STRATEGY
Pinj=71 [MPa]
Pilot [ms]
Pre [ms]
Main [ms]
Dwell [ms]
dt [s] 270 275 515 230
Injected fuel
[mg/str]
1.65 2.06 8.51
Total fuel 12.22 mg
2.55.07.510.012.5
20.0
30.0
40.0
50.0
PDA Test grid
PDA Measurements:Different locations from the nozzle and along the spray axis up to the borderThe radial step was r=0.5 mm
r
z
0 500 1000 1500 2000 2500 3000
-0,5
0,0
0,5
1,0
1,5
2,0
0,0
0,1
0,2
0,3
0,4
0,5
8.38mg/str1.99mg/str1.65mg/str
in
st. g
au
ge p
ressu
re [M
Pa]
time [s]
515 s275s270 s
230 s230 s
medium load total inj. fuel12.02 mg/strP
inj=71 MPa
so
len
oid
co
rren
t
t=0
SPRAY CHARACTERIZATION: SIZE & VELOCITY RESULTS
0 300 600 900 1200 1500 1800 2100 24000
20
40
60
80
100
120r=0.0 mm
Time [s]
z= 5.0 mm z= 7.5 mm
Axia
l velo
city
[m/s
]
0 300 600 900 1200 1500 1800 2100 24000
5
10
15
20
25
30
Time [s] Main startsPre startsPilot starts
r=0.0 mm
z= 5.0 mm z= 7.5 mm
Dia
mete
r [m
]
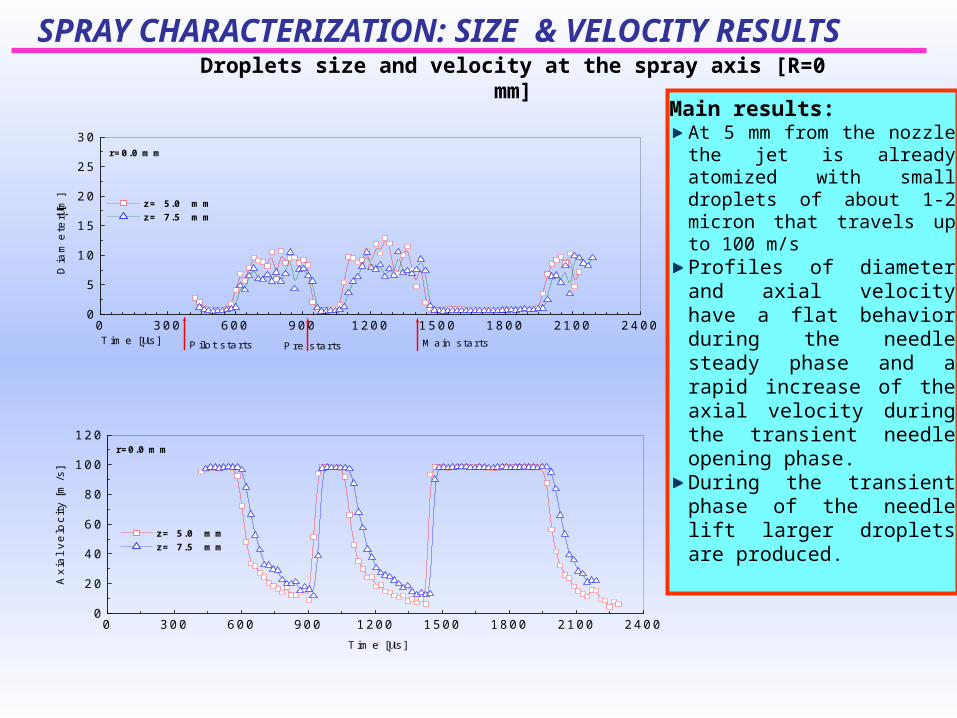
Main results:At 5 mm from the nozzle the jet is already atomized with small droplets of about 1-2 micron that travels up to 100 m/s Profiles of diameter and axial velocity have a flat behavior during the needle steady phase and a rapid increase of the axial velocity during the transient needle opening phase. During the transient phase of the needle lift larger droplets are produced.
Droplets size and velocity at the spray axis [R=0 mm]
SPRAY CHARACTERIZATION: SIZE & VELOCITY RESULTS
0 200 400 600 800 1000 1200 1400 1600 1800 2000 22000
5
10
15
20
25
30r=0.0 mm
Time [s]
z= 5.0 mm z= 7.5 mm z=10.0 mm
Dia
mete
r [m
]
0 200 400 600 800 1000 1200 1400 1600 1800 2000 22000
5
10
15
20
25
30r=0.0 mm
Time (s)
z=12.5 mm z=20.0 mm z=30.0 mm z=40.0 mm
Dia
mete
r (m
)
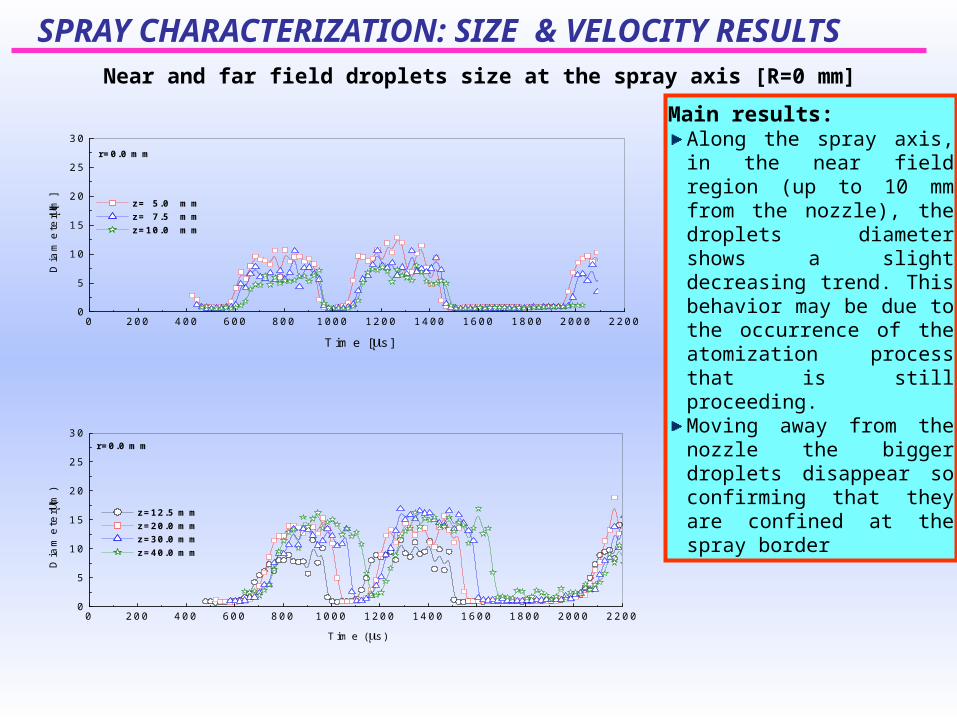
Main results:Along the spray axis, in the near field region (up to 10 mm from the nozzle), the droplets diameter shows a slight decreasing trend. This behavior may be due to the occurrence of the atomization process that is still proceeding. Moving away from the nozzle the bigger droplets disappear so confirming that they are confined at the spray border
Near and far field droplets size at the spray axis [R=0 mm]
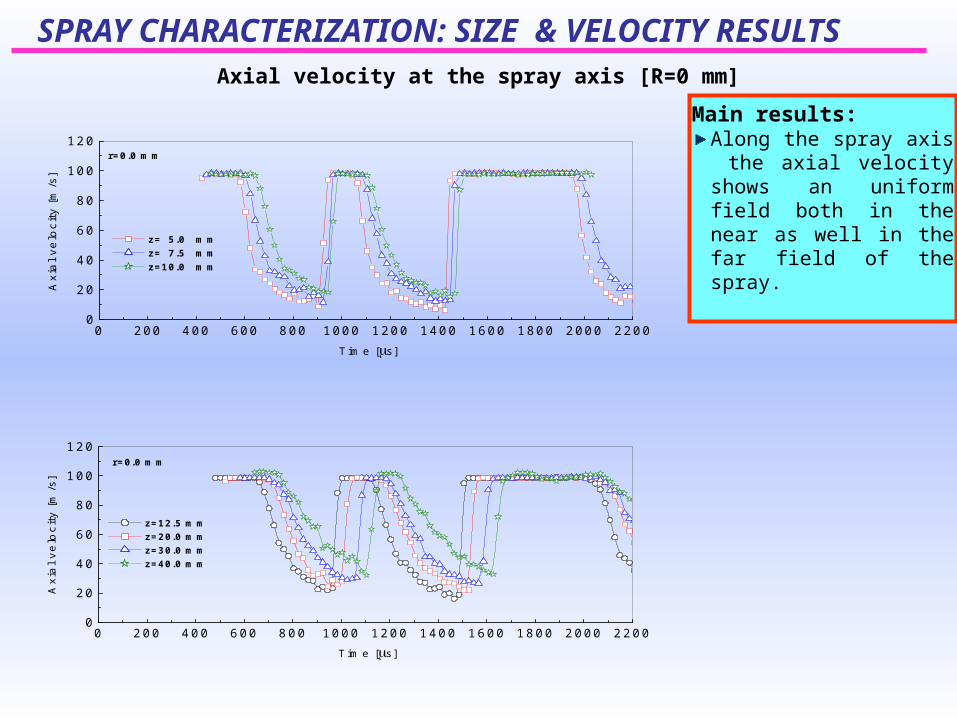
SPRAY CHARACTERIZATION: SIZE & VELOCITY RESULTSAxial velocity at the spray axis [R=0 mm]
0 200 400 600 800 1000 1200 1400 1600 1800 2000 22000
20
40
60
80
100
120r=0.0 mm
Time [s]
z= 5.0 mm z= 7.5 mm z=10.0 mm
Axia
l velo
city
[m/s
]
Main results:Along the spray axis the axial velocity shows an uniform field both in the near as well in the far field of the spray.
0 200 400 600 800 1000 1200 1400 1600 1800 2000 22000
20
40
60
80
100
120r=0.0 mm
Time [s]
z=12.5 mm z=20.0 mm z=30.0 mm z=40.0 mm
Axia
l velo
city
[m/s
]
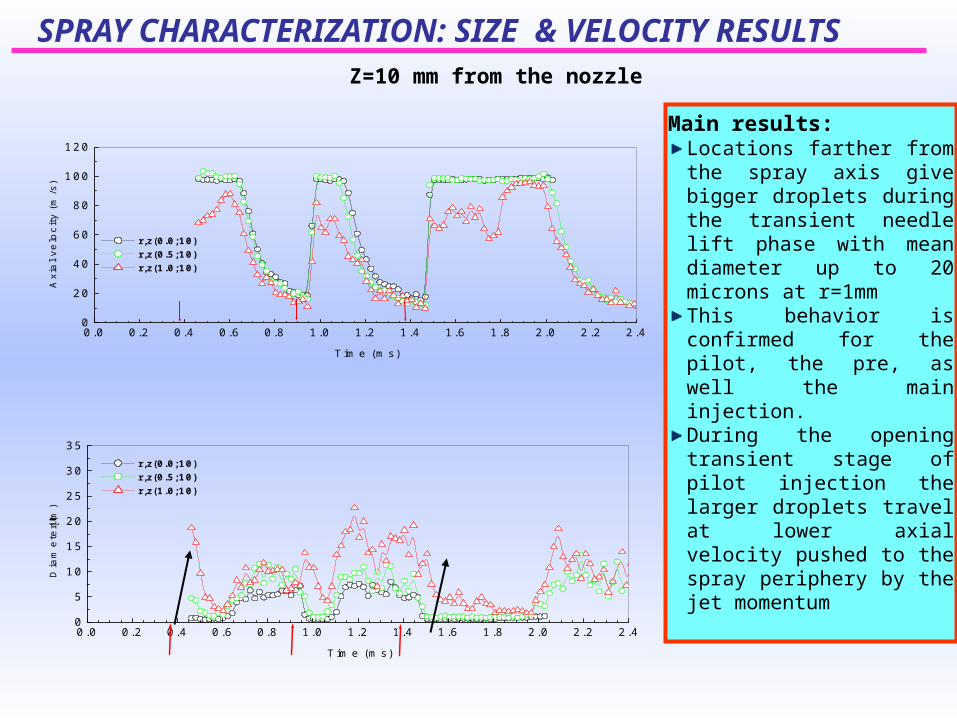
SPRAY CHARACTERIZATION: SIZE & VELOCITY RESULTSZ=10 mm from the nozzle
0.0 0.2 0.4 0.6 0.8 1.0 1.2 1.4 1.6 1.8 2.0 2.2 2.40
5
10
15
20
25
30
35
Time (ms)
r,z(0.0;10) r,z(0.5;10) r,z(1.0;10)
Dia
mete
r (m
)
0.0 0.2 0.4 0.6 0.8 1.0 1.2 1.4 1.6 1.8 2.0 2.2 2.40
20
40
60
80
100
120
Time (ms)
r,z(0.0;10) r,z(0.5;10) r,z(1.0;10)
Axia
l velo
city
(m/s
)
Main results:Locations farther from the spray axis give bigger droplets during the transient needle lift phase with mean diameter up to 20 microns at r=1mmThis behavior is confirmed for the pilot, the pre, as well the main injection.During the opening transient stage of pilot injection the larger droplets travel at lower axial velocity pushed to the spray periphery by the jet momentum
0.0 0.2 0.4 0.6 0.8 1.0 1.2 1.4 1.6 1.8 2.0 2.2 2.40
20
40
60
80
100
120
r,z(0.0;20) r,z(0.5;20) r,z(1.0;20) r,z(1.5;20)
Axia
l velo
cit
y (
m/s
)
Time (ms)
0.0 0.2 0.4 0.6 0.8 1.0 1.2 1.4 1.6 1.8 2.0 2.2 2.4
0
5
10
15
20
25
30
35 r,z(0.0;20) r,z(0.5;20) r,z(1.0;20) r,z(1.5;20)
Dia
mete
r (m
)
Time (ms)
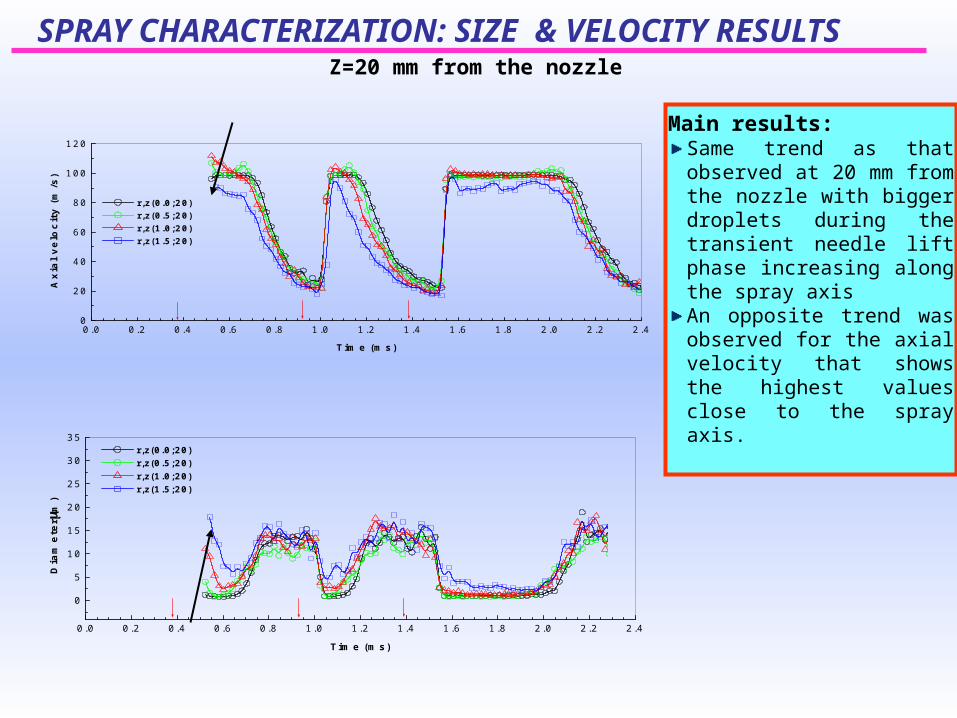
SPRAY CHARACTERIZATION: SIZE & VELOCITY RESULTSZ=20 mm from the nozzle
Main results:Same trend as that observed at 20 mm from the nozzle with bigger droplets during the transient needle lift phase increasing along the spray axis An opposite trend was observed for the axial velocity that shows the highest values close to the spray axis.
0.0 0.2 0.4 0.6 0.8 1.0 1.2 1.4 1.6 1.8 2.0 2.2 2.4 2.6
0
5
10
15
20
25
30
35 r,z(0.0;30) r,z(0.5;30) r,z(1.0;30) r,z(1.5;30)
Dia
mete
r (m
)
Time (ms)
0.0 0.2 0.4 0.6 0.8 1.0 1.2 1.4 1.6 1.8 2.0 2.2 2.4 2.60
20
40
60
80
100
120
r,z(0.0;30) r,z(0.5;30) r,z(1.0;30) r,z(1.5;30)
Axia
l velo
cit
y (
m/s
)
Time (ms)
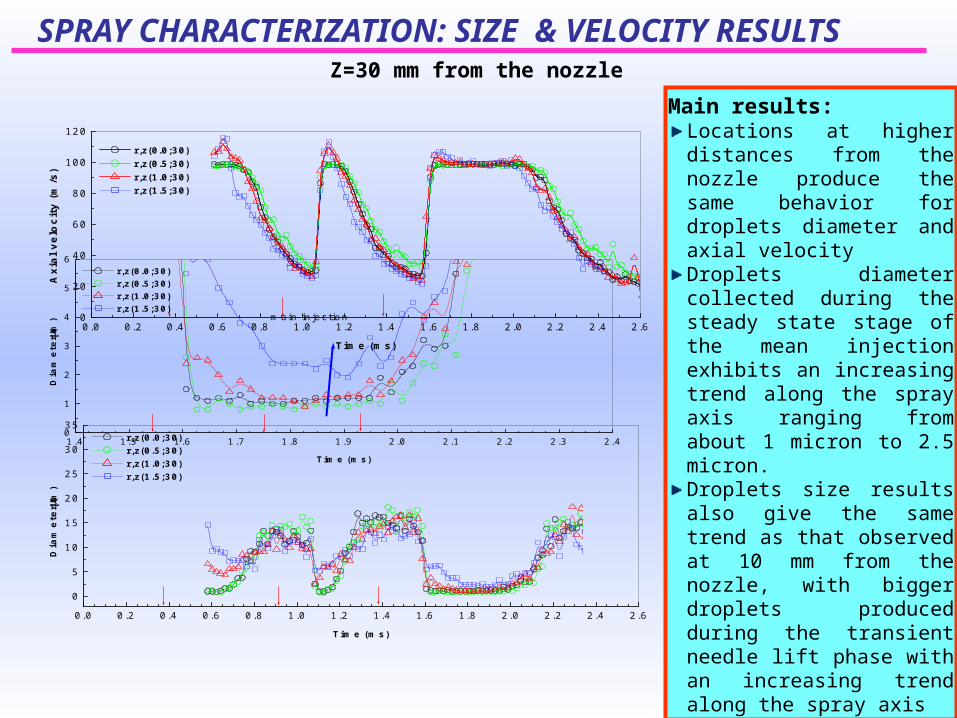
SPRAY CHARACTERIZATION: SIZE & VELOCITY RESULTSZ=30 mm from the nozzle
Main results:Locations at higher distances from the nozzle produce the same behavior for droplets diameter and axial velocity Droplets diameter collected during the steady state stage of the mean injection exhibits an increasing trend along the spray axis ranging from about 1 micron to 2.5 micron. Droplets size results also give the same trend as that observed at 10 mm from the nozzle, with bigger droplets produced during the transient needle lift phase with an increasing trend along the spray axis
1.4 1.5 1.6 1.7 1.8 1.9 2.0 2.1 2.2 2.3 2.40
1
2
3
4
5
6
main injection
r,z(0.0;30) r,z(0.5;30) r,z(1.0;30) r,z(1.5;30)
Dia
mete
r (m
)
Time (ms)
SPRAY CHARACTERIZATION: SIZE & VELOCITY RESULTS
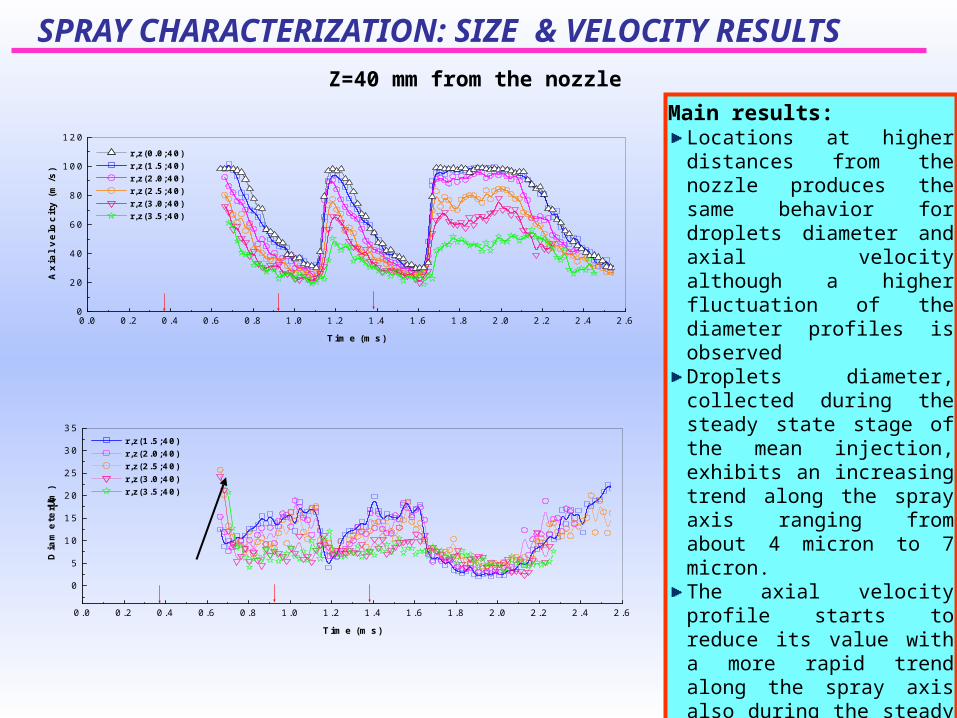
Z=40 mm from the nozzle
0.0 0.2 0.4 0.6 0.8 1.0 1.2 1.4 1.6 1.8 2.0 2.2 2.4 2.60
20
40
60
80
100
120
r,z(0.0;40) r,z(1.5;40) r,z(2.0;40) r,z(2.5;40) r,z(3.0;40) r,z(3.5;40)
Axia
l velo
cit
y (
m/s
)
Time (ms)
0.0 0.2 0.4 0.6 0.8 1.0 1.2 1.4 1.6 1.8 2.0 2.2 2.4 2.6
0
5
10
15
20
25
30
35 r,z(1.5;40) r,z(2.0;40) r,z(2.5;40) r,z(3.0;40) r,z(3.5;40)
Dia
mete
r (m
)
Time (ms)
Main results:Locations at higher distances from the nozzle produces the same behavior for droplets diameter and axial velocity although a higher fluctuation of the diameter profiles is observedDroplets diameter, collected during the steady state stage of the mean injection, exhibits an increasing trend along the spray axis ranging from about 4 micron to 7 micron.The axial velocity profile starts to reduce its value with a more rapid trend along the spray axis also during the steady state part of injection
0.0 0.2 0.4 0.6 0.8 1.0 1.2 1.4 1.6 1.8 2.0 2.2 2.4 2.60
20
40
60
80
100
120 r,z (0.0;50) r,z (0.5;50) r,z (1.0;50) r,z (1.5;50) r,z (3.0;50) r,z (3.5;50)
Axia
l velo
cit
y (
m/s
)
Time (ms)
0.0 0.2 0.4 0.6 0.8 1.0 1.2 1.4 1.6 1.8 2.0 2.2 2.4 2.6
0
5
10
15
20
25
30
35 r,z(0.0;50) r,z(0.5;50) r,z(1.0;50) r,z(1.5;50)
Dia
mete
r (m
)
Time (ms)
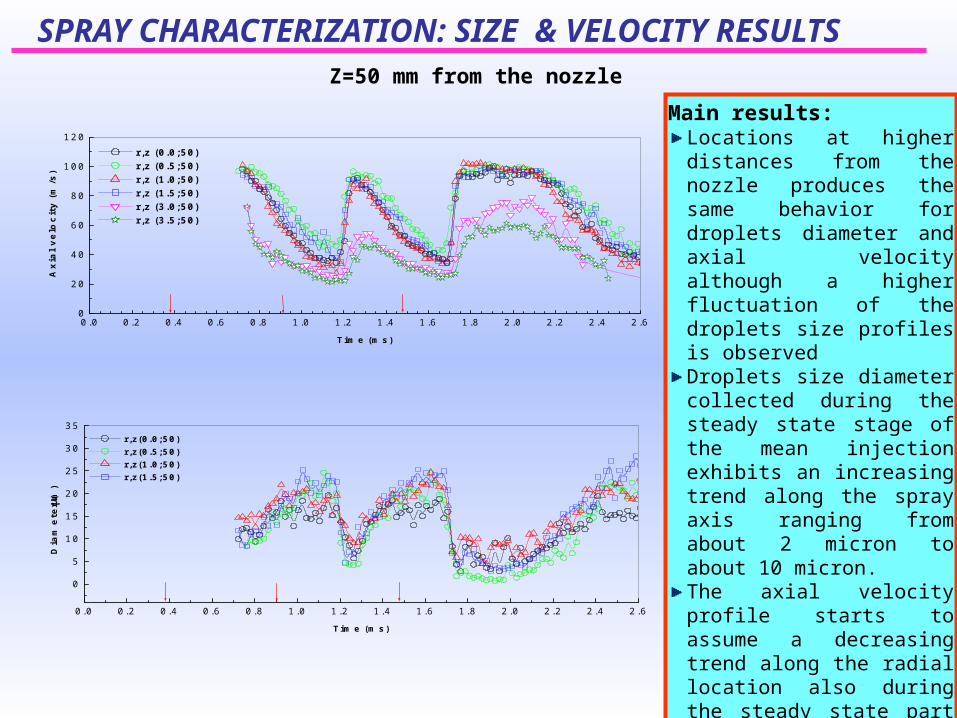
SPRAY CHARACTERIZATION: SIZE & VELOCITY RESULTSZ=50 mm from the nozzle
Main results:Locations at higher distances from the nozzle produces the same behavior for droplets diameter and axial velocity although a higher fluctuation of the droplets size profiles is observedDroplets size diameter collected during the steady state stage of the mean injection exhibits an increasing trend along the spray axis ranging from about 2 micron to about 10 micron. The axial velocity profile starts to assume a decreasing trend along the radial location also during the steady state part of injection
SPRAY CHARACTERIZATION: SIZE & VELOCITY RESULTS
0 200 400 600 800 1000 1200 1400 1600 1800 2000 22000
20
40
60
80
100
120r=0.0 mm - z=7.5 mm
Time [s]
Axia
l velo
city
[m/s
]
0 200 400 600 800 1000 1200 1400 1600 1800 2000 22000
5
10
15
20
25
30
Time [s]
r=0.0 mm - z=7.5 mm
Dia
mete
r [m
]
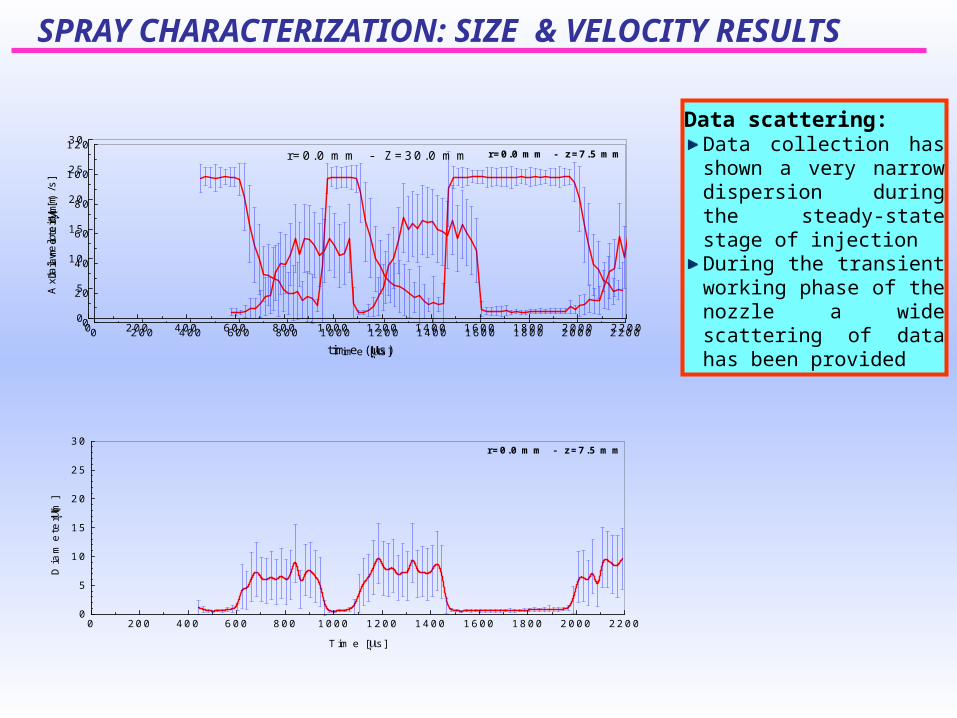
Data scattering:Data collection has shown a very narrow dispersion during the steady-state stage of injection During the transient working phase of the nozzle a wide scattering of data has been provided
0 200 400 600 800 1000 1200 1400 1600 1800 2000 22000
5
10
15
20
25
30r=0.0 mm - Z=30.0 mm
time (s)
Dia
mete
r (m
)
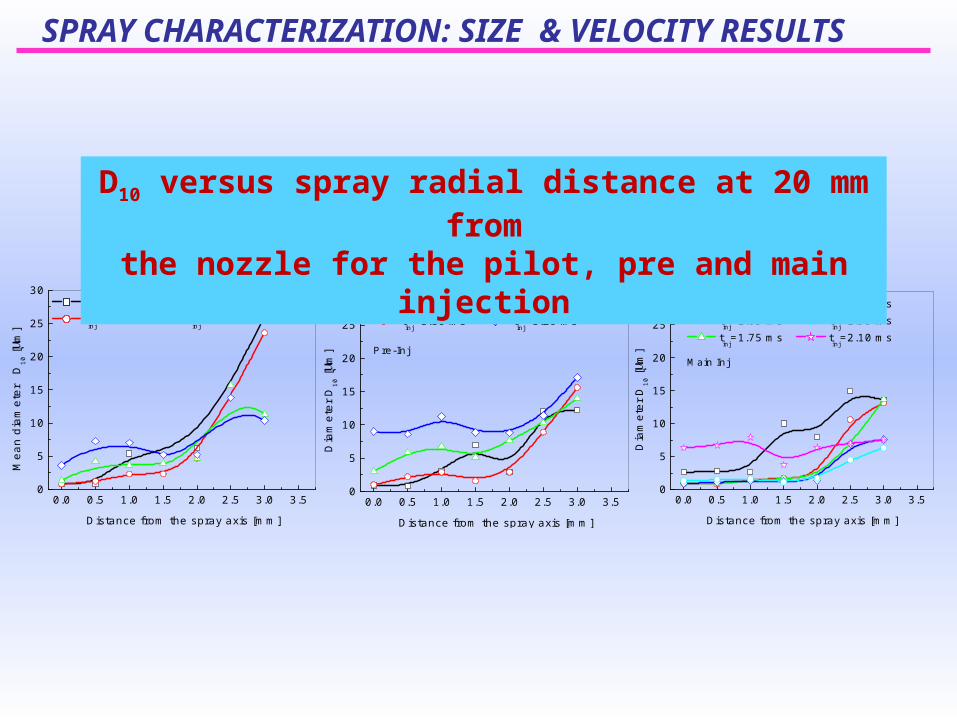
0.0 0.5 1.0 1.5 2.0 2.5 3.0 3.50
5
10
15
20
25
30Pilot
Distance from the spray axis [mm]
tinj
=0.55 ms tinj
=0.65 ms t
inj=0.60 ms t
inj=0.70 ms
Mea
n di
amet
er
D10
[m
]
0.0 0.5 1.0 1.5 2.0 2.5 3.0 3.50
5
10
15
20
25
30
Pre-Inj
Distance from the spray axis [mm]
tinj
=1.05 ms tinj
=1.15 ms t
inj=1.10 ms t
inj=1.20 ms
Dia
met
er D
10 [
m]
0.0 0.5 1.0 1.5 2.0 2.5 3.0 3.50
5
10
15
20
25
30
Main Inj
tinj
=1.55 ms tinj
=1.85 ms t
inj=1.65 ms t
inj=1.95 ms
tinj
=1.75 ms tinj
=2.10 ms
Dia
met
er D
10 [
m]
Distance from the spray axis [mm]
SPRAY CHARACTERIZATION: SIZE & VELOCITY RESULTS
D10 versus spray radial distance at 20 mm fromthe nozzle for the pilot, pre and main injection
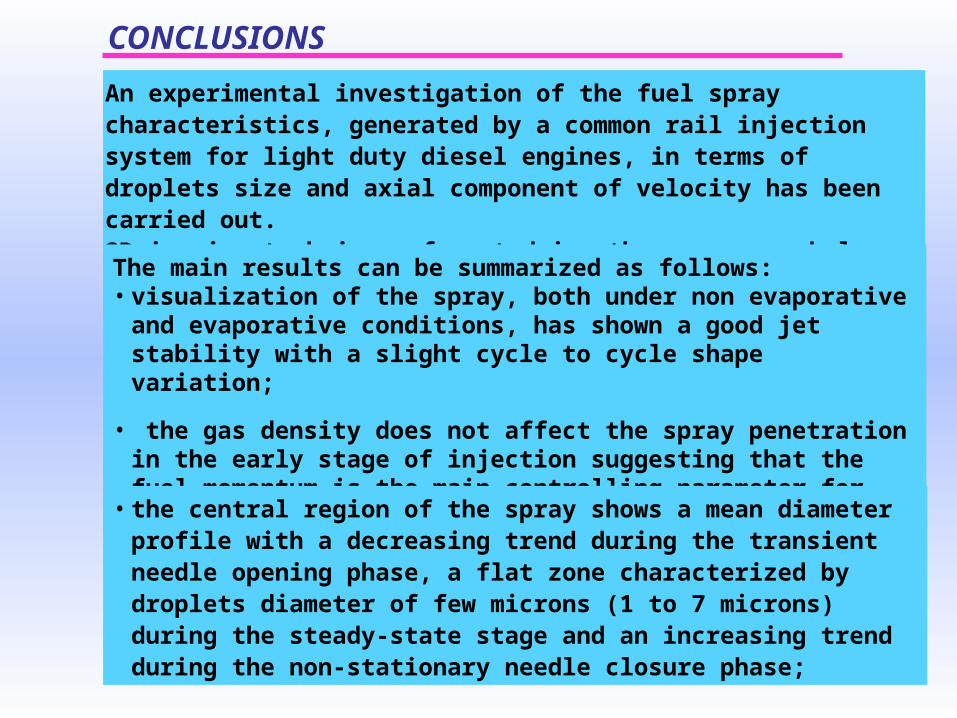
CONCLUSIONS
An experimental investigation of the fuel spray characteristics, generated by a common rail injection system for light duty diesel engines, in terms of droplets size and axial component of velocity has been carried out.2D imaging techniques for studying the spray morphology and the spatial and temporal evolution in quiescent ambient has been applied.
The main results can be summarized as follows:• visualization of the spray, both under non evaporative and evaporative
conditions, has shown a good jet stability with a slight cycle to cycle shape variation;
• the gas density does not affect the spray penetration in the early stage of injection suggesting that the fuel momentum is the main controlling parameter for the jet evolution;
• the central region of the spray shows a mean diameter profile with a decreasing trend during the transient needle opening phase, a flat zone characterized by droplets diameter of few microns (1 to 7 microns) during the steady-state stage and an increasing trend during the non-stationary needle closure phase;
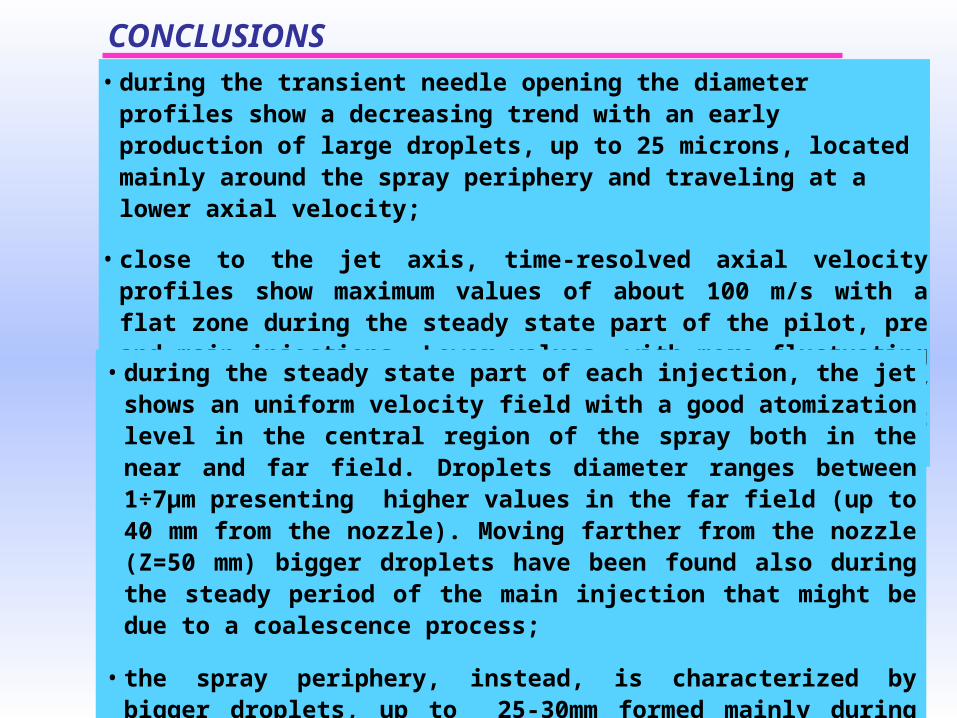
CONCLUSIONS• during the transient needle opening the diameter profiles show a decreasing
trend with an early production of large droplets, up to 25 microns, located mainly around the spray periphery and traveling at a lower axial velocity;
• close to the jet axis, time-resolved axial velocity profiles show maximum values of about 100 m/s with a flat zone during the steady state part of the pilot, pre and main injections. Lower values, with more fluctuating profiles, have been observed moving toward the spray periphery because of the interaction with the air that produces wide fluctuations;
• during the steady state part of each injection, the jet shows an uniform velocity field with a good atomization level in the central region of the spray both in the near and far field. Droplets diameter ranges between 1÷7µm presenting higher values in the far field (up to 40 mm from the nozzle). Moving farther from the nozzle (Z=50 mm) bigger droplets have been found also during the steady period of the main injection that might be due to a coalescence process;
• the spray periphery, instead, is characterized by bigger droplets, up to 25-30mm formed mainly during the transient opening phase of the needle with high velocity gradients due to its interaction with the surrounding air.
Droplets Size and Velocity Measurements in a Spray from a Common Rail System for DI Diesel Engines
L. Allocca, S. Alfuso, M. Auriemma, G. ValentinoIstituto Motori – CNR, Napoli - ITALY
Istanbul - Nov. 13th-14th
THANK YOU FORYOUR ATTENTION
ISTITUTO MOTORI

INTRODUCTION
Key role in i.c. engines of fuel injection systems for meeting high power, reduced fuel consumption and emission requirements
Droplet atomization and dispersion, vapour distribution and stoichiomentric air/fuel mixture burning affect the combustion stability, efficiency and pollutant formation
Droplet atomization and dispersion, vapour distribution and stoichiomentric air/fuel mixture burning affect the combustion stability, efficiency and pollutant formation
Non intrusive optical techniques for investigationg on spray development for understanding the mixture preparation (imaging, PDA, LIF, LII, …)
Common rail: injection modulation in terms of rate shaping, multiple injection, injection pressure
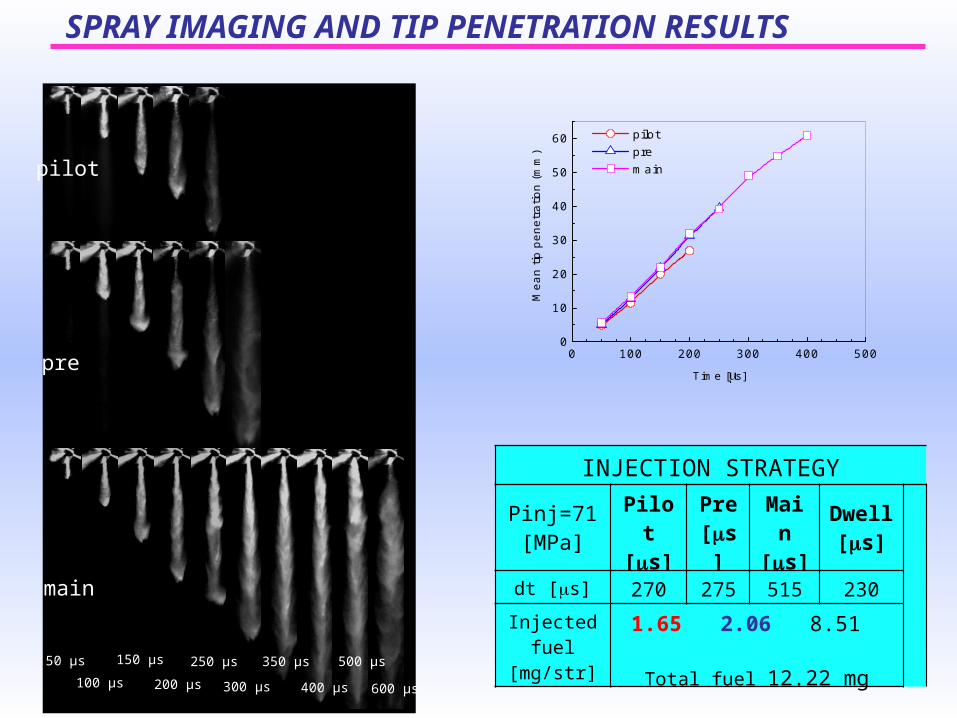
SPRAY IMAGING AND TIP PENETRATION RESULTS
0 100 200 300 400 5000
10
20
30
40
50
60 pilot pre main
Mea
n tip
pen
etra
tion
(mm
)
Time [s]
pilot
pre
main
50 μs 100 μs
150 μs 250 μs 300 μs 350 μs
400 μs 500 μs 600 μs 200 μs
INJECTION STRATEGY
Pinj=71 [MPa]
Pilot [ms]
Pre [ms]
Main [ms]
Dwell [ms]
dt [s] 270 275 515 230
Injected fuel
[mg/str]
1.65 2.06 8.51
Total fuel 12.22 mg