Embed Size (px)
Citation preview

DRIVING
SUSTAINED
EXCELLENCE
For more information, see page 2
Introducing Aurobindo Pharma Limited
COMPANY OVERVIEW
2 Introducing Aurobindo Pharma Limited
6 Geographical Presence
8 Year in Review
10 Financial Highlights
12 Vice-Chairman’s Review
14 Managing Director’s Message
16 Business Model
18 Operating Landscape
20 Strategic Priorities
22 Pursuit of Sustained Excellence
24 Quality is Sacrosanct
29 Scaling the Growth Curve is Exhilarating
32 Reinforcing a Culture of Ownership
36 Robust Risk Governance
38 Environment, Health and Safety
40 Shaping Holistic Community Well-being
42 Board of Directors
STATUTORY REPORTS
44 Notice
53 Board’s Report
63 Management Discussion and Analysis
73 Management of Risks
80 Business Responsibility Report
124 Report on Corporate Governance
FINANCIAL STATEMENTS
137 Standalone Financial Statements
199 Consolidated Financial Statements
For further information, log on to www.aurobindo.com
CONTENTS
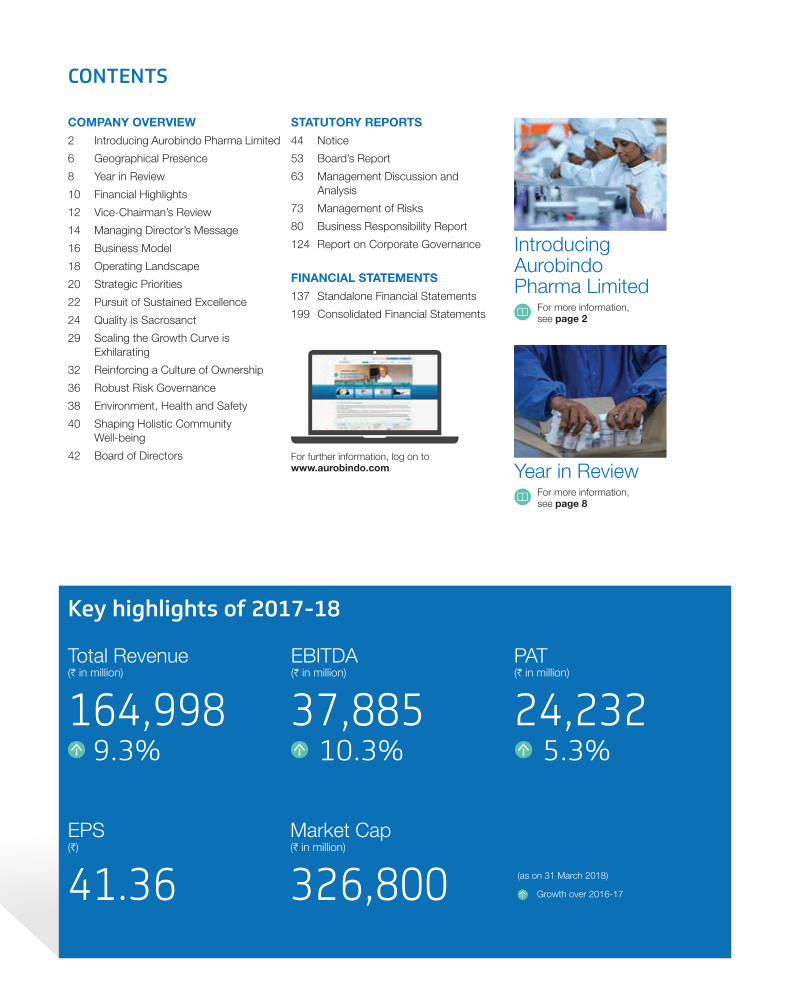
Key highlights of 2017-18
Total Revenue(H in million)
164,9989.3%
EBITDA(H in million)
37,885 10.3%
PAT(H in million)
24,232 5.3%
EPS(H)
41.36Market Cap(H in million)
326,800 Growth over 2016-17
(as on 31 March 2018)
For more information, see page 8
Year in Review

For over three decades, we have steadily built an institution through our sustained pursuit of excellence.
Excellence is an operative word at Aurobindo Pharma. It has many facets. It is reflected in the quality products we manufacture across complex and critical therapeutic areas.
It is demonstrated through our focus on Research and Development (R&D) and the investments that we plan to accomplish our long-term growth objectives.
Excellence is also vindicated in the way we nurture our talent pool and future leadership; and drive our sustainability initiatives.
We are making lasting contributions to human health and well-being through the intervention of science; and creating value for stakeholders through care and integrity.
We are bringing excellence in all that we do diligently and sustainably.
Driving sustained excellence

INTRODUCING AUROBINDO PHARMA LIMITED
Aurobindo is a leading global pharmaceutical company, producing generic formulations and Active Pharmaceutical Ingredients (APIs).
At Aurobindo, our three decades of expertise was sharpened by our intense focus on productivity, operational efficiency and commitment to highest quality standards.
Our robust product portfolio spans over seven major therapeutic areas, including antibiotics, antiretrovirals (ARVs), cardiovascular (CVS), central nervous systems (CNS), gastroenterologicals, anti-diabetics and anti-allergics, supported by an outstanding R&D capability.
Strengthened by several large manufacturing facilities, approved by the USFDA, UK MHRA, MCC-SA, EMA and ANVISA Brazil for both APIs and formulation, Aurobindo markets its products and solutions across 150+ countries; with growing penetration in the US and Europe.
Our in-house scientific talent pool strengthens our intellectual capital and helps us to commercialize cost-effective, quality generic finished dosages. Our competitive advantage is the broad portfolio of diversified dosage forms, including Rx and OTC oral solids and liquids, injectables, ophthalmics, specialty products and controlled substances. The focus is on complex molecules, differentiated technology platforms and specialty products.
Our mission Aurobindo’s mission is to become the most valued pharmaceutical partner to the world pharma fraternity by continuously researching, developing and manufacturing a wide range of pharmaceutical products that comply with the highest regulatory standards.
Delivering sustainable growth
2

Auro Values
Business Care Operational excellence
Stakeholder orientation
Quality and innovation
People Care Fairness, humility and
respect for individuals
Teamwork
Applied learning
Organization Care Accountability
Integrity
Achievement
Co
mp
any Overview
Statutory R
eports
Financial Statem
ents
Annual Report 2017-18 3
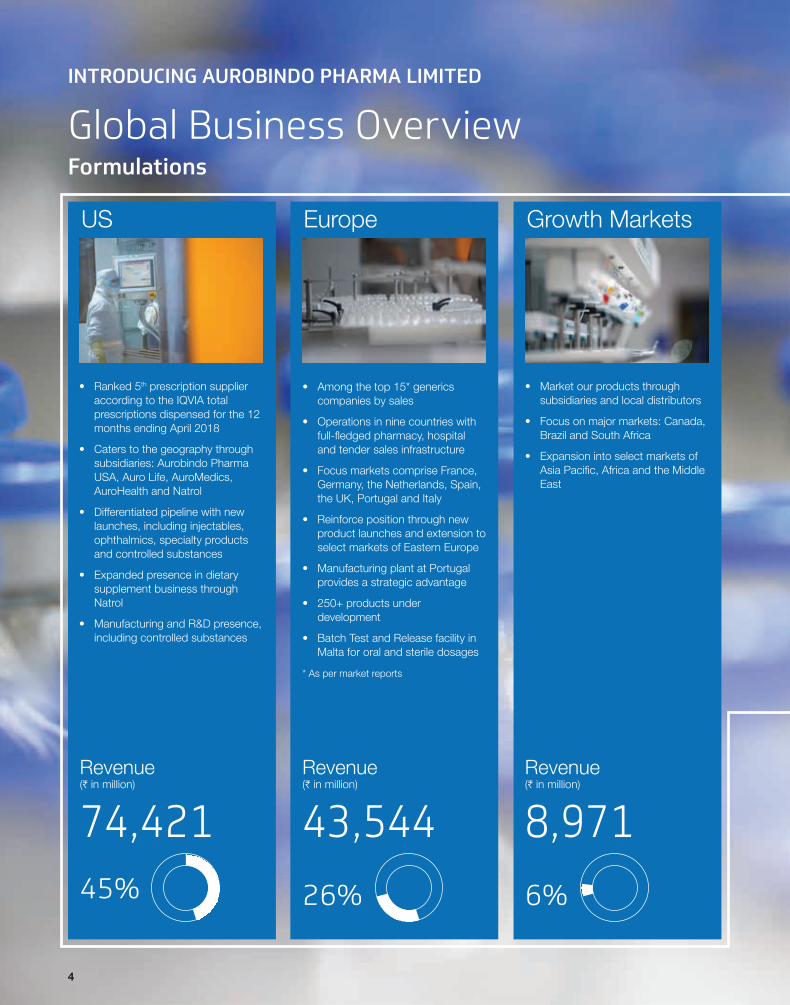
Global Business OverviewFormulations
Growth MarketsEuropeUS
• Ranked 5th prescription supplier according to the IQVIA total prescriptions dispensed for the 12 months ending April 2018
• Caters to the geography through subsidiaries: Aurobindo Pharma USA, Auro Life, AuroMedics, AuroHealth and Natrol
• Differentiated pipeline with new launches, including injectables, ophthalmics, specialty products and controlled substances
• Expanded presence in dietary supplement business through Natrol
• Manufacturing and R&D presence, including controlled substances
• Among the top 15* generics companies by sales
• Operations in nine countries with full-fledged pharmacy, hospital and tender sales infrastructure
• Focus markets comprise France, Germany, the Netherlands, Spain, the UK, Portugal and Italy
• Reinforce position through new product launches and extension to select markets of Eastern Europe
• Manufacturing plant at Portugal provides a strategic advantage
• 250+ products under development
• Batch Test and Release facility in Malta for oral and sterile dosages
* As per market reports
• Market our products through subsidiaries and local distributors
• Focus on major markets: Canada, Brazil and South Africa
• Expansion into select markets of Asia Pacific, Africa and the Middle East
Revenue(H in million)
74,421 Revenue(H in million)
43,54426%
Revenue(H in million)
8,971 6%
INTRODUCING AUROBINDO PHARMA LIMITED
45%
4

ARVs
Portfolio mix (31 March 2018)
• Focus on global tenders; availability across 125 countries
• Maintain competitiveness through development of new products
• Received USFDA approval for Dolutegravir and its triple drug combination product under President’s Emergency Plan for AIDS Relief (PEPFAR) program
of total revenues
APIs
• Cost-effective with vertical integration of around 70% of API requirement being sourced internally
• One of the leading suppliers of APIs from India – serves as a source for various generics and branded drugs
• Strong regulatory capability with 227 US DMF filings as on 31 March 2018
Revenue(H in million)
29,622 Revenue(H in million)
8,396 5%
Therapy ANDAs Addressable Market Size ($ Bn)*
Anti Diabetic 15 6.3ARV* 42 7.0CNS 90 24.6Controlled Substances 16 1.7CVS 76 24.5Gastroenterological 30 4.1Ophthalmics 11 0.5Others 142 15.5Penem 2 0.5Respiratory 11 0.7Oncology & Hormones 13 3.0SSP & Cephalosporins 30 0.8Total 478 89.2
* As per IQVIA MAT March 2018
18%
Annual Report 2017-18 5
Co
mp
any Overview
Statutory R
eports
Financial Statem
ents

Growing global footprint
GEOGRAPHICAL PRESENCE
USA
India
France
Germany
Netherlands
Spain
UK
Portugal
Italy
Romania
Belgium
Ukraine
South Africa
East Africa
Myanmar
Canada
Mexico
Colombia
Brazil
Japan
6

12th
150+
2nd
19,000+
5th
25
$2.6 Bn
26+ Bn
Largest generic company by sales globally#
Markets in which we are present
Largest listed Indian pharmaceutical company by revenues*
Employees
Largest generic company by Rx dispensed in the US**
Manufacturing facilities globally
Global revenues in FY2017-18
Diverse dosage forms manufactured in FY2017-18
# Source: Evaluate Pharma; *as per FY2017-18 revenues ** Source: IQVIA National Prescription Audit, 12 months ending Apr 2018;
Co
mp
any Overview
Statutory R
eports
Financial Statem
ents
Annual Report 2017-18 7

Q1• Filed 13 ANDAs with USFDA, including 9
in oral and 4 in injectable
• Received final approval for 17 ANDAs, including 16 orals and one injectable; tentative approval for 3 ANDAs
• Launched 15 products, including 3 injectables in the US
• Agile Pharma B.V., Netherlands, a wholly-owned step-down subsidiary of the Company, successfully completed the acquisition of Generis Farmaceutica S.A.
• Transferred the manufacture of 2 products from Europe to India
• New Betalactum injectable manufacturing facility i.e. Unit XVI has been commissioned during the quarter
• First company to launch Sevelamer Carbonate oral suspension in the US market
FY2017-18
Q2• Filed 21 ANDAs with USFDA, including 11
in oral and 10 in injectable
• Received final approval for 2 ANDAs and tentative approval for 3 ANDAs
• Launched 8 products, including 2 injectables in the US
• Transferred manufacturing of 3 products from Europe to India
• First company to launch Sevelamer Carbonate tablets in the US market
FY2017-18
YEAR IN REVIEW
Each quarter takes us forward
8
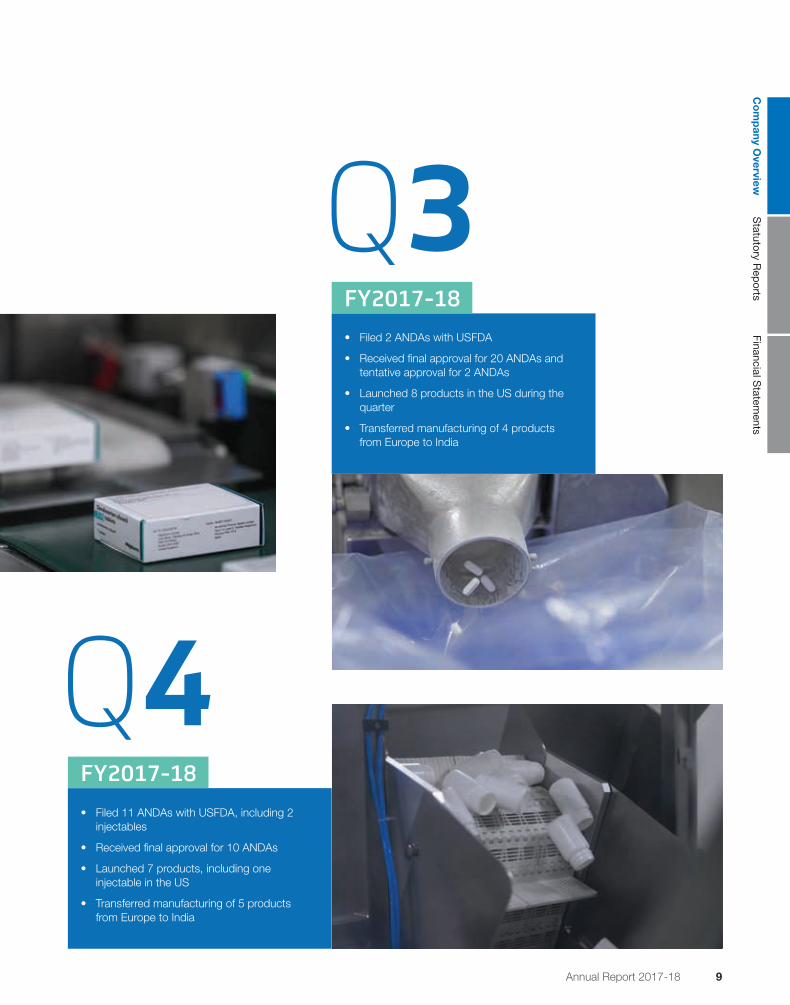
Q3• Filed 2 ANDAs with USFDA
• Received final approval for 20 ANDAs and tentative approval for 2 ANDAs
• Launched 8 products in the US during the quarter
• Transferred manufacturing of 4 products from Europe to India
FY2017-18
Q4• Filed 11 ANDAs with USFDA, including 2
injectables
• Received final approval for 10 ANDAs
• Launched 7 products, including one injectable in the US
• Transferred manufacturing of 5 products from Europe to India
FY2017-18
Annual Report 2017-18 9
Co
mp
any Overview
Statutory R
eports
Financial Statem
ents
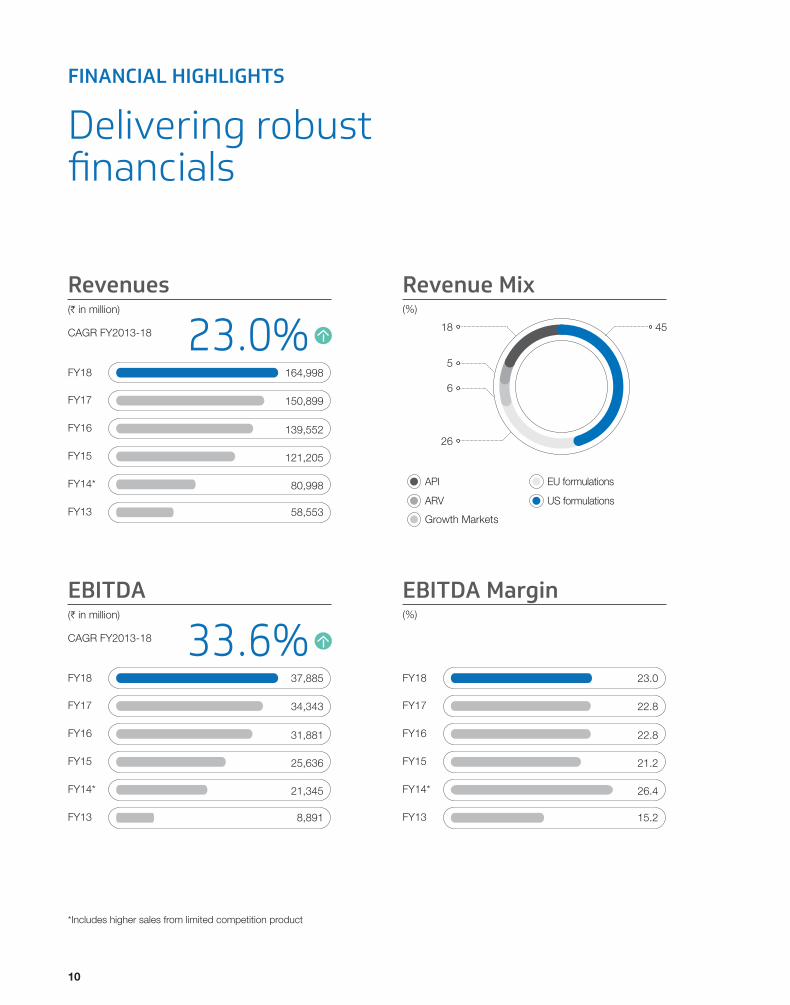
*Includes higher sales from limited competition product
FY18
(%)
23.0
22.8
22.8
21.2
26.4
15.2
FY17
FY16
FY15
FY14*
FY13
EBITDA Margin
FINANCIAL HIGHLIGHTS
Delivering robust financials
FY18
(H in million)
164,998
150,899
139,552
121,205
80,998
58,553
FY17
FY16
FY15
FY14*
FY13
Revenues
23.0%CAGR FY2013-18
FY18
(H in million)
37,885
34,343
31,881
25,636
21,345
8,891
FY17
FY16
FY15
FY14*
FY13
EBITDA
33.6%CAGR FY2013-18
Revenue Mix
ARV US formulations
API EU formulations
Growth Markets
4518
6
5
26
(%)
10

FY18 0.3
0.6
0.8
1.2
FY17
FY16
FY15
FY14*
FY13
Net Debt / Equity
0.3
1.0
FY18 0.9
0.8
1.3
1.6
1.7
3.6
FY17
FY16
FY15
FY14*
FY13
Net Debt / EBITDA
FY18
(H in million)
24,232
23,017
20,251
15,758
11,729
2,939
FY17
FY16
FY15
FY14*
FY13
Net Profit
52.5%CAGR FY2013-18
*Includes higher sales from limited competition product
Annual Report 2017-18 11
Co
mp
any Overview
Statutory R
eports
Financial Statem
ents

“If there is one thing that makes me confident about the future, it is the passion of our people to deliver, despite challenges; and this passion shapes our culture of excellence.”K. Nithyananda ReddyVice Chairman
VICE-CHAIRMAN’S REVIEW
Driving holistic excellence
12

I am delighted to report that our strategy to drive holistic excellence has translated into encouraging business momentum in a year that presented its fair share of challenges. Despite hardships, we performed satisfactorily in catering to critical patient needs across geographies.
MACRO LANDSCAPEThe global economy saw definite signs of recovery in 2017, and the major markets of our operations reflected this growth trend. According to IMF, the US economy grew by 2.3% vis-à-vis 1.6% in 2016. The Indian economy too registered robust growth as the GDP grew by 6.7% in FY2017-18.
Demand growth and renewed investments across geographies have helped economies record encouraging progress. However, the global pharmaceutical sector encountered hurdles caused by buyer consolidation in the US, and improved pace of USFDA approvals has resulted in rising pricing pressures and increasing competition.
Despite international headwinds, we retained our growth momentum and continued to further reinforce our financial strength. With launches in the US market and improving market presence in Europe and other Growth Markets, we continued to progress and deliver encouraging results.
PERFORMANCE REVIEWWe achieved a 9.3% revenue growth over the previous year at `164,998 million, at the consolidated level. The Company’s diversified geographical presence and product portfolio made all the difference in a challenging and competitive market.
EBITDA for the year stood at `37,885 million and reflected an impressive 10.3% growth. We saw improvement in the EBITDA margin, as it stood at 23.0%, compared to 22.8% in the previous year.
Profit after tax (PAT) was at `24,232 million, higher by 5.3% over 2016-17. Earnings per Share for the year were healthy at `41.36.
TRANSFORMATION IN OUR DNAWe believe, transformation in response to market requirements, industry dynamics,
and regulatory demands is the only reliable roadmap to sustainable growth.
We have strengthened our manufacturing facilities and adopted top-notch technologies to stay ahead of the curve in a competitive market scenario. To elevate our manufacturing capabilities, we have successfully commissioned Betalactum injectables manufacturing facility (Unit XVI) at Jadcherla in Telangana; and the creation of Unit X for an USFDA compliant oral manufacturing facility at Naidupet, Andhra Pradesh, is on track.
We strengthened our manufacturing processes through operational training and further enhanced the integrated process systems such as quality management system by automating the complaint management process to facilitate timely and effective handling of complaints and also implemented a real-time data management system called PRISM. As part of continuous improvement, the Laboratory Information Management System (LIMS) is now being upgraded to fully automated electronic platform for improved transparency and efficiency and an initiative was taken to implement Continued Process Verification through automated electronic system to ensure that processes are in a constant state of control, thus ensuring product quality.
INNOVATION ALL THE WAYOur priority is to grow our product portfolio and drive our R&D efforts to create solutions for growing healthcare threats. In this context, it is relevant to mention that we continue to ramp up our pipeline of products.
We are investing extensively in our R&D efforts towards creating high-value complex products and drug delivery systems. We are making steady progress in the realms of oncology and hormones including steroids, penems, vaccines, biosimilars, peptides, dermatology and respiratory. We remain optimistic that the growth in these categories will amass for the business, while also helping us fulfil our objective to create affordable medicines for unmet medical needs.
During the year, we continued to focus on promoting education, sanitation, healthcare, rural development and sports in the communities where we operate. Our objective is to work as an agent of empowerment from the grassroots.
FUTURE GROWTH PROSPECTSGlobal healthcare spending is estimated to increase at an annual rate of 4.1% during 2017-2021 (as per 2018 Global healthcare outlook: The evolution of smart healthcare by Deloitte). This coupled with more acceleration in the global economy will ensure steady growth in healthcare expenditure. We remain optimistic about our growth across geographies; and aim to further de-risk our business by extending our product portfolio.
CULTURE OF EXCELLENCEIf there is one thing that makes me confident about the future, it is the passion of our people to deliver, despite challenges; and this passion shapes our culture of excellence. We are also constantly enriching our culture and bringing on board new talent pool to grow the business sustainably.
We believe in the importance of thinking ahead and be proactive to remain at the vanguard of opportunities; and we will continue to follow this strategy diligently in the coming years.
Before I conclude, I must thank all our stakeholders for encouraging us to seek excellence in every facet of the business.
K. Nithyananda ReddyVice Chairman
Annual Report 2017-18 13
Co
mp
any Overview
Statutory R
eports
Financial Statem
ents

Dear Stakeholders,
I am pleased to share that we reported encouraging progress and better efficiencies across all our functions during FY2017-18. Most importantly, this progress was achieved against a backdrop of a volatile global pharma landscape, characterized by price erosions and intense competition.
In the last fiscal, we continued our efforts on strengthening the compliance and quality aspects of our business. Our dedicated efforts and integrity continue to enable us to create sustainable value for all stakeholders.
GROWTH ACROSS GEOGRAPHIESEven as players in the global pharma sector experienced pricing pressures owing to customer consolidation in the US, uncertainty around BREXIT and faster pace of approval by the USFDA, we reinforced our market presence by key launches and investments in inorganic growth opportunities. Aurobindo is well-known globally for its execution capabilities and resilience against temporary headwinds; and it has lived up to its reputation and sustained its momentum. We ramped up volumes, improved efficiencies, optimized costs and strengthened supply chain and logistics.
“Quality is of utmost importance to us; and every member of the team ensures that we remain at the top of the quality and compliance curve.”N. GovindarajanManaging Director
MANAGING DIRECTOR’S MESSAGE
Execution brilliance shows the way
14

and selective geographical expansion. In our ARV segment in particular, we received the USFDA approval for Dolutegravir triple drug combination (TLD) product under the PEPFAR program; this will improve our patient outreach to around 5 million.
CONSISTENT EXECUTIONAurobindo pioneered the execution of end-to-end activities in the pharma value chain. Our continuous holistic efforts to optimize and rationalize the operations gives us the strength to face headwinds very efficiently. Team Aurobindo is well-focused on bringing the best out of available resources, which directly impacts our operational and financial outcomes.
The excellence in execution paved path for the Company to successfully register growth across the key markets. The execution excellence also resulted in diversifying our product portfolio, thereby minimizing the risk of product concentration. Aurobindo successfully executed the turnaround strategies of acquired business in Europe, which resulted in much healthier margins from that region.
QUALITY COUNTSQuality is of utmost importance to us; and every member of the team ensures that we remain at the top of the quality and compliance curve. Hence, when our US-based subsidiary, AuroMedics Pharma LLC, was appraised for the presence of particulate matter in few of the products distributed in the US market, we initiated a voluntary recall of these products. Aurobindo has adopted a holistic life cycle approach to mitigate the particulate matter issues thereby ensuring patients receive high-quality injectables in terms of product quality and safety.
We managed the task by fast-tracking our response time and immediate notifications were sent out to consumers, distributors and retailers about the recall. We, at Aurobindo, remain committed to ensuring high-quality of our products; and have strengthened the quality culture over the years, by being steadfast about our adherence to robust Standard Operating Procedures (SOPs). Aurobindo has invested in capability building to embrace a culture of quality for sustainable compliance. Employees are continuously trained on various quality aspects such as Effective Investigation and Authoring skills and Computerized Systems Compliance for understanding.
NEW INITIATIVESThe development across our new initiatives has been on track. In the fiscal gone by, for our oncology and hormonal products we filed 11 ANDAs with the USFDA. We have launched our first penem injectable in the US in the year, and in the process of launching one more penem injectable in the US and Europe.
We are happy to report that the production of exhibit batches for our upcoming dermatology and biosimilar products is on track. We are in the process of filing 5-6 ANDAs in dermatology for the US market. We are expecting to start the Phase-I clinical trials for our first biosimilar in FY2018-19.
The rapid pace at which our new initiatives are moving across the development and regulatory approval stages, we are confident of their successful commercialization in the foreseeable future. We strongly believe that, these products will ensure long-term growth of the Company and significant value creation for all our stakeholders.
NURTURING PEOPLE AND ENVIRONMENTOur broad sustainability agenda encompasses our strategy about our people, community and the environment. In the preceding fiscal, we expanded our training and development program to bring more people into this ambit. We have further aligned each function of our operations with stringent quality needs.
As a fast-growing enterprise, we are conscious of the impact our business can have on the environment and the communities we work with. Hence, we continue to implement a strategic EHS and CSR framework to ensure holistic growth and environment sustainability.
Our execution brilliance across all aspects of the business has enabled us to grow and create value sustainably. We will continue to be an execution-focused Company, because at the end of the day sustained excellence is the outcome of steadfast execution.
I am grateful to all members of the Aurobindo family and the entire stakeholder fraternity for putting your faith in our vision and strategy.
N. GovindarajanManaging Director
I am happy to state that despite the challenges, our US business has remained resilient; and continued to be a top contributor to our overall revenues. Our US formulations business contributed 45% to the overall formulations revenue during the year. The revenue generated from the US business grew to `74,421 million in FY2017-18 vis-à-vis `68,272 million in FY2016-17, an increase of 9% year-on-year.
We launched 38 products, including 6 injectables in the US market during the year under review. In FY2017-18, we received approvals for 49 ANDAs and filed a total of 47 ANDAs. With our increasing product pipeline, we believe we can further strengthen our market position in mid-to-long term; and set the course for our future growth prospects.
We commissioned a fully automated distribution center in East Windsor, NJ, during the year under review which facilitates enhanced storage of various dosage forms including orals, injectables and OTC products and spans across 567,000 sq ft. with a capacity of 20,000 pallet locations.
We have commissioned our new Betalactum injectables manufacturing facility (Unit XVI) at Jadcherla during the year, which will improve the injectable volumes for the US, EU and Growth Markets. Unit XV, the dedicated manufacturing facility for the Europe market has seen significant improvement in volumes.
In Europe, we registered an encouraging 32.9% growth, to reach `43,544 million revenue compared to `32,771 million in the previous year. We aim to improve our market presence in Italy, Spain, Portugal and France and foray into unexplored geographies like Poland and the Czech Republic.
We have successfully completed the acquisition of Generis Farmaceutica S.A., through our wholly-owned subsidiary Agile Pharma B.V. It has a wide portfolio of products with major share in the therapeutic areas of cardiovascular (CVS), central nervous system (CNS), anti-infectives and genito-urinary system ailments. Generis is one of the most prominent pharmaceutical brands in Portugal; and the acquisition will establish Aurobindo as the leading generics group in that country.
Our antiretroviral (ARV) product segment and Growth Markets presence were further strengthened with the launch of key products
Annual Report 2017-18 15
Co
mp
any Overview
Statutory R
eports
Financial Statem
ents
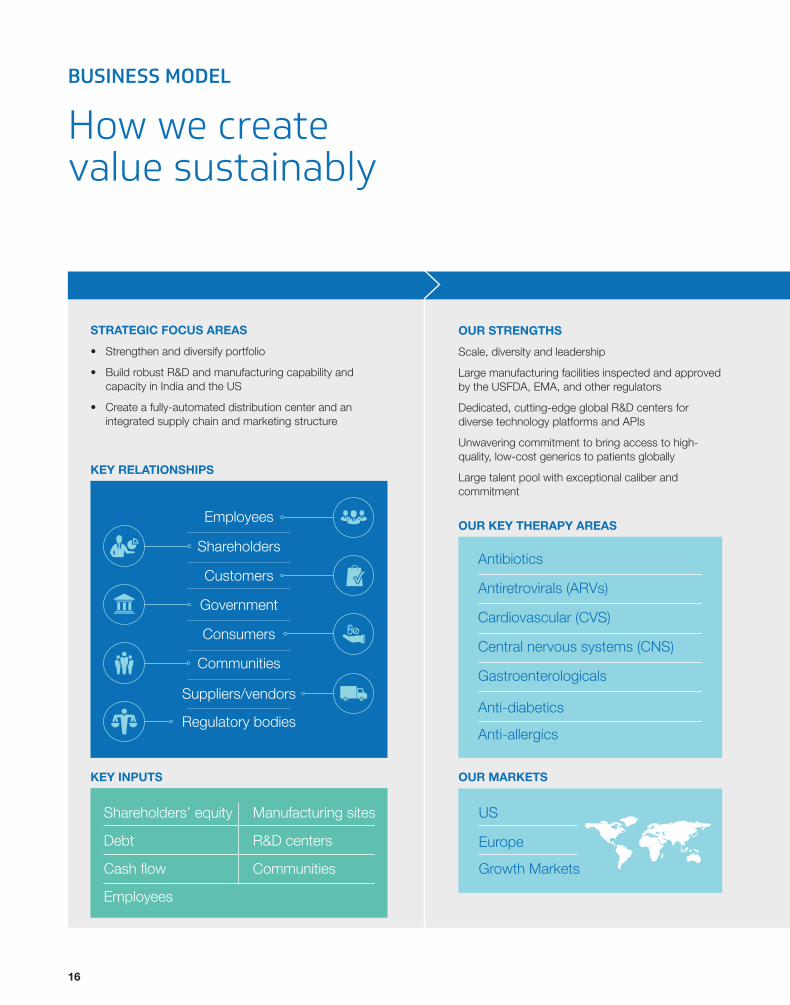
STRATEGIC FOCUS AREAS
• Strengthen and diversify portfolio
• Build robust R&D and manufacturing capability and capacity in India and the US
• Create a fully-automated distribution center and an integrated supply chain and marketing structure
KEY INPUTS
KEY RELATIONSHIPS
OUR KEY THERAPY AREAS
Antibiotics
Antiretrovirals (ARVs)
Cardiovascular (CVS)
OUR MARKETS
US
Europe
Growth Markets
Central nervous systems (CNS)
Gastroenterologicals
Anti-diabetics
Anti-allergics
OUR STRENGTHS
Scale, diversity and leadership
Large manufacturing facilities inspected and approved by the USFDA, EMA, and other regulators
Dedicated, cutting-edge global R&D centers for diverse technology platforms and APIs
Unwavering commitment to bring access to high-quality, low-cost generics to patients globally
Large talent pool with exceptional caliber and commitment
Shareholders’ equity
Debt
Cash flow
Manufacturing sites
R&D centers
Communities
Employees
Customers
Consumers
Suppliers/vendors
Shareholders
Government
Communities
Regulatory bodies
Employees
BUSINESS MODEL
How we create value sustainably
16

OUR VALUE CHAIN
Research and Development
Registration
Manufacturing Supply chain
Sales and marketing
OUTCOMES Returns Returns for our equity holders and debt providers
AssetsCash to re-invest in our assets and our people
Product efficacyProducts that help patients across the globe live better lives
OpportunityEmployment, training and development opportunities for all our employees, regardless of gender, race or age
A strong cultureAn engaged workforce that enhances the communities they operate in
Growth of the economy The Company pays taxes on the economic value generated. Further, the Government collects taxes on goods sold and services provided. Most importantly, our operations yield one of the best net Forex inwards impacting the economy positively.
Annual Report 2017-18 17
Co
mp
any Overview
Statutory R
eports
Financial Statem
ents

As a significant global player in the pharmaceutical landscape, we are increasing the complexity and diversity of our portfolio to treat more patients and win across global markets. However, regulatory and pricing pressures continue to shape the way the industry operates and creates value for all stakeholders.
Global economic growth and burgeoning populationThe global economy grew by 3.8% in 2017. As per the IMF, the year reported the broadest synchronized growth across the world since 2010 and the growth pattern is expected to improve in 2018.
Additionally, the global population is increasing at a rapid pace. Thus, growing life expectancy with expected rise in per capita income will be the key growth driver for the pharmaceutical industry.
Global population growth (in billion)
Prevalence of lifestyle diseasesThe proliferation of lifestyle diseases is likely to be a major concern in both developed and emerging economies. Obesity, cardiovascular diseases, hypertension and diabetes are persistent and will challenge public healthcare delivery systems to meet the growing demand for drugs and treatments.
592 million people to have diabetes by 2035
Ageing societiesAgeing societies are expected to drive the resources being diverted to social and health spending. Ageing-related illnesses, such as cancer and dementia, will increasingly dominate health research agendas. Increasing life expectancy may trigger increased consumption of medical services and pharmaceuticals.
Population ageing will remain a long-term growth driver in Western Europe and Japan as well as in countries such as Argentina, Thailand, and China.
16% of the world’s population will be 65+ years by 2050
[Source: United Nations’ World Population Prospects]
[Source: International Diabetes Federation (IDF)]
[Source: United Nations’ World Population Ageing Report]
OPERATING LANDSCAPE
Major socio-economic trends
7.48.59.7
2015
2030
2050
18

Science and technologyInnovation is critical to addressing the world’s unmet medical needs. The delivery of new medicines will rely on a deeper understanding of diseases and the use of new technology and approaches.
Technological advances are helping the pharma industry to look at growth opportunities that help design and test novel products
~27% of the global pharma market to be biologics by 2020
GlobalizationGlobalization will continue to facilitate the wide dissemination of knowledge, technologies and new business practices. It will progressively lead to more international initiatives to deepen the impact of public health programs. This necessitates further international co-operation in research and direct it towards global threats.
In 2015, the World Health Organization (WHO) endorsed a global action plan to tackle Antimicrobial Resistance (AMR)
100+ companies and associations signed Industry Declaration on AMR at the World Economic Forum in Davos in 2016
Pricing scenarioHealthcare services are highly regulated by governments, insurers and other private payers. Hence, pricing and reimbursement remain challenging in many markets.
Pharma companies are now working hard to mitigate pricing pressures by diversifying into diverse geographies and complex products, promising high margins.
$345–375 billion growth estimated from Pharmerging markets by 2022
[Source: Global pharma looks to India: Prospects for growth by PwC]
[Source: IQVIA Market Prognosis, October 2017].
Annual Report 2017-18 19
Co
mp
any Overview
Statutory R
eports
Financial Statem
ents
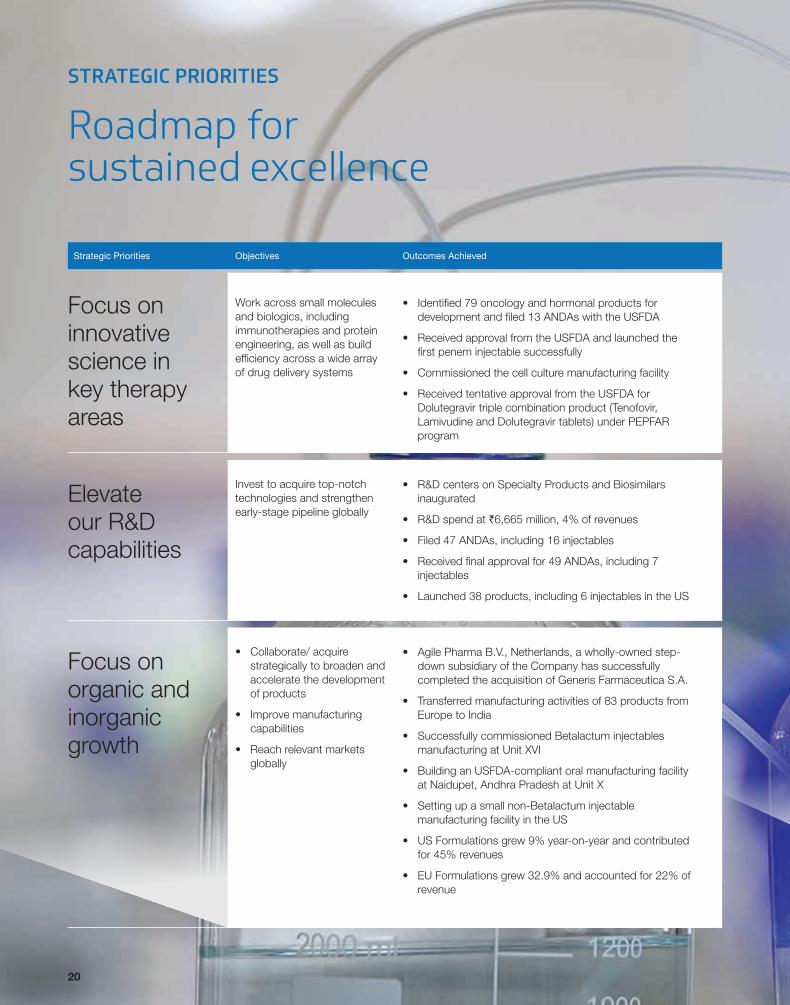
Strategic Priorities Objectives Outcomes Achieved
Focus on innovative science in key therapy areas
Elevate our R&D capabilities
Focus on organic and inorganic growth
Work across small molecules and biologics, including immunotherapies and protein engineering, as well as build efficiency across a wide array of drug delivery systems
Invest to acquire top-notch technologies and strengthen early-stage pipeline globally
• Collaborate/ acquire strategically to broaden and accelerate the development of products
• Improve manufacturing capabilities
• Reach relevant markets globally
• Identified 79 oncology and hormonal products for development and filed 13 ANDAs with the USFDA
• Received approval from the USFDA and launched the first penem injectable successfully
• Commissioned the cell culture manufacturing facility
• Received tentative approval from the USFDA for Dolutegravir triple combination product (Tenofovir, Lamivudine and Dolutegravir tablets) under PEPFAR program
• R&D centers on Specialty Products and Biosimilars inaugurated
• R&D spend at `6,665 million, 4% of revenues
• Filed 47 ANDAs, including 16 injectables
• Received final approval for 49 ANDAs, including 7 injectables
• Launched 38 products, including 6 injectables in the US
• Agile Pharma B.V., Netherlands, a wholly-owned step-down subsidiary of the Company has successfully completed the acquisition of Generis Farmaceutica S.A.
• Transferred manufacturing activities of 83 products from Europe to India
• Successfully commissioned Betalactum injectables manufacturing at Unit XVI
• Building an USFDA-compliant oral manufacturing facility at Naidupet, Andhra Pradesh at Unit X
• Setting up a small non-Betalactum injectable manufacturing facility in the US
• US Formulations grew 9% year-on-year and contributed for 45% revenues
• EU Formulations grew 32.9% and accounted for 22% of revenue
STRATEGIC PRIORITIES
Roadmap for sustained excellence
20

Strategic Priorities Objectives
Ensure compliance to quality standards
Sustain market leadership; and a robust financial position
Drive a people-focused culture
Ensure consistent quality excellence; and comply with the evolving regulatory scenario
Maintain a strong balance sheet to fund growth ambitions
Ensure effective organization, leadership, talent management and recruitment
• Manufacturing facilities approved by the USFDA, UK MHRA, MCC-SA, ANVISA Brazil and EMA
• 12th largest generic company by sales globally*
• 2nd largest listed Indian pharmaceutical company by revenues (in FY2017-18)
• Revenue from operations at `164,998 million, a 9.3% year-on-year growth
• EBITDA margin continued to expand
• Basic and diluted EPS is `41.36 per share
• 5,578 employees with length of service of over five years
• 4,973 employees received training and development during FY2017-18
Outcomes Achieved
* Source; Evaluate Pharma
Annual Report 2017-18 21
Co
mp
any Overview
Statutory R
eports
Financial Statem
ents

Pursuit of sustained excellence is an exciting voyage towards new harbors of opportunity.
We remain committed to deliver affordable and innovative solutions for unmet medical needs globally. Our commitment enables us to drive sustained excellence by manufacturing quality products, reaching new growth milestones and nurturing a culture of integrity. By creating high-quality products, and making them accessible to those who need them, we are helping shape a healthier world.
1 2 3 4 5 6
SUSTAINED EXCELLENCE HAS MANY FACETS
QUALITY SCALE CULTURE GOVERNANCE SUSTAINABILITY COMMUNITY

We are passionately and thoughtfully translating science into lasting contributions to human health through the manufacture of quality products. Our intervention in key therapeutic areas and high-end manufacturing capabilities help us achieve financial and operational stability.
We have steadily grown the scale and scope of our business from a very modest beginning to emerge among the largest
generic companies by sales globally. This is a collective achievement of our formidable talent pool. Our credo is to acquire and share knowledge and nurture go-getters, who can take the organization to the next level.

Quality is sacrosanct Aurobindo’s growing market presence has been built on the foundation of high-quality products. Our core business philosophy is to manufacture quality products that are both accessible and affordable. With our brand promise of building capabilities that comply with regulatory standards, we remain committed to our patients and partners.
We are continuously upgrading our facilities and aligning them to match international standards.
Our collaboration with key global partners has enabled us to enrich our portfolio and provide critical healthcare solutions to those in need.
We believe, quality commitment cannot be sustainable, unless it is supported
by robust R&D and manufacturing capabilities.
RESEARCH AND DEVELOPMENT
During FY2017-18, we invested around `6,665 million, which is 4% of total revenues. Our R&D efforts have been focused on strengthening the product portfolio. During the year under review, we launched 38 products, including
six injectables in the US. In addition, approvals were received for 49 ANDAs, including seven injectables.
To ensure the continuous development of our product pipeline, we submitted a total of 47 ANDAs filings, including 16 injectables.
FACETS OF SUSTAINED EXCELLENCE
1
24

Site Details Final Approval Tentative Approval* Under Review Total
Unit III Oral Formulations 108 11 7 126
Unit IV Injectables & Ophthalmics 50 2 38 90
Unit VIB Cephalosphorins Oral 11 11
Unit VII (SEZ) Oral Formulations 117 21 22 160
Unit X Oral Formulations 25 25
Unit XII Penicillin Oral & Injectables 19 1 20
Aurolife USA Oral Formulations 17 10 27
AuroNext Penem Injectables 1 1 2
Eugia Oral & Injectable Formulations 13 13
Others Oral Formulations 4 4
Total 327 34 117 478
*includes 11 ANDA approved under PEPFAR
Unit-wise ANDA filings as on 31 March 2018
Co
mp
any Overview
Statutory R
eports
Financial Statem
ents
Annual Report 2017-18 25
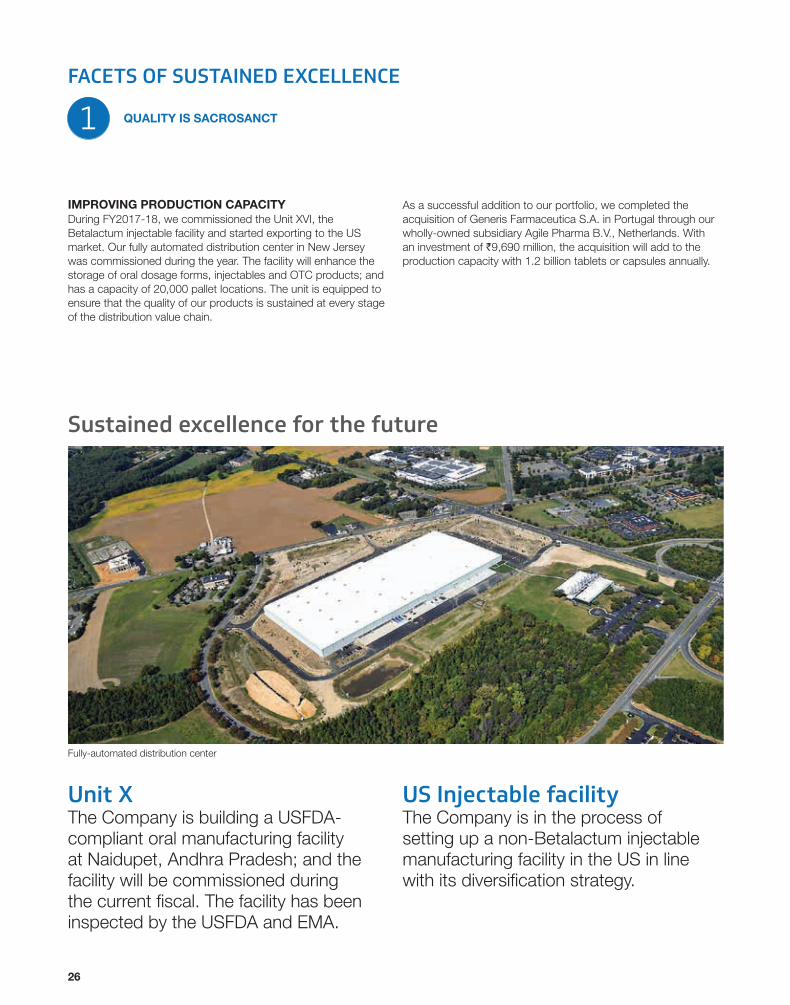
IMPROVING PRODUCTION CAPACITYDuring FY2017-18, we commissioned the Unit XVI, the Betalactum injectable facility and started exporting to the US market. Our fully automated distribution center in New Jersey was commissioned during the year. The facility will enhance the storage of oral dosage forms, injectables and OTC products; and has a capacity of 20,000 pallet locations. The unit is equipped to ensure that the quality of our products is sustained at every stage of the distribution value chain.
As a successful addition to our portfolio, we completed the acquisition of Generis Farmaceutica S.A. in Portugal through our wholly-owned subsidiary Agile Pharma B.V., Netherlands. With an investment of `9,690 million, the acquisition will add to the production capacity with 1.2 billion tablets or capsules annually.
Unit X The Company is building a USFDA-compliant oral manufacturing facility at Naidupet, Andhra Pradesh; and the facility will be commissioned during the current fiscal. The facility has been inspected by the USFDA and EMA.
US Injectable facilityThe Company is in the process of setting up a non-Betalactum injectable manufacturing facility in the US in line with its diversification strategy.
Sustained excellence for the future
FACETS OF SUSTAINED EXCELLENCE
1 QUALITY IS SACROSANCT
Fully-automated distribution center
26

Co
mp
any Overview
Statutory R
eports
Financial Statem
ents
Annual Report 2017-18 27

FACETS OF SUSTAINED EXCELLENCE
28
Scaling the growth curve is exhilaratingWe began our journey as an API manufacturing company, gradually moving into production of formulations. Today, our product portfolio spans seven major therapeutic/product areas, including antibiotics, ARVs, CVS, CNS, gastroenterologicals, anti-diabetics and anti-allergics.
2
Co
mp
any Overview
Statutory R
eports
Financial Statem
ents
Annual Report 2017-18 29

Over the years, we have focused on augmenting our capabilities to create novel solutions that help provide patients across the world a healthier life.
We are diversifying into new product segments such as biosimilars, specialty injectables, oncology, peptides, respiratory, topicals, vaccines and penems.
We have identified 79 oncology and hormonal products for development. We are cognizant of the capabilities needed to fulfil this objective, as oncology products are a highly specialized class of products and are difficult to produce. We have already filed
13 ANDAs with the USFDA as on 31 March 2018, and our manufacturing facility was inspected by the USFDA and EMA.
We also successfully received approval from the USFDA and launched our first penem injectable during the year.
One of our other achievements was receiving tentative approval from the USFDA for Dolutegravir triple combination product (Tenofovir, Lamivudine and Dolutegravir tablets) under President’s Emergency Plan for AIDS Relief (PEPFAR) program.
We have developed the process of manufacturing 14 peptides and two more molecules are in the process of development. Till FY2017-18, we filed four DMFs to US regulatory authorities and plan to file three more DMFs in the next fiscal.
Through steady investment and strategic acquisitions, we have reinforced our R&D capabilities to pursue our long-term growth objectives. We have the expertise and resources to focus on more complex and differentiated products across a range of therapeutic categories, dosage forms and delivery systems.
Our cell culture manufacturing facility was commissioned, and our first set of biosimilar exhibit batches will be completed. We also intend to commence Phase I clinical trials for our lead molecule, Bevacizumab.
Among our topical products under the dermatology portfolio, exhibit batches of 17 products will be ready and we intend to file 5 ANDAs.
Projected Future Growth in FY 2018-19
FACETS OF SUSTAINED EXCELLENCE
2 SCALING THE GROWTH CURVE IS EXHILARATING
Unit IV facility
30
Co
mp
any Overview
Statutory R
eports
Financial Statem
ents
Annual Report 2017-18 31

Reinforcing a culture of ownership
Our culture is shaped by the passion and perseverance of our people. Our culture aligns every member of the team to our core values. Our HR initiatives focus on three key aspects: people, process and performance.
FACETS OF SUSTAINED EXCELLENCE
3
32

Our HR strategies focus on realizing the business sustenance and growth envisioned by the management through building a strong talent pipeline that is geared to instill accountability and integrity towards processes and functions.
Given the dynamic regulatory environment that the pharma industry is witnessing, it is essential to build human capacities
that can take on challenges; and help the Company achieve sustained growth.
One of the most important achievements for us has been the mapping of leadership competencies and identification of people in terms of succession planning for leadership until 2022. Leadership competency is very critical; and our leaders demonstrate characteristics such
as ownership, people leadership, strategic thinking, pursuit of innovation and an execution drive.
We have undertaken several steps to ensure overall growth and development of employees across every level, with an improved focus on inter-band promotions.
Total employees
Inter-band elevation
19,000+
17-20%
Co
mp
any Overview
Statutory R
eports
Financial Statem
ents
Annual Report 2017-18 33

1. NALANDA Nalanda was launched with a vision
towards business excellence through leadership and functional competency development; and to provide impetus to develop second-line managers for all critical functions. The components of the courses are customized to the APL Competency Framework and are curated with content from esteemed professors from leading universities such as Wharton, Insead, London School of Business, Harvard University and Kellogg School of Management to, name a few.
The strategic e-learning initiative that commenced last year with the objective of scaling leadership competencies in line with the organization’s robust business growth completed the first season in March 2018.
2. QUALITY MARSHAL PROGRAM (QMP)
QMP is a key initiative to strengthen the Culture of Quality through continuous cascade and reinforcement
of Quality Behaviours and adherence to SOPs at the shop-floor through the trained and qualified resource pool of Quality Marshals. The Quality Marshals have worked arduously towards strengthening our quality culture by developing confidence and communication among shop-floor employees towards increasing audit interface capabilities and continuously addressing quality risks in our processes through structured learning partnerships.
By, 2020 we aim to have around 400+ Quality Marshals across all formulation units in the organization.
3. HR OUTREACH & ENGAGEMENT At Aurobindo, we are committed
to extend learning to not only the employee, but also the employee’s family. We create a positive whole-man approach through our various HR Outreach & Engagement programs like
Saksham, Career Orientation Program, Prathiba and Aurobindo Appreciation Day.
4. KAIZEN We, at Aurobindo, have adopted
Kaizen in the work culture to focus on continual improvement. This requires unit-level involvement to map KPIs and drive efficiencies.
5. SKILL-BUILDING & DEVELOPMENT PROGRAMS
Aligning the HR function with the business strategy is one of our primary objectives, in view of this various skill-building and development programs are designed and implemented which includes preparation of skill matrix for all operators, initiating project on Talent Critical Equipment Repository and organizing OEMs from Gansons, Tofflon and FETTE for technical training programs.
Daily KaizenFocused on identifying daily KPIs and strict adherence to those KPIs
Project KaizenEncompasses KPIs that need to be put into action to improve processes and improve productivity
Kaizen deals with four aspects:
FACETS OF SUSTAINED EXCELLENCE
3 REINFORCING A CULTURE OF OWNERSHIP
34

Support KaizenEnsures that the key enablers such as the support systems within an organizational structure and the governance mechanism follow certain goals to ensure process stability
Leaders KaizenEnsures that the top management is empowered and supported to build efficient capabilities
Annual Report 2017-18 35
Co
mp
any Overview
Statutory R
eports
Financial Statem
ents
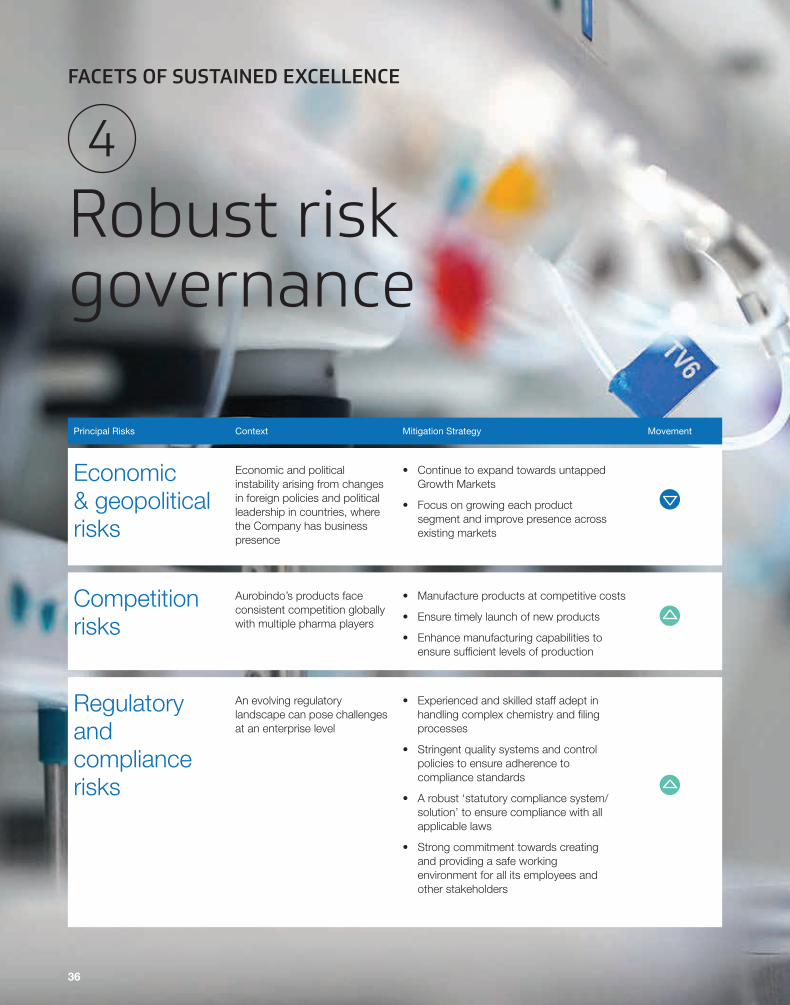
Robust risk governance
Principal Risks Context Mitigation Strategy Movement
Economic & geopolitical risks
Competition risks
Regulatory and compliance risks
Economic and political instability arising from changes in foreign policies and political leadership in countries, where the Company has business presence
Aurobindo’s products face consistent competition globally with multiple pharma players
An evolving regulatory landscape can pose challenges at an enterprise level
• Continue to expand towards untapped Growth Markets
• Focus on growing each product segment and improve presence across existing markets
• Manufacture products at competitive costs
• Ensure timely launch of new products
• Enhance manufacturing capabilities to ensure sufficient levels of production
• Experienced and skilled staff adept in handling complex chemistry and filing processes
• Stringent quality systems and control policies to ensure adherence to compliance standards
• A robust ‘statutory compliance system/solution’ to ensure compliance with all applicable laws
• Strong commitment towards creating and providing a safe working environment for all its employees and other stakeholders
FACETS OF SUSTAINED EXCELLENCE
4
36

ContextPrincipal Risks MovementMitigation Strategy
Financial Controls
Our majority expenses and investments are primarily in Indian currency. However, revenues are spread out across various international currencies. Therefore, our net expenses and any future investment or other income may be vulnerable to fluctuations in exchange rates.
• Established robust currency hedging strategy to safeguard ourselves
• Ensured reduction in borrowing costs with proper negotiation with banks
• Defined credit policy for all customers
• Consistent monitoring of daily fund requirements
Intellectual Property
Environment, Health and Safety and Sustainability
People risks
R&D initiatives are susceptible to significant risks. For example, specific product candidates are never approved; projects may even get abandoned, for various reasons
Any shortcoming in compliance with Company policies on maintaining EHS and Sustainability standards can jeopardize the brand salience
Lack of quality human resource may impact our growth targets and sustainability
• Established a strong team of experts and thought leaders in the R&D team
• Monitored our progress on specific product candidates in R&D
• Enhanced focus and regulatory activity on environmental issues
• Going an extra mile and thinking beyond regulatory compliance
• Stringent controls and governance framework, enabling compliance
• Identify and develop talent with potential
• Implement tools to train individuals on a periodic basis
• Sharpen and strengthen quality compliance across the organization
• Initiated Social Accountability Certification process (SA 8000 series) to sustain our commitment towards fair people management
Risk exposure increased Risk exposure decreased Risk exposure remains the same
Co
mp
any Overview
Statutory R
eports
Financial Statem
ents
Annual Report 2017-18 37

Environment, Health and Safety
We believe our EHS initiatives are part of our sustainability initiatives. We provide relevant information, training and support to all our employees to increase their awareness of the hazards and risks that are associated with our operations.
FACETS OF SUSTAINED EXCELLENCE
5
38
In FY2017-18, like previous years, we recorded sustained and satisfactory environment operations across our API and formulation units. Major API manufacturing units in Telangana state demonstrated compliance to Zero Liquid Discharge. We established 30 MW captive solar power plant project at Varisam, Srikakulam District, Andhra Pradesh. The plant is fully functional and helps reduce carbon footprint. Aurobindo has initiated SA 8000 accreditation process for two formulations manufacturing units and aims for certification in 2018.
LIQUID DISCHARGEWe conform to all regulations for disposal of wastewater to Common Effluent Treatment Plants (CETPs) or marine discharge across our formulation units and API facilities. We developed new initiatives for treatment of wastewater using advanced technologies like membrane bio-reactors that complement our expansion projects in some of our API manufacturing locations.
SOLID WASTE MANAGEMENTWe continue to follow the standardized practice of disposing organic wastes in which they are sent to cement units for reuse as auxiliary fuel in kilns. We use Treatment, Storage and Disposal Facilities (TSDF) to manage our inorganic and miscellaneous solid wastes. We also commenced new initiatives for additional control measures on fugitive emissions at waste treatment facilities at some of our API units. These initiatives include providing hoods on wastewater storage tanks, arrangement of additional scrubbers and so on. Additionally, our API units are equipped with monitoring instruments for continuous assessments of fugitive emissions in the premises.
During FY 2017-18, we started vermi-composting of garden and kitchen waste in one of our API manufacturing units. The pilot project was highly successful and going forward, we will implement it across our other units.
ENVIRONMENTAL SUSTENANCEWe have installed, online continuous emissions monitoring systems across our manufacturing units. These are connected to the central and concerned state pollution control boards according to norms. We completed our public consultation process for expansion of Aurobindo Unit XI.
Now, we are gearing up for the submission of Environmental Impact Assessment (EIA) report to the Ministry of Environment and Forests & Climate Change (MoEF & CC). During FY 2017-18, our various customers conducted environment assessments functions across our API and DP formulations units.
We also worked towards enriching our environment with the following programs: ~1 lakh square meters of area brought
under green cover 7,000 trees and 2,000 shrubs planted
across manufacturing locations Collaborated with Governments to
develop environmental awareness initiatives like Vanamahostavam by the Government of India, Vanam–Manam by Government of Andhra Pradesh; and Telangana Ku Haritha Haram by the Government of Telangana
SAFETY FIRSTIn our drive to improve safety culture, to change behavior and thought process, behavior-based safety programs are being implemented. Software modelling and quantitative risk assessment tools like PHAST software is being used to identify hazards, and mitigate risks from bulks flammable material storage.
We initiated safety pep-talks before every shift on hazards in activities and necessary precautions to be taken in case of a mishap. We also conduct Hazard and Operability Study (HAZOP) and risk analysis for all new products.
Historical events including injuries and other incidents were analyzed and actions have been initiated to address the common root causes. We have also put in place a training
matrix for contract workers based on their activities and special training modules have been implemented for production heads for managing and leading safety. Safety training person-hours increased
from 0.54% in last year to 0.59% during this year.
Sprinkler systems being put up as an additional layer of safety for bulk solvent storage yards
Safety tests were conducted for all new chemicals
Activity based risk assessments conducted three to four years earlier were re-visited and updated during the year
ANTI-MICROBIAL RESISTANCE (AMR) – A GLOBAL THREATSince 2015, there has been an intense focus by the international media on policy-level discussions over anti-microbial resistance (AMR). This has also raised concerns over pharmaceutical industry in India and Hyderabad in particular. Aurobindo recognizes that AMR is a serious global concern that needs to be handled through a comprehensive and multi-pronged strategy.
The Antimicrobial Resistance Benchmark is a first independent, detailed benchmarking of how pharmaceutical companies are halting the rise of drug resistance by Access to Medicine Foundation, an independent non-profit organization based in the Netherlands through collaboration with experts and specialists working across the spectrum of organizations trying to curb antimicrobial resistance.
The Access to Medicine Foundation approached Aurobindo, while describing the purpose of the benchmark, its process and the framework of the benchmark, in May 2017 with a request to take part in the initiative. Aurobindo has collaborated in the benchmarking exercise. The Antimicrobial Resistance Benchmark 2018 was published in January, 2018. The proposed 2020 AMR Benchmark will have more indicators with participation of 30 companies. We are engaging ourselves for the forthcoming 2020 AMR Benchmark as well.
Annual Report 2017-18 39
Co
mp
any Overview
Statutory R
eports
Financial Statem
ents
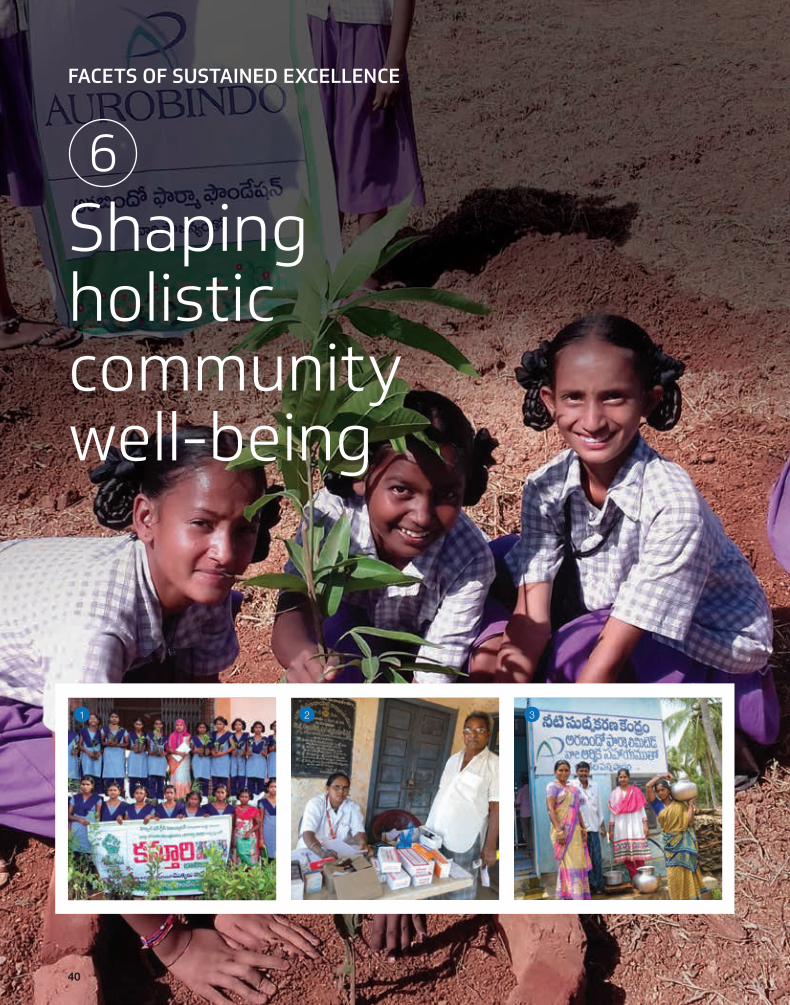
Shaping holistic community well-being
1 2 3
FACETS OF SUSTAINED EXCELLENCE
6
40
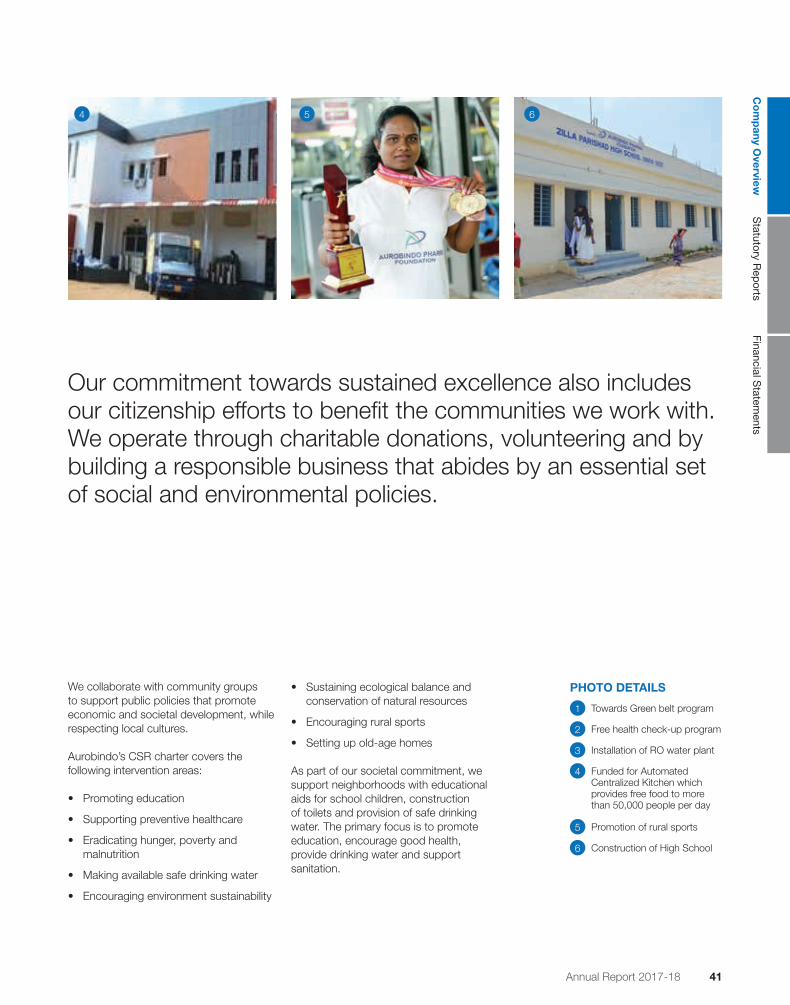
Our commitment towards sustained excellence also includes our citizenship efforts to benefit the communities we work with. We operate through charitable donations, volunteering and by building a responsible business that abides by an essential set of social and environmental policies.
We collaborate with community groups to support public policies that promote economic and societal development, while respecting local cultures.
Aurobindo’s CSR charter covers the following intervention areas:
• Promoting education
• Supporting preventive healthcare
• Eradicating hunger, poverty and malnutrition
• Making available safe drinking water
• Encouraging environment sustainability
• Sustaining ecological balance and conservation of natural resources
• Encouraging rural sports
• Setting up old-age homes
As part of our societal commitment, we support neighborhoods with educational aids for school children, construction of toilets and provision of safe drinking water. The primary focus is to promote education, encourage good health, provide drinking water and support sanitation.
4 5 6
PHOTO DETAILS
1 Towards Green belt program
2 Free health check-up program
3 Installation of RO water plant
4 Funded for Automated Centralized Kitchen which provides free food to more than 50,000 people per day
5 Promotion of rural sports
6 Construction of High School
Annual Report 2017-18 41
Co
mp
any Overview
Statutory R
eports
Financial Statem
ents

BOARD OF DIRECTORS
Mr. K. RAGUNATHANNon-Executive Chairman, Independent Director
Chartered Accountant
He is a CA by profession and a leading management consultant. He has over three decades of experience in consulting services.
Mr. K. NITHYANANDA REDDYVice Chairman, Whole-time Director, a promoter of the Company
Postgraduate in Science from Venkateswara University
He has been associated with the Company from its initial days. He is well-versed with the manufacturing technology and supervises the overall affairs of the Company.
Mr. N. GOVINDARAJANManaging Director
B.E. (Mechanical) from Annamalai University
He has more than 25 years of experience across a variety of domains such as active ingredients, CRAMS, finished dosages & biotechnology.
Dr. M. SIVAKUMARANWhole-time Director
Postgraduate in Science from University of Madras and PhD in Organic Chemistry from Jadavpur University
He has more than four decades of experience in the pharmaceutical industry and is responsible for the technological evolution of the Company. He looks after research and development, new product development and total quality management.
Mr. M. MADAN MOHAN REDDYWhole-time Director
Postgraduate in Science (Organic Chemistry) from Bhopal University
He has held top managerial positions in leading pharmaceutical companies. He commands over 25 years of valuable experience in the pharmaceutical industry. He looks after formulations manufacturing of the Company.
Mr. P. SARATH CHANDRA REDDYWhole-time Director
Graduate in Business Administration
He is a second-generation entrepreneur, experienced in general management and has expertise in project executions, IT, procurement and other aspects of the business.
42

Mr. P.V. RAMPRASAD REDDYNon-executive Director, Promoter
Postgraduate in Commerce from Venkateswara University
Prior to promoting Aurobindo in 1986, he held management positions in various pharmaceutical companies. In 2008, the widely read World Pharmaceutical Frontiers, named him among the top 35 most influential people in the pharmaceutical industry.
Mrs. SAVITA MAHAJANNon-executive, Independent Director
MBA, IIM Ahmedabad.
Mrs. Savita Mahajan, is the former Deputy Dean of the Indian School of Business (ISB). She was associated with the ISB for 14 years, since its inception in 2001, and was responsible for building its second campus at Mohali, Punjab, as its CEO. She has also carried out consulting and training assignments for corporations and development organizations, including GE Capital, the Planning Commission, the World Bank, and the Tibetan Government in exile of His Holiness, the Dalai Lama.
Mr. M. SITARAMA MURTYNon-executive, Independent Director
Postgraduate in Electronics from Andhra University
He is a professionally qualified banker and has over three decades of experience in the industry with various important positions in nationalized banks. He retired as the Managing Director & CEO of State Bank of Mysore, in 2003.
His specialized areas of interest are international banking, foreign exchange, money markets, funds management, credit management, rural development, computerization, commercial law and systems.
Dr. (Mrs.) AVNIT BIMAL SINGHNon-executive, Independent Director
M.B.B.S. degree from RNT Medical College, Udaipur and Postgraduate in obstetrics & gynecology from Rajasthan University
She is a medical practitioner and a senior obstetrician/gynecologist based in Hyderabad.
Chief Financial Officer
Mr. SANTHANAM
SUBRAMANIAN
Company Secretary
Mr. B. ADI REDDY
Statutory Auditors
M/s. BSR & Associates LLP
Chartered Accountants
Salarpuria Knowledge City
Orwell, 6th Floor, Unit-3
Sy No. 83/1, Plot No. 2, Raidurg
Hyderabad - 500 081
Registrars & Transfer Agents
M/s. Karvy Computershare
Private Limited
Karvy Selenium,
Tower B, Plot No.31-32,
Gachibowli, Financial District,
Nanakramguda,
Hyderabad - 500 032
Phone : +91 40 6716 2222
Fax : +91 40 2300 1153
E-mail : [email protected]
Bankers
Andhra Bank
Canara Bank
DBS Bank Limited
HDFC Bank Limited
ICICI Bank Limited
Standard Chartered Bank
State Bank of India
Corporate website:
www.aurobindo.com
CIN: L24239TG1986PLC015190
Annual Report 2017-18 43
Co
mp
any Overview
Statutory R
eports
Financial Statem
ents

Annual Report 2017-18 4544
(CIN - L24239TG1986PLC015190)Regd.Office: Plot No.2, Maitrivihar, Ameerpet, Hyderabad – 500 038
Tel No. +91 40 23736370, Fax No. +91 40 23747340E-mail: [email protected]; Website : www.aurobindo.com
NOTICE is hereby given that the 31st Annual General Meeting of the Members of Aurobindo Pharma Limited will be held on Thursday, the 30th day of August, 2018 at 3.00 p.m. at Kaveri Ball Room, Hotel Trident, Hi-tech City, Near Cyber Towers, Madhapur, Hyderabad 500 081 to transact the following business:
ORDINARY BUSINESS1) To receive, consider and adopt the Audited Standalone
Balance Sheet as at March 31, 2018, Statement of Profit and Loss for the financial year ended on March 31, 2018, Cash Flow Statement for the financial year ended March 31, 2018 and reports of Directors and Auditors thereon.
2) To receive, consider and adopt the Audited Consolidated Balance Sheet as at March 31, 2018, Statement of Profit and Loss for the financial year ended on March 31, 2018, Cash Flow Statement for the financial year ended March 31, 2018 and report of Auditors thereon.
3) To confirm the first interim dividend of `1.50 and second interim dividend of `1.00 in aggregate `2.50 per equity share of `1/- each, as dividend for the financial year 2017-18.
4) To appoint a Director in place of Mr. K.Nithyananda Reddy (DIN: 01284195) who retires by rotation at this Annual General Meeting and being eligible, seeks re-appointment.
5) To appoint a Director in place of Mr. M.Madan Mohan Reddy (DIN: 01284266) who retires by rotation at this Annual General Meeting and being eligible, seeks re-appointment.
SPECIAL BUSINESS6) To appoint Mrs. Savita Mahajan (DIN: 06492679) as an
Independent Director and in this regard to consider and, if thought fit, to pass, with or without modification(s), the following resolution as an Ordinary Resolution:
“RESOLVED THAT pursuant to the provisions of Sections 149, 152 read with Schedule IV and all other applicable provisions of the Companies Act, 2013 and the Companies
(Appointment and Qualification of Directors) Rules, 2014 (including any statutory modification(s) or re-enactment thereof for the time being in force), Mrs. Savita Mahajan (DIN: 06492679), who was appointed as an Additional Director of the Company by the Board of Directors with effect from December 16, 2017, pursuant to the provisions of Section 161(1) of the Companies Act, 2013 and the Articles of Association of the Company and whose term of office expires at this Annual General Meeting and in respect of whom the Company has received a notice in writing under Section 160 of the Companies Act, 2013 from a member proposing her candidature for the office of Director, be and is hereby appointed as an Independent Director of the Company to hold office for 2 (two) years up to December 15, 2019, not liable to retire by rotation.”
7) To re-appoint Mr. K.Nithyananda Reddy (DIN: 01284195) as Whole-time Director designated as Vice Chairman and in this regard to consider and, if thought fit, to pass, with or without modification(s), the following resolution as an Ordinary Resolution:
“RESOLVED THAT pursuant to the provisions of Sections 196, 197 and 203 read with Schedule V and all other applicable provisions of the Companies Act, 2013 and the Companies (Appointment and Remuneration of Managerial Personnel) Rules, 2014 (including any statutory modification(s) or re-enactment thereof for the time being in force) and subject to such other consents/approvals as may be required, Mr. K.Nithyananda Reddy (DIN: 01284195) be and is hereby re-appointed as Whole-time Director of the Company designated as Vice Chairman for a period of three years with effect from June 1, 2018, whose term of office shall be liable to determination by retirement of directors by rotation at a remuneration and perquisites as detailed below with liberty to the Board of Directors to alter and vary the terms and conditions of the said re-appointment and / or remuneration as it may deem fit and as may be acceptable to Mr.K.Nithyananda Reddy, subject to the same not exceeding the limits specified under Schedule V to the Companies Act, 2013 or any statutory modification(s) or re-enactment thereof.”
Aurobindo Pharma Limited
NOTICE

Annual Report 2017-18 4544
Com
pany O
verviewS
tatutory R
epo
rtsFinancial S
tatements
a Salary `650,000 per monthb House Rent Allowance `433,333 per monthc Medical Reimbursement i) Reimbursement of medical expenses incurred for self and family subject to a
ceiling of one month’s salary in a year or 3 months’ salary over a period of 3 years.
ii) Mediclaim insurance as per rules of the Company.d Leave Travel Concession For self & family once in a year as per the rules of the Companye Personal Accident Insurance Premium not exceeding `25,000 per annumf Club Fees Fees of clubs subject to a maximum of two clubs. This will not include admission and
life membership fee.g Provident fund, superannuation benefits and gratuity as per the rules of the Company subject to the ceilings as per the
guidelines for managerial remuneration in force from time to time.h Provision of Company’s car with driver.i Provision of free telephone at residence.j Encashment of leave as per the rules of the Company
8) To re-appoint Mr. N.Govindarajan (DIN: 00050482) as Managing Director and in this regard to consider and, if thought fit, to pass, with or without modification(s), the following resolution as an Ordinary Resolution:
“RESOLVED THAT pursuant to the provisions of Sections 196, 197 and 203 read with Schedule V and all other applicable provisions of the Companies Act, 2013 and the Companies (Appointment and Remuneration of Managerial Personnel) Rules, 2014 (including any statutory modification(s) or re-enactment thereof for the time being in force) and subject to such other consents/approvals as may be required, Mr. N.Govindarajan (DIN: 00050482) be and is hereby re-appointed as Managing Director of the Company for a period of three years with effect from June 1, 2018, whose term of office shall not be liable to determination by retirement of directors by rotation, at a remuneration and perquisites as detailed below with liberty to the Board of Directors to alter and vary the terms and conditions of the said re-appointment and / or remuneration as it may deem fit and as may be acceptable to Mr. N.Govindarajan, subject to the same not exceeding the limits specified under Schedule V to the Companies Act, 2013 or any statutory modification(s) or re-enactment thereof."
a Salary `1,935,940 per monthb House Rent Allowance `1,290,626 per monthc Medical Reimbursement i) Reimbursement of medical expenses incurred for self and family subject to a ceiling
of one month’s salary in a year or 3 months’ salary over a period of 3 years.ii) Mediclaim insurance as per rules of the Company.
d Leave Travel Concession For self & family once in a year as per the rules of the Companye Other Allowances `1,281,200 per annumf Provident fund, superannuation benefits and gratuity as per the rules of the Company subject to the ceilings as per the
guidelines for managerial remuneration in force from time to time.g Provision of Company’s car with driver.h Encashment of leave as per the rules of the Company
“RESOLVED FURTHER THAT in addition to the above salary and perquisites, commission will also be payable up to 1% of the net profits of the Company calculated in the manner referred in Section 198 of the Companies Act, 2013 subject to a ceiling of `100 million for each financial year, as may be decided by the Board of Directors of the Company, subject to the overall remuneration payable to Mr.N.Govindarajan, Managing Director of the Company not exceeding the limits specified under Schedule V to the Companies Act, 2013 or any statutory modification(s) or re-enactment thereof.”
9) To re-appoint Dr.M.Sivakumaran (DIN: 01284320) as Whole-time Director and in this regard to consider and, if thought fit, to pass, with or without modification(s), the following resolution as a Special Resolution:
“RESOLVED THAT pursuant to the provisions of Sections 196, 197 and 203 read with Schedule V and all other applicable provisions of the Companies Act, 2013 and the Companies (Appointment and Remuneration of Managerial Personnel) Rules, 2014 (including any statutory modification(s) or re-enactment thereof for the time being in force) and subject to such other consents/approvals as may be required, Dr.M.Sivakumaran (DIN: 01284320) be and is hereby re-appointed as Whole-time Director of the Company for a period of three years with effect from June 1, 2018, whose term of office shall be liable to determination by retirement of directors by rotation at a remuneration and perquisites as detailed below with liberty to the Board of Directors to alter and vary the terms and conditions of the said re-appointment and / or remuneration as it may deem fit and as may be acceptable to Dr.M.Sivakumaran, subject to the same not exceeding the limits specified under Schedule V to the Companies Act, 2013 or any statutory modification(s) or re-enactment thereof.”

Annual Report 2017-18 4746
a Salary `650,000 per monthb House Rent Allowance `433,333 per monthc Medical Reimbursement i) Reimbursement of medical expenses incurred for self and family subject to a ceiling
of one month’s salary in a year or 3 months’ salary over a period of 3 years.
ii) Mediclaim insurance as per rules of the Company. d Leave Travel Concession For self & family once in a year as per the rules of the Companye Personal Accident Insurance Premium not exceeding `25,000 per annumf Club Fees Fees of clubs subject to a maximum of two clubs. This will not include admission
and life membership fee.g Provident fund, superannuation benefits and gratuity as per the rules of the Company subject to the ceilings as per the
guidelines for managerial remuneration in force from time to time.h Provision of Company's car with driver. i Provision of free telephone at residence.j Encashment of leave as per the rules of the Company
10) To re-appoint Mr.M.Madan Mohan Reddy (DIN: 01284266) as Whole-time Director and in this regard to consider and, if thought fit, to pass, with or without modification(s), the following resolution as an Ordinary Resolution:
“RESOLVED THAT pursuant to the provisions of Sections 196, 197 and 203 read with Schedule V and all other applicable provisions of the Companies Act, 2013 and the Companies (Appointment and Remuneration of Managerial Personnel) Rules, 2014 (including any statutory modification(s) or re-enactment thereof for the time being in force) and subject to such other consents/approvals as may be required, Mr.M.Madan Mohan Reddy (DIN: 01284266) be and is hereby re-appointed as Whole-time Director of the Company for a period of three years with effect from June 1, 2018, whose term of office shall be liable to determination by retirement of directors by rotation at a remuneration and perquisites as detailed below with liberty to the Board of Directors to alter and vary the terms and conditions of the said re-appointment and / or remuneration as it may deem fit and as may be acceptable to Mr.M.Madan Mohan Reddy, subject to the same not exceeding the limits specified under Schedule V to the Companies Act, 2013 or any statutory modification(s) or re-enactment thereof.”
a Salary `1,150,000 per monthb House Rent Allowance `766,666 per monthc Medical Reimbursement i) Reimbursement of medical expenses incurred for self and family subject to a
ceiling of one month’s salary in a year or 3 months’ salary over a period of 3 years.
ii) Mediclaim insurance as per rules of the Company. d Leave Travel Concession For self & family once in a year as per the rules of the Companye Personal Accident Insurance Premium not exceeding `25,000 per annumf Club Fees Fees of clubs subject to a maximum of two clubs. This will not include admission and
life membership fee. g Provident fund, superannuation benefits and gratuity as per the rules of the Company subject to the ceilings as per the
guidelines for managerial remuneration in force from time to time.h Provision of Company's car with driver. i Provision of free telephone at residence.j Encashment of leave as per the rules of the Company
By Order of the Board
Place: Hyderabad B. Adi ReddyDate: 28 May 2018 Company Secretary

Annual Report 2017-18 4746
Com
pany O
verviewS
tatutory R
epo
rtsFinancial S
tatements
Notes1. A MEMBER ENTITLED TO ATTEND AND VOTE AT
THE MEETING IS ENTITLED TO APPOINT A PROXY TO ATTEND AND VOTE ON A POLL INSTEAD OF HIMESELF/ HERSELF AND THE PROXY NEED NOT BE A MEMBER OF THE COMPANY. A person can act as proxy on behalf of Members up to and not exceeding fifty and holding in the aggregate not more than ten percent of the total share capital of the Company. Further, a Member holding more than ten percent of the total share capital of the Company carrying voting rights may appoint a single person as proxy and such person shall not act as proxy for any other person or Member. In order to become valid, the proxy forms should be deposited at the Registered Office of the Company not less than 48 hours before the time fixed for holding the meeting. The proxy form is enclosed.
2. A Statement pursuant to Section 102 of the Companies Act, 2013 with respect to the Special Business set out in the Notice is annexed hereto and forms part of the Notice.
3. Relevant documents referred to in the accompanying Notice and the statement are open for inspection by the Members at the Registered Office of the Company on all working days during business hours up to the date of the meeting of the Company and also be kept at the venue during the AGM.
4. The Register of Members and Share Transfer Books of the Company will remain closed from August 24, 2018 to August 30, 2018 (both days inclusive).
5. The Board of Directors of the Company has declared first interim dividend @ 150% i.e., `1.50 per share of `1 each and second interim dividend @ 100% i.e. `1.00 per share of `1 each for the financial year 2017-18 and the same was paid on November 30, 2017 and February 28, 2018 respectively.
6. During the financial year 2017-18, the final unpaid/unclaimed dividend for the year 2009-10 and the interim unpaid /unclaimed dividend for the year 2010-11 were transferred to the Investor Education and Protection Fund (IEPF). The Company has uploaded the details of the unpaid and unclaimed dividend amounts of the previous years’ on the website of the Company (www.aurobindo.com) and also on the website of Ministry of Corporate Affairs. The unpaid/unclaimed final dividend for the year 2010-11 will be transferred to the Investor Education and Protection Fund of the Central Government on the due date. Also shares pertaining to unclaimed dividend for the year 2009-10 and the interim unpaid /unclaimed dividend for the year 2010-11 were also transferred to IEPF as per the prescribed Rules.
Members may note that shares as well as unclaimed dividends transferred to IEPF authority can be claimed back from them. Concerned Members/ Investors are advised to visit the weblink http://iepf.gov.in/IEPFA/refund.html or contact Karvy for lodging claim for refund of shares and / or dividend from the IEPF Authority.
Due dates for transfer of Final unclaimed/unpaid dividends for the financial year 2010-11 and thereafter to IEPF:
Financial year Dividend Declaration Date Due Date
2010-11 Final Dividend July 29, 2011 September 2, 20182011-12 Dividend August 7, 2012 September 12, 20192012-13 Interim Dividend February 7, 2013 March 14, 20202012-13 Final Dividend August 7, 2013 September 11, 20202013-14 Interim Dividend November 7, 2013 December 12, 20202013-14 2nd Interim Dividend May 30, 2014 July 4, 20212014-15 Interim Dividend August 7, 2014 September 11, 20212014-15 2nd Interim Dividend February 4, 2015 March 11, 20222014-15 3rd Interim Dividend May 28, 2015 July 2, 20222015-16 Interim Dividend August 12, 2015 September 16, 20222015-16 2nd Interim Dividend November 6, 2015 December 11, 20222015-16 3rd Interim Dividend February 9, 2016 March 16, 20232015-16 4th Interim Dividend May 30, 2016 July 5, 20232016-17 Interim Dividend November 14, 2016 December 20, 20232016-17 2nd Interim Dividend May 29, 2017 July 3, 20242017-18 Interim Dividend November 9, 2017 December 14, 20242017-18 2nd Interim Dividend February 7, 2018 March 14, 2025
Annual Report 2017-18 4948
7. Members holding shares in physical form are requested to notify immediately any change in their address to the Company’s Registrar and Transfer Agents, M/s. Karvy Computershare Private Limited. Members holding shares in electronic form may intimate any such changes to their respective Depository Participants (DPs).
8. To avoid loss of dividend warrants in transit and undue delay in respect of receipt of dividend warrants, the Company has provided a facility to the Members for remittance of dividend through the National Electronic Clearing System (NECS), Real Time Gross Settlement (RTGS)/ National Electronic Fund Transfer (NEFT). For this purpose, the details such as, name of the bank, name of the branch, 9- digit code number appearing on the MICR band of the cheque supplied by the bank, account type, account number etc. are to be furnished to your DP if the shares are in electronic form or to the Registrar & Transfer Agents, if they are held in physical mode.
9. The Annual Report for the financial year 2017-18 is being sent by electronic mode only to the Members whose Email addresses are registered with the Company/Depository Participant(s) for communication purpose unless any Member has requested for a hard copy of the same. For Members who have not registered their Email addresses, physical copies of the Annual Report for the financial year 2017-18 are being sent by the permitted mode. For Members who have not registered their e-mail addresses so far are requested to register their e-mail address for receiving all communication including Annual Report, Notices, Circulars, etc., from the Company electronically.
10. In terms of Section 108 of the Companies Act, 2013 read with the Companies (Management and Administration) Rules, 2014 and as per the requirements of the Securities and Exchange Board of India (Listing Obligations and Disclosure
Requirements) Regulations, 2015, the Company is providing the facility to its Members holding shares in physical or dematerialized form as on the cut-off date, i.e August 23, 2018, to exercise their right to vote by electronic means (e-voting) on any or all of the agenda items specified in the accompanying Notice of Annual General Meeting. Details of the process and manner of E-voting along with the User ID and Password are being sent separately to all the Members along with the Notice.
11. Members may also note that the Notice of the 31st Annual General Meeting and the Annual Report for the financial year 2017-18 will be available on the Company’s website www.aurobindo.com. The physical copies of the aforesaid documents will also be available at the Company’s Registered Office for inspection during normal business hours on working days. Members who require communication in physical form in addition to e-communication, or have any other queries, may write to us at [email protected].
12. Brief resume of Directors who have been proposed to be appointed/re-appointed, nature of their expertise in specific functional areas, names of companies in which they hold directorships and membership/chairmanships of Board Committees and shareholding in the Company as stipulated under Regulation 36 of Securities and Exchange Board of India (Listing Obligations and Disclosure Requirements) Regulations, 2015 and Secretarial Standard on General Meetings issued by ICSI are forming part of the Notice and is appended to the Notice.
13 The requirement of ratification of appointment of Statutory Auditors at every Annual General Meeting is done away by the Ministry of Corporate Affairs. Accordingly, no resolution is proposed for ratification of appointment of Statutory Auditors at this Annual General Meeting.

Annual Report 2017-18 4948
Com
pany O
verviewS
tatutory R
epo
rtsFinancial S
tatements
Statement pursuant to Section 102(1) of the Companies Act, 2013
Item 6The Board of Directors appointed Mrs. Savita Mahajan as an Additional Director categorized as Independent Director of the Company with effect from December 16, 2017, and accordingly, she holds office up to the ensuing Annual General Meeting of the Company. In terms of Sections 149 and 152 and the Rules made there under read with Schedule IV of the Companies Act, 2013, the Board of Directors have reviewed the declaration made by Mrs. Savita Mahajan that she meets the criteria of independence as provided in Section 149(6) of the Companies Act, 2013. The Board is of the view that the association of Mrs. Savita Mahajan would benefit the Company given the knowledge and experience of Mrs. Savita Mahajan. The Board is of the opinion that she fulfills the conditions specified in the Companies Act, 2013 and the Rules made thereunder and is independent of the management. Based on the recommendation of the Nomination and Remuneration/Compensation Committee, it is proposed to appoint Mrs. Savita Mahajan as an Independent Director of the Company as per the provisions of the Companies Act, 2013.
The Company has received a notice in writing under the provisions of Section 160 of the Companies Act, 2013 from a Member proposing the candidature of Mrs. Savita Mahajan for the office of Independent Director.
The Resolution seeks the approval of the Members for appointment of Mrs. Savita Mahajan as an Independent Director of the Company up to December 15, 2019 pursuant to Section 149 and other applicable provisions of the Companies Act, 2013 and the Rules made there under. She is not liable to retire by rotation.
The terms and conditions of appointment shall be open for inspection by Members at the Registered Office during business hours on all working days and will also be kept open at the venue during the AGM.
She does not hold any shares in the Company.
Additional information in respect of Mrs. Savita Mahajan pursuant to Listing Regulation 2015 and Secretarial Standard on General Meetings is appended to the AGM Notice.
No Director, Key Managerial Personnel or their relatives, except Mrs. Savita Mahajan, to whom the Resolution relates, is interested or concerned in the Resolution.
The Board recommends the Ordinary Resolution set forth in Item 6 for approval of the Members.
Item 7Mr. K.Nithyananda Reddy was re-appointed as Whole-time Director designated as Vice Chairman of the Company with effect from June 1, 2015 for a period of 3 years which was approved at the 28th Annual General Meeting of the Company
held on August 27, 2015. Mr. K.Nithyananda Reddy is one of the promoters of the Company. The Board considering the significant contribution made by him in the growth and development of the Company and based on the recommendation of Nomination and Remuneration/ Compensation Committee, re-appointed Mr. K.Nithyananda Reddy as Whole-time Director designated as Vice Chairman of the Company with effect from June 1, 2018 for a period of three years, subject to the approval of shareholders at the general meeting.
The terms of reappointment of Mr. K.Nithyananda Reddy and remuneration payable to him are as set out in Item No.7 of the Notice. Presently Mr.K.Nithyananda Reddy is drawing a remuneration of `13 million p.a. and other perquisites.
Additional information in respect of Mr. K. Nithyananda Reddy pursuant to Listing Regulations 2015 and Secretarial Standard on General Meetings is appended to the Notice.
No Director, Key Managerial Personnel or their relatives, except Mr. K.Nithyananda Reddy to whom the resolution relates and his relative Mr.P.Sarath Chandra Reddy, Whole-time Director, are interested or concerned in the Resolution.
The Board recommends the Ordinary Resolution set forth in Item 7 for approval of the Members.
Item 8Mr. N. Govindarajan was re-appointed as Managing Director of the Company with effect from June 1, 2015 for a period of 3 years which was approved at the 28th Annual General Meeting of the Company held on August 27, 2015. The Board, considering the significant contribution made by him in the growth and development of the Company and based on the recommendation of the Nomination and Remuneration/Compensation Committee, re-appointed Mr. N. Govindarajan as Managing Director of the Company with effect from June 1, 2018 for a further period of three years, subject to the approval of Members at the general meeting.
The terms of reappointment of Mr. N. Govindarajan and remuneration payable to him are as set out in Item 8 of the Notice. Presently, he is drawing remuneration of `38.72 million per annum, allowances of `1.28 million per annum and other perquisites and also being paid a commission up to 1% of the net profits of the Company calculated in the manner referred in Section 198 of the Companies Act, 2013 subject to a ceiling of `100 million for each financial year.
Additional information in respect of Mr. N. Govindarajan pursuant to Listing Regulations 2015 and Secretarial Standard on General Meetings is appended to the Notice.
No Director, Key Managerial Personnel or their relatives, except Mr. N. Govindarajan, to whom the resolution relates, is interested or concerned in the Resolution.

Annual Report 2017-18 5150
The Board recommends the Ordinary Resolution set forth in Item 8 for approval of the Members.
Item 9Dr. M.Sivakumaran was re-appointed as Whole-time Director of the Company with effect from June 1, 2015 for a period of 3 years which was approved at the 28th Annual General Meeting of the Company held on August 27, 2015. The Board considering the significant contribution made by Dr. M.Sivakumaran in the growth and development of the Company and based on the recommendation of Nomination and Remuneration/ Compensation Committee, re-appointed Dr. M.Sivakumaran as Whole-time Director of the Company with effect from June 1, 2018 for a period of three years, subject to the approval of shareholders at the general meeting.
Dr. M.Sivakumaran is responsible for the technological evolution of the Company. He looks after research and development, new product development and total quality management. Considering his long association with the Company and the pivotal role being played on the technical front, the Board justifies the proposal of his re-appointment.
The terms of reappointment of Dr. M.Sivakumaran and remuneration payable to him are as set out in Item No.9 of the Notice. Presently Dr. M.Sivakumaran is drawing a remuneration of `13 million p.a. and other perquisites.
Additional information in respect of Dr. M. Sivakumaran pursuant to Listing Regulations 2015 and Secretarial Standard on General Meetings is appended to the Notice.
No Director, Key Managerial Personnel or their relatives, except Dr. M.Sivakumaran, to whom the resolution relates, is interested or concerned in the Resolution.
The Board recommends the Special Resolution set forth in Item 9 for approval of the Members.
Item 10Mr. M.Madan Mohan Reddy was re-appointed as Whole-time Director of the Company with effect from June 1, 2015 for a period of 3 years which was approved at the 25th Annual General Meeting of the Company held on August 27, 2015. The Board considering the significant contribution made by him in the growth and development of the Company and based on the recommendation of Nomination and Remuneration/ Compensation Committee, re-appointed Mr. M.Madan Mohan Reddy as Whole-time Director of the Company with effect from June 1, 2018 for a period of three years, subject to the approval of shareholders at the general meeting.
The terms of reappointment of Mr. M.Madan Mohan Reddy and remuneration payable to him are as set out in Item No.10 of the Notice. Presently Mr.M.Madan Mohan Reddy is drawing a remuneration of `23 million p.a. and other perquisites.
Additional information in respect of Mr. M. Madan Mohan Reddy pursuant to Listing Regulations 2015 and Secretarial Standard on General Meetings is appended to the Notice.
No Director, Key Managerial Personnel or their relatives, except Mr. M.Madan Mohan Reddy, to whom the resolution relates, is interested or concerned in the Resolution.
The Board recommends the Ordinary Resolution set forth in Item 10 for approval of the Members.
By Order of the Board
Place: Hyderabad B. Adi ReddyDate: 28 May 2018 Company Secretary

Annual Report 2017-18 5150
Com
pany O
verviewS
tatutory R
epo
rtsFinancial S
tatements
Details of the Directors proposed to be appointed/re-appointed at the AGM scheduled to be held on Thursday, August 30, 2018 as required under Regulation 36 of the SEBI (Listing Obligations and Disclosure Requirements) Regulations 2015 and Secretarial Standard on General Meetings are as given below:
Particulars Mrs.Savita Mahajan Mr.K.Nithyananda Reddy
Mr.N.Govindarajan Dr.M. Sivakumaran Mr.M.Madan Mohan Reddy
Age 59 60 50 75 58Qualification Degree in Economics and MBA
from IIM AhmedabadPostgraduate in Science
BE (Mechanical) Postgraduate in Science and PhD
Postgraduate in Science
Experience (including expertise in specific functional area)/Brief Resume
She was associated with the ISB for 14 years, since its inception in 2001, and was responsible for building its second campus at Mohali, Punjab, as its CEO. She holds a degree in Economics from Delhi University and did her MBA from the Indian Institute of Management, Ahmedabad, in 1981. Since then, she worked in several Indian organizations, including Maruti Udyog Limited, Bharat Technologies, Karvy Consultants, and Intergraph India, in diverse industry sectors, including automobiles, engineering, financial services and software. Her professional interests include Strategic Management, Institutional Values, Leadership and Organizational Change. She has also carried out consulting and training assignments for corporations and development organizations, including GE Capital, the Planning Commission, the World Bank, and the Tibetan Government in exile of His Holiness, the Dalai Lama. Mrs. Savita Mahajan was featured in Business Today’s 2013 list of “30 Most Powerful Women” in Indian Business.
He has been associated with the Company from the initial days as a promoter, and is well versed with manufacturing technologies, systems, processes and controls.
He has more than 25 years of experience across a variety of domains such as active pharmaceutical ingredients, CRAMS, finished dosages & biotechnology. Mr.N.Govindarajan is overseeing active pharmaceutical ingredients operations and CRAMS development business of the Company and also dietary supplements.
He has about 43 years of experience in the pharmaceutical industry. He is responsible for the technological evolution of the Company. Dr.M.Sivakumaran looks after research and development, generic product development and total quality management.
He held top managerial positions in leading pharmaceutical companies. He commands 28 years of experience in the pharmaceutical industry.
Terms and Conditions of Appointment / Reappointment
As per the resolution at item no. 6 of the Notice convening Annual General Meeting on August 30, 2018 read with explanatory statement thereto, Mrs. Savita Mahajan is proposed to be appointed as an Independent Director of the Company for a period of two years i.e. from 16 December 2017 to 15 December 2019.
As per the resolution at item no. 7 of the Notice convening Annual General Meeting on August 30, 2018 read with explanatory statement thereto, Mr.K.Nithyananda Reddy is proposed to be re-appointed as Whole-time Director designated as Vice Chairman.
As per the resolution at item no. 8 of the Notice convening Annual General Meeting on August 30, 2018 read with explanatory statement thereto, Mr.N.Govindarajan is proposed to be appointed as Managing Director.
As per the resolution at item No. 9 of the Notice convening Annual General Meeting on August 30, 2018 read with explanatory statement thereto, Dr.M. Sivakumaran is proposed to be re-appointed as Whole-time Director
As per the resolution at item No. 10 of the Notice convening Annual General Meeting on August 30, 2018 read with explanatory statement thereto, Mr.M. Madam Mohan Reddy is proposed to be re-appointed as Whole-time Director

Annual Report 2017-18 5352
Particulars Mrs.Savita Mahajan Mr.K.Nithyananda Reddy
Mr.N.Govindarajan Dr.M. Sivakumaran Mr.M.Madan Mohan Reddy
Remuneration last drawn (including sitting fees, if any)
`0.10 Million `15.12 Million `146.27 Million `15.12 Million `26.74 Million
Remuneration proposed to be paid
No remuneration other than sitting fee for attending board/committee meetings.
As per resolution at item No.7 of the notice convening this meeting read with explanatory statement thereto
As per resolution at item No.8 of the Notice convening this meeting read with explanatory statement thereto
As per resolution at item No.9 of the notice convening this meeting read with explanatory statement thereto
As per resolution at item No.10 of the notice convening this meeting read with explanatory statement thereto
Date of first appointment on the Board
December 16, 2017 December 26, 1986 May 29, 2012 March 30 1992 September 18, 2006
Shareholding in the Company as on March 31, 2018
Nil 25,359,572 equity shares
Nil 14,491,360 equity shares
2,010 equity shares
Relationship with other Directors/Key Managerial Personnel
Not related to any Director /Key Managerial Personnel
He is related to Mr.P.Sarath Chandra Reddy, Whole-time Director of the Company.
Not related to any Director /Key Managerial Personnel
Not related to any Director /Key Managerial Personnel
Not related to any Director /Key Managerial Personnel
Number of meetings of the Board attended during the year
Nil 4 5 5 5
Directorships of other Boards as on March 31, 2018
Orient Green Power Company Limited
APL Healthcare Limited, APL Research Centre Limited, Auro Peptides Limited, AuroZymes Limited, Auronext Pharma Private Limited, Silicon Life Sciences Private Limited, Hyacinths Pharma Private Limited, Auro Pharma India Private Limited, Raidurgam Developers Limited and Patancheru Envirotech Limited.
Nil APL Research Centre Limited,
APL Healthcare Limited,
Curepro Parentarals Limted,
Auro Peptides Limited,
AuroZymes Limited
Tergene Biotech Private Limited
Eugia Pharma Specialities Limited, Curepro Parenterals Limited, APL Research Centre Limited, AuroZymes Limited, Pravesha Industries Private Limited, SGD Pharma Ltd., Crest Cellulose Private Limited, Oremsi Plastics Private Limited andPharmaceuticals Export Promotion Council of India.
Membership / Chairmanship of Committees of other Boards as on March 31, 2018
Nil Auro Peptides Ltd.Audit Committee-MemberNomination & Remuneration Committee-MemberCSR Committee-Chairman
Nil Nil Nil

Annual Report 2017-18 5352
Com
pany O
verviewS
tatutory R
epo
rtsFinancial S
tatements
BOARD’S REPORT
Dear Members,
Your Directors are pleased to present the 31st Annual Report of the Company together with the audited accounts for the financial year ended 31 March 2018.
FINANCIAL HIGHLIGHTS
Standalone financials ` Million
2017-18 2016-17
Revenue from operations 103,031.5 97,812.1EBITDA 26,700.0 23,740.0Depreciation 3,548.3 2,861.7Finance cost 528.9 451.6Profit before Tax 23,429.4 21,785.7Provision for Tax 5,301.7 4,718.1Net Profit after tax 18,127.7 17,067.6Other Comprehensive Income/ (expense)
-21.8 -56.1
Total Comprehensive income for the period
18,105.9 17,011.5
DIVIDENDYour Company has paid first interim dividend of 150% i.e. `1.50 per equity share of `1/- and second interim dividend of 100% i.e `1/- per equity share of `1/-. The total dividend for the financial year 2017-18 comes to 250% i.e. `2.50 per equity share of `1/- against 250% i.e `2.50 per equity share of `1/- paid in the previous year.
Pursuant to Regulation 43A of the SEBI (Listing Obligations and Disclosure Requirements) Regulations, 2015, top five hundred listed entities based on market capitalization are required to formulate a Dividend Distribution Policy. The Board has approved and adopted the Dividend Distribution Policy and the same is available on the Company's website viz. www.aurobindo.com.
PERFORMANCE REVIEWYour Company continued to strengthen its position across global markets during the year. It delivered yet another year of consistent and profitable growth; and fortified its manufacturing and research capabilities.
Your Company continued to build a robust pipeline of products for the future and invested in elevating operational efficiencies to improve the quality of products. The holistic wellbeing of employees also remained a priority. During the reporting period, there was a sustained focus to augment the strengths of your Company and sharpen competitive advantages with a view towards long term value creation.
On a standalone basis, your Company revenues registered a growth of 5.3% reaching `103,032 million in FY 2017-18, compared to `97,812 million. EBITDA stood at `26,700 million, an increase of 12.5% over FY2016-17. EBITDA margins increased by ~160 bps to 25.9% during the year and profit before
tax for the year at standalone level was `23,429 million, a 7.5% growth over the preceding year. Your Company’s net profit was at `18,128 million, a growth of 6.2% over `17,068 million reported in FY2016-17. The diluted earnings per share stood at `30.94 compared to `29.16 in FY2016-17.
On a consolidated basis the performance for the FY2017-18 is, revenues increased to `164,998 million from `150,899 million in the previous year, at 9.3% growth. The formulations business registered a revenue growth of 12.4% and improved to `135,332 million from `120,454 million in the previous year. The API business sales stood at `29,622 million from `30,421 million in the corresponding previous period. EBITDA margins expanded by ~20 bps to 23.0% vis-à-vis 22.8% in 2016-17. EBITDA was `37,885 million, witnessed a 10.3% growth over the corresponding previous period. Net profit grew by 5.3% to `24,232 million. The growth in net profit was impacted by a one-time expense related to a tax charge.
The diluted earnings per share stood at `41.36 compared to `39.33 in 2016-17. The healthy growth in revenues and profits were driven by new product launches across markets, improvement in market share of existing products, enhanced productivity and cost optimizations.
In the US, the Tax Cuts and Jobs Act of 2017 was approved and enacted into a law on December 22, 2017. This resulted in reduction of federal corporate tax from 35% to 21%. As a result, the Company re-evaluated its U.S. deferred tax assets and liabilities, and recognized a one-time charge of `664 million.
As on 31 March 2018, the Company filed 478 ANDAs on a cumulative basis. Of the total count, 327 have final approvals and 34 have tentative approvals, including 11 ANDAs which are tentatively approved under the US President's Emergency Plan for AIDS Relief (PEPFAR) and the balance 117 ANDAs are under review.
Your Company witnessed growth across the key geographies in the formulations segment. The US business reported 9% growth to `74,421 million and contributed 45% to total revenues. The growth in revenues was driven by new product launches, including complex products, coupled with an increase in the market share of existing products. Your Company witnessed growth, despite pricing pressures in the orals segment. The pricing pressure in orals segment was led by an increase in competition with the improved pace of USFDA approvals and customer consolidation.
Your Company registered a robust 32.9% growth in revenue from the Europe formulations business, reaching to `43,544 million in FY2017-18 over the previous year revenue of `32,771 million. Aurobindo continues to work towards improving synergies between the acquired businesses of Actavis and Generis, and the Company's existing ground presence in several markets. During the year under review, the EBITDA margins in the European region touched double digit.

Annual Report 2017-18 5554
The improvement in revenue and profitability happened on the back of transferring manufacturing base for products to India, continued streamlining of business structures, integrating and optimizing the information flow to improve decision-making and control; and new product launches, including Day-1 launches. As on 31 March 2018, the Company has transferred the manufacturing activities of 83 products from Europe to India.
Your Company’s formulations sales in Growth Markets including Brazil, Canada, Columbia and South Africa grew by 18.7% to `8,971 million vis-à-vis `7,556 million reported in 2016-17. This segment remains a key market for Aurobindo and renewed efforts are made to position your Company's products as one of the preferred suppliers in the existing and new geographies.
The ARV formulations business was negatively impacted during the year and posted sales of `8,396 million vis-à-vis `11,854 million. The decline in sales was due to incremental pricing pressure in one of the key molecules and delay in some country specific tenders. During the year, the Company received tentative approval from USFDA for Dolutegravir triple combination product (Tenofovir, Lamivudine and Dolutegravir tablets) under the PEPFAR program, which enables your Company to launch the product in PEPFAR markets. Your Company is the second pharma enterprise to receive the USFDA approval for this drug.
OUTLOOKYour Company will continue to invest in building a diversified product portfolio and improve its market share in the existing product basket. Quality and regulatory compliance will continue to be the cornerstone of your Company’s overall operations. As the demand for critical therapies continue to rise, your Company continues to develop differentiated and new drug delivery systems in these therapies and contribute to improve the lives of patients globally.
In the coming years, the organization’s key priorities will comprise: building a robust pipeline of complex molecules and setting up state-of-the art manufacturing facilities for select therapies that meet high compliance standards; minimizing wastage and maximizing the recycling of materials; reducing the risk in operations; enhancing community wellbeing and being a preferred partner to all stakeholders.
Despite shifting industry trends, your Company’s strong balance sheet and robust operations have helped it stay on track of its growth plans. Your Company's product portfolio and pipeline has significant potential for sustainable volume growth. Research and Development (R&D) initiative has been undertaken on difficult-to-manufacture and differentiated products, with possible low competitive pressure. Work is currently in progress for development of differentiated molecules, both for oral and injectable products. FY2018-19 promises to be a year with many milestones across a differentiated product basket.
Aurobindo is optimistic of the sustained value that will be created through the planned new initiatives. In the last fiscal, your Company made considerable development across the upcoming product categories and the same is encapsulated in R&D section.
To manufacture a growing product pipeline, your Company initiated significant improvements in capacities to bolster volumes:
• Unit XVI: The Company has successfully commissioned Betalactum injectables manufacturing facility at Jadcherla, Telengana in FY2017-18, which will improve the injectable volumes for the US, EU and Growth Markets.
• Unit X: The Company is building an USFDA compliant oral manufacturing facility at Naidupet, Andhra Pradesh; and the facility will be commissioned during FY2018-19. It has been inspected by USFDA and EMA.
• Injectable facility in US: The Company is in the process of setting up a non-Betalactum injectable manufacturing facility in the US, which is in line with the diversification strategy.
For a sustainable future growth and to spread the geographical risk, Aurobindo has been steadily expanding its European footprint since 2006, via acquisitions across several key markets and organically building a diversified product basket. The acquisition of Generis, referred to earlier, builds upon an already successful growth strategy.
Your Company's products have the potential to improve the lives of millions of patients across the globe.
RESEARCH & DEVELOPMENTYour Company's new product development initiatives ranges from conventional orals to injectable products to more complex and advanced dosage forms. In the last fiscal, the R&D efforts led to filing ANDAs of complex and niche products including oral and sterile drug products
Oncology and HormonesEugia’s product portfolio comprises of 79 products that are prescribed for Oncology, Hormone & Immuno-suppressant indications. The Oncology product portfolio is diverse and are approved for treating cancers (involving 16 different indications), either in single or in combination with other drugs. The Hormonal products that are being developed by Eugia are approved prescribed for indications involving, Pre-term birth, birth control, Amenorrhea & Hypergonadism.
Oncology products are a highly specialized class of products and are difficult to produce due to their toxic characteristics and the need for specialized preparation and handling. Of the 71 oncology products which have been shortlisted, 55 products are already in the development phase. We have filed 7 ANDAs as on 31 March, 2018, in the Oncology Segment. In hormones segment, a total of eight products have been identified for development and the Company has already filed six ANDAs.

Annual Report 2017-18 5554
Com
pany O
verviewS
tatutory R
epo
rtsFinancial S
tatements
The Company has also planned to develop and manufacture the Oncology and Hormone products for distribution in Europe markets. With a plan to de-risk the portfolio and improve market share, the Company aims to file these products across Canada and other key emerging markets in future. The facility is designed to cater to ~20% of the global volume demand for the products that are part of Eugia’s portfolio.
The manufacturing facility at Eugia comprises of the Oral solid dosage forms (Tablets & Capsules) and Injectables (Wet vials, dry vials & pre-filled syringes) and was inspected twice by the USFDA in FY2017-18. The facility has also been inspected by EMA in FY2017-18 and has been approved without any observations.
In FY2017-18, the Company filed 11 ANDAs with the USFDA and Exhibit batches for 25 products were completed.
In FY2018-19, it is estimated that Exhibit batches for 20-24 products will be completed and 15-18 ANDA’s will be filed in US market.
The Company has received its first ANDA approval (product name: Capecitabine) in the first quarter of FY2018-19.
According to IQVIA, global spending on cancer therapies and supportive care drugs now exceeds $133 billion. The U.S. is the biggest contributor to this trend with spends accounting for 46% of global spending. The global market for oncology therapeutic medicines is estimated to reach $200 billion by 2022, averaging 10—13% growth over the next five years, with the U.S. market reaching as much as $100 billion by 2022, averaging 12–15% growth. The global market size of the products under development is $ 45 billion.
Biologics The Company started working on biosimilars a couple of years ago. In February 2017, Aurobindo acquired five molecules from TL Biopharmaceuticals. Your Company is currently developing nine more products and the pipeline spans across oncology, rheumatology and ophthalmology. The global market size of these products is around $ 45 billion.
To build this segment into an important future growth driver, your Company has invested in a state-of-the-art manufacturing facility with 1,40,000 square feet comprising of mammalian cell culture, microbial fermentation, quality control, fill and finish sections. This facility has been commissioned and the exhibit batches will be completed in FY2018-19. With a total R&D employee strength of 75 people for biologics division, the Company will start Phase I clinical trials for its lead molecule i.e. Bevacizumab – a biosimilar to Avastin® in FY2018-19. Apart from Bevacizumab, the Company has also started doing animal toxic studies on an ophthalmic product which will be ready for Phase III trials in FY2019-20.
Peptides Peptides are short chains of amino acid monomers linked by peptide (amide) bonds. The Company has invested in developing a state-of-the-art peptide development laboratory and four
manufacturing suites for its commercial production. Till date, Auro Peptides have developed the process for manufacturing 14 peptides; and two more molecules are in the process of development.
The unit has already filed four DMFs with US regulatory authorities and is planning to file an additional 3 DMFs in FY2018-19. Presently, Auro Peptides is supplying material for formulation development and the execution of its validation batches. These peptide APIs are being utilized for the development of three liposomal injectable products and seven injectable products. The addressable market size of these products is about $ 12.2 billion
Biocatalysis Aurobindo invents, identifies and produces biocatalysts through fermentation processes which are subsequently developed into scalable biocatalytic solutions. This reduces the usage of chemicals within the processes during pharmaceutical manufacturing, saving costs whilst benefiting from this green technology. The high technical base and core competence of Aurobindo has made it easier to initiate the entry in to enzyme production.
The Company has a highly qualified dedicated team of over 30 professionals, with an on-going technology development program which has built a library of over 7,000+ biocatalysts across 15 classes of enzymes. Supplementing the initial R&D molecular and microbiology facilities, your Company has invested in state-of-the-art fermentation development equipment which encompasses twelve 20 litre automated fermentation vessels, with associated downstream processing including: homogenization, tangential flow filtration and resin purification. A number of biocatalytic projects and processes have been identified utilizing internally developed technology, and these are now progressing through process validation. This development work is supported by the 1KL pilot facility leading to the 10KL enzyme production facility.
PenemsPenem products are manufactured at the Company’s Auronext manufacturing facility at Bhiwadi, Rajasthan. The total capacity of the unit is ~ 1.0 million vials per month. The facility was re-inspected in February 2018 and received Establishment Inspection Report (EIR).
The Company has filed two ANDAs with USFDA and received approvals for both the products. The approval for Meropenem was received in March 2017 and the same was launched in US in April 2017. In the month of June 2018, an approval was received for Ertapenem injection and is in the process of launching in US. The market size of these products put together is around $ 480 million for the 12 months ending 31 March 2018. In Europe, the Company already launched Meropenem injection (with a market size which is over $ 200 million) and expects to launch Ertapenem in FY2018-19

Annual Report 2017-18 5756
Dermatology TopicalsThe Company has currently identified 38 products for development and started working on 23 products. The market size of these products is $ 5 billion.
The identified products have presence across various dosages including Ointment (7 nos), Cream (14 nos), Gel (12 nos) and Solution (5 nos) in the pipeline. Of the 38 products under development, around 24 products need clinical trials or BE studies which are planned to kick-start in Jan 2019.
In FY2017-18, the Company has produced exhibit batches for two products and is planning to execute exhibit batches for another 17 products in FY2018-19. APL, North Carolina site, is expected to be ready for manufacturing these products in August 2018. The Company filed the first ANDA in the first quarter of FY2018-19; and is planning to file another five ANDAs by the end of this fiscal.
Transdermal Currently, the Company’s pipeline includes five patches under development. The addressable global market size of these products is around $ 2.8 billion. The clinical studies for these products had started in June 2018 and the first ANDA for patches will be filed in November 2019. APL, North Carolina site is planned for manufacturing these products; and the capacity will be ready by October 2018.
RespiratoryInhalersYour Company has been working towards creating a diverse portfolio of products with different drug delivery systems. With the respiratory portfolio, the Company now has six inhaler products under development; of which four products are likely to come up for exhibit batches during FY2018-19. The market size of these products under development is $ 7.5 billion.
The pilot pharmacokinetics analysis will start during April 2019 for one of the key products; and the Company expects to file its first ANDA during the first quarter of 2020. These products will be manufactured from APL, North Carolina, which will be commissioned in October 2018 for exhibit batch production. This facility will be equipped with a capacity to handle 10 to 15 million units with eight head filling machines and a 500L vessel.
NasalsThe Company has a strong pipeline of nasals with five products under development, of which two products already had exhibit batches in FY 18; and another two products are expected to have exhibit batches during FY2018-19. The market size of these products is $ 0.5 billion. The Company expects to file two ANDAs in FY2018-19 and the remaining will be filed in FY2019-20. These products are manufactured in Unit X; and the unit has a current monthly capacity to produce 1.4 million units.
Depot InjectionsYour Company is currently developing four depot injections, which have a combined addressable market size of $ 3.6 billion. These products are ready for scaling-up and waiting for manufacturing capabilities to be commissioned.
VaccinesThe need for improved public health and medicines to protect infants is fast becoming a global priority. In view of this reality, your Company was focused on development of the pneumococcal conjugate vaccine (PCV), and the development was completed in FY2017-18. The global market size of the product is $ 6 billion.
The Company has received the approval to conduct Phase I clinical trials from the Drug Controller General of India (DCGI) in April 2018; and has initiated the trials in May 2018 and completed the same in June 2018. The Company will be submitting the report to DGCI by August 2018 and Phase 2 clinical trials are expected to commence in the third quarter of FY2018-19.
All the clinical trials are expected to be completed by 2020; and the Company expects to be ready for taking part in the upcoming government tender during 2021. Your Company is setting up a manufacturing facility in Hyderabad with an annual capacity of 100 million doses.
ENVIRONMENT, HEALTH & SAFETYYour Company’s EHS imperatives are part of its broader sustainability journey. These initiatives focus on reducing the environment footprint, help enhance wellbeing of employees and set high safety standards for employees, contractors and visitors. While several steps have been taken to enhance these standards and raise awareness across the organization, Team Aurobindo believes that it is an area with no finish line; and more needs to be done to remain ahead of the curve in this dynamic industry.
Few initiatives taken during the year comprise of
EnvironmentIn FY2017-18, the Company continued to ensure that environmental norms were abided by all its API and Formulation units. API manufacturing units in Telangana state demonstrated compliance to Zero Liquid Discharge norms.
The Formulations Units and other API units have conformed to the regulations for disposal of wastewater to Common Effluent Treatment Plants (CETPs) or marine discharge. New initiatives for treatment of wastewater using advanced technologies, viz., membrane bio-reactors, supplementing the infrastructure required in line with expansion projects have been started for some of the API manufacturing facilities.
Standardized practices for disposal of organic wastes to cement units for reuse as auxiliary fuel in cement kilns continues. While inorganic and miscellaneous solid wastes are being disposed to treatment, storage and disposal facilities (TSDF). New

Annual Report 2017-18 5756
Com
pany O
verviewS
tatutory R
epo
rtsFinancial S
tatements
initiatives for additional control measures on fugitive emissions at waste treatment facilities at some of the API initiatives like providing hoods on waste water storage tanks, arrangement of additional scrubbers, among others have been started. The API units are equipped with monitoring instruments for continuous assessments of fugitive emissions in the premises.
Vermi-composting of garden and kitchen waste was attempted in one of the API manufacturing units on a pilot basis that proved to be highly successful. This initiative will be taken forward to other units in the future.
The Company has installed, online continuous emissions monitoring systems across manufacturing units. These are connected to the Central and concerned State Pollution Control Boards as per norms. Public consultation process for expansion of Aurobindo Unit XI is completed and is gearing up for the submission of Environmental Impact Assessment (EIA) report to the Ministry of Environments and Forests & Climate Change (MoEF & CC). Environment assessments across API and DP formulations units by Aurobindo’s customers in FY2017-18 concluded on a highly satisfactory note.
Safety To maintain a safe working environment, safety pep-talks were initiated before every shift, on hazards in activities and necessary precautions to be taken in case of a mishap. As an important process inclusion, hazard and operability study (HAZOP) and risk analysis were conducted for all new products.
Historical events including injuries and other incidents were analysed and actions have been initiated to address the common root causes. The Company has created a training matrix for contract workers, based on their initiatives and special training modules have been implemented for production heads for managing and leading the safety agenda.
HUMAN RESOURCESYour Company’s ability to respond to new challenges and opportunities depends on effective leadership, knowledge, expertise and new ideas shared at all levels. Therefore, Aurobindo recognizes human capital as the most important element to drive its progress. Hence, your Company has devised initiatives that enable training and development of employees across levels and enables their professional and personal growth.
Your Company’s human resources management framework is aligned to the business goals and drives key decisions on business processes and introduction of new technology. The HR interventions of the Company focuses on skilling the existing workforce and empowering them to step beyond their defined roles. Emphasis is laid on ensuring that every colleague is well informed with the Standard Operating Procedures on quality and compliance. Shop floor executives are continuously trained and groomed in the area of compliance, supported adequately to raise their competence, confidence and anytime readiness.
Employees at the shop floor undergo classroom training, on-the-job training and assessments. Over 8,000 person days of training was conducted for them during the year under review.
Nalanda, the online learning program, helps employees to choose from a range of strategic leadership courses in partnership with CROSS knowledge. Launched with a vision towards business excellence through leadership and functional competency development, 271 employees were trained under the program in FY2017-18. Nalanda training is exclusively for junior, middle and senior management.
Employees covered under Technical, Safety & Quality Trainings in addition to mandatory cGMP Trainings (FML + API) is above 1,000 during the year. Several employees underwent multiple, need-based programs. Aurobindo Training and Development Centre (ATDC) developed 464 talented professionals, who can be leaders of tomorrow. During the year, your company recruited 4,135 employees.
Established in 2014 with a vision to impart Technical and Application skills to the future workforce of Aurobindo, ATDC (Aurobindo Training & Development Centre) has since been making steadfast contribution in Talent space to compliment the steady yet rapid growth our APL has achieved. It is a great privilege to report our ATDC achieved major milestone with placement of 1004 trained candidates since inception and enculturated future ready workforce into Aurobindo ranks.
AWARDS• Received “Pharmexcil Outstanding Exports Award 2016-
17” in the category of highest Number of ANDAs filed in the calendar year 2016.
• Bagged two Awards in “Excellence in Skill Development” & “Excellence in Pharma Digital Innovation” for the 2nd time in row at the India Pharma Awards 2017 in South-Asia’s largest pharmaceutical event- CPhI& PMEC India.
• Have won the “IDMA MARGI MEMORIAL BEST PROCESS PATENTS AWARD 2016-17” (for 2 Indian & 1 US Granted patents; supported by several other patent applications filed during the said year) awarded by Indian Drug Manufacturers’ Association.
• Our HR team received certificate of appreciation from BML Munjal Awards 2018 for attaining Expert Panel evaluation level in the category of “Learning and Development”.
• Received “2017 Business Award” from The East Windsor Township for best community enhancement contributions in East Windsor Township.
• Aurobindo won “Company of the Year, Asia Pacific” award at Global Generics and Biosimilars Awards 2017.
• Aurobindo’s Unit 15 at Parawada - Vizag awarded by the State Government of Andhra Pradesh for best management award in manufacturing sector. (in Mid-Size Industries category)

Annual Report 2017-18 5958
SUBSIDIARIES/JOINT VENTURESAs per the provisions of Section 129 of the Companies Act, 2013 read with the Companies (Accounts) Rules 2014, a separate statement containing the salient features of the financial statement of subsidiary companies/associate companies/joint ventures is detailed in Form AOC-1 and is in Annexure-1 to this Report.
During the year, the following are the changes in the subsidiaries of the Company:
Ceased as subsidiariesRaidurgam Developers Limited (formerly known as Aurobindo Antibiotics Limited) now became a joint venture
Aurobindo Pharma USA LLC (Liquidated w.e.f. 31.03.2018)
Aurobindo Pharma (Portugal) Unipessoal Limitada (Merged with Generis Farmaceuita SA effective 1st April, 2018)
Aurovitas, Unipessoal LDA (Merged with Generis Farmaceuita SA effective 1st April, 2018)
Aurobindo Ilac Sanayi Ve Ticaret Limited Sirketi (Liquidated on 31st October, 2017)
Mer Medicamentos, Lda (Merged with Generis Farmaceuita SA effective 1st April, 2018)
Farma APS (Liquidated w.e.f 25.01.2018)
Generis Mozambique (Liquidated w.e.f 19.03.2018)
Incorporation of New subsidiariesAurobindo Pharma Saudi Arabia Limited, Saudi Arabia
AuroLogistics LLC, USA
Auro Pharma India Pvt.Ltd, India
Aurovitas Pharma Ceska Republica s.r.o, Check Slovakia
AcquisitionAgile Pharma BV, a step down subsidiary of the Company acquired Generis Farmacêutica SA and its 4 subsidiaries viz. Mer Medicamentos, Portugal, Generis Phar, Portugal, Pharma APS, Portugal and Generis Mozambique, Portugal. Post acquisition of Generis Farmacêutica SA, Portugal, as part of restructuring of operations in Portugal, Aurobindo Pharma (Portugal) Unipessoal Limitada and Aurovitas, Unipessoal LDA, Mer Medicamentos, Lda, Farma APS and Generis Mozambique have been either merged with Generis Farmacêutica SA or liquidated.
CONSOLIDATED FINANCIAL STATEMENTSConsolidated Financial Statements have been prepared by the Company in accordance with the Indian Accounting Standards (Ind AS) 110 and 111 as specified in the Companies (Indian Accounting Standards) Rules, 2015 and as per the provisions of Companies Act, 2013. The Company has placed separately, the audited accounts of its subsidiaries on its website www.aurobindo.com, in compliance with the provisions of Section 136 of the Companies Act, 2013. Audited financial statements of the Company's subsidiaries will be provided to the Members, on request.
VIGIL MECHANISMThe Board of Directors has adopted the Whistle Blower Policy which is in compliance with Section 177(9) of the Companies Act, 2013 and Regulation 22 of the SEBI (Listing Obligations and Disclosure Requirements) Regulations, 2015. The Whistle Blower Policy aims for conducting the affairs in a fair and transparent manner by adopting highest standards of professionalism, honesty, integrity and ethical behavior. All permanent employees and whole-time directors of the Company are covered under the Whistle Blower Policy.
A mechanism has been established for employees to report their concerns about unethical behavior, actual or suspected fraud or violation of Code of Conduct and Ethics. It also provides for adequate safeguards against the victimization of employees who avail of the mechanism and allows direct access to the Chairperson of the audit committee in exceptional cases. The Whistle Blower Policy is available on the Company's website: http://www.aurobindo.com/about-us/corporategovernance.
PREVENTION AND PROHIBITION OF SEXUAL HARASSMENTYour Company has constituted an internal complaints committee in compliance with the Sexual Harassment of Women at Workplace (Prevention, Prohibition and Redressal) Act, 2013 and the Rules there under. The Company has a policy on prevention & prohibition of sexual harassment at workplace. The policy provides for protection against sexual harassment of women at workplace and for the prevention and redressal of such complaints. During the year, no complaints have been received.
RATINGIndia Ratings and Research (Ind-Ra) has affirmed Aurobindo's current long-term rating at 'IND AA+’ with outlook positive.
MEETINGS OF THE BOARDThe Board and Committee meetings are prescheduled and a tentative calendar of the meetings is finalized in consultation with the Directors to facilitate them to plan their schedule. However, in case of special and urgent business needs, approval is taken by passing resolutions through circulation. During the year under review, five Board Meetings and six Audit Committee Meetings were convened and held. The details of the meetings including composition of Audit Committee are provided in the Corporate Governance Report. During the year, all the recommendations of the Audit Committee were accepted by the Board.
DIRECTORSAs per the provisions of the Companies Act, 2013, Mr. K.Nithyananda Reddy and Mr.Madan Mohan Reddy will retire at the ensuing annual general meeting and being eligible, seek reappointment. The Board of Directors recommends their re-appointment.
The re-appointment of Mr.K.Nithyananda Reddy, Dr.M.Sivakumaran and Mr.M. Madan Mohan Reddy as Whole-time Directors and Mr. N.Govindarajan as Managing Director with

Annual Report 2017-18 5958
Com
pany O
verviewS
tatutory R
epo
rtsFinancial S
tatements
effect from June 1, 2018 are being proposed at the ensuing Annual General Meeting. The Board of directors recommends their re-appointments.
The appointment of Mrs. Savita Mahajan as an Independent Director of the Company for a period of two years up to December 15, 2019 is being proposed at the ensuing Annual General Meeting. The Board of Directors recommends her appointment.
Mr.Rangaswamy Rathakrishnan Iyer resigned as Independent Director of the Company with effect from December 9, 2017. The Board has placed on record its sincere appreciation and gratitude for contributions made by him during his tenure as Independent Director of the Company.
DETAILS OF DIRECTORS & KEY MANAGERIAL PERSONNELBoard of Directors appointed Mrs.Savita Mahajan as an Independent Director of the Company for a period of two years up to December 15, 2019.
Mr.Rangaswamy Rathakrishnan Iyer resigned as Independent Director of the Company with effect from December 9, 2017 due to pre-occupation and time constraints.
DIRECTORS' RESPONSIBILITY STATEMENTPursuant to Section 134(3)(c) of the Companies Act, 2013 your Directors confirm that:
a. in the preparation of the annual accounts, the applicable accounting standards have been followed along with proper explanation relating to material departures, if any;
b. appropriate accounting policies have been selected and applied consistently. Judgement and estimates which are reasonable and prudent have been made so as to give a true and fair view of the state of affairs of your Company as at the end of the financial year and of the profit of your Company for the year;
c. proper and sufficient care has been taken for the maintenance of adequate accounting records in accordance with the provisions of the Companies Act, 2013 for safeguarding the assets of your Company and for preventing and detecting fraud and other irregularities;
d. the annual accounts have been prepared on a going concern basis;
e. proper internal financial controls have been laid down to be followed by your Company and such internal financial controls are adequate and are operating effectively; and
f. proper systems to ensure compliance with the provisions of all applicable laws have been devised, and such systems are adequate and are operating effectively.
DECLARATION FROM INDEPENDENT DIRECTORSThe Independent Directors have submitted the declaration of independence stating that they meet the criteria of independence as provided in sub-section (6) of Section 149 of the Companies Act, 2013.
BOARD DIVERSITYThe Company recognizes and embraces the importance of a diverse board in its success. The Board has adopted the Board Diversity Policy which sets out the approach to diversity of the Board of Directors. The Board Diversity Policy is available on the Company's website: http://www.aurobindo.com/about-us/corporategovernance.
BOARD EVALUATIONSEBI (Listing Obligations and Disclosure Requirements) Regulations, 2015 mandates that the Board shall monitor and review the Board evaluation framework. The Companies Act, 2013 states that a formal annual evaluation needs to be made by the Board of its own performance and that of its committees and individual directors. Schedule IV of the Companies Act, 2013 states that the performance evaluation of independent directors shall be done by the entire Board of Directors, excluding the director being evaluated. The evaluation of all the Directors and the Board as a whole was conducted against the parameters laid down by the Nomination and Remuneration / Compensation Committee including performance and working of its Committees.
POLICY ON DIRECTORS' APPOINTMENT AND REMUNERATIONThe policy of the Company on directors' appointment and remuneration, including criteria for determining qualifications, positive attributes, independence of a director and other matters are adopted as per the provisions of the Companies Act, 2013. The remuneration paid to the Directors is as per the terms laid out in the nomination and remuneration policy of the Company. The nomination and remuneration policy as adopted by the Board is placed on the Company's website: http://www.aurobindo.com/about-us/corporategovernance.
TRANSFER TO RESERVEThe Company has not transferred any amount to general reserve out of the profits of the year.
LOANS, GUARANTEES OR INVESTMENTSLoans, guarantees or investments covered under Section 186 of the Companies Act, 2013 form part of the Notes to the financial statements provided in this Annual Report.
CONTRACTS OR ARRANGEMENTS WITH RELATED PARTIESThe particulars of contracts or arrangements with related parties referred to in sub-section (1) of Section 188 of the Companies Act, 2013 is prepared in Form No. AOC-2 pursuant to clause (h) of sub-

Annual Report 2017-18 6160
section (3) of Section 134 of the Act and Rule 8(2) of the Companies (Accounts) Rules, 2014 and is in Annexure-2 to this Report.
EXTRACT OF ANNUAL RETURNAs required under Section 92(3) of the Companies Act, 2013 and Rule 12(1) of the Companies (Management and Administration) Rules, 2014, the extract of Annual Return prepared in Form MGT-9 is in Annexure-3 to this Report.
CONSERVATION OF ENERGY, TECHNOLOGY ABSORPTION, FOREIGN EXCHANGE EARNINGS & OUTGOInformation with respect to conservation of energy, technology absorption, foreign exchange earnings & outgo pursuant to Section 134(3)(m) of the Act read with Companies (Accounts) Rules, 2014 is in Annexure-4 to this Report.
RISK MANAGEMENT COMMITTEERisk Management Committee of the Company consists of the following Directors viz. Mr. M. Sitarama Murty, Mr. N. Govindarajan and Mr. P. Sarath Chandra Reddy. Mr. M. Sitarama Murty is the Chairman of the Committee. The Company has established a separate department to monitor the enterprise risk and for its management. The Committee had formulated a risk management policy for dealing with different kinds of risks which the Company faces in its day-to-day operations. Risk management policy of the Company outlines different kinds of risks and risk mitigating measures to be adopted by the Board.
The Company has adequate internal financial control systems and procedures to combat the risk. The risk management procedure is reviewed by the Audit Committee and Board of Directors on regular basis at the time of review of quarterly financial results of the Company. A report on the risks and their management is enclosed as a separate section forming part of this report.
AUDITORS & AUDITORS' REPORTThe statutory auditors' report is annexed to this report. The notes on financial statements referred to in the Auditors' Report are self-explanatory and do not call for any further comments. There are no specifications, reservations, adverse remarks on disclosure by the statutory auditors in their report. They have not reported any incident of fraud to the Audit Committee of the Company during the year under review.
Pursuant to Section 139 (2) of the Companies Act, 2013, read with Companies (Audit and Auditors) Rules, 2014, the Company at its 30th Annual General Meeting (AGM) held on August 31, 2017, had appointed M/s. B S R & Associates LLP, Chartered Accountants as Statutory Auditors of the Company for a period of 5 years i.e. up to the conclusion of the 35th AGM to be held in the year 2022.
INTERNAL AUDITORSThe internal audit of the Company was conducted by in-house team of professionals up to December, 2017. Form January, 2018
Ernst & Young LLP has been appointed as internal auditors of the Company and they submit their report to the Audit Committee.
COST AUDITPursuant to Section 148 of the Companies Act, 2013 read with the Companies (Audit and Auditors) Rules, 2014 and the Companies (Cost Records and Audit) Rules, 2014, the Company is maintaining the cost records as its business is covered under the regulated sector viz. drugs and pharmaceuticals. Audit of the Company's cost records is not applicable since the Company's revenues from exports, in foreign exchange, exceed 75% of its total revenues.
INTERNAL FINANCIAL CONTROLSThe internal financial controls (IFC) framework institutionalized in Aurobindo last year has been evaluated in-depth for its adequacy and operating effectiveness, wherein the Company has covered financial reporting controls, operational controls, compliance related controls and also Information Technology (IT) controls, comprising IT general controls (ITGC) and application level controls. The ITGC would include controls over IT environment, computer operations, access to programs and data, program development and program changes. The application controls would include transaction processing controls in ERP Oracle system which supports accurate data input, data processing and data output, workflows, reviews and approvals as per the defined authorization levels.
In order to further strengthen the existing IFC framework and to support the growing business, the Company has redefined all the process level controls at activity level which has brought in more clarity and transparency in day-to-day processing of transactions and in addressing any related risks. All the controls so redefined & identified have been properly documented and tested with the help of an independent auditor to ensure their adequacy and effectiveness.
The internal auditors conduct ' Process & control review' on a quarterly basis as per the defined scope and submit the audit findings along with management comments and action taken reports to Audit Committee for its review.
The IFC framework at Aurobindo ensures the following:
• Establishment of policies & procedures, assignment of responsibility, delegation of authority, segregation of duties to provide a basis for accountability and controls;
• Physical existence and ownership of assets at a specified date;
• Enabling proactive anti-fraud controls and a risk management framework to mitigate fraud risks to the Company;
• Recording of all transactions occurred during a specific period. Accounting of assets, liability, and revenue and expense components at appropriate amounts;

Annual Report 2017-18 6160
Com
pany O
verviewS
tatutory R
epo
rtsFinancial S
tatements
• Preparation of financial information as per the timelines defined by the relevant authorities.
SECRETARIAL AUDIT REPORTPursuant to the provisions of Section 204 of the Companies Act, 2013 and Rule 9 of the Companies (Appointment and Remuneration of Managerial Personnel) Rules, 2014, the Company has appointed Mr.A.Mohan Rami Reddy, a Company Secretary in Practice to undertake the secretarial audit of the Company for the financial year 2017-18. The Secretarial Audit Report issued in form MR-3 is in Annexure-5 to this Report.
There are no qualifications, reservations or adverse remarks in the Secretarial Audit Report.
CORPORATE SOCIAL RESPONSIBILITYYour Company is striving to help create a healthy, improved life of people in its neighborhood. Broadly, the initiatives are to execute on the stated CSR policy of 'give back to the society' and make an impact on the lives of people.
The activities undertaken in FY2017-18 can be summarized under the following heads:
• Promoting education;
• Supporting preventive health care;
• Eradicating hunger, poverty & malnutrition;
• Making available safe drinking water;
• Encouraging environment sustainability;
• Sustaining ecological balance & conservation of natural resources;
• Developing rural sports; and
• Setting up old age homes, etc
A detailed account of the CSR activities forms part of the annual report on CSR placed on the Company's website at: http://www.aurobindo.com/social-responsibility/csr-activities. Report on Corporate Social Responsibility as per Rule 8 of the Companies (Corporate Social Responsibility Policy) Rules, 2014 is in Annexure-6 to this Report.
STATEMENT OF PARTICULARS OF APPOINTMENT AND REMUNERATION OF MANAGERIAL PERSONNELThe statement of particulars of appointment and remuneration of managerial personnel as per Rule 5 of the Companies (Appointment and Remuneration of Managerial Personnel) Rules, 2014 is in Annexure-7 to this Report.
INSURANCEAll properties and insurable interests of the Company including building, plant and machinery and stocks have been fully insured.
MATERIAL CHANGES AND COMMITMENTSThere are no material changes and commitments in the business operations of the Company from the financial year ended March 31, 2018 to the date of signing of the Board’s Report. There were no significant and material orders passed by the regulators or courts or tribunals impacting the going concern status and Company's operations in future. There is no change in the nature of the business of the Company during the year.
CORPORATE GOVERNANCEA separate section on Corporate Governance standards followed by your Company, as stipulated under Schedule V (C) of the SEBI (Listing Obligations and Disclosure Requirements) Regulations, 2015 is enclosed as a separate section forming part of this report.
The certificate of the Practicing Company Secretary, Mr. S. Chidambaram with regard to compliance of conditions of corporate governance as stipulated under Schedule V (E) of the SEBI (Listing Obligations and Disclosure Requirements) Regulations, 2015 is annexed to the Corporate Governance Report.
MANAGEMENT DISCUSSION AND ANALYSISManagement Discussion and Analysis Report for the year under review as stipulated under SEBI (Listing Obligations and Disclosure Requirements) Regulations, 2015 is presented in a separate section forming part of this report.
FIXED DEPOSITSYour Company has not accepted any fixed deposits from the public within the purview of Chapter V of the Companies Act, 2013.
INDUSTRIAL RELATIONSIndustrial relations at all units of the Company have been harmonious and cordial. The employees are motivated and have shown initiative in improving the Company's performance.
TRANSFER OF UNPAID AND UNCLAIMED AMOUNT TO IEPFThe dividends which remain unpaid/unclaimed for a period of seven years, have been transferred on due dates by the Company to the Investor Education and Protection Fund (IEPF) established by the Central Government.
Further, Section 124 of the Companies Act, 2013 read with Investor Education and Protection Fund Authority (Accounting, Audit, Transfer and Refund) Rules, 2016 ('the Rules') mandates that companies shall apart from transfer of dividend that has remained unclaimed for a period of seven years from the unpaid dividend account to the Investor Education and Protection Fund (IEPF), also transfer the corresponding shares with respect to the dividend, which has not been paid or claimed for seven consecutive years or more to IEPF. Accordingly, the dividends that remain unclaimed for seven years and also the corresponding shares have been transferred to IEPF account on due dates.

Annual Report 2017-18 6362
SHARE CAPITALThe paid up share capital of the Company increased by `25,200 during the year due to the allotment of 25,200 equity shares of `1 each on exercise of stock options under the Employee Stock Option Plan-2006 (ESOP 2006) of the Company. The paid up share capital of the Company as on March 31, 2018 was `585,907,609 divided into 585,907,609 equity shares of `1 each.
EMPLOYEE STOCK OPTION SCHEMEThe Members at the Annual General Meeting of the Company held on September 18, 2006 approved formulation of Employee Stock Option Scheme- 2006 (ESOP 2006) for the eligible employees and Directors of the Company and its subsidiaries. Details of the stock options as on March 31, 2018 is provided on the Company's website: http://www.aurobindo.com/about-us/corporategovernance. The details of the employee stock options also form part of the notes to accounts of the financial statements in this Annual Report.
BUSINESS RESPONSIBILITY REPORTA detailed Business Responsibility Report in terms of the provisions of Regulation 34 of SEBI (Listing Obligations and Disclosure Requirements) Regulations, 2015 is available as a separate section in this Annual Report.
ACKNOWLEDGEMENTSYour Directors are grateful to for the invaluable contribution made by the employees and are encouraged by the support of the customers, business associates, banks and government agencies. The Directors deeply appreciate their faith in the Company and are thankful to them. The Board shall always strive to meet the expectations of all the stakeholders.
For and on behalf of the Board
Place: Hyderabad K. RagunathanDate: 28 May 2018 Chairman
DIN: 00523576

Annual Report 2017-18 6362
Com
pany O
verviewS
tatutory R
epo
rtsFinancial S
tatements
MANAGEMENT DISCUSSION & ANALYSIS
MACRO-ECONOMIC REVIEW GLOBAL ECONOMY In 2017, the global economy witnessed a comeback with the strongest growth since 2010. According to the International Monetary Fund’s (IMF’s) World Economic Outlook, April 2018, the growth of developed economies was backed by improvement in investments and manufacturing output, while key developing economies, including Brazil, China, and India, posted strong momentum.
In the first quarter of 2017, export and investment growth propelled the US economy at an astounding pace. Thereafter, the recovery in household spending, healthy labor market and tax cuts helped maintain momentum in the economy. Given the strong recovery, the IMF has revised its growth forecast for the US. The US economy is now expected to gain from higher external demand and the macroeconomic impact of the tax reform.
The UK experienced a declining economy due to lower-than-expected growth in the first two quarters. The IMF estimates the economy growth to further decline to 1.8% in 2017. Softer growth in private consumption, currency depreciation, and the looming uncertainty over the UK’s new economic relationship with the European Union (EU) after the Brexit phenomenon are factors responsible for this slowdown.
Overall, the IMF has predicted that the decline in tax revenues and tax reforms in the US will be responsible for carving a positive growth trajectory for the major economies in 2018 and 2019.
The US growth forecast has been raised from 2.3% to 2.7% in 2018 and from 1.9% to 2.5% in 2019. In emerging and developed economies like Europe, economic activity in 2018-19 is projected to remain stronger than previously anticipated. Moreover, the advanced Asian economies are particularly expected to deliver stronger growth. The emerging and developing economies in Asia are expected to grow at around 6.5% over 2018-19, broadly at the same pace as in 2017
Global growth pattern
(%) 2017 2018 (P) 2019 (P)
World Output 3.8 3.9 3.9Advanced Economies 2.3 2.5 2.5US 2.3 2.9 2.7Euro Area 2.3 2.4 2.0Japan 1.7 1.2 0.9UK 1.8 1.6 1.5Other Advanced Economies* 2.7 2.7 2.6Emerging and Developing Economies 4.8 4.9 5.1China 6.9 6.6 6.4Brazil 1.0 2.3 2.5
P: Projections*Excludes the G7 – Canada, France, Germany, Italy, Japan, the UK, the US, and eurozone(Source: International Monetary Fund)
Though the outlook for the global economy remains optimistic, the World Trade Organization has declared that the trade barriers getting erected by major economies could impact growth expectations.
INDIAN ECONOMY The Indian economy witnessed temporary headwinds owing to the Goods and Service Tax (GST) transition in FY2017-18. However, the economy gained momentum and emerged as one of the fastest growing economies with a Q4 Gross Domestic Product (GDP) growth of 7.7% compared to the 7.2% and 6.5% growth in Q2 and Q3 of FY2017-18, respectively. Gross
Value-Added (GVA) growth, another economic indicator, stood at 7.6% for FY2017-18, indicating a steady growth potential for the economy in the next fiscal. Transformational reforms such as the GST and structural decisions such as demonetization have improved investments and supported economic growth.
Due to higher growth in manufacturing, the farm and construction sectors have provided an impetus to the domestic economy. According to the World Bank’s Global Economic Prospects report, India’s GDP is expected to rise by 7.4% in FY2018-19 and 7.8% in FY2019-20.

Annual Report 2017-18 6564
INDUSTRY REVIEW GLOBAL PHARMACEUTICAL INDUSTRY Global healthcare spending is estimated to increase at an annual rate of 4.1% during 2017-2021, up from just 1.3% during 2012-2016.
Factors such as ageing and increasing population in key economies, developing markets expansion, advanced medical treatment needs and rising labor costs will contribute to an increase in the spending. Thus, combined healthcare spending in the world’s major regions is expected to reach $8.7 trillion by 2020, up from $7 trillion in 2015. (Source: 2018 Global Health Care Outlook: The evolution of smart health care by Deloitte)
Future drivers of global pharma growth
Since the past few years, scientists have been developing a new generation of cell-based therapies, gene therapies, and regenerative medicines. Some of these treatments have been passing clinical trials and gaining regulatory approval. These therapies and medicines go beyond the conventional definition of a drug — they are engineered personally for each patient and some offer curative results with a single administration.
In 2018, it is forecasted that five to eight next-generation biotherapeutics will be approved and launched. Over the next five years, 20% of the 40 to 45 New Active Substances (NAS) projected to be launched each year will come from this group of drugs.
In recent years, the pharmaceutical industry is witnessing a proliferation of digital health tools, including mobile health apps and wearable sensors. With the promise of improving human health, these tools have the potential to change the face of the pharma industry. An increasing number of clinical practitioners are using various digital health apps while treating patients.
In 2018, approximately 340 digital health efficacy studies will be completed and published, continuing the trend of building strong scientific evidence to support digital tools and interventions. These studies will span a broad range of diseases. However, they will mainly focus on large-population chronic conditions such as diabetes and heart diseases, which can be avoided and kept in check through self-management, behavioral support or medical intervention.
The past decade has seen a sustained shift in the focus of new medicines towards specialty pharmaceuticals. These healthcare products help treat chronic, complex or rare conditions. Driven by new therapies and the slowing or declining growth of traditional medicines, specialty share of global spending has risen from 19% in 2007 to 32% in 2017. In the 10 developed markets, specialty represented 39% of spending in 2017, totalling to $297 billion, led by five major European countries (France, Germany, Italy, Spain, and the UK) and the US, all having a specialty share above 41%.
In 2018, specialty spending in developed countries will reach $318 billion, representing 41% of market spending in these countries, up from $172 billion in 2013. Oncology and autoimmune biologics lead the specialty categories, accounting for 46% of 2017 spending and 68% of projected growth in the next five years.
Gene therapies Digital health Specialty medicines
(Source for growth drivers: IQVIA Institute, 2018 and Beyond: Outlook and Turning Points)

Annual Report 2017-18 6564
Com
pany O
verviewS
tatutory R
epo
rtsFinancial S
tatements
GLOBAL MARKETS REVIEWUS The US pharma market recorded a nominal drug spending of $452.6 billion in revenue in 2017. Despite the US administration’s continuing public scrutiny of drug pricing, the industry recorded a slight growth of 1.4% in nominal spending over the previous year.
In the US pharma market, pricing pressure is fuelled by factors such as increasing competition, payer consolidation and restrictive reimbursement policies. This is further aggravated by cost control tools such as exclusionary formularies and price protection clauses. As a result, the health plan designs are changing and patients may experience a possible increase in both premiums and out-of-pocket payments for their branded medications.
Spending on traditional medicines has declined primarily due to patent expiries and associated losses of brand exclusivity, as well as a general shift in the focus of medical innovation towards next-generation medicines. In the US market, innovation and
According to Quintiles IMS, net revenue from all types of prescription medicines will grow at 2-5% over the next five years, driven by new products and the wider use of existing medicines. However, this may be offset by reduced pricing of existing drugs. The volume growth for existing products in the market is expected to be highly variable, from 1.1% contribution in 2018 to 4.5% in 2021, as previously launched drugs continue to grow, and generic uptake from patent expiries lift volume. 40-45 new innovative products are expected to be launched per year, from 2018 through 2021, contributing to 3.5-4.5% growth per year.
technological advances have fast-tracked the growth of specialty medicines; they account for nearly half of the market’s current medical spends. According to IQVIA, the largest proportion of new medicines launched in the last five years has been specialty drugs. Also, specialty share of spending has risen, while traditional net medicine spending has declined by more than $133 per person over the past decade. In non-retail settings, specialty drugs represent 60% of invoice spending and 2.3% of standard unit volumes.
OUTLOOK Since 2015, the aggregate adjustment of normalized medicine spending has declined due to a strong economy and the rising off-invoice discounts and rebates, slowing overall medicine spending growth. According to the IQVIA projection, the US population’s real net per capita spending on medicines will decline in 2018 and remain unchanged at almost $800, until 2022. Any subsequent growth in the US pharma market will be primarily driven by the large number of new medicines, many of which will be specialty and orphan drugs.
Source: IQVIA Market Prognosis Sep 2017; US Census Bureau; US Bureau of Economic Analysis (BEA), Dec 2017; IQVIA Institute; Feb 2018Notes: Real medicine spending reflected in 2009 $
real net per capita spending $ % Growth
1,000900800700600500400300200100
0
8
6
4
2
0
-2
-4
-6
-8
Exhibit 14: U.S. Real Net Per Capita Drug Spending and Growth
2007 2008 2009 2010 2011 2012 2013 2014 2015 2016 2017 2018 2019 2020 2021 2022
Real Net Per Capita Spending Real Net Per Capita Growth

Annual Report 2017-18 6766
EUROPE Pharma spending in Europe was $154.4 billion in 2017 and is expected to increase to $170-200 billion in 2021. However, the outcome of the UK’s negotiations with the EU will create medium-term headwinds for pharma companies, owing to the uncertainty around pharma planning and business strategies. In contrast, some countries in the region, such as Italy and Spain, which are not purely tender-driven markets, have witnessed steady growth in pharma spends owing to the growth in generic sales.
OUTLOOK According to QuintilesIMS, growth in the five major markets of the EU (France, Germany, Italy, Spain, and the UK) is mixed with a projected CAGR, through 2018, of 2-5% each for Germany and Italy, better CAGR of 4-7% for the UK, but negative to minimal growth for France and Spain.
Coface India estimates that in 2018, spending on prescription drugs is set to grow by 4% for the top five EU countries to reach almost €126 million. This is explained by the increasing presence of specialty drugs (more than a third of the total sales), even though payers are reluctant to pay the pharmaceutical companies’ list prices. Most importantly, there could be some modest increase in medicine spending above the base-case scenario if the UK Government continues its commitments towards innovative drug access.
Moreover, after Brexit, the UK will require to make major readjustments to the existing and pending European initiatives, ranging from clinical trials regulation to health technology assessment and from digital health to modernized pathways to medicine authorization.
PHARMERGING MARKETS The decline in the US spending on medicines is expected to be balanced by the growth in the pharmerging markets. The contribution from these markets to global medicine spending has risen from 13% in 2007 to 24% in 2017, almost doubling in a decade. In total value, this accounts for an increase in spends from $81 billion in 2007 to $270 billion in 2017, growing at an average rate of 12.8%, which is estimated at more than twice the global growth rate.
This rise has been fuelled by the various governments’ efforts to increase healthcare access by reducing medicine costs and the efforts of the global drug companies to expand their reach and scale through tie-ups and partnerships with local companies.
The use of and spending for generic medicines is higher in the pharmerging markets. With self-paying consumers buying these medicines, there is a directly proportional relationship between medicine spending growth and the overall economic growth.
2020 20212019
14121086420
-2-4-6-8
US Market: Net Medicines Revenue Growth and Contribution by Type
2012 2014 2016 20182013 2015 2017
Existing Products Volume Growth
New Brands
Existing Products Price Growth
Total Growth
(Source: IQVIA Market Prognosis, September 2017)
Spending $ Bn % Growth Const $
Pharmerging Spending and Growth
Pharmerging GrowthOther PharmergingBrazil, India, RussiaChina
400350300250200150100500
25
20
15
10
5
0
2007 2008 2009 2010 2011 2012 2013 2014 2015 2016 2017 2018 2019 2020 2021 2022

Annual Report 2017-18 6766
Com
pany O
verviewS
tatutory R
epo
rtsFinancial S
tatements
Government of India’s healthcare focus • As per the Economic Survey, child and maternal malnutrition
are the major causes of deaths in India. Neonatal disorders and nutritional deficiencies, as well as diarrhoea, lower respiratory infections and other common infections, are responsible for maternal and child malnutrition. The Government of India has worked towards implementing several programs and has also initiated new policy interventions to improve the health and nutritional status of women and children.
• Under the National Health Mission (NHM), the Union Government has rolled out the National Free Diagnostic Service Initiative to provide essential diagnostic services in public health facilities. The Government has approved an amount of `7,590 million for the initiative for 29 States/ Union Territories (UTs) in FY2017-18.
• The Government of India unveiled 'Pharma Vision 2020' aimed at making India a global leader in end-to-end drug manufacturing. The approval time for new facilities has been reduced to boost investments. Further, the Government introduced mechanisms such as the DPCO and the National Pharmaceutical Pricing Authority to make medicines affordable and easily available.
COMPANY REVIEW Aurobindo is one of the largest vertically integrated pharmaceutical companies in India. It has carved a niche for itself in developing high-quality Active Pharmaceutical Ingredients (APIs) and finished-dosage forms. The Company is the market leader in semi-synthetic penicillin. Moreover, it has established a firm foothold in key therapeutic segments such as anti-biotics, Central Nervous System (CNS), cardiovascular (CVS), anti-retrovirals, diabetics, anti-allergies and gastroenterology, among others.
Aurobindo’s state-of-the-art manufacturing facilities have been approved by the US Food and Drug Administration (FDA), UK Medicines and Healthcare products Regulatory Agency (MHRA), Medicines Control Council-South Africa (MCC-SA), EMA and ANVISA-Brazil for both APIs and formulations. Leveraging on this, the Company has Joint Ventures (JVs) and strategic alliances with 56 subsidiaries.
Aurobindo exports to over 150 countries across the globe, with around 90% of its revenues being derived from international operations. In the last fiscal, the Company focused on increasing the complexity and diversity of the portfolio, while retaining the core business and augmenting capability and capacity to strengthen it. The Company is now addressing the prescription, biopsy and consumer healthcare [Over-the-Counter (OTC) and Dietary Supplements] segments.
From a long-term growth strategy perspective, the Company is working on differentiated technologies and segments, including biologics, vaccines, and peptides.
OUTLOOK According to IQVIA, pharmerging markets are expected to experience significant changes. The sale of generic medicines is expected to grow by 7-8% in 2018, down from the 9.7% CAGR over the prior five years. FY2017-18 will mark the third year of less-than-10% growth.
Pharmerging markets are forecasted to grow by 6-9% to $345-375 billion in the next five years. China, the largest pharmerging country, is projected to contribute $145-175 billion at a tepid growth of 5-8%.
INDIAIndia has among the lowest spends on healthcare, at about 4.5% of the GDP against the global average of 9%. This gap has prompted the Government of India to actively focus on policies that provide impetus to the healthcare sector.
The Government has taken a hallmark step of launching a National Health Protection Scheme (NHPS) to cover over 100 million poor and vulnerable families. The scheme provides an annual coverage of `5 lakh per family for secondary and tertiary care hospitalization.
Such measures by the Government saw India attract a record Foreign Direct Investment (FDI) of $747 million in the healthcare sector during the fiscal. Further, spending on medicines is projected to grow by 9-12% in the next five years compared to China’s 5-8%, according to IQVIA. This growth will thrust India forward to reach the list of the Top 10 countries in the ongoing financial year.
While this domestic growth is a massive opportunity for the Indian domestic pharma industry, it is also well-poised to serve the international markets. India is the largest maker of generic medicines, with the Indian pharma industry contributing to 20% of the global generics exports. By 2020, the Indian industry revenue is expected to touch $55 billion.
New drugs being brought under Drug Price Control Orders (DPCO); a price cap on stents, implants, and procedures; and an increasing number of licenses being withdrawn by the regulators are among the challenges faced by the industry.
Projected size of Indian pharma market($ billion )
12.6
35
55
70
2009 PessimisticCase (2020)
Base Case (2020)
Aggressive Case (2020)
~17% CAGR~14.5% CAGR
~10% CAGR
(Source: India Pharma 2020: Propelling access and acceptance by McKinsey)

Annual Report 2017-18 6968
KEY STRENGTHS 1) Scale, Diversity, and Leadership• Among the Top 3 companies in over 60% of commercial
portfolio in the US market in terms of prescriptions as per IQVIA QTR Mar 2018
• A large US portfolio comprising 478 Abbreviated New Drug Applications (ANDAs) filed, of which 327 received final approval, 34 received tentative approvals including 11 ANDAs approved under PEPFAR, and 117 are under review
• A strong foothold in the US and EU
• Extensive product portfolio and pipeline
• Experienced and forward-looking leadership team
• Wide pool of committed talent
2) Robust Operations • Large manufacturing facilities inspected and approved by
the USFDA, European Medicines Agency (EMA), and other regulators
• Dedicated and cutting-edge global Research and Development (R&D) centres for diverse technology platforms and APIs
• Focus on complying with quality and Environment, Health, and Safety (EHS) standards
• Speed and effectiveness in execution
3) Patient Focus• Unwavering commitment to providing access to high-quality,
low-cost generics to patients globally
• Continuous effort to maximize patient reach
• Continue to offer a broad, cost-competitive portfolio for all consumer needs
FY2017-18 segment-wise revenue contribution
ARV US formulations
API EU formulations
Growth Markets
4518
6
5
26
(%)
FORMULATIONS BUSINESSAurobindo manufactures generic formulations that are sold across the US, Europe markets and Growth Markets. The Company also sells Antiretroviral Medicines (ARV) in various Growth Markets by participating in global tenders floated by various international bodies.
Primarily focused on developing oral and injectables generic formulations, Aurobindo is building capabilities for next level complex R&D products. Nearly 90% of the Company’s revenue is driven by its international operations. With 20 manufacturing facilities in India, three manufacturing facilities in the US, one in Brazil and one in Portugal, Aurobindo has gained considerable market share in the international formulations market.
US formulations New launches and a well-diversified portfolio have enabled Aurobindo to deliver steady growth in its US business. The Company launched 38 products, including six injectables, in FY2017-18 in the US market.
In FY2017-18, the US revenue increased by 9.0% to `74,421 million from `68,272 million in FY2016-17, accounting for 45% of consolidated revenue. The Company filed 47 ANDAs with the USFDA, including for 16 injectables and received final approvals for 49 ANDAs, including seven injectables during the year under review.
The injectables business contributed to 14% of the overall US business in FY2017-18. Currently, AuroMedics is the third largest generic injectables company by volume as per IQVIA MAT Mar 2018. AuroHealth, the Company’s US OTC business, launched the first set of key products in FY2017-18. As on 31st Mar 2018, 16 OTC ANDAs were approved.
Aurobindo is building a strong product pipeline for the US market with differentiated products and believes that new injectables launches will help to improve the product mix and margins going forward.
% of Total Revenue
FY13 FY14 FY15 FY16 FY17 FY18
US formulations revenue growth (FY13-FY18)
US Revenue
(` Million )33.5% CAGR in (FY13-FY18)
80,000
60,000
40,000
20,000
0
50
40
30
20
10
017,5
26 34,0
28 48,3
17 60,7
86
68,2
72
74,4
21
30
41 3944 45 45

Annual Report 2017-18 6968
Com
pany O
verviewS
tatutory R
epo
rtsFinancial S
tatements
EU formulationsIn FY2017-18, the EU formulations recorded a strong revenue growth of 32.9% reaching to `43,544 million, accounting for 26% of consolidated revenue. By the close of the fiscal, the manufacturing activities of around 83 products was transferred from Europe to India.
EU formulations revenue growth (FY13-FY18) (` Million )
30
25
20
15
10
5
0
% of Total Revenue
FY13 FY14 FY15 FY16 FY17 FY18
EU Revenue
56% CAGR in (FY13-FY18)
48,000
42,000
36,000
30,000
24,000
18,000
12,000
6,000
0
4,67
9
6,72
1
31,9
47
31,3
04
32,7
71 43,5
448 8
26
22 22
26
Growth markets formulationsIn FY2017-18, Growth Markets recorded a revenue of `8,971 million, witnessing a strong growth of 18.7%, and accounted for ~6% of revenue. The key markets like Canada, Brazil and Columbia have propelled the growth.
8
6
4
2
0
% of Total Revenue
FY13 FY14 FY15 FY16 FY17 FY18
Growth Markets formulations revenue growth (FY13-FY18)
GM Revenue
(` Million)
17% CAGR in (FY13-FY18)
8,000
6,000
4,000
2,000
0
4,16
4
4,63
4
5,69
2
6,46
1
7,55
6 8,97
1
7
65 5
56
ARV formulations For the ARV business, the Company’s focus has been on global tenders floated by multi-lateral organizations such as Global Fund, USAID/PEPFAR, and country-specific Ministry of Health (MOH) tenders. Aurobindo supplies life-saving ARVs to ~3 million HIV patients spread over more than 125 countries. The ARV formulations business booked revenues of around `8,396 million, a decline of 29% YoY in FY2017-18. The decline was due to an increase in pricing pressure in one of the key products and reduction in the tenders floated by various countries particularly in Q4FY2017-18.
% of Total Revenue
ARV formulations revenue trend (FY13-FY18)
ARV Revenue
(` Million )
FY13 FY14 FY15 FY16 FY17 FY18
14,000
10,500
7,000
3,500
0
7,50
3
8,40
2 9,63
9
12,0
93
11,8
54
8,39
6
13
10
89 8
5
15
10
5
0
API BUSINESS The API segment remains as an important strategic unit for the Company, enabling vertical integration in supplying formulations to regulated markets.
In FY2017-18, the total revenue from APIs was around `29,622 million, recording a marginal decline of 3% year-on-year due to increased captive consumption. The Company has also invested capital for capacity creation and capability building to ensure that the base business is strengthened for future growth opportunities. The API business continues to focus on complex products with varying volumes and is consistently evolving its manufacturing processes to meet the market needs. The API facilities meet the advanced market requirements of USFDA, UK MHRA, EMA, Japan Pharmaceuticals and Medical Devices Agency (PMDA), Mexico COFEPRIS, Brazil-ANVISA, Korea FDA, etc.
NEW INITIATIVES The Company’s priority markets are driven by a broad portfolio of products from internal pipeline coupled with acquired entities. To strengthen its foundation for sustainable growth in these markets, the Company continues to focus on building a differentiated
Annual Report 2017-18 7170
product portfolio through in-house research and development. Aurobindo is investing heavily in R&D efforts towards creating high-value complex products and drug delivery systems. The Company has made steady progress across its new initiatives such as oncology & hormones, penems, vaccines, biosimilars, respiratory and dermatology. In the year ahead, the Company will continue to maintain its focus on further streamlining its operations and provide affordable life-saving drugs to the world.
FINANCIAL REVIEWIn FY2017-18, Aurobindo’s revenue from operations on a consolidated basis amounted to `164,998 million vis à-vis `150,899 million in FY17, recording 9.3% growth despite headwinds including pricing pressures in key markets.
This rise was driven by a healthy growth in the US, Europe, and Growth Markets. The EBITDA increased by 10.3% YoY to `37,885 million. EBITDA margin expanded ~20 bps to 23.0%. The net profit after JV share and minority interest was recorded at `24,232 million compared to `23,017 million in the previous year, growing by 5.3%.
The Company’s total R&D spend stood at `6,665 million, which is 4% of its total revenue.
The Company’s market capitalization as on March 31, 2018 stood at `326.8 billion.
MANUFACTURING REVIEWIn FY2017-18, Aurobindo conquered new frontiers through its resource debottlenecking efforts and its initiatives to reduce cycle time. The Company is now on a path to digitize manufacturing operations by integrating all process-related machines to the server to capture real-time process parameters for better operations control, improvement in productivity and enhanced compliance status. Through this initiative, Aurobindo aspires to set a benchmark for operational excellence.
With a view to increase manufacturing capabilities, the Company has successfully commissioned a Betalactum injectables manufacturing facility (Unit XVI) at Jadcherla in FY2017-18, which will improve the injectables volumes for the US, EU and Growth Markets. The establishment of Unit X for an US FDA - compliant oral manufacturing facility at Naidupet, Andhra Pradesh, is on track and will be commissioned during the ongoing fiscal. The facility has been inspected by the USFDA and EMA.
Aurobindo has also focused on strengthening manufacturing processes through operational-side training and implementation of integrated process systems such as a robust quality management system called Laboratory Information Management System (LIMS), a real-time data management system called PRISM and a stringent material management via a single Enterprise Resource Planning (ERP) system.
THREATS AND CHALLENGESThe pharmaceutical industry is highly competitive, with challenges from both the Indian manufacturers who have similar production facilities as well as those of abroad. Human resources with similar skills, talent, and experiences in the industry are mobile between competing companies.
Price pressures are expected to remain in the US market. Going forward, there is a risk of inability to maintain current margins on products. Price sensitivities are tested in a crowded market where the price tends to sag while the business achieves volume.
Competing pharmaceutical companies have several similar bio-equivalent products in the same market, manufactured at facilities that have been approved by the highest regulatory authorities. All of them stay focused on the same markets, resulting in price elasticity being tested and margins eroding.
Yet, it must be appreciated that Indian manufacturers in general, and Aurobindo in particular, have etched their presence on the global stage and have worked hard to get shelf space. Aurobindo is better placed when compared to many of the other Indian manufacturers because of the Company’s control over raw material sourcing. The Company is a dominant player in the API business and has been able to control its quality, improve on timelines, be competitive on costs and deliver at short notice. This is an unique advantage that Aurobindo enjoys over many other manufacturers across the world. The Company has been timing its launches to take advantage of the products going off-patent and the opportunities available in a first-mover market. This strategy is built around the in-house R&D capabilities, technology strength in manufacturing facilities and the marketing infrastructure. Aurobindo has worked on its speed-to-market abilities and is quick to convert product approvals into invoices.
The scientists and other professionals of Aurobindo have been trained to create opportunities, replicate the successes and drive business growth. The Company has unmatched strengths to cope with the challenges of the market, such as an experienced staff with the ability to anticipate market needs, plan for product launches with supportive documentation, create products that meet regulatory norms and execute plans within tight cost and time budgets.
INTERNAL FINANCIAL CONTROLSThe Internal Financial Controls (IFC) framework institutionalized in Aurobindo during FY2017-18 has been evaluated in-depth for its adequacy and operating effectiveness. Basis this Framework, the Company has covered financial reporting controls, operational controls, compliance-related controls and also Information Technology (IT) controls comprising IT General Controls (ITGC) and application-level controls. The ITGC would include controls over the IT environment, computer operations, access to programs and data, program development and program

Annual Report 2017-18 7170
Com
pany O
verviewS
tatutory R
epo
rtsFinancial S
tatements
changes. The application controls would include transaction processing controls in the ERP Oracle system, which supports accurate data input, data processing and data output, workflows, reviews, and approvals as per the defined authorization levels.
To further strengthen the existing IFC framework and to support the growing business, the Company has redefined all the process-level controls at activity level. This has brought more clarity and transparency in daily processing of transactions and in addressing any related risks. All the controls that have been redefined and identified have been properly documented and tested with the help of an independent auditor to ensure their adequacy and effectiveness.
The internal auditors, on a quarterly basis, conduct 'Process and Control Review' as per the scope defined and submit the audit findings, along with management comments and action-taken reports to the Audit Committee for its review.
The IFC framework at Aurobindo ensures the following:
• Establishment of policies and procedures, assignment of responsibility, delegation of authority and segregation of duties to provide a basis for accountability and controls
• Physical existence and ownership of assets at a specified date
• Enabling of proactive anti-fraud controls and a risk management framework to mitigate fraud risks to the Company
• Recording of all transactions occurred during a specific period
• Accounting of assets, liability and revenue and expense components at appropriate amounts
• Preparation of financial information as per the timelines defined by relevant authorities
HUMAN RESOURCESAurobindo boasts of a tight-knit team of highly competent and committed industry professionals. The corporate promise, 'Committed to healthier life', reiterates that the team is focused on performing and delivering on patient safety. The knowledge, expertise and skills of the Aurobindo teams form a strong foundation of the Company's progress and hence, considerable strategic emphasis is laid on people development and leadership. The overall target is to enhance business growth by enabling engagement and performance. The Company aims to achieve this target by providing participative leadership for enterprising employees and creating an environment conducive to work towards organizational goals.
Aurobindo’s corporate values form the foundation of this development. Aurobindo Pharma has a team of over 19,000 professionals from 31 different countries working at its various divisions – API manufacturing, formulation manufacturing, chemical R&D, formulation R&D and overseas operations. About 80% of these employees are graduates, postgraduates and PhD holders.
As part of its investment in learning and development, the Company has recrafted its human resource philosophy. In brief, the policy is iterated as below:
• Attract, build and retain the right talent at all levels
• Create and nurture a performance culture through continuous capability building, performance measurement, and leveraging of IT
• Foster leadership at all levels through trust, empowerment and openness
• Strengthen collaborative approach for business excellence
• Promote a vibrant work culture based on innovation and incentivize people based on productivity/ outstanding performance
The Company emphasizes the five critical dimensions of people management:
• Establishment of a vibrant organizational culture
• Talent attraction and retention
• Continuous capability building
• Recognition of outstanding performance of the team/individuals
• Staff welfare
The Company has undertaken the following initiatives for the holistic development of employees:
MISSION QUALITY This is a key initiative undertaken to create and augment the quality culture across the organization. The process assesses the staff and executives on quality standards compliance. An assessment based on key performance indices and quality metrics has been carried out at the formulations unit to identify Master Quality Leaders (MQLs) who will facilitate the quality initiatives across the organization.
QUALITY MARSHAL PROGRAM (QMP)This initiative has helped to strengthen the quality culture through continuous reinforcement of Standard Operating Procedures (SOPs) and adherence to quality standards by application of learning with the help of a qualified resource pool.

Annual Report 2017-18 7372
For the pharma industry, in general, it is critical to ensure that the efficiency of the processes is effectively communicated during the audit interaction. This efficiency in communication needs continuous practice. The QMP was envisaged to address this need by strengthening the Company’s quality culture through learning partnerships and developing confidence and communication towards increasing audit interface capabilities.
Potential Quality Marshals are mapped across the value stream with demonstrated high-compliance behaviors, training ability and audit experience. They then become part of collaborative learning with cascading methodology, leading to critical talent development. The program aims to develop close to 500 Quality Marshals across all units by 2019 and the training and certification processes are going on in full gear.
ENVIRONMENT, HEALTH AND SAFETYIndustrial relations continue to be cordial and harmonious. The Management has initiated various measures such as the formation of bipartite forums and joint management councils to promptly redress staff grievances and improve welfare amenities at the plants.
The Company places utmost importance on employee and contractor safety as well as environment protection. In its approach to business, Aurobindo integrates a robust and sustainable safety system that aims for zero incidents to ensure a high degree of safety at the workplace.
Aurobindo works towards fulfilling its environmental and social responsibilities by optimizing the use of resources, minimizing waste, reusing and recycling materials, and reducing the eco-footprint to create more value with less environmental impact.
CORPORATE SOCIAL RESPONSIBILITY (CSR)Aurobindo's CSR charter covers the following areas of activities:
• Promoting education
• Supporting preventive healthcare
• Eradicating hunger, poverty, and malnutrition
• Making safe drinking water available
• Encouraging environment sustainability
• Sustaining ecological balance and conserving natural resources
• Developing rural sports
• Setting up old-age homes
As part of its societal commitment, Aurobindo provides support in the areas of educational aids for school children, construction of toilets, and provision of safe drinking water. Its social intervention programs have benefited the neighboring communities and the Company continues to give back to the society.

Annual Report 2017-18 7372
Com
pany O
verviewS
tatutory R
epo
rtsFinancial S
tatements
MANAGEMENT OF RISKS
OVERVIEWThe objective of Enterprise Risk Management (ERM) framework at Aurobindo is to address all major risks in a proactive manner and to sustain business growth. The Company’s ERM practices are based on COSO-ERM framework. The ERM is designed to minimize impacts arising from the risks and enable the Company to leverage market opportunities effectively. It also enhances Company’s competitive advantage on a medium and long-term basis, thereby creating value for its stakeholders.
The Company has aligned risk management framework with critical business processes to ensure that the core functions are designed and operated effectively towards the achievement of business objectives. Risks are addressed across all key business functions in a holistic manner rather than in silos.
COMPANY’S ERM FRAMEWORK
RSK MANAGEMENT COMPONENTSProcess Description
Business objectives Business objectives are set by executive management and approved by the BoardRisk identification A bottom-up approach is adopted through structured interviews, brainstorming sessions and risk
questionnaire techniques for the identification of risks which could potentially impact achievement of business goals. Risk registers are updated with existing and emerging risks.
Risk assessment It includes evaluating and prioritizing risks so that their levels are managed within defined tolerance thresholds.
Risk evaluation is carried out using scenario-based assessments to determine the potential impact and likelihood of risk occurrence. Identified risks are compared with established thresholds to determine the priority and method of risk mitigation.
Risk mitigation & monitoring
Aurobindo adopts meaningful mitigation strategies tailored to each identified risk. Risk mitigation procedures involve undertaking appropriate actions by the business heads/process owners who are accountable to mitigate risks in a time bound manner. Risk owners are identified, and progress of mitigation actions are monitored and reviewed periodically.
The Risk Management Committee (RMC) periodically reviews the scope adequacy and effectiveness of mitigation actions and provides necessary direction to mitigation teams.
Risk reporting Risk reports are submitted to RMC on a periodic basis. The reports help in tracking each identified risk and its impact on business. The assessment of key risks, analysis of exposure and potential impact are carried out periodically, presented and discussed with RMC. Periodic updates are provided to the Board highlighting key risks, their subsequent impact and the required mitigation measures.
Business objectives
Riskidentification
Riskassessment
Risk mitigation & Monitoring
Riskreporting
Strategic risks
Financial risks
IT risks
Operational risk
Compliance risks

Annual Report 2017-18 7574
RISK CATEGORIESThe Risk management framework covers the following broad categories of risks to business objectives:
• Strategic risks are the risks arising due to the decisions taken by the management with respect to markets, product & process development, resources, business growth & revenue model, acquisitions, investment model, etc. which can impact business objectives.
Ownership of risk: Key management personnel
• Operational risks are attributable to business operations such as production capacities, quality assurance, customer demands, material availability, human safety etc. which can have impact on business.
Ownership of risk: Operations team.
• Compliance risks arise out of non-compliance with applicable laws, regulations, standards and policies that could impact the Company’s reputation and business.
Ownership of risk: Functional heads
• Financial risks are related to financial performance targets of revenue and profit goals of the Company. These risks could have impact on the Company’s financial statements and transmission of accurate financial information to stakeholders.
Ownership of risk: Finance & accounts heads and their team
• IT risks could have potential impact on information assets and processing systems.
Ownership of risk: Chief Information Officer and his team
RISK GOVERNANCE STRUCTUREThe risk management framework operates at various levels in the Company and the governance structure is as given below:
Business & Plant Heads
Audit Committee
Board
Risk Management Committee (RMC)
Risk Management Head

Annual Report 2017-18 7574
Com
pany O
verviewS
tatutory R
epo
rtsFinancial S
tatements
The risk governance structure of the Company is headed by Board of Directors who form the RMC. The Committee is responsible for framing, implementing and monitoring the risk management framework for the Company and responsible for reviewing the risk management process and ensuring its effectiveness.
The Audit Committee has additional oversight in the area of financial risks and controls. Risk Management Head (RMH) acts as a nodal point for coordinating risk mitigation activities. RMH also appraises the Audit Committee with identified risks and its mitigation. RMH is supported by business heads who are the risk owners to implement the risk management framework in their respective business units.
INTERNAL FINANCIAL CONTROLS (IFC) HIGHLIGHTS FOR THE YEARAs mandated by the Companies Act 2013, the Board of Directors are responsible to ensure that the Internal Financial Controls are adequate and operating effectively. In addition, the Company’s statutory auditors are required to provide an independent opinion on the adequacy and operating effectiveness of such controls in the financial year. During the FY 2017-18, the Company has taken an initiative to automate controls in key business processes and has put in place large number of ‘system-driven controls’ and reduced dependency on manual controls. Segregation of duties is established in every activity to prevent errors and frauds. This effort has increased the effectiveness of business processes as well as accuracy of transactions processing in ERP. All the controls have been properly documented and tested for their design and operating effectiveness.
BUSINESS RISKS AT AUROBINDOSome of the key existing and emerging risks affecting Aurobindo’s business are listed below:
Economic & geopolitical risksEconomic and political instability arising from changes in foreign policies & political leadership in countries such as USA, Europe and emerging markets (EM), where Aurobindo has business presence could adversely affect the Company’s operations and revenues.
There has been a significant growth over the years in the Company’s revenues backed by increased exports. The revenues are generated mainly from the sale of formulations and bulk drugs in the global markets. These include developed markets like USA and Europe and emerging markets across the world. The revenue breakup of the Company for financial year 2017-18 is as given below:
• Export sales constitute about 90% of the Company’s total revenue with the rest 10% being domestic sales;
• Formulations business contributes 82% to the Company’s total revenue and the rest 18% comes from active pharmaceutical ingredients (APIs);
• About 55% of the formulations sales come from the US,
about 32% from Europe, 6% from anti-retroviral (ARV) business segment and the balance 7% from Growth markets.
In the global pharmaceutical industry, there are various concerns on product quality and safety which may lead to penalties, product recalls, brand & reputation damage and revenue loss. The regulatory landscape of global pharmaceutical industry is complex and dynamic which is significantly influenced by political environment, changes in Government policies and decisions.
Aurobindo is an integrated global pharmaceutical company with operational presence across the globe and with broad portfolio of diversified dosage forms. The Company’s objective is to expand further in the other untapped markets and to focus on novel technology platforms.
Mitigation strategy:In order to mitigate the economic and geo-political risks, the Company continues to expand its business presence in other untapped and potential markets like Japan, Brazil, Africa, Canada and Middle East. New markets are added in Poland and Czech Republic. Also, to enhance presence in therapeutic areas like oncology and speciality injectable products, Aurobindo continues to take adequate care to grow in each of the product segment and is striving to improve its presence in all markets by expanding its business. Such well-designed moves would also help consolidate the Company’s volumes and revenues over the long-term, thereby spreading the risk portfolio.
As a de-risking strategy, the Company continues to focus on territorial expansions, partnerships, globalization and further penetration through joint ventures and subsidiaries in potential markets.
Competition risksAurobindo’s products face tough competition from other pharmaceutical companies in India and abroad where multiple players are present, and introduction of new products by competitors may impair the Company’s competitive advantage and lead to loss of market share.
The Pharmaceutical industry is severely competitive and is affected by new technologies, new product developments, government regulations and other factors. The Company faces intense competition from other pharmaceutical companies in global and domestic markets and introduction of new products by them may impair company’s competitive advantage thereby affecting revenues.
Mitigation strategy:In order to mitigate the risk of rising and on-going competition from peers, the Company continues to focus on the following aspects.
• Producing products at competitive costs by developing new processes, upgrading existing processes and achieving operational excellence

Annual Report 2017-18 7776
• Timely launch of new products by talented R&D teams to build and increase market share
• Adding new manufacturing facilities with new products to ensure sufficient levels of production
• Providing the product quality assurance to all customers
• Redefining the production process by R&D team to have cost effective products
• Vertically integrating the manufacturing facilities for most generic formulations to ensure timely material availability
• Micro-level planning of inventory to handle inventory costs efficiently
Regulatory, Statutory & Legal compliance risksWith rigorous regulatory and legal requirements and an evolving compliance landscape, the pharmaceutical industry is constantly being challenged by critical compliance risks at an enterprise level.
Regulatory framework plays a vital role in developing and doing business in global and domestic markets. Due to constantly increasing regulatory requirements as well as globalization market, the demands and responsibilities of business in the form of regulatory readiness are becoming stringent. The regulations require registration, filings and data submission to allow the Company enter diverse markets. Therefore, the Company continues to establish and strengthen systems & controls to monitor and upgrade registrations as and when required. The Company continues to adopt a zero-tolerance approach towards non-compliance with any applications laws.
Mitigation strategy:Aurobindo has a talent pool of over 1,500 scientists, who have adequate experience in handling complex chemistry and filing applications with the regulatory authorities. The strong scientist pool has helped Aurobindo receive a total of 361 ANDA approvals (327 final approvals including 17 for Aurolife Pharma LLC, and 34 tentative approvals) from US FDA as at March 31, 2018. Cumulative filings total 478 ANDAs.
Similarly, as on March 31, 2018, the team has filed over 427 DMFs including 227 with US FDA. So far, 669 patent applications are pending with various authorities and 106 have been granted patents.
Aurobindo is committed for supplying highest quality medicines to customers for promoting healthier lives. Hence, the Company strives to conform to regulatory and compliance standards to meet stringent requirements of regulators to ensure that our medicines provide best health care for the consumers. Robust quality systems & control measures are available to ensure that the quality is ensured by process design. Every effort is being made to ensure that there is no compromise on quality of products and processes. Continuous monitoring is being done by QC/QA team to deliver highest quality products.
The Company has a robust “Statutory compliance system/solution” (Vision 360 Tool) for ensuring compliance with all applicable laws and it is designed to meet compliance goals of the Company. Periodic updates to the system are made as and when there is a change in any applicable law. Quarterly compliance declarations generated electronically from the system are submitted to compliance officer. In case of any non-compliance, necessary steps are taken by the concerned functional heads to fix it.
Aurobindo’s commitment to Environment, Health and Safety (EHS) - The Company’s Board and executive management have a strong commitment towards creating and providing a safe working environment for all its employees and other stakeholders. Aurobindo has a full-fledged EHS team which is continuously addressing issues of environmental safeguarding by conducting periodical safety audits and training programs.
Pricing risksSome of Aurobindo’s products are subject to regulatory pricing controls and other pressures on pricing. The price controls limit the financial benefits of growth in the life sciences market and the timely introduction of new products.
Like most of the other companies, Aurobindo is also subject to pricing pressure. Prices are a function of demand and supply and the Company faces perfect competition in generic drug industry. This year witnessed a significant volatility in global commodity prices and there has been disruption in domestic market in the form of demonetization. Prices change in response to supplies and competitive pressures. Domestic pricing is influenced by global trends in both availability and price of imported active ingredients. The Company continues to face challenges within the industry successfully be it price cuts or increased price controls.
Mitigation strategy:Aurobindo is able to cope with pricing pressures and focus on quality assurance to minimize the possibilities of commoditization. Also, the Company has a well-diversified product basket in the US which helps in mitigating the pricing pressure. The in-house R&D team is striving to develop cost-effective products by redefining the production process/facility. The Company is moving up the value chain by offering differentiated and speciality products and technology platforms. The supply chain team is continuously putting in efforts to de-risk global procurement issues and is ensuring timely services to key customers in international and domestic markets.
Patent protection risksAurobindo’s success to a great extent depends upon the Company’s ability to obtain IP Rights such as patents and trademarks, protect trade secrets and other proprietary information, and operate without infringing the intellectual property rights of the other companies. Aurobindo’s inability

Annual Report 2017-18 7776
Com
pany O
verviewS
tatutory R
epo
rtsFinancial S
tatements
to obtain timely ANDA approval and/or launch a product immediately upon approval due to patent litigation issues or due to settlement for a late market entry date may affect the revenue.
Aurobindo has a dedicated team of IP professionals whose primary task is to ensure that the products are manufactured using essentially non-infringing composition and processes to the best possible extent and in compliance with IP-related requirements by reviewing and monitoring IPR issues continuously.
The IPR team evaluates and provides stage-wise IP clearances during product/process developmental activities. The IPR team also provides frequent updates and alerts on all relevant IP matters (such as patent, trademark, etc.) to R&D scientists for the products and suggests suitable measures to deal with IP-related issues. The IP team is also involved in product selection activity to ensure that right products are selected for development and no potential opportunity is missed out to the best possible extent.
As of March 31, 2018, the Company has more than 563 patent applications pending with various authorities. Aurobindo takes adequate care to protect its trade secrets, know-how and other proprietary information, and ensures that the employees, vendors and suppliers associated with the Company directly or indirectly sign appropriate confidentiality agreements prior to disclosure of any such confidential information.
Market risksAurobindo is exposed to market risk if the Company is unable to maintain sufficient portfolio of products and manage their development and timely bringing the products to market which could ultimately affect the business and growth strategy. The Company is significantly dependent on the US market for its business. Failure to conduct profitable operations in that market could adversely affect the Company’s business, operations and financial condition. This scenario poses the risk of high concentration and significant dependence on one market.
Aurobindo’s success largely depends on the ability to continue the development and commercialization of new products in a timely and cost-effective manner which is a complex and time-consuming process. Therefore, it is important for the Company to maintain a large portfolio of products and product pipeline. Most importantly, the Company needs to focus on managing development and approval process of products to bring them to market on a timely basis.
Mitigation strategy:As part of mitigation procedure, the Company’s R&D team strives to develop new, innovative processes and specialized products that allow the Company to capitalize on competitive market opportunities. As part of product portfolio growth strategy, the Company sells nutritional supplements in US & other markets which enhance revenues.
It is highly challenging for the Company to retain the existing market share and increase it in the future. Any sort of delay in supplying material to customers and deviations in customers’ specifications could have adverse impact on customer relationships and loss of revenues and the Company would have to face penalties. It may also affect the Company’s reputation and competitiveness which could lead to loss of market share. Such failures could have major impact on the Company’s business and brand value. The Company’s SCM team ensures that such failures are monitored and mitigated in a real time.
Mitigation strategy:In order to reduce the concentration risk, the Company continues to spread its business (Formulations and API) into European, Japanese and emerging markets. Aurobindo with its effective marketing strategy is increasing sales volumes for both the businesses in existing markets and is making regular efforts to widen geographical spread by entering into large potential markets in Latin America and emerging markets. The Company has the right balance between high margin-low volume products and low margin-high volume products.
The Company continues to expand the end-to-end manufacturing capacities and to ensure capacity utilization at optimum levels with effective marketing strategy and proper coordination from Production and SCM heads.
Financial risksFailure to maintain appropriate credit ratings (Downward movement in rating) could affect the Company’s cost of borrowings thereby having adverse impact on profitability. While the Company’s exports are significantly high, financial obligations towards import payments and ECB payments are also high and any adverse foreign currency fluctuations could have impact on financial position.
Mitigation strategy:The Company’s treasury team continues to ensure reduction in borrowing costs with proper negotiation with banks. There exists a defined credit policy for all its customers which covers defining, approving and monitoring customer credit limits based on customer’s profile and their payment history. The treasury team along with the Business Heads evaluate customer credit risk and approve credit limit that can be provided to a customer. The customer credit limits are periodically reviewed and changed in order to mitigate the credit risk. The treasury team reviews customer collections regularly and makes import payments and takes necessary actions wherever necessary. Also, the treasury team continuously monitor day-to-day fund requirements and manages the banking relations effectively.
Aurobindo is predominately an export-oriented company. Around 90% of the Company’s revenue is from international markets. At the same time, the Company is having sizable imports/working capital in foreign currency and long-term ECB to fund the export-oriented projects. As such, the Company’s growing exports

Annual Report 2017-18 7978
and its collections provide the natural hedge to the imports and working capital against the foreign exchange fluctuations.
The Company is conscious of the impact that currency fluctuations can have on earnings. The forex position is reviewed on a monthly-basis by the Borrowing Committee and quarterly by the Board/Audit Committee. Based on the decision of the Borrowing Committee, the treasury team ensures the execution of transactions through forward cover.
Raw-material import risksAurobindo’s dependency on China market for import of raw-material is very high and this may lead to risk of import disruptions, short supplies and production bottlenecks due to unforeseen changes in government regulations & economic policies of China.
The creation of stable sourcing platform is a challenge and critical for the Company in material procurement and the SCM team has taken steps in ensuring long-term supply sustainability in this space.
Mitigation strategy:As part of strategic sourcing, our procurement team continuously focuses on the following aspects in order to mitigate sourcing risks.
• Cross-functional interaction to address long-term supply concerns and sourcing constraints
• Mapping of geographic risks with alternative vendor development
• Efficient cost management and proper alignment with budget constraints
• Monthly procurement review among cross-functional teams to monitor progress on risk mitigation
• Integrated planning and procurement for operational dynamism
• Continuous tracking of market trends and its dynamics
In our journey of excellence over the years, our key focus has been de-risking of single sourced material and reducing our dependency on China for raw-material procurement due to cost escalation and environmental changes therein. There exists a dedicated procurement team for managing the sourcing risks regularly and the Company is having an effective process and controls to periodically evaluate its vendors for all critical material. The procurement team ensures high quality purchases at economical costs and maintains reliability of supplies from reputed vendors with long-term relationships.
The ‘Production planning & inventory control’ (PPIC) continues to regularly track the material requirement in coordination with SCM and Production teams for keeping optimum levels of material so that production schedule is not affected.
People risksAurobindo’s success depends largely upon an effective HR strategy that includes recruitment, learning & development,
succession planning and retention of competent personnel. The HR strategy is aligned to business plan and growth of the Company. It is a well-managed challenge for Aurobindo to maintain good industrial & employee relations. Labour unrest could impact the Company’s operations. The industry is human capital intensive with a high rate of attrition and this could have an impact on the Company’s operations.
Mitigation strategy:Aurobindo has a committed Human Resources team to acquire, retain and develop talent considering the competition for qualified and experienced people.
Leadership development – As part of the Company’s strategic talent and succession management, the HR team at Aurobindo has identified and developed people with potential to fill key business leadership positions. The Company has instituted NALANDA, online academy, to facilitate Leadership Talent Development and support management philosophy of second-line development and for promoting mentor-mentee relationships within the Company. The second-in-command across each key function and decentralized management style has developed a much stronger organization culture. The Company is continuously fine-tuning its HR strategy in order to meet its business goals.
Talent engagement & empowerment –Talent development is important for the success of business and training needs are identified for each individual on a periodic-basis. The Company understands the need to create a culture of high employee engagement as a method to retain talent. There is a proactive approach to HR management and employees are given responsible authority. Emphasis is on accountability with clear job descriptions and the employees are encouraged to perform to their optimum potential. Regular interactions and communications help the personnel to update and upgrade their knowledge and skills which helps in minimizing the operational risks.
Kaizen change management process has been initiated with focus on Shop-floor Empowerment and provides Partnership-platform for the people to engage with continuous improvement projects. Process Care, People Care and Asset Care are the three enablers to achieve the continuous improvement mission in the Company.
Multi skilling & Quality programs – The Company has introduced multi-skilling program which promotes job enrichment of talent at operational level. Also introduced Quality Marshal Program which facilitates strengthening of Quality culture at shop-floor.
Employee performance appraisals – The Company’s on-line employee appraisal system is robust for measuring performance vis-à-vis KRAs defined for the employees. HR team strives to ensure that annual performance assessments are conducted effectively with necessary feedback and counselling.
Harmonious industrial relations – Industrial Relations team is making continuous efforts to maintain a cordial relationship with employees with a view to achieve best performance. The
Annual Report 2017-18 7978
Com
pany O
verviewS
tatutory R
epo
rtsFinancial S
tatements
Company has established an online people care link to redress grievances in a proactive manner and believes in bipartite strategy to prevent and settle any outstanding issues in a peaceful manner. Further, management has initiated Social Accountability Certification process (SA 8000 series) to maintain its commitment towards fair people management.
The Company ensures that there is full adherence to code of business conduct and fair business practices are followed by employees.
Information technology (IT) risksAchievement of business objectives for Aurobindo depends on the existence of a robust IT strategy that includes adequate IT infrastructure, data storage & processing capabilities, data confidentiality, integrity and availability at all times. Occurrence of any unforeseen threats to IT systems could have adverse impact on data processing, data availability and continuity of operations.
Mitigation strategy:The Company continues to calibrate and update its key business processes to continuously improve efficiencies. These include controls automation and internal workflows for manufacturing, supply chain and integrating them with material planning, sales & marking, HR.
The Company has robust IT controls related to back-up, storage and system access including role-based access control for the applications and strong change management controls. There are well documented SOPs and are reviewed periodically for their effectiveness. For all mission critical IT applications and services,
the Company has built highly stringent and secured infrastructure. For business continuity, the Company has a disaster recovery site which hosts backup ERP applications.
Aurobindo has an experienced IT operations team who ensures day-to-day smooth functioning of IT infrastructure and applications including network infrastructure, server & device management, computer operations, and help desk services for the Company. All incidents are tracked through ticketing tool and there is a well-defined process for its closure in a timely manner.
The IT Governance Committee of the Company periodically reviews IT-related matters around policies & practices, budgets proposals for procurement of new applications and hardware, renewal of licenses, process automation to support the business functions etc. and advises the Board for its consideration.
For any business process automation /digitalization and regulatory compliance-related solution, the IT team works very closely with business process owners for effective and timely implementation. Periodic reporting of all critical IT projects to leadership team is done by Chief Information Officer (CIO). The IT team conducts periodic evaluation of IT process and in case of any process gaps and concerns, appropriate corrective measures are taken in a time bound manner.

Annual Report 2017-18 8180
BUSINESS RESPONSIBILITY REPORT
OVERVIEWAurobindo Pharma Ltd is one of the largest generic pharmaceutical companies in the world with presence in over 150 countries, with 25 manufacturing facilities, which has requisite approvals from various regulatory authorities like US FDA, UK MHRA, Japan PMDA, WHO, Health Canada, MCC South Africa, ANVISA Brazil, etc. Aurobindo has an employee base of more than 19,000 (including all subsidiaries). Aurobindo is a vertically integrated Company with around 70% of its API requirement being met in-house. The Company has presence across the world and the key markets are the US and Europe.
The Company’s robust product portfolio is spread over seven major therapeutic/product areas encompassing Antibiotics, Anti-Retrovirals, cardio-vascular (CVS), central nervous system (CNS), Gastroenterologicals, Anti-Allergies and Anti-Diabetics, supported by an outstanding R&D set-up. Aurobindo forayed into biosimilars segment with acquisition of five cell culture derived biosimilar products. The Company also develops fermentation based semi synthetic products, and furthermore it produces novel proprietary biocatalysts.
Aurobindo generates around 90% of its consolidated revenue from the international markets and currently holds a strong position in the US market and in many European countries, including France and Italy where it ranks among the largest generic companies. In the US, it is the fifth largest generic pharmaceutical company (as per IMS National Prescription Audit, in terms of total prescriptions dispensed for the 12 months ending April 2018), The Company believes in doing business in a responsible manner. The Business Responsibility Report is aligned to the National Voluntary Guidelines (NVGs) on social, environmental and economic responsibilities of business released by the Ministry of Corporate Affairs and is in compliance with Regulation 34 (2) (f) of the SEBI (Listing Obligations and Disclosure Requirements) Regulations, 2015. All the facts and figures reported in the Business Responsibility Report pertains to the parent company i.e. Aurobindo Pharma Ltd.
SECTION A: GENERAL INFORMATION ABOUT THE COMPANY1. Corporate Identity Number (CIN) of the Company L24239TG1986PLC015190
2. Name of the Company Aurobindo Pharma Limited
3. Company Address Registered Office: Plot No2, Maitrivihar, Ameerpet,
Hyderabad 500038, Telangana, India
Corporate Office: Water Mark Building | Plot No. 11, Survey No.9 | Kondapur, Hitech City | Hyderabad-500084, Telangana, India
4. Website www.aurobindo.com
5. E-mail id [email protected]
6. Financial Year reported 1st April 2017 to 31st March 2018
7. Sector(s) that the Company is engaged in (industrial activity code-wise):
S. No
NIC code of product/ service
Description
1 21001/21002 Manufacturing generic pharmaceuticals and active pharmaceuticals ingredients (APIs)
8. List three key products/services that the Company manufactures/provides (as in balance sheet)
The Company’s product portfolio is spread over seven major therapeutic/product areas encompassing Antibiotics, Anti-Retrovirals, CVS, CNS, Gastroenterologicals, Anti-Allergies and Anti-Diabetics.
9. Total number of locations where business activity is undertaken by the Company:
The Company along with its subsidiaries has Marketing and Sales offices in 31 countries and markets its products globally in over 150 countries.
(a) Number of International locations (Provide details of major 5):
The subsidiaries of the Company have manufacturing facilities in New Jersey, Los Angeles and California in USA, one each in Brazil & Portugal and two R&D centers in USA. Apart from these, the Company has offices in various European, African and Asian countries.
(b) Number of National locations:
The parent company has 15 manufacturing units and two R&D centers. In addition to these, there are three manufacturing units under construction. The subsidiaries & joint ventures of the Company have five fully commissioned manufacturing units and another one is under construction.
10. Markets served by the Company – Local/State/National/International:
Apart from the domestic market, the Company also markets its products globally in over 150 countries across 6 continents. Around 81% of the Company’s standalone sales are generated from the International markets.
SECTION B: FINANCIAL DETAILS OF THE COMPANY
1. Paid up Capital (`): `585.9 million
Annual Report 2017-18 8180
Com
pany O
verviewS
tatutory R
epo
rtsFinancial S
tatements
2. Total Turnover (`): Gross turnover of `103,031 million on standalone basis
3. Total profit after taxes (`): `18,128 million on standalone basis
4. Total Spending on Corporate Social Responsibility (CSR) as percentage of profit after tax (%):
CSR Spend during the financial year 2017-18 was `200 million (1.1% of standalone profit after tax). All unspent CSR funds of previous year(s) are carried forward for spending on CSR activities.
5. List of activities in which expenditure above has been incurred
• Education
• Health
• Environmental sustainability
• Rural sports promotion, old age homes and rural development
SECTION C: OTHER DETAILS1. Does the Company have any Subsidiary Company/
Companies? Yes, Aurobindo has 56 subsidiary companies located in India
and other countries as on 31st March, 2018.
2. Do the Subsidiary Company/Companies participate in the BR Initiatives of the parent company? If yes, then indicate the number of such subsidiary company(s)
The parent company undertakes majority of the BR initiatives, through its 'Not for Profit' foundation called Aurobindo Pharma Foundation.
3. Do any other entity/entities (e.g. suppliers, distributors etc.) that the Company does business with, participate in the BR initiatives of the Company? If yes, then indicate the percentage of such entity/entities? [Less than 30%, 30-60%, More than 60%]
Entities like suppliers, distributors did not participate in the Company’s BR initiatives for the reporting period.
SECTION D: BR INFORMATION1. Details of Director/Directors responsible for BR a) Details of the Director/Director responsible for
implementation of the BR policy/policies
• DIN Number: 00050482
• Name: Mr. N. Govindarajan
• Designation: Managing Director
b) Details of the BR head
S. No
Particulars Details
1 DIN Number (if applicable)
00050482
2 Name Mr. N. Govindarajan3 Designation Managing Director4 Telephone number 040-667252465 e-mail id [email protected]

Annual Report 2017-18 8382
2. Principle-wise (as per NVGs) BR Policy/policies a) Details of compliance (Reply in Y/N)
S. No
Questions
Eth
ics
Pro
duc
t Li
fe
Cyc
leS
usta
inab
ility
Em
plo
yees
w
ell-
bei
ng
Sta
keho
lder
E
ngag
emen
t
Hum
an
Rig
hts
Env
ironm
ent
Pol
icy
Ad
voca
cy
Com
mun
ity
Dev
elop
men
t (C
SR
)
Cus
tom
er
Valu
e
1 Do you have a policy/ policies for Y The company
continuously focusses on the optimal utilization of resources from its product
design to disposal
Y Y Y Y
NA
Y The company in its operations ensures the customer value
2 Has the policy being formulated in consultation with the relevant stakeholders?
Y Y Y Y Y Y
3 Does the policy conform to any national / international standards? If yes, specify? (50 words)
Y Y Y Y Y* Y
4 Has the policy being approved by the Board?
Is yes, has it been signed by MD/ owner/ CEO/ appropriate Board Director?
Y Y Y Y Y Y
5 Does the company have a specified committee of the Board/ Director/ Official to oversee the implementation of the policy?
Y Y Y Y Y Y
6 Indicate the link for the policy to be viewed online?
** Employees Self Service in IHRMS
** **
7 Has the policy been formally communicated to all relevant internal and external stakeholders?
Y Y Y Y Y Y
8 Does the Company have in-house structure to implement the policy/ policies?
Y Y Y Y Y Y
9 Does the Company have a grievance redressal mechanism related to the policy/ policies to address stakeholders’ grievances related to the policy/ policies?
Y Systems in place
Y Y Y
10 Has the Company carried out independent audit/ evaluation of the working of this policy by an internal or external agency?
Y Y Y Y Y The CSR assessment
is done internally
The Company abides by the law of land and the policies are framed considering the national standards.*Policy is in line with ISO 14001 international standardsThe policies are available at the following link:** http://www.aurobindo.com/social-responsibility
3. Governance related to BR a) Indicate the frequency with which the Board of
Directors, Committee of the Board or CEO to assess the BR performance of the Company. Within three months, three-six months, annually, more than one year
Reviewed annually
b) Does the Company publish a BR or a Sustainability Report? What is the hyperlink for viewing this report? How frequently it is published?
This is Aurobindo’s 3rd Business Responsibility Report and is a part of the FY17-18 Annual Report.
Previous year’s Business Responsibility Report can be accessed from the following hyperlink (which is part of Annual report 2016-17): http://www.aurobindo.com/docs/annual-reports/aurobindo-ar-2016-17.pdf
SECTION E: PRINCIPLE-WISE PERFORMANCEPrinciple 1 – Ethics1. Does the policy relating to ethics, bribery and
corruption cover only the Company? Yes/ No. Does it extend to the Group/Joint Ventures/ Suppliers/Contractors/NGOs /Others?
Aurobindo is committed to build a strong ethical organization. The Company’s Code of Conduct affirms its

Annual Report 2017-18 8382
Com
pany O
verviewS
tatutory R
epo
rtsFinancial S
tatements
commitment to the highest standards of integrity and ethics. The Code of Conduct guides all supervisory, executive and managerial employees of the Company including the Board members. The policy is communicated to the employees across all the locations. The policy documents are made available in internal portal for ready reference
2. How many stakeholder complaints have been received in the past financial year and what percentage was satisfactorily resolved by the management? If so, provide details thereof, in about 50 words or so.
During the year ended March 31, 2018, the Company has received and resolved 31 complaints from investors. All the complaints were resolved to the satisfaction of the shareholders and there were no pending complaints at the year end.
Principle 2 – Product Life Cycle Sustainability1. List up to three of your products or services whose
design has incorporated social or environmental concerns, risks and/or opportunities.
Our following products help address social or environmental concerns in their design (Electrical and Energy Savings),
a) Levetiracetam
b) Ceftazidime for Injection
c) Ceftriaxone Sodium
2. For each such product, provide the following details in respect of resource use (energy, water, raw material etc.) per unit of product(optional)
Product-wise details are mentioned below:
Levetiracetam: Levetiracetam has been approved as an add-on treatment
for partial (focal) myoclonic and tonic-clonic seizures. It has potential benefits for treating other psychiatric and neurologic conditions such as Tourette syndrome, anxiety disorder and Alzheimer’s disease. However, its most serious adverse effects are behavioral, and its benefit-risk ratio in these conditions is not well understood.
Installed De-super heaters at turbines exhaust to convert the super-heated steam to saturated steam to meet the process steam requirements. This energy conservation initiative has produced 16,065 MT of additional steam and an equivalent coal savings of 3.01 MT/ Kg or `20.6 million / annum. This project not only fulfills the heating requirements for Levetiracetam, but also for major capacity production molecules such as Lamivudine, Cinacalcet Hydrochloride, Dabigatran, Hydralazine HCl, etc.
Ceftazidime for Injection and Ceftriaxone Sodium: Ceftazidime is used to treat a wide variety of bacterial
infections. It works by stopping the growth of bacteria.
Ceftazidime is used to treat lower respiratory tract, skin, urinary tract, blood-stream, joint, and abdominal infections, and meningitis.
Ceftriaxone Sodium is used to prevent or treat certain infections caused by bacteria. It is given by injection only into a muscle or vein. Ceftriaxone is often used to treat infections of the lung, urinary tract, skin, abdomen, bone joint and lining of the brain (meningitis), depending on the bacteria causing them. It can also be used to treat Gonorrhea. Both these products belongs to the family of antibiotics known as Cephalosporins. 320 TR Vapor Absorption Machine (VAM) installed instead of old 300 TR- 1No & 2 compressors (160 TR & 200 TR) to save electrical energy at manufacturing blocks for these products and solvent recovery (Methylene Chloride, Acetone, Ethyl Acetate, Ethanol, Methanol). Cumulatively, the saving of 31.05 kWh/Kg of product which is equivalent to `17.2 million /annum was achieved with ceftazidime and ceftriaxone Sodium energy conservation initiative
3. Does the Company have procedures in place for sustainable sourcing (including transportation)?
The Company has laid down a standard operating procedure for the selection of its vendors and approving the same for sourcing of material. There is a system in place for evaluating the EHS resources and compliance of key suppliers and vendors for key raw material intermediates and API sourcing.
4. Has the Company taken any steps to procure goods and services from local & small producers, including communities surrounding their place of work?
The Company follows a strict sourcing code of conduct with respect to the compliance and quality. The Company procures goods and services from local vendors near the manufacturing locations who fulfills the above key criteria of compliance and quality.
5. Does the Company have a mechanism to recycle products and waste? If yes what is the percentage of recycling of products and waste (separately as <5%, 5-10%, >10%). Also, provide details thereof, in about 50 words or so.
Yes, the Company has a mechanism to recycle or dispose materials including waste in a responsible manner.
• The Company has the process of recovering solvents where the volume of solvent usage is maximum and wherever possible to recycle.
• Spent Catalysts are sent back to vendor for regeneration and reuse.
• All organic wastes generated from API Units (solids and liquids) and all the wastes generated from Formulations Units (with very few exceptions) are disposed to Cement Units for use as auxiliary fuel called ‘co-processing’ of wastes. For the financial year under discussion, approximately 60% of the waste is recycled through co-processing.

Annual Report 2017-18 8584
Principle 3 – Employees Well being1. Please indicate the total number of employees Company has 17,332 employees as on 31st March, 2018
2. Please indicate the total number of employees hired on temporary/contractual/casual basis
Company has over 9,000 contractual employees as on 31st March, 2018
3. Please indicate the number of permanent women employees.
Company has 780 women employees as on 31st March, 2018
4. Please indicate the number of permanent employees with disabilities
We don't differentiate employees on any form of disabilities. Hence, no data available.
5. Do you have an employee association that is recognized by management?
Yes
6. What percentage of your permanent employees is members of this recognized employee association?
As the majority of the office bearers/active members of the Association have left the organization, no activity has been observed during last financial year. Harmonious industrial relations were maintained across all the manufacturing locations.
7. Please indicate the number of complaints relating to child labour, forced labour, involuntary labour, sexual harassment in the last financial year and pending, as on the end of the financial year.
S. No
Category No of complaints filed during the FY
No of complaints pending as on end of the FY
1 Child labour/forced labour/involuntary labour
Nil, Company does not hire child labour, forced labour, involuntary labour
Nil
2 Sexual harassment Nil Nil
3 Discriminatory employment
Nil Nil
8. What percentage of your under mentioned employees were given safety & skill up-gradation training in the last year?• Permanent Employees: Employee training is a
continuous process in the organization and all the employees are given mandatory safety training at the time of joining the organization. Further there are continuous skill-based trainings imparted to over 90% our employees.
• Permanent Women Employees: No separate data record is maintained.
• Casual/Temporary/Contractual Employees: All our contractual employees are imparted with trainings
• Employees with Disabilities: NA
Principle 4 – Stakeholders Engagement1. Has the Company mapped its internal and external
stakeholders? Yes/No Yes
2. Out of the above, has the Company identified the disadvantaged, vulnerable & marginalized stakeholders
Yes
3. Are there any special initiatives taken by the Company to engage with the disadvantaged, vulnerable and marginalized stakeholders? If so, provide details thereof, in about 50 words or so.
The Company believes in greater engagement with its stakeholders and being sensitive towards their needs and expectations. This is one of the corporate values that focusses on being responsive to stakeholders’ needs, proactive and transparent.
The Company has a Whistleblower Policy that provides support to employees, channel partners and vendors to report significant deviations from key management policies and report any non-compliance and wrong practices. The Company also has an Investor Grievance Cell where the investors can raise their concerns and are resolved appropriately.
Principle 5 – Human Rights1. Does the policy of the Company on human rights
cover only the Company or extend to the Group/Joint Ventures/Suppliers/Contractors/NGOs/Others?
The policy covers the employees of the organization.
2. How many stakeholder complaints have been received in the past financial year and what percent was satisfactorily resolved by the management?
None received
Principle 6 - Environment1. Does the policy related to Principle 6 cover only the
Company or extends to the Group/Joint Ventures/Suppliers/Contractors/NGOs/others?
The Company has a well-defined environment, health and safety (EHS) policy that caters to the employees, group, JVs and the contractors working at our sites. The Company is committed to operate all its units in an environmentally friendly manner while protecting health and safety of its employees.

Annual Report 2017-18 8584
Com
pany O
verviewS
tatutory R
epo
rtsFinancial S
tatements
2. Does the Company have strategies/ initiatives to address global environmental issues such as climate change, global warming, etc? Y/N. If yes, please give hyperlink for webpage etc.
The Company has initiated for participation and membership in Pharmaceutical Supply Chain Initiative (PSCI) and International Federation of Pharmaceutical Manufacturers & Associations (IFPMA). These international forums are engaged in addressing global environmental concerns such as Pharmaceuticals in Environment, Anti-Microbial Resistance, etc. Aurobindo is part of BDMA (Bulk Drug Manufacturer’s Association, India) initiatives to address similar issues. IFPMA, agreed in principle for the request of Aurobindo for Membership.
The Antimicrobial Resistance Benchmark is a first independent, detailed evaluation of how pharmaceutical companies are halting the rise of drug resistance by Access to Medicine Foundation, an independent non-profit organization based in the Netherlands through collaboration with experts and specialists working across the spectrum of organizations working to curb antimicrobial resistance. The Access to Medicine Foundation approached Aurobindo, while describing the purpose of the benchmark, its process and the framework of the benchmark, in May, 2017 with a request to take part in the initiative. Aurobindo gladly accepted to take part in the benchmark exercise. The Antimicrobial Resistance Benchmark 2018 was published in January, 2018. Proposed 2020 AMR Benchmark will have more indicators with participation of 30 companies across 106 countries in scope for access indicators. Aurobindo is actively engaging itself for the forthcoming 2020 AMR Benchmark as well.
3. Does the Company identify and assess potential environmental risks? Y/N
Yes
4. Does the Company have any project related to Clean Development Mechanism? If so, provide details thereof, in about 50 words or so. Also, if yes, whether any environmental compliance report is filed?
At present the Company does not have any project related to Clean Development Mechanism.
5. Has the Company undertaken any other initiatives on – clean technology, energy efficiency, renewable energy, etc.? Y/N. If yes, please give hyperlink for web page etc.
Yes, the Company has undertaken various initiatives to improve energy efficiency and to introduce cleaner technologies. In continuation of earlier initiatives, the Company has installed two stage RO systems that facilitates reduction in wastewater volumes requiring physical treatment like MEE, which resulted in reduction in steam consumption.
In cleaner technologies, the Company is continuing with established practices of segregation, storage and disposal appropriately to secure landfill facilities or cement units. The organic wastes, liquid and solid, are disposed to cement units for co-processing where the wastes serve as auxiliary fuel for the cement units.
6. Are the Emissions/Waste generated by the Company within the permissible limits given by CPCB/SPCB for the financial year being reported?
Yes
7. Number of show cause/ legal notices received from CPCB/SPCB which are pending (i.e. not resolved to satisfaction) as on end of financial year.:
No pending notices as on 31st March, 2018
Principle 7 – Policy Advocacy1. Is your company a member of any trade and chamber
or association? If Yes, Name only those major ones that your business deals with: The Company is associated with various trade organizations, chambers etc. as follows.
The Company is a member of various trade bodies and chamber associations in India as follows:
1) Export Promotion Council for EOU’S & SEZ’S
2) Indian Drug Manufacturers Association
3) Indian Chamber of Commerce & Industry
4) The Federation TG and AP Chambers of Commerce & Industry (FAPCCI)
5) Confederation of Indian Industry
6) Andhra Chamber of Commerce
7) Bulk Drug Manufacturers Association
8) Pharmaceuticals Export Promotion Council of India
9) Indo American Chamber of Commerce
10) JNPC Manufactures Association
11) Telangana Chambers of Commerce and Industry
12) Federation of Indian Micro and Small and Medium Enterprises (FIMSE)
2. Have you advocated/lobbied through above associations for the advancement or improvement of public good? Yes/No; if yes specify the broad areas (drop box: Governance and Administration, Economic Reforms, Inclusive Development Policies, Energy security, Water, Food Security, Sustainable Business Principles, Others)
The Company focuses on the advancement/improvement of public good through our well-defined CSR activities.

Annual Report 2017-18 8786
Principle 8 – Community Development (CSR)1. Does the Company have specified programs/
initiatives/projects in pursuit of the policy related to Principle 8? If yes details thereof
Aurobindo is committed to continuously improve its social responsibilities, environment and economic practices to make a positive impact on the society. Some of the key priorities of our community-based initiatives are:
• Education
• Health
• Environmental Sustainability
• Rural sports promotion, old age homes and rural development.
The Company also provides infrastructure support to the above-mentioned projects.
2. Are the programs/projects undertaken through in-house team/own foundation/external NGO/government structures/any other organization?
As indicated in the last year’s Annual Report, Aurobindo has established a Foundation i.e. Aurobindo Pharma Foundation for undertaking mainly CSR activities. Accordingly, the Company initiates CSR activities through the said foundation.
3. Have you done any impact assessment of your initiative?
We review our projects from time to time. Each project has specific deliverables to be met. The internal teams ensure project implementations are undertaken and that the desired impact is created.
4. What is your company’s direct contribution to community development projects- Amount in `and the details of the projects undertaken
Aurobindo has spent `200 million on the CSR activities during the FY2017-18. The amount was spent on areas as mentioned in point 1.
5. Have you taken steps to ensure that this community development initiative is successfully adopted by the community? Please explain in 50 words, or so.
The community development program revolves around education, health, sanitation etc. Overall these programs have benefitted more than 80,000 students and 1.4 lakh families during the year.
• Education: For the promotion of education, Aurobindo Pharma Foundation took various initiatives like
construction of school buildings, providing desks and benches, renovating facilities, free supply of school bags and other stationery, etc.
• Health: Aurobindo has partnered with LV Prasad Eye Institute for providing free oncology related treatment to elderly population in Vizag and Srikakulam districts. Aurobindo Pharma Foundation installed RO plants, constructed permanent water storage tanks, etc. for providing safe drinking water in many villages across Telangana and Andhra Pradesh.
• Environmental Sustainability: Under Green-Belt program, Aurobindo team has planted numerous saplings in many places and provided cement and plastic tree guards for the protection of saplings.
• Others: Aurobindo has taken up many other activities like adoption of few villages, conducting sports events for promotion of sports, donating fire engines and ambulances in some districts, providing free food for thousands of poor people each day, etc.
Further details on our CSR projects undertaken during the FY2017-18 are mentioned in a separate section of the Annual Report.
Principle 9 – Customer Value1. What percentage of customer complaints/consumer
cases are pending as on the end of financial year. Aurobindo has a well-defined mechanism to handle the
customer complaints. As on 31st March, 2018 less than 1% of the complaints were pending beyond the acceptable timelines as per the Standard Operating Procedures (SOP).
2. Does the Company display product information on the product label, over and above what is mandated as per local laws? Yes/No/N.A. /Remarks (additional information)
The product labelling is to be approved by the regulatory authorities of the country where the product is to be sold. The Company mentions all the product information required by the regulatory agencies.
3. Is there any case filed by any stakeholder against the Company regarding unfair trade practices, irresponsible advertising and/or anti-competitive behavior during the last five years and pending as on end of financial year? If so, provide details thereof, in about 50 words or so.
There are no pending cases as on 31 March 2018.
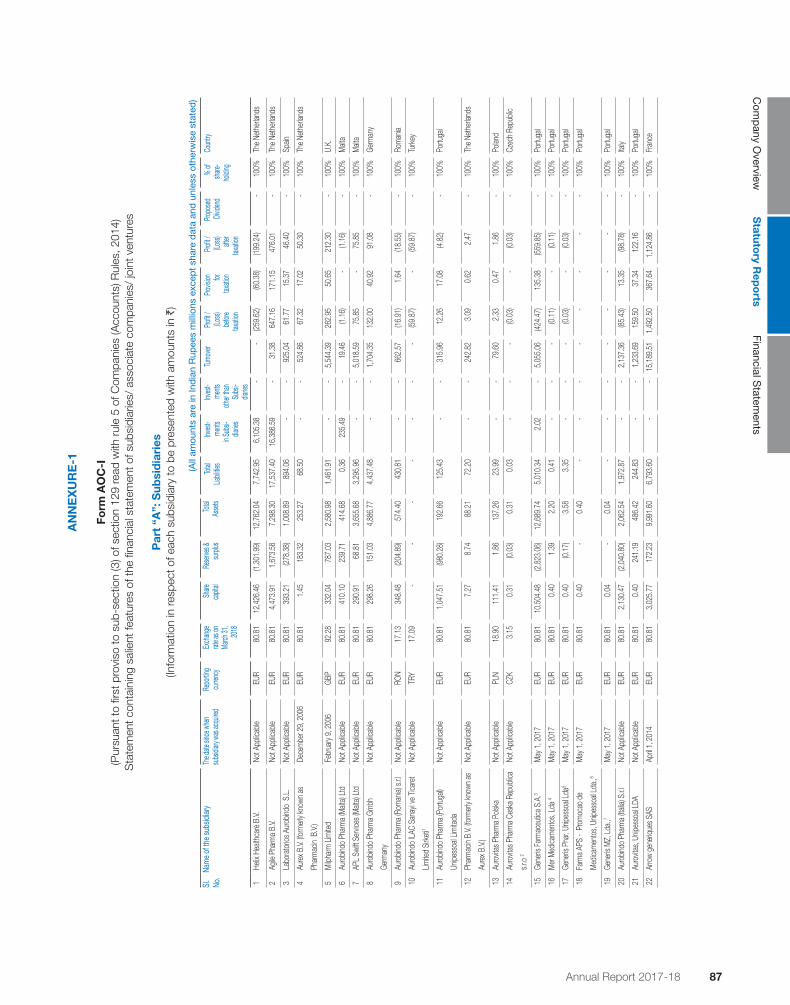
Annual Report 2017-18 8786
Com
pany O
verviewS
tatutory R
epo
rtsFinancial S
tatements
AN
NE
XU
RE
-1
Form
AO
C-I
(Pur
suan
t to
first
pro
viso
to s
ub-s
ectio
n (3
) of s
ectio
n 12
9 re
ad w
ith r
ule
5 of
Com
pani
es (A
ccou
nts)
Rul
es, 2
014)
Sta
tem
ent c
onta
inin
g sa
lient
feat
ures
of t
he fi
nanc
ial s
tate
men
t of s
ubsi
diar
ies/
ass
ocia
te c
ompa
nies
/ jo
int v
entu
res
Par
t “A
”: S
ubsi
dia
ries
(Info
rmat
ion
in re
spec
t of e
ach
subs
idia
ry to
be
pres
ente
d w
ith a
mou
nts
in `
)
(All
amou
nts
are
in In
dia
n R
upee
s m
illio
ns e
xcep
t sh
are
dat
a an
d u
nles
s ot
herw
ise
stat
ed)
Sl.
No.
Nam
e of
the
subs
idiar
yTh
e date
sinc
e whe
n su
bsidi
ary w
as ac
quire
dRe
portin
g cu
rrenc
y Ex
chan
ge
rate a
s on
March
31,
2018
Share
ca
pital
Rese
rves &
su
rplus
To
tal
Asse
tsTo
tal
Liabil
ities
Inves
t-me
nts
in Su
bsi-
diarie
s
Inves
t-me
nts
other
than
Subs
i-dia
ries
Turno
ver
Profi
t / (Lo
ss)
befor
e tax
ation
Prov
ision for
tax
ation
Profi
t / (Lo
ss)
after
taxati
on
Propo
sed
Divide
nd%
of
share
-ho
lding
Coun
try
1He
lix H
ealth
care
B.V.
Not A
pplic
able
EUR
80.
81
12,
426.
46
(1,3
01.9
9) 1
2,76
2.04
7
,742
.95
6,1
05.3
8 -
- (2
59.6
2) (6
0.38
) (1
99.2
4) -
100%
The
Neth
erlan
ds
2Ag
ile P
harm
a B.
V.No
t App
licab
leEU
R 8
0.81
4
,473
.91
1,6
73.5
8 7
,298
.30
17,
537.
40
16,
386.
59
- 3
1.38
6
47.1
6 1
71.1
5 4
76.0
1 -
100%
The
Neth
erlan
ds
3La
bora
torio
s Aur
obind
o S
.L.
Not A
pplic
able
EUR
80.
81
393
.21
(278
.38)
1,0
08.8
9 8
94.0
6 -
- 9
25.0
4 6
1.77
1
5.37
4
6.40
-
100%
Spain
4Au
rex B
.V. (fo
rmer
ly kn
own
as
Phar
mac
in B
.V.)
Dece
mbe
r 29,
200
6EU
R 8
0.81
1
.45
183
.32
253
.27
68.
50
- -
524
.86
67.
32
17.
02
50.
30
- 10
0%Th
e Ne
ther
lands
5M
ilpha
rm L
imite
dFe
brua
ry 9,
200
6GB
P 9
2.28
3
32.0
4 7
87.0
3 2
,580
.98
1,4
61.9
1 -
- 5
,544
.39
262
.95
50.
65
212
.30
- 10
0%U.
K.
6Au
robin
do P
harm
a (M
alta)
Ltd
Not A
pplic
able
EUR
80.
81
410
.10
239
.71
414
.68
0.3
6 2
35.4
9 -
19.
46
(1.1
6) -
(1.1
6) -
100%
Malt
a
7AP
L Sw
ift Se
rvice
s (M
alta)
Ltd
Not A
pplic
able
EUR
80.
81
290
.91
68.
81
3,6
55.6
8 3
,295
.96
- -
5,0
18.5
9 7
5.85
-
75.
85
- 10
0%M
alta
8Au
robin
do P
harm
a Gm
bh
Germ
any
Not A
pplic
able
EUR
80.
81
298
.26
151
.03
4,8
86.7
7 4
,437
.48
- -
1,7
04.3
5 1
32.0
0 4
0.92
9
1.08
-
100%
Germ
any
9Au
robin
do P
harm
a (R
oman
ia) s.
r.lNo
t App
licab
leRO
N 1
7.13
3
48.4
8 (2
04.8
9) 5
74.4
0 4
30.8
1 -
- 6
62.5
7 (1
6.91
) 1
.64
(18.
55)
- 10
0%Ro
man
ia
10Au
robin
do IL
AC S
anay
i ve
Ticar
et
Limite
d Si
rket
i1
Not A
pplic
able
TRY
17.
09
- -
- -
- -
- (5
9.87
) -
(59.
87)
- 10
0%Tu
rkey
11Au
robin
do P
harm
a (P
ortu
gal)
Unipe
ssoa
l Lim
itada
Not A
pplic
able
EUR
80.
81
1,0
47.5
1 (9
80.2
8) 1
92.6
6 1
25.4
3 -
- 3
15.9
6 1
2.26
1
7.08
(4
.82)
- 10
0%Po
rtuga
l
12Ph
arm
acin
B.V.
(form
erly
know
n as
Aure
x B.V.
)
Not A
pplic
able
EUR
80.
81
7.2
7 8
.74
88.
21
72.
20
- -
242
.82
3.0
9 0
.62
2.4
7 -
100%
The
Neth
erlan
ds
13Au
rovit
as P
harm
a Po
lska
Not A
pplic
able
PLN
18.
90
111
.41
1.8
6 1
37.2
6 2
3.99
-
- 7
9.60
2
.33
0.4
7 1
.86
- 10
0%Po
land
14Au
rovit
as P
harm
a Ce
ska
Repu
blica
s.r.o
2
Not A
pplic
able
CZK
3.1
5 0
.31
(0.0
3) 0
.31
0.0
3 -
- -
(0.0
3) -
(0.0
3) -
100%
Czec
h Re
publi
c
15Ge
neris
Far
mac
eutic
a S.
A.3
May
1, 2
017
EUR
80.
81
10,
504.
48
(2,8
23.0
6) 1
2,68
9.74
5
,010
.34
2.0
2 -
5,0
55.0
6 (4
24.4
7) 1
35.3
8 (5
59.8
5) -
100%
Portu
gal
16M
er M
edica
men
tos,
Lda
4M
ay 1
, 201
7EU
R 8
0.81
0
.40
1.3
9 2
.20
0.4
1 -
- -
(0.1
1) -
(0.1
1) -
100%
Portu
gal
17Ge
neris
Pha
r, Unip
esso
al Ld
a5M
ay 1
, 201
7EU
R 8
0.81
0
.40
(0.1
7) 3
.58
3.3
5 -
- -
(0.0
3) -
(0.0
3) -
100%
Portu
gal
18Fa
rma
APS
- Pr
omoc
ao d
e
Med
icam
ento
s, Un
ipess
oal L
da.,6
May
1, 2
017
EUR
80.
81
0.4
0 -
0.4
0 -
- -
- -
- -
- 10
0%Po
rtuga
l
19Ge
neris
MZ,
Lda
.,7M
ay 1
, 201
7EU
R 8
0.81
0
.04
- 0
.04
- -
- -
- -
- -
100%
Portu
gal
20Au
robin
do P
harm
a (Ita
lia) S
.r.lNo
t App
licab
leEU
R 8
0.81
2
,130
.47
(2,0
40.8
0) 2
,062
.54
1,9
72.8
7 -
- 2
,137
.36
(85.
43)
13.
35
(98.
78)
- 10
0%Ita
ly
21Au
rovit
as, U
nipes
soal
LDA
Not A
pplic
able
EUR
80.
81
0.4
0 2
41.1
9 4
86.4
2 2
44.8
3 -
- 1
,233
.69
159
.50
37.
34
122
.16
- 10
0%Po
rtuga
l
22Ar
row
gene
rique
s SAS
April
1, 2
014
EUR
80.
81
3,0
25.7
7 1
72.2
3 9
,991
.60
6,7
93.6
0 -
- 1
5,18
9.51
1
,492
.50
367
.64
1,1
24.8
6 -
100%
Fran
ce
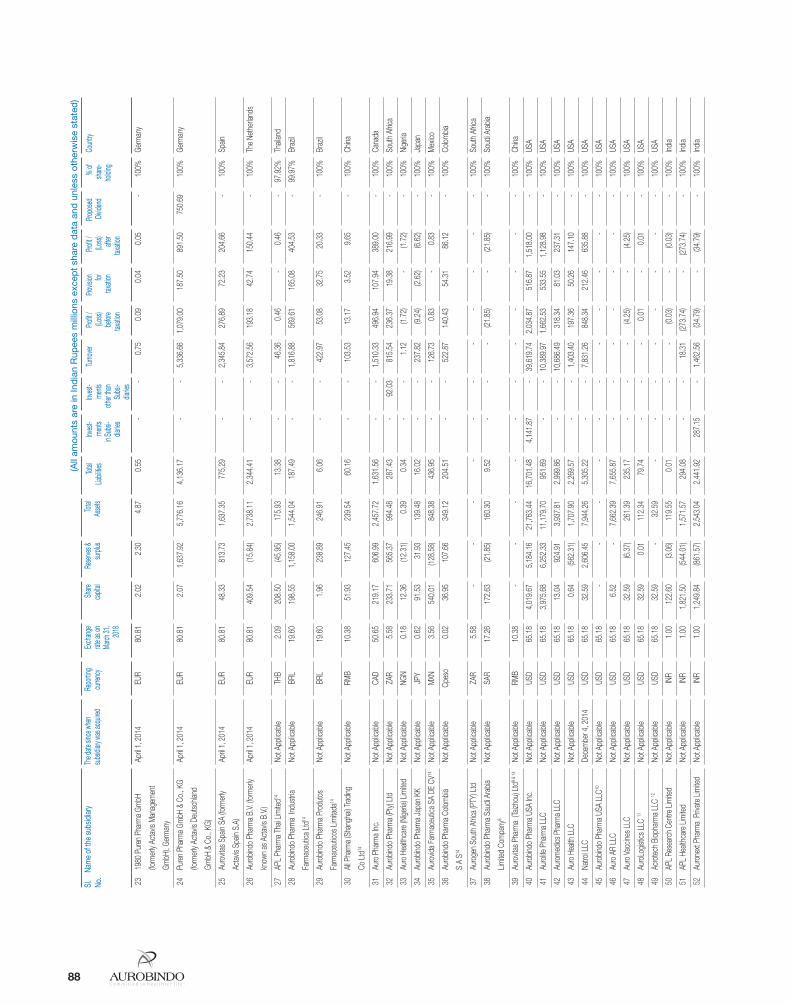
Annual Report 2017-18 8988
(All
amou
nts
are
in In
dia
n R
upee
s m
illio
ns e
xcep
t sh
are
dat
a an
d u
nles
s ot
herw
ise
stat
ed)
Sl.
No.
Nam
e of
the
subs
idiar
yTh
e date
sinc
e whe
n su
bsidi
ary w
as ac
quire
dRe
portin
g cu
rrenc
y Ex
chan
ge
rate a
s on
March
31,
2018
Share
ca
pital
Rese
rves &
su
rplus
To
tal
Asse
tsTo
tal
Liabil
ities
Inves
t-me
nts
in Su
bsi-
diarie
s
Inves
t-me
nts
other
than
Subs
i-dia
ries
Turno
ver
Profi
t / (Lo
ss)
befor
e tax
ation
Prov
ision for
tax
ation
Profi
t / (Lo
ss)
after
taxati
on
Propo
sed
Divide
nd%
of
share
-ho
lding
Coun
try
2319
80 P
uren
Pha
rma
GmbH
(form
erly
Acta
vis M
anag
emen
t
GmbH
), Ge
rman
y
April
1, 2
014
EUR
80.
81
2.0
2 2
.30
4.8
7 0
.55
- -
0.7
5 0
.09
0.0
4 0
.05
- 10
0%Ge
rman
y
24Pu
ren
Phar
ma
GmbH
& C
o., K
G
(form
erly
Acta
vis D
eutsc
hland
GmbH
& C
o., K
G)
April
1, 2
014
EUR
80.
81
2.0
7 1
,637
.92
5,7
76.1
6 4
,136
.17
- -
5,3
36.6
6 1
,079
.00
187
.50
891
.50
750
.69
100%
Germ
any
25Au
rovit
as S
pain
SA (fo
rmer
ly
Acta
vis S
pain
S.A)
April
1, 2
014
EUR
80.
81
48.
33
813
.73
1,6
37.3
5 7
75.2
9 -
- 2
,345
.84
276
.89
72.
23
204
.66
- 10
0%Sp
ain
26Au
robin
do P
harm
a B.
V. (fo
rmer
ly
know
n as
Act
avis
B.V.)
April
1, 2
014
EUR
80.
81
409
.54
(15.
84)
2,7
38.1
1 2
,344
.41
- -
3,5
72.5
6 1
93.1
8 4
2.74
1
50.4
4 -
100%
The
Neth
erlan
ds
27AP
L Ph
arm
a Th
ai Lim
ited14
Not A
pplic
able
THB
2.0
9 2
08.5
0 (4
5.95
) 1
75.9
3 1
3.38
-
- 4
6.36
0
.46
- 0
.46
- 97
.92%
Thail
and
28Au
robin
do P
harm
a In
dustr
ia
Farm
aceu
tica
Ltd14
Not A
pplic
able
BRL
19.
60
198
.55
1,1
58.0
0 1
,544
.04
187
.49
- -
1,8
16.8
8 5
69.6
1 1
65.0
8 4
04.5
3 -
99.9
7%Br
azil
29Au
robin
do P
harm
a Pr
odut
os
Farm
aceu
ticos
Lim
itada
14
Not A
pplic
able
BRL
19.
60
1.9
6 2
38.8
9 2
46.9
1 6
.06
- -
422
.97
53.
08
32.
75
20.
33
- 10
0%Br
azil
30Al
l Pha
rma
(Sha
ngha
i) Tra
ding
Co L
td14
Not A
pplic
able
RMB
10.
38
51.
93
127
.45
239
.54
60.
16
- -
103
.53
13.
17
3.5
2 9
.65
- 10
0%Ch
ina
31Au
ro P
harm
a Inc
.No
t App
licab
leCA
D 5
0.65
2
19.1
7 6
06.9
9 2
,457
.72
1,6
31.5
6 -
- 1
,510
.33
496
.94
107
.94
389
.00
- 10
0%Ca
nada
32Au
robin
do P
harm
a (P
ty) L
tdNo
t App
licab
leZA
R 5
.58
233
.71
565
.37
994
.48
287
.43
- 9
2.03
8
15.5
4 2
36.3
7 1
9.38
2
16.9
9 -
100%
Sout
h Af
rica
33Au
ro H
ealth
care
(Nige
ria) L
imite
dNo
t App
licab
leNG
N 0
.18
12.
36
(12.
31)
0.3
9 0
.34
- -
1.1
2 (1
.72)
- (1
.72)
- 10
0%Ni
geria
34Au
robin
do P
harm
a Ja
pan
KKNo
t App
licab
leJP
Y 0
.62
91.
53
31.
93
139
.48
16.
02
- -
237
.82
(9.2
4) (2
.62)
(6.6
2) -
100%
Japa
n
35Au
rovid
a Fa
rmac
eutic
a SA
DE
CV14
Not A
pplic
able
MXN
3.5
6 5
40.0
1 (1
28.5
8) 8
48.3
8 4
36.9
5 -
- 1
26.7
3 0
.83
- 0
.83
- 10
0%M
exico
36Au
robin
do P
harm
a Co
lombia
S A
S14
Not A
pplic
able
Cpes
o 0
.02
36.
95
107
.66
349
.12
204
.51
- -
522
.87
140
.43
54.
31
86.
12
- 10
0%Co
lombia
37Au
roge
n So
uth
Afric
a (P
TY) L
tdNo
t App
licab
leZA
R 5
.58
- -
- -
- -
- -
- -
- 10
0%So
uth
Afric
a
38Au
robin
do P
harm
a Sa
udi A
rabia
Limite
d Co
mpa
ny8
Not A
pplic
able
SAR
17.
26
172
.63
(21.
85)
160
.30
9.5
2 -
- -
(21.
85)
- (2
1.85
) -
100%
Soud
i Ara
bia
39Au
rovit
as P
harm
a (T
aizho
u) Lt
d9 &
14No
t App
licab
leRM
B 1
0.38
-
- -
- -
- -
- -
- -
100%
China
40Au
robin
do P
harm
a US
A Inc
.No
t App
licab
leUS
D 6
5.18
4
,019
.67
5,1
84.1
6 2
1,76
3.44
1
6,70
1.48
4
,141
.87
- 3
9,61
9.74
2
,034
.87
516
.87
1,5
18.0
0 -
100%
USA
41Au
rolife
Pha
rma
LLC
Not A
pplic
able
USD
65.
18
3,9
75.6
8 6
,252
.33
11,
179.
70
951
.69
- -
10,
389.
97
1,6
62.5
3 5
33.5
5 1
,128
.98
- 10
0%US
A
42Au
rom
edics
Pha
rma
LLC
Not A
pplic
able
USD
65.
18
13.
04
924
.91
3,9
37.8
1 2
,999
.86
- -
10,
686.
49
318
.34
81.
03
237
.31
- 10
0%US
A
43Au
ro H
ealth
LLC
Not A
pplic
able
USD
65.
18
0.6
4 (5
62.3
1) 1
,707
.90
2,2
69.5
7 -
- 1
,403
.40
197
.36
50.
26
147
.10
- 10
0%US
A
44Na
trol L
LCDe
cem
ber 4
, 201
4US
D 6
5.18
3
2.59
2
,606
.45
7,9
44.2
6 5
,305
.22
- -
7,8
31.2
6 8
48.3
4 2
12.4
6 6
35.8
8 -
100%
USA
45Au
robin
do P
harm
a US
A LL
C10No
t App
licab
leUS
D 6
5.18
-
- -
- -
- -
- -
- -
100%
USA
46Au
ro A
R LL
CNo
t App
licab
leUS
D 6
5.18
6
.52
- 7
,662
.39
7,6
55.8
7 -
- -
- -
- -
100%
USA
47Au
ro V
accin
es L
LCNo
t App
licab
leUS
D 6
5.18
3
2.59
(6
.37)
261
.39
235
.17
- -
- (4
.25)
- (4
.25)
- 10
0%US
A
48Au
roLo
gistic
s LLC
11No
t App
licab
leUS
D 6
5.18
3
2.59
0
.01
112
.34
79.
74
- -
- 0
.01
- 0
.01
- 10
0%US
A
49Ac
rote
ch B
iopha
rma
LLC
12No
t App
licab
leUS
D 6
5.18
3
2.59
-
32.
59
- -
- -
- -
- -
100%
USA
50AP
L Re
sear
ch C
entre
Lim
ited
Not A
pplic
able
INR
1.0
0 1
22.6
0 (3
.06)
119
.55
0.0
1 -
- -
(0.0
3) -
(0.0
3) -
100%
India
51AP
L He
althc
are
Limite
dNo
t App
licab
leIN
R 1
.00
1,8
21.5
0 (5
44.0
1) 1
,571
.57
294
.08
- -
18.
31
(273
.74)
- (2
73.7
4) -
100%
India
52Au
rone
xt Ph
arm
a P
rivat
e Lim
ited
Not A
pplic
able
INR
1.0
0 1
,249
.84
(861
.57)
2,5
43.0
4 2
,441
.92
287
.15
- 1
,462
.56
(34.
79)
- (3
4.79
) -
100%
India
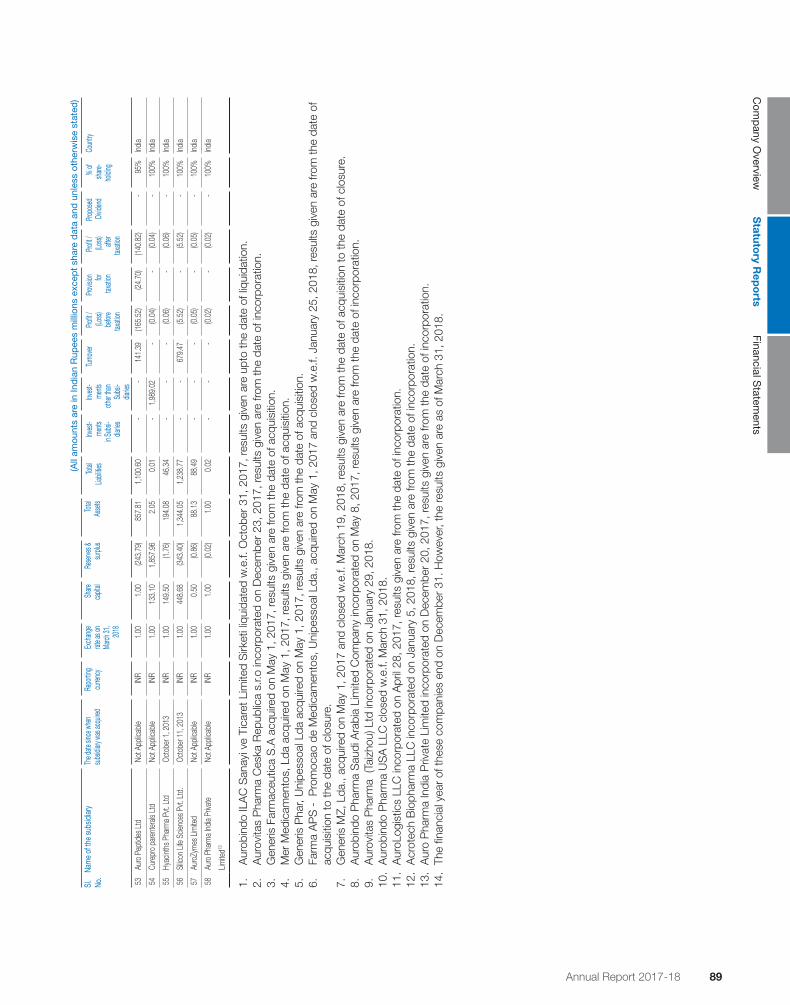
Annual Report 2017-18 8988
Com
pany O
verviewS
tatutory R
epo
rtsFinancial S
tatements
(All
amou
nts
are
in In
dia
n R
upee
s m
illio
ns e
xcep
t sh
are
dat
a an
d u
nles
s ot
herw
ise
stat
ed)
Sl.
No.
Nam
e of
the
subs
idiar
yTh
e date
sinc
e whe
n su
bsidi
ary w
as ac
quire
dRe
portin
g cu
rrenc
y Ex
chan
ge
rate a
s on
March
31,
2018
Share
ca
pital
Rese
rves &
su
rplus
To
tal
Asse
tsTo
tal
Liabil
ities
Inves
t-me
nts
in Su
bsi-
diarie
s
Inves
t-me
nts
other
than
Subs
i-dia
ries
Turno
ver
Profi
t / (Lo
ss)
befor
e tax
ation
Prov
ision for
tax
ation
Profi
t / (Lo
ss)
after
taxati
on
Propo
sed
Divide
nd%
of
share
-ho
lding
Coun
try
53Au
ro P
eptid
es L
td
Not A
pplic
able
INR
1.0
0 1
.00
(243
.79)
857
.81
1,1
00.6
0 -
- 1
41.3
9 (1
65.5
2) (2
4.70
) (1
40.8
2) -
95%
India
54Cu
repr
o pa
rent
erals
Ltd
Not A
pplic
able
INR
1.0
0 1
33.1
0 1
,857
.96
2.0
5 0
.01
- 1
,989
.02
- (0
.04)
- (0
.04)
- 10
0%Ind
ia
55Hy
acint
hs P
harm
a Pv
t. Lt
dOc
tobe
r 1, 2
013
INR
1.0
0 1
49.5
0 (1
.76)
194
.08
46.
34
- -
- (0
.06)
- (0
.06)
- 10
0%Ind
ia
56Si
licon
Life
Scie
nces
Pvt.
Ltd
.Oc
tobe
r 11,
201
3IN
R 1
.00
448
.68
(343
.40)
1,3
44.0
5 1
,238
.77
- -
679
.47
(5.5
2) -
(5.5
2) -
100%
India
57Au
roZy
mes
Lim
ited
Not A
pplic
able
INR
1.0
0 0
.50
(0.8
6) 8
8.13
8
8.49
-
- -
(0.0
5) -
(0.0
5) -
100%
India
58Au
ro P
harm
a Ind
ia Pr
ivate
Limite
d13
Not A
pplic
able
INR
1.0
0 1
.00
(0.0
2) 1
.00
0.0
2 -
- -
(0.0
2) -
(0.0
2) -
100%
India
1.
Aur
obin
do IL
AC
San
ayi v
e Ti
care
t Lim
ited
Sirk
eti l
iqui
date
d w
.e.f.
Oct
ober
31,
201
7, re
sults
giv
en a
re u
pto
the
date
of l
iqui
datio
n.2.
A
urov
itas
Pha
rma
Ces
ka R
epub
lica
s.r.o
inco
rpor
ated
on
Dec
embe
r 23
, 201
7, re
sults
giv
en a
re fr
om th
e da
te o
f inc
orpo
ratio
n.3.
G
ener
is F
arm
aceu
tica
S.A
acq
uire
d on
May
1, 2
017,
resu
lts g
iven
are
from
the
date
of a
cqui
sitio
n.4.
M
er M
edic
amen
tos,
Lda
acq
uire
d on
May
1, 2
017,
resu
lts g
iven
are
from
the
date
of a
cqui
sitio
n.5.
G
ener
is P
har,
Uni
pess
oal L
da a
cqui
red
on M
ay 1
, 201
7, re
sults
giv
en a
re fr
om th
e da
te o
f acq
uisi
tion.
6.
Farm
a A
PS
- P
rom
ocao
de
Med
icam
ento
s, U
nipe
ssoa
l Lda
., ac
quire
d on
May
1, 2
017
and
clos
ed w
.e.f.
Jan
uary
25,
201
8, re
sults
giv
en a
re fr
om th
e da
te o
f ac
quis
ition
to th
e da
te o
f clo
sure
.7.
G
ener
is M
Z, L
da.,
acqu
ired
on M
ay 1
, 201
7 an
d cl
osed
w.e
.f. M
arch
19,
201
8, re
sults
giv
en a
re fr
om th
e da
te o
f acq
uisi
tion
to th
e da
te o
f clo
sure
.8.
A
urob
indo
Pha
rma
Sau
di A
rabi
a Li
mite
d C
ompa
ny in
corp
orat
ed o
n M
ay 8
, 201
7, re
sults
giv
en a
re fr
om th
e da
te o
f inc
orpo
ratio
n.9.
A
urov
itas
Pha
rma
(Tai
zhou
) Ltd
inco
rpor
ated
on
Janu
ary
29, 2
018.
10.
Aur
obin
do P
harm
a U
SA
LLC
clo
sed
w.e
.f. M
arch
31,
201
8.11
. A
uroL
ogis
tics
LLC
inco
rpor
ated
on
Apr
il 28
, 201
7, re
sults
giv
en a
re fr
om th
e da
te o
f inc
orpo
ratio
n.12
. A
crot
ech
Bio
phar
ma
LLC
inco
rpor
ated
on
Janu
ary
5, 2
018,
resu
lts g
iven
are
from
the
date
of i
ncor
pora
tion.
13.
Aur
o P
harm
a In
dia
Priv
ate
Lim
ited
inco
rpor
ated
on
Dec
embe
r 20
, 201
7, re
sults
giv
en a
re fr
om th
e da
te o
f inc
orpo
ratio
n.14
. Th
e fin
anci
al y
ear
of th
ese
com
pani
es e
nd o
n D
ecem
ber
31. H
owev
er, t
he re
sults
giv
en a
re a
s of
Mar
ch 3
1, 2
018.

Annual Report 2017-18 9190
Part “B”: Associates and Joint VenturesStatement pursuant to Section 129 (3) of the Companies Act, 2013 related to Associate Companies and Joint Ventures
(All amounts are in Indian Rupees million except share data and otherwise stated.
Name of Joint Venture Novagen Pharma (Pty) Ltd
Eugia Pharma Specialities Ltd
Tergene Biotech Pvt.Ltd
Raidurgam Developers
Limited (Formerly
Aurobindo Antibiotics
Limited)*
1. Latest audited Balance Sheet Date March 31, 2018 March 31, 2018 March 31, 2018 March 31, 20182. Shares of Joint Venture held by the company on the year
end No. 927,237 198,901,611 7,500,000 4,000,000 Amount of Investment in Joint Venture 92.03 1,989.02 75.00 40.00 Extent of Holding % 50.00% 67.82% 76.84% 40.00%3. Description of how there is significant influence Joint Venture Joint Venture Joint Venture Joint Venture4. Reason why the associate/joint venture is not consolidated Not applicable Not applicable Not applicable Not applicable5. Networth attributable to Shareholding as per latest audited
Balance Sheet 281.71 1,966.16 (51.62) 35.38
6. Profit for the year 169.18 (9.17) (56.06) (3.28) i. Considered in Consolidation 84.59 (6.22) (43.08) (1.31)
ii. Not Considered in Consolidation 84.59 (2.95) (12.98) (1.97)
* Raidurgam Developers Limited (formerly Aurobindo Antibiotics Limited) ceased to be a subsidiary of the Company with effect from November 30, 2017, resulting in shareholding of 40% w.e.f November 30, 2017.
For and on behalf of the Board of Directors of Aurobindo Pharma Limited
N. Govindarajan Dr. M. SivakumaranManaging Director Director
DIN-00050482 DIN-01284320
Santhanam Subramanian B. Adi ReddyPlace: Hyderabad Chief Financial Officer Company SecretaryDate: 28 May 2018 Membership No. 13709

Annual Report 2017-18 9190
Com
pany O
verviewS
tatutory R
epo
rtsFinancial S
tatements
ANNEXURE-2
Form No. AOC-2Particulars of Contracts/Arrangements entered into by the Company with the related parties
(Pursuant to clause (h) of sub-section (3) of section 134 of the Act and Rule 8(2) of the Companies (Accounts) Rules, 2014) (Referred to in sub-section(1) of Section 188 of the Companies Act, 2013 including certain arms length
transactions under third proviso thereto)
1. Details of contracts or arrangements or transactions not at arm’s length basis All contracts / arrangements entered into by the Company with related parties referred to in sub-section (1) of Section 188 of the
Companies Act, 2013 are at arm's length basis
2. Details of material contracts or arrangement or transactions at arm’s length basis
(` In Millions)
Sl. No.
Name of the related party Nature of relationship
Nature of contracts / arrangements / transactions
Duration of the Contracts / arrangements / transactions
Salient terms of the contracts or arrangemetns or transactions including the value, if any
Amount
1 Aurobindo Pharma USA Inc., USA
Wholly owned subsidiary
Sale of Goods & Services
on going Based on transfer pricing guidelines
27,182.9
Purchase of Goods
on going Based on transfer pricing guidelines
0.1
Appropriate approvals have been taken for related party transactions. No amount was paid as advance.
Place: Hyderabad K. RagunathanDate: 28 May 2018 Chairman
DIN: 00523576

Annual Report 2017-18 9392
ANNEXURE-3
Form No. MGT-9EXTRACT OF ANNUAL RETURN
For the financial year ended on March 31, 2018
[Pursuant to section 92(3) of the Companies Act, 2013 and rule 12(1) of the Companies (Management and Administration) Rules, 2014]
I. REGISTRATION AND OTHER DETAILS:
i CIN L24239TG1986PLC015190ii Registration Date 26th December, 1986iii Name of the Company AUROBINDO PHARMA LIMITEDiv Category / Sub-Category of the Company Company having share capitalv Address of the Registered Office and
contact detailsPlot No.2, Maitrivihar, Ameerpet, Hyderabad 500 038, Telangana, India Phone:+91 40 23736370 Fax: +91 40 23743740 Email: [email protected]
vi Whether listed company Yes/No Yes. Listed on BSE Ltd and National Stock Exchange of India Ltd.vii Name, Address and Contact details of
Registrar and Transfer Agent, if anyKarvy Computershare Private LimitedUnit: Aurobindo Pharma LimitedKarvy Selenium, Tower B, Plot No.31-32, Gachihowli, Financial District, Nanakramguda, Hyderabad – 500032Tel : 040-6716 2222 Fax: 040-2300 1153E-mail: [email protected]
II. PRINCIPAL BUSINESS ACTIVITIES OF THE COMPANY All the business activities contributing 10% or more of the total turnover of the company shall be stated
Sl. No.
Name and Description of main products / services NIC Code of the product/service
% to total turnover of the company
1 Manufacturing generic pharmaceuticals and active pharmaceutical ingredients. 21001/21002 100%
III. PARTICULARS OF HOLDING, SUBSIDIARY AND ASSOCIATE COMPANIES
Sl. No.
Name & Address of the Company CIN/GIN Holding /Subsidiary /Associate
% of Shares held Applicable section
1 APL Pharma Thai Limited,438, Soi Phattanakaran, 30 Phattanakaran, Road, Khweang Suanluang, Khet Suanluang, Bangkok –10250
Foreign Company Subsidiary 97.92 2(87)
2 All Pharma (Shanghai) Trading Corp Ltd, Room 3304, No.8 Xingly Rd., Shanghai, P.R. China
Foreign Company Subsidiary 100 2(87)
3 Aurobindo Pharma Industria Farmaceutica Ltda,VP –06-E Qd. 09 Mod 12 a 15, Daia Anapolis, Goias State, Brazil
Foreign Company Subsidiary 99.97 2(87)
4 Aurobindo Pharma Produtos Farmaceuticos Ltda,2 Andar Sala 205, Centro, Anapolis, Goias State, Brazil
Foreign Company Subsidiary 100 2(87)
5 Aurobindo Pharma Japan KK, 9th Floor, Youth Building, 1-3-8 Nihonbashibakuro-cho, Cho-ku, 103-0002, Tokyo Japan
Foreign Company Subsidiary 100 2(87)
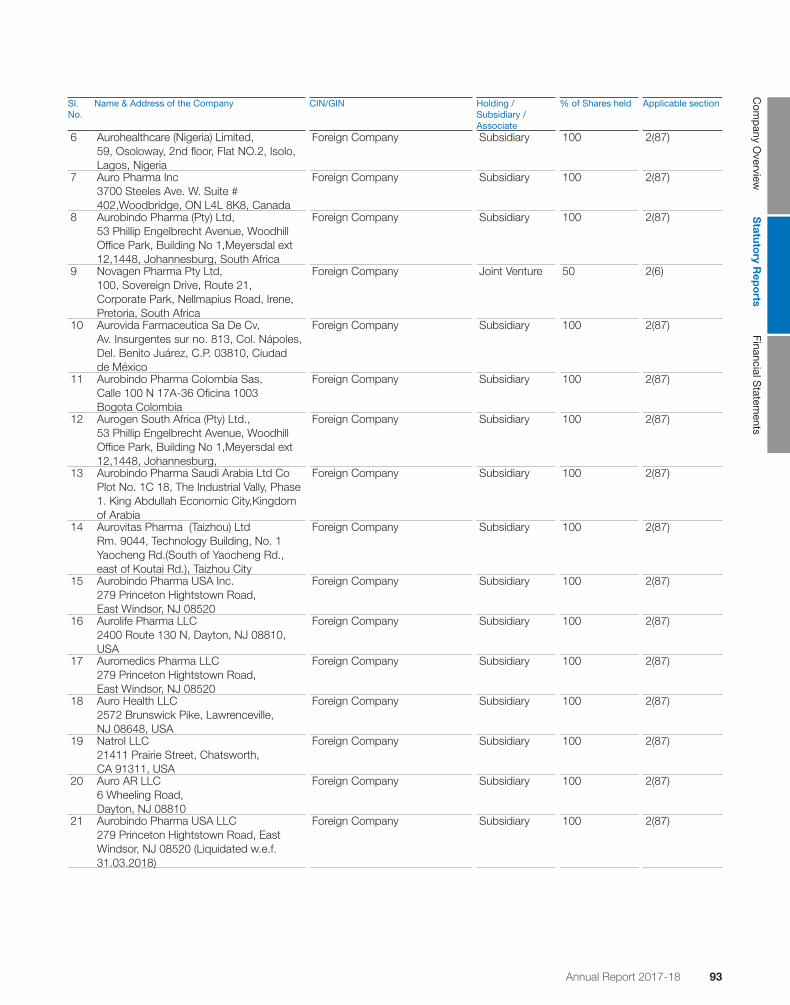
Annual Report 2017-18 9392
Com
pany O
verviewS
tatutory R
epo
rtsFinancial S
tatements
Sl. No.
Name & Address of the Company CIN/GIN Holding /Subsidiary /Associate
% of Shares held Applicable section
6 Aurohealthcare (Nigeria) Limited,59, Osoloway, 2nd floor, Flat NO.2, Isolo, Lagos, Nigeria
Foreign Company Subsidiary 100 2(87)
7 Auro Pharma Inc3700 Steeles Ave. W. Suite # 402,Woodbridge, ON L4L 8K8, Canada
Foreign Company Subsidiary 100 2(87)
8 Aurobindo Pharma (Pty) Ltd,53 Phillip Engelbrecht Avenue, Woodhill Office Park, Building No 1,Meyersdal ext 12,1448, Johannesburg, South Africa
Foreign Company Subsidiary 100 2(87)
9 Novagen Pharma Pty Ltd,100, Sovereign Drive, Route 21, Corporate Park, Nellmapius Road, Irene, Pretoria, South Africa
Foreign Company Joint Venture 50 2(6)
10 Aurovida Farmaceutica Sa De Cv, Av. Insurgentes sur no. 813, Col. Nápoles, Del. Benito Juárez, C.P. 03810, Ciudad de México
Foreign Company Subsidiary 100 2(87)
11 Aurobindo Pharma Colombia Sas,Calle 100 N 17A-36 Oficina 1003Bogota Colombia
Foreign Company Subsidiary 100 2(87)
12 Aurogen South Africa (Pty) Ltd.,53 Phillip Engelbrecht Avenue, Woodhill Office Park, Building No 1,Meyersdal ext 12,1448, Johannesburg,
Foreign Company Subsidiary 100 2(87)
13 Aurobindo Pharma Saudi Arabia Ltd CoPlot No. 1C 18, The Industrial Vally, Phase 1. King Abdullah Economic City,Kingdom of Arabia
Foreign Company Subsidiary 100 2(87)
14 Aurovitas Pharma (Taizhou) LtdRm. 9044, Technology Building, No. 1 Yaocheng Rd.(South of Yaocheng Rd., east of Koutai Rd.), Taizhou City
Foreign Company Subsidiary 100 2(87)
15 Aurobindo Pharma USA Inc.279 Princeton Hightstown Road, East Windsor, NJ 08520
Foreign Company Subsidiary 100 2(87)
16 Aurolife Pharma LLC2400 Route 130 N, Dayton, NJ 08810, USA
Foreign Company Subsidiary 100 2(87)
17 Auromedics Pharma LLC279 Princeton Hightstown Road, East Windsor, NJ 08520
Foreign Company Subsidiary 100 2(87)
18 Auro Health LLC2572 Brunswick Pike, Lawrenceville, NJ 08648, USA
Foreign Company Subsidiary 100 2(87)
19 Natrol LLC21411 Prairie Street, Chatsworth, CA 91311, USA
Foreign Company Subsidiary 100 2(87)
20 Auro AR LLC6 Wheeling Road,Dayton, NJ 08810
Foreign Company Subsidiary 100 2(87)
21 Aurobindo Pharma USA LLC279 Princeton Hightstown Road, East Windsor, NJ 08520 (Liquidated w.e.f. 31.03.2018)
Foreign Company Subsidiary 100 2(87)
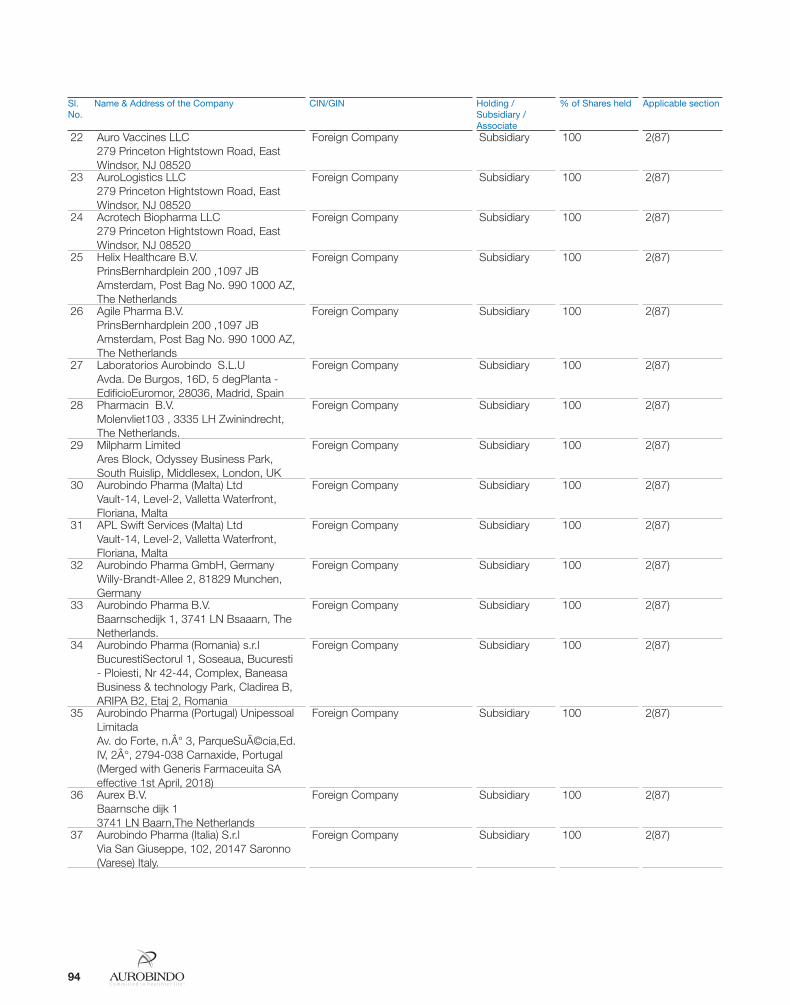
Annual Report 2017-18 9594
Sl. No.
Name & Address of the Company CIN/GIN Holding /Subsidiary /Associate
% of Shares held Applicable section
22 Auro Vaccines LLC279 Princeton Hightstown Road, East Windsor, NJ 08520
Foreign Company Subsidiary 100 2(87)
23 AuroLogistics LLC279 Princeton Hightstown Road, East Windsor, NJ 08520
Foreign Company Subsidiary 100 2(87)
24 Acrotech Biopharma LLC279 Princeton Hightstown Road, East Windsor, NJ 08520
Foreign Company Subsidiary 100 2(87)
25 Helix Healthcare B.V.PrinsBernhardplein 200 ,1097 JB Amsterdam, Post Bag No. 990 1000 AZ, The Netherlands
Foreign Company Subsidiary 100 2(87)
26 Agile Pharma B.V.PrinsBernhardplein 200 ,1097 JB Amsterdam, Post Bag No. 990 1000 AZ, The Netherlands
Foreign Company Subsidiary 100 2(87)
27 Laboratorios Aurobindo S.L.UAvda. De Burgos, 16D, 5 degPlanta - EdificioEuromor, 28036, Madrid, Spain
Foreign Company Subsidiary 100 2(87)
28 Pharmacin B.V.Molenvliet103 , 3335 LH Zwinindrecht, The Netherlands.
Foreign Company Subsidiary 100 2(87)
29 Milpharm LimitedAres Block, Odyssey Business Park, South Ruislip, Middlesex, London, UK
Foreign Company Subsidiary 100 2(87)
30 Aurobindo Pharma (Malta) LtdVault-14, Level-2, Valletta Waterfront, Floriana, Malta
Foreign Company Subsidiary 100 2(87)
31 APL Swift Services (Malta) LtdVault-14, Level-2, Valletta Waterfront, Floriana, Malta
Foreign Company Subsidiary 100 2(87)
32 Aurobindo Pharma GmbH, Germany Willy-Brandt-Allee 2, 81829 Munchen, Germany
Foreign Company Subsidiary 100 2(87)
33 Aurobindo Pharma B.V.Baarnschedijk 1, 3741 LN Bsaaarn, The Netherlands.
Foreign Company Subsidiary 100 2(87)
34 Aurobindo Pharma (Romania) s.r.lBucurestiSectorul 1, Soseaua, Bucuresti - Ploiesti, Nr 42-44, Complex, Baneasa Business & technology Park, Cladirea B, ARIPA B2, Etaj 2, Romania
Foreign Company Subsidiary 100 2(87)
35 Aurobindo Pharma (Portugal) Unipessoal Limitada Av. do Forte, n.° 3, ParqueSuécia,Ed. IV, 2°, 2794-038 Carnaxide, Portugal(Merged with Generis Farmaceuita SA effective 1st April, 2018)
Foreign Company Subsidiary 100 2(87)
36 Aurex B.V.Baarnsche dijk 13741 LN Baarn,The Netherlands
Foreign Company Subsidiary 100 2(87)
37 Aurobindo Pharma (Italia) S.r.lVia San Giuseppe, 102, 20147 Saronno (Varese) Italy.
Foreign Company Subsidiary 100 2(87)
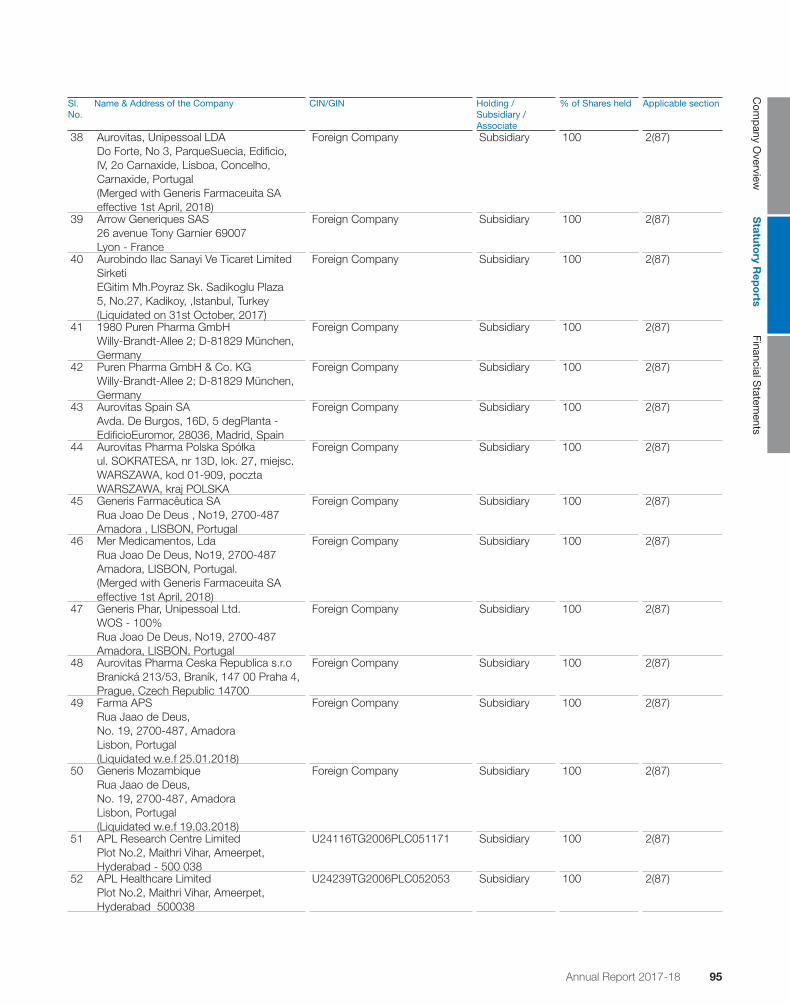
Annual Report 2017-18 9594
Com
pany O
verviewS
tatutory R
epo
rtsFinancial S
tatements
Sl. No.
Name & Address of the Company CIN/GIN Holding /Subsidiary /Associate
% of Shares held Applicable section
38 Aurovitas, Unipessoal LDA Do Forte, No 3, ParqueSuecia, Edificio, IV, 2o Carnaxide, Lisboa, Concelho, Carnaxide, Portugal(Merged with Generis Farmaceuita SA effective 1st April, 2018)
Foreign Company Subsidiary 100 2(87)
39 Arrow Generiques SAS26 avenue Tony Garnier 69007 Lyon - France
Foreign Company Subsidiary 100 2(87)
40 Aurobindo Ilac Sanayi Ve Ticaret Limited SirketiEGitim Mh.Poyraz Sk. Sadikoglu Plaza 5, No.27, Kadikoy, ,Istanbul, Turkey (Liquidated on 31st October, 2017)
Foreign Company Subsidiary 100 2(87)
41 1980 Puren Pharma GmbH Willy-Brandt-Allee 2; D-81829 München, Germany
Foreign Company Subsidiary 100 2(87)
42 Puren Pharma GmbH & Co. KGWilly-Brandt-Allee 2; D-81829 München, Germany
Foreign Company Subsidiary 100 2(87)
43 Aurovitas Spain SA Avda. De Burgos, 16D, 5 degPlanta - EdificioEuromor, 28036, Madrid, Spain
Foreign Company Subsidiary 100 2(87)
44 Aurovitas Pharma Polska Spółka ul. SOKRATESA, nr 13D, lok. 27, miejsc. WARSZAWA, kod 01-909, poczta WARSZAWA, kraj POLSKA
Foreign Company Subsidiary 100 2(87)
45 Generis Farmacêutica SARua Joao De Deus , No19, 2700-487 Amadora , LISBON, Portugal
Foreign Company Subsidiary 100 2(87)
46 Mer Medicamentos, Lda Rua Joao De Deus, No19, 2700-487 Amadora, LISBON, Portugal.(Merged with Generis Farmaceuita SA effective 1st April, 2018)
Foreign Company Subsidiary 100 2(87)
47 Generis Phar, Unipessoal Ltd.WOS - 100%Rua Joao De Deus, No19, 2700-487 Amadora, LISBON, Portugal
Foreign Company Subsidiary 100 2(87)
48 Aurovitas Pharma Ceska Republica s.r.oBranická 213/53, Braník, 147 00 Praha 4, Prague, Czech Republic 14700
Foreign Company Subsidiary 100 2(87)
49 Farma APSRua Jaao de Deus,No. 19, 2700-487, AmadoraLisbon, Portugal(Liquidated w.e.f 25.01.2018)
Foreign Company Subsidiary 100 2(87)
50 Generis MozambiqueRua Jaao de Deus,No. 19, 2700-487, AmadoraLisbon, Portugal(Liquidated w.e.f 19.03.2018)
Foreign Company Subsidiary 100 2(87)
51 APL Research Centre LimitedPlot No.2, Maithri Vihar, Ameerpet, Hyderabad - 500 038
U24116TG2006PLC051171 Subsidiary 100 2(87)
52 APL Healthcare LimitedPlot No.2, Maithri Vihar, Ameerpet, Hyderabad 500038
U24239TG2006PLC052053 Subsidiary 100 2(87)
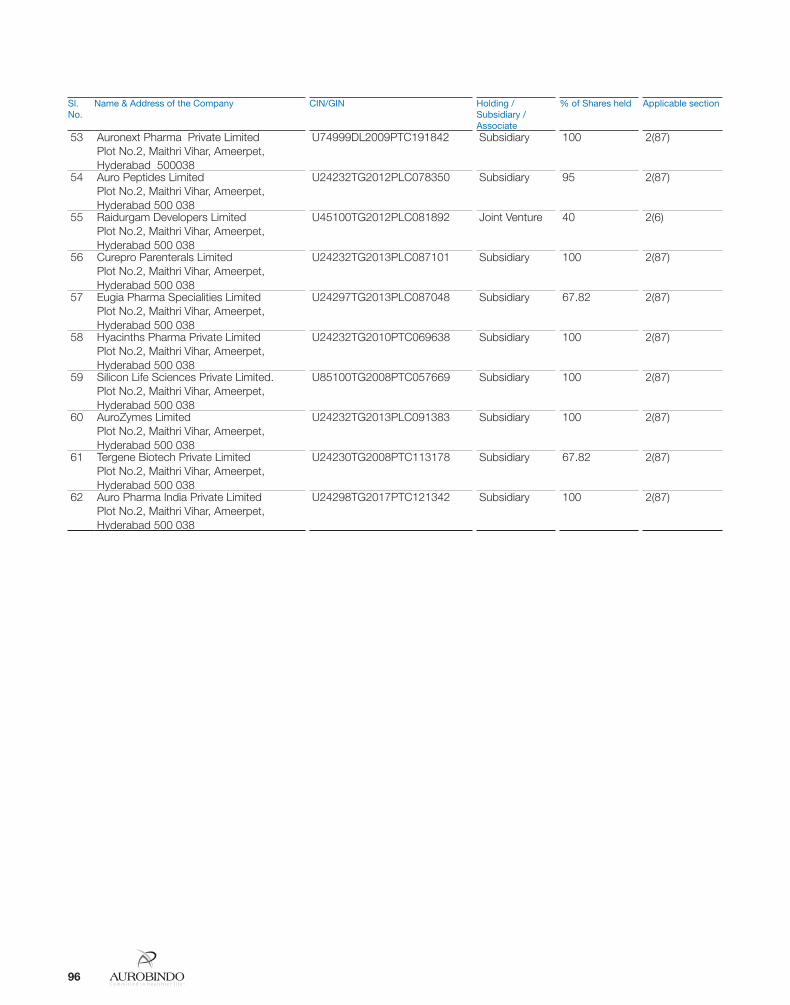
Annual Report 2017-18 9796
Sl. No.
Name & Address of the Company CIN/GIN Holding /Subsidiary /Associate
% of Shares held Applicable section
53 Auronext Pharma Private LimitedPlot No.2, Maithri Vihar, Ameerpet, Hyderabad 500038
U74999DL2009PTC191842 Subsidiary 100 2(87)
54 Auro Peptides LimitedPlot No.2, Maithri Vihar, Ameerpet, Hyderabad 500 038
U24232TG2012PLC078350 Subsidiary 95 2(87)
55 Raidurgam Developers LimitedPlot No.2, Maithri Vihar, Ameerpet, Hyderabad 500 038
U45100TG2012PLC081892 Joint Venture 40 2(6)
56 Curepro Parenterals LimitedPlot No.2, Maithri Vihar, Ameerpet, Hyderabad 500 038
U24232TG2013PLC087101 Subsidiary 100 2(87)
57 Eugia Pharma Specialities LimitedPlot No.2, Maithri Vihar, Ameerpet, Hyderabad 500 038
U24297TG2013PLC087048 Subsidiary 67.82 2(87)
58 Hyacinths Pharma Private LimitedPlot No.2, Maithri Vihar, Ameerpet, Hyderabad 500 038
U24232TG2010PTC069638 Subsidiary 100 2(87)
59 Silicon Life Sciences Private Limited.Plot No.2, Maithri Vihar, Ameerpet, Hyderabad 500 038
U85100TG2008PTC057669 Subsidiary 100 2(87)
60 AuroZymes LimitedPlot No.2, Maithri Vihar, Ameerpet, Hyderabad 500 038
U24232TG2013PLC091383 Subsidiary 100 2(87)
61 Tergene Biotech Private LimitedPlot No.2, Maithri Vihar, Ameerpet, Hyderabad 500 038
U24230TG2008PTC113178 Subsidiary 67.82 2(87)
62 Auro Pharma India Private LimitedPlot No.2, Maithri Vihar, Ameerpet, Hyderabad 500 038
U24298TG2017PTC121342 Subsidiary 100 2(87)

Annual Report 2017-18 9796
Com
pany O
verviewS
tatutory R
epo
rtsFinancial S
tatements
IV. SHAREHOLDING PATTERN (EQUITY SHARE CAPITAL BREAKUP AS PERCENTAGE OF TOTAL EQUITY) i) Category-wise Shareholding
Cate-gory Code
Category of Shareholder No. of Shares held at the beginning of the year 31/03/2017
No. of shares held at the end of the year 31/03/2018
% Change
during the year
Demat Physical Total % of Total Shares
Demat Physical Total % of Total Shares
(I) (II) (III) (IV) (V) (VI) (VII) (VIII) (IX) (X) (XI)(A) PROMOTER AND
PROMOTER GROUP
(1) Indian (a) Individual /HUF 72,164,968 0 72,164,968 12.32 72,164,968 0 72,164,968 12.32 0.00(b) Central Government/State
Government(s)0 0 0 0.00 0 0 0 0.00 0.00
(c) Bodies Corporate 213,760,966 0 213,760,966 36.49 213,760,966 0 213,760,966 36.48 0.00(d) Financial Institutions / Banks 0 0 0 0.00 0 0 0 0.00 0.00(e) Others 0 0 0 0.00 0 0 0 0.00 0.00 Sub-Total A(1) : 285,925,934 0 285,925,934 48.80 285,925,934 0 285,925,934 48.80 0.00(2) Foreign (a) Individuals (NRIs/Foreign
Individuals)18,000,000 0 18,000,000 3.07 18,000,000 0 18,000,000 3.07 0.00
(b) Bodies Corporate 0 0 0 0.00 0 0 0 0.00 0.00(c) Institutions 0 0 0 0.00 0 0 0 0.00 0.00(d) Qualified Foreign Investor 0 0 0 0.00 0 0 0 0.00 0.00(e) Others 0 0 0 0.00 0 0 0 0.00 0.00 Sub-Total A(2) : 18,000,000 0 18,000,000 3.07 18,000,000 0 18,000,000 3.07 0.00 Total A=A(1)+A(2) 303,925,934 0 303,925,934 51.87 303,925,934 0 303,925,934 51.87 0.00(B) PUBLIC SHAREHOLDING (1) Institutions (a) Mutual Funds /UTI 70,950,268 0 70,950,268 12.11 88,223,316 0 88,223,316 15.06 2.95(b) Financial Institutions /Banks 2,326,571 0 2,326,571 0.40 1,542,088 0 1,542,088 0.26 -0.13(c) Central Government / State
Government(s)0 0 0 0.00 0 0 0 0.00 0.00
(d) Venture Capital Funds 0 0 0 0.00 0 0 0 0.00 0.00(e) Insurance Companies 1,456,754 0 1,456,754 0.25 1,819,681 0 1,819,681 0.31 0.06(f) Foreign Institutional Investors 122,986,244 0 122,986,244 20.99 105,430,838 0 105,430,838 17.99 -3.00(g) Foreign Venture Capital
Investors 0 0 0 0.00 0 0 0 0.00 0.00
(h) Qualified Foreign Investor 0 0 0 0.00 0 0 0 0.00 0.00(i) Others 0 0 0 0.00 0 0 0 0.00 0.00 Sub-Total B(1) : 197,719,837 0 197,719,837 33.75 197,015,923 0 197,015,923 33.63 -0.12(2) Non-Institutions (a) Bodies Corporate 18,959,315 98,910 19,058,225 3.25 16,663,996 55,530 16,719,526 2.85 -0.40(b) Individuals (i) Individuals holding nominal
share capital upto `1 lakh39,324,003 2,468,067 41,792,070 7.13 42,959,387 1,817,997 44,777,384 7.64 0.51
(ii) Individuals holding nominal share capital in excess of `1 lakh
15,298,636 0 15,298,636 2.61 15,886,710 0 15,886,710 2.71 0.10
(c) Others Clearing Members 2,927,903 0 2,927,903 0.50 1,128,877 0 1,128,877 0.19 -0.31 I E P F 0 0 0 0.00 564,473 0 564,473 0.10 0.10 Non Resident Indians 1,958,718 15,000 1,973,718 0.34 2,446,676 8,000 2,454,676 0.42 0.08 NRI Non-Repatriation 483,964 0 483,964 0.08 1,015,358 0 1,015,358 0.17 0.09 Trusts 2,702,122 0 2,702,122 0.46 2,418,748 0 2,418,748 0.41 -0.05(d) Qualified Foreign Investor 0 0 0 0.00 0 0 0 0.00 0.00 Sub-Total B(2) : 81,654,661 2,581,977 84,236,638 14.38 83,084,225 1,881,527 84,965,752 14.50 0.12 Total B=B(1)+B(2) : 279,374,498 2,581,977 281,956,475 48.13 280,100,148 1,881,527 281,981,675 48.13 0.00 Total (A+B) : 583,300,432 2,581,977 585,882,409 100.00 584,026,082 1,881,527 585,907,609 100.00 0.00(C) Shares held by custodians,
against which
Depository Receipts have been issued
(1) Promoter and Promoter Group 0 0 0 0.00 0 0 0 0.00 0.00(2) Public 0 0 0 0.00 0 0 0 0.00 0.00
GRAND TOTAL (A+B+C) : 583,300,432 2,581,977 585,882,409 100.00 584,026,082 1,881,527 585,907,609 100.00

Annual Report 2017-18 9998
(ii) Shareholding of Promoters
Sl No Shareholder’s Name Shareholding at the beginning of the year Shareholding at the end of the year % change in share holding
during the year
No. of Shares % of total Shares of the
company
%of Shares Pledged /
encumbered to total shares
No. of Shares % of total Shares of the
company
%of Shares Pledged /
encumbered to total shares
1 Mr. P.V. Ramprasad Reddy 18,000,000 3.07 0.00 18,000,000 3.07 0.00 0.002 Mrs. K. Kirthi Reddy 20,700,000 3.53 0.00 20,700,000 3.53 0.00 0.003 Mr. K. Nithyananda Reddy 25,359,572 4.33 0.00 25,359,572 4.33 0.41 0.004 Mrs. K. Rajeswari 1,975,500 0.34 0.03 1,975,500 0.34 0.03 0.005 Trident Chemphar Limited* 867,226 0.15 0.00 300,000 0.05 0.00 -0.106 Mrs. Kambam Spoorthi 7,600,000 1.30 0.26 7,600,000 1.30 0.26 0.007 Dr. M. Sivakumaran 14,491,360 2.47 0.00 14,491,360 2.47 0.00 0.008 Mrs.P.Neha Reddy 1,30,000 0.02 0.00 1,30,000 0.02 0.00 0.009 Axis Clinicals Ltd. 658,000 0.11 0.11 658,000 0.11 0.11 0.0010 Mr. K. Prasad Reddy 3,01,156 0.05 0.05 3,01,156 0.05 0.03 0.0011 Mr. M Sumanth Kumar Reddy 1,600,000 0.27 0.20 1,600,000 0.27 0.20 0.0012 Mr.K.Suryaprakash Reddy 7,380 0.00 0.00 7,380 0.00 0.00 0.0013 RPR Advisors Private Limited,
Mrs.P.Suneela Rani (Jointly holding)
196,376,250 33.52 0.00 196,376,250 33.52 0.00 0.00
14 Axis Clinicals Limited, Trident Chemphar Limited, RPR Sons Advisors Private Limited (Jointly holding)*
15,859,490 2.71 0.00 16,426,716 2.81 0.00 0.10
Total 303,925,934 51.87 0.65 303,925,934 51.87 1.04 0.00
* On 31.03.2017 entire shareholding of Trident Chemphar Limited in the Company was transferred as capital contribution to Auryn Labs, a Partnership firm and holding shares jointly in the name of its partners viz., Axis Clinicals Limited, Trident Chemphar Limited and RPR Sons Advisors Private Limited. However, the transfer of 867,226 shares was not effected in the system of depository as on 31.03.2017. Transfer of 567,226 shares was effected in the system of depository during the FY2017-18 and 300,000 shares on April 6, 2018.
(iii) Change in Promoters’ Shareholding (please specify, if there is no change)
Sl No Shareholder’s Name Shareholding at the beginning of the Year
Cumulative Holding during the year
No of Shares % of total shares of the
company
No of Shares % of total shares of the
companyAt the beginning of the year 303,925,934 51.87 303,925,934 51.87Date wise Increase / Decrease in Promoters Shareholding during the year
specifying the reasons for increase / decrease (e.g. allotment / transfer /
bonus/ sweat equity etc):
Nil Nil
At the end of the year 303,925,934 51.87
Notes: There is no change in shareholding of promoters during the financial year 2017-18.

Annual Report 2017-18 9998
Com
pany O
verviewS
tatutory R
epo
rtsFinancial S
tatements
(iv) Shareholding Pattern of top ten Shareholders (other than Directors, Promoters and Holders of GDRs and ADRs):
Sl No Name of the Shareholder Shareholding at the beginning of the Year
Cumulative Shareholding during the Year
No of Shares % of total shares of the
company
No of Shares % of total shares of the
company1 HDFC TRUSTEE COMPANY LIMITED A/C HDFC GROWTH
FUND 24943173 4.26 24943173 4.26
07/04/2017 2188 0.00 24945361 4.26 07/04/2017 -254 0.00 24945107 4.26 14/04/2017 -58 0.00 24945049 4.26 21/04/2017 104900 0.02 25049949 4.28 21/04/2017 -231830 -0.04 24818119 4.24 28/04/2017 167300 0.03 24985419 4.26 28/04/2017 -684104 -0.12 24301315 4.15 05/05/2017 24864 0.00 24326179 4.15 12/05/2017 537200 0.09 24863379 4.24 12/05/2017 -185264 -0.03 24678115 4.21 19/05/2017 25969 0.00 24704084 4.22 26/05/2017 500000 0.09 25204084 4.30 26/05/2017 -37 0.00 25204047 4.30 02/06/2017 904731 0.15 26108778 4.46 09/06/2017 382000 0.07 26490778 4.52 09/06/2017 -16406 0.00 26474372 4.52 16/06/2017 1157275 0.20 27631647 4.72 23/06/2017 3137000 0.54 30768647 5.25 23/06/2017 -92671 -0.02 30675976 5.24 30/06/2017 1212108 0.21 31888084 5.44 30/06/2017 -104300 -0.02 31783784 5.42 07/07/2017 724718 0.12 32508502 5.55 14/07/2017 13630 0.00 32522132 5.55 21/07/2017 434400 0.07 32956532 5.63 21/07/2017 -64 0.00 32956468 5.63 28/07/2017 300800 0.05 33257268 5.68 28/07/2017 -93 0.00 33257175 5.68 04/08/2017 254 0.00 33257429 5.68 04/08/2017 -63200 -0.01 33194229 5.67 11/08/2017 436030 0.07 33630259 5.74 11/08/2017 -538 0.00 33629721 5.74 18/08/2017 499200 0.09 34128921 5.83 18/08/2017 -17 0.00 34128904 5.83 25/08/2017 516936 0.09 34645840 5.91 01/09/2017 310200 0.05 34956040 5.97 08/09/2017 71350 0.01 35027390 5.98 15/09/2017 404000 0.07 35431390 6.05
15/09/2017 -4 0.00 35431386 6.0522/09/2017 200000 0.03 35631386 6.0822/09/2017 -3200 0.00 35628186 6.0829/09/2017 402400 0.07 36030586 6.1529/09/2017 -443 0.00 36030143 6.1506/10/2017 499365 0.09 36529508 6.2313/10/2017 40 0.00 36529548 6.2327/10/2017 50 0.00 36529598 6.2327/10/2017 -200000 -0.03 36329598 6.2031/10/2017 127306 0.02 36456904 6.2203/11/2017 309 0.00 36457213 6.22

Annual Report 2017-18 101100
Sl No Name of the Shareholder Shareholding at the beginning of the Year
Cumulative Shareholding during the Year
No of Shares % of total shares of the
company
No of Shares % of total shares of the
company03/11/2017 -620000 -0.11 35837213 6.1210/11/2017 1581 0.00 35838794 6.1210/11/2017 -630000 -0.11 35208794 6.0117/11/2017 2858 0.00 35211652 6.0124/11/2017 87285 0.01 35298937 6.0201/12/2017 20835 0.00 35319772 6.0308/12/2017 46474 0.01 35366246 6.0415/12/2017 30 0.00 35366276 6.0415/12/2017 -1600 0.00 35364676 6.0422/12/2017 400000 0.07 35764676 6.1029/12/2017 192000 0.03 35956676 6.1429/12/2017 -110 0.00 35956566 6.1405/01/2018 612834 0.10 36569400 6.2405/01/2018 -936444 -0.16 35632956 6.0812/01/2018 157117 0.03 35790073 6.1119/01/2018 165 0.00 35790238 6.1126/01/2018 118400 0.02 35908638 6.1326/01/2018 -7 0.00 35908631 6.1302/02/2018 5441 0.00 35914072 6.1309/02/2018 22 0.00 35914094 6.1316/02/2018 399200 0.07 36313294 6.2016/02/2018 -25414 0.00 36287880 6.1923/02/2018 25235 0.00 36313115 6.2023/02/2018 -25000 0.00 36288115 6.1902/03/2018 354813 0.06 36642928 6.2509/03/2018 361912 0.06 37004840 6.3209/03/2018 -340000 -0.06 36664840 6.2616/03/2018 640681 0.11 37305521 6.3716/03/2018 -1738561 -0.30 35566960 6.0723/03/2018 2009894 0.34 37576854 6.4123/03/2018 -2836000 -0.48 34740854 5.9330/03/2018 341000 0.06 35081854 5.9930/03/2018 -1273182 -0.22 33808672 5.77
2 SBI MAGNUM EQUITY FUND 14343488 2.45 14343488 2.45 07/04/2017 92338 0.02 14435826 2.46 07/04/2017 -1416 0.00 14434410 2.46 14/04/2017 43420 0.01 14477830 2.47 14/04/2017 -440000 -0.08 14037830 2.40 21/04/2017 21108 0.00 14058938 2.40 28/04/2017 9326 0.00 14068264 2.40 28/04/2017 -99 0.00 14068165 2.40 05/05/2017 11862 0.00 14080027 2.40 05/05/2017 -21000 0.00 14059027 2.40 12/05/2017 11254 0.00 14070281 2.40 12/05/2017 -459 0.00 14069822 2.40 19/05/2017 12660 0.00 14082482 2.40 19/05/2017 -864 0.00 14081618 2.40 26/05/2017 4743 0.00 14086361 2.40 26/05/2017 -703 0.00 14085658 2.40 02/06/2017 4577 0.00 14090235 2.40 02/06/2017 -778348 -0.13 13311887 2.27 09/06/2017 112517 0.02 13424404 2.29

Annual Report 2017-18 101100
Com
pany O
verviewS
tatutory R
epo
rtsFinancial S
tatements
Sl No Name of the Shareholder Shareholding at the beginning of the Year
Cumulative Shareholding during the Year
No of Shares % of total shares of the
company
No of Shares % of total shares of the
company 09/06/2017 -23766 0.00 13400638 2.29 16/06/2017 15957 0.00 13416595 2.29 23/06/2017 9067 0.00 13425662 2.29 23/06/2017 -68603 -0.01 13357059 2.28 30/06/2017 35022 0.01 13392081 2.29 30/06/2017 -25000 0.00 13367081 2.28 07/07/2017 15700 0.00 13382781 2.28 07/07/2017 -311055 -0.05 13071726 2.23 14/07/2017 36595 0.01 13108321 2.24 14/07/2017 -20816 0.00 13087505 2.23 21/07/2017 10920 0.00 13098425 2.24 21/07/2017 -841233 -0.14 12257192 2.09 28/07/2017 100614 0.02 12357806 2.11 28/07/2017 -22 0.00 12357784 2.11 04/08/2017 278852 0.05 12636636 2.16 04/08/2017 -200000 -0.03 12436636 2.12 11/08/2017 26825 0.00 12463461 2.13 11/08/2017 -659 0.00 12462802 2.13 18/08/2017 17990 0.00 12480792 2.13 25/08/2017 21901 0.00 12502693 2.13 25/08/2017 -35600 -0.01 12467093 2.13 01/09/2017 24694 0.00 12491787 2.13 08/09/2017 20778 0.00 12512565 2.14 08/09/2017 -113700 -0.02 12398865 2.12 15/09/2017 86210 0.01 12485075 2.13 15/09/2017 -74400 -0.01 12410675 2.12
22/09/2017 16876 0.00 12427551 2.1229/09/2017 1798 0.00 12429349 2.1229/09/2017 -260897 -0.04 12168452 2.0806/10/2017 19690 0.00 12188142 2.0806/10/2017 -334145 -0.06 11853997 2.0213/10/2017 30483 0.01 11884480 2.0313/10/2017 -254300 -0.04 11630180 1.9920/10/2017 18383 0.00 11648563 1.9927/10/2017 25968 0.00 11674531 1.9931/10/2017 3078 0.00 11677609 1.9903/11/2017 3810 0.00 11681419 1.9910/11/2017 3515 0.00 11684934 1.9910/11/2017 -69678 -0.01 11615256 1.9817/11/2017 4338 0.00 11619594 1.9817/11/2017 -1000 0.00 11618594 1.9824/11/2017 24886 0.00 11643480 1.9924/11/2017 -31546 -0.01 11611934 1.9801/12/2017 18392 0.00 11630326 1.9901/12/2017 -82000 -0.01 11548326 1.9708/12/2017 336104 0.06 11884430 2.0308/12/2017 -28056 0.00 11856374 2.0215/12/2017 24730 0.00 11881104 2.0322/12/2017 28061 0.00 11909165 2.0322/12/2017 -49729 -0.01 11859436 2.0229/12/2017 16708 0.00 11876144 2.0329/12/2017 -1748685 -0.30 10127459 1.73
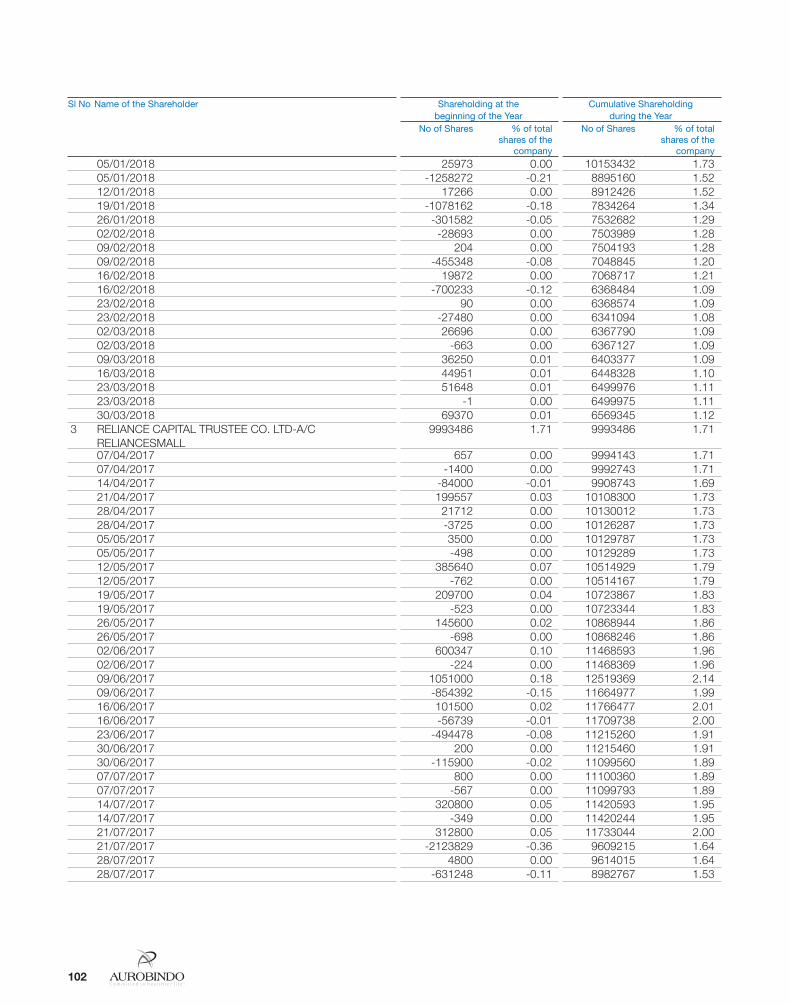
Annual Report 2017-18 103102
Sl No Name of the Shareholder Shareholding at the beginning of the Year
Cumulative Shareholding during the Year
No of Shares % of total shares of the
company
No of Shares % of total shares of the
company05/01/2018 25973 0.00 10153432 1.7305/01/2018 -1258272 -0.21 8895160 1.5212/01/2018 17266 0.00 8912426 1.5219/01/2018 -1078162 -0.18 7834264 1.3426/01/2018 -301582 -0.05 7532682 1.2902/02/2018 -28693 0.00 7503989 1.2809/02/2018 204 0.00 7504193 1.2809/02/2018 -455348 -0.08 7048845 1.2016/02/2018 19872 0.00 7068717 1.2116/02/2018 -700233 -0.12 6368484 1.0923/02/2018 90 0.00 6368574 1.0923/02/2018 -27480 0.00 6341094 1.0802/03/2018 26696 0.00 6367790 1.0902/03/2018 -663 0.00 6367127 1.0909/03/2018 36250 0.01 6403377 1.0916/03/2018 44951 0.01 6448328 1.1023/03/2018 51648 0.01 6499976 1.1123/03/2018 -1 0.00 6499975 1.1130/03/2018 69370 0.01 6569345 1.12
3 RELIANCE CAPITAL TRUSTEE CO. LTD-A/C RELIANCESMALL
9993486 1.71 9993486 1.71
07/04/2017 657 0.00 9994143 1.71 07/04/2017 -1400 0.00 9992743 1.71 14/04/2017 -84000 -0.01 9908743 1.69 21/04/2017 199557 0.03 10108300 1.73 28/04/2017 21712 0.00 10130012 1.73 28/04/2017 -3725 0.00 10126287 1.73 05/05/2017 3500 0.00 10129787 1.73 05/05/2017 -498 0.00 10129289 1.73 12/05/2017 385640 0.07 10514929 1.79 12/05/2017 -762 0.00 10514167 1.79 19/05/2017 209700 0.04 10723867 1.83 19/05/2017 -523 0.00 10723344 1.83 26/05/2017 145600 0.02 10868944 1.86 26/05/2017 -698 0.00 10868246 1.86 02/06/2017 600347 0.10 11468593 1.96 02/06/2017 -224 0.00 11468369 1.96 09/06/2017 1051000 0.18 12519369 2.14 09/06/2017 -854392 -0.15 11664977 1.99 16/06/2017 101500 0.02 11766477 2.01 16/06/2017 -56739 -0.01 11709738 2.00 23/06/2017 -494478 -0.08 11215260 1.91 30/06/2017 200 0.00 11215460 1.91 30/06/2017 -115900 -0.02 11099560 1.89 07/07/2017 800 0.00 11100360 1.89 07/07/2017 -567 0.00 11099793 1.89 14/07/2017 320800 0.05 11420593 1.95 14/07/2017 -349 0.00 11420244 1.95 21/07/2017 312800 0.05 11733044 2.00 21/07/2017 -2123829 -0.36 9609215 1.64 28/07/2017 4800 0.00 9614015 1.64 28/07/2017 -631248 -0.11 8982767 1.53
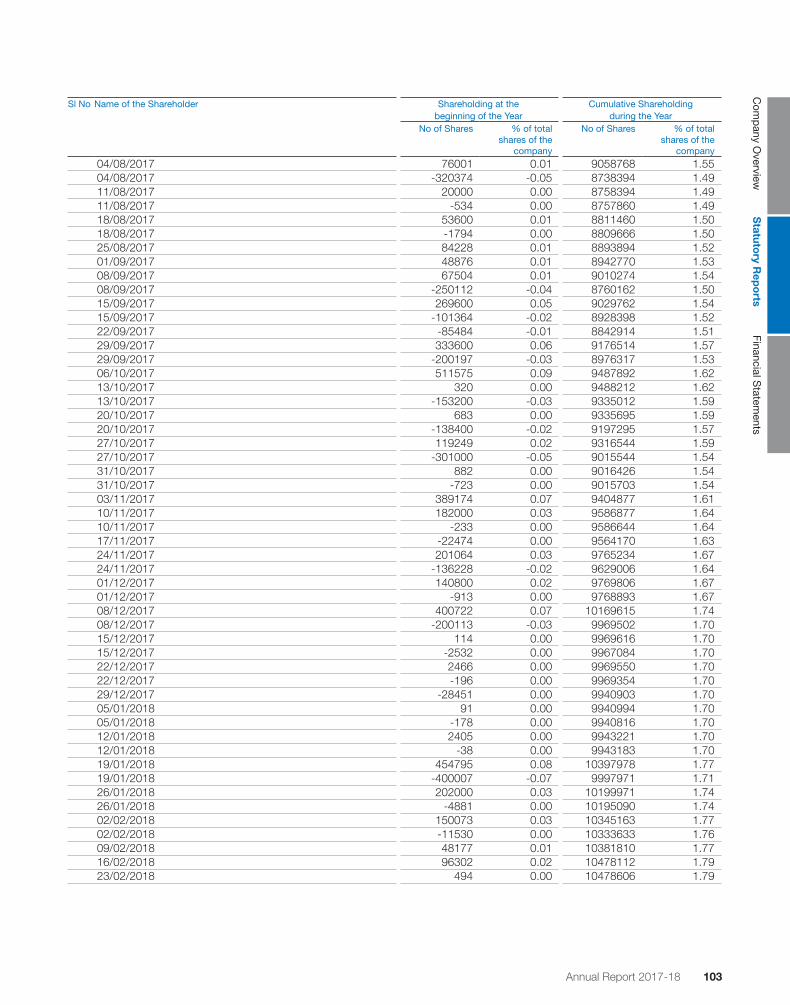
Annual Report 2017-18 103102
Com
pany O
verviewS
tatutory R
epo
rtsFinancial S
tatements
Sl No Name of the Shareholder Shareholding at the beginning of the Year
Cumulative Shareholding during the Year
No of Shares % of total shares of the
company
No of Shares % of total shares of the
company 04/08/2017 76001 0.01 9058768 1.55 04/08/2017 -320374 -0.05 8738394 1.49 11/08/2017 20000 0.00 8758394 1.49 11/08/2017 -534 0.00 8757860 1.49 18/08/2017 53600 0.01 8811460 1.50 18/08/2017 -1794 0.00 8809666 1.50 25/08/2017 84228 0.01 8893894 1.52 01/09/2017 48876 0.01 8942770 1.53 08/09/2017 67504 0.01 9010274 1.54 08/09/2017 -250112 -0.04 8760162 1.50 15/09/2017 269600 0.05 9029762 1.54 15/09/2017 -101364 -0.02 8928398 1.52 22/09/2017 -85484 -0.01 8842914 1.51
29/09/2017 333600 0.06 9176514 1.5729/09/2017 -200197 -0.03 8976317 1.5306/10/2017 511575 0.09 9487892 1.6213/10/2017 320 0.00 9488212 1.6213/10/2017 -153200 -0.03 9335012 1.5920/10/2017 683 0.00 9335695 1.5920/10/2017 -138400 -0.02 9197295 1.5727/10/2017 119249 0.02 9316544 1.5927/10/2017 -301000 -0.05 9015544 1.5431/10/2017 882 0.00 9016426 1.5431/10/2017 -723 0.00 9015703 1.5403/11/2017 389174 0.07 9404877 1.6110/11/2017 182000 0.03 9586877 1.6410/11/2017 -233 0.00 9586644 1.6417/11/2017 -22474 0.00 9564170 1.6324/11/2017 201064 0.03 9765234 1.6724/11/2017 -136228 -0.02 9629006 1.6401/12/2017 140800 0.02 9769806 1.6701/12/2017 -913 0.00 9768893 1.6708/12/2017 400722 0.07 10169615 1.7408/12/2017 -200113 -0.03 9969502 1.7015/12/2017 114 0.00 9969616 1.7015/12/2017 -2532 0.00 9967084 1.7022/12/2017 2466 0.00 9969550 1.7022/12/2017 -196 0.00 9969354 1.7029/12/2017 -28451 0.00 9940903 1.7005/01/2018 91 0.00 9940994 1.7005/01/2018 -178 0.00 9940816 1.7012/01/2018 2405 0.00 9943221 1.7012/01/2018 -38 0.00 9943183 1.7019/01/2018 454795 0.08 10397978 1.7719/01/2018 -400007 -0.07 9997971 1.7126/01/2018 202000 0.03 10199971 1.7426/01/2018 -4881 0.00 10195090 1.7402/02/2018 150073 0.03 10345163 1.7702/02/2018 -11530 0.00 10333633 1.7609/02/2018 48177 0.01 10381810 1.7716/02/2018 96302 0.02 10478112 1.7923/02/2018 494 0.00 10478606 1.79

Annual Report 2017-18 105104
Sl No Name of the Shareholder Shareholding at the beginning of the Year
Cumulative Shareholding during the Year
No of Shares % of total shares of the
company
No of Shares % of total shares of the
company23/02/2018 -400032 -0.07 10078574 1.7202/03/2018 1184164 0.20 11262738 1.9202/03/2018 -474 0.00 11262264 1.9209/03/2018 2159228 0.37 13421492 2.2909/03/2018 -1208800 -0.21 12212692 2.0816/03/2018 437634 0.07 12650326 2.16
16/03/2018 -50 0.00 12650276 2.16 23/03/2018 2888 0.00 12653164 2.16 23/03/2018 -190491 -0.03 12462673 2.13 30/03/2018 122518 0.02 12585191 2.15 30/03/2018 -38401 -0.01 12546790 2.144 ADITYA BIRLA SUN LIFE TRUSTEE PRIVATE LIMITED A/C 8375902 1.43 8375902 1.43 07/04/2017 217000 0.04 8592902 1.47 21/04/2017 334900 0.06 8927802 1.52 28/04/2017 -2738 0.00 8925064 1.52 05/05/2017 -454000 -0.08 8471064 1.45 12/05/2017 500000 0.09 8971064 1.53 12/05/2017 -80200 -0.01 8890864 1.52 19/05/2017 -60757 -0.01 8830107 1.51 26/05/2017 -80 0.00 8830027 1.51 02/06/2017 345 0.00 8830372 1.51 02/06/2017 -32600 -0.01 8797772 1.50 16/06/2017 100000 0.02 8897772 1.52 16/06/2017 -65800 -0.01 8831972 1.51 23/06/2017 2173800 0.37 11005772 1.88 23/06/2017 -321300 -0.05 10684472 1.82 30/06/2017 183931 0.03 10868403 1.86 07/07/2017 46000 0.01 10914403 1.86 14/07/2017 32800 0.01 10947203 1.87 21/07/2017 11200 0.00 10958403 1.87 28/07/2017 266400 0.05 11224803 1.92 04/08/2017 108800 0.02 11333603 1.93 04/08/2017 -200000 -0.03 11133603 1.90 11/08/2017 -10600 0.00 11123003 1.90 18/08/2017 380 0.00 11123383 1.90 25/08/2017 96876 0.02 11220259 1.92 01/09/2017 181653 0.03 11401912 1.95 01/09/2017 -135412 -0.02 11266500 1.92 08/09/2017 29600 0.01 11296100 1.93 08/09/2017 -1500 0.00 11294600 1.93 15/09/2017 90000 0.02 11384600 1.94 29/09/2017 57653 0.01 11442253 1.95 06/10/2017 570000 0.10 12012253 2.05 13/10/2017 181600 0.03 12193853 2.08 20/10/2017 104000 0.02 12297853 2.10 27/10/2017 42400 0.01 12340253 2.11 31/10/2017 -34243 -0.01 12306010 2.10 03/11/2017 48000 0.01 12354010 2.11 03/11/2017 -232676 -0.04 12121334 2.07 10/11/2017 -290000 -0.05 11831334 2.02 17/11/2017 655 0.00 11831989 2.02 17/11/2017 -552000 -0.09 11279989 1.93

Annual Report 2017-18 105104
Com
pany O
verviewS
tatutory R
epo
rtsFinancial S
tatements
Sl No Name of the Shareholder Shareholding at the beginning of the Year
Cumulative Shareholding during the Year
No of Shares % of total shares of the
company
No of Shares % of total shares of the
company 24/11/2017 200000 0.03 11479989 1.96 01/12/2017 212400 0.04 11692389 2.00 08/12/2017 -2300 0.00 11690089 2.00 15/12/2017 20000 0.00 11710089 2.00 15/12/2017 -116000 -0.02 11594089 1.98 22/12/2017 -181700 -0.03 11412389 1.95 05/01/2018 182800 0.03 11595189 1.98 12/01/2018 156800 0.03 11751989 2.01 19/01/2018 78 0.00 11752067 2.01 26/01/2018 16800 0.00 11768867 2.01 02/02/2018 4000 0.00 11772867 2.01 02/02/2018 -22500 0.00 11750367 2.01 09/02/2018 83200 0.01 11833567 2.02 09/02/2018 -203425 -0.03 11630142 1.99 16/02/2018 169000 0.03 11799142 2.01 23/02/2018 50000 0.01 11849142 2.02 02/03/2018 380839 0.07 12229981 2.09 02/03/2018 -700 0.00 12229281 2.09 09/03/2018 50091 0.01 12279372 2.10 09/03/2018 -8400 0.00 12270972 2.09 16/03/2018 -44253 -0.01 12226719 2.09 23/03/2018 500039 0.09 12726758 2.17 23/03/2018 -6248 0.00 12720510 2.17 30/03/2018 200078 0.03 12920588 2.21 30/03/2018 -1270 0.00 12919318 2.215 AMANSA HOLDINGS PRIVATE LIMITED 0 0.00 0 0.00 26/05/2017 2790597 0.48 2790597 0.48 02/06/2017 1561300 0.27 4351897 0.74 30/06/2017 382311 0.07 4734208 0.81 18/08/2017 206006 0.04 4940214 0.84 06/10/2017 95350 0.02 5035564 0.86 17/11/2017 47500 0.01 5083064 0.87 22/12/2017 -83064 -0.01 5000000 0.85 12/01/2018 -95380 -0.02 4904620 0.84 02/02/2018 241127 0.04 5145747 0.88 09/02/2018 328287 0.06 5474034 0.93 16/02/2018 353162 0.06 5827196 0.99 23/02/2018 621020 0.11 6448216 1.10 23/03/2018 153298 0.03 6601514 1.13 30/03/2018 306539 0.05 6908053 1.186 STICHTING DEPOSITARY APG EMERGING MARKETS
EQUITY P 6448482 1.10 6448482 1.10
07/04/2017 -9094 0.00 6439388 1.10 14/04/2017 113174 0.02 6552562 1.12 12/05/2017 233503 0.04 6786065 1.16 26/05/2017 -1614039 -0.28 5172026 0.88 02/06/2017 -571784 -0.10 4600242 0.79 09/06/2017 731342 0.12 5331584 0.91 16/06/2017 260767 0.04 5592351 0.95 14/07/2017 103738 0.02 5696089 0.97 28/07/2017 225854 0.04 5921943 1.01 04/08/2017 209748 0.04 6131691 1.05

Annual Report 2017-18 107106
Sl No Name of the Shareholder Shareholding at the beginning of the Year
Cumulative Shareholding during the Year
No of Shares % of total shares of the
company
No of Shares % of total shares of the
company 11/08/2017 -22725 0.00 6108966 1.04 18/08/2017 32467 0.01 6141433 1.05 22/09/2017 149037 0.03 6290470 1.07 13/10/2017 512523 0.09 6802993 1.16 20/10/2017 -17441 0.00 6785552 1.16 27/10/2017 60536 0.01 6846088 1.17 03/11/2017 -11837 0.00 6834251 1.17 08/12/2017 -741842 -0.13 6092409 1.04 15/12/2017 15349 0.00 6107758 1.04 09/02/2018 -319444 -0.05 5788314 0.99 16/02/2018 -1519258 -0.26 4269056 0.73 02/03/2018 -4599 0.00 4264457 0.73 09/03/2018 -32512 -0.01 4231945 0.72 16/03/2018 -128699 -0.02 4103246 0.70 23/03/2018 -177455 -0.03 3925791 0.677 JHUNJHUNWALA RAKESH RADHESHYAM 6350000 1.08 6350000 1.08 02/06/2017 500000 0.09 6850000 1.17 02/06/2017 -500000 -0.09 6350000 1.08 30/06/2017 200000 0.03 6550000 1.12 01/12/2017 -6550000 -1.12 0 0.008 ABU DHABI INVESTMENT AUTHORITY - RELVAL 5992293 1.02 5992293 1.02 19/05/2017 -334240 -0.06 5658053 0.97 02/06/2017 -73917 -0.01 5584136 0.95 09/06/2017 -810130 -0.14 4774006 0.81 16/06/2017 -754987 -0.13 4019019 0.69 08/09/2017 13121 0.00 4032140 0.69 22/09/2017 -267220 -0.05 3764920 0.64 27/10/2017 -200000 -0.03 3564920 0.61 17/11/2017 -105537 -0.02 3459383 0.59 24/11/2017 -187626 -0.03 3271757 0.56 01/12/2017 -4023 0.00 3267734 0.56 02/03/2018 -41531 -0.01 3226203 0.55 23/03/2018 -5628 0.00 3220575 0.55 30/03/2018 11007 0.00 3231582 0.55 30/03/2018 -11007 0.00 3220575 0.559 VANGUARD EMERGING MARKETS STOCK INDEX FUND,
A SERI 4621529 0.79 4621529 0.79
07/04/2017 52320 0.01 4673849 0.80 28/04/2017 4800 0.00 4678649 0.80 05/05/2017 38400 0.01 4717049 0.81 12/05/2017 12000 0.00 4729049 0.81 19/05/2017 25920 0.00 4754969 0.81 02/06/2017 10560 0.00 4765529 0.81 07/07/2017 16800 0.00 4782329 0.82 14/07/2017 12000 0.00 4794329 0.82 04/08/2017 10560 0.00 4804889 0.82 11/08/2017 13920 0.00 4818809 0.82 01/09/2017 17280 0.00 4836089 0.83 08/09/2017 24480 0.00 4860569 0.83 15/09/2017 22080 0.00 4882649 0.83 22/09/2017 -172304 -0.03 4710345 0.80 06/10/2017 14400 0.00 4724745 0.81

Annual Report 2017-18 107106
Com
pany O
verviewS
tatutory R
epo
rtsFinancial S
tatements
Sl No Name of the Shareholder Shareholding at the beginning of the Year
Cumulative Shareholding during the Year
No of Shares % of total shares of the
company
No of Shares % of total shares of the
company 13/10/2017 14880 0.00 4739625 0.81 20/10/2017 11040 0.00 4750665 0.81 27/10/2017 10080 0.00 4760745 0.81 22/12/2017 -163716 -0.03 4597029 0.78 26/01/2018 22983 0.00 4620012 0.79 02/02/2018 20538 0.00 4640550 0.79 23/03/2018 4640550 0.79 9281100 1.58 23/03/2018 -4640550 -0.79 4640550 0.79 30/03/2018 -24500 0.00 4616050 0.7910 MORGAN STANLEY MAURITIUS COMPANY LIMITED 4320861 0.74 4320861 0.74 07/04/2017 -67399 -0.01 4253462 0.73 14/04/2017 -6300 0.00 4247162 0.72 21/04/2017 -9333 0.00 4237829 0.72 28/04/2017 -2100 0.00 4235729 0.72 05/05/2017 -27000 0.00 4208729 0.72 12/05/2017 -21280 0.00 4187449 0.71 19/05/2017 -27655 0.00 4159794 0.71 26/05/2017 -1400 0.00 4158394 0.71 02/06/2017 -61160 -0.01 4097234 0.70 09/06/2017 -1000 0.00 4096234 0.70 16/06/2017 -3500 0.00 4092734 0.70 23/06/2017 -138500 -0.02 3954234 0.67 28/07/2017 -8147 0.00 3946087 0.67 04/08/2017 -21927 0.00 3924160 0.67 11/08/2017 -215731 -0.04 3708429 0.63 18/08/2017 -32903 -0.01 3675526 0.63 25/08/2017 -700 0.00 3674826 0.63 29/09/2017 -1005909 -0.17 2668917 0.46
27/10/2017 -2417 0.00 2666500 0.4610/11/2017 -17472 0.00 2649028 0.4517/11/2017 -52124 -0.01 2596904 0.4401/12/2017 -22216 0.00 2574688 0.4408/12/2017 -471 0.00 2574217 0.4415/12/2017 -4827 0.00 2569390 0.4422/12/2017 -234 0.00 2569156 0.4429/12/2017 -21597 0.00 2547559 0.4312/01/2018 -7787 0.00 2539772 0.4309/02/2018 -38517 -0.01 2501255 0.4323/02/2018 -101 0.00 2501154 0.4302/03/2018 -66965 -0.01 2434189 0.4209/03/2018 -398634 -0.07 2035555 0.3516/03/2018 -374557 -0.06 1660998 0.2823/03/2018 -800 0.00 1660198 0.2830/03/2018 -5335 0.00 1654863 0.28
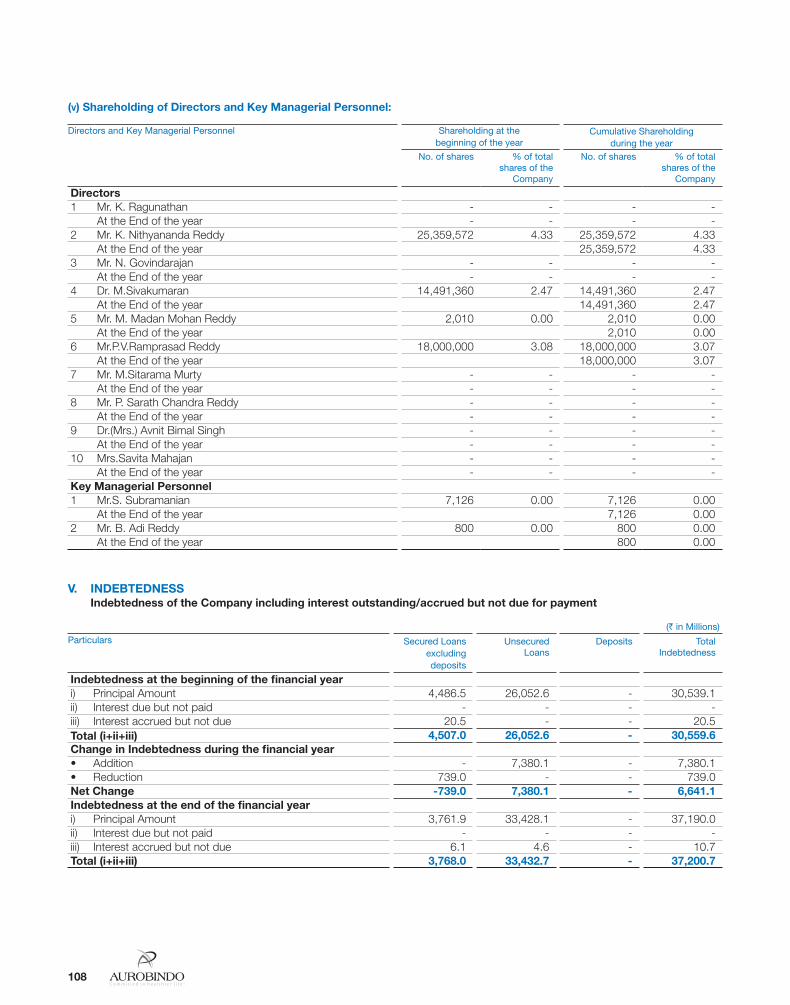
Annual Report 2017-18 109108
(v) Shareholding of Directors and Key Managerial Personnel:
Directors and Key Managerial Personnel Shareholding at thebeginning of the year
Cumulative Shareholdingduring the year
No. of shares % of total shares of the
Company
No. of shares % of total shares of the
Company
Directors1 Mr. K. Ragunathan - - - -
At the End of the year - - - -2 Mr. K. Nithyananda Reddy 25,359,572 4.33 25,359,572 4.33
At the End of the year 25,359,572 4.333 Mr. N. Govindarajan - - - -
At the End of the year - - - -4 Dr. M.Sivakumaran 14,491,360 2.47 14,491,360 2.47
At the End of the year 14,491,360 2.475 Mr. M. Madan Mohan Reddy 2,010 0.00 2,010 0.00
At the End of the year 2,010 0.006 Mr.P.V.Ramprasad Reddy 18,000,000 3.08 18,000,000 3.07
At the End of the year 18,000,000 3.077 Mr. M.Sitarama Murty - - - -
At the End of the year - - - -8 Mr. P. Sarath Chandra Reddy - - - -
At the End of the year - - - -9 Dr.(Mrs.) Avnit Bimal Singh - - - -
At the End of the year - - - -10 Mrs.Savita Mahajan - - - -
At the End of the year - - - -Key Managerial Personnel1 Mr.S. Subramanian 7,126 0.00 7,126 0.00
At the End of the year 7,126 0.002 Mr. B. Adi Reddy 800 0.00 800 0.00
At the End of the year 800 0.00
V. INDEBTEDNESS Indebtedness of the Company including interest outstanding/accrued but not due for payment
(` in Millions)Particulars Secured Loans
excluding deposits
Unsecured Loans
Deposits Total Indebtedness
Indebtedness at the beginning of the financial yeari) Principal Amount 4,486.5 26,052.6 - 30,539.1 ii) Interest due but not paid - - - - iii) Interest accrued but not due 20.5 - - 20.5 Total (i+ii+iii) 4,507.0 26,052.6 - 30,559.6 Change in Indebtedness during the financial year• Addition - 7,380.1 - 7,380.1 • Reduction 739.0 - - 739.0 Net Change -739.0 7,380.1 - 6,641.1 Indebtedness at the end of the financial year i) Principal Amount 3,761.9 33,428.1 - 37,190.0 ii) Interest due but not paid - - - - iii) Interest accrued but not due 6.1 4.6 - 10.7 Total (i+ii+iii) 3,768.0 33,432.7 - 37,200.7

Annual Report 2017-18 109108
Com
pany O
verviewS
tatutory R
epo
rtsFinancial S
tatements
vI. REMUNERATION OF DIRECTORS AND KEY MANAGERIAL PERSONNELA. Remuneration to Managing Director, Whole-time Directors and/or Manager:
(` in million)
Sl. no.
Particulars of Remuneration
Name of MD/WTD/ Manager Total Amount
Mr. K. Nithyananda
Reddy
Mr. N. Govindarajan
Dr. M. Sivakumaran
Mr. M. Madan Mohan Reddy
Mr.P.Sarath Chandra
Reddy
1 Gross salary (a) Salary as per provisions contained in
section 17(1) of the Income Tax Act, 1961
13.80 42.38 13.80 24.42 7.50 101.90
(b) Value of perquisites u/s 17(2) Income tax Act, 1961
1.30 3.87 1.30 2.30 0.75 9.52
(c) Profits in lieu of salary under section 17(3) Income tax Act, 1961
- - - - - -
2 Stock Option - - - - - -3 Sweat Equity - - - - - -4 Commission - - - - -
- as % of profit - 100.00 - - - 100.00- others, specify… - - - -Others, please specify - Contribution to PF
0.02 0.02 0.02 0.02 0.02 0.10
Total (A) 15.12 146.27 15.12 26.74 8.27 211.52Ceiling as per the Act (being 10% of the net profits of the Company calculated as per Section 198 of the Companies Act, 2013)
2,394.51
B. Remuneration to other directors:
(` in million)
Sl. no. Particulars of Remuneration Name of Directors Total Amount1 Independent Directors Mr. K.
RagunathanMr. M
Sitarama Murty
Mr. Rathakrishnan Rangaswamy
Iyer *
Dr. (Mrs). Avnit Bimal
Singh
Mrs. Savita Mahajan
Fee for attending board / committee meetings
1.00 1.05 0.60 0.55 0.10 3.30
Commission - - - - - -Others, please specify - - - - - -Total (1) 1.00 1.05 0.60 0.55 0.10 3.30
2 Other Non-Executive Directors Mr.P.V.Ramprasad
Reddy
Fee for attending board / committee meetings
0.20 0.20
Commission -Others, please specify -Total (2) 0.20 0.20Total B)=(1+2) 3.50Total managerial Remuneration 215.02Overall Ceiling as per the Act (being 11% of the net profits of the Company calculated as per Section 198 of the Companies Act, 2013)
2,633.96
* Resigned during the year.

Annual Report 2017-18 111110
C. Remuneration to Key Managerial Personnel Other than MD/Manager/WTD
(` in million)
Particulars of Remuneration
Key Managerial Personnel
CFO Company Secretary Total
Mr. S. Subramanian
Mr.B.Adi Reddy
1 Gross salary(a) Salary as per provisions contained in section 17(1) of the Income
Tax Act, 1961 13.24 3.04 16.28
(b) Value of perquisites u/s 17(2) Income Tax Act, 1961 1.01 0.27 1.28(c) Profits in lieu of salary under section 17(3) Income-tax Act, 1961 - - -
2 Stock Option - - -3 Sweat Equity - - -4 Commission
- as % of profit - - -- others, specify - - -
5 Others, please specify - Contribution to PF 0.02 0.02 0.04Total 14.27 3.33 17.60
VII. PENALTIES / PUNISHMENT/ COMPOUNDING OF OFFENCES: Against the Company, Directors and other officers in default under the Companies Act, 2013: None
For and on behalf of the Board
K. RagunathanHyderabad ChairmanMay 28, 2018 DIN: 00523576

Annual Report 2017-18 111110
Com
pany O
verviewS
tatutory R
epo
rtsFinancial S
tatements
ANNEXURE-4
Conservation of energy, technology absorption, foreign exchange earnings and outgo(Pursuant to the provisions of section 134(3) (m) of the Companies Act, 2013 read with the Companies (Accounts) Rules, 2014.)
(A) CONSERVATION OF ENERGY(i) Steps taken or impact on conservation of energy;• At unit 3 all areas lighting is replaced by LED lamps saving
about 1.5 lakh units annually. Lighting transformers are kept under operation with reduced voltage resulting in further lighting savings of 6%. STP permeate water of cooling towers now is getting recycled resulting in reduction of 40KL per day effluent and 40KL per day fresh water intake. Steam condensate recovery improved from 55% to 70% resulting in reduction of 30KL water. Air compressor cooling mechanism modification reduced another 20KL water per day
• At unit 7 installation of hot well and cold well system at chillers area resulted in energy savings of 41 lakh units per annum. Lighting system at OCB area replaced by LED which gives savings of about 10,000 units per annum. 200KL water per day saved at unit 7 by recycling purified water system rejects to cooling towers, toilets, dining wash area etc.,
• Lighting system at unit 6 is replaced by LED lamps, which gives annual savings of 54000 units. VFD’s usage resulted in another 15000units savings. 5400KL water annually saved at unit 6 by the reuse of water from autoclave and vial washing machine for garden and other areas
• At unit 4, water saving components is used for all taps and faucets.
• By modification of chiller network system one 110TR chiller at unit 12 is completely stopped which gives the savings of about 21lakh units annually
• OPL’s (One point Lessons) are created at various units to improve the awareness levels among employees for disciplined usage of energy.
• Arranged Nitrogen blanketing systems to Centrifuges for reduction of Nitrogen consumption and at the same time safety measures also improved while operating in Unit-1 & Unit-11U
• Optimization of chilling plant operations during winter season taking the benefit of environmental coldness by modifying the existing pipelines and pumps etc.,
• Replacement of old and high energy consuming coal crushing plants with low energy consumption coal plant for improving the productivity and efficiency.
• Installed multi stage Multi Effect Evaporator (MEE) by replacing old MEE plant for improving the operational efficiency in Unit-5
• Installation of double effect Vapor Absorption Machines (VAMs) replacing single effect old VAM & Vapor Compression Refrigeration (VCR) systems.
• Waste Heat Recovery (WHR) system implemented to pre heat the Boiler feed water from the process waste heat in Unit-11
• De-Super heaters arranged for converting super-heated steam in to saturated steam for using in process applications.
• Installed of flash steam recovery units for recovering heat from the flash steam in Unit-11U
• GLR Reactors 60 W Vessel Lamps replaced with 7 W LED Lamps in Unit-11U
• Replaced old low efficiency pump sets with high efficient pump sets, replacement of old impellers with new efficient impellers in pumping systems.
• Provision of interlocks for avoiding operation of standby equipment.
• RO rejected water using for cooling tower and saving the water consumption from outside.
(ii) Steps taken by the company for utilizing alternate sources of energy;
• Steam coils are provided for dehumidification system at unit 15 to reduces power consumption
• At unit7, 75 no.s day lights installed to reduce lighting energy. 200 wind blowers installed to reduce heat load of HVAC system
• At unit 4, rain water harvesting water is used for cooling towers after softening. This resulted in about 50KL water reduction per day
• Trading of Power through open access using wind /solar power in UNIT-XI and XIU.
• Utilization of waste heat available in the process for pre heating of Boiler Feed Water
(iii) Capital investment on energy conservation equipments;
• At unit 3, Low efficiency reciprocating air compressors are replaced with oil free screw air compressors
• VFDs installed for coating AHU’s at unit 6
• LED lighting system replaced conventional lighting at units 3, 6 and 7
• Hot well, cold well system implemented at chillers area in unit 7
• As energy conservation is one of the priority areas for Aurobindo, the company has invested in FY 2017-18 on energy conservation projects

Annual Report 2017-18 113112
(B) TECHNOLOGY ABSORPTION Efforts made towards technology absorption: The Company has a robust in-house R&D team which
works on research, development, and commercialization of various APIs and Formulations. The Company along with various subsidiaries & Joint ventures intensely works on R&D projects to fulfill the medical needs of many people across the globe. Technology absorption is one of the key priorities for the Company as it facilitates long-term sustainability. The technologies developed will be protected through patent registration which will directly create value for the stakeholders of the company.
Benefits derived like product improvement, cost reduction, product development or import substitution:The Company actively works on optimizing the costs across the value chain which makes the products and services more competitive. These activities resulted in the improvement of operational efficiency. The Company maximized the efforts to further vertically integrate the operations which decreases the dependency on import of intermediaries and APIs. These efforts include in-house development, local sourcing, etc.
In case of imported technology (imported during the last three years reckoned from the beginning of the financial year)-Not Applicable
Expenditure Incurred on Research and Development
` Millions
Particulars 2017-18 2016-17
Capital 596.3 940.7Recurring 5,895.2 4,963.3Total R&D Expenditure 6,491.5 5,904.0As a % of total gross turnover 6.32 6.04
(C) FOREIGN EXCHANGE EARNINGS AND OUTGO- The Foreign Exchange earned in terms of actual inflows
during the year and the Foreign Exchange outgo during the year in terms of actual outflows.
Foreign Exchange Earned
` Millions
Particulars 2017-18 2016-17
Exports 80,680.5 75,760.7Others 46.7 77.0
80,727.2 75,837.7
Foreign Exchange Outgo
` Millions
Particulars 2017-18 2016-17
Imports 31,852.8 27,088.8Others 2,847.6 3,135.5
34,700.3 30,224.3
For and on behalf of the Board
Place: Hyderabad K. RagunathanDate: 28 May 2018 Chairman
DIN: 00523576
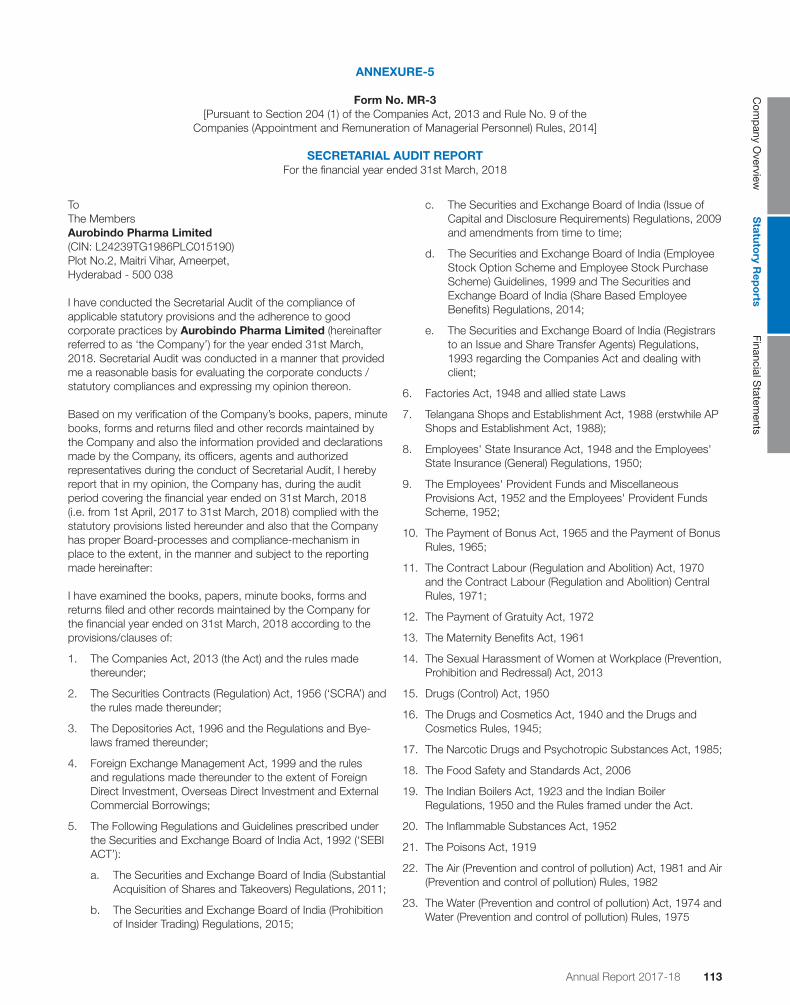
Annual Report 2017-18 113112
Com
pany O
verviewS
tatutory R
epo
rtsFinancial S
tatements
ANNEXURE-5
Form No. MR-3[Pursuant to Section 204 (1) of the Companies Act, 2013 and Rule No. 9 of the
Companies (Appointment and Remuneration of Managerial Personnel) Rules, 2014]
SECRETARIAL AUDIT REPORTFor the financial year ended 31st March, 2018
ToThe MembersAurobindo Pharma Limited(CIN: L24239TG1986PLC015190)Plot No.2, Maitri Vihar, Ameerpet,Hyderabad - 500 038
I have conducted the Secretarial Audit of the compliance of applicable statutory provisions and the adherence to good corporate practices by Aurobindo Pharma Limited (hereinafter referred to as ‘the Company’) for the year ended 31st March, 2018. Secretarial Audit was conducted in a manner that provided me a reasonable basis for evaluating the corporate conducts / statutory compliances and expressing my opinion thereon.
Based on my verification of the Company’s books, papers, minute books, forms and returns filed and other records maintained by the Company and also the information provided and declarations made by the Company, its officers, agents and authorized representatives during the conduct of Secretarial Audit, I hereby report that in my opinion, the Company has, during the audit period covering the financial year ended on 31st March, 2018 (i.e. from 1st April, 2017 to 31st March, 2018) complied with the statutory provisions listed hereunder and also that the Company has proper Board-processes and compliance-mechanism in place to the extent, in the manner and subject to the reporting made hereinafter:
I have examined the books, papers, minute books, forms and returns filed and other records maintained by the Company for the financial year ended on 31st March, 2018 according to the provisions/clauses of:
1. The Companies Act, 2013 (the Act) and the rules made thereunder;
2. The Securities Contracts (Regulation) Act, 1956 (‘SCRA’) and the rules made thereunder;
3. The Depositories Act, 1996 and the Regulations and Bye-laws framed thereunder;
4. Foreign Exchange Management Act, 1999 and the rules and regulations made thereunder to the extent of Foreign Direct Investment, Overseas Direct Investment and External Commercial Borrowings;
5. The Following Regulations and Guidelines prescribed under the Securities and Exchange Board of India Act, 1992 (‘SEBI ACT’):
a. The Securities and Exchange Board of India (Substantial Acquisition of Shares and Takeovers) Regulations, 2011;
b. The Securities and Exchange Board of India (Prohibition of Insider Trading) Regulations, 2015;
c. The Securities and Exchange Board of India (Issue of Capital and Disclosure Requirements) Regulations, 2009 and amendments from time to time;
d. The Securities and Exchange Board of India (Employee Stock Option Scheme and Employee Stock Purchase Scheme) Guidelines, 1999 and The Securities and Exchange Board of India (Share Based Employee Benefits) Regulations, 2014;
e. The Securities and Exchange Board of India (Registrars to an Issue and Share Transfer Agents) Regulations, 1993 regarding the Companies Act and dealing with client;
6. Factories Act, 1948 and allied state Laws
7. Telangana Shops and Establishment Act, 1988 (erstwhile AP Shops and Establishment Act, 1988);
8. Employees' State Insurance Act, 1948 and the Employees' State Insurance (General) Regulations, 1950;
9. The Employees' Provident Funds and Miscellaneous Provisions Act, 1952 and the Employees' Provident Funds Scheme, 1952;
10. The Payment of Bonus Act, 1965 and the Payment of Bonus Rules, 1965;
11. The Contract Labour (Regulation and Abolition) Act, 1970 and the Contract Labour (Regulation and Abolition) Central Rules, 1971;
12. The Payment of Gratuity Act, 1972
13. The Maternity Benefits Act, 1961
14. The Sexual Harassment of Women at Workplace (Prevention, Prohibition and Redressal) Act, 2013
15. Drugs (Control) Act, 1950
16. The Drugs and Cosmetics Act, 1940 and the Drugs and Cosmetics Rules, 1945;
17. The Narcotic Drugs and Psychotropic Substances Act, 1985;
18. The Food Safety and Standards Act, 2006
19. The Indian Boilers Act, 1923 and the Indian Boiler Regulations, 1950 and the Rules framed under the Act.
20. The Inflammable Substances Act, 1952
21. The Poisons Act, 1919
22. The Air (Prevention and control of pollution) Act, 1981 and Air (Prevention and control of pollution) Rules, 1982
23. The Water (Prevention and control of pollution) Act, 1974 and Water (Prevention and control of pollution) Rules, 1975
Annual Report 2017-18 115114
24. Environment Protection Act, 1986 and the rules, notifications issued thereunder.
25. Memorandum and Articles of Association of the Company.
I have also examined compliance with the applicable clauses of the following:i. Secretarial Standards issued by the Institute of Company
Secretaries of India;ii. The Listing Agreement entered into by the Company with
BSE Limited and National Stock Exchange of India Limited;iii. Securities and Exchange Board of India (Listing Obligations
and Disclosure Requirements) Regulations, 2015.
During the period under review the company has generally complied with the provisions of the acts, rules, regulations, guidelines, and standards etc., mentioned above.
I further report thata) the Board of Directors of the Company is duly constituted
with proper balance of Executive Directors, Non-Executive Directors and Independent Directors. The changes in the composition of the Board of Directors that took place during the period under review were carried out in compliance with the provisions of the Act.
b) Adequate notice is given to all directors to schedule the Board Meetings, agenda and detailed notes on agenda were sent in advance, and a system exists for seeking and obtaining further information and clarifications on the agenda items before the meeting and for meaningful participation at the meeting.
c) All the decisions at Board Meetings and Committee Meetings are carried out unanimously as recorded in the minutes of the meetings of the Board of Directors or Committee of the Board, as the case may be.
d) the compliance by the Company of the applicable financial laws like direct and indirect tax laws and maintenance of financial records and books of accounts has not been reviewed by me since the same have been subject to review by statutory auditors and other professionals.
I further report that there are adequate systems and processes in the company commensurate with the size and operations of the company to monitor and ensure compliance with applicable laws, rules, regulations and guidelines.
Place: Hyderabad A. Mohan Rami ReddyDate: 28 May 2018 Practicing Company Secretary
FCS No: 2147; COP No: 16660
This Report is to be read with my letter which is annexed as Annexure and forms an integral part of this report
Place: Hyderabad A. Mohan Rami ReddyDate: 28 May 2018 Practicing Company Secretary
FCS No: 2147; COP No: 16660
‘ANNEXURE’
ToThe MembersM/s. Aurobindo Pharma Limited(CIN: L24239TG1986PLC015190)Plot No.2, Maitri Vihar, Ameerpet,Hyderabad- 500 038
My report of even date is to be read along with this letter.
1. Maintenance of Secretarial records is the responsibility of the management of the Company. My responsibility is to express an opinion on these secretarial records based on my audit.
2. I have followed the audit practices and process as were appropriate to obtain reasonable assurance about the correctness of the contents of the Secretarial records. The verification was done on test basis to ensure that correct facts are reflected in Secretarial records. I believe that the
process and practices followed by me provide a reasonable basis for my opinion.
3. I have not verified the correctness and appropriateness of financial records and Books of Accounts of the Company.
4. Wherever required, I have obtained the Management representation about the Compliance of laws, rules and regulations and happening of events, etc.
5. The Compliance of the provisions of Corporate and other applicable laws, rules, regulations, standards is the responsibility of management. My examination was limited to the verification of procedures on test basis.
6. The Secretarial Audit Report is neither an assurance as to the future viability of the Company nor of the efficacy or effectiveness with which the management has conducted the affairs of the Company.

Annual Report 2017-18 115114
Com
pany O
verviewS
tatutory R
epo
rtsFinancial S
tatements
ANNEXURE-6
Annual Report of Corporate Social Responsibility activities
1. A brief outline of the Company's Corporate Social Responsibility (CSR) policy, including overview of projects or programs proposed to be undertaken and a reference to the web-link to the CSR policy and projects or programs.
Promoting Education, Promoting Preventive Health Care, Eradicating Hunger, Poverty & Malnutrition and Preventive Health Care. Making Available Safe Drinking Water, Environment Sustainability, and Ecological Balance & Conservation of Natural Resources. Rural sports and Setting up Old Age Homes etc.
The CSR Policy has been placed on the Company’s website at: http://www.aurobindo.com/about-us/corporate-governance
The Company has established Aurobindo Pharma Foundation for primarily undertaking CSR activities. Accordingly, the Company has started CSR activities under the said foundation.
Annual report on the CSR activities of the Company during the year are also placed on the Company’s website at: http://www.aurobindo.com/social-responsibility/csr-activities
2. Composition of CSR Committee:
Name Designation
Mr. K. Nithyananda Reddy ChairmanMr. K. Ragunathan Member Dr. M. Sivakumaran MemberMr. P. Sarath Chandra Reddy Member
3. Average net profit (as per section 198 of the Companies Act, 2013) for the past three financial years:
` Millions
Particulars 2016-17 2015-16 2014-15
Net profit as per Section 198 of the Companies Act, 2013 for the preceding three financial years.
21,965.3 21,802.4 19,968.4
` Millions
4 Average net profit for three years 21,245.4Prescribed CSR expenditure (2% of Average Net Profit) 424.9CSR amount unspent as on March 31, 2017 345.1Total CSR amount available for the financial year 2017-18 770.0Total value of CSR activities approved during financial year 2017-18 345.7
Contribution made by the Company to Aurobindo Pharma Foundation for CSR Expenditure during the financial year 2017-18*
200.0
CSR amount unspent as on March 31, 2018 and carried forward to next year 570.0
* Out of the total contribution of `200 millions, Aurobindo Pharma Foundation paid an amount of `177.3 millions to the vendors and the balance amount of `22.7 millions is yet to be paid to the vendors for ongoing projects.

Annual Report 2017-18 117116
Purposes for which the amount was spent on CSR during the financial year is detailed below:
`
Sl. No.
CSR Project or Activity identified Sector in which the Project is Covered
Projects or Programs (1) Local area or other (2) Specify the state and district where projects or programs was undertaken
Amount outlay (budget) project or programs wise
Amount spent on the projects or programssub heads:(1) Direct expenditure on projects or programs(2) Overheads
Cumulative expenditure upto the reporting period
Amount spent: Direct or through implementing agency
i Construction, maintenance and repair of classrooms at government schools, compound walls, and play grounds and provided other amenities like furniture, dual desks, etc.
Aurobindo Pharma Foundation has provided funds for summer special coaching to 10th class students in various government schools. Provided assistance towards employment enhancing vocational skills for the socially & economically backward students. Provided financial Support to pursue education by economically poor students. Financial assistance for providing free education to orphans, semi-orphans and underprivileged girl children.
Aurobindo Pharma Foundation has given financial support for hearing Impaired children towards skill development activities and also for construction of skill development centre and to provide education, health, science and cultural activities at various places.
Promoting Education
Ramachandrapuram, Tellapur village, Bhadurpura, Bachupally & Mallampet, Narsapur, Shivampet, Masaipet, Kodugal, Gaddapotharam and various other villages situated in Hatnoora mandal, Patancheru, Narsapur, Quthbullapur, Sircilla, Jedcherla and Jinnaram Mandals of Telangana State.
Pydibhimavaram, Chillapeta, Lankapeta, OVpeta, Nelivada & Mukshumpuram and surrounding villages in Srikakulam, Visakhapatnam & Vizianagaram Districts of Andhra Pradesh state
Menakur village, Naidupeta mandal and other villages in Nellore and Chittor districts of Andhra Pradesh state.
Chintalapudi village, Guntur District of Andhra Pradesh state
Ashray-Akruthi, Srinagar Colony, Hyderabad for hearing impaired children.
Skill development centre at "Alluri Sita Rama Raju Vignana Kendram", Visakahapatnam District, Andhra Pradesh State.
Sundarayya Vignana Kendram and Makineni Basvapunniah memorial trust, Hyderabad.
81,486,297 61,486,297 61,486,297 Direct, Visakha-patnam District Collector and through NGO ," GIVE", "Nachiketa Tapovan", "Sai Seva sangh", "Ashray- Akruti", "Alluri Sita Rama Raju Vignana Kendhram", "Sundarayya Vignana Kendram", "Makineni Basava-punnaiah Memorial Trust", "Jana Vignana Vedika", "Vande-mataram Foundation" "Sri Srinivasa Charitable Trust".

Annual Report 2017-18 117116
Com
pany O
verviewS
tatutory R
epo
rtsFinancial S
tatements
`
Sl. No.
CSR Project or Activity identified Sector in which the Project is Covered
Projects or Programs (1) Local area or other (2) Specify the state and district where projects or programs was undertaken
Amount outlay (budget) project or programs wise
Amount spent on the projects or programssub heads:(1) Direct expenditure on projects or programs(2) Overheads
Cumulative expenditure upto the reporting period
Amount spent: Direct or through implementing agency
ii Aurobindo Pharma Foundation has provided
- free eye checkup camp with doctors of LV Prasad Eye Institute, Visakhapatnam and provided spectacles to government school children.
-financial support for the treatment of poor children suffering from heart defects and facilitated surgeries.
- funds for the Treatment of mentally handicapped persons at Chennai and
- funds for mentally retarded children at Malkapet, Hyderabad.
-funds for treatment of Poor Patient's suffering from Cancer and Kidney Disease.
-funds for organizing free health camps, free volunteer services for patients and support for the respiratory intensive care unit at Government General Hospital located at Vijayawada, Andhra Pradesh.
-TATA ACE vehicle to collect the garbage from households.
-monthly maintenance expenses to three fire stations. Provided 2 sets of forcible entry kits door opener to fire department.
- Six Patrolling vehicles two wheelers for Police Department towards public safety purpose.
- "Elbow crutches, Wheel chairs, Walkers for the disabled and mentally challenged persons.
Provided funds for construction of 30 bed hospital and towards health & education, provided funds to Mallu Venkata Narsimha Reddy Vignana Kendram and for health purpose provided funds towards repairs and renovation of toilets at girls’ orphanage.
Promoting preventive health care & Sanitation, Road Safety for Public.
Pydibhimavaram village, Ranasthalam mandal, Srikakulam district, Andhra Pradesh State.
Vijayawada , Krishna district, Andhra Pradesh state. Parwada, Visakhapatnam District, Andhra Pradesh state.
Little Heart Foundation, Hyderabad. SCARF Foundation, Chennai, Tamilnadu state.
Malakpet, Isnapur, Borapatla, Gundlamachnoor, Pashamylaram, and other villages and places in Telangana State.
22,664,133 19,940,328 81,426,625 Direct, and through NGO "Innova Little Heart Foundation", Direct, "SCARF Foundation", NGO "Prerna Welfare Society" " UCDS NGO" "Mallu Venkata Narsimha Reddy Vignana Kendram", " Family Eduvision".
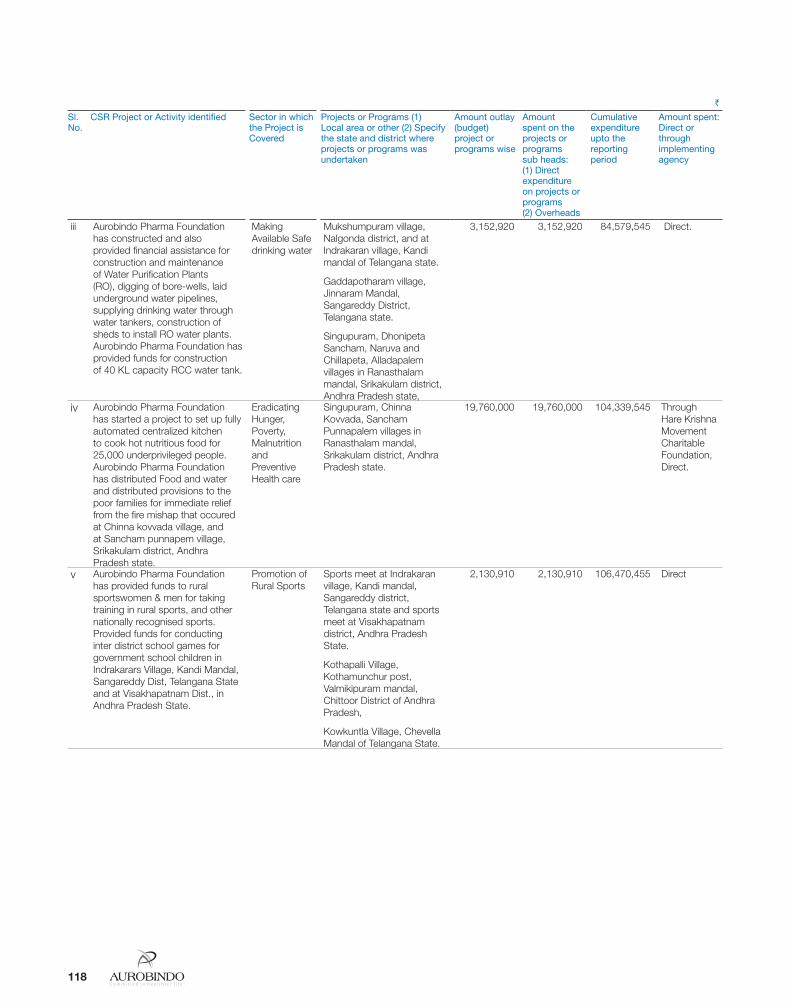
Annual Report 2017-18 119118
`
Sl. No.
CSR Project or Activity identified Sector in which the Project is Covered
Projects or Programs (1) Local area or other (2) Specify the state and district where projects or programs was undertaken
Amount outlay (budget) project or programs wise
Amount spent on the projects or programssub heads:(1) Direct expenditure on projects or programs(2) Overheads
Cumulative expenditure upto the reporting period
Amount spent: Direct or through implementing agency
iii Aurobindo Pharma Foundation has constructed and also provided financial assistance for construction and maintenance of Water Purification Plants (RO), digging of bore-wells, laid underground water pipelines, supplying drinking water through water tankers, construction of sheds to install RO water plants. Aurobindo Pharma Foundation has provided funds for construction of 40 KL capacity RCC water tank.
Making Available Safe drinking water
Mukshumpuram village, Nalgonda district, and at Indrakaran village, Kandi mandal of Telangana state.
Gaddapotharam village, Jinnaram Mandal, Sangareddy District, Telangana state.
Singupuram, Dhonipeta Sancham, Naruva and Chillapeta, Alladapalem villages in Ranasthalam mandal, Srikakulam district, Andhra Pradesh state,
3,152,920 3,152,920 84,579,545 Direct.
iv Aurobindo Pharma Foundation has started a project to set up fully automated centralized kitchen to cook hot nutritious food for 25,000 underprivileged people. Aurobindo Pharma Foundation has distributed Food and water and distributed provisions to the poor families for immediate relief from the fire mishap that occured at Chinna kovvada village, and at Sancham punnapem village, Srikakulam district, Andhra Pradesh state.
Eradicating Hunger, Poverty, Malnutrition and Preventive Health care
Singupuram, Chinna Kovvada, Sancham Punnapalem villages in Ranasthalam mandal, Srikakulam district, Andhra Pradesh state.
19,760,000 19,760,000 104,339,545 Through Hare Krishna Movement Charitable Foundation, Direct.
v Aurobindo Pharma Foundation has provided funds to rural sportswomen & men for taking training in rural sports, and other nationally recognised sports. Provided funds for conducting inter district school games for government school children in Indrakarars Village, Kandi Mandal, Sangareddy Dist, Telangana State and at Visakhapatnam Dist., in Andhra Pradesh State.
Promotion of Rural Sports
Sports meet at Indrakaran village, Kandi mandal, Sangareddy district, Telangana state and sports meet at Visakhapatnam district, Andhra Pradesh State.
Kothapalli Village, Kothamunchur post, Valmikipuram mandal, Chittoor District of Andhra Pradesh,
Kowkuntla Village, Chevella Mandal of Telangana State.
2,130,910 2,130,910 106,470,455 Direct

Annual Report 2017-18 119118
Com
pany O
verviewS
tatutory R
epo
rtsFinancial S
tatements
`
Sl. No.
CSR Project or Activity identified Sector in which the Project is Covered
Projects or Programs (1) Local area or other (2) Specify the state and district where projects or programs was undertaken
Amount outlay (budget) project or programs wise
Amount spent on the projects or programssub heads:(1) Direct expenditure on projects or programs(2) Overheads
Cumulative expenditure upto the reporting period
Amount spent: Direct or through implementing agency
vi Aurobindo Pharma Foundation under Rural Development projects, provided funds for infrastructure facilities for laying /widening/repairing of roads in rural areas and construction of village sewage water drainage system. Construction of culverts for public purpose, laying of roads for welfare of farmers. Aurobindo Pharma Foundation has Adopted villages and done various development works. Under 'Haritha Haram' Program, planted trees and erected plastic tree guards and providing funds for monthly maintenance of plants. Provided funds towards skill development & employment enhancing programs for the rural youth and development of poor and marginal farmers. Towards safety of public, repaired and renovated Police Station. Provided funds to improve livelihood of 50 small farmers by installing solar fencing to protect crops from wild animals. Aurobindo Pharma Foundation has installed CC Cameras for public safety and also provided funds to "Sri Rama Jeeva Seva Sadan goshala" and goshala located at "Avadhana Saraswathi Peetham". Aurobindo Pharma Foundation has provided Solar street lights in rural areas, and also road stoppers for public safety purpose. Aurobindo Pharma Foundation has provided funds towards protection of rivers banks.
Rural Development Projects, Environmental Sustainability, ecological balance & conservation of natural resources & Animal Welfare.
Janwada, Reddy Khanapur, Chitkul, Paniyal, Nandigama Village, Gaddapotharam, Jadcherla, Borapatla, Polepally village, Hatnoora Mandal, Sangareddy District. Polepally village, Jadcherla mandal, Mahboobnagar district and at Nagar Kurnool district, Telangana State.
Kandivalassa gadda, Urvakonda, Pydibhimavaram and Parwada villages in Ananthapur, Srikakulam and Visakhapatnam Districts, Andhra Pradesh.
Adopted Borapatla village in sangareddy district, Telangana state and Peyalapalem village in Nellore district, Andhra Pradesh.
Skill development and medical camps in rural areas of Nalgonda district, Telangana state, and at Krishna District of Andhra Pradesh State.
Goshala at Avadhana Saraswathi Peetham, Madhapur, Hyderabad,Telangana State.
Provided 588 nos. of solar street lights at various villages in Pali District of Rajasthan State. 130 nos. of street lights at Nimmada village, Kotabommali mandal, Andhra Pradesh State.
61,696,048 61,696,048 168,166,503 Direct, and through NGO's "Green Revolution" "MAS", "Nava Chethana Vignana Samithi" "Consortium of Indian Farmer's Association". "Cornell Sathguru Foundation for Develop-ment" Direct.
vii Aurobindo Pharma Foundation has contributed towards old age home expansion and maintenance.
Setting up of Old age homes
Anadha Sharan Charitable Trust – Old Age home at K.V. Pally village, Chittoor district, Andhra Pradesh State.
Old Age Home at Sri Ganapathi Sachidananda Avadhoota Peetha Trust at Dundigal, Medchal Malkajgiri District, Telangana state.
1,500,000 1,500,000 169,666,503 Direct
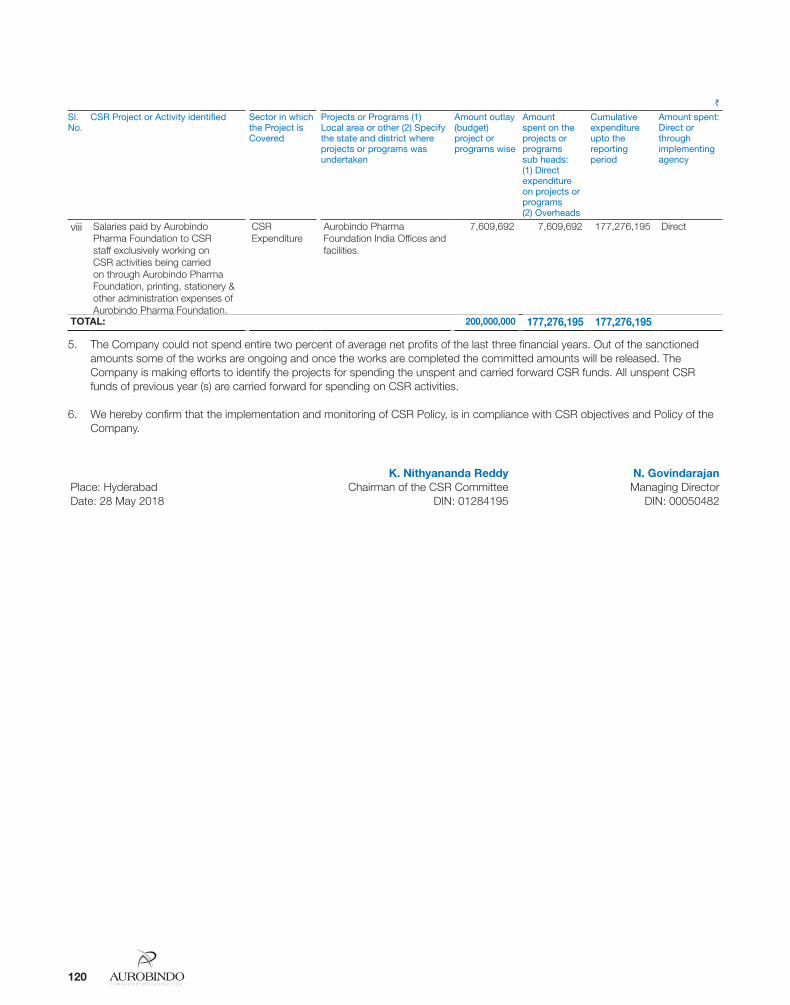
Annual Report 2017-18 121120
`
Sl. No.
CSR Project or Activity identified Sector in which the Project is Covered
Projects or Programs (1) Local area or other (2) Specify the state and district where projects or programs was undertaken
Amount outlay (budget) project or programs wise
Amount spent on the projects or programssub heads:(1) Direct expenditure on projects or programs(2) Overheads
Cumulative expenditure upto the reporting period
Amount spent: Direct or through implementing agency
viii Salaries paid by Aurobindo Pharma Foundation to CSR staff exclusively working on CSR activities being carried on through Aurobindo Pharma Foundation, printing, stationery & other administration expenses of Aurobindo Pharma Foundation.
CSR Expenditure
Aurobindo Pharma Foundation India Offices and facilities.
7,609,692 7,609,692 177,276,195 Direct
TOTAL: 200,000,000 177,276,195 177,276,195
5. The Company could not spend entire two percent of average net profits of the last three financial years. Out of the sanctioned amounts some of the works are ongoing and once the works are completed the committed amounts will be released. The Company is making efforts to identify the projects for spending the unspent and carried forward CSR funds. All unspent CSR funds of previous year (s) are carried forward for spending on CSR activities.
6. We hereby confirm that the implementation and monitoring of CSR Policy, is in compliance with CSR objectives and Policy of the Company.
K. Nithyananda Reddy N. GovindarajanPlace: Hyderabad Chairman of the CSR Committee Managing DirectorDate: 28 May 2018 DIN: 01284195 DIN: 00050482
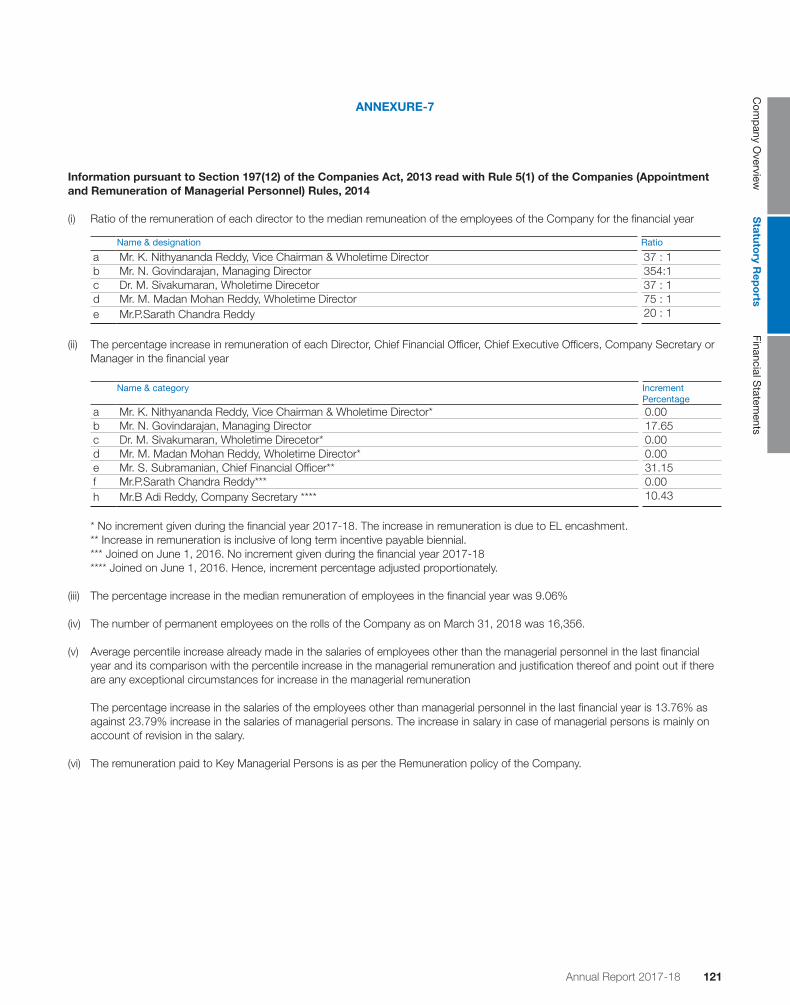
Annual Report 2017-18 121120
Com
pany O
verviewS
tatutory R
epo
rtsFinancial S
tatements
ANNEXURE-7
Information pursuant to Section 197(12) of the Companies Act, 2013 read with Rule 5(1) of the Companies (Appointment and Remuneration of Managerial Personnel) Rules, 2014
(i) Ratio of the remuneration of each director to the median remuneation of the employees of the Company for the financial year
Name & designation Ratio
a Mr. K. Nithyananda Reddy, Vice Chairman & Wholetime Director 37 : 1b Mr. N. Govindarajan, Managing Director 354:1c Dr. M. Sivakumaran, Wholetime Direcetor 37 : 1d Mr. M. Madan Mohan Reddy, Wholetime Director 75 : 1e Mr.P.Sarath Chandra Reddy 20 : 1
(ii) The percentage increase in remuneration of each Director, Chief Financial Officer, Chief Executive Officers, Company Secretary or Manager in the financial year
Name & category Increment Percentage
a Mr. K. Nithyananda Reddy, Vice Chairman & Wholetime Director* 0.00b Mr. N. Govindarajan, Managing Director 17.65c Dr. M. Sivakumaran, Wholetime Direcetor* 0.00d Mr. M. Madan Mohan Reddy, Wholetime Director* 0.00e Mr. S. Subramanian, Chief Financial Officer** 31.15f Mr.P.Sarath Chandra Reddy*** 0.00h Mr.B Adi Reddy, Company Secretary **** 10.43
* No increment given during the financial year 2017-18. The increase in remuneration is due to EL encashment.** Increase in remuneration is inclusive of long term incentive payable biennial.*** Joined on June 1, 2016. No increment given during the financial year 2017-18**** Joined on June 1, 2016. Hence, increment percentage adjusted proportionately.
(iii) The percentage increase in the median remuneration of employees in the financial year was 9.06%
(iv) The number of permanent employees on the rolls of the Company as on March 31, 2018 was 16,356.
(v) Average percentile increase already made in the salaries of employees other than the managerial personnel in the last financial year and its comparison with the percentile increase in the managerial remuneration and justification thereof and point out if there are any exceptional circumstances for increase in the managerial remuneration
The percentage increase in the salaries of the employees other than managerial personnel in the last financial year is 13.76% as against 23.79% increase in the salaries of managerial persons. The increase in salary in case of managerial persons is mainly on account of revision in the salary.
(vi) The remuneration paid to Key Managerial Persons is as per the Remuneration policy of the Company.

Annual Report 2017-18 123122
Statement of particulars of employees pursuant to the provisions of Rule (5) of the Companies (Appointment and Remuneration of Managerial Personnel) Rules, 2014
Financial Year 2017-18
Top 10 employees in terms of remuneration drawn during the financial year
S No Name & designation Designation Remuneration Received (`Million)
Qualification & Experience
Date of Commencement of employment
Age (Years)
The last employment held by such employee before joining the Company;
1 Mr. N. Govindarajan Managing Director 146.27 B.E., 28 Years 7-Oct-10 50 Shasun Chemicals & Drugs Ltd.
2 Mr. Sanjeev Indravadan Dani
Chief Operating Officer-Head Formulations
32.12 B.Pharm., M.B.A., 34 Years
9-Jul-15 58 Ranbaxy Laboratories Ltd.
3 Dr. V. K. Handa President - Chemical Research
29.70 Ph.D, 35 Years 1-Jan-99 66 Ranbaxy Research Laboratories
4 Mr. M. Madan Mohan Reddy
Wholetime Director 26.74 M.Sc, 28 Years 27-May-03 58 Ranit Pharma Limited
5 Mr. V. Naga Prasad President-FRD 21.47 M.Pharm., 26 Years
16-Mar-06 51 Ranbaxy Research Laboratories
6 Dr. A. Rama Mohana Rao
President -Corporate QA
21.47 Ph.D, 30 Years 7-May-01 56 Biological E Limited
7 Dr. S Vijaya Kumar President-Technical 17.00 M.Tech., Ph.D, 29 Years
2-Nov-16 52 Jubilant Generics Ltd.,
8 Dr. A. T. Bapuji Associate President-CPD-BIO
16.61 Ph.D, 26 Years 25-Oct-04 51 Ranbaxy Research Laboratories
9 Mr. Atul Sadashiv Shastri
Associate President-Operations
15.88 M.Pharm., 28 Years
8-Dec-14 52 Ranbaxy Laboratories Ltd.
10 Dr. Hemant Kumar Sharma
Associate President-Analytical Research
15.76 Ph.D, 24 Years 14-Jul-00 50 Ranbaxy Research Laboratories
Employees drawing a remuneration of `1.02 crore or above per annum
S No Name & designation Designation Remuneration Received (`Million)
Qualification & Experience
Date of Commencement of employment
Age (Years)
The last employment held by such employee before joining the Company;
1 Mr. K. Nithyananda Reddy
Vice Chairman & Wholetime Director
15.12 M.Sc, 31 years 1-Jan-89 60 Tini Pharma Ltd.
2 Dr. M. Sivakumaran Wholetime Director 15.12 M.Sc, Ph.D., 45 Years
1-Jan-89 75 TTK Pharma Ltd.
3 Mr. S. Subramanian Chief Financial Officer 14.27 B.Sc., ACA, ACS, AICWA, 32 Years
1-Nov-13 57 RSB Global, Pune
4 Dr. Gita Rao Associate President-RAD- II
13.56 Ph.D, 21 Years 1-Jan-04 51 Lupin Limited,
5 Dr. Makkapati Satakarni
President-Biologics 12.71 Ph.D, 11 Years 3-Feb-16 37 Intas Pharma
6 Mr. G. Bhaskar Reddy Vice President -Operations
11.43 B.Pharm., 22 Years
8-Jun-95 47 Rhonac Lab Pvt Ltd.,
7 Mr. I.V.S.S. Prasad Vice President -Operations
11.17 B.Sc., 30 Years 2-Nov-11 52 Hetero Drugs Limited
8 Mr. Sudhanshu Radhakrishna Kamat
Vice President-Business Development
10.62 B.Com., 27 Years
1-Feb-16 53 Mylan Laboratories
9 Mr. Medisetti V Rama Krishna
Vice President -Operations
10.38 B.E., 24 Years 12-Aug-16 48 Dr. Reddy's Laboratories Ltd.,
10 Mr. Sudhir B Singhi Head-Global Finance Operations
10.17 B.Com., C.A., I.C.W.A.I. 29 Years
23-Mar-05 49 Procon Financials and Investiments Pvt Ltd

Annual Report 2017-18 123122
Com
pany O
verviewS
tatutory R
epo
rtsFinancial S
tatements
Employed for part of the year with average salary abvoe `8.5 lakhs per month.
S No Name & designation Designation Remuneration Received (`Million)
Qualification & Experience
Date of Commencement of employment
Age (Years)
The last employment held by such employee before joining the Company;
1 Mr. Satnam Singh Loomba
Senior Vice President - Operations
9.50 B.Tech., 27 Years
1-Dec-15 50 Sun Pharmaceutical Industries Ltd
2 Mr. D Surya Narayana Vice President-Process Development
6.83 Ph.D, 31 Years 16-Aug-17 47 Mylan Laboratories
3 Mr. Ashok Kumar Saxena
Senior Vice President - Operations
5.08 B.Pharm., P.G.D.M., 26 Years
17-Dec-15 48 Shaline Healthcare, Dubai
Note: 1. Gross Remuneration includes salary, taxable allowances, commission, value of perquisites as per the Income Tax Rules, 1962 and Company contribution to Providend fund.
2. Nature of employment and duties: Contractual and in accordance with the terms and conditions as per Company's rules.
3. No employee is a relative of any Director or Key Managerial Personnel of the Company except Mr. K. Nithyananda Reddy, who is relative of Mr.P.Sarath Chandra Reddy, Director of the Company.
4. The percentage of equity shares hedl by each of the employee in the Company within the meaning of clause (III) of sub-rule(2) of Rule 5 is not applicable.
For and on behalf of the Board
Place: Hyderabad K. RagunathanDate: 28 May 2018 Chairman
DIN: 00523576
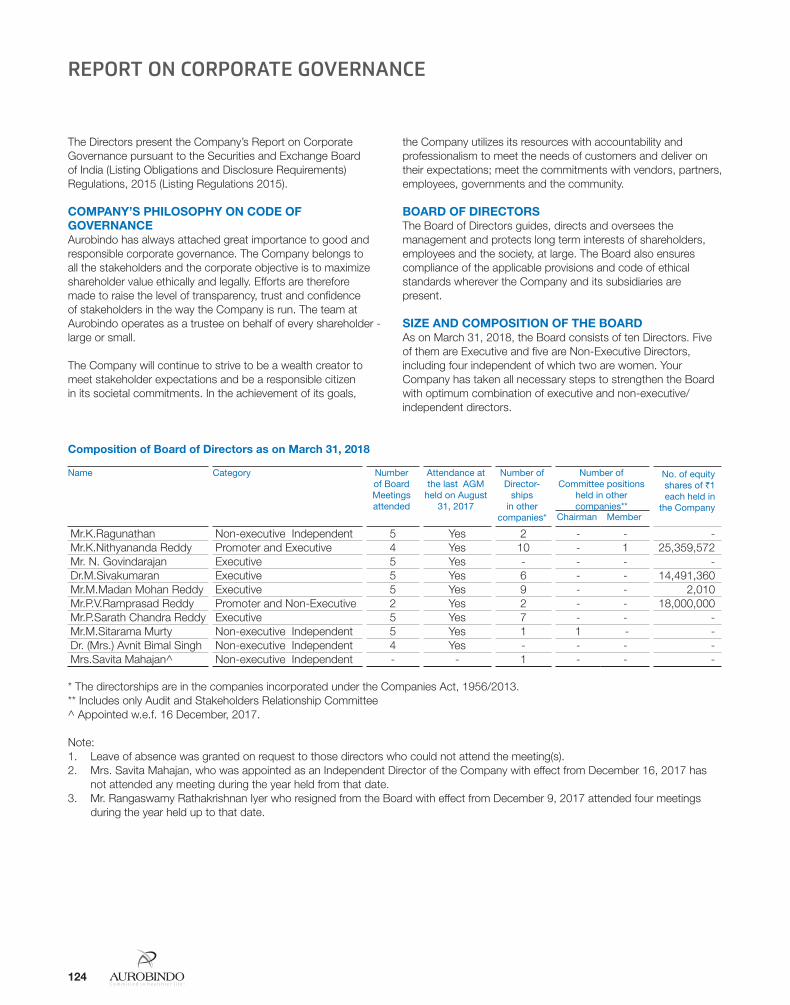
Annual Report 2017-18 125124
REPORT ON CORPORATE GOVERNANCE
The Directors present the Company’s Report on Corporate Governance pursuant to the Securities and Exchange Board of India (Listing Obligations and Disclosure Requirements) Regulations, 2015 (Listing Regulations 2015).
COMPANY’S PHILOSOPHY ON CODE OF GOVERNANCEAurobindo has always attached great importance to good and responsible corporate governance. The Company belongs to all the stakeholders and the corporate objective is to maximize shareholder value ethically and legally. Efforts are therefore made to raise the level of transparency, trust and confidence of stakeholders in the way the Company is run. The team at Aurobindo operates as a trustee on behalf of every shareholder - large or small.
The Company will continue to strive to be a wealth creator to meet stakeholder expectations and be a responsible citizen in its societal commitments. In the achievement of its goals,
the Company utilizes its resources with accountability and professionalism to meet the needs of customers and deliver on their expectations; meet the commitments with vendors, partners, employees, governments and the community.
BOARD OF DIRECTORSThe Board of Directors guides, directs and oversees the management and protects long term interests of shareholders, employees and the society, at large. The Board also ensures compliance of the applicable provisions and code of ethical standards wherever the Company and its subsidiaries are present.
SIZE AND COMPOSITION OF THE BOARDAs on March 31, 2018, the Board consists of ten Directors. Five of them are Executive and five are Non-Executive Directors, including four independent of which two are women. Your Company has taken all necessary steps to strengthen the Board with optimum combination of executive and non-executive/independent directors.
Composition of Board of Directors as on March 31, 2018
Name Category Number of Board Meetings attended
Attendance at the last AGM
held on August 31, 2017
Number of Director-
ships in other
companies*
Number of Committee positions
held in other companies**
No. of equity shares of `1 each held in
the CompanyChairman Member
Mr.K.Ragunathan Non-executive Independent 5 Yes 2 - - -Mr.K.Nithyananda Reddy Promoter and Executive 4 Yes 10 - 1 25,359,572Mr. N. Govindarajan Executive 5 Yes - - - -Dr.M.Sivakumaran Executive 5 Yes 6 - - 14,491,360 Mr.M.Madan Mohan Reddy Executive 5 Yes 9 - - 2,010Mr.P.V.Ramprasad Reddy Promoter and Non-Executive 2 Yes 2 - - 18,000,000Mr.P.Sarath Chandra Reddy Executive 5 Yes 7 - - -Mr.M.Sitarama Murty Non-executive Independent 5 Yes 1 1 - -Dr. (Mrs.) Avnit Bimal Singh Non-executive Independent 4 Yes - - - -Mrs.Savita Mahajan^ Non-executive Independent - - 1 - - -
* The directorships are in the companies incorporated under the Companies Act, 1956/2013.** Includes only Audit and Stakeholders Relationship Committee^ Appointed w.e.f. 16 December, 2017.
Note: 1. Leave of absence was granted on request to those directors who could not attend the meeting(s).2. Mrs. Savita Mahajan, who was appointed as an Independent Director of the Company with effect from December 16, 2017 has
not attended any meeting during the year held from that date.3. Mr. Rangaswamy Rathakrishnan Iyer who resigned from the Board with effect from December 9, 2017 attended four meetings
during the year held up to that date.
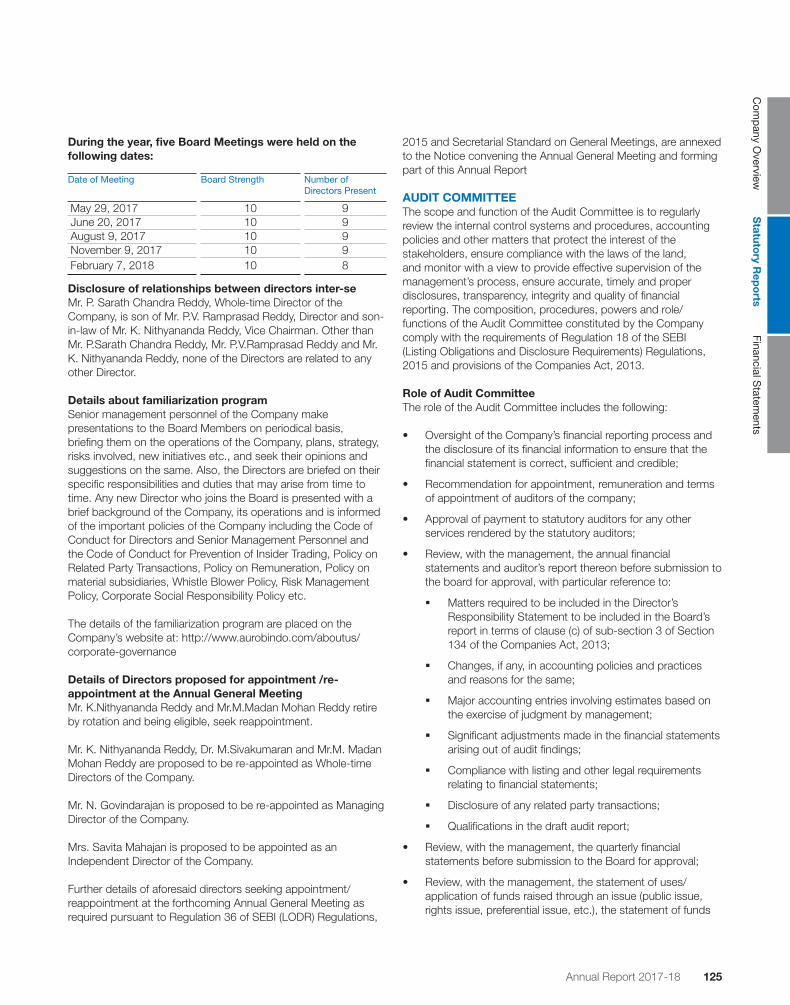
Annual Report 2017-18 125124
Com
pany O
verviewS
tatutory R
epo
rtsFinancial S
tatements
During the year, five Board Meetings were held on the following dates:
Date of Meeting Board Strength Number of Directors Present
May 29, 2017 10 9June 20, 2017 10 9August 9, 2017 10 9November 9, 2017 10 9February 7, 2018 10 8
Disclosure of relationships between directors inter-seMr. P. Sarath Chandra Reddy, Whole-time Director of the Company, is son of Mr. P.V. Ramprasad Reddy, Director and son-in-law of Mr. K. Nithyananda Reddy, Vice Chairman. Other than Mr. P.Sarath Chandra Reddy, Mr. P.V.Ramprasad Reddy and Mr. K. Nithyananda Reddy, none of the Directors are related to any other Director.
Details about familiarization programSenior management personnel of the Company make presentations to the Board Members on periodical basis, briefing them on the operations of the Company, plans, strategy, risks involved, new initiatives etc., and seek their opinions and suggestions on the same. Also, the Directors are briefed on their specific responsibilities and duties that may arise from time to time. Any new Director who joins the Board is presented with a brief background of the Company, its operations and is informed of the important policies of the Company including the Code of Conduct for Directors and Senior Management Personnel and the Code of Conduct for Prevention of Insider Trading, Policy on Related Party Transactions, Policy on Remuneration, Policy on material subsidiaries, Whistle Blower Policy, Risk Management Policy, Corporate Social Responsibility Policy etc.
The details of the familiarization program are placed on the Company’s website at: http://www.aurobindo.com/aboutus/corporate-governance
Details of Directors proposed for appointment /re-appointment at the Annual General MeetingMr. K.Nithyananda Reddy and Mr.M.Madan Mohan Reddy retire by rotation and being eligible, seek reappointment.
Mr. K. Nithyananda Reddy, Dr. M.Sivakumaran and Mr.M. Madan Mohan Reddy are proposed to be re-appointed as Whole-time Directors of the Company.
Mr. N. Govindarajan is proposed to be re-appointed as Managing Director of the Company.
Mrs. Savita Mahajan is proposed to be appointed as an Independent Director of the Company.
Further details of aforesaid directors seeking appointment/reappointment at the forthcoming Annual General Meeting as required pursuant to Regulation 36 of SEBI (LODR) Regulations,
2015 and Secretarial Standard on General Meetings, are annexed to the Notice convening the Annual General Meeting and forming part of this Annual Report
AUDIT COMMITTEEThe scope and function of the Audit Committee is to regularly review the internal control systems and procedures, accounting policies and other matters that protect the interest of the stakeholders, ensure compliance with the laws of the land, and monitor with a view to provide effective supervision of the management’s process, ensure accurate, timely and proper disclosures, transparency, integrity and quality of financial reporting. The composition, procedures, powers and role/functions of the Audit Committee constituted by the Company comply with the requirements of Regulation 18 of the SEBI (Listing Obligations and Disclosure Requirements) Regulations, 2015 and provisions of the Companies Act, 2013.
Role of Audit CommitteeThe role of the Audit Committee includes the following:
• Oversight of the Company’s financial reporting process and the disclosure of its financial information to ensure that the financial statement is correct, sufficient and credible;
• Recommendation for appointment, remuneration and terms of appointment of auditors of the company;
• Approval of payment to statutory auditors for any other services rendered by the statutory auditors;
• Review, with the management, the annual financial statements and auditor’s report thereon before submission to the board for approval, with particular reference to:
� Matters required to be included in the Director’s Responsibility Statement to be included in the Board’s report in terms of clause (c) of sub-section 3 of Section 134 of the Companies Act, 2013;
� Changes, if any, in accounting policies and practices and reasons for the same;
� Major accounting entries involving estimates based on the exercise of judgment by management;
� Significant adjustments made in the financial statements arising out of audit findings;
� Compliance with listing and other legal requirements relating to financial statements;
� Disclosure of any related party transactions;
� Qualifications in the draft audit report;
• Review, with the management, the quarterly financial statements before submission to the Board for approval;
• Review, with the management, the statement of uses/ application of funds raised through an issue (public issue, rights issue, preferential issue, etc.), the statement of funds

Annual Report 2017-18 127126
utilized for purposes other than those stated in the offer document/prospectus/notice and the report submitted by the monitoring agency monitoring the utilization of proceeds of a public or rights issue, and making appropriate recommendations to the Board to take up steps in this matter;
• Review and monitor the auditor’s independence and performance, and effectiveness of audit process;
• Approval or any subsequent modification of transactions of the company with related parties;
• Scrutiny of inter-corporate loans and investments;
• Valuation of undertakings or assets of the company, wherever it is necessary;
• Evaluation of internal financial controls and risk management systems;
• Review, with the management, performance of statutory and internal auditors, adequacy of the internal financial control systems;
• Review the adequacy of internal audit function, if any, including the structure of the internal audit department, staffing and seniority of the official heading the department, reporting structure coverage and frequency of internal audit;
• Discussion with internal auditors of any significant findings and follow up there on;
• Review the findings of any internal investigations by the internal auditors into matters where there is suspected fraud or irregularity or a failure of internal control systems of a material nature and reporting the matter to the board;
• Discussion with statutory auditors before the audit commences, about the nature and scope of audit as well as post-audit discussion to ascertain any area of concern;
• Examine into the reasons for substantial defaults in the payment to the depositors, debenture holders, shareholders (in case of non-payment of declared dividends) and creditors;
• Review the functioning of the Whistle Blower mechanism;
• Approval of appointment of CFO (i.e. the whole-time finance director or any other person heading the finance function or discharging that function) after assessing the qualifications, experience and background, etc. of the candidate;
• Carry out any other function as is mentioned in the terms of reference of the Audit Committee under Securities Exchange Board of India (Listing Obligations and Disclosure Requirements) Regulations and Companies Act, 2013.
• To review:
� Management discussion and analysis of financial condition and results of operations;
� Adequacy of internal control systems and the Company’s statement on the same prior to
endorsement by the Board, such review to be done in consultation with the management, Statutory and Internal Auditors;
� Reports of Internal Audit and discussion with Internal Auditors on any significant findings and follow-up thereon;
� System for storage, retrieval, security etc. of books of account maintained in the electronic form;
� Functioning of Whistle Blower mechanism in the Company.
Composition and other details of Audit CommitteeThe Audit Committee comprises of three Non-Executive Directors, all of them being independent directors. The heads of finance & accounts, internal auditors and the representative of the statutory auditors are invitees to the meetings of the Audit Committee. The Company Secretary is the Secretary to the Committee.
Mr. M. Sitarama Murty, Chairman of the Committee, is a Non-Executive, Independent Director having expertise in accounting and financial management. Mr. K.Ragunathan and Mr.Rangaswamy Rathakrishnan Iyer (up to December 9, 2017) and Mrs.Savita Mahajan (w.e.f. December 16, 2017) are the members of the Committee.
During the year, the Audit Committee met six times on May 29, 2017; June 20, 2017; August 9, 2017; November 9, 2017; February 7, 2018 and March 28, 2018.
The attendance at the Audit Committee meetings during the financial year 2017-18 is as under:
Name of the Committee Member
No. of Meetings held during his/her tenure
Attended
Mr. M Sitarama Murty 6 6Mr. K.Ragunathan 6 6Mr. Rangaswamy Rathakrishnan Iyer1
4 4
Mrs. Savita Mahajan2 2 1
Note: 1. Mr. Rangaswamy Rathakrishnan Iyer ceased to be member w.e.f. December 9, 2017. He attended four meetings held during his tenure.
2. Mrs Savita Mahajan was appointed as a member of Audit Committee with effect from December 16, 2017. She attended one meeting held after her appointment.
NOMINATION AND REMUNERATION / COMPENSATION COMMITTEEBrief description of terms of reference of the Nomination and Remuneration/Compensation Committee
• Identifying persons who are qualified to become directors

Annual Report 2017-18 127126
Com
pany O
verviewS
tatutory R
epo
rtsFinancial S
tatements
and who may be appointed in senior management in accordance with the criteria laid down and recommend to the Board their appointment and removal;
• Carry out evaluation of every director’s performance;
• Formulation of the criteria for determining qualifications, positive attributes and independence of a director;
• Recommend to the Board a policy, relating to the remuneration for the directors, key managerial personnel and other employees;
• Formulation of the criteria for evaluation of Independent Directors and the Board;
• Devising a policy on Board diversity;
• Grant of options to eligible employees and administering the employee stock option scheme of the Company;
• Any other matter as the Board may decide from time to time.
Composition and other details of Nomination and Remuneration/Compensation CommitteeThe composition of the Nomination and Remuneration/Compensation Committee comprises of three Non-Executive Directors; all of them are independent directors.
Dr. (Mrs) Avnit Bimal Singh is the Chairperson of the Committee and Mr.M.Sitarama Murty, and Mr.K.Ragunathan are other Members of the Committee. During the year, the Nomination and Remuneration/Compensation Committee met two times on May 29, 2017 and March 28, 2018.
Meetings and attendance during the yearThe attendance at the Nomination and Remuneration/Compensation Committee meetings during the financial year 2017-18 is as under:
Name of the Committee Member
No. of Meetings held during his / her tenure
Attended
Dr.(Mrs.) Avnit Bimal Singh
2 2
Mr. M Sitarama Murty 2 2Mr. K.Ragunathan 2 2
Nomination/Remuneration PolicyThe compensation of the Executive Directors comprises of fixed component, perquisites and commission. The compensation is determined based on the remuneration prevailing in the industry and the performance of the Company. The remuneration package of the Executive Directors is periodically reviewed and suitable revision is recommended to the Board by the Committee. The Non-Executive Directors are paid sitting fees for attending meetings of Board/Committee.
The nomination and remuneration policy as adopted by the Board is placed on the Company’s website at: http://www.aurobindo.com/about-us/corporate-governance
Performance evaluation criteria for independent directorsThe performance evaluation shall be done on an annual basis. Each Director shall be provided an evaluation sheet in the form of questionnaire. The ratings shall be provided by all the Directors except the Independent Director being evaluated.
On the basis of the report of performance evaluation, it shall be determined by the Nomination and Remuneration/Compensation Committee and Board whether to extend or continue the term of appointment of Independent Director subject to all other applicable provisions.
REMUNERATION OF DIRECTORSDetails of remuneration paid to the Directors during the financial year 2017-18 are as follows:
a. Executive Directors (`)
Name Salary Benefits (Perquisites)
Bonus Pension Commission Contribution to P.F.
Total
Mr. K.Nithyananda Reddy 12,999,996 2,100,004 - - - 21,600 15,121,600Dr. M.Sivakumaran 12,999,996 2,100,004 - - - 21,600 15,121,600Mr. M.Madan Mohan Reddy 22,999,992 3,715,381 - - - 21,600 26,736,973Mr. N. Govindarajan 38,718,792 7,535,771 - - 100,000,000 21,600 146,276,163Mr. P.Sarath Chandra Reddy 7,500,000 750,000 - - - 21,600 8,271,600 Total 95,218,776 16,201,160 - - 100,000,000 108,000 211,527,936
Mr. K.Nithyananda Reddy, Dr. M.Sivakumaran, Mr. M.Madan Mohan Reddy and Mr. N. Govindarajan were re-appointed as executive directors w.e.f June 01, 2015 for a period of 3 years and Mr. P.Sarath Chandra Reddy was appointed as an executive director w.e.f June 01, 2016 for a period of 3 years on the terms and conditions contained in the respective resolutions passed by the Members in the General Meetings. The Notice period is as per the rules of the Company. There was no severance fee.

Annual Report 2017-18 129128
Mr. N. Govindarajan, Managing Director was granted options under Employee Stock Option Plan (ESOP) of the Company and all the options were vested and exercised during the year 2016-17. No other directors were granted options under ESOP.
b. Non-Executive DirectorsThere were no pecuniary transactions with any non-executive director of the Company.
Non-Executive Directors are paid Sitting Fee for attending the Board and Committee Meetings. Sitting fee of `100,000 is being paid to Non-Executive Directors for attending each meeting of the Board of Directors and `50,000 for each meeting of the Committees of Board of Directors. During the year, the sitting fees paid was as follows:
Name Sitting fee (`)
Mr.M.Sitarama Murty 1,050,000 Mr.K.Ragunathan 1,000,000 Dr.(Mrs.) Avnit Bimal Singh 550,000Mr.P.V. Ramprasad Reddy 200,000Mr. Rangaswamy Rathakrishnan Iyer (up to December 9, 2017) 600,000Mrs. Savita Mahajan (w.e.f December 16, 2017) 100,000
STAKEHOLDERS RELATIONSHIP COMMITTEECompositionDr. (Mrs) Avnit Bimal Singh, a Non-Executive Independent Director is the Chairperson of the Committee and Mr. K. Nithyananda Reddy, Mr. M. Madan Mohan Reddy and Mr. P. Sarath Chandra Reddy are the other members of the Committee.
Terms of referenceStakeholders Relationship Committee considers and resolves all matters of the grievances of the security holders of the Company including complaints related to transfer of shares, non-receipt of annual reports, dividends, issue of duplicate share certificates etc.
Name and designation of Compliance OfficerMr. B.Adi Reddy, Company Secretary
E-mail ID for investor grievances: [email protected]
Investor ComplaintsDuring the year ended March 31, 2018, the Company has received and resolved 31 complaints from investors. Number of complaints not resolved to the satisfaction of shareholders is nil and there were no pending complaints at the year end.
CORPORATE SOCIAL RESPONSIBILITY COMMITTEEAs per the Companies Act, 2013, the Company is required to constitute a Corporate Social Responsibility (CSR) Committee of the Board consisting of three or more directors, at least one of whom will be an independent director. The constitution of CSR Committee is as under:
Mr. K. Nithyananda Reddy, Chairman
Mr. K. Ragunathan, Member
Dr. M. Sivakumaran, Member
Mr. P. Sarath Chandra Reddy, Member
The purpose of the Committee is to formulate CSR Policy of the Company and monitor its implementation.
The CSR Policy has been placed on the Company’s website at: http://www.aurobindo.com/about-us/corporate-governance.
Annual report on the CSR activities of the Company during the year is also placed on the Company’s website at: http://www.aurobindo.com/social-responsibility/csr-activities.
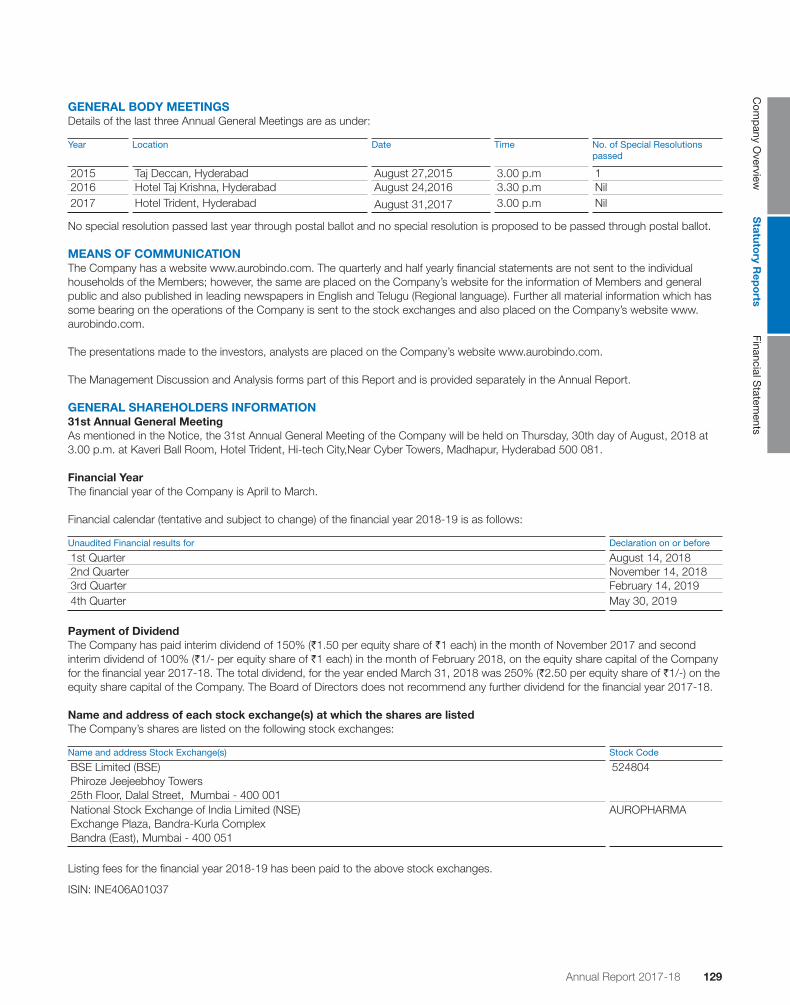
Annual Report 2017-18 129128
Com
pany O
verviewS
tatutory R
epo
rtsFinancial S
tatements
GENERAL BODY MEETINGSDetails of the last three Annual General Meetings are as under:
Year Location Date Time No. of Special Resolutions passed
2015 Taj Deccan, Hyderabad August 27,2015 3.00 p.m 12016 Hotel Taj Krishna, Hyderabad August 24,2016 3.30 p.m Nil2017 Hotel Trident, Hyderabad August 31,2017 3.00 p.m Nil
No special resolution passed last year through postal ballot and no special resolution is proposed to be passed through postal ballot.
MEANS OF COMMUNICATIONThe Company has a website www.aurobindo.com. The quarterly and half yearly financial statements are not sent to the individual households of the Members; however, the same are placed on the Company’s website for the information of Members and general public and also published in leading newspapers in English and Telugu (Regional language). Further all material information which has some bearing on the operations of the Company is sent to the stock exchanges and also placed on the Company’s website www.aurobindo.com.
The presentations made to the investors, analysts are placed on the Company’s website www.aurobindo.com.
The Management Discussion and Analysis forms part of this Report and is provided separately in the Annual Report.
GENERAL SHAREHOLDERS INFORMATION31st Annual General MeetingAs mentioned in the Notice, the 31st Annual General Meeting of the Company will be held on Thursday, 30th day of August, 2018 at 3.00 p.m. at Kaveri Ball Room, Hotel Trident, Hi-tech City,Near Cyber Towers, Madhapur, Hyderabad 500 081.
Financial YearThe financial year of the Company is April to March.
Financial calendar (tentative and subject to change) of the financial year 2018-19 is as follows:
Unaudited Financial results for Declaration on or before
1st Quarter August 14, 20182nd Quarter November 14, 20183rd Quarter February 14, 20194th Quarter May 30, 2019
Payment of DividendThe Company has paid interim dividend of 150% (`1.50 per equity share of `1 each) in the month of November 2017 and second interim dividend of 100% (`1/- per equity share of `1 each) in the month of February 2018, on the equity share capital of the Company for the financial year 2017-18. The total dividend, for the year ended March 31, 2018 was 250% (`2.50 per equity share of `1/-) on the equity share capital of the Company. The Board of Directors does not recommend any further dividend for the financial year 2017-18.
Name and address of each stock exchange(s) at which the shares are listedThe Company’s shares are listed on the following stock exchanges:
Name and address Stock Exchange(s) Stock Code
BSE Limited (BSE)Phiroze Jeejeebhoy Towers25th Floor, Dalal Street, Mumbai - 400 001
524804
National Stock Exchange of India Limited (NSE)Exchange Plaza, Bandra-Kurla ComplexBandra (East), Mumbai - 400 051
AUROPHARMA
Listing fees for the financial year 2018-19 has been paid to the above stock exchanges.
ISIN: INE406A01037
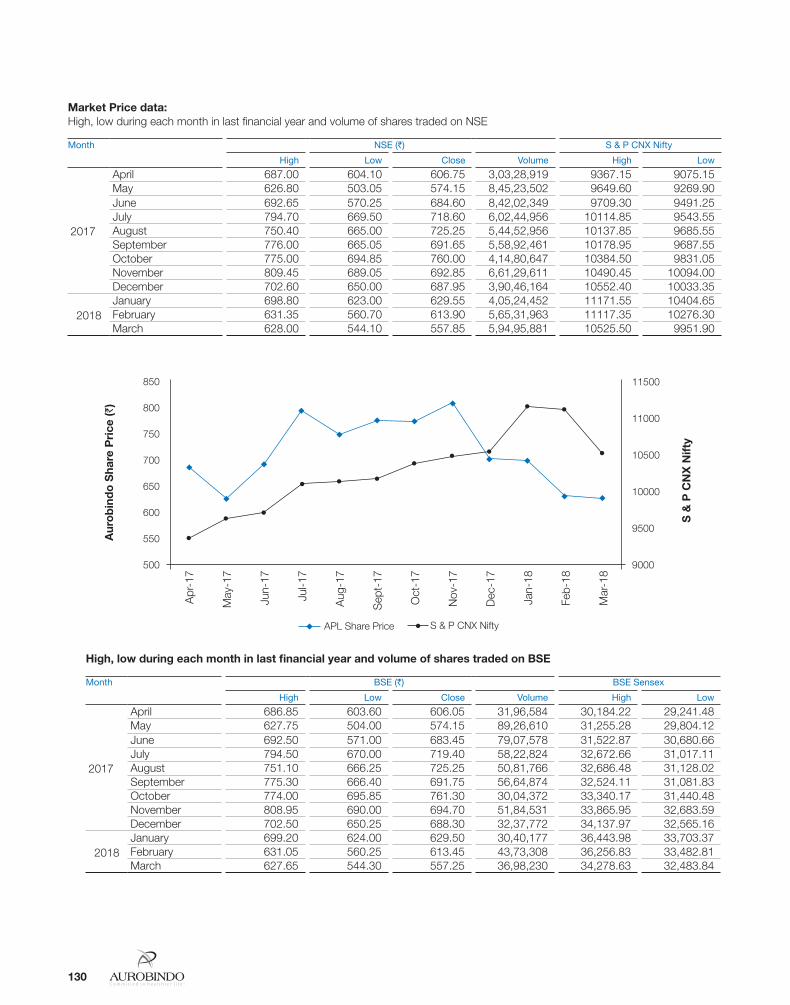
Annual Report 2017-18 131130
Market Price data:High, low during each month in last financial year and volume of shares traded on NSE
Month NSE (`) S & P CNX Nifty
High Low Close Volume High Low
2017
April 687.00 604.10 606.75 3,03,28,919 9367.15 9075.15May 626.80 503.05 574.15 8,45,23,502 9649.60 9269.90June 692.65 570.25 684.60 8,42,02,349 9709.30 9491.25July 794.70 669.50 718.60 6,02,44,956 10114.85 9543.55August 750.40 665.00 725.25 5,44,52,956 10137.85 9685.55September 776.00 665.05 691.65 5,58,92,461 10178.95 9687.55October 775.00 694.85 760.00 4,14,80,647 10384.50 9831.05November 809.45 689.05 692.85 6,61,29,611 10490.45 10094.00December 702.60 650.00 687.95 3,90,46,164 10552.40 10033.35
2018January 698.80 623.00 629.55 4,05,24,452 11171.55 10404.65February 631.35 560.70 613.90 5,65,31,963 11117.35 10276.30March 628.00 544.10 557.85 5,94,95,881 10525.50 9951.90
High, low during each month in last financial year and volume of shares traded on BSE
Month BSE (`) BSE Sensex
High Low Close Volume High Low
2017
April 686.85 603.60 606.05 31,96,584 30,184.22 29,241.48May 627.75 504.00 574.15 89,26,610 31,255.28 29,804.12June 692.50 571.00 683.45 79,07,578 31,522.87 30,680.66July 794.50 670.00 719.40 58,22,824 32,672.66 31,017.11August 751.10 666.25 725.25 50,81,766 32,686.48 31,128.02September 775.30 666.40 691.75 56,64,874 32,524.11 31,081.83October 774.00 695.85 761.30 30,04,372 33,340.17 31,440.48November 808.95 690.00 694.70 51,84,531 33,865.95 32,683.59December 702.50 650.25 688.30 32,37,772 34,137.97 32,565.16
2018January 699.20 624.00 629.50 30,40,177 36,443.98 33,703.37February 631.05 560.25 613.45 43,73,308 36,256.83 33,482.81March 627.65 544.30 557.25 36,98,230 34,278.63 32,483.84
Apr
-17
850 11500
80011000
750
10500700
10000650
9500
600
550
500 9000
APL Share Price S & P CNX Nifty
May
-17
Jun-
17
Jul-1
7
Aug
-17
Sep
t-17
Oct
-17
Nov
-17
Dec
-17
Jan-
18
Feb-
18
Mar
-18
S &
P C
NX
Nift
y
Aur
ob
ind
o S
hare
Pri
ce (`
)

Annual Report 2017-18 131130
Com
pany O
verviewS
tatutory R
epo
rtsFinancial S
tatements
There was no suspension of trading in Securities of the Company during the year under review.
Registrar to an issue and share transfer agentsM/s. Karvy Computershare Private Limited is the Registrar & Share Transfer Agent and Depository Transfer Agent of the Company. Any request pertaining to investor relations may be forwarded to them at the following address:
Ms. C. Shobha AnandKarvy Computershare Private LimitedUnit: Aurobindo Pharma LimitedKarvy Selenium, Tower B, Plot No.31-32,Gachibowli, Financial District, Nanakramguda,Hyderabad - 500 032Phone: +91 40 6716 2222 Fax: +91 40 2300 1153 E-mail: [email protected]
Share transfer system and dematerialization of shares and liquidityThe Company’s shares are covered under the compulsory dematerialization list and are transferable through the depository system. The Company has appointed M/s. Karvy Computershare Private Limited as its Registrar and Share Transfer Agent and also Depository Transfer Agent. Shares received for physical transfer are generally registered within a period of 15 days from the date of receipt, subject to fulfillment of other legal formalities. The Compliance Officer has been delegated the power to approve the share transfers and the information is placed to the Board in each meeting. Further, the Company has signed a tripartite agreement with NSDL/CDSL and M/s. Karvy Computershare Private Limited to facilitate dematerialization of shares. The Members may contact for the redressal of their grievances either M/s. Karvy Computershare Private Limited or to the Company Secretary, Aurobindo Pharma Limited. Further, SEBI has decided that securities of listed companies can be transferred only in dematerialized form, from a cut-off date, to be notified.
Distribution of shareholdingDistribution Schedule - As on March 31, 2018Category No. of
Shareholders% of No. of
shareholders Total Shares Amount (`) % of Amount
1-5000 222,358 99.09 34,556,785 34,556,785 5.905001- 10000 918 0.41 6,820,830 6,820,830 1.1710001- 20000 382 0.17 5,591,973 5,591,973 0.9520001- 30000 149 0.07 3,654,798 3,654,798 0.6230001- 40000 84 0.04 2,941,953 2,941,953 0.5040001- 50000 47 0.02 2,123,318 2,123,318 0.3650001- 100000 144 0.06 10,481,195 10,481,195 1.79100001& Above 313 0.14 519,736,757 519,736,757 88.71Total 224,395 100.00 585,907,609 585,907,609 100.00
Apr
-17
850 37,000.00
800
35,000.00
36,000.00
750
34,000.00
33,000.00
700
32,000.00
650
31,000.00
600
550
500 30,000.00
APL Share Price BSE Sensex
May
-17
Jun-
17
Jul-1
7
Aug
-17
Sep
t-17
Oct
-17
Nov
-17
Dec
-17
Jan-
18
Feb-
18
Mar
-18
BS
E S
ense
x
Aur
ob
ind
o S
hare
Pri
ce (
`)

Annual Report 2017-18 133132
Categories of shareholders as on March 31, 2018
Category No. of Shares %
Promoters & Directors 303,927,944 51.87NRIs/FPIs/Foreign Nationals 108,901,790 18.59FIs / Banks 1,542,088 0.26Mutual Funds 88,223,316 15.06Insurance companies 1,819,681 0.31Body corporates 1,699,511 0.29General public and others 79,793,279 13.62Total 585,907,609 100.00
Outstanding GDR/ADR/warrants or any convertible instruments, conversion date and likely impact on equity
The Company has not issued any GDR/ADR and there are no outstanding warrants or any convertible instruments.
Commodity Price Risk or Foreign Exchange risk and hedging activities
Detailed information on commodity price risk and foreign exchange risk has been provided under Management of Risks which forms part of this annual report. The Company has not undertaken any hedging activities for commodity price risk and foreign exchange risk.
Plant locations of manufacturing and R&D facilitiesUnit No Address
Unit-I Survey No.379, 385, 386, 388 to 396 & 269, Borpatla Village, Hatnoor Mandal, Sangareddy District, 502296, Telangana.
Unit-II Plot No.103/A & 104/A, SVCIE, Industrial Development Area, Bollaram, Jinnaram Mandal Sangareddy District, 500 092, Telangana.
Unit-III Survey No.313 & 314 Bachupally Village, Bachupally Mandal, Medchal Malkajgiri District, 500090, Telangana.Unit-IV Plot No.4 in Sy. No.151 and Plot Nos.34 to 48 in Sy. Nos. part of 146, 150, 151, 152, 153 and 154 situated in
Phase-III, TSIIC, EPIP, IDA, Pashamylaram, Pattahcneru Revenue Mandal , Sangareddy District 502307, Telangana.Unit-V Plot Nos.68 to 70, 73 to 91, 95, 96, 260 & 261, Industrial Development Area, Chemical Zone, Pashamylaram Village,
Patancheru Mandal, Sangareddy District, 502307, Telangana.Unit-VI Survey No. 329/39 & 329/47, Chitkul Village, Patancheru Mandal, Sangareddy District, 502307, Telangana.Unit-VII (SEZ) Sy.Nos.411/P, 425/P, 434/P, 435/P & 458/P, Plot No.S1/A, Special Economic Zone (Pharma), TSIIC, Green Industrial
Park, Polepally Village, Jedcherla Mandal, Mahaboob Nagar District, 509302, Telangana.Unit-VIII Survey No.10 & 13, Gaddapothram, Industrial Development Area – Kazipally Industrial Area, Jinnaram Mandal,
Sangareddy District, 502319, Telangana.Unit-IX Survey No.305, 369, 370, 371, 372, 373, 374& 377, Gundlamachanoor Village, Hatnoora Mandal, Sangareddy
District, 502296, Telangana.Unit-X * Plot No 16, APIIC, Multi product SEZ at Sy.No.3 (P) to 6(P) & 413(P) & 416(P) Palchur village and 113 Part of
Palepalem Village Naidupeta Mandal, PSR Nellore District 524126, Andhra Pradesh.Unit-XI Survey No. 52-78, of Pydibhimavaram Village, Survey No.2-11 & 29-32 of Chittivalasa Village Industrial
Development Area, Pydibhimavaram, Ranasthalam Mandal, Srikakulam District, 532409, Andhra PradeshUnit-XII Survey No.314, Bachupally Village, Bachupally Mandal, Medchal Malkajgiri District, 500090, Telangana.Unit - XIV JN Pharma City, Plot No. 17, Road No.10,11 & 19,20, E Bonangi Village, Parawada Mandal, Visakhapatnam District,
531021, Andhra Pradesh.Unit - XV JN Pharma City, Plot No. 17A, Road No.10,11 & 19,20, E Bonangi Village, Parawada Mandal, Visakhapatnam
District, 531021, Andhra Pradesh.Unit - XVI Plot No.S-5/B,S-6&S-7, Sy No.408 to 412,418 to 435,437 to 445,452 to 459, TSIIC,SEZ,Polepally-Village,
Jadcherla-Mandal, Mahaboob nagar-Dist, -509302 Telangana.Unit – XVII * Survey No.77 & 78, Indrakaran Village, Kandi Mandal, Sangareddy Dist, 502203, Telangana.Unit – XVIII * Survey No.69, 70, 71 & 72, Indrakaran Village, Kandi Mandal, Sangareddy Dist, 502203, Telangana.APLRC – I@ Survey No. 313 & 314, Bachupally Village, Bachupally Mandal, Medchal Malkajgiri District, 500090, Telangana. APLRC –II@ Survey No.71 & 72, Indrakaran Village, Kandi Mandal, Sangareddy Dist, 502203, Telangana.Bhiwadi Unit 1128, RIICO Phase–III, Bhiwadi – 301 019, Rajasthan (under sub lease to Auronext Pharma Private Limited, a wholly
owned subsidiary of the Company)
* Facilities under construction/development@ Research and Development Centers

Annual Report 2017-18 133132
Com
pany O
verviewS
tatutory R
epo
rtsFinancial S
tatements
OTHER DISCLOSURESRelated Party TransactionsNo transaction of material nature has been entered into by the Company with its Directors/management and their relatives, etc. that may have a potential conflict with the interests of the Company. The Register of Contracts containing transactions, in which Directors are interested, is placed before the Board regularly.
Transactions with related parties are disclosed in the Notes to Accounts in the Annual Report.In terms of SEBI (Listing Obligations and Disclosure Requirements) Regulations, 2015, the Audit Committee and Board of Directors of the Company have adopted a policy to determine Related Party Transactions. The policy is placed on the Company’s website at: http://www.aurobindo.com/about-us/corporate-governance
Details of Non-Compliance and PenaltiesThere were no instances of non-compliance or penalties/strictures by the stock exchanges/SEBI/statutory authorities on any matter related to capital markets during the last three years.
Details of establishment of Vigil Mechanism (Whistle Blower policy)The Board of Directors of the Company had adopted the Whistle Blower policy. The Company has established a mechanism for employees to report to the management, concerns about unethical behavior, actual or suspected fraud or violation of the Company’s code of conduct or ethics. The employees have been appropriately communicated within the organization about the mechanism and have been provided direct access to the Chairman of the Audit Committee. The mechanism also lays emphasis on making enquiry into whistle blower complaint received by the Company. The Audit Committee reviews periodically the functioning of whistle blower mechanism. No employee has been denied access to the Audit Committee. A
copy of the Whistle Blower Policy is hosted on the Company’s website at http://www.aurobindo.com/about-us/corporate-governance
Details of compliance with mandatory requirements and adoption of the non-mandatory requirementsThe Company has complied with all the mandatory requirements of Corporate Governance as per Securities and Exchange Board of India (Listing Obligations and Disclosure Requirements) Regulations, 2015 and is in the process of implementation of non-mandatory requirements.
Policy on Material SubsidiariesIn terms of the SEBI (Listing Obligations and Disclosure Requirements) Regulations, 2015, the Board of Directors of the Company has adopted a policy with regard to determination of material subsidiaries. The policy is placed on the Company’s website: http://www.aurobindo.com/about-us/corporate-governance
Non-compliance of any requirement of corporate governance report of sub-paras (2) to (10) of Schedule-VThe Company has complied with the requirements of corporate governance report of sub-paras (2) to (10) of Schedule-V of the Securities and Exchange Board of India (Listing Obligations and Disclosure Requirements) Regulations, 2015
Adoption of discretionary requirements as specified in Part E of Schedule II of the Securities and Exchange Board of India (Listing Obligations and Disclosure Requirements) Regulations, 2015With regard to discretionary requirements, the Company has adopted clauses relating to the following:
Separate persons were appointed for the post of Chairman and Managing Director and Internal Auditors report directly to the Audit Committee.
Address for correspondence:
Registered Office Corporate Office Name & Designation of Compliance Officer
Aurobindo Pharma Limited(CIN - L24239TG1986PLC015190)Plot No.2, Maitrivihar, AmeerpetHyderabad - 500 038, TelanganaPhone : +91 40 2373 6370Fax : +91 40 2374 7340E-mail : [email protected]
Water Mark Building,Plot No.11, Survey No.9,Kondapur, Hitech City Hyderabad – 500 084, TelanganaPhone : +91 40 6672 5000Fax : +91 40 6707 4044/4059 E-mail : [email protected]
Mr. B.Adi ReddyCompany SecretaryAurobindo Pharma Limited,Water Mark Building, Plot No. 11, Survey No. 9, Kondapur, Hitech City,Hyderabad - 500 084, TelanganaPhone : +91 40 6672 5333Fax : +91 40 6707 4044/4059E-mail : [email protected]
Contact address for investor grievancesE-mail: [email protected]

Annual Report 2017-18 135134
prevention of insider trading in accordance with the requirements of SEBI (Prohibition of Insider Trading) Regulations, 2015. Pursuant to the SEBI (Prohibition of Insider Trading) Regulations, 2015, which is effective from May 15, 2015, the Board has formulated a Code of Conduct to regulate, monitor and report trading by insiders and the Board has also adopted a code of practices and procedures for fair disclosure of un-published price sensitive information.
Risk ManagementThe Company recognizes that it faces various financial, market, technical and operational risks including regulatory and compliance risks and needs to take appropriate steps to minimize such risks. The Board regularly discusses the significant business risks identified by the management and the mitigation process being taken up. The Board has constituted a Risk Management Committee comprising of Mr. M. Sitarama Murty, as the Chairman of the Committee and Mr. N. Govindarajan and Mr. P. Sarath Chandra Reddy as other members of the Committee. The objectives of the Committee include identifying, measuring monitoring the various risks the Company is exposed to and initiate appropriate mitigating measures on an ongoing basis.
Letter of appointmentEach independent director upon appointment is given a letter of appointment. The terms and conditions of the appointment of the independent directors is available on the Company’s website at: http://www.aurobindo.com/about-us/corporate-governance
CEO and CFO CertificationThe Managing Director (Chief Executive officer) and Chief Financial Officer have submitted a compliance certificate to the Board as contemplated under SEBI (Listing Obligations and Disclosure Requirements) Regulations, 2015.
The Disclosures of the compliance with Corporate Governance requirements specified in regulation 17 to 27 and clauses (b) to (i) of sub-regulation (2) of regulation 46 are as follows:
Regulation Particulars of Regulations Compliance status(Yes/No)
17 Board of Directors Yes18 Audit Committee Yes19 Nomination and Remuneration
CommitteeYes
20 Stakeholders Relationship Committee Yes21 Risk Management Committee Yes22 Vigil mechanism Yes23 Related Party Transactions Yes24 Corporate Governance requirements
with respect to subsidiary of listed entity
Yes
25 Obligations with respect to Independent Directors
Yes
26 Obligation with respect to Directors and senior management
Yes
27 Other Corporate Governance requirements
Yes
46(2)(b) to (i)
Website Yes
Code of ConductThe Board of Directors has laid down a ‘Code of Conduct’ (Code) for all the Board members and the senior management of the Company and this Code is posted on the website of the Company. Annual declaration is obtained from every person covered by the Code.
The Company has a comprehensive Code of Conduct for
Declaration
I, N. Govindarajan, Managing Director, hereby declare that as provided under the SEBI (Listing Obligations and Disclosure Requirements) Regulations, 2015, the Board Members and the senior management personnel have confirmed compliance with the Code of Conduct and Ethics for the year ended March 31, 2018.
For Aurobindo Pharma Limited
Place: Hyderabad N. GovindarajanDate: 28 May 2018 Managing Director
Annual Report 2017-18 135134
Com
pany O
verviewS
tatutory R
epo
rtsFinancial S
tatements
CERTIFICATE ON COMPLIANCE WITH THE CONDITIONS OF CORPORATE GOVERNANCE UNDER REGULATION 34(3) READ WITH SCHEDULE V OF SECURITIES AND EXCHANGE BOARD OF INDIA (LISTING OBLIGATIONS AND DISCLOSURE REQUIREMENTS) REGULATIONS, 2015
The Members ofAurobindo Pharma Limited
I have examined the compliance of conditions of corporate governance by Aurobindo Pharma Limited (The Company) for the financial year ended March 31, 2018, as stipulated in Securities and Exchange Board of India (Listing Obligations and Disclosure Requirements) Regulations, 2015.
The compliance of conditions of corporate governance is the responsibility of the management. My examination was limited to review the procedures and implementation thereof, adopted by the Company, for ensuring the compliance of the conditions of the corporate governance. It is neither an audit nor an expression of opinion on financial statements of the Company.
In my opinion and to the beset of our information and according to the explanations given to me, I certify that the Company has complied with the conditions of corporate governance as stipulated in the above Securities and Exchange Board of India (Listing Obligations and Disclosure Requirements) Regulations, 2015.
I further state that such compliance is neither an assurance as to the future viability of the Company nor the efficiency or effectiveness with which the management has conducted the affairs of the Company.
Place: Hyderabad S. ChidambaramDate: 28 May 2018 Company Secretary in Practice
C.P. No. 2286

Annual Report 2017-18 PB136
CHIEF EXECUTIVE OFFICER (CEO) AND CHIEF FINANCIAL OFFICER (CFO) CERTIFICATION
We hereby certify that:
a. We have reviewed financial statement and cash flow statement for the financial year ended March 31, 2018 and that to the best our knowledge and belief:
i. These statements do not contain any materially untrue statement or omit any material fact or contain statements that might be misleading;
ii. These statements together present a true and fair view of the Company’s affairs and are in compliance with existing accounting standards, applicable laws and regulations.
b. There are to the best of our knowledge and belief, no transactions entered into by the Company during the year which are fraudulent, illegal or violative of the Company’s code of conduct.
c. We accept responsibility for establishing and maintaining internal controls for financials reporting and that we have evaluated the effectiveness of internal control systems of the company pertaining to financial reporting and we have disclosed to the auditors and the Audit Committee, deficiencies in the design or operation of such internal controls, if any, of which we have aware and the steps we have taken or propose to take to rectify these deficiencies.
d. We have indicated to the Auditors and the Audit Committee that there are no:
i. Significant changes in internal control over financial reporting during the year.
ii. Significant changes in accounting policies during the year and that the same have been disclosed in the notes to the financial statements; and
iii. Instances of significant fraud of which we have become aware and the involvement therein, if any, of the management or an employee having significant role in the Company’s internal control system financial reporting.
For Aurobindo Pharma Limited
Place: Hyderabad N. Govindarajan S. SubramanianDate: 28 May 2018 Managing Director Chief Financial Officer

Annual Report 2017-18 137PB
Com
pany O
verviewS
tatutory Rep
ortsFinancial S
tatements
INDEPENDENT AUDITOR’S REPORT
ToThe Members of Aurobindo Pharma Limited
REPORT ON THE AUDIT OF THE STANDALONE IND AS FINANCIAL STATEMENTSWe have audited the accompanying standalone Ind AS financial statements of Aurobindo Pharma Limited (“the Company”), which comprise the Balance Sheet as at 31 March 2018, the Statement of Profit and Loss, the Statement of Changes in Equity and the Statement of Cash Flows for the year then ended, and a summary of significant accounting policies and other explanatory information (herein after referred to as “standalone Ind AS financial statements”).
MANAGEMENT’S RESPONSIBILITY FOR THE STANDALONE IND AS FINANCIAL STATEMENTSThe Company’s Board of Directors is responsible for the matters stated in Section 134(5) of the Companies Act, 2013 (“the Act”) with respect to the preparation of these standalone Ind AS financial statements that give a true and fair view of the state of affairs, profit (including other comprehensive income), changes in equity and cash flows of the Company in accordance with the accounting principles generally accepted in India, including the Indian Accounting Standards (Ind AS) prescribed under Section 133 of the Act.
This responsibility also includes maintenance of adequate accounting records in accordance with the provisions of the Act for safeguarding the assets of the Company and for preventing and detecting frauds and other irregularities; selection and application of appropriate accounting policies; making judgments and estimates that are reasonable and prudent; and design, implementation and maintenance of adequate internal financial controls that were operating effectively for ensuring the accuracy and completeness of the accounting records, relevant to the preparation and presentation of the standalone Ind AS financial statements that give a true and fair view and are free from material misstatement, whether due to fraud or error.
In preparing the financial statements, management is responsible for assessing the Company’s ability to continue as a going concern, disclosing, as applicable, matters related to going concern and using the going concern basis of accounting unless management either intends to liquidate the Company or to cease operations, or has no realistic alternative but to do so.
AUDITOR’S RESPONSIBILITYOur responsibility is to express an opinion on these standalone Ind AS financial statements based on our audit.
We have taken into account the provisions of the Act, the accounting and auditing standards and matters which are required to be included in the audit report under the provisions of the Act and the Rules made thereunder.
We conducted our audit of the standalone Ind AS financial statements in accordance with the Standards on Auditing
specified under Section 143(10) of the Act. Those Standards require that we comply with ethical requirements and plan and perform the audit to obtain reasonable assurance about whether the standalone Ind AS financial statements are free from material misstatement.
An audit involves performing procedures to obtain audit evidence about the amounts and the disclosures in the standalone Ind AS financial statements. The procedures selected depend on the auditor’s judgment, including the assessment of the risks of material misstatement of the standalone Ind AS financial statements, whether due to fraud or error. In making those risk assessments, the auditor considers internal financial control relevant to the Company’s preparation of the standalone Ind AS financial statements that give a true and fair view in order to design audit procedures that are appropriate in the circumstances. An audit also includes evaluating the appropriateness of the accounting policies used and the reasonableness of the accounting estimates made by the Company’s Directors, as well as evaluating the overall presentation of the standalone Ind AS financial statements.
We are also responsible to conclude on the appropriateness of management’s use of the going concern basis of accounting and, based on the audit evidence obtained, whether a material uncertainty exists related to events or conditions that may cast significant doubt on the entity’s ability to continue as a going concern. If we conclude that a material uncertainty exists, we are required to draw attention in the auditor’s report to the related disclosures in the financial statements or, if such disclosures are inadequate, to modify the opinion. Our conclusions are based on the audit evidence obtained up to the date of the auditor’s report. However, future events or conditions may cause an entity to cease to continue as a going concern.
We believe that the audit evidence we have obtained is sufficient and appropriate to provide a basis for our audit opinion on the standalone Ind AS financial statements.
OPINIONIn our opinion and to the best of our information and according to the explanations given to us, the aforesaid standalone Ind AS financial statements give the information required by the Act in the manner so required and give a true and fair view in conformity with the accounting principles generally accepted in India, of the state of affairs of the Company as at 31 March 2018, its profit (including other comprehensive income), changes in equity and its cash flows for the year ended on that date.
OTHER MATTERCorresponding figures for the year ended 31 March 2017 have been audited by another auditor who expressed an unmodified opinion dated 29 May 2017 on the standalone Ind AS financial statements of the Company for the year ended 31 March 2017.
Our opinion on the standalone Ind AS financial statements is not modified in respect of the above matter.

Annual Report 2017-18 139138
REPORT ON OTHER LEGAL AND REGULATORY REQUIREMENTS1. As required by the Companies (Auditor’s Report) Order, 2016
(“the Order”) issued by the Central Government of India in terms of Section 143(11) of the Act, we give in “Annexure A” a statement on the matters specified in paragraphs 3 and 4 of the Order.
2. As required by Section 143(3) of the Act, we report that:
a) We have sought and obtained all the information and explanations which to the best of our knowledge and belief were necessary for the purposes of our audit.
b) In our opinion, proper books of account as required by law have been kept by the Company so far as it appears from our examination of those books.
c) The Balance Sheet, the Statement of Profit and Loss including the Statement of Other Comprehensive Income, the Statement of Changes in Equity and the Statement of Cash Flows dealt with by this Report are in agreement with the books of account.
d) In our opinion, the aforesaid standalone Ind AS financial statements comply with the Indian Accounting Standards prescribed under Section 133 of the Act.
e) On the basis of the written representations received from the directors as on 31 March 2018 taken on record by the Board of Directors, none of the directors is disqualified as on 31 March 2018 from being appointed as a director in terms of Section 164(2) of the Act.
f) With respect to the adequacy of the internal financial controls with reference to financial statements of the Company and the operating effectiveness of such controls, refer to our separate Report in “Annexure B”.
g) With respect to the other matters to be included in the Auditor’s Report in accordance with Rule 11 of the Companies (Audit and Auditors) Rules, 2014, in our opinion and to the best of our information and according to the explanations given to us:
i. The Company has disclosed the impact of pending litigations on its financial position in its standalone Ind AS financial statements; - Refer Note 30(C) to the standalone Ind AS financial statements;
ii. The Company did not have any long-term contracts including derivative contracts for which there were any material foreseeable losses;
iii. There has been no delay in transferring amounts, required to be transferred, to the Investor Education and Protection Fund by the Company; and
iv. The disclosures in the standalone Ind AS financial statements regarding holdings as well as dealings in specified bank notes during the period from 8 November 2016 to 30 December 2016 have not been made since they do not pertain to the financial year ended 31 March 2018. However, amounts as appearing in the audited Standalone Ind AS financial statements for the period ended 31 March 2017 have been disclosed.
For B S R & Associates LLPChartered Accountants
ICAI Firm Registration Number: 116231W/ W-100024
Amit Kumar AgarwalPartnerMembership No.214198
Place: HyderabadDate: 28 May 2018
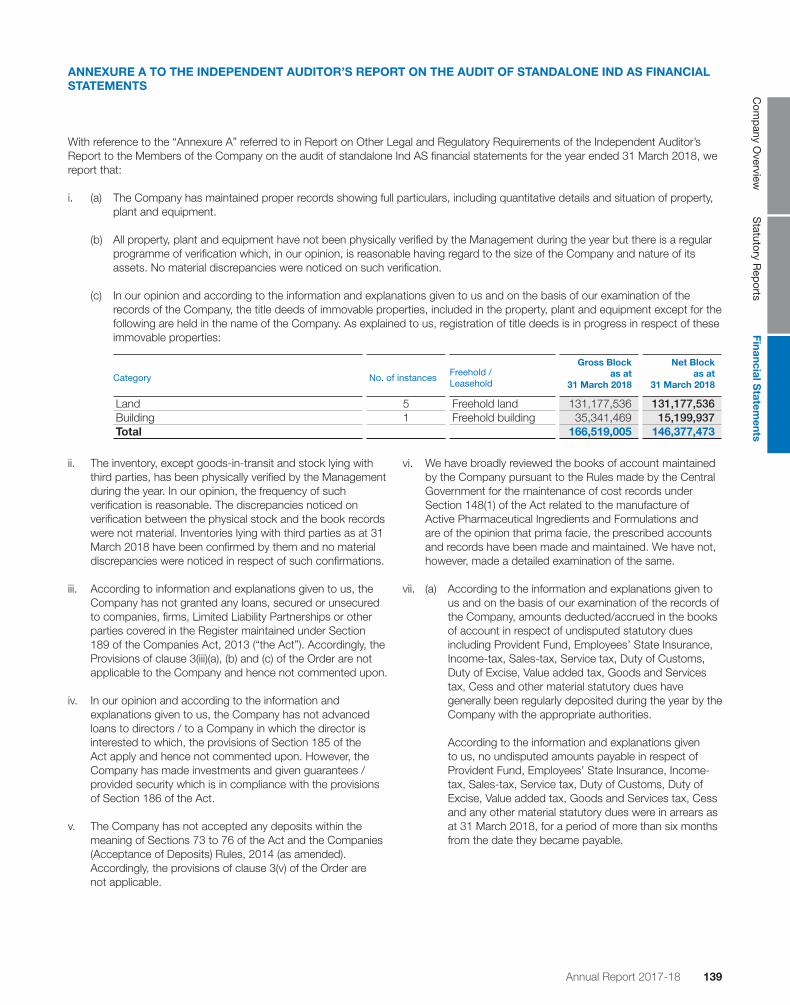
Annual Report 2017-18 139138
Com
pany O
verviewS
tatutory Rep
ortsFinancial S
tatements
ANNEXURE A TO THE INDEPENDENT AUDITOR’S REPORT ON THE AUDIT OF STANDALONE IND AS FINANCIAL STATEMENTS
With reference to the “Annexure A” referred to in Report on Other Legal and Regulatory Requirements of the Independent Auditor’s Report to the Members of the Company on the audit of standalone Ind AS financial statements for the year ended 31 March 2018, we report that:
i. (a) The Company has maintained proper records showing full particulars, including quantitative details and situation of property, plant and equipment.
(b) All property, plant and equipment have not been physically verified by the Management during the year but there is a regular programme of verification which, in our opinion, is reasonable having regard to the size of the Company and nature of its assets. No material discrepancies were noticed on such verification.
(c) In our opinion and according to the information and explanations given to us and on the basis of our examination of the records of the Company, the title deeds of immovable properties, included in the property, plant and equipment except for the following are held in the name of the Company. As explained to us, registration of title deeds is in progress in respect of these immovable properties:
Category No. of instancesFreehold / Leasehold
Gross Block as at
31 March 2018
Net Block as at
31 March 2018
Land 5 Freehold land 131,177,536 131,177,536Building 1 Freehold building 35,341,469 15,199,937Total 166,519,005 146,377,473
ii. The inventory, except goods-in-transit and stock lying with third parties, has been physically verified by the Management during the year. In our opinion, the frequency of such verification is reasonable. The discrepancies noticed on verification between the physical stock and the book records were not material. Inventories lying with third parties as at 31 March 2018 have been confirmed by them and no material discrepancies were noticed in respect of such confirmations.
iii. According to information and explanations given to us, the Company has not granted any loans, secured or unsecured to companies, firms, Limited Liability Partnerships or other parties covered in the Register maintained under Section 189 of the Companies Act, 2013 (“the Act”). Accordingly, the Provisions of clause 3(iii)(a), (b) and (c) of the Order are not applicable to the Company and hence not commented upon.
iv. In our opinion and according to the information and explanations given to us, the Company has not advanced loans to directors / to a Company in which the director is interested to which, the provisions of Section 185 of the Act apply and hence not commented upon. However, the Company has made investments and given guarantees / provided security which is in compliance with the provisions of Section 186 of the Act.
v. The Company has not accepted any deposits within the meaning of Sections 73 to 76 of the Act and the Companies (Acceptance of Deposits) Rules, 2014 (as amended). Accordingly, the provisions of clause 3(v) of the Order are not applicable.
vi. We have broadly reviewed the books of account maintained by the Company pursuant to the Rules made by the Central Government for the maintenance of cost records under Section 148(1) of the Act related to the manufacture of Active Pharmaceutical Ingredients and Formulations and are of the opinion that prima facie, the prescribed accounts and records have been made and maintained. We have not, however, made a detailed examination of the same.
vii. (a) According to the information and explanations given to us and on the basis of our examination of the records of the Company, amounts deducted/accrued in the books of account in respect of undisputed statutory dues including Provident Fund, Employees’ State Insurance, Income-tax, Sales-tax, Service tax, Duty of Customs, Duty of Excise, Value added tax, Goods and Services tax, Cess and other material statutory dues have generally been regularly deposited during the year by the Company with the appropriate authorities.
According to the information and explanations given to us, no undisputed amounts payable in respect of Provident Fund, Employees’ State Insurance, Income-tax, Sales-tax, Service tax, Duty of Customs, Duty of Excise, Value added tax, Goods and Services tax, Cess and any other material statutory dues were in arrears as at 31 March 2018, for a period of more than six months from the date they became payable.
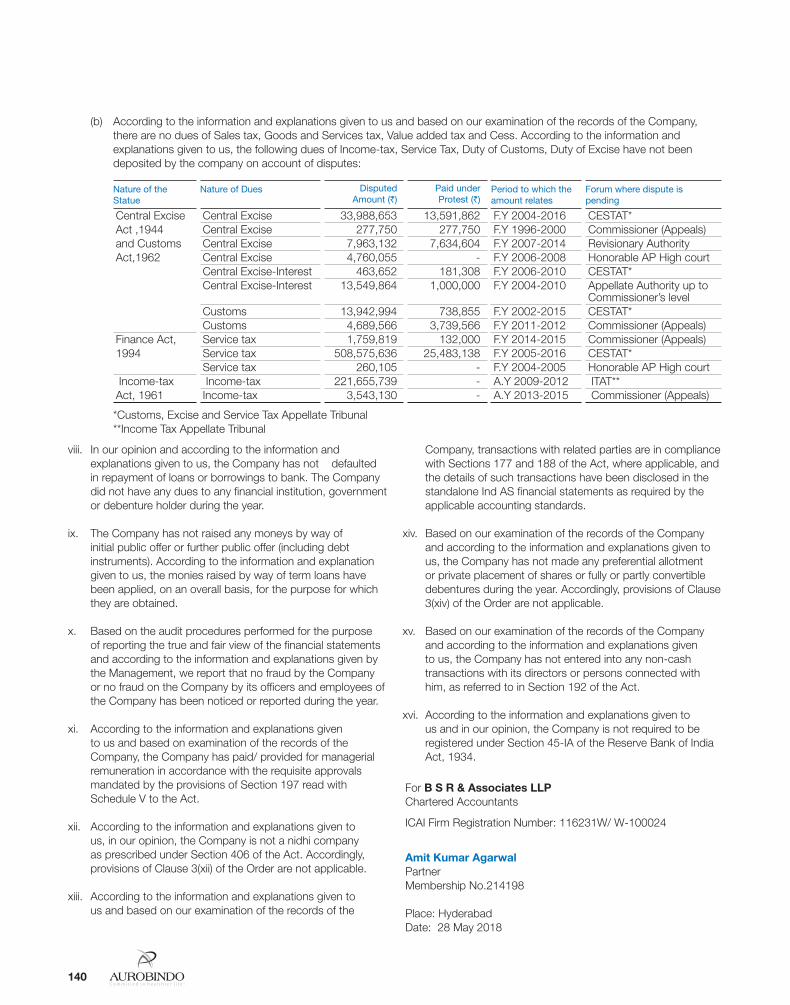
Annual Report 2017-18 141140
viii. In our opinion and according to the information and explanations given to us, the Company has not defaulted in repayment of loans or borrowings to bank. The Company did not have any dues to any financial institution, government or debenture holder during the year.
ix. The Company has not raised any moneys by way of initial public offer or further public offer (including debt instruments). According to the information and explanation given to us, the monies raised by way of term loans have been applied, on an overall basis, for the purpose for which they are obtained.
x. Based on the audit procedures performed for the purpose of reporting the true and fair view of the financial statements and according to the information and explanations given by the Management, we report that no fraud by the Company or no fraud on the Company by its officers and employees of the Company has been noticed or reported during the year.
xi. According to the information and explanations given to us and based on examination of the records of the Company, the Company has paid/ provided for managerial remuneration in accordance with the requisite approvals mandated by the provisions of Section 197 read with Schedule V to the Act.
xii. According to the information and explanations given to us, in our opinion, the Company is not a nidhi company as prescribed under Section 406 of the Act. Accordingly, provisions of Clause 3(xii) of the Order are not applicable.
xiii. According to the information and explanations given to us and based on our examination of the records of the
Company, transactions with related parties are in compliance with Sections 177 and 188 of the Act, where applicable, and the details of such transactions have been disclosed in the standalone Ind AS financial statements as required by the applicable accounting standards.
xiv. Based on our examination of the records of the Company and according to the information and explanations given to us, the Company has not made any preferential allotment or private placement of shares or fully or partly convertible debentures during the year. Accordingly, provisions of Clause 3(xiv) of the Order are not applicable.
xv. Based on our examination of the records of the Company and according to the information and explanations given to us, the Company has not entered into any non-cash transactions with its directors or persons connected with him, as referred to in Section 192 of the Act.
xvi. According to the information and explanations given to us and in our opinion, the Company is not required to be registered under Section 45-IA of the Reserve Bank of India Act, 1934.
For B S R & Associates LLPChartered Accountants
ICAI Firm Registration Number: 116231W/ W-100024
Amit Kumar AgarwalPartnerMembership No.214198
Place: HyderabadDate: 28 May 2018
(b) According to the information and explanations given to us and based on our examination of the records of the Company, there are no dues of Sales tax, Goods and Services tax, Value added tax and Cess. According to the information and explanations given to us, the following dues of Income-tax, Service Tax, Duty of Customs, Duty of Excise have not been deposited by the company on account of disputes:
Nature of the Statue
Nature of Dues Disputed Amount (`)
Paid under Protest (`)
Period to which the amount relates
Forum where dispute is pending
Central Excise Act ,1944 and Customs Act,1962
Central Excise 33,988,653 13,591,862 F.Y 2004-2016 CESTAT*Central Excise 277,750 277,750 F.Y 1996-2000 Commissioner (Appeals)Central Excise 7,963,132 7,634,604 F.Y 2007-2014 Revisionary AuthorityCentral Excise 4,760,055 - F.Y 2006-2008 Honorable AP High courtCentral Excise-Interest 463,652 181,308 F.Y 2006-2010 CESTAT*Central Excise-Interest 13,549,864 1,000,000 F.Y 2004-2010 Appellate Authority up to
Commissioner’s levelCustoms 13,942,994 738,855 F.Y 2002-2015 CESTAT*Customs 4,689,566 3,739,566 F.Y 2011-2012 Commissioner (Appeals)
Finance Act, 1994
Service tax 1,759,819 132,000 F.Y 2014-2015 Commissioner (Appeals)Service tax 508,575,636 25,483,138 F.Y 2005-2016 CESTAT*Service tax 260,105 - F.Y 2004-2005 Honorable AP High court
Income-tax Act, 1961
Income-tax 221,655,739 - A.Y 2009-2012 ITAT**Income-tax 3,543,130 - A.Y 2013-2015 Commissioner (Appeals)
*Customs, Excise and Service Tax Appellate Tribunal**Income Tax Appellate Tribunal

Annual Report 2017-18 141140
Com
pany O
verviewS
tatutory Rep
ortsFinancial S
tatements
ANNEXURE B TO THE INDEPENDENT AUDITOR’S REPORT ON THE AUDIT OF STANDALONE IND AS FINANCIAL STATEMENTS
Report on the Internal Financial Controls under Clause (i) of Sub-section 3 of the Section 143 of the Companies Act, 2013 (“the Act”)
We have audited the internal financial controls over financial reporting of Aurobindo Pharma Limited (“the Company”), as of 31 March 2018 in conjunction with our audit of the standalone Ind AS financial statements of the Company for the year ended on that date.
MANAGEMENT’S RESPONSIBILITY FOR INTERNAL FINANCIAL CONTROLSThe Company’s management is responsible for establishing and maintaining internal financial controls based on the internal control over financial reporting criteria established by the Company considering the essential components of internal control stated in the Guidance Note on Audit of Internal Financial Controls over Financial Reporting issued by the Institute of Chartered Accountants of India (‘ICAI’). These responsibilities include the design, implementation and maintenance of adequate internal financial controls that were operating effectively for ensuring the orderly and efficient conduct of its business, including adherence to Company’s policies, the safeguarding of its assets, the prevention and detection of frauds and errors, the accuracy and completeness of the accounting records, and the timely preparation of reliable financial information, as required under the Act.
AUDITOR’S RESPONSIBILITYOur responsibility is to express an opinion on the Company’s internal financial controls over financial reporting based on our audit. We conducted our audit in accordance with the Guidance Note on Audit of Internal Financial Controls Over Financial Reporting (the “Guidance Note”) and the Standards on Auditing, issued by the ICAI and deemed to be prescribed under Section 143(10) of the Act, to the extent applicable to an audit of Internal Financial Controls both applicable to an audit of Internal Financial Controls and, both issued by the ICAI. Those Standards and the Guidance Note require that we comply with ethical requirements and plan and perform the audit to obtain reasonable assurance about whether adequate internal financial controls over financial reporting was established and maintained and if such controls operated effectively in all material respects.
Our audit involves performing procedures to obtain audit evidence about the adequacy of the internal financial controls system over financial reporting and their operating effectiveness. Our audit of internal financial controls over financial reporting included obtaining an understanding of internal financial controls over financial reporting, assessing the risk that a material weakness exists, and testing and evaluating the design and operating effectiveness of internal control based on the assessed risk. The procedures selected depend on the auditor’s judgment, including the assessment of the risks of material misstatement of the standalone Ind AS financial statements, whether due to fraud or error.
We believe that the audit evidence we have obtained is sufficient and appropriate to provide a basis for our audit opinion on the Company’s internal financial controls system over financial reporting.
MEANING OF INTERNAL FINANCIAL CONTROLS OVER FINANCIAL REPORTINGA Company’s internal financial control over financial reporting is a process designed to provide reasonable assurance regarding the reliability of financial reporting and the preparation of financial statements for external purposes in accordance with the generally accepted accounting principles. A Company’s internal financial control over financial reporting includes those policies and procedures that:1. pertain to the maintenance of records that, in reasonable
detail, accurately and fairly reflect the transactions and dispositions of the assets of the Company;
2. provide reasonable assurance that transactions are recorded as necessary to permit preparation of financial statements in accordance with generally accepted accounting principles, and that receipts and expenditures of the Company are being made only in accordance with authorizations of management and directors of the Company; and
3. provide reasonable assurance regarding prevention or timely detection of unauthorized acquisition, use, or disposition of the Company’s assets that could have a material effect on the Standalone Ind AS financial statements.
INHERENT LIMITATIONS OF INTERNAL FINANCIAL CONTROLS OVER FINANCIAL REPORTINGBecause of the inherent limitations of internal financial controls over financial reporting, including the possibility of collusion or improper management override of controls, material misstatements due to error or fraud may occur and not be detected. Also, projections of any evaluation of the internal financial controls over financial reporting to future periods are subject to the risk that the internal financial control over financial reporting may become inadequate because of changes in conditions, or that the degree of compliance with the policies or procedures may deteriorate.
OPINIONIn our opinion, the Company has, in all material respects, an adequate internal financial controls system over financial reporting and such internal financial controls over financial reporting were operating effectively as at 31 March 2018, based on the internal control over financial reporting criteria established by the Company considering the essential components of internal control stated in the Guidance Note on Audit of Internal Financial Controls Over Financial Reporting issued by the ICAI.
For B S R & Associates LLPChartered Accountants
ICAI Firm Registration Number: 116231W/ W-100024
Amit Kumar AgarwalPartnerMembership No.214198
Place: HyderabadDate: 28 May 2018
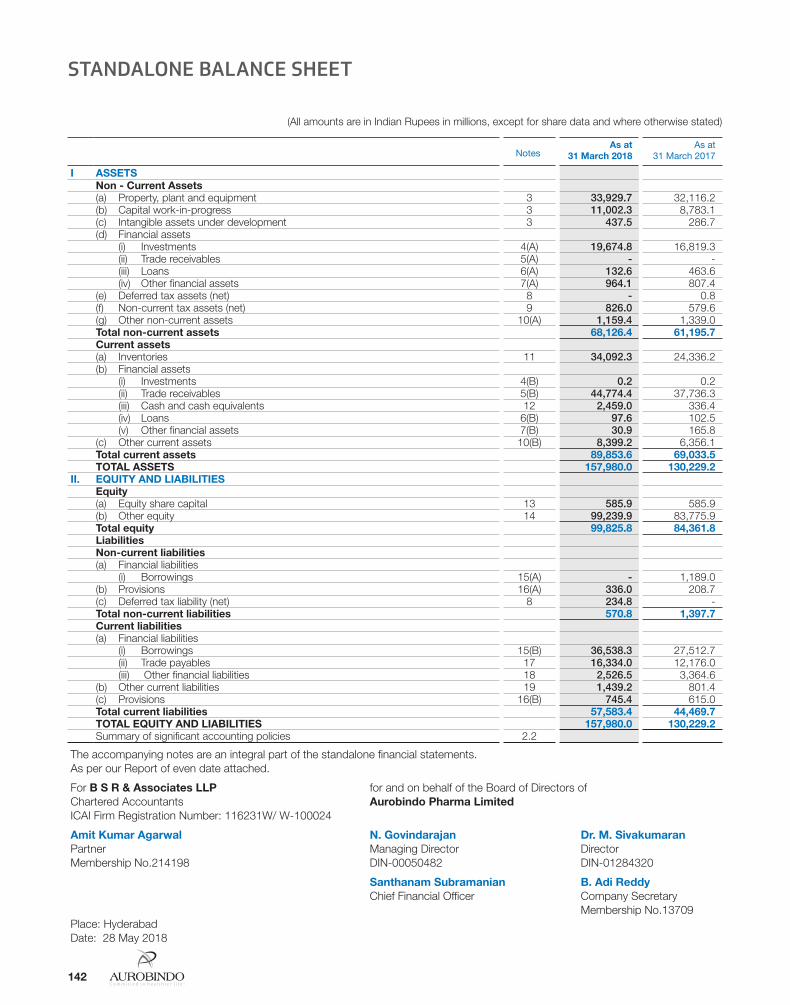
Annual Report 2017-18 143142
(All amounts are in Indian Rupees in millions, except for share data and where otherwise stated)
STANDALONE BALANCE SHEET
The accompanying notes are an integral part of the standalone financial statements.As per our Report of even date attached.
For B S R & Associates LLP for and on behalf of the Board of Directors ofChartered Accountants Aurobindo Pharma LimitedICAI Firm Registration Number: 116231W/ W-100024
Amit Kumar Agarwal N. Govindarajan Dr. M. SivakumaranPartner Managing Director DirectorMembership No.214198 DIN-00050482 DIN-01284320
Santhanam Subramanian B. Adi ReddyChief Financial Officer Company Secretary
Membership No.13709Place: HyderabadDate: 28 May 2018
NotesAs at
31 March 2018 As at
31 March 2017
I ASSETSNon - Current Assets(a) Property, plant and equipment 3 33,929.7 32,116.2 (b) Capital work-in-progress 3 11,002.3 8,783.1 (c) Intangible assets under development 3 437.5 286.7 (d) Financial assets
(i) Investments 4(A) 19,674.8 16,819.3 (ii) Trade receivables 5(A) - - (iii) Loans 6(A) 132.6 463.6 (iv) Other financial assets 7(A) 964.1 807.4 (e) Deferred tax assets (net) 8 - 0.8 (f) Non-current tax assets (net) 9 826.0 579.6 (g) Other non-current assets 10(A) 1,159.4 1,339.0 Total non-current assets 68,126.4 61,195.7 Current assets(a) Inventories 11 34,092.3 24,336.2 (b) Financial assets (i) Investments 4(B) 0.2 0.2 (ii) Trade receivables 5(B) 44,774.4 37,736.3 (iii) Cash and cash equivalents 12 2,459.0 336.4 (iv) Loans 6(B) 97.6 102.5 (v) Other financial assets 7(B) 30.9 165.8 (c) Other current assets 10(B) 8,399.2 6,356.1 Total current assets 89,853.6 69,033.5 TOTAL ASSETS 157,980.0 130,229.2
II. EQUITY AND LIABILITIESEquity(a) Equity share capital 13 585.9 585.9 (b) Other equity 14 99,239.9 83,775.9 Total equity 99,825.8 84,361.8 LiabilitiesNon-current liabilities (a) Financial liabilities (i) Borrowings 15(A) - 1,189.0 (b) Provisions 16(A) 336.0 208.7 (c) Deferred tax liability (net) 8 234.8 - Total non-current liabilities 570.8 1,397.7 Current liabilities (a) Financial liabilities (i) Borrowings 15(B) 36,538.3 27,512.7 (ii) Trade payables 17 16,334.0 12,176.0 (iii) Other financial liabilities 18 2,526.5 3,364.6 (b) Other current liabilities 19 1,439.2 801.4 (c) Provisions 16(B) 745.4 615.0 Total current liabilities 57,583.4 44,469.7 TOTAL EQUITY AND LIABILITIES 157,980.0 130,229.2 Summary of significant accounting policies 2.2

Annual Report 2017-18 143142
(All amounts are in Indian Rupees in millions, except for share data and where otherwise stated)
Com
pany O
verviewS
tatutory Rep
ortsFinancial S
tatements
The accompanying notes are an integral part of the standalone financial statements.As per our Report of even date attached.
For B S R & Associates LLP for and on behalf of the Board of Directors ofChartered Accountants Aurobindo Pharma LimitedICAI Firm Registration Number: 116231W/ W-100024
Amit Kumar Agarwal N. Govindarajan Dr. M. SivakumaranPartner Managing Director DirectorMembership No.214198 DIN-00050482 DIN-01284320
Santhanam Subramanian B. Adi ReddyChief Financial Officer Company Secretary
Membership No.13709Place: HyderabadDate: 28 May 2018
STANDALONE STATEMENT OF PROFIT AND LOSS
NoteYear ended
31 March 2018Year ended
31 March 2017
I INCOMERevenue from operations 20 103,031.5 97,812.1 Other income 21 806.5 1,359.5 TOTAL INCOME (I) 103,838.0 99,171.6
II EXPENSESCost of materials consumed 22 48,932.7 46,041.9 Purchases of stock-in-trade 37.2 112.1 Changes in inventories of finished goods, stock-in-trade and work-in-progress 23 (3,341.8) 313.2 Employee benefits expense 24 11,316.4 9,273.0 Finance costs 25 528.9 451.6 Depreciation expense 26 3,548.3 2,861.7 Other expenses 27 19,386.9 18,332.4 TOTAL EXPENSES (II) 80,408.6 77,385.9
III PROFIT BEFORE TAX (I-II) 23,429.4 21,785.7 IV TAX EXPENSE : 28
Current tax 5,053.4 4,620.6 Tax credit - Minimum Alternate Tax (MAT) (433.2) (642.8)Deferred tax 681.5 740.3 TOTAL TAX EXPENSE (IV) 5,301.7 4,718.1
V PROFIT FOR THE YEAR (III-IV) 18,127.7 17,067.6 VI OTHER COMPREHENSIVE INCOME (OCI)
Items that will not to be reclassified subsequently to profit or loss:(a) Re-measurement of defined benefit liability (34.5) (85.7)(b) Income-tax relating to items that will not be reclassified to profit or loss 12.7 29.7 TOTAL OTHER COMPREHENSIVE INCOME FOR THE YEAR (NET OF TAX) (VI) (21.8) (56.1)
VII TOTAL COMPREHENSIVE INCOME FOR THE YEAR (NET OF TAX) (V+VI) 18,105.9 17,011.5 VIII EARNINGS PER EQUITY SHARE 29
Basic (in `) 30.94 29.16 Diluted (in `) 30.94 29.16 Nominal value per equity share 1.00 1.00 Summary of significant accounting policies 2.2

(All
amou
nts
are
in In
dian
Rup
ees
in m
illion
s, e
xcep
t for
sha
re d
ata
and
whe
re o
ther
wis
e st
ated
)(A
) E
QU
ITY
SH
AR
E C
AP
ITA
L (R
efer
No
te 1
3)
Num
ber
B
alan
ce
As
at 0
1 A
pril
201
6 5
85,1
69,5
86
585
.2
Cha
nges
in e
quity
sha
re c
apita
l dur
ing
the
year
712
,823
0
.7
As
at 3
1 M
arch
201
7 5
85,8
82,4
09
585
.9
Cha
nges
in e
quity
sha
re c
apita
l dur
ing
the
year
25,
200
0.0
A
s at
31
Mar
ch 2
018
585
,907
,609
5
85.9
(B) O
TH
ER
EQ
UIT
Y
Res
erve
s an
d s
urp
lus
Item
s of
oth
er
com
pre
hens
ive
inco
me
Tota
l
Cap
ital
rese
rve
Cap
ital
red
emp
tion
rese
rve
Empl
oyee
sto
ck o
ptio
ns
outs
tand
ing
acco
unt
Sec
uriti
es
pre
miu
mG
ener
al
rese
rve
Ret
aine
d
earn
ings
Rem
easu
rem
ents
of n
et
defin
ed b
enefi
t pla
ns
Bal
ance
at 0
1 A
pril
2016
91.
1 9
0.0
12.
7 3
,339
.7
7,8
88.4
5
6,72
9.9
(78.
5) 6
8,07
3.3
Tota
l co
mp
rehe
nsiv
e in
com
e fo
r th
e ye
ar e
nded
31
Mar
ch 2
017
Pro
fit fo
r th
e ye
ar -
-
-
-
-
1
7,06
7.6
-
17,
067.
6 O
ther
com
preh
ensi
ve in
com
e (n
et o
f tax
) -
-
-
-
-
-
(5
6.1)
(56.
1)To
tal c
om
pre
hens
ive
inco
me
-
-
-
-
-
17,
067.
6 (5
6.1)
17,
011.
5 Is
sue
of e
quity
sha
res
on e
xerc
ise
of e
mpl
oyee
sto
ck o
ptio
ns -
-
-
6
5.9
-
-
-
65.
9 S
hare
bas
ed p
aym
ent (
refe
r no
te 3
1) -
-
(1
.4)
-
-
-
-
(1.4
)E
xerc
ise
of s
hare
opt
ions
-
-
(10.
4) 1
0.4
-
-
-
-
Div
iden
d pa
id -
-
-
-
-
(1
,141
.1)
-
(1,1
41.1
)D
ivid
end
dist
ribut
ion
tax
-
-
-
-
-
(232
.3)
-
(232
.3)
Bal
ance
at
31 M
arch
201
7 9
1.1
90.
0 0
.9
3,4
16.0
7
,888
.4
72,
424.
1 (1
34.6
) 8
3,77
5.9
Tota
l co
mp
rehe
nsiv
e in
com
e fo
r th
e ye
ar e
nded
31
Mar
ch 2
018
Pro
fit fo
r th
e ye
ar -
-
-
-
-
1
8,12
7.7
-
18,
127.
7 O
ther
com
preh
ensi
ve in
com
e (n
et o
f tax
) -
-
-
-
-
-
(2
1.8)
(21.
8)To
tal c
om
pre
hens
ive
inco
me
-
-
-
-
-
18,
127.
7 (2
1.8)
18,
105.
9 Is
sue
of e
quity
sha
res
on e
xerc
ise
of e
mpl
oyee
sto
ck o
ptio
ns -
-
-
2
.3
-
-
-
2.3
S
hare
bas
ed p
aym
ent (
refe
r no
te 3
1) -
-
0
.2
-
-
-
-
0.2
E
xerc
ise
of s
hare
opt
ions
-
-
(0.4
) 0
.4
-
-
-
-
Div
iden
d pa
id -
-
-
-
-
(2
,197
.1)
-
(2,1
97.1
)D
ivid
end
dist
ribut
ion
tax
-
-
-
-
-
(447
.3)
-
(447
.3)
Bal
ance
at
31 M
arch
201
8 9
1.1
90.
0 0
.7
3,4
18.7
7
,888
.4
87,
907.
4 (1
56.4
) 9
9,23
9.9
STA
ND
ALO
NE
STAT
EMEN
T O
F CH
AN
GES
IN E
QU
ITY
As
per
our
Rep
ort o
f eve
n da
te a
ttac
hed.
For
B S
R &
Ass
oci
ates
LLP
for
and
on b
ehal
f of t
he B
oard
of D
irect
ors
ofC
hart
ered
Acc
ount
ants
Aur
ob
ind
o P
harm
a Li
mit
edIC
AI F
irm R
egis
trat
ion
Num
ber:
116
231W
/ W
-100
024
Am
it K
umar
Ag
arw
alN
. Go
vind
araj
anD
r. M
. Siv
akum
aran
San
than
am S
ubra
man
ian
B. A
di R
edd
yP
artn
erM
anag
ing
Dire
ctor
Dire
ctor
Chi
ef F
inan
cial
Offi
cer
Com
pany
Sec
reta
ryM
embe
rshi
p N
o.21
4198
DIN
-000
5048
2D
IN-0
1284
320
Mem
bers
hip
No.
1370
9P
lace
: Hyd
erab
adD
ate:
28
May
201
8
144

(All amounts are in Indian Rupees in millions, except for share data and where otherwise stated)
Com
pany O
verviewS
tatutory Rep
ortsFinancial S
tatements
Annual Report 2017-18 145
STANDALONE STATEMENT OF CASH FLOW
NoteYear ended
31 March 2018Year ended
31 March 2017
1 CASH FLOW FROM OPERATING ACTIVITIESNet profit before tax 23,429.4 21,785.7 Adjustments to reconcile profit before tax to net cash flow:
Depreciation expense 3,548.3 2,861.7 Provision for doubtful receivables, advances and other assets (net) (94.8) (60.2)Bad debts 9.9 41.0 Provision for diminution on non-current investment 200.0 - Loss on sale of non-current investment - 145.3 Change in fair value of current investment 0.0 - Provisions no longer required written back (0.0) (81.8)Unrealised foreign exchange gain (net) (843.9) (37.6)Mark-to-market loss/(gain) on derivative financial instruments 23.3 (94.8)Loss on sale of property, plant and equipment (net) 0.7 34.3 Employee share-based payment expense - equity settled - 0.2
Dividend accrued on investment - (95.6)Finance cost 482.7 402.0 Interest income (74.5) (75.5)Dividend income - - Operating profit before working capital changes 26,681.1 24,824.7 Movements in working capital:(Increase) /decrease in trade receivables (5,225.3) 5,320.2 Increase in inventories (9,756.1) (20.2)Decrease / (increase) in loans 7.8 (10.8)Increase in other financial assets (61.9) (179.5)Increase in other current/non-current assets (2,038.2) (661.0)Increase in trade payables 3,966.7 380.2 Increase in provision for retirement benefits 223.2 26.0 Increase/ (decrease) in other financial liabilities 0.0 (0.0)Increase/ (decrease) in other current liabilities 637.9 (284.7)Cash generated from operating activities 14,435.2 29,394.9 Income-tax paid (net of refunds) (5,299.7) (4,822.9)Net cash flow generated from operating activities (A) 9,135.5 24,572.0
2 CASH FLOW FROM INVESTING ACTIVITIESPurchase of plant, property equipment, capital work-in-progress, capital advances and capital creditors
(9,606.9) (9,909.3)
Purchase of intangibles assets under development (150.8) (286.7)Proceeds from sale of property, plant and equipment 2,556.0 20.9 Purchase of non-current investments (refer Note "c" below) (2,573.5) (5,407.5)Proceeds from sale of non - current investments - 287.1 Loans made to subsidiaries/ joint venture (1,258.2) (164.5)Loans repaid by subsidiaries/ joint venture (refer Note "c" below) 1,110.0 - Interest received (refer Note "c" below) 108.9 39.5 Dividend received - 0.0 Net cash flow used in investing activities (B) (9,814.5) (15,420.5)
3 CASH FLOW FROM FINANCING ACTIVITIESProceeds from issuance of equity share capital 2.3 66.6 Repayment of non-current borrowings (2,377.9) (4,522.0)Proceeds from current borrowings (net) 9,906.2 (7,043.4)Interest paid (492.4) (419.3)
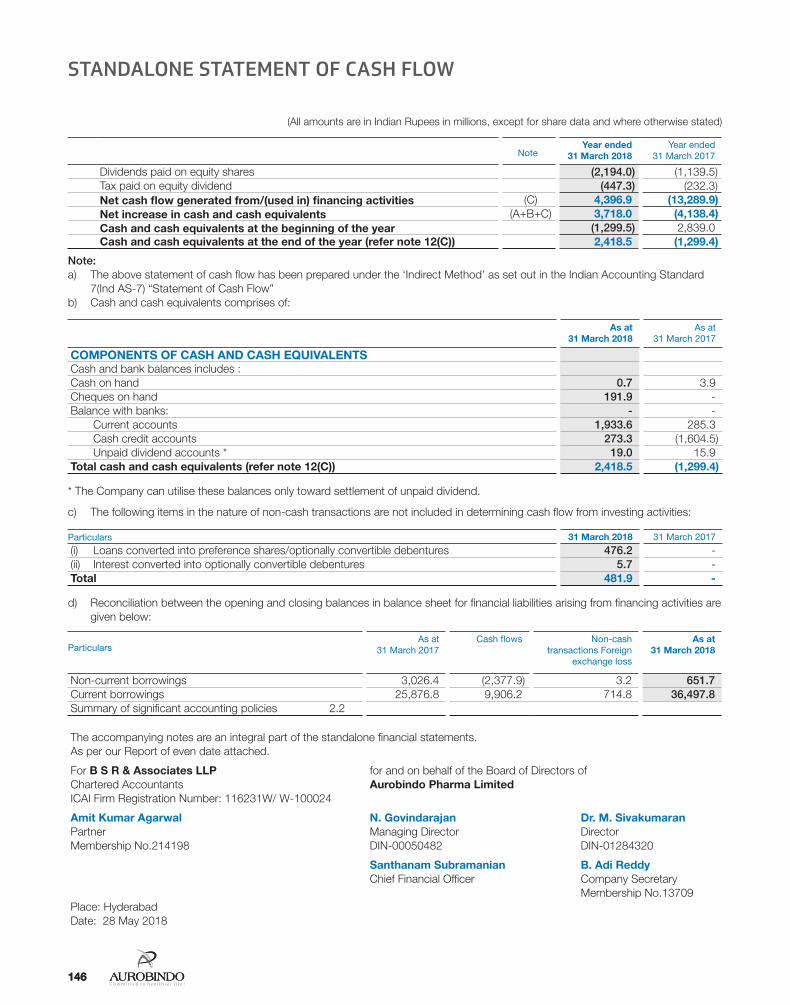
Annual Report 2017-18 147146 Annual Report 2017-18 147146
(All amounts are in Indian Rupees in millions, except for share data and where otherwise stated)
NoteYear ended
31 March 2018Year ended
31 March 2017
Dividends paid on equity shares (2,194.0) (1,139.5)Tax paid on equity dividend (447.3) (232.3)Net cash flow generated from/(used in) financing activities (C) 4,396.9 (13,289.9)Net increase in cash and cash equivalents (A+B+C) 3,718.0 (4,138.4)Cash and cash equivalents at the beginning of the year (1,299.5) 2,839.0 Cash and cash equivalents at the end of the year (refer note 12(C)) 2,418.5 (1,299.4)
Note:a) The above statement of cash flow has been prepared under the ‘Indirect Method’ as set out in the Indian Accounting Standard
7(Ind AS-7) “Statement of Cash Flow”b) Cash and cash equivalents comprises of:
As at 31 March 2018
As at 31 March 2017
COMPONENTS OF CASH AND CASH EQUIVALENTSCash and bank balances includes :Cash on hand 0.7 3.9 Cheques on hand 191.9 - Balance with banks: - -
Current accounts 1,933.6 285.3 Cash credit accounts 273.3 (1,604.5)Unpaid dividend accounts * 19.0 15.9
Total cash and cash equivalents (refer note 12(C)) 2,418.5 (1,299.4)
* The Company can utilise these balances only toward settlement of unpaid dividend.
c) The following items in the nature of non-cash transactions are not included in determining cash flow from investing activities:
Particulars 31 March 2018 31 March 2017
(i) Loans converted into preference shares/optionally convertible debentures 476.2 - (ii) Interest converted into optionally convertible debentures 5.7 - Total 481.9 -
d) Reconciliation between the opening and closing balances in balance sheet for financial liabilities arising from financing activities are given below:
ParticularsAs at
31 March 2017 Cash flows Non-cash
transactions Foreign exchange loss
As at 31 March 2018
Non-current borrowings 3,026.4 (2,377.9) 3.2 651.7 Current borrowings 25,876.8 9,906.2 714.8 36,497.8 Summary of significant accounting policies 2.2
STANDALONE STATEMENT OF CASH FLOW
The accompanying notes are an integral part of the standalone financial statements.As per our Report of even date attached.
For B S R & Associates LLP for and on behalf of the Board of Directors ofChartered Accountants Aurobindo Pharma LimitedICAI Firm Registration Number: 116231W/ W-100024
Amit Kumar Agarwal N. Govindarajan Dr. M. SivakumaranPartner Managing Director DirectorMembership No.214198 DIN-00050482 DIN-01284320
Santhanam Subramanian B. Adi ReddyChief Financial Officer Company Secretary
Membership No.13709Place: HyderabadDate: 28 May 2018

Annual Report 2017-18 147146
Com
pany O
verviewS
tatutory Rep
ortsFinancial S
tatements
Annual Report 2017-18 147146
1. CORPORATE INFORMATION Aurobindo Pharma Limited (“the Company”) is a public
company domiciled in India and was incorporated under the provisions of the Companies Act applicable in India. The registered office of the Company is located at Plot No.2, Maitri Vihar, Ameerpet, Hyderabad - 500038, India and the Corporate office is located at The Water Mark Building, Plot No. 11, Survey No. 9, Hi-tech City, Hyderabad - 500084, India. The Company’s shares are listed on the Bombay Stock Exchange (BSE) and the National Stock Exchange (NSE) in India.
The Company is principally engaged in manufacturing and marketing of active pharmaceutical ingredients, generic pharmaceuticals and related services. The standalone financial statements for the year ended 31 March 2018 were approved by the Board of Directors and authorised for issue on 28 May 2018.
2. STATEMENT OF SIGNIFICANT ACCOUNTING POLICIES
2.1 Basis of preparation a) Statement of compliance These standalone financial statements have been
prepared in accordance with the Indian Accounting Standards (hereinafter referred to as the “Ind AS”) as notified by Ministry of Corporate Affairs pursuant to Section 133 of the Companies Act, 2013 (“the Act”) read with Rule 3 of the Companies (Indian Accounting Standards) Rules, 2015 and Companies (Indian Accounting Standards) Amendment Rules, 2016.
These standalone financial statements comprise the Balance Sheets as at 31 March 2018 and 31 March 2017, the Statements of Profit and Loss, the Statements of Cash Flows and the Statements of Changes in Equity for the year ended 31 March 2018 and for the year ended 31 March 2017, and a summary of the significant accounting policies and other explanatory information (together hereinafter referred to as “Financial Statements”)
These standalone financial statements have been prepared on accrual and going concern basis. The accounting policies are applied consistently to all the periods presented in these standalone financial statements.
b) Functional and presentation currency These standalone financial statements are presented in
Indian rupees (`), which is also the functional currency of the Company. All amounts have been rounded-off to the nearest million, unless otherwise indicated. Transactions and balances with values below ` one lac have been reflected as “0.0” in the financial statements.
c) Basis of measurement The standalone financial statements have been prepared
on a historical cost convention and on an accrual basis, except for the following; - certain financial assets and liabilities (including derivative instruments) are measured at fair value or amortised cost. - employee defined benefit assets / liability recognised as the net total of the fair value of plan assets, and actuarial losses/gains, and the present value of defined benefit obligation.
d) Use of estimates and judgements The preparation of the standalone financial statements
in conformity with Ind AS requires management to make estimates, judgements and assumptions. These estimates, judgements and assumptions affect the application of accounting policies and the reported amounts of assets and liabilities, the disclosures of contingent assets and liabilities at the date of the financial statements and reported amounts of revenues and expenses during the period. Accounting estimates could change from period to period. Actual results could differ from those estimates. Appropriate changes in estimates are made as management becomes aware of changes in circumstances surrounding the estimates. Changes in estimates are reflected in the financial statements in the period in which changes are made and, if material, their effects are disclosed in the notes to the standalone financial statements.
Judgements Information about judgements made in applying
accounting policies that have the most significant effects on the amounts recognised in the standalone financial statements is included in the following notes:
- Note 30(A) - leases: whether an arrangement contains a lease; lease classification.
- Note 2.2(r) and 42: Financial instruments
- Note 2.2(k), 8 and 28: Provision for income taxes and evaluation of recoverability of deferred tax assets.
- Note 2.2(e): Useful lives of property, plant and equipment
- Note 31: Share based payments
- Note 32: Assets and obligations relating to employee benefits
Assumptions and estimation uncertainties The key assumptions concerning the future and
other key sources of estimation uncertainty at the reporting date, that have a significant risk of causing a material adjustment to the carrying amounts of assets and liabilities within the next financial year, are described below. The Company based its assumptions
NOTES TO STANDALONE FINANCIAL STATEMENTSfor the year ended 31 March 2018
Annual Report 2017-18 149148
and estimates on parameters available when the standalone financial statements were prepared. Existing circumstances and assumptions about future developments, however, may change due to market changes or circumstances arising that are beyond the control of the Company. Such changes are reflected in the assumptions when they occur.
(i) Share-based payments The grant date fair value of employee stock options
granted is recognised as an employee expense over the period that the employee becomes unconditionally entitled to the options. Estimating fair value for share-based payment transactions requires determination of the most appropriate valuation model, which is dependent on the terms and conditions of the grant. This estimation requires determination of the most appropriate inputs to the valuation model including the expected life of the share option, volatility and dividend yield and making assumptions about them. The Black Scholes valuation model has been used by the Management for share-based payment transactions. The assumptions and models used for estimating fair value for share-based payment transactions are disclosed in Note 31.
(ii) Defined employee benefit plans (Gratuity) The cost of the defined benefit gratuity plan
and other accumulated leave entitlement and the present value of the gratuity obligation and accumulated leave obligation are determined using actuarial valuations. An actuarial valuation involves making various assumptions that may differ from actual developments in the future. These include the determination of the discount rate, future salary increases and mortality rates. Due to the complexities involved in the valuation and its long-term nature, a defined benefit obligation is highly sensitive to changes in these assumptions. All assumptions are reviewed at each reporting date.
The parameter most subject to change is the discount rate. In determining the appropriate discount rate for plans operated in India, the management considers the interest rates of government bonds in currencies consistent with the currencies of the post-employment benefit obligation.
The mortality rate is based on publicly available mortality tables for the specific countries. Those mortality tables tend to change only at interval in response to demographic changes. Future salary increases and gratuity increases are based on expected future inflation rates. Further details about gratuity obligations are given in Note 32.
(iii) Fair value measurement of financial instruments When the fair values of financial assets and financial
liabilities recorded in the balance sheet cannot be measured based on quoted prices in active markets, their fair value is measured using valuation techniques including the DCF model. The inputs to these models are taken from observable markets where possible, but where this is not feasible, a degree of judgement is required in establishing fair values. Judgements include considerations of inputs such as liquidity risk, credit risk and volatility. Changes in assumptions about these factors could affect the reported fair value of financial instruments. See note 41 and 42 for further disclosures.
(iv) Depreciation on property, plant and equipment Depreciation on property, plant and equipment
is calculated on a straight-line basis based on the useful lives estimated by the management. Considering the applicability of Schedule II of Companies Act, 2013, the management has re-estimated useful lives and residual values of all its property, plant and equipment. The management believes that useful lives currently used fairly reflect its estimate of the useful lives and residual values of property, plant and equipment, though these in certain cases are different from lives prescribed under Schedule II of the Companies Act, 2013.
(v) Impairment of non-financial assets Impairment exists when the carrying value of
an asset or cash generating unit exceeds its recoverable amount, which is the higher of its fair value less costs of disposal and its value in use. The fair value less costs of disposal calculation is based on available data from binding sales transactions, conducted at arm’s length, for similar assets or observable market prices less incremental costs for disposing of the asset. The value in use calculation is based on a DCF model.
(vi) Impairment of investments The Company reviews its carrying value of
investments annually, or more frequently when there is an indication for impairment. If the recoverable amount is less than its carrying amount, the impairment loss is accounted for.
(vii) Intangible assets under development The Company capitalises acquired intangible asset
under development for a project in accordance with the accounting policy. In determining the amounts to be capitalised, management makes assumptions regarding the expected future cash generation of the project, discount rates to be applied and the expected period of benefits.The innovative nature
NOTES TO STANDALONE FINANCIAL STATEMENTSfor the year ended 31 March 2018
Annual Report 2017-18 149148
Com
pany O
verviewS
tatutory Rep
ortsFinancial S
tatements
of the product gives rise to some uncertainty as to whether the final approval for the products will be obtained.
(viii) Inventories The Company estimates the net realisable value
(NRV) of its inventories by taking into account their estimated selling price, estimated cost of completion, estimated costs necessary to make the sale, obsolescence by applying certain percentages over different age category of such inventories, expected loss rate considering the past trend and future outlook. Inventories are written down to NRV where such NRV is lower than their cost.
(ix) Recognition and measurement of other provisions:
The recognition and measurement of other provisions is based on the assessment of the probability of an outflow of resources, and on past experience and circumstances known at the closing date. The actual outflow of resources at a future date may therefore, vary from the amount included in other provisions.
2.2 Significant accounting policies a. Current versus non-current classification The Company presents assets and liabilities in
the balance sheet based on current/ non-current classification. An asset is treated as current when it is:
- Expected to be realised or intended to be sold or consumed in the Company normal operating cycle;
- Held primarily for the purpose of trading;
- Expected to be realised within twelve months after the reporting period; or
- Cash or cash equivalent unless restricted from being exchanged or used to settle a liability for at least twelve months after the reporting period
All other assets are classified as non-current.
A liability is current when: - It is expected to be settled in the Company normal
operating cycle;
- It is held primarily for the purpose of trading;
- It is due to be settled within twelve months after the reporting period; or
- There is no unconditional right to defer the settlement of the liability for at least twelve months after the reporting period.
The Company classifies all other liabilities as non-current.
Deferred tax assets and liabilities are classified as non-current assets and liabilities.
The operating cycle is the time between the acquisition of assets for processing and their realisation in cash and cash equivalents. The Company has identified twelve months as its operating cycle.
b. Foreign exchange transactions and translations The standalone financial statements are presented in
Indian rupees, which is the functional currency of the Company and the currency of the primary economic environment in which the Company operates.
Initial recognition: Foreign currency transactions are recorded in the functional currency, by applying to the foreign currency amount the exchange rate between the functional currency and foreign currency at the date of the transaction.
Conversion: Foreign currency monetary items are reported at functional currency spot rate of exchange at the reporting date. ‘Non-monetary items that are measured in terms of historical cost in a foreign currency are translated using the exchange rates at the dates of the initial transactions. Non-monetary items measured at fair value in a foreign currency are translated using the exchange rates at the date when the fair value is determined. The gain or loss arising on translation of non-monetary items measured at fair value is treated in line with the recognition of the gain or loss on the change in fair value of the item (i.e., translation differences on items whose fair value gain or loss is recognised in OCI or profit or loss are also recognised in OCI or profit or loss, respectively).
Exchange differences: Exchange differences arising on the settlement of monetary items or on reporting monetary items of the Company at rates different from those at which they were initially recorded during the year, or reported in previous standalone financial statements, are recognised as income or as expenses in the year in which they arise.
c. Fair value measurement The Company measures financial instruments, such as,
derivatives at fair value at each balance sheet date.
Fair value is the price that would be received to sell an asset or paid to transfer a liability in an orderly transaction between market participants at the measurement date. The fair value measurement is based on the presumption that the transaction to sell the asset or transfer the liability takes place either:
- In the principal market for the asset or liability, or
- In the absence of a principal market, in the most advantageous market for the asset or liability.
NOTES TO STANDALONE FINANCIAL STATEMENTSfor the year ended 31 March 2018

Annual Report 2017-18 151150
The principal or the most advantageous market must be accessible by the Company. The fair value of an asset or a liability is measured using the assumptions that market participants would use when pricing the asset or liability, assuming that market participants act in their economic best interest.
A fair value measurement of a non-financial asset takes into account a market participant’s ability to generate economic benefits by using the asset in its highest and best use or by selling it to another market participant that would use the asset in its highest and best use.
The Company uses valuation techniques that are appropriate in the circumstances and for which sufficient data are available to measure fair value, maximising the use of relevant observable inputs and minimising the use of unobservable inputs.
All assets and liabilities for which fair value is measured or disclosed in the standalone financial statements are categorised within the fair value hierarchy, described as follows, based on the lowest level input that is significant to the fair value measurement as a whole:
- Level 1 — quoted prices (unadjusted) in active markets for identical assets or liabilities.
- Level 2 — inputs other than quoted prices included in Level 1 that are observable for the asset or liability, either directly (i.e. as prices) or indirectly (i.e. derived from prices).
- Level 3 — inputs for the asset or liability that are not based on observable market data (unobservable inputs).
For assets and liabilities that are recognised in the standalone financial statements on a recurring basis, the Company determines whether transfers have occurred between levels in the hierarchy by re-assessing categorisation (based on the lowest level input that is significant to the fair value measurement as a whole) at the end of each reporting period.
The Company’s CFO determines the appropriate valuation techniques and inputs for fair value measurements. In estimating the fair value of an asset or a liability, the Company uses market observable data to the extent it is available. Where Level 1 inputs are not available, the Company engages third party qualified valuers to perform the valuation. Any change in the fair value of each asset and liability is also compared with relevant external sources to determine whether the change is reasonable.
For the purpose of fair value disclosures, the Company has determined classes of assets and liabilities on the basis of the nature, characteristics and risks of the asset or liability and the level of the fair value hierarchy as explained above.
d. Revenue recognition Revenue is recognised to the extent that it is probable
that the economic benefits will flow to the Company and the revenue can be reliably measured, regardless of when the payment is being made. Revenue is measured at the fair value of the consideration received or receivable, taking into account contractually defined terms of payment and excluding taxes or duties collected on behalf of the government. The Company has concluded that it is the principal in all of its revenue arrangements since it is the primary obligor in all the revenue arrangements as it has pricing latitude and is also exposed to inventory and credit risks.
The specific recognition criteria described below must also be met before revenue is recognised:
Sale of goods: Revenue from sale of goods is recognised on dispatch (in respect of exports, on the date of the bill of lading or airway bill) which coincides with the transfer of significant risks and rewards to customer is net of trade discounts, volume discounts, sales returns and any taxes or duties collected on behalf of the government which are levied on sales such as sales tax, value added tax, goods and services tax, etc., where applicable and recognised based on the terms of the agreements entered into with the customers. However, it includes excise duty upto 30 June 2017. Any additional amounts based on terms of agreement entered into with customers, is recognised in the period when the collectability becomes probable and a reliable measure of the same is available.
Rendering of services: Revenue from sale of dossiers/licenses/services is recognised in accordance with the terms of the relevant agreements as accepted and agreed with the customers. Revenue from contract research operations is recognised in accordance with the terms of the relevant contracts with customers and when the agreed milestones are achieved, which are substantiated by the performance of related service work.
Interest income: For all debt instruments measured either at amortised cost or at fair value through other comprehensive income, interest income is recorded using the effective interest rate (EIR). EIR is the rate that exactly discounts the estimated future cash payments or receipts over the expected life of the financial instrument or a shorter period, where appropriate, to the gross carrying amount of the financial asset or to the amortised cost of a financial liability. When calculating the EIR, the Company estimates the expected cash flows by considering all the contractual terms of the financial instrument (for example, prepayment, extension, call and similar options) but does not consider the expected credit losses. Interest income is included in other income in the standalone statement of profit and loss.
NOTES TO STANDALONE FINANCIAL STATEMENTSfor the year ended 31 March 2018

Annual Report 2017-18 151150
Com
pany O
verviewS
tatutory Rep
ortsFinancial S
tatements
Dividend income: Revenue is recognised when the Company’s right to receive the payment is established, which is generally when shareholders approve the dividend.
Export benefits, incentives and licenses: Export incentives are recognised as income when the right to receive credit as per the terms of the scheme is established in respect of the exports made and where there is no significant uncertainty regarding the ultimate collection of the relevant export proceeds.
e. Property, plant and equipment & Depreciation Freehold land and buildings (property) held for use
in the production or supply of goods or services, or administrative purposes are stated at cost less accumulated depreciation and accumulated impairment. Freehold land is not depreciated.
The cost of an item of property, plant and equipment comprises its purchase price, including import duties and non-refundable purchase taxes, after deducting trade discounts and rebates and any costs directly attributable to bringing the asset to the location and condition necessary for it to be capable of operating in the manner intended by management.
Subsequent expenditure is capitalised only if it is probable that the future economic benefits associated with the expenditure will flow to the Company.
Capital work in progress, plant and equipment is stated at cost, net of accumulated depreciation and accumulated impairment losses, if any. Such cost includes the cost of replacing part of the plant and equipment and borrowing costs for long-term construction projects if the recognition criteria are met. When significant parts of plant and equipment are required to be replaced at intervals, the Company depreciates them separately based on their specific useful life. Likewise, when a major inspection is performed, its cost is recognised in the carrying amount of the plant and equipment as a replacement if the recognition criteria are satisfied. All other repair and maintenance costs are recognised in profit or loss as incurred. The present value of the expected cost for the decommissioning of an asset after its use is included in the cost of the respective asset if the recognition criteria for a provision are met.
Depreciation is provided on the straight-line method, based on the useful life of the assets as estimated by the Management.
The Company, based on technical assessment and management estimate, depreciates property, plant
and equipment over estimated useful lives which are different from the useful life prescribed in Schedule II to the Companies Act, 2013. The management believes that these estimated useful lives are realistic and reflect fair approximation of the period over which the assets are likely to be used. The Company has estimated the following useful life to provide depreciation on its fixed assets:
Nature of the assets
Useful life as estimated by the
management (in years)
Useful life as stated in the
Companies Act, 2013
(in years) Leasehold buildings 20 10 - 60Freehold buildings 15- 60 10 - 60Plant and equipment 5 - 20 3 - 40Furniture and fixtures 10 10 Vehicles 4 - 8 8 Office equipment 5 5
Assets acquired under finance leases are depreciated over the shorter of the lease term and their useful lives unless it is reasonably certain that the Company will obtain ownership by the end of the lease term.
An item of property, plant and equipment and any significant part initially recognised is derecognised upon disposal or when no future economic benefits are expected from its use or disposal. Any gain or loss arising on derecognition of the asset (calculated as the difference between the net disposal proceeds and the carrying amount of the asset) is included in the income statement when the asset is derecognised.
The residual values, useful life and methods of depreciation of property, plant and equipment are reviewed at each financial period/year end and adjusted prospectively, if appropriate.
f. Intangibles Intangible assets acquired separately are measured on
initial recognition at cost. Following initial recognition, intangible assets are carried at cost less any accumulated amortisation and accumulated impairment losses.
Intangible assets with finite lives are amortised over the useful economic life and assessed for impairment whenever there is an indication that the intangible asset may be impaired. The amortisation period and the amortisation method for an intangible asset with a finite useful life are reviewed at least at the end of each reporting period. Changes in the expected useful life or the expected pattern of consumption of future economic benefits embodied in the asset are considered to modify the amortisation period or method, as appropriate, and are treated as changes in accounting estimates. The
NOTES TO STANDALONE FINANCIAL STATEMENTSfor the year ended 31 March 2018
Annual Report 2017-18 153152
amortisation expense on intangible assets with finite lives is recognised in the statement of profit and loss unless such expenditure forms part of carrying value of another asset.
Gains or losses arising from derecognition of an intangible asset are measured as the difference between the net disposal proceeds and the carrying amount of the asset and are recognised in the statement of profit or loss when the asset is derecognised.
Research and development costs: Research costs are expensed as incurred. Development
expenditures on an individual project are recognised as an intangible asset when the Company can demonstrate:
- The technical feasibility of completing the intangible asset so that the asset will be available for use or sale
- Its intention to complete and use or sell the asset
- Its ability to use or sell the asset
- How the asset will generate future economic benefits
- The availability of resources to complete the asset
- The ability to measure reliably the expenditure during development
Acquired research and development intangible assets that are under development are recognised as Intangible assets under development. These assets are not amortised, but evaluated for potential impairment on an annual basis or when there are indications that the carrying value may not be recoverable. Any impairment is recognised as an expense in the statement of profit and loss.
Subsequent expenditure on in process research and development project acquired separately and recognised as an intangible asset is:
- recognised as an expense, if it is research expenditure.
- recognised as an expense, if its development expenditure that does not satisfy the criteria for recognition as an Intangible asset; and
- added to the carrying amount of acquired in process research and development project, if it is development expenditure that satisfies the recognition criteria.
Following initial recognition of the development expenditure as an asset, the asset is carried at cost less any accumulated amortisation and accumulated impairment losses. Amortisation of the asset begins when development is complete and the asset is available for use. It is amortised over the period of expected future benefit. Amortisation expense is
recognised in the statement of profit and loss unless such expenditure forms part of carrying value of another asset.
Intangible assets relating to products in development and other intangible assets not available for use is tested for impairment annually.
g. Government grants and subsidies Government grants are recognised when there is
reasonable assurance that the grant will be received and all attached conditions will be complied with. When the grant relates to an expense item, it is deducted from the related expense. When the grant relates to an asset, it is recognised as deferred income and amortised over the useful life of such assets.
h. Inventories Inventories are valued at lower of cost, determined
on “Weighted average” basis and net realisable value. Costs incurred in bringing each product to its present location and condition are accounted for as follows:
Raw materials: cost includes cost of purchase and other costs incurred in bringing the inventories to their present location and condition.
Finished goods and work-in-progress: cost includes direct materials, labour and a proportion of manufacturing overheads based on the normal operating capacity, but excludes borrowing costs.
Trading goods: cost includes cost of purchase and other costs incurred in bringing the inventories to their present location and condition.
Net realisable value is the estimated selling price in the ordinary course of business, less estimated costs of completion and the estimated costs necessary to make the sale. The net realisable value of work-in-progress is determined with reference to the selling prices of related finished products.
Raw materials, components and other supplies held for use in the production of finished products are not written down below cost except in cases where material prices have declined and it is estimated that the cost of the finished products will exceed their net realisable value.
The comparison of cost and net realisable value is made on an item-by-item basis.
i. Retirement and other employee benefits Provident fund Retirement benefit in the form of provident fund is a
defined contribution scheme. The Company has no obligation, other than the contribution payable to the
NOTES TO STANDALONE FINANCIAL STATEMENTSfor the year ended 31 March 2018

Annual Report 2017-18 153152
Com
pany O
verviewS
tatutory Rep
ortsFinancial S
tatements
provident fund. The Company recognizes contribution payable to the provident fund scheme as an expense, when an employee renders the related service. If the contribution payable to the scheme for service received before the balance sheet date exceeds the contribution already paid, the deficit payable to the scheme is recognized as a liability after deducting the contribution already paid. If the contribution already paid exceeds the contribution due for services received before the balance sheet date, then excess is recognized as an asset to the extent that the pre-payment will lead to, for example, a reduction in future payment or a cash refund.
Gratuity The Company operates a defined benefit gratuity plan
in India, which requires contributions to be made to a separately administered fund. The cost of providing benefits under the defined benefit plan is determined based on actuarial valuation.
Remeasurements, comprising of actuarial gains and losses, the effect of the asset ceiling, excluding amounts included in net interest on the net defined benefit liability and the return on plan assets (excluding amounts included in net interest on the net defined benefit liability), are recognised immediately in the balance sheet with a corresponding debit or credit to retained earnings through OCI in the period in which they occur. Remeasurements are not reclassified to profit or loss in subsequent periods.
Past service costs are recognised in profit or loss on the earlier of:
- The date of the plan amendment or curtailment, and
- The date that the Company recognises related restructuring costs
Net interest is calculated by applying the discount rate to the net defined liability or asset. The Company recognises the following changes in the net defined benefit obligation as an expense in the statement of profit and loss:
- Service costs comprising current service costs, past-service costs, gains and losses on curtailments and non-routine settlements; and
- Net interest expense or income
Compensated absences Short term compensated absences are provided for
based on estimates. The Company treats accumulated leave, as a long-term employee benefit for measurement purposes. Such accumulated leaves are provided for based on an actuarial valuation using the projected unit credit method at the period-end/ year-end. The Company presents the entire liability in respect of leave
as a current liability in the balance sheet, since it does not have an unconditional right to defer its settlement beyond twelve months after the reporting date.
J Share-based payments Employees of the Company receive remuneration in the
form of share-based payments, whereby employees render services as consideration for equity instruments.
The cost of equity-settled transactions is determined by the fair value at the date when the grant is made using an appropriate valuation model. That cost is recognised, together with a corresponding increase in employee stock options reserves in equity, over the period in which the performance and/or service conditions are fulfilled in employee benefits expense. The cumulative expense recognised for equity-settled transactions at each reporting date until the vesting date reflects the extent to which the vesting period has expired and the Company’s best estimate of the number of equity instruments that will ultimately vest. The statement of profit and loss expense or credit for a period represents the movement in cumulative expense recognised as at the beginning and end of that period and is recognised in employee benefits expense. Service and non-market based performance conditions are not taken into account when determining the grant date fair value of awards, but the likelihood of the conditions being met is assessed as part of the Company’s best estimate of the number of equity instruments that will ultimately vest. No expense is recognised for awards that do not ultimately vest because of non-market performance and/or service conditions have not been met.
The dilutive effect of outstanding options is reflected as additional share dilution in the computation of diluted earnings per share.
K. Taxes Income tax expense comprises of current and deferred
tax. Current income tax assets and liabilities are measured at the amount expected to be recovered from or paid to the tax authorities in accordance with the Indian Income-tax Act, 1961. Current income tax relating to items recognised outside profit or loss is recognised outside profit or loss (either in other comprehensive income or in equity). Current tax items are recognised in correlation to the underlying transaction either in OCI or directly in equity. The Management periodically evaluates positions taken in the tax returns with respect to situations in which applicable tax regulations are subject to interpretation and establishes provision where appropriate. The tax rate and tax laws used to compute the amount are those that are enacted or substantially enacted, at the reporting date.
Deferred tax is provided using the balance sheet
NOTES TO STANDALONE FINANCIAL STATEMENTSfor the year ended 31 March 2018

Annual Report 2017-18 155154
method on temporary differences between the tax bases of assets and liabilities and their carrying amounts for financial reporting purposes at the reporting date. Deferred tax liabilities are recognised for all taxable temporary differences.
Deferred tax assets are recognised for all deductible temporary differences, the carry forward of unused tax credits and any unused tax losses. Deferred tax assets are recognised to the extent that it is probable that taxable profit will be available against which the deductible temporary differences, and the carry forward of unused tax credits and unused tax losses can be utilized.
The carrying amount of deferred tax assets is reviewed at each reporting date and reduced to the extent that it is no longer probable that sufficient taxable profit will be available to allow all or part of the deferred tax asset to be utilised. Unrecognised deferred tax assets are re-assessed at each reporting date and are recognised to the extent that it has become probable that future taxable profits will allow the deferred tax asset to be recovered.
Deferred tax assets and liabilities are measured at the tax rates that are expected to apply in the period/year when the asset is realised or the liability is settled, based on tax rates and tax laws that have been enacted or substantively enacted at the reporting date. Deferred tax relating to items recognised outside profit or loss is recognised outside profit or loss (either in other comprehensive income or in equity). Deferred tax items are recognised in correlation to the underlying transaction either in OCI or directly in equity.
Deferred tax assets and deferred tax liabilities are offset if a legally enforceable right exists to set off current tax assets against current tax liabilities and the deferred taxes relate to the same taxation authority.
Taxes paid on acquisition of assets or on incurring expenses which are not subsequently recoverable:
Expenses and assets are recognised net of the taxes paid, except:
(i) When the tax incurred on a purchase of assets or services is not recoverable from the taxation authority, in which case, the tax paid is recognised as part of the cost of acquisition of the asset or as part of the expense item, as applicable
(ii) When receivables and payables are stated with the amount of tax included The net amount of tax recoverable from, or payable to, the taxation authority is included as part of receivables or payables in the balance sheet.”
I. Leases The determination of whether an arrangement is
(or contains) a lease is based on the substance of the arrangement at the inception of the lease. The arrangement is, or contains, a lease if fulfilment of the arrangement is dependent on the use of a specific asset or assets and the arrangement conveys a right to use the asset or assets, even if that right is not explicitly specified in an arrangement.
Where the Company is lessee A lease is classified at the inception date as a finance
lease or an operating lease. A lease that transfers substantially all the risks and rewards incidental to ownership to the Company is classified as a finance lease. Finance leases are capitalised at the commencement of the lease at the inception date fair value of the leased property or, if lower, at the present value of the minimum lease payments. Lease payments are apportioned between finance charges and reduction of the lease liability so as to achieve a constant rate of interest on the remaining balance of the liability. Finance charges are recognised in finance costs in the statement of profit and loss, unless they are directly attributable to qualifying assets, in which case they are capitalized in accordance with the Company’s general policy on the borrowing costs. Contingent rentals are recognised as expenses in the periods in which they are incurred.
A leased asset is depreciated over the useful life of the asset. However, if there is no reasonable certainty that the Company will obtain ownership by the end of the lease term, the asset is depreciated over the shorter of the estimated useful life of the asset and the lease term. Operating lease payments are recognised as an expense in the Statement of Profit and Loss on a straight-line basis over the lease term.
Where the Company is lessor Leases in which the Company does not transfer
substantially all the risks and rewards of ownership of an asset are classified as operating leases. Rental income from operating lease is recognised on a straight-line basis over the term of the relevant lease. Initial direct costs incurred in negotiating and arranging an operating lease are added to the carrying amount of the leased asset and recognised over the lease term on the same basis as rental income. Contingent rents are recognised as revenue in the period in which they are earned.
Leases are classified as finance leases when substantially all of the risks and rewards of ownership transfer from the Company to the lessee. Amounts due from lessees under finance leases are recorded as receivables at the Company’s net investment in the leases. Finance lease income is allocated to accounting periods so as to reflect
NOTES TO STANDALONE FINANCIAL STATEMENTSfor the year ended 31 March 2018

Annual Report 2017-18 155154
Com
pany O
verviewS
tatutory Rep
ortsFinancial S
tatements
a constant periodic rate of return on the net investment outstanding in respect of the lease.
m. Earnings per share Basic earnings per share is calculated by dividing the
net profit for the year attributable to equity shareholders by the weighted average number of equity shares outstanding during the year. The weighted average number of shares outstanding during the year is adjusted for events such as bonus issue that have changed the number of shares outstanding, without a corresponding change in resources.
For the purpose of calculating diluted earnings per share, the net profit for the year attributable to equity shareholders and the weighted average number of equity shares outstanding during the year are adjusted for the effects of all dilutive potential equity shares.
n. Provision and contingent liabilities Provisions are recognised when the Company has
a present obligation (legal or constructive) as a result of a past event, it is probable that an outflow of resources embodying economic benefits will be required to settle the obligation and a reliable estimate can be made of the amount of the obligation. When the Company expects some or all of a provision to be reimbursed, for example, under an insurance contract, the reimbursement is recognised as a separate asset, but only when the reimbursement is virtually certain. The expense relating to a provision is presented in the statement of profit and loss net of any reimbursement.
If the effect of the time value of money is material, provisions are discounted using a current pre-tax rate that reflects, when appropriate, the risks specific to the liability. When discounting is used, the increase in the provision due to the passage of time is recognised as a finance cost.
Onerous contracts A contract is considered to be onerous when the
expected economic benefits to be derived by the Company from the contract are lower than the unavoidable cost of meeting its obligations under the contract. The provision for an onerous contract is measured at the present value of the lower of the expected cost of terminating the contract and the expected net cost of continuing with the contract. Before such a provision is made, the Company recognises any impairment loss on the assets associated with that contract.
Contingencies Provision in respect of loss contingencies relating to
claims, litigations, assessments, fines and penalties are recognised when it is probable that a liability has been incurred and the amount can be estimated reliably.
o. Cash and cash equivalents Cash and cash equivalents in the balance sheet
comprise cheques, cash at banks and on hand and short-term deposits with an original maturity of three months or less, which are subject to an insignificant risk of changes in value. For the purpose of the statement of cash flows, cash and cash equivalents consist of cash and short-term deposits, as defined above, net of outstanding bank overdrafts as they are considered an integral part of the Company’s cash management.
p. Borrowing cost Borrowing costs directly attributable to the acquisition,
construction or production of an asset that necessarily takes a substantial period of time to get ready for its intended use or sale are capitalised as part of cost of the asset. All other borrowing costs are expensed in the period in which they occur. Borrowing costs consist of interest and other costs that an entity incurs in connection with the borrowing of funds. Borrowing cost also includes exchange differences to the extent regarded as an adjustment to the borrowing costs.
q. Impairment of non-financial assets The Company assesses, at each reporting date,
whether there is an indication that an asset may be impaired. If any indication exists, or when annual impairment testing for an asset is required, the Company estimates the asset’s recoverable amount. An asset’s recoverable amount is the higher of an asset’s or cash-generating unit’s (CGU) fair value less costs of disposal and its value in use. Recoverable amount is determined for an individual asset, unless the asset does not generate cash inflows that are largely independent of those from other assets or groups of assets. When the carrying amount of an asset or CGU exceeds its recoverable amount, the asset is considered impaired and is written down to its recoverable amount.
In assessing value in use, the estimated future cash flows are discounted to their present value using a pre-tax discount rate that reflects current market assessments of the time value of money and the risks specific to the asset. In determining fair value less costs of disposal, recent market transactions are taken into account. If no such transactions can be identified, an appropriate valuation model is used. These calculations are corroborated by valuation multiples, quoted share prices for publicly traded companies or other available fair value indicators.
The Company bases its impairment calculation on detailed budgets and forecast calculations, which are prepared separately for each of the Company’s CGUs to which the individual assets are allocated. These budgets and forecast calculations generally cover a period of
NOTES TO STANDALONE FINANCIAL STATEMENTSfor the year ended 31 March 2018
Annual Report 2017-18 157156
five years. Impairment losses of continuing operations, including impairment on inventories, are recognised in the statement of profit and loss.
An assessment is made at each reporting date to determine whether there is an indication that previously recognised impairment losses no longer exist or have decreased. If such indication exists, the Company estimates the asset’s or CGU’s recoverable amount. A previously recognised impairment loss is reversed only if there has been a change in the assumptions used to determine the asset’s recoverable amount since the last impairment loss was recognised. The reversal is limited so that the carrying amount of the asset does not exceed its recoverable amount, nor exceed the carrying amount that would have been determined, net of depreciation, had no impairment loss been recognised for the asset in prior periods/ years. Such reversal is recognised in the statement of profit or loss unless the asset is carried at a revalued amount, in which case, the reversal is treated as a revaluation increase.
r. Financial instruments A financial instrument is any contract that gives rise to
a financial asset of one entity and a financial liability or equity instrument of another entity.
Financial assets Initial recognition and measurement All financial assets are recognised initially at fair value
plus, in the case of financial assets not recorded at fair value through profit or loss, transaction costs that are attributable to the acquisition of the financial asset. Purchases or sales of financial assets that require delivery of assets within a time frame established by regulation or convention in the market place (regular way trades) are recognised on the trade date, i.e., the date that the Company commits to purchase or sell the asset.
Subsequent measurement For purposes of subsequent measurement, a ‘debt
instrument’ is measured at the amortised cost if both the following conditions are met:
i) The asset is held within a business model whose objective is to hold assets for collecting contractual cash flows, and
ii) Contractual terms of the asset give rise on specified dates to cash flows that are solely payments of principal and interest (SPPI) on the principal amount outstanding. This category is the most relevant to the Company. After initial measurement, such financial assets are subsequently measured at amortised cost using the effective interest rate (EIR) method. Amortised cost is calculated by taking into account any discount
or premium on acquisition and fees or costs that are an integral part of the EIR. The EIR amortisation is included in finance income in the standalone statement profit or loss. The losses arising from impairment are recognised in the standalone statement profit or loss. This category generally applies to trade and other receivables.
A ‘debt instrument’ is classified as at the FVTOCI if both of the following criteria are met:
a) The objective of the business model is achieved both by collecting contractual cash flows and selling the financial assets, and
b) The asset’s contractual cash flows represent SPPI.
Debt instruments included within the FVTOCI category are measured initially as well as at each reporting date at fair value. Fair value movements are recognized in the other comprehensive income (OCI). However, the group recognizes interest income, impairment losses & reversals and foreign exchange gain or loss in the statement of profit and loss. On derecognition of the asset, cumulative gain or loss previously recognised in OCI is reclassified from the equity to statement of profit and loss. Interest earned whilst holding FVTOCI debt instrument is reported as interest income using the EIR method.
Any debt instrument, which does not meet the criteria for categorization as at amortized cost or as FVTOCI, is classified as at FVTPL. In addition, the company may elect to designate a debt instrument, which otherwise meets amortized cost or FVTOCI criteria, as at FVTPL. However, such election is allowed only if doing so reduces or eliminates a measurement or recognition inconsistency (referred to as ‘accounting mismatch’). The Company has not designated any debt instrument as at FVTPL. Debt instruments included within the FVTPL category are measured at fair value with all changes recognized in the statement of profit and loss.
Equity investments: All equity investments in subsidiaries are
measured at cost less diminution other than temporary. All equity investments in scope of Ind AS 109 - Financial Instruments are measured at fair value. Equity investments which are held for trading are classified as FVTPL. For all other equity investments, the Company may make an irrevocable election to present in OCI subsequent changes in fair value. The Company makes such election on an instrument by instrument basis. The classification is made on initial recognition and is irrevocable.
NOTES TO STANDALONE FINANCIAL STATEMENTSfor the year ended 31 March 2018

Annual Report 2017-18 157156
Com
pany O
verviewS
tatutory Rep
ortsFinancial S
tatements
If the Company decides to classify an equity instrument as at FVOCI, then all fair value changes on the instrument, excluding dividends, are recognised in OCI. There is no recycling of amounts from OCI to statement of profit and loss, even on sale of investment. However, the Company may transfer the cumulative gain/loss within equity. Equity instruments included within the FVTPL category are measured at fair value with all changes recognised in the statement of profit and loss.
Derecognition A financial asset (or, where applicable, a part of a
financial asset or part of a group of similar financial assets) is primarily derecognised (i.e. removed from the Company’s balance sheet) when:
i) the rights to receive cash flows from the asset have expired, or
ii) the Company has transferred its rights to receive cash flows from the asset, and the Company has transferred substantially all the risks and rewards of the asset, or the Company has neither transferred nor retained substantially all the risks and rewards of the asset, but has transferred control of the asset.
Impairment of financial assets In accordance with Ind AS 109 - Financial Instruments,
the Company applies expected credit loss (ECL) model for measurement and recognition of impairment loss on the following financial assets:
(i) Financial assets that are debt instruments, and are measured at amortised cost, e.g. loans, deposits, debt securities, etc.
(ii) Trade receivables that result from transactions that are within the scope of Ind AS 18 - Revenue Recognition.
The Company follows ‘simplified approach’ for recognition of impairment loss allowance. The application of simplified approach does not require the Company to track changes in credit risk. Rather, it recognises impairment loss allowance based on lifetime ECLs at each reporting date, right from its initial recognition.
For recognition of impairment loss on other financial assets and risk exposure, the Company determines that whether there has been a significant increase in the credit risk since initial recognition. If credit risk has not increased significantly, 12-month ECL is used to provide for impairment loss. However, if credit risk has increased significantly, lifetime ECL is used. If, in a subsequent period, credit quality of the instrument improves such that there is no longer a significant increase in credit risk since initial recognition, then the entity reverts to recognising impairment loss allowance based on 12-month ECL. Lifetime ECL are the expected credit
losses resulting from all possible default events over the expected life of a financial instrument. The 12-month ECL is a portion of the lifetime ECL which results from default events that are possible within 12 months after the reporting date.
ECL is the difference between all contractual cash flows that are due to the Company in accordance with the contract and all the cash flows that the entity expects to receive (i.e., all cash shortfalls), discounted at the original EIR. When estimating the cash flows, an entity is required to consider:
(i) All contractual terms of the financial instrument (including prepayment, extension, call and similar options) over the expected life of the financial instrument. However, in rare cases when the expected life of the financial instrument cannot be estimated reliably, then the entity is required to use the remaining contractual term of the financial instrument
(ii) Cash flows from the sale of collateral held or other credit enhancements that are integral to the contractual terms.
As a practical expedient, the Company uses a provision matrix to determine impairment loss allowance on portfolio of its trade receivables. The provision matrix is based on its historically observed default rates over the expected life of the trade receivables and is adjusted for forward-looking estimates. At every reporting date, the historical observed default rates are updated and changes in the forward-looking estimates are analysed.
ECL impairment loss allowance (or reversal) recognized during the period is recognized as income/ expense in the statement of profit and loss. This amount is reflected under the head other expenses/other income in the statement of profit and loss. ECL is presented as an allowance, i.e., as an integral part of the measurement of those assets in the balance sheet. The allowance reduces the net carrying amount. Until the asset meets write-off criteria, the Company does not reduce impairment allowance from the gross carrying amount.
For assessing increase in credit risk and impairment loss, the Company combines financial instruments on the basis of shared credit risk characteristics with the objective of facilitating an analysis that is designed to enable significant increases in credit risk to be identified on a timely basis. The Company does not have any purchased or originated credit-impaired (POCI) financial assets, i.e., financial assets which are credit impaired on purchase/ origination.
NOTES TO STANDALONE FINANCIAL STATEMENTSfor the year ended 31 March 2018

Annual Report 2017-18 159158
Financial liabilities Initial recognition and measurement Financial liabilities are classified, at initial recognition,
as financial liabilities at fair value through profit or loss, loans and borrowings, payables, or as derivatives designated as hedging instruments in an effective hedge, as appropriate. All financial liabilities are recognised initially at fair value and, in the case of loans and borrowings and payables, net of directly attributable transaction costs. The Company’s financial liabilities include trade and other payables, loans and borrowings including bank overdrafts, financial guarantee contracts and derivative financial instruments.
Subsequent measurement The measurement of financial liabilities depends on their
classification, as described below:
Financial liabilities at fair value through profit or loss Financial liabilities at fair value through profit or loss
include financial liabilities designated upon initial recognition as at fair value through profit or loss.
Financial liabilities designated upon initial recognition at fair value through profit or loss are designated as such at the initial date of recognition, and only if the criteria in Ind AS 109 are satisfied. For liabilities designated as FVTPL, fair value gains/ losses attributable to changes in own credit risk are recognized in OCI. These gains/ loss are not subsequently transferred to statement of profit and loss. However, the Company may transfer the cumulative gain or loss within equity. All other changes in fair value of such liability are recognised in the statement of profit and loss.
Loans and borrowings This is the category most relevant to the Company. After
initial recognition, interest-bearing loans and borrowings are subsequently measured at amortised cost using the EIR method. Gains and losses are recognised in profit or loss when the liabilities are derecognised as well as through the EIR amortisation process.
Amortised cost is calculated by taking into account any discount or premium on acquisition and fees or costs that are an integral part of the EIR. The EIR amortisation is included as finance costs in the statement of profit and loss.
Derecognition A financial liability is derecognised when the obligation
under the liability is discharged or cancelled or expires. When an existing financial liability is replaced by another from the same lender on substantially different terms, or the terms of an existing liability are substantially modified, such an exchange or modification is treated as the derecognition of the original liability and the
recognition of a new liability. The difference in the respective carrying amounts is recognised in the statement of profit or loss.
Reclassification of financial assets The Company determines classification of financial assets
and liabilities on initial recognition. After initial recognition, no reclassification is made for financial assets which are equity instruments and financial liabilities. For financial assets which are debt instruments, a reclassification is made only if there is a change in the business model for managing those assets. Changes to the business model are expected to be infrequent. The Company’s senior management determines the change in the business model as a result of external or internal changes which are significant to the Company’s operations. Such changes are evident to the external parties. A change in the business model occurs when the Company either begins or ceases to perform an activity that is significant to its operations. If the Company reclassifies financial assets, it applies the reclassification prospectively from the reclassification date which is the first day of the immediately next reporting period following the change in business model. The Company does not restate any previously recognised gains, losses (including impairment gains or losses) or interest.
The following table shows various reclassification and how they are accounted for:
Original classification
Revised classification
Accounting treatment
Amortised cost
FVTPL Fair value is measured at reclassification date. Difference between previous amortized cost and fair value is recognised in statement of profit and loss.
FVTPL Amortised cost
Fair value at reclassification date becomes its new gross carrying amount. EIR is calculated based on the new gross carrying amount.
Amortised cost
FVTOCI Fair value is measured at reclassification date. Difference between previous amortised cost and fair value is recognised in OCI. No change in EIR due to reclassification.
FVTOCI Amortised cost
Fair value at reclassification date becomes its new amortised cost carrying amount. However, cumulative gain or loss in OCI is adjusted against fair value. Consequently, the asset is measured as if it had always been measured at amortised cost.
NOTES TO STANDALONE FINANCIAL STATEMENTSfor the year ended 31 March 2018

Annual Report 2017-18 159158
Com
pany O
verviewS
tatutory Rep
ortsFinancial S
tatements
Original classification
Revised classification
Accounting treatment
FVTPL FVTOCI Fair value at reclassification date becomes its new carrying amount. No other adjustment is required.
FVTOCI FVTPL Assets continue to be measured at fair value. Cumulative gain or loss previously recognized in OCI is reclassified to statement of profit and loss at the reclassification date.
Financial assets and financial liabilities are offset and the net amount is reported in the balance sheet if there is a currently enforceable legal right to offset the recognised amounts and there is an intention to settle on a net basis, to realise the assets and settle the liabilities simultaneously.
s. Derivative financial instruments The Company uses derivative financial instruments,
such as forward currency contracts to hedge its foreign currency risks. Such derivative financial instruments are initially recognised at fair value on the date on which a derivative contract is entered into and are subsequently re-measured at fair value. Derivatives are carried as financial assets when the fair value is positive and as financial liabilities when the fair value is negative. The forward contracts that meet the definition of a derivative under Ind AS 109 are recognised in the statement of profit and loss. Any gains or losses arising from changes in the fair value of derivatives are taken directly to profit or loss.
t. Cash dividend and non cash distribution to equity holders
The Company recognises a liability to make cash and non cash distribution to equity holders when the distribution is authorised and the distribution is no longer at the discretion of the Company. As per the Corporate laws in India, a final dividend distribution is authorised when it is approved by the shareholders whereas for interim dividend when authorised by board. A corresponding amount is recognised directly in equity. Non cash distribution are measured at fair value of the assets distributed with fair value re-measurement recognised directly in equity.
u. Recent accounting pronouncements Standards issued but not yet effective & not early
adopted by the Company:
Ind AS 115, Revenue from Contracts with Customers
In March 2018, the Ministry of Corporate Affairs issued the Companies (Indian Accounting Standards) Amendment Rules, 2018, notifying Ind AS 115 ‘Revenue from Contracts with Customers’ (New Revenue Standard), which replaces Ind AS 11 ‘Construction Contracts’ and Ind AS 18 ‘Revenue’. This establishes a comprehensive framework for determining whether, how much and when revenue should be recognised. It replaces existing revenue recognition guidance, including Ind AS 18 Revenue, Ind AS 11 Construction Contracts and Guidance Note on Accounting for Real Estate Transactions. Ind AS 115 is effective for annual periods beginning on or after 1 April 2018 and will be applied accordingly.
The core principle of Ind AS 115 is that an entity should recognise revenue to depict the transfer of promised goods or services to customers in an amount that reflects the consideration to which the entity expects to be entitled in exchange for those goods or services. Specifically, the standard introduces a 5-step approach to revenue recognition.
Step 1: Identify the contract(s) with a customer
Step 2: Identify the performance obligation in contract
Step 3: Determine the transaction price
Step 4: Allocate the transaction price to the performance obligations in the contract
Step 5: Recognise revenue when (or as) the entity satisfies a performance obligation
For the sale of goods, revenue is currently recognised when related risks and rewards of ownership are transferred. Revenue is recognised at this point provided that the revenue and costs can be measured reliably, the recovery of the consideration is probable and there is no continuing management involvement with the goods.
Under Ind AS 115, revenue will be recognised when a customer obtains control of the goods.
For certain contracts that permit the customer to return an item, revenue is currently recognised when a reasonable estimate of the returns can be made, provided that all other criteria for revenue recognition are met. If a reasonable estimate cannot be made, then revenue recognition is deferred until the return period lapses or a reasonable estimate of returns can be made. Some of the key changes introduced by Ind AS 115 include additional guidance for measurement approaches for variable consideration.
NOTES TO STANDALONE FINANCIAL STATEMENTSfor the year ended 31 March 2018

Annual Report 2017-18 161160
Under Ind AS 115, revenue will be recognised for these contracts to the extent that it is probable that a significant reversal in the amount of cumulative revenue recognised will not occur. As a consequence, for those contracts for which the Company is unable to make a reasonable estimate of return, revenue is expected to be recognised sooner than when the return period lapses or a reasonable estimate can be made. A refund liability and an asset for recovery will be recognised for these contracts and presented separately in the balance sheet.
Significant additional disclosures in relation to revenue are also prescribed. The New Revenue Standard also provides two broad alternative transition options – Retrospective Method and Cumulative Effect Method – with certain practical expedients available under the Retrospective Method. The Company is in the process
of evaluating the impact of the New Revenue Standard on the present and future arrangements and shall determine the appropriate transition option once the said evaluation has been completed.
Ind AS 21, The effect of changes in foreign exchange rates
The amendment clarifies on the accounting of transactions that include the receipt or payment of advance consideration in a foreign currency. The appendix explains that the date of the transaction, for the purpose of determining the exchange rate, is the date of initial recognition of the non-monetary prepayment asset or deferred income liability. If there are multiple payments or receipts in advance, a date of transaction is established for each payment or receipt. The Company is evaluating the impact of this amendment on its standalone financial statements.
NOTES TO STANDALONE FINANCIAL STATEMENTSfor the year ended 31 March 2018

Annual Report 2017-18 161160
Com
pany O
verviewS
tatutory Rep
ortsFinancial S
tatements
(All
amou
nts
are
in In
dian
Rup
ees
in m
illion
s, e
xcep
t for
sha
re d
ata
and
whe
re o
ther
wis
e st
ated
)
3.
PR
OP
ER
TY,
PLA
NT
AN
D E
QU
IPM
EN
T
Leas
ehol
d
land
Fr
eeho
ld
land
Le
aseh
old
b
uild
ings
Free
hold
b
uild
ings
Pla
nt a
nd
equi
pm
ent
Furn
iture
and
fix
ture
sVe
hicl
esO
ffice
eq
uip
men
tTo
tal
Gro
ss c
arry
ing
val
ue (a
t co
st)
As
at 0
1 A
pril
2016
136
.0
2,1
45.1
1
2.0
5,9
49.1
1
9,29
7.6
506
.7
105
.1
156
.2
28,
307.
8 A
dditi
ons
-
1,0
87.9
-
1
,592
.5
6,2
61.9
2
43.1
1
24.1
4
6.1
9,3
55.6
D
ispo
sals
-
-
-
0.2
7
0.1
0.2
1
0.8
0.3
8
1.6
As
at 3
1 M
arch
201
7 1
36.0
3
,233
.0
12.
0 7
,541
.4
25,
489.
4 7
49.6
2
18.4
2
02.0
3
7,58
1.8
Add
ition
s 2
.0
5.6
-
1
,193
.0
6,4
61.5
1
90.0
3
5.0
34.
1 7
,921
.2
Dis
posa
ls -
2
,508
.6
-
-
62.
0 -
1
0.2
0.4
2
,581
.2
As
at 3
1 M
arch
201
8 1
38.0
7
30.0
1
2.0
8,7
34.4
3
1,88
8.9
939
.6
243
.2
235
.7
42,
921.
8
Acc
umul
ated
dep
reci
atio
nA
s at
01
Apr
il 20
16 4
.2
-
1.3
2
47.2
2
,236
.8
66.
2 2
7.6
43.
2 2
,626
.5
Cha
rge
for
the
year
4.2
-
1
.3
269
.8
2,4
40.1
7
7.0
37.
0 3
6.0
2,8
65.4
D
ispo
sals
-
-
-
-
20.
4 -
5
.6
0.3
2
6.3
As
at 3
1 M
arch
201
7 8
.4
-
2.6
5
17.0
4
,656
.5
143
.2
59.
0 7
8.9
5,4
65.6
C
harg
e fo
r th
e ye
ar 4
.3
-
1.3
3
42.9
3
,008
.7
100
.4
54.
6 3
8.7
3,5
50.9
D
ispo
sals
-
-
-
-
19.
5 0
.0
4.7
0
.2
24.
4 A
s at
31
Mar
ch 2
018
12.
7 -
3
.9
859
.9
7,6
45.7
2
43.6
1
08.9
1
17.4
8
,992
.1
-
Net
car
ryin
g v
alue
A
s at
31
Mar
ch 2
017
127
.6
3,2
33.0
9
.4
7,0
24.4
2
0,83
2.9
606
.4
159
.4
123
.1
32,
116.
2 A
s at
31
Mar
ch 2
018
125
.3
730
.0
8.1
7
,874
.5
24,
243.
2 6
96.0
1
34.3
1
18.3
3
3,92
9.7
Cap
ital
wo
rk-i
n-p
rog
ress
`11
,002
.3 (3
1 M
arch
201
7: `
8,7
83.1
) (in
clud
ing
expe
nditu
re d
urin
g co
nstr
uctio
n pe
riod)
(ref
er n
ote
33)
Inta
ngib
le a
sset
s un
der
dev
elo
pm
ent
`437
.5 (3
1 M
arch
201
7: `
286.
7)1.
Th
e tit
le d
eeds
of l
and
and
build
ings
agg
rega
ting
to `
166.
5 (3
1 M
arch
201
7: `
166
.5) a
re p
endi
ng tr
ansf
er to
the
Com
pany
’s n
ame.
2.
Dep
reci
atio
n fo
r th
e ye
ar in
clud
e `2
.6 (3
1 M
arch
201
7: `
3.7
) tak
en a
s pr
e-op
erat
ive
capi
tal e
xpen
ditu
re o
n ca
pita
l pro
ject
s pe
ndin
g ca
pita
lisat
ion.
3.
Ref
er n
ote
30 (A
) for
det
ails
of fi
nanc
e le
ase.
4.
Ref
er n
ote
36 fo
r de
tails
of c
apita
l res
earc
h an
d de
velo
pmen
t exp
endi
ture
.5.
R
efer
not
e 15
for
deta
ils o
f pro
pert
y, p
lant
and
equ
ipm
ent s
ubje
ct to
cha
rge
on s
ecur
ed b
orro
win
gs.
NO
TES
TO S
TAN
DA
LON
E FI
NA
NCI
AL
STAT
EMEN
TSfo
r the
yea
r end
ed 3
1 M
arch
201
8

Annual Report 2017-18 163162
(All amounts are in Indian Rupees in millions, except for share data and where otherwise stated)
NOTES TO STANDALONE FINANCIAL STATEMENTSfor the year ended 31 March 2018
4. INVESTMENTS(A) Non-current investments
Face value
As at 31 March 2018 As at 31 March 2017
Quantity Amount Quantity Amount
Investments in unquoted equity shares (fully paid, carried at cost, unless stated otherwise)In subsidiariesAurobindo Pharma USA Inc, USA * - 100% of paid-in-
capital 2,832.5 100% of
paid-in-capital 2,832.3
APL Pharma Thai Ltd, Thailand Baht 100 979,200 145.6 979,200 145.6 Aurobindo Pharma Industria Farmaceutica Ltda, Brazil Real 1 10,124,795 80.0 10,124,795 80.0 (At cost less imapairment of `180.0 (31 March 2017: `180.0))Helix Healthcare B.V., The Netherlands Euro 10 15,377,851 7,683.7 100% of 7,298.9 (At cost less impairment of `2,995.0 (31 March 2017: ` 2,795.0))
represents 100% of paid-in-
capital
paid-in-capital
APL Research Centre Limited, India ` 10 12,260,000 122.6 12,260,000 122.6 APL Health Care Limited, India ` 10 182,150,000 1,821.5 130,000,000 1,300.0 All Pharma (Shanghai) Trading Company Limited, China
- 100% of paid-in-capital
27.5 100% of paid-in-capital
27.5
Aurobindo Pharma Produtos Farmaceuticos Ltda, Brazil
Real 1 99,000 2.1 99,000 2.1
Auronext Pharma Private Limited, India ` 10 124,984,028 1,298.6 124,984,028 1,298.6 Auro Peptides Limited, India ` 10 95,000 1.0 95,000 1.0 Aurobindo Antibiotics Limited, India (converted into a joint venture, Raidurgam Developers Limited w.e.f. 30 November 2017)
` 10 - - 900,000 9.0
Curepro Parenterals Limited, India ` 10 13,310,107 1,989.5 13,310,107 1,989.5 Hyacinths Pharma Private Limited, India ` 10 14,950,000 219.2 10,540,998 175.3 AuroZymes Limited, India ` 10 50,000 0.5 50,000 0.5 Auro Pharma India Private Limited, India ` 10 100,000 1.0 - - In joint venturesTergene Biotech Private Limited, India ` 10 7,500,000 75.0 3,390,000 33.9 Raidurgam Developers Limited, India ` 10 4,000,000 40.0 - - (formerly Aurobindo Antibiotics Limited, India)In others (At fair value through profit and loss)Jeedimetla Effluent Treatment Limited, India ` 100 753 0.1 753 0.1 Patancheru Envirotech Limited, India ` 10 103,709 1.0 103,709 1.0 Progressive Effluent Treatment Limited, India ` 100 1,000 0.1 1,000 0.1
A 16,341.5 15,318.0 Investments in unquoted preference shares (fully paid, carried at amortised cost, unless stated otherwise)In subsidiariesAuro Peptides Limited, India ` 100 830,000 830.0 7,350,000 735.0 (9.5% Cumulative Preference shares redeemable at par within five years from the date of issue)Auronext Pharma Private Limited, India ` 100 9,861,520 986.2 6,161,520 616.1 (9.5% Cumulative Preference shares redeemable at par within five years from the date of issue)APL Health Care Limited, India ` 100 600,000 60.0 600,000 60.0 (9.5% Cumulative Preference shares redeemable at par within five years from the date of issue)Silicon life sciences Private Limited, India ` 100 6,510,000 651.0 - - (9.5% Cumulative Preference shares redeemable at par within five years from the date of issue)

Annual Report 2017-18 163162
(All amounts are in Indian Rupees in millions, except for share data and where otherwise stated)
Com
pany O
verviewS
tatutory Rep
ortsFinancial S
tatements
NOTES TO STANDALONE FINANCIAL STATEMENTSfor the year ended 31 March 2018
Face value
As at 31 March 2018 As at 31 March 2017
Quantity Amount Quantity Amount
In joint venturesTergene Biotech Private Limited, India ` 100 950,000 95.0 900,000 90.0 (10.5% Cumulative Preference shares redeemable at par within five years from the date of issue)
B 2,622.2 1,501.1 Investments in unquoted optionally convertible debentures (fully paid, carried at cost, unless stated otherwise)In joint venturesRaidurgam Developers Limited, India ` 1000 710,933 710.9 - (Interest of 1.5% to 9.5% over a period of ten years redeemable at par within ten years from date of issue. These are optionally convertible into 100 equity shares per debenture at any time after one year.)
C 710.9 - Unquoted investment in government securities (Carried at fair value through profit and loss)National Savings Certificate (includes held by Income tax authorities ` 0.1 (31 March 2017: `0.1))
0.2 0.2
D 0.2 0.2 A+B+C+D 19,674.8 16,819.3
Aggregate value of unquoted investments 19,674.8 16,819.3 Aggregate amount of impairment in value of investments
3,175.0 2,975.0
* Includes employee stock options given to group employees considered as investment as per Ind AS-102 share based payments
(B) Current investments
Face value
As at 31 March 2018 As at 31 March 2017
Quantity Amount Quantity Amount
Investments in unquoted equity shares (fully paid, carried at fair value through profit and loss)Citadel Aurobindo Biotech Limited, India ` 100 70,000 - 70,000 - (Aggregate impairment of `7.0 (31 March 2017: `7.0)Investments in quoted equity shares (fully paid, carried at fair value through profit and loss)Andhra Bank ` 10 4,520 0.2 4,520 0.2
0.2 0.2 Aggregate value of unquoted investments - - Aggregate value of quoted investments 0.2 0.2 Market value of quoted investments 0.2 0.2 Aggregate amount of impairment in value of investments
7.0 7.0
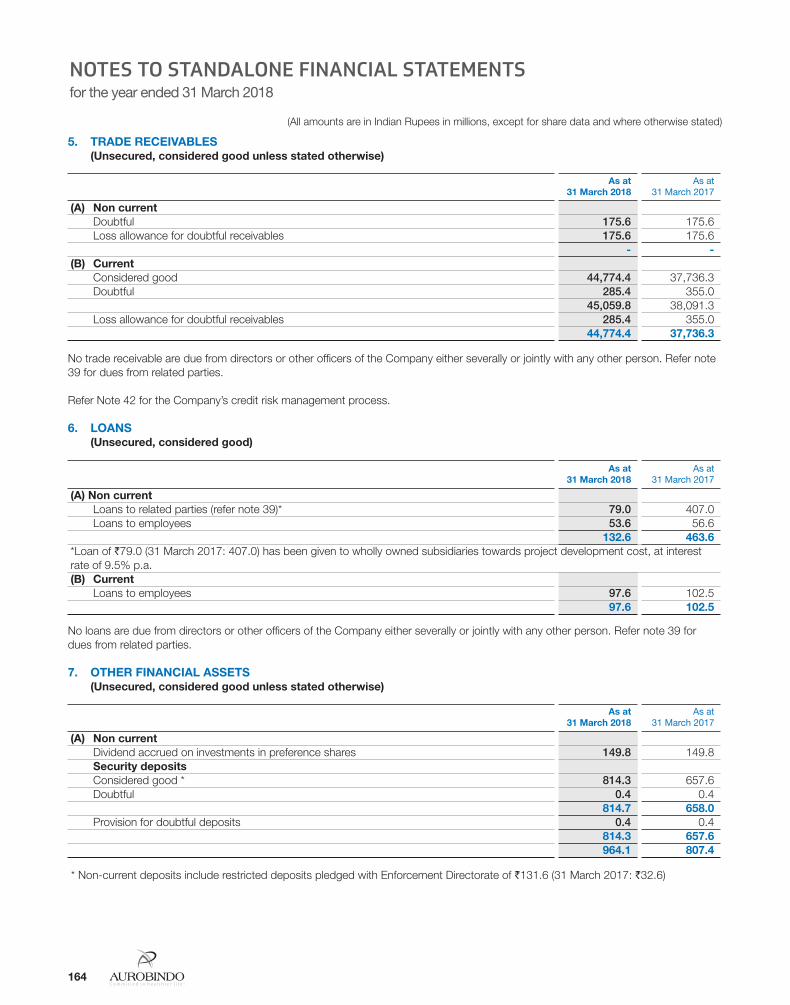
Annual Report 2017-18 165164
(All amounts are in Indian Rupees in millions, except for share data and where otherwise stated)
NOTES TO STANDALONE FINANCIAL STATEMENTSfor the year ended 31 March 2018
5. TRADE RECEIVABLES (Unsecured, considered good unless stated otherwise)
As at 31 March 2018
As at 31 March 2017
(A) Non current Doubtful 175.6 175.6 Loss allowance for doubtful receivables 175.6 175.6
- - (B) Current Considered good 44,774.4 37,736.3 Doubtful 285.4 355.0
45,059.8 38,091.3 Loss allowance for doubtful receivables 285.4 355.0
44,774.4 37,736.3
No trade receivable are due from directors or other officers of the Company either severally or jointly with any other person. Refer note 39 for dues from related parties.
Refer Note 42 for the Company’s credit risk management process.
6. LOANS (Unsecured, considered good)
As at 31 March 2018
As at 31 March 2017
(A) Non current Loans to related parties (refer note 39)* 79.0 407.0 Loans to employees 53.6 56.6
132.6 463.6 *Loan of `79.0 (31 March 2017: 407.0) has been given to wholly owned subsidiaries towards project development cost, at interest rate of 9.5% p.a. (B) Current Loans to employees 97.6 102.5
97.6 102.5
No loans are due from directors or other officers of the Company either severally or jointly with any other person. Refer note 39 for dues from related parties.
7. OTHER FINANCIAL ASSETS (Unsecured, considered good unless stated otherwise)
As at 31 March 2018
As at 31 March 2017
(A) Non current Dividend accrued on investments in preference shares 149.8 149.8 Security deposits Considered good * 814.3 657.6 Doubtful 0.4 0.4
814.7 658.0 Provision for doubtful deposits 0.4 0.4
814.3 657.6 964.1 807.4
* Non-current deposits include restricted deposits pledged with Enforcement Directorate of `131.6 (31 March 2017: `32.6)
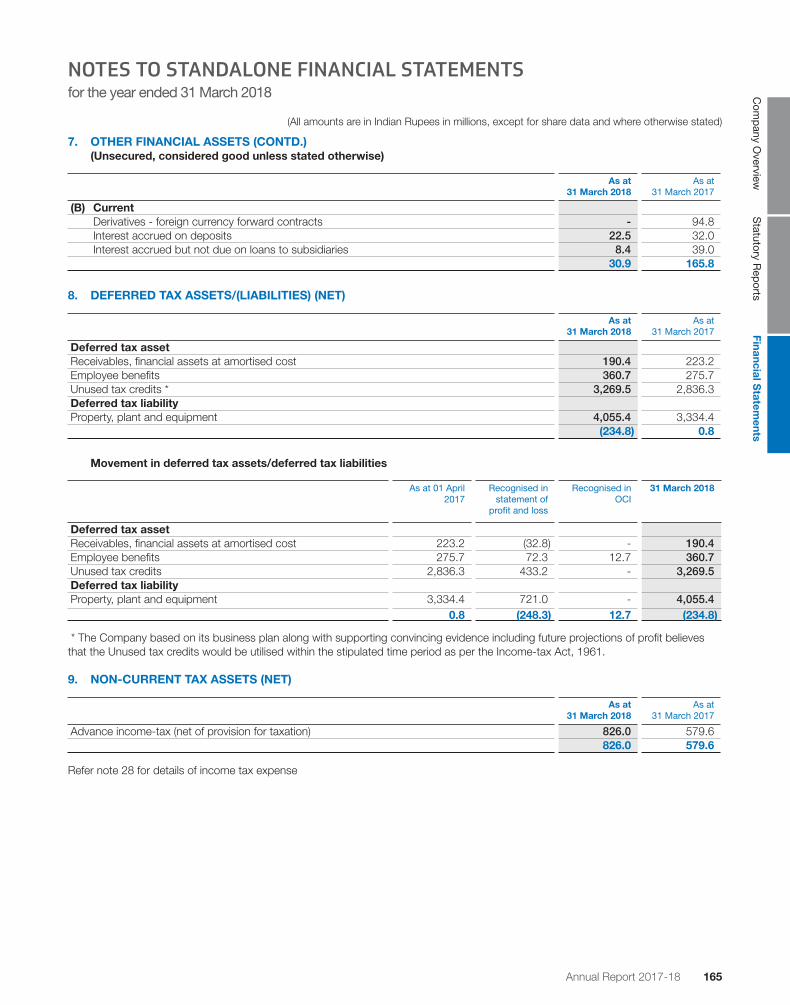
Annual Report 2017-18 165164
(All amounts are in Indian Rupees in millions, except for share data and where otherwise stated)
Com
pany O
verviewS
tatutory Rep
ortsFinancial S
tatements
NOTES TO STANDALONE FINANCIAL STATEMENTSfor the year ended 31 March 2018
7. OTHER FINANCIAL ASSETS (CONTD.) (Unsecured, considered good unless stated otherwise)
As at 31 March 2018
As at 31 March 2017
(B) Current Derivatives - foreign currency forward contracts - 94.8 Interest accrued on deposits 22.5 32.0 Interest accrued but not due on loans to subsidiaries 8.4 39.0
30.9 165.8
8. DEFERRED TAX ASSETS/(LIABILITIES) (NET)
As at 31 March 2018
As at 31 March 2017
Deferred tax asset Receivables, financial assets at amortised cost 190.4 223.2 Employee benefits 360.7 275.7 Unused tax credits * 3,269.5 2,836.3 Deferred tax liability Property, plant and equipment 4,055.4 3,334.4
(234.8) 0.8
Movement in deferred tax assets/deferred tax liabilities
As at 01 April 2017
Recognised in statement of
profit and loss
Recognised in OCI
31 March 2018
Deferred tax asset Receivables, financial assets at amortised cost 223.2 (32.8) - 190.4 Employee benefits 275.7 72.3 12.7 360.7 Unused tax credits 2,836.3 433.2 - 3,269.5 Deferred tax liability Property, plant and equipment 3,334.4 721.0 - 4,055.4
0.8 (248.3) 12.7 (234.8)
* The Company based on its business plan along with supporting convincing evidence including future projections of profit believes that the Unused tax credits would be utilised within the stipulated time period as per the Income-tax Act, 1961.
9. NON-CURRENT TAX ASSETS (NET)
As at 31 March 2018
As at 31 March 2017
Advance income-tax (net of provision for taxation) 826.0 579.6 826.0 579.6
Refer note 28 for details of income tax expense

Annual Report 2017-18 167166
(All amounts are in Indian Rupees in millions, except for share data and where otherwise stated)
NOTES TO STANDALONE FINANCIAL STATEMENTSfor the year ended 31 March 2018
10. OTHER ASSETS (Unsecured, considered good unless stated otherwise)
As at 31 March 2018
As at 31 March 2017
(A) Non currentExport incentives receivableConsidered good 566.9 418.5 Doubtful 19.6 44.8
586.5 463.3 Provision for doubtful receivables 19.6 44.8
566.9 418.5 Export rebate claims receivable 288.8 288.8 Capital advancesConsidered good 209.6 409.5 Doubtful 0.8 0.8
210.4 410.3 Provision for doubtful advances 0.8 0.8
209.6 409.5 Advances other than capital advancesConsidered good 15.5 18.0 Doubtful 30.1 30.1
45.6 48.1 Provision for doubtful advances 30.1 30.1
15.5 18.0 Balances with government authoritiesConsidered good 78.6 204.2 Doubtful 38.1 38.1
116.7 242.3 Provision for doubtful receivables 38.1 38.1
78.6 204.2 1,159.4 1,339.0
(B) CurrentExport rebate claims receivable 1,768.0 782.0 Export incentives receivable 2,438.5 2,479.5 Advances other than capital advances 1,031.4 1,838.2 Balances with government authorities 3,160.5 1,256.4 Insurance claim receivable 0.8 -
8,399.2 6,356.1
11. INVENTORIES (Valued at lower of cost and net realisable value)
As at 31 March 2018
As at 31 March 2017
Raw materials 17,967.6 12,297.8 Packing materials 2,207.3 1,577.9 Work-in-progress 9,399.3 7,788.2 Finished goods (including stock-in-trade) 3,230.1 1,499.4 Stores, spares and consumables 1,288.0 1,172.9
34,092.3 24,336.2 Details of material in transit included in inventories aboveRaw materials 888.3 665.9 Finished goods 1,359.7 80.6

Annual Report 2017-18 167166
(All amounts are in Indian Rupees in millions, except for share data and where otherwise stated)
Com
pany O
verviewS
tatutory Rep
ortsFinancial S
tatements
NOTES TO STANDALONE FINANCIAL STATEMENTSfor the year ended 31 March 2018
12. CASH AND CASH EQUIVALENTS (A) Cash and cash equivalents
As at 31 March 2018
As at 31 March 2017
Balances with banks: in current accounts 1,933.6 285.3 in cash credit accounts 313.8 31.3 in unpaid dividend account 19.0 15.9 Cash on hand 0.7 3.9 Cheques on hand 191.9 -
2,459.0 336.4
(B) For the purpose of statement of cash flows, cash and cash equivalents comprise of following:
As at 31 March 2018
As at 31 March 2017
Cash and cash equivalents as above 2,459.0 336.4 Less: Cash credit (refer note 15(B)) (40.5) (1,635.8)
2,418.5 (1,299.4)
(C) Details of Specified Bank Notes (SBN) held and transacted during the period 8 November 2016 to 30 December 2016
SBN* Other denominations
Total
Closing cash on hand as on 8 November 2016 2.3 4.1 6.4 Add: Permitted receipts - 0.8 0.8 Add: Withdrawal from bank - 0.9 0.9 Less: Permitted payments - 2.2 2.2 Less: Amount deposited into bank 2.3 0.6 2.9 Closing cash on hand - 30 December 2016 - 3.0 3.0
* For the purposes of this clause, the term “Specified Bank Notes” shall have the same meaning provided in the notification of the Government of India, in the Ministry of Finance, Department of Economic Affairs number S.O.3407(E), dated the 8 November 2016.
13. EQUITY SHARE CAPITAL
As at 31 March 2018
As at 31 March 2017
(a) Authorised 660,000,000 (31 March 2017: 660,000,000) equity shares of `1 each 660.0 660.0 1,000,000 (31 March 2017: 1,000,000) preference shares of `100 each 100.0 100.0
760.0 760.0
(b) Issued, subscribed and fully paid-up equity shares
Equity Shares
Numbers Value
As at 01 April 2016 585,169,586 585.2 Issued during the year under Employees Stock Option Plan (ESOP) (refer note 31) 712,823 0.7 As at 31 March 2017 585,882,409 585.9 Issued during the year under Employees Stock Option Plan (ESOP) (refer note 31) 25,200 0.0 As at 31 March 2018 585,907,609 585.9

Annual Report 2017-18 169168
(All amounts are in Indian Rupees in millions, except for share data and where otherwise stated)
NOTES TO STANDALONE FINANCIAL STATEMENTSfor the year ended 31 March 2018
c) Terms/rights attached to equity shares
The Company has only one class of equity shares having a par value of `1 per share. Each holder of equity shares is entitled to one vote per share.
The Company declares and pays dividends in Indian rupees. The dividend proposed by the Board of Directors is subject to the approval of shareholders in the ensuing Annual General Meeting, except in case of interim dividend.
For the year ended 31 March 2018, the amount of dividend per share declared as distributions to equity shareholders was ` 2.5 (31 March 2017: ` 2.5).
In the event of liquidation of the Company, the holders of equity shares will be entitled to receive remaining assets of the Company, after distribution of all preferential amounts. However, no such preferential amounts exist currently. The distribution will be in proportion to the number of equity shares held by the shareholders.
d) Details of shareholders holding more than 5% of total number of equity shares in the Company:
As at 31 March 2017
Numbers % holding
RPR Sons Advisors Private Limited & Mrs.P.Suneela Rani 196,376,250 33.52%
As at 31 March 2018
Numbers % holding
RPR Sons Advisors Private Limited & Mrs.P.Suneela Rani 196,376,250 33.52%
As per records of the Company, including its register of shareholders/members and other declarations received from shareholders, the above shareholding represents legal ownerships of shares and the beneficial ownership is with RPR Enterprises, a partnership firm.
e) Aggregate number of bonus shares issued, shares issued for consideration other than cash during the period of five years immediately preceding the reporting date:
Value
Equity shares allotted as fully paid bonus shares by capitalisation of securities premium Year ended 31 March 2018 - Year ended 31 March 2017 - Year ended 31 March 2016 291,982,275 Year ended 31 March 2015 - Year ended 31 March 2014 -
f) For details of shares reserved for issue under Employee stock option plan (ESOP) of the Company, refer note 31.
14. OTHER EQUITY
As at 31 March 2018
As at 31 March 2017
Capital reserve 91.1 91.1 Capital redemption reserve 90.0 90.0 Employee stock options outstanding account 0.7 0.9 Securities premium account 3,418.7 3,416.0 General reserve 7,888.4 7,888.4 Retained earnings 87,907.4 72,424.1 OCI (156.4) (134.6)
99,239.9 83,775.9
a) For details of stock options refer note 31.b) The disaggregation of changes in reserves and surplus and OCI are disclosed in statement of changes in equity.

Annual Report 2017-18 169168
(All amounts are in Indian Rupees in millions, except for share data and where otherwise stated)
Com
pany O
verviewS
tatutory Rep
ortsFinancial S
tatements
NOTES TO STANDALONE FINANCIAL STATEMENTSfor the year ended 31 March 2018
c) The details of distribution of dividend made and proposed are as under:
As at 31 March 2018
As at 31 March 2017
Cash dividends on equity shares declared and paid during the yearInterim dividend for the year ended 31 March 2018: `3.75 per share (31 March 2017: `1.95 per share)
2,197.1 1,141.1
Dividend distribution tax on interim dividend 447.3 232.3 2,644.4 1,373.4
As at 31 March 2018
As at 31 March 2017
Proposed dividend on equity shares declared at the year end *Interim dividend for the year ended 31 March 2018: `Nil per share (31 March 2017: ` 1.25 per share)
- 732.4
Dividend distribution tax on interim dividend - 149.1 - 881.5
* Under Ind AS dividend is recognised as liability in the period in which it is declared by the Company. Accordingly, the above dividend and dividend distribution tax has not been recognised in the standalone financial statements as at 31 March 18 and 31 March 17 respectively.
B. Nature and purpose of reserves
(a) Capital Reserve : Represents capital reserve balances of acquired entities which are transferred to the Company upon mergers in the earlier years.
(b) Capital redemption reserve : The Company has recognised Capital Redemption Reserve on redemption of non-convertible preference shares. The amount in Capital Redemption Reserve is equal to nominal amount of the non convertible preference shares redeemed.
(c) Employee stock options outstanding account :
The fair value of the equity-settled share based payment transactions with employees is recognised in statement of profit and loss with corresponding credit to Employee Stock Options Outstanding Account.
(d) Securities premium account : The amount received in excess of face value of the equity shares is recognised in Securities Premium Reserve. In case of equity-settled share based payment transactions, the difference between fair value on grant date and nominal value of share is accounted as securities premium reserve.
(e) General reserve : The Company has transferred a portion of the net profit of the Company before declaring dividend to general reserve pursuant to the earlier provisions of Companies Act, 1956. Mandatory transfer to general reserve is not required under the Companies Act, 2013.
(f) Retained Earnings: Retained earnings are the profits that the Company has earned till date, less any transfers to general reserve, dividends or other distribution to share holders.
(g) OCI represents Re-measurement on defined employee benefit plans :
Difference between the interest income on plan assets and the return actually achieved, any changes in the liabilities over the year due to changes in actuarial assumptions or experience adjustments within the plans, are recognised in other comprehensive income and subsequently not reclassified in to statement of profit and loss.

Annual Report 2017-18 171170
(All amounts are in Indian Rupees in millions, except for share data and where otherwise stated)
NOTES TO STANDALONE FINANCIAL STATEMENTSfor the year ended 31 March 2018
15. BORROWINGS
As at 31 March 2018
As at 31 March 2017
(A) Non current Term loans from Banks (Secured) Foreign currency term loans - 1,189.0
- 1,189.0 (B) Current Term loans from Banks (Secured) Current maturities of foreign currency term loans 651.7 1,837.4 Loans repayable on demand from Banks - working capital loans
Cash credit facilities (secured) 40.5 1,635.8 Working capital demand loan (unsecured) - 750.0 Packing credit loans (secured) 3,069.7 324.3 Packing credit loans (unsecured) 31,995.3 24,100.3 Bill discounting (unsecured) 1,432.8 702.3
37,190.0 29,350.1 Amount disclosed under the head "Other financial liabilities" (refer note 18) (651.7) (1,837.4)
36,538.3 27,512.7 (C) Details of secured and unsecured borrowings
The aggregate amount of borrowing includes:Secured borrowings 3,761.9 4,986.5 Unsecured borrowings 33,428.1 25,552.6
(D) Terms of borrowings (i) Secured term loans in foreign currency carry interest in the range of LIBOR plus 1.2% to 1.5%. Out of these loans, loans
amounting to ` Nil (31 March 2017: ` 1,080.9) are repayable in Nil (31 March 2017: two) equal annual instalments and loan amounting to ` 651.7 (31 March 2017: `1,945.5) is repayable in equal half yearly installment of one (31 March 2017: three).
(ii) Term loans are secured by first pari passu charge on all the present and future property, plant and equipment, both movable and immovable property of the Company.
(iii) All secured demand loans are secured by first pari passu charge by way of hypothecation of all the stocks, book debts and other current assets (both present and future). All secured packing credit foreign currency loans carry intrest rate in the range of LIBOR plus 20 to 50 basis points.
(iv) All unsecured packing credit foreign currency loans carry interest rate in the range of 1 month’s LIBOR plus -20 to 50 basis points with maturity within 6 months.
16. PROVISIONS
As at 31 March 2018
As at 31 March 2017
(A) Non current For employee benefits Gratuity [refer note 32(b)] 336.0 208.7
336.0 208.7 (B) Current For employee benefits Gratuity [refer note 32(b)] 90.0 65.0
Compensated absences 655.4 550.0 745.4 615.0

Annual Report 2017-18 171170
(All amounts are in Indian Rupees in millions, except for share data and where otherwise stated)
Com
pany O
verviewS
tatutory Rep
ortsFinancial S
tatements
NOTES TO STANDALONE FINANCIAL STATEMENTSfor the year ended 31 March 2018
17. TRADE PAYABLES
As at 31 March 2018
As at 31 March 2017
Total outstanding dues of micro enterprises and small enterprises (refer note 34) 296.7 238.6 Total outstanding dues of creditors other than micro enterprises and small enterprises 16,037.3 11,937.4
16,334.0 12,176.0
(Refer Note 42 for the Company’s liquidity risk management process)
18. OTHER FINANCIAL LIABILITIES
As at 31 March 2018
As at 31 March 2017
Current maturities of non-current borrowings (refer note 15(B)) 651.7 1,837.4 Interest accrued but not due on borrowings 10.7 20.5 Unclaimed dividend (refer note 35) 19.0 15.9 Capital creditors 1,820.3 1,489.3 Security deposits 1.5 1.5 Derivatives - foreign currency forward contracts 23.3 -
2,526.5 3,364.6
19. OTHER LIABILITIES
As at 31 March 2018
As at 31 March 2017
Advance from customers 61.7 71.0 Statutory liabilities 288.8 229.4 Employee payables 1,088.7 501.0
1,439.2 801.4
20. REVENUE FROM OPERATIONS
For the year ended 31 March 2018
For the year ended 31 March 2017
Sale of products (including excise duty) * 100,382.2 95,321.9 Sale of services 37.4 71.7 Other operating revenues
Scrap sales 133.2 86.5 Export incentives 2,478.7 2,332.0
103,031.5 97,812.1
*The Company is liable to Goods and Services Tax (GST) with effect from 01 July 2017. The revenues for the year ended 31 March 2018 is net of such GST. However, the revenues for the period ended upto 30 June 2017 are inclusive of excise duty.
21. OTHER INCOME
For the year ended 31 March 2018
For the year ended 31 March 2017
Interest income on financials assets (carried at amortised cost)Other deposits and receivables 39.8 138.2 Loans to subsidiaries 34.7 32.8
Dividend income on investments (carried at fair value through profit and loss) - 0.0 Provision for doubtful receivables/advances written back (net) 94.8 60.2 Bad debts recovered from trade receivables - 0.7 Foreign exchange gain (net) 585.3 989.3 Miscellaneous income 51.9 138.3
806.5 1,359.5

Annual Report 2017-18 173172
(All amounts are in Indian Rupees in millions, except for share data and where otherwise stated)
NOTES TO STANDALONE FINANCIAL STATEMENTSfor the year ended 31 March 2018
22. COST OF MATERIALS CONSUMED
For the year ended 31 March 2018
For the year ended 31 March 2017
Raw material consumedOpening stock 12,297.8 12,118.0 Add: Purchases 49,010.0 41,326.3
61,307.8 53,444.3 Less: Closing stock 17,967.6 12,297.8 Cost of raw material consumed 43,340.2 41,146.5 Packing materials consumed 5,592.5 4,895.4
48,932.7 46,041.9
23. CHANGES IN INVENTORY OF FINISHED GOODS (INCLUDING STOCK-IN-TRADE) AND WORK IN PROGRESS
For the year ended 31 March 2018
For the year ended 31 March 2017
Inventories at the end of the yearFinished goods 3,230.1 1,499.4 Work-in-progress 9,399.3 7,788.2
12,629.4 9,287.6 Inventories at the beginning of the year
Finished goods 1,499.4 1,646.2 Work-in-progress 7,788.2 7,954.6
9,287.6 9,600.8 (3,341.8) 313.2
24. EMPLOYEE BENEFITS EXPENSE
For the year ended 31 March 2018
For the year ended 31 March 2017
Salaries, wages and bonus 10,403.1 8,537.0 Contribution to provident and other funds (refer note 32(a)) 331.0 272.7 Gratuity expense (refer note 32(b)) 203.5 121.6 Leave encashment expense 204.9 189.5 Staff welfare expenses 173.9 152.0 Employee share-based payment expense - equity settled (refer note 31) - 0.2
11,316.4 9,273.0
25. FINANCE COSTS
For the year ended 31 March 2018
For the year ended 31 March 2017
Interest expense on financial liabilities measured at amortised cost 482.7 402.0 Bank and other financial charges 46.2 49.6
528.9 451.6
26. DEPRECIATION EXPENSE
For the year ended 31 March 2018
For the year ended 31 March 2017
Depreciation of property, plant and equipment 3,548.3 2,861.7 3,548.3 2,861.7

Annual Report 2017-18 173172
(All amounts are in Indian Rupees in millions, except for share data and where otherwise stated)
Com
pany O
verviewS
tatutory Rep
ortsFinancial S
tatements
NOTES TO STANDALONE FINANCIAL STATEMENTSfor the year ended 31 March 2018
27. OTHER EXPENSES
For the year ended 31 March 2018
For the year ended 31 March 2017
Conversion charges 526.6 326.2 Consumption of stores and spares 1,446.6 1,395.0 Chemicals consumed 2,166.9 1,647.9 Power and fuel 4,330.2 4,050.9 Carriage inward 449.6 413.8 Factory maintenance 307.6 266.0 Effluent treatment expenses 189.7 156.8 Excise duty on sales 332.5 1,741.6 Excise duty on changes in inventory (30.2) 4.1 Repairs and maintenance (i) Plant and machinery 843.3 751.8 (ii) Buildings 334.7 409.9 (iii) Others 68.0 19.3 Rent (refer note 30(A)) 89.5 73.9 Rates and taxes 245.2 304.8 Printing and stationery 147.7 107.9 Postage, telegram and telephones 65.2 59.1 Insurance 144.0 137.8 Legal and professional charges 1,177.7 1,052.1 Directors sitting fees 3.5 1.9 Remuneration to statutory auditors (refer note 37) 13.6 15.6 Sales commission 438.1 351.0 Carriage outwards 2,625.0 1,979.8 Selling expenses 311.6 181.0 Travelling and conveyance 191.5 183.5 Vehicle maintenance expenses 4.9 4.5 Analytical charges 1,068.8 709.7 Provision for impairment of investments (refer note 4) 200.0 - Donations (refer note 38) 1.0 8.3 Registration and filing charges 717.7 856.2 Loss on sale of property, plant and equipment (net) 0.7 34.3 Bad debts 9.9 41.0 Loss on sale of non current investments - 145.3 Fair value changes to current investments 0.0 - Corporate Social Responsibility expenditure (CSR) (refer note below) 200.0 193.6 Miscellaneous expenses 765.8 707.8
19,386.9 18,332.4
Note: Details of CSR expenditurea) Gross amount required to be spent by the Company during the year 424.9 424.5
in cash Yet to be paid in cash
Total
b) Amount spent during the year ending on 31 March 2018: i) Construction/acquisition of any asset; - - - ii) On purposes other than (i) above. 200.0 - 200.0 Amount spent during the year ending on 31 March 2017: i) Construction/acquisition of any asset; - - - ii) On purposes other than (i) above. 193.6 - 193.6

Annual Report 2017-18 175174
(All amounts are in Indian Rupees in millions, except for share data and where otherwise stated)
NOTES TO STANDALONE FINANCIAL STATEMENTSfor the year ended 31 March 2018
28. INCOME TAX
For the year ended 31 March 2018
For the year ended 31 March 2017
The major components of income tax expense for the year ended 31 March 2018 and 31 March 2017 are:Statement of profit and loss Current income tax charge 5,053.4 4,620.6 Deferred tax/ Tax credit - relating to origination and reversal of temporary differences 248.3 97.5
5,301.7 4,718.1 Other comprehensive income Deferred tax - net loss on remeasurements of defined benefit plans 12.7 29.7
12.7 29.7 Reconciliation of effective tax rate for the year ended 31 March 2018 and 31 March 2017:Profit before tax 23,429.4 21,785.7 Enacted tax rate in India 34.608% 34.608%Tax at statutory tax rate 8,108.4 7,539.6 Effect of : Tax holidays (refer Note "a" below) (2,132.1) (1,313.4)Weighted deduction allowed for research and development expenditure (765.0) (1,278.3)Others (net) 90.4 (229.8)Total (2,806.7) (2,821.5)Income tax expense 5,301.7 4,718.1 Effective tax rate 22.628% 21.657%
Notes: (a) The Company benefits from the tax holiday available for units set up under the Special Economic Zone Act, 2005.These tax
holidays are available for a period of fifteen years from the date of commencement of operations. Under the SEZ scheme, the unit which begins providing services on or after 01 April 2005 will be eligible for deductions of 100% of profits or gains derived from export of services for the first five years, 50% of such profit or gains for a further period of five years and 50% of such profits or gains for the balance period of five years subject to fulfillment of certain conditions. From 01 April 2011 units set up under SEZ scheme are subject to Minimum Alternate Tax (MAT).
(b) During the year ended 31 March 2018 and 31 March 2017, the Company has paid dividend to shareholders, this has resulted in payment of dividend distribution tax to the taxation authorities. The Company believes that dividend distribution tax represents additional payment to tax authorities on behalf of shareholders. Hence, dividend distribution tax paid is charged to equity.
(c) There are no unrecognised deferred tax assets and liabilities as at 31 March 2018 and 31 March 2017.
29 EARNINGS PER SHARE The following reflects the income and share data used in the basic and diluted EPS computations:
31 March 2018 31 March 2017
EarningsProfit after taxation considered for calculation of basic and diluted earnings per share 18,127.7 17,067.6 SharesWeighted average number of Equity Shares considered for calculation of basic earnings per share (a)
585,882,685 585,213,641
Effect of dilution on account of Employee Stock Options granted (b) 5,039 9,782 Weighted average number of equity Shares considered for calculation of diluted earnings per share (a+b)
585,887,724 585,223,423
Earnings per share of face value `1/- - Basic 30.94 29.16 - Diluted 30.94 29.16
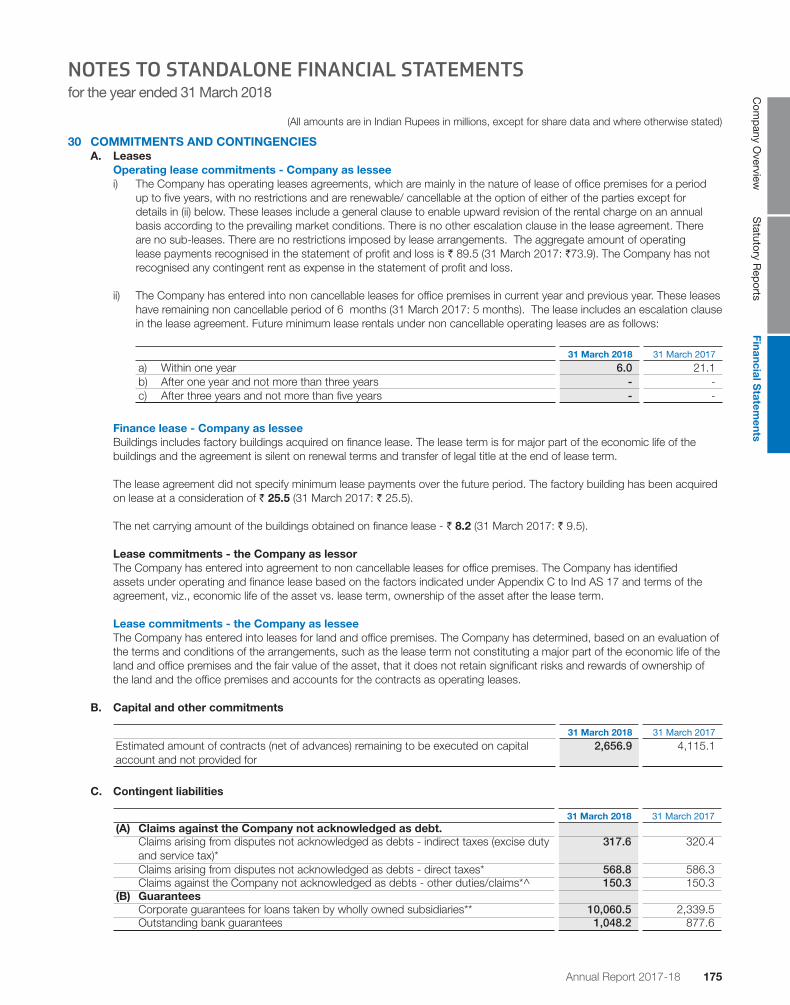
Annual Report 2017-18 175174
(All amounts are in Indian Rupees in millions, except for share data and where otherwise stated)
Com
pany O
verviewS
tatutory Rep
ortsFinancial S
tatements
NOTES TO STANDALONE FINANCIAL STATEMENTSfor the year ended 31 March 2018
30 COMMITMENTS AND CONTINGENCIES A. Leases Operating lease commitments - Company as lessee i) The Company has operating leases agreements, which are mainly in the nature of lease of office premises for a period
up to five years, with no restrictions and are renewable/ cancellable at the option of either of the parties except for details in (ii) below. These leases include a general clause to enable upward revision of the rental charge on an annual basis according to the prevailing market conditions. There is no other escalation clause in the lease agreement. There are no sub-leases. There are no restrictions imposed by lease arrangements. The aggregate amount of operating lease payments recognised in the statement of profit and loss is ` 89.5 (31 March 2017: `73.9). The Company has not recognised any contingent rent as expense in the statement of profit and loss.
ii) The Company has entered into non cancellable leases for office premises in current year and previous year. These leases have remaining non cancellable period of 6 months (31 March 2017: 5 months). The lease includes an escalation clause in the lease agreement. Future minimum lease rentals under non cancellable operating leases are as follows:
31 March 2018 31 March 2017
a) Within one year 6.0 21.1 b) After one year and not more than three years - - c) After three years and not more than five years - -
Finance lease - Company as lessee Buildings includes factory buildings acquired on finance lease. The lease term is for major part of the economic life of the
buildings and the agreement is silent on renewal terms and transfer of legal title at the end of lease term.
The lease agreement did not specify minimum lease payments over the future period. The factory building has been acquired on lease at a consideration of ` 25.5 (31 March 2017: ` 25.5).
The net carrying amount of the buildings obtained on finance lease - ` 8.2 (31 March 2017: ` 9.5).
Lease commitments - the Company as lessor The Company has entered into agreement to non cancellable leases for office premises. The Company has identified
assets under operating and finance lease based on the factors indicated under Appendix C to Ind AS 17 and terms of the agreement, viz., economic life of the asset vs. lease term, ownership of the asset after the lease term.
Lease commitments - the Company as lessee The Company has entered into leases for land and office premises. The Company has determined, based on an evaluation of
the terms and conditions of the arrangements, such as the lease term not constituting a major part of the economic life of the land and office premises and the fair value of the asset, that it does not retain significant risks and rewards of ownership of the land and the office premises and accounts for the contracts as operating leases.
B. Capital and other commitments
31 March 2018 31 March 2017
Estimated amount of contracts (net of advances) remaining to be executed on capital account and not provided for
2,656.9 4,115.1
C. Contingent liabilities
31 March 2018 31 March 2017(A) Claims against the Company not acknowledged as debt. Claims arising from disputes not acknowledged as debts - indirect taxes (excise duty
and service tax)* 317.6 320.4
Claims arising from disputes not acknowledged as debts - direct taxes* 568.8 586.3 Claims against the Company not acknowledged as debts - other duties/claims*^ 150.3 150.3 (B) Guarantees Corporate guarantees for loans taken by wholly owned subsidiaries** 10,060.5 2,339.5 Outstanding bank guarantees 1,048.2 877.6

Annual Report 2017-18 177176
(All amounts are in Indian Rupees in millions, except for share data and where otherwise stated)
NOTES TO STANDALONE FINANCIAL STATEMENTSfor the year ended 31 March 2018
* in respect of above matters, future cash outflows in respect of contingent liabilities are determinable only by the occurrence or non occurrence of one or more uncertain future events not wholly within the control of the Company. The Company is contesting these demands and the Management, including its advisors, believe that its position will likely be upheld in the appellate process. No expense has been accrued in the standalone financial statements for the demands raised. The Management believes that the ultimate outcome of this proceeding will not have a material adverse effect on the Company’s financial position and results of operations.
** Guarantees furnished towards business requirement in respective subsidiaries. The Company has assessed that it is only possible, but not probable, that outflow of economic resources will be required.
The Company is involved in disputes, claims, Governmental and /or regulatory inspection, inquires, including patents and commercial maters that arise from time to time in the ordinary course of business. The same are subject to uncertain future events not wholly within the control of the Company. The management does not expect the same to have materially adverse effect on its financial position, as it believes the likely hood of any loss is not probable.
31 SHARE BASED PAYMENTS Employee Stock Option Plan “ESOP-2006” The Company instituted an Employee Stock Option Plan “ESOP-2006” for issue of shares to eligible employees of the Company
as per the special resolution passed in the 19th Annual General Meeting held on 18 September 2006. The compensation committee of the Board of directors accordingly, granted 3,240,500 options under eight grants of 175,000, 25,000, 90,000, 1,205,000, 300,000, 500,000, 915,500 and 30,000 options to eligible employees on 30 October 2006, 31 July 2007, 31 October 2007, 16 December 2011, 19 June 2012, 09 January 2013, 28 January 2013 and 09 August 2013 respectively. The method of settlement under scheme is by issue of equity shares of the Company and there are no cash settlement alternatives for the employees. Each option comprises of one underlying Equity Share of `1/- each. The said options vest on an annual basis at 10%, 15%, 25% and 50% over a period of four years and can be exercised over a period of six years from the date of grant of options. The options have been granted at the then prevailing market price of ` 120.70, ` 132.35, ` 114.50, ` 91.60, ` 106.05, ` 200.70, ` 187.40 and ` 161.30 per share respectively. The fair value of share options grants is estimated at the date of grant using Black-Scholes model, taking into account the terms and conditions upon which the share options were granted.
The details of ESOP 2006 Scheme are summarised below:
Grant Grant date Number of options Granted
Exercise price* Weighted Average Fair
value of option at grant date*
1st Grant 30 October 2006 175,000 60.35 73.102nd Grant 31 July 2007 25,000 66.18 78.823rd Grant 31 October 2007 90,000 57.25 68.184th Grant 16 December 2011 1,753,800 45.80 54.355th Grant 19 June 2012 300,000 53.03 57.426th Grant 09 January 2013 500,000 100.35 119.227th Grant 28 January 2013 1,483,170 93.70 111.328th Grant 09 August 2013 57,000 80.65 96.30
*Adjusted for bonus issue.
The details of activity under the Scheme ESOP 2006 are summarised below :
31 March 2018 31 March 2017
Options outstanding at the beginning of the year 56,219 1,027,120Granted during the year - -Vested / exercisable during the year 56,219 638,932Exercised during the year 25,200 712,823Forfeited during the year subject to reissue - 258,078Options outstanding at end of the year 31,019 56,219Exercisable at the end of the year 31,019 27,719Weighted average exercise price for all the above options (`) 80.66 88.76Weighted average fair value of options at the date of grant (`) 96.30 105.63

Annual Report 2017-18 177176
(All amounts are in Indian Rupees in millions, except for share data and where otherwise stated)
Com
pany O
verviewS
tatutory Rep
ortsFinancial S
tatements
NOTES TO STANDALONE FINANCIAL STATEMENTSfor the year ended 31 March 2018
The details of share options outstanding are summarised below:
Range of exercise prices
Number of options
outstanding
Weighted average remaining contractual
life of options (in years)
As at 31 March 2018 80 to 94 31,019 1.36 As at 31 March 2017 80 to 94 56,219 2.23
The following table lists the assumptions used for the plan:
31 March 2018
Grant Dividend yield Expected
volatility Risk-free
interest rate Expected life of
options granted in years
7th Grant 0.80% 0.31% 8% 48th Grant 0.61% 0.31% 8% 4
31 March 2017
Grant Dividend yield Expected
volatility Risk-free
interest rate Expected life of
options granted in years
7th Grant 0.80% 0.31% 8% 48th Grant 0.61% 0.31% 8% 4
32 EMPLOYEE BENEFITS
31 March 2018 31 March 2017
a) Disclosures related to defined contribution plan Provident fund contribution * 311.9 266.4 Contribution to ESI** 39.1 21.9
* Includes `19.3 (31 March 2017: `14.3) transferred to capital work in progress ** Includes `0.7 (31 March 2017: `1.3) transferred to capital work in progress
b) Disclosures related to defined benefit plan
The Company has a defined benefit gratuity plan governed by the Payment of Gratuity Act, 1972. Every employee who has completed five years or more of service is entitled to gratuity on departure at 15 days last drawn salary for each completed year of service or part thereof in excess of six months.
This defined benefit plan exposes the Company to acturial risk, such as longevity risk, currency risk, interest rate risk and market (investment) risk.
The plan is funded with Life Insurance Corporation in the form of a qualifying insurance policy. The following tables summarise the components of net benefit expense recognised in the statement of profit and loss, the fund status and amounts recognised in the balance sheet:
Net employee benefit expense (included under employee benefit expenses)
31 March 2018 31 March 2017
Current service cost 143.5 114.4 Past service cost 55.3 - Interest on defined benefit liability 12.8 18.1 Net employee benefit expenses* 211.6 132.5
* Includes `8.2 (31 March 2017: `10.9) transferred to capital work in progress

Annual Report 2017-18 179178
(All amounts are in Indian Rupees in millions, except for share data and where otherwise stated)
NOTES TO STANDALONE FINANCIAL STATEMENTSfor the year ended 31 March 2018
Details of the employee benefits obligations and plan assets are as follows:
31 March 2018 31 March 2017
Present value of funded obligation 1,054.5 818.3 Fair value of plan assets 628.5 544.6 Net defined benefit liability 426.0 273.7
Details of changes in present value of defined benefit obligation are as follows:
31 March 2018 31 March 2017
Opening defined benefit obligation 818.3 618.1 Current service cost 143.5 114.4 Past service cost 55.3 - Interest on defined benefit obligation 59.0 47.9 Benefits paid (49.9) (47.3)Remeasurement due to:
Actuarial loss arising from changes in experience 43.8 14.4 Actuarial loss arising from changes in demographic assumptions 6.3 - Actuarial (gain)/loss arising from changes in financial assumptions (21.8) 70.8
Closing defined benefit obligation 1,054.5 818.3
Details of changes in fair value of plan assets are as follows:
31 March 2018 31 March 2017
Opening fair value of plan assets 544.6 340.5 Interest on plan assets 46.1 29.8 Employer Contribution 93.9 222.2 Benefits paid (49.9) (47.3)Remeasurement due to - actual return on plan assets less interest on plan assets (6.2) (0.6)Closing fair value of plan assets 628.5 544.6
Sensitivity analysis The sensitivity of over all plan obligations to changes in key assumptions are as follows:
31 March 2018 31 March 2017
Defined benefit obligation without effect of projected salary growth rate 677.4 381.1 Add: effect of salary growth rate 377.1 437.2 Defined benefit obligation with effect of projected salary growth 1,054.5 818.3 Defined benefit obligation, using discount rate plus 50 basis points 1,019.8 769.2 Defined benefit obligation, using discount rate minus 50 basis points 1,091.3 871.9 Defined benefit obligation, using salary growth rate plus 50 basis points 1,089.9 864.4 Defined benefit obligation, using salary growth rate minus 50 basis points 1,020.8 774.8
The major categories of plan assets as a percentage of the fair value of total plan assets are as follows:
31 March 2018 31 March 2017
Funds managed by Insurers 100.00% 100.00%
The principal assumptions used in determining gratuity obligations for the Company’s plans are shown below Financial assumptions
31 March 2018 31 March 2017
Discount rate (p.a.) 7.70% 7.40%Expected salary increase (p.a)
Until 2 years - 10.00%Beyond 2 years - 7.00%Until 1 year 10.00% - Beyond 1 year 7.00% -
Demographic assumptionsMortality rate (% of IALM 06-08) 100% 100%

Annual Report 2017-18 179178
(All amounts are in Indian Rupees in millions, except for share data and where otherwise stated)
Com
pany O
verviewS
tatutory Rep
ortsFinancial S
tatements
NOTES TO STANDALONE FINANCIAL STATEMENTSfor the year ended 31 March 2018
Attrition rate 2018 2017
Age (years) Rates (p.a) Age (years) Rates (p.a)
21 - 30 16% 21 - 30 8% 31 - 40 12% 31 - 40 4% 41 - 50 3% 41 - 57 1% 51 - 57 23% - -
Discount rate : The discount rate is based on the prevailing market yields of Indian Governmet securities as at the balance sheet date for the estimated term of obligations.
Salary escalation rate : The estimate of future salary increases considered takes into account the inflation, seniority, promotion and other related factors.
Maturity profile of the defined benefit obligation
31 March 2018 31 March 2017
Weighted average duration of defined benefit obligation (in years) 6.77 12.53Expected future cash flow of gratuity
Within 12 months 143.2 43.0 Between 2 and 5 years 488.3 160.8 Between 5 and 10 years 399.6 223.5 Beyond 10 years 984.3 2,099.6
Notes: 1. The estimates of future salary increases, considered in actuarial valuation, take account of inflation, seniority, promotion and
other relevant factors, such as supply and demand in the employment market.
2. The Company expects to contribute ` 90.0 (31 March 2017: ` 65.0) during the year ended 31 March 2019 to the qualifying insurance policy .
3. The sensitivity analysis above have been determined based on a method that extrapolates the impact on defined benefit obligation as a result of reasonable changes in key assumptions occurring at the end of the reporting period by varying one actuarial assumption, keeping all other actuarial assumptions constant.
33 CAPITAL WORK-IN-PROGRESS INCLUDES EXPENDITURE DURING CONSTRUCTION PERIOD PENDING CAPITALISATION
31 March 2018 31 March 2017
Balance brought forward 1,335.8 960.2 Add: Incurred during the year Salaries, wages and bonus 338.7 443.5 Consumption of material for testing 173.5 249.1 Consumption of stores and spares 95.1 208.3 Carriage inward 1.5 1.5 Power and fuel 122.9 270.2 Conversion charges 39.2 50.8 Rates and taxes 9.0 30.7 Printing and stationery 5.7 8.6 Postage, telegram and telephones 2.0 2.5 Insurance 1.9 (1.0)Legal and professional charges 9.2 8.9 Travelling and conveyance 7.6 10.4 Depreciation 2.6 3.7 Factory maintenance 42.4 46.5 Miscellaneous expenses 31.1 69.7
2,218.2 2,363.6 Less: Capitalised to property, plant and equipment during the year 623.3 1,027.8 Balance carried forward 1,594.9 1, 335.8

Annual Report 2017-18 181180
(All amounts are in Indian Rupees in millions, except for share data and where otherwise stated)
NOTES TO STANDALONE FINANCIAL STATEMENTSfor the year ended 31 March 2018
34 DETAILS OF DUES TO MICRO AND SMALL ENTERPRISES AS DEFINED UNDER THE MSMED ACT,2006
31 March 2018 31 March 2017
The principal amount remaining unpaid to any supplier as at the end of each accounting year (including ` 10.95 shown under capital creditors [31 March 2017: `NIL])
307.7 238.6
The amount of interest accrued and remaining unpaid as at the end of the year. Nil Nil Amount of interest paid by the Company in terms of Sec 16, of Micro, Small and Medium Enterprise Development Act, 2006 along with the amounts of payments made beyond the appointed date during the year.
Nil Nil
Amount of interest due and payable for the period of delay in making payment without the interest specified under the Micro, Small and Medium Enterprise Development Act, 2006.
Nil Nil
The amount of interest accrued and remaining unpaid at the end of each accounting year; and Nil Nil The amount of further interest remaining due and payable in the succeeding years, until such date when the interest dues as above are actually paid to the small enterprises for the purpose of disallowance as a deductible expenditure under section 23 of the Micro, Small and Medium Enterprise Development Act, 2006.
Nil Nil
35 In respect of the amounts mentioned under section 125 of the Companies Act, 2013 there are no dues that are to be credited to the Investor Education and Protection Fund as at 31 March 2018 (31 March 2017: ` Nil).
36 RESEARCH AND DEVELOPMENT EXPENSES a. Details of Research and development expenses incurred during the year, debited under various heads of
statement of profit and loss is given below
31 March 2018 31 March 2017
Material and stores and spares consumption 1,258.7 894.0 Power and fuel 127.5 106.3 Repairs and maintenance 42.0 41.6 Employee benefits expense 1,445.1 1,196.6 Analytical charges 1,015.0 659.3 Legal & Professional charges 886.2 846.0 Registration and filing fee 618.2 793.2 Depreciation 290.4 238.7 Others 212.0 187.6 Total 5,895.1 4,963.3
b. Details of capital expenditure incurred for Research and development are given below:
31 March 2018 31 March 2017
Buildings 44.6 129.6 Plant and equipment
- Plant and equipment 119.3 145.4 - Lab equipment 334.8 530.1 - Pipes and valves 17.7 14.3 - Data processing equipment 27.8 28.5 - Electrical installations 17.0 48.0
Office equipment 3.9 4.2 Furniture and fixtures 31.2 40.6 Total 596.3 940.7

Annual Report 2017-18 181180
(All amounts are in Indian Rupees in millions, except for share data and where otherwise stated)
Com
pany O
verviewS
tatutory Rep
ortsFinancial S
tatements
NOTES TO STANDALONE FINANCIAL STATEMENTSfor the year ended 31 March 2018
37 REMUNERATION TO STATUTORY AUDITORS
31 March 2018 31 March 2017
As Auditors :Statutory audit 8.6 7.9 Limited review - standalone 2.1 2.1 Limited review - consolidation 1.8 3.0
In other capacity:Certification 0.7 0.2 Others - 1.5
Reimbursement of expenses and taxes 0.4 0.9 13.6 15.6
38 DONATION TO POLITICAL PARTIES
31 March 2018 31 March 2017
Communist Party of India (Marxist) 0.5 0.5 Communist Party of India 0.5 - Bharatiya Janata Party - 2.0
1.0 2.5
39 RELATED PARTY DISCLOSURES Names of related parties and description of relationship Subsidiaries 1 APL Pharma Thai Limited, Thailand 2 All Pharma (Shanghai) Trading Company Limited, China 3 Aurobindo Pharma USA Inc., USA 4 Aurobindo Pharma Industria Farmaceutica Ltda, Brazil 5 Helix Healthcare B.V., The Netherlands 6 Aurobindo Pharma Produtos Farmaceuticos Limitada, Brazil 7 APL Healthcare Limited, India 8 Auronext Pharma Private Limited, India 9 APL Research Centre Limited, India 10 Auro Pharma Inc., Canada 11 Aurobindo Pharma (Pty) Limited, South Africa 12 Agile Pharma B.V., The Netherlands 13 Auro Healthcare (Nigeria) Limited, Nigeria 14 Aurobindo Ilac Sanayi Ve Ticaret Limited Sirketi, Turkey (liquidated w.e.f. 31 October 2017) 15 Aurobindo Pharma Japan K.K., Japan 16 Aurex B.V. (formerly Pharmacin B.V.), The Netherlands 17 Aurobindo Pharma GmbH, Germany 18 Aurobindo Pharma (Portugal) Unipessoal Limitada., Portugal** 19 Laboratorios Aurobindo S.L., Spain 20 Aurobindo Pharma B.V., The Netherlands (formerly known as Actavis B.V.) 21 Aurobindo Pharma (Romania) S.r.l, Romania 22 Aurobindo Pharma (Italia) S.r.l, Italy 23 Aurobindo Pharma (Malta) Limited, Malta 24 APL Swift Services (Malta) Limited, Malta 25 Milpharm Limited, UK 26 Aurolife Pharma LLC, USA 27 Auro Peptides Limited, India 28 Auromedics Pharma USA LLC, USA (dissolved w.e.f. 31 March 2018) 29 Aurovida Farmaceutica S.A. DE C.V., Mexico 30 Curepro Parenterals Limited, India 31 Hyacinths Pharma Private Limited, India 32 Silicon life sciences Private Limited, India 33 AuroZymes Limited, India

Annual Report 2017-18 183182
(All amounts are in Indian Rupees in millions, except for share data and where otherwise stated)
NOTES TO STANDALONE FINANCIAL STATEMENTSfor the year ended 31 March 2018
34 Aurobindo Pharma Colombia S.A.S, Columbia 35 Aurovitas, Unipessoal LDA, Portugal** 36 Arrow Generiques SAS, France 37 Auro Health LLC, USA 38 Pharmacin B.V. (formerly Aurex B.V.), The Netherlands 39 1980 Puren Pharma GmbH (formerly Actavis Management GmbH), Germany 40 Puren Pharma GmbH & Co., KG (formerly Actavis Deutschland GmbH & Co., KG), Germany 41 Aurovitas Spain SA (formerly Actavis Spain SA) 42 Natrol LLC, USA 43 Aurovitas Pharma Polska, Poland (w.e.f 31 March 2017) 44 Aurogen South Africa (Pty) Ltd, South Africa (w.e.f. 25 January 2017) 45 Aurobindo Pharma USA LLC, USA (w.e.f 14 April 2016 and dissolved w.e.f. 31 March 2018) 46 Auro AR LLC, USA (w.e.f. 2 May 2017) 47 Auro Vaccines LLC, USA (w.e.f. 27 January 2017) 48 Auro Logistics LLC, USA (w.e.f. 28 April 2017) 49 Acrotech Biopharma LLC, USA (w.e.f. 05 January 2018) 50 Generis Farmaceutica S.A, Portugal (w.e.f. 01 May 2017) 51 Mer Medicamentos, Lda, Portugal (w.e.f. 01 May 2017)** 52 Generis Phar Unipessoal Lda., Portugal (w.e.f. 01 May 2017) 53 Farma APS - Promoção de Medicamentos, Unipessoal Lda. (w.e.f. 01 May 2017 and dissolved w.e.f. 25 January 2018) 54 Aurobindo Pharma Saudi Arabia Limited Company (w.e.f 08 May 2017) 55 Auro Pharma India Private Limited, India (w.e.f 20 December 2017) 56 Aurovitas Pharma Ceska Republica s.r.o , Czech Republic ( w.e.f.23 December 2017) 57 Generis MZ, Lda., Mozambique (w.e.f. 01 May 2017 and dissolved w.e.f. 19 March 2018) 58 Aurovitas Pharma (Tazihou) Ltd, China( w.e.f. 29 January 2018)
**Mer Medicamentos, Lda, Portugal, Aurovitas, Unipessoal LDA, Portugal and Aurobindo Pharma (Portugal) Unipessoal Limitada., Portugal were merged with Generis Farmaceutica S.A., w.e.f. 01 April 2018.
Joint ventures 1 Novagen Pharma (Pty) Limited, South Africa (Joint Venture of a Subsidiary, Aurobindo Pharma (Pty) Limited, South Africa) 2 Eugia Pharma Specialities Limited, India 3 Tergene Biotech Private Limited, India (w.e.f. 01 April 2015) 4 Raidurgam developers limited, India (formerly known as Aurobindo Antibiotics limited, India) Enterprises over which key management personnel or their relatives exercise significant influence 1 Pravesha Industries Private Limited, India 2 Sri Sai Packaging, India (Partnership firm) 3 Trident Chemphar Limited, India 4 Auropro Soft Systems Private Limited, India 5 Axis Clinicals Limited, India 6 Pranit Projects Private Limited, India 7 Pranit Packaging Private Limited, India 8 SGD Pharma India Limited (formerly Cogent Glass Limited), India 9 Orem Access Bio Inc, India 10 Veritaz Healthcare Limited, India 11 Alex Merchant PTE. LTD, Singapore 12 Trident Petrochemicals DMCC, Dubai 13 Axis Clinicals LLC, USA 14 Alex Merchant DMCC, Dubai 15 Crest Cellulose Private Limited, India 16 East Pharma Technologies, India (Partnership firm) 17 Axis Clinicals Latina SA DE CV, Mexico 18 Viwyn Pharma Private limited, India 19 Gelcaps Industries, India

Annual Report 2017-18 183182
(All amounts are in Indian Rupees in millions, except for share data and where otherwise stated)
Com
pany O
verviewS
tatutory Rep
ortsFinancial S
tatements
NOTES TO STANDALONE FINANCIAL STATEMENTSfor the year ended 31 March 2018
Key managerial personnel 1 Mr. K. Nityananda Reddy, Whole-time Director 2 Dr. M. Sivakumaran, Whole-time Director 3 Mr. M. Madan Mohan Reddy, Whole-time Director 4 Mr. P. Sarath Chandra Reddy, Whole-time Director (from 01 June 2016) 5 Mr. N. Govindarajan, Managing Director 6 Mr. Santhanam Subramanian, Chief Financial Officer 7 Mr. A. Mohan Rami Reddy, Company Secretary (upto 31 May 2016 ) 8 Mr. B. Adireddy, Company Secretary (w.e.f. 01 June 2016) 9 Mr. K. Ragunathan, Independent Director 10 Mr. M. Sitarama Murty, Independent Director 11 Mr. D. Rajagopala Reddy, Independent Director (Upto 08 February 2017 ) 12 Dr. (Mrs.) Avnit Bimal Singh, Independent Director 13 Mr.Rangaswamy Rathakrishnan Iyer, Independent Director (Upto 09 December 2017) 14 Mr.P.Venkata Ramprasad Reddy, Non Executive promoter director 15 Mrs.Savitha Mahajan, Independent Diretor (w.e.f. 16 December 2017) Relatives to key managerial personnel 1 Mr. Vishnu M Sriram (son-in-law of Dr. M. Sivakumaran, Wholetime Director) Transactions with related parties
Particulars 31 March 2018 31 March 2017
a. Loans given and repayment thereof Transactions with subsidiaries
AuroZymes Limited, India Receipt against loan and interest 4.2 0.9 Interest accrued 6.6 6.1 Loan given 23.0 16.0 Balance receivable 87.5 62.1
Silicon life sciences Private Limited, India Receipt/Converted into 9.5% cumulative redemable preferece shares against loan and interest
311.6 -
Interest accrued 6.1 31.4 Loan given - 108.5 Balance receivable 36.8 342.4
Auronext Pharma Private Limited, IndiaReceipt/Converted into 9.5% cumulative redemable preferece shares against loan and interest
221.5 40.0
Interest accrued 10.0 1.5 Loan given 170.0 80.0 Balance receivable - 41.5
Transactions with Joint ventureRaidurgam developers limited
Receipt/Converted into optionally convertible debentures against loan and interest 1,071.8 - Interest accrued 8.3 - Loan given 1,065.2 - Balance receivable 1.8 -
b. Sale/purchase of goods, services and other transactions Transactions with subsidiaries

Annual Report 2017-18 185184
(All amounts are in Indian Rupees in millions, except for share data and where otherwise stated)
NOTES TO STANDALONE FINANCIAL STATEMENTSfor the year ended 31 March 2018
Particulars 31 March 2018 31 March 2017
APL Pharma Thai Limited, Thailand Sale of goods/(returns) 21.5 (35.4)
All Pharma (Shanghai) Trading Company Limited, China Purchase of goods 0.4 14.9 Reimbursement of expenses 10.5 5.7
Aurobindo Pharma Produtos Farmaceuticos Ltda, Brazil Sale of goods 114.8 121.6 Reimbursement of expenses - 0.8 Sales Commission 17.8 21.7
APL Swift Services (Malta) Limited, MaltaSale of goods 3,550.9 2,715.7 Reimbursement of expenses 48.4 40.7 Reimbursement of expenses received 3.2 86.6
Aurobindo Pharma USA Inc., USASale of goods 27,182.9 20,628.9 Purchase of goods 0.1 -
Aurobindo Pharma Industria Farmaceutica Ltda, BrazilSale of goods 625.0 560.6 Sale of asset 0.7 - Reimbursement of expenses 0.8 4.8
Auro Pharma Inc., CanadaSale of goods 744.3 425.9 Reimbursement of expenses 1.9 -
Aurobindo Pharma (Pty) Limited, South AfricaSale of goods 209.1 108.7 Reimbursement of expenses 0.1 Sales Commission 8.2 0.2
Pharmacin B.V., The Netherlands (formerly Aurex B.V.)Sale of goods 8.4 8.6 Sales Commission 0.2 -
Aurex B.V., The Netherlands (formerly Pharmacin B.V.)Sale of goods 40.6 29.1 Sales Commission 19.9 4.4 Reimbursement of expenses 0.2 0.1
Milpharm Limited, UKSale of goods 3,150.4 1,573.2 Reimbursement of expenses 25.7 16.6
Aurolife Pharma LLC, USASale of goods 2,127.0 2,906.0 Reimbursement of expenses 1.3 5.0 Reimbursement of expenses received - 18.8
Aurobindo Pharma Japan K.K., JapanSale of goods 152.3 397.5 Sales Commission 22.2 26.3
Aurobindo Pharma (Malta) Limited, MaltaReimbursement of expenses 4.0 1.3
Auronext Pharma Private Limited, IndiaSale of goods 276.5 361.8 Purchase of goods 30.3 41.8 Purchases of asset 1.1 - Rent received 1.8 1.8 Reimbursement of expenses received 0.9 17.7
Laboratorios Aurobindo S.L, SpainSale of goods 10.6 397.2
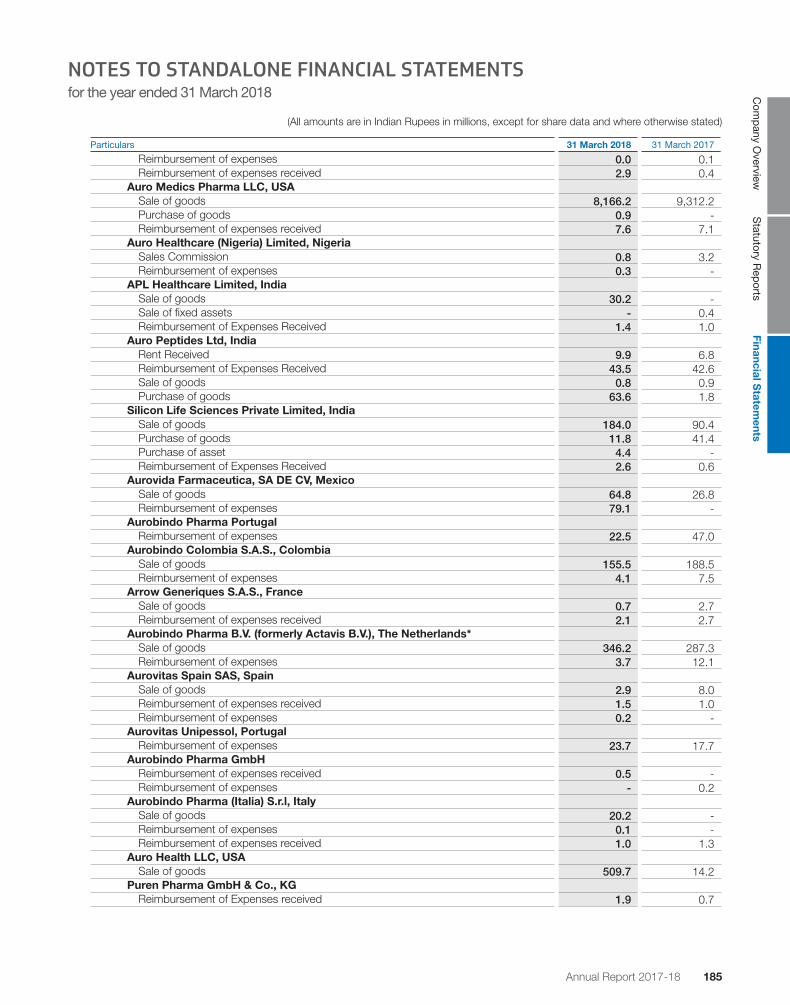
Annual Report 2017-18 185184
(All amounts are in Indian Rupees in millions, except for share data and where otherwise stated)
Com
pany O
verviewS
tatutory Rep
ortsFinancial S
tatements
NOTES TO STANDALONE FINANCIAL STATEMENTSfor the year ended 31 March 2018
Reimbursement of expenses 0.0 0.1 Reimbursement of expenses received 2.9 0.4
Auro Medics Pharma LLC, USASale of goods 8,166.2 9,312.2 Purchase of goods 0.9 - Reimbursement of expenses received 7.6 7.1
Auro Healthcare (Nigeria) Limited, NigeriaSales Commission 0.8 3.2 Reimbursement of expenses 0.3 -
APL Healthcare Limited, IndiaSale of goods 30.2 - Sale of fixed assets - 0.4 Reimbursement of Expenses Received 1.4 1.0
Auro Peptides Ltd, IndiaRent Received 9.9 6.8 Reimbursement of Expenses Received 43.5 42.6 Sale of goods 0.8 0.9 Purchase of goods 63.6 1.8
Silicon Life Sciences Private Limited, IndiaSale of goods 184.0 90.4 Purchase of goods 11.8 41.4 Purchase of asset 4.4 - Reimbursement of Expenses Received 2.6 0.6
Aurovida Farmaceutica, SA DE CV, MexicoSale of goods 64.8 26.8 Reimbursement of expenses 79.1 -
Aurobindo Pharma PortugalReimbursement of expenses 22.5 47.0
Aurobindo Colombia S.A.S., ColombiaSale of goods 155.5 188.5 Reimbursement of expenses 4.1 7.5
Arrow Generiques S.A.S., FranceSale of goods 0.7 2.7 Reimbursement of expenses received 2.1 2.7
Aurobindo Pharma B.V. (formerly Actavis B.V.), The Netherlands*Sale of goods 346.2 287.3 Reimbursement of expenses 3.7 12.1
Aurovitas Spain SAS, SpainSale of goods 2.9 8.0 Reimbursement of expenses received 1.5 1.0 Reimbursement of expenses 0.2 -
Aurovitas Unipessol, PortugalReimbursement of expenses 23.7 17.7
Aurobindo Pharma GmbHReimbursement of expenses received 0.5 - Reimbursement of expenses - 0.2
Aurobindo Pharma (Italia) S.r.l, ItalySale of goods 20.2 - Reimbursement of expenses 0.1 - Reimbursement of expenses received 1.0 1.3
Auro Health LLC, USASale of goods 509.7 14.2
Puren Pharma GmbH & Co., KG Reimbursement of Expenses received 1.9 0.7
Particulars 31 March 2018 31 March 2017

Annual Report 2017-18 187186
(All amounts are in Indian Rupees in millions, except for share data and where otherwise stated)
NOTES TO STANDALONE FINANCIAL STATEMENTSfor the year ended 31 March 2018
Hyacinths Pharma Private Limited, India Sale of asset 2.0 -
Aurovitas Pharma Polska, PolandReimbursement of expenses 75.3 -
Generis Farmaceutica SASale of goods 70.6 -
Helix Healthcare B.V., The NetherlandsCorporate guarantee given 4,235.0 -
Agile Pharma BV, The NetherlandsCorporate guarantee given 7,827.3 -
c. Sale/purchase of goods, services and other transactions Transactions with Joint Venture
Novagen Pharma (Pty) Limited, South AfricaSale of goods 209.7 274.9
Raidurgam developers limitedSale of land 1,681.2 - Reimbursement of expenses 152.1 -
Eugia Pharma Specialities Ltd, IndiaSale of goods 10.2 0.5 Purchase of goods 0.5 - Reimbursement of Expenses Received 3.4 2.4
d. Transactions with enterprises over which key management personnel or their relatives exercise significant influence
Pravesha Industries Private Limited, IndiaSale of goods 0.3 0.1 Purchase of goods 2,155.8 1,804.3 Rent and electricity charges received - 0.2
Sri Sai Packaging, IndiaSale of goods 0.5 0.3 Purchase of goods 210.5 194.3
Axis Clinicals Limited, IndiaPurchase of services 830.7 553.1
Axis Clinicals LLC, USAPurchase of services - 31.8
Axis Clinicals Latina SA DE CV, MexicoPurchase of services 11.9 -
Trident Chemphar Limited, IndiaSale of goods - 22.5 Purchase of goods 757.7 764.5
Auropro Soft Systems Private Limited, IndiaPurchase of services 0.2 -
Pranit Packaging Private Limited, IndiaPurchase of goods 198.9 165.5
Pranit Projects Private Limited, IndiaPurchase of services (civil services) - 0.8
SGD Pharma India Limited (formerly Cogent Glass Limited )Purchase of goods 919.1 675.1
Orem Access Bio Inc, IndiaPurchase of goods 201.1 204.6
Veritaz Healthcare Limited, IndiaSale of goods 127.3 95.3 Rent received 0.3 -
Alex Merchants DMCCPurchase of goods 677.6 555.8
Particulars 31 March 2018 31 March 2017

Annual Report 2017-18 187186
(All amounts are in Indian Rupees in millions, except for share data and where otherwise stated)
Com
pany O
verviewS
tatutory Rep
ortsFinancial S
tatements
NOTES TO STANDALONE FINANCIAL STATEMENTSfor the year ended 31 March 2018
Crest Cellulose Private limited, IndiaPurchase of goods 255.8 52.9
East PharmaTechonologies, IndiaPurchase of goods 57.0 9.6
Viwyn Pharma Private limitedPurchase of services 58.1 - Reimbursement of Expenses Received 0.7 -
Gelcaps IndustriesPurchase of goods 130.0 -
e. Transactions with key managerial personnel or their relatives Mr. K Nityananda Reddy
Managerial remuneration 15.1 15.0 Rent expense 2.4 2.4
Dr. M SivakumaranManagerial remuneration 15.1 15.0
Mr. M Madan Mohan ReddyManagerial remuneration 26.7 26.5
Mr. P Sarath Chandra ReddyManagerial remuneration 8.3 6.9 Director sitting fees - 0.1
Mr. Vishnu M SriramRemuneration 5.4 4.8
Mr.N GovindarajanManagerial Remuneration 146.3 124.3
Mr.Santhanam Subramanian Remuneration 14.3 10.9
Mr.A. Mohanrami ReddyRemuneration - 0.6
Mr.B. Adi ReddyRemuneration 3.3 2.5
Mr. P.V. Ramaprasad ReddyDirector sitting fees 0.2 0.2
Mr. K.Ragunathan, Independent DirectorDirector sitting fees 1.0 0.4
Mr. M. Sitarama Murty, Independent DirectorDirector sitting fees 1.1 0.5
Mr. D.Rajagopala Reddy,Independent Director (upto 09 Feberuary 2017)Director sitting fees - 0.4
Dr.(Mrs.) Avnit Bimal Singh, Independent Director Director sitting fees 0.6 0.3
Mr.Rangaswamy Rathakrishnan Iyer, Independent Director (from 09 February 2017)Director sitting fees 0.6 0.1
Mrs.Savitha Mahajan, Independent Director Director sitting fees 0.1 -
Note: i) Managerial remuneration does not include provision for gratuity and leave encashment, which is determined for the Company as a whole. ii) All transactions with related parties are made on terms equivalent to those that prevail in arm’s length transactions.
Outstanding balances for trade receivable, trade payable and other payables are unsecured, interest free and settlement occurs in cash. The Company has not recorded any impairment of balances relating to amouts owed by related parties during the year ended 31 March 2018 (31 March 2017), provision for bad and doubtful debts will be made on an aggregate basis i.e. not specific to party. The assessment is undertaken each financial year through evaluating the financial position of the related party and the market in which the related party operates.
Particulars 31 March 2018 31 March 2017

Annual Report 2017-18 189188
(All amounts are in Indian Rupees in millions, except for share data and where otherwise stated)
NOTES TO STANDALONE FINANCIAL STATEMENTSfor the year ended 31 March 2018
f. Loans and advances in the nature of loans to subsidiaries - Maximum amount outstanding
Name of the Companies Closing Balance as at 31 March * Maximum outstanding at any time during the year ended 31 March *
2018 2017 2018 2017
AuroZymes Limited, India 79.0 56.0 79.0 56.0 Silicon Life Sciences Private Limited, India - 311.0 311.0 311.0 Auronext Pharma Private Limited, India - 40.0 210.0 40.0 Raidurgam Developers Limited, India - - 1,065.2 -
* Excluding interest on loan
g. Balances with Subsidiaries at the year end Particulars 31 March 2018 31 March 2017
APL Pharma Thai Limited, ThailandBalance payable 3.7 22.5
All Pharma (Shanghai) Trading Company Limited, ChinaBalance payable 19.0 13.7
Helix Healthcare B.V., The NetherlandsEquity contribution 584.8 - Corporate guarantee for loans 7,676.7 -
Aurobindo Pharma Produtos Farmaceuticos Ltda, BrazilBalance receivable 3.4 72.0
APL Swift Services (Malta) Limited, MaltaBalance receivable 3,395.1 1,840.8 Balance payable 36.0 25.8
Aurobindo Pharma USA Inc., USABalance receivable 15,736.0 9,990.7 Balance payable - 5.4 Corporate guarantee for loans - 953.7
Aurobindo Pharma Industria Farmaceutica Ltda, BrazilBalance receivable 213.9 248.4 Balance payable - 0.8
Auro Pharma Inc., CanadaBalance receivable 589.5 279.7 Balance payable 1.9 -
Aurobindo Pharma (Pty) Limited, South AfricaBalance receivable 66.3 46.1 Balance payable 6.2 6.1
Pharmacin B.V., The Netherlands (formerly Aurex B.V.)Balance receivable 5.4 5.8
Aurex B.V., The Netherlands (formerly Pharmacin B.V.)Balance payable - 4.4 Balance receivable - 4.0
Milpharm Limited, UKBalance receivable 1,040.2 794.8 Balance payable 9.9 11.1
Aurolife Pharma LLC, USABalance receivable 264.3 1,254.5
Aurobindo Pharma Japan K.K., JapanBalance receivable 11.7 95.8 Balance payable 2.7 4.3
Aurobindo Pharma (Malta) Limited, MaltaBalance payable 0.1 1.9

Annual Report 2017-18 189188
(All amounts are in Indian Rupees in millions, except for share data and where otherwise stated)
Com
pany O
verviewS
tatutory Rep
ortsFinancial S
tatements
NOTES TO STANDALONE FINANCIAL STATEMENTSfor the year ended 31 March 2018
Particulars 31 March 2018 31 March 2017
Auronext Pharma Private Limited, IndiaBalance receivable 691.5 435.1 Balance payable - 0.2 Investment in 9.5% Cumulative Redeemable Preference shares 370.0 336.2
Laboratorios Aurobindo S.L, SpainBalance receivable 0.3 167.0
Auro Medics Pharma LLC, USABalance receivable 3,083.7 4,810.4 Balance payable 0.6 -
Auro Healthcare (Nigeria) Limited, NigeriaBalance payable 0.4 1.4
APL Healthcare Limited, IndiaBalance receivable 28.2 - Equity allotment 521.5 425.0
Hyacinths Pharma Private Limited, IndiaEquity allotment 44.1 8.0 Balance receivable 2.0 -
Auro Peptides Ltd, IndiaInvestment in 9.5% Cumulative Redeemable Preference shares 95.0 75.0 Balance receivable 37.4 26.3
Silicon Life Sciences Private Limited, IndiaBalance receivable 425.6 222.8 Investment in 9.5% Cumulative Redeemable Preference shares 651.0 -
Aurovida Farmaceutica, SA DE CV, MexicoBalance receivable 56.5 26.1 Balance payable 38.6 -
Aurobindo Pharma B.V.,The NetherlandsBalance payable - 3.9 Balance receivable 240.1 195.8
Aurobindo Pharma PortugalBalance payable 0.2 5.0
Aurobindo Colombia S.A.S., ColombiaBalance payable 2.1 5.5 Balance receivable 117.0 168.7
Arrow Generiques S.A.S., FranceBalance receivable - 2.8
Agile Pharma BV, The NetherlandsCorporate guarantee for loans 2,383.8 1,385.9
Aurovitas Spain SAS, SpainBalance receivable 0.5 6.2 Balance payable 0.1 -
Aurovitas Unipessol, PortugalBalance payable 0.0 2.1
Aurobindo Pharma GmbHBalance payable - 0.6
Aurobindo Pharma Italia, ItalyBalance receivable 20.8 - Balance payable 0.1 -
Puren Pharma GmbH & Co., KG Balance Receivable 0.1 0.2
Auro Health LLC, USABalance receivable 361.0 11.7
Generis Farmaceutica SABalance receivable 44.0 -

Annual Report 2017-18 191190
(All amounts are in Indian Rupees in millions, except for share data and where otherwise stated)
NOTES TO STANDALONE FINANCIAL STATEMENTSfor the year ended 31 March 2018
Particulars 31 March 2018 31 March 2017
Aurovitas Pharma Polska, PolandBalance payable 75.3 -
Auro Pharma India Private Limited, IndiaEquity allotment 1.0 -
Curepro Parenterals Limited, IndiaEquity allotment - 1,129.0
Note: For closing balance of investments and provision for diminution in value of investments, refer note 4.
h. Balances with Joint venture at the year endNovagen Pharma (Pty) Limited, South Africa
Balance receivable 59.9 74.2 Raidurgam developers limited, India
Balance receivable 152.1 - Equity allotment 31.0 - Investment in optionally convertible debentures 710.9 -
Tergene Biotech Pvt. Ltd, India Equity allotment 41.1 - Investment in 10.5% Cumulative Redeemable Preference shares 5.0 -
Eugia Pharma Specialities Ltd, IndiaBalance receivable 4.8 -
i. Balances with enterprises over which key management personnel or their relatives exercise significant influence at the year end.
Pravesha Industries Private Limited, IndiaBalance payable 431.7 25.9 Balance receivable - 0.1
Sri Sai Packaging, IndiaBalance payable 15.6 0.6
Axis Clinicals Limited, IndiaBalance payable 77.1 62.4
Trident Chemphar Limited, IndiaBalance payable 153.7 202.4
Pranit Packaging Private Limited, IndiaBalance payable 8.3 2.6
SGD Pharma India Limited (formerly Cogent Glass Limited )Balance payable 295.4 121.1
Veritaz Healthcare Limited, IndiaBalance receivable 36.5 53.2

Annual Report 2017-18 191190
(All amounts are in Indian Rupees in millions, except for share data and where otherwise stated)
Com
pany O
verviewS
tatutory Rep
ortsFinancial S
tatements
NOTES TO STANDALONE FINANCIAL STATEMENTSfor the year ended 31 March 2018
Particulars 31 March 2018 31 March 2017
Alex Merchants DMCCBalance receivable 38.2 173.7
Orem Access Bio Inc, IndiaBalance Payable 39.6 -
Crest Cellulose Private limitedBalance Payable 35.9 16.5
East PharmaTechonologiesBalance Payable 6.8 2.5
Viwyn Pharma Private limitedBalance receivable 2.0 -
Gelcaps IndustriesBalance Payable 25.5 -
Balances with key managerial personnel or their relatives at the year endMr.N Govindarajan
Balance payable 100.0 90.0
j. Details of advances due from private companies in which Company’s director is a director. Pranit Packaging Private Limited, India ` Nil (March 31, 2017 ` Nil)
k. i) Details of trade receivables due from private companies in which Company’s director is a director. Pravesha Industries Private Limited, India `Nil (March 31, 2017: `0.1)
ii) Details of trade receivables due from partnership firm in which Company’s director is a partner. Sri Sai Packaging, India `Nil (March 31, 2017: `0.0)
40 The Board of Directors at their meeting held on 12 September 2013, had approved to transfer its Injectable Unit of the Company on a going concern basis comprising assets and liabilities pertaining to the said Unit to its wholly owned subsidiary viz., Curepro Parenterals Limited. The same was subject to requisite consents, approvals or permissions of the statutory or regulatory authorities. Pending such approvals, no effect of this Scheme has been given till date. The Board of Directors at their meeting held on 29 May 2017 decided not to transfer the Unit, considering the expansion and growth plans of the Company.
41 HEDGING ACTIVITIES AND DERIVATIVES - DERIVATIVES NOT DESIGNATED AS HEDGING INSTRUMENTS The Company uses foreign currency denominated borrowings and foreign exchange forward contracts to manage some of its
transaction exposures. The foreign exchange forward contracts are not designated as cash flow hedges and are entered into for periods consistent with foreign currency exposure of the underlying transactions, generally from one week to twelve months.

(All
amou
nts
are
in In
dian
Rup
ees
in m
illion
s, e
xcep
t for
sha
re d
ata
and
whe
re o
ther
wis
e st
ated
)
NO
TES
TO S
TAN
DA
LON
E FI
NA
NCI
AL
STAT
EMEN
TSfo
r the
yea
r end
ed 3
1 M
arch
201
8
42
FIN
AN
CIA
L IN
ST
RU
ME
NT
S -
FA
IR V
ALU
E A
ND
RIS
K M
AN
AG
EM
EN
T
A
. A
cco
unti
ng c
lass
ifica
tio
ns a
nd f
air
valu
es
The
follo
win
g ta
ble
show
s th
e ca
rryi
ng a
mou
nts
and
fair
valu
es o
f fina
ncia
l ass
ets
and
finan
cial
liab
ilitie
s, in
clud
ing
thei
r le
vels
in th
e fa
ir va
lue
hier
arch
y.
31
Mar
ch 2
018
Par
ticul
ars
Not
esC
arry
ing
amou
ntFa
ir va
lue
FVTP
LO
ther
fin
anci
al
asse
ts -
A
mor
tised
co
st
Oth
er
finan
cial
lia
bili
ties
- A
mor
tised
co
st
Tota
l car
ryin
g am
ount
Leve
l 1Le
vel 2
Leve
l 3To
tal
Fina
ncia
l ass
ets
mea
sure
d a
t fa
ir
valu
eN
on-c
urre
nt in
vest
men
ts in
oth
ers*
4A 1
.2
-
-
1.2
-
-
1
.2
1.2
N
on-c
urre
nt in
vest
men
ts in
gov
ernm
ent
secu
ritie
s*4A
0.2
-
-
0
.2
-
-
0.2
0
.2
Cur
rent
inve
stm
ents
*4B
0.2
-
-
0
.2
0.2
-
-
0
.2
Der
ivat
ive
asse
ts7B
-
-
-
-
-
-
-
-
1.6
-
-
1
.6
0.2
-
1
.4
1.6
Fi
nanc
ial a
sset
s no
t m
easu
red
at
fair
va
lue
Non
-cur
rent
inve
stm
ents
in p
refe
renc
e sh
ares
4A -
2
,622
.2
-
2,6
22.2
Trad
e re
ceiv
able
s5B
-
44,
774.
4 -
4
4,77
4.4
Loan
s6A
&6B
-
230
.2
-
230
.2
Cas
h an
d ca
sh e
quiv
alen
ts12
-
2,4
59.0
-
2
,459
.0
Oth
er fi
nanc
ial a
sset
s7A
&7B
-
995
.0
-
995
.0
-
51,
080.
8 -
5
1,08
0.8
Fina
ncia
l lia
bili
ties
mea
sure
d a
t fa
ir
valu
eD
eriv
ativ
e lia
bilit
ies
18 2
3.3
-
-
23.
3 -
2
3.3
-
23.
3 2
3.3
-
-
23.
3 -
2
3.3
-
23.
3 Fi
nanc
ial l
iab
iliti
es n
ot
mea
sure
d a
t fa
ir v
alue
Bor
row
ings
(inc
ludi
ng c
urre
nt m
atur
ities
of
non-
curr
ent b
orro
win
gs)
15A
, 15B
&
18
-
-
37,
190.
0 3
7,19
0.0
Trad
e pa
yabl
es17
-
-
16,
334.
0 1
6,33
4.0
Oth
er fi
nanc
ial l
iabi
litie
s18
1,8
51.5
1
,851
.5
-
-
55,
375.
5 5
5,37
5.5
192

Com
pany O
verviewS
tatutory Rep
ortsFinancial S
tatements
Annual Report 2017-18 193
42
FIN
AN
CIA
L IN
ST
RU
ME
NT
S -
FA
IR V
ALU
E A
ND
RIS
K M
AN
AG
EM
EN
T (C
ON
TD
.)
A.
Acc
oun
ting
cla
ssifi
cati
ons
and
fai
r va
lues
Th
e fo
llow
ing
tabl
e sh
ows
the
carr
ying
am
ount
s an
d fa
ir va
lues
of fi
nanc
ial a
sset
s an
d fin
anci
al li
abilit
ies,
incl
udin
g th
eir
leve
ls in
the
fair
valu
e hi
erar
chy.
31
Mar
ch 2
017
Par
ticul
ars
Not
esC
arry
ing
amou
ntFa
ir va
lue
FVTP
LO
ther
fin
anci
al
asse
ts -
A
mor
tised
co
st
Oth
er
finan
cial
lia
bili
ties
- A
mor
tised
co
st
Tota
l car
ryin
g am
ount
Leve
l 1Le
vel 2
Leve
l 3To
tal
Fina
ncia
l ass
ets
mea
sure
d a
t fa
ir
valu
eN
on-c
urre
nt in
vest
men
ts in
oth
ers*
4A 1
.2
-
-
1.2
-
-
1
.2
1.2
N
on-c
urre
nt in
vest
men
ts in
gov
ernm
ent
secu
ritie
s*4A
0.2
-
-
0
.2
-
-
0.2
0
.2
Cur
rent
inve
stm
ents
*4B
0.2
-
-
0
.2
0.2
-
-
0
.2
Der
ivat
ive
asse
ts7B
94.
8 -
-
9
4.8
-
94.
8 9
4.8
96.
4 -
-
9
6.4
0.2
9
4.8
1.4
9
6.4
Fina
ncia
l ass
ets
not
mea
sure
d a
t fa
ir
valu
eN
on-c
urre
nt in
vest
men
ts in
pre
fere
nce
shar
es4A
-
1,5
01.1
-
1
,501
.1
Trad
e re
ceiv
able
s5B
-
37,
736.
3 -
3
7,73
6.3
Loan
s6A
&6B
-
566
.1
-
566
.1
Cas
h an
d ca
sh e
quiv
alen
ts12
-
336
.4
-
336
.4
Oth
er fi
nanc
ial a
sset
s7A
&7B
-
878
.4
-
878
.4
-
41,
018.
3 -
4
1,01
8.3
Fina
ncia
l lia
bili
ties
mea
sure
d a
t fa
ir
valu
eD
eriv
ativ
e lia
bilit
ies
18 -
-
-
-
-
-
-
-
-
-
-
-
-
-
-
-
Fi
nanc
ial l
iab
iliti
es n
ot
mea
sure
d a
t fa
ir v
alue
Bor
row
ings
(inc
ludi
ng c
urre
nt m
atur
ities
of
non-
curr
ent b
orro
win
gs)
15A
, 15B
&
18
-
-
30,
539.
1 3
0,53
9.1
Trad
e pa
yabl
es17
-
-
12,
176.
0 1
2,17
6.0
Oth
er fi
nanc
ial l
iabi
litie
s18
1,5
27.2
1
,527
.2
-
-
44,
242.
3 4
4,24
2.3
*T
hese
are
for
oper
atio
nal p
urpo
ses
and
the
Com
pany
est
imat
es th
at th
e fa
ir va
lue
of th
ese
inve
stm
ents
are
not
mat
eria
lly d
iffer
ent a
s co
mpa
red
to th
eir
cost
.
(All
amou
nts
are
in In
dian
Rup
ees
in m
illion
s, e
xcep
t for
sha
re d
ata
and
whe
re o
ther
wis
e st
ated
)
NO
TES
TO S
TAN
DA
LON
E FI
NA
NCI
AL
STAT
EMEN
TSfo
r the
yea
r end
ed 3
1 M
arch
201
8

Annual Report 2017-18 195194
(All amounts are in Indian Rupees in millions, except for share data and where otherwise stated)
NOTES TO STANDALONE FINANCIAL STATEMENTSfor the year ended 31 March 2018
B. Measurement of fair values i. Valuation techinque and significant unobservable inputs The following tables show the valuation techniques used in measuring Level 2 and Level 3 fair values, for financial instruments
measured at fair value in the balance sheet, as well as the significant unobservable inputs used:
Type
Valuation technique Significant unobservable inputs
Inter-relationship between significant unobservable inputs
and fair valueDerivative instruments Forward pricing: The fair value
is determined using quoted forward exchange rates at the
reporting date and present value calculations based on high
credit quality yield curves in the respective currency.
Not applicable
Not applicable
ii. Transfer between Level 1 and 2 There have been no transfers from Level 2 to Level 1 or vice-versa in 2017-18 and no transfers in either direction in 2016-17.
C. Risk management framework The Company’s board of directors has overall responsibility for the establishment and oversight of the Company’s risk
management framework. The board of directors has established the Risk Management Committee, which is responsible for developing and monitoring the Company’s risk management policies. The committee reports to the board of directors on its activities.
The Company’s risk management policies are estabilished to identify and analyse the risks being faced by the Company, to set appropriate risk limits and controls and to monitor risks and adherence to limits. Risk management policies and systems are reviewed regularly to reflect changes in market conditions and the company’s activities. The Company, through its training and managment standards and procedures, aims to maintain a disciplined and constructive control environment in which all employees understand their roles and obligations.
The Company’s audit committee oversees how management monitors compliance with the Company’s risk management policies and procedures, and reviews the adequacy of the risk management framwork in relation to the risks faced by the company. The audit committee is assisted in its oversight role by internal audit. Internal audit undertakes both regular and adhoc reviews of risk managment controls and procedures, the result of which are reported to the audit committee.
The Company is exposed primarily to credit risk, liquidity risk and market risk (including currency risk, interest rate risk and other price risk). The Company uses derivative financial instruments such as forwards to minimise any adverse effect on its financial performance.
i. Credit risk Credit risk is the risk that counterparty will not meet its obligations under a financial instrument or customer contract, leading
to a financial loss. Credit risk encompasses of both, the direct risk of default and the risk of deterioration of creditworthiness as well as concentration of risks. Credit risk is controlled by analysing credit limits and creditworthiness of customers on a continuous basis to whom the credit has been granted after obtaining necessary approvals for credit. Financial instruments that are subject to concentrations of credit risk principally consist of trade receivables, investments, derivative financial instruments, cash and cash equivalents, loans and other financial assets. The Company establishes an allowance for doubtful debts and impairment that represents its estimate of incurred losses in respect of trade and other receivables and investments.
Trade receivables
The Company’s exposure to credit risk is influenced mainly by the individual characteristics of each customer. However, the Management also evaluates the factors that may influence the credit risk of its customer base, including the default risk and country in which the customers operate. The Management has established a credit policy under which each new customer is analysed individually for creditworthiness before the Company’s standard payment and delivery terms and conditions are

Annual Report 2017-18 195194
(All amounts are in Indian Rupees in millions, except for share data and where otherwise stated)
Com
pany O
verviewS
tatutory Rep
ortsFinancial S
tatements
NOTES TO STANDALONE FINANCIAL STATEMENTSfor the year ended 31 March 2018
offered. The Company’s review includes external ratings, if available, financial statements, credit agency information, industry information and in some case bank references. Sales limits are established for each customer and reviewed quarterly.
The Companies receivables turnover is quick and historically, there was no significant default on account of trade and other receivables. An impairment analysis is performed at each reporting date on an individual basis for major clients. In addition, a large number of minor receivables are grouped into homogenous groups and assessed for impairment collectively. The company assesses at each reporting date whether a financial asset or a group of financial assets is impaired. Expected credit losses are measured at an amount equal to the 12 months expected credit losses or at an amount equal to the life time expected credit losses if the credit risk on the financial asset has increased significantly since initial recognition. The Company has used a practical expedient by computing the expected credit loss allowance for trade receivables based on a provision matrix. The provision matrix takes into account historical credit loss experience and is adjusted for forward looking information. The maximum exposure to credit risk at the reporting date is the carrying value of trade and other receivables. The Company does not hold collateral as security. The Company evaluates the concentration of risk with respect to trade receivables as low, as its customers are located in several jurisdictions and operate in largely independent markets.
Other financial assets The Company maintains exposure in cash and cash equivalents and derivative instruments with financial institutions. The
Company has loan receivables outstanding from its wholly owned subsidiaries amounting to ` 7.9 (31 March 2017 : ` 407.0).
The Company’s maximum exposure to credit risk as at 31 March 2018 and 31 March 2017 is the carrying value of each class of financial assets.
ii. Liquidity risk Liquidity risk is the risk that the Company will encounter difficulty in meeting the obligations associated with its financial
liabilities that are settled by delivering cash or another financial asset. The Company’s approach to managing liquidity is to ensure, as far as possible, that it will have sufficient liquidity to meet its liabilities when they are due, under both normal and stressed conditions, without incurring unacceptable losses or risking damage to the Company’s reputation.
The objective of liquidity risk management is to maintain sufficient liquidity and ensure that funds are available for use as per requirements. The Company manages liquidity risk by maintaining adequate reserves, banking facilities and reserve borrowing facilities, by continuously monitoring forecast and actual cash flows, and by matching the maturity profiles of financial assets and liabilities. The following are the remaining contractual maturities of financial liabilities at reporting date:
As at 31 March 2018 Carrying amount Contractual cash flows
< 12 months 1 to 5 years > 5 years Total
Non-derivative financial liabilitiesNon-current borrowings 651.7 655.7 - - 655.7 Current borrowings 36,538.3 36,735.8 - - 36,735.8 Trade payables 16,334.0 16,334.0 - - 16,334.0 Other current financial liabilities 1,851.5 1,851.5 - - 1,851.5
Derivative financial liabilitiesForeign exchange forward contracts 23.3 23.3 - - 23.3
As at 31 March 2017 Carrying amount Contractual cash flows
< 12 months 1 to 5 years > 5 years Total
Non-derivative financial liabilitiesNon-current borrowings 3,026.4 1,882.6 1,192.5 - 3,075.1 Current borrowings 27,512.7 27,562.5 - - 27,562.5 Trade payables 12,176.0 12,176.0 - - 12,176.0 Other current financial liabilities 1,527.2 1,527.2 - - 1,527.2
Derivative financial liabilitiesForeign exchange forward contracts - - - - -

Annual Report 2017-18 197196
(All amounts are in Indian Rupees in millions, except for share data and where otherwise stated)
NOTES TO STANDALONE FINANCIAL STATEMENTSfor the year ended 31 March 2018
iii. Market risk Market risk is the risk that the fair value or future cash flows of a financial instrument will fluctuate because of changes in
market prices. Such changes in the values of financial instruments may result from changes in the foreign currency exchange rates, interest rates, credit, liquidity and other market changes. The Company’s exposure to market risk is primarily on account of foreign currency exchange rate risk and interest rate risk.
a) Foreign Currency risk: The fluctuation in foreign currency exchange rates may have potential impact on the statement of profit or loss, where any
transaction references more than one currency or where assets / liabilities are denominated in a currency other than the functional currency of the Company. The Company is subject to foreign exchange risk primarily due to its foreign currency revenues, expenses and borrowings. Considering the countries and economic environment in which the Company operates, its operations are subject to risks arising from fluctuations in exchange rates in those countries. The risks primarily relate to fluctuations in US Dollar, Euro and GBP against the functional currency of the Company. The Company, as per its risk management policy, uses derivative instruments primarily to hedge foreign exchange. The Company has a treasury team which evaluates the impact of foreign exchange rate fluctuations by assessing its exposure to exchange rate risks and advises the Management of any material adverse effect on the Company. It hedges a part of these risks by using derivative financial instruments in line with its risk management policies. The information on foreign exchange risk from derivative instruments and non derivative instruments is as follows:
The summary of quantitative data about the Company’s exposure to currency risk (based on the notional amounts) as reported to the management is as follows:
As at 31 March 2018Amount in `
Particulars USD Euro GBP Others Total
Financial assetsTrade receivables 30,093.0 4,506.7 1,048.2 771.4 36,419.3 Cash and cash equivalents 1,205.3 395.0 294.7 5.4 1,900.4 Total 31,298.3 4,901.7 1,342.9 776.8 38,319.7 Less:Foreign exchange forward contracts (2,038.3) (767.7) (645.9) (288.8) (3,740.7)Net exposure in financial assets 29,260.0 4,134.0 697.0 488.0 34,579.0 Financial liabilitiesBorrowings 32,946.9 3,128.6 1,074.1 - 37,149.6 Interest accrued but not due 10.7 - - - 10.7 Trade payables (including payable for capital goods)
6,403.8 414.2 35.6 36.6 6,890.2
39,361.4 3,542.8 1,109.7 36.6 44,050.5 Less:Foreign exchange forward contracts (195.5) (242.4) (184.6) - (622.5)Net exposure in financial liabilities 39,165.9 3,300.4 925.1 36.6 43,428.0 Net exposure in respect of recognised assets/(liabilities)
(9,905.9) 833.6 (228.1) 451.4 (8,849.0)

Annual Report 2017-18 197196
(All amounts are in Indian Rupees in millions, except for share data and where otherwise stated)
Com
pany O
verviewS
tatutory Rep
ortsFinancial S
tatements
NOTES TO STANDALONE FINANCIAL STATEMENTSfor the year ended 31 March 2018
As at 31 March 2017Amount in `
Particulars USD Euro GBP Others Total
Financial assetsTrade receivables 26,689.7 2,927.9 788.5 452.8 30,858.9 Cash and cash equivalents 181.2 30.4 4.8 7.5 223.9 Total 26,870.9 2,958.3 793.3 460.3 31,082.8 Less:Foreign exchange forward contracts (586.9) (55.8) (606.8) - (1,249.5)Net exposure in financial assets 26,284.0 2,902.5 186.5 460.3 29,833.3 Financial liabilitiesBorrowings 21,963.6 5,518.2 671.5 - 28,153.3 Interest accrued but not due 20.5 - - - 20.5 Trade payables (including payable for capital goods)
3,746.0 84.6 12.6 22.7 3,865.9
25,730.1 5,602.8 684.1 22.7 32,039.7 Less:Foreign exchange forward contracts (324.3) - - - (324.3)Net exposure in financial liabilities 25,405.8 5,602.8 684.1 22.7 31,715.4 Net exposure in respect of recognised assets/(liabilities)
878.2 (2,700.3) (497.6) 437.6 (1,882.1)
Sensitivity analysis: A reasonably possible strengthening (weakening) of the Indian Rupee against US dollars at 31 March would have affected the
measurement of financial instruments denominated in US dollars and affected equity and profit or loss by the amounts shown below. This analysis assumes that all other variables, in particular interest rates, remain constant and ignores any impact of forecast sales and purchases.
ParticularsProfit or (loss) Equity, net of tax
Strengthening Weakening Strengthening Weakening
31 March 2018USD (5% movement) (495.3) 495.3 (389.6) 389.6 Euro (5% movement) 41.7 (41.7) 32.8 (32.8)GBP (5% movement) (11.4) 11.4 (9.0) 9.0 Others (5% movement) 22.6 (22.6) 17.8 (17.8)31 March 2017USD (5% movement) 43.9 (43.9) 34.5 (34.5)Euro (5% movement) (135.0) 135.0 (106.2) 106.2 GBP (5% movement) (24.9) 24.9 (19.6) 19.6 Others (5% movement) 21.9 (21.9) 17.2 (17.2)
b) interest rate risk: Interest rate risk is the risk that the fair value or future cash flows of a financial instrument will fluctuate because of change in market interest rates. The Company’s exposure to risk of change in market interest rates because it borrows funds at both fixed and floating interest rates. The Company manages its interest rate risk by having a balances portfolio of fixed and variable rate loans and borrowings. As the company has no significant interest bearing assets, the income and operating cash flows are substantially independent of changes in market interest rates.
Particulars 31 March 2018 31 March 2017
Variable rate borrowings including current maturities 37,190.0 30,539.1 Total borrowings 37,190.0 30,539.1

Annual Report 2017-18 PB198
(All amounts are in Indian Rupees in millions, except for share data and where otherwise stated)
NOTES TO STANDALONE FINANCIAL STATEMENTSfor the year ended 31 March 2018
Sensitivity analysis:
ParticularsImpact on profit and loss
31 March 2018 31 March 2017
0.5% increase 0.5% decrease 0.5% increase 0.5% decrease
Variable rate instruments (186.0) 186.0 (172.0) 172.0
c) commodity risk: Exposure to market risk with respect to commodity prices primarily arises from the Company’s purchase of active pharmaceutical ingredients and other raw material components for its products. These are commodity products, whose prices may fluctuate significantly over short periods of time. The prices of the Company’s raw materials generally fluctuate in line with commodity cycles, although the prices of raw materials used in the Company’s business are generally more volatile. Cost of raw materials forms the largest portion of the Company’s cost of revenues. Commodity price risk exposure is evaluated and managed through operating procedures and sourcing policies. As of 31 March 2018, the Company had not entered into any derivative contracts to hedge exposure to fluctuations in commodity prices.
43 CAPITIAL MANAGEMENT For the purpose of the Company’s capital management, capital includes issued equity capital, share premium and all other
equity reserves attributable to the equity holders. The primary objective of the Company’s capital management is to maximise the shareholder value.
44 SEGMENT REPORTING In accordance with Indian Accounting Standard (Ind AS) 108 on Operating segments, segment information has been given in the
consolidated financial statements of the Company, and therefore no separate disclosure on segment information is given in these financial statements.
As per our Report of even date attached.
For B S R & Associates LLP for and on behalf of the Board of Directors ofChartered Accountants Aurobindo Pharma LimitedICAI Firm Registration Number: 116231W/ W-100024
Amit Kumar Agarwal N. Govindarajan Dr. M. SivakumaranPartner Managing Director DirectorMembership No.214198 DIN-00050482 DIN-01284320
Santhanam Subramanian B. Adi ReddyChief Financial Officer Company Secretary
Membership No.13709Place: HyderabadDate: 28 May 2018

Annual Report 2017-18 199PB
Com
pany O
verviewS
tatutory Rep
ortsFinancial S
tatements
ToThe Members of Aurobindo Pharma Limited
REPORT ON THE AUDIT OF CONSOLIDATED IND AS FINANCIAL STATEMENTSWe have audited the accompanying consolidated Ind AS financial statements of Aurobindo Pharma Limited (hereinafter referred to as “the Holding Company”), its subsidiaries (the Holding Company and its subsidiaries together referred to as “the Group”) and its joint ventures, which comprise the Consolidated Balance Sheet as at 31 March 2018, the Consolidated Statement of Profit and Loss, the Consolidated Statement of Changes in Equity and the Consolidated Statement of Cash Flow, for the year then ended, including a summary of significant accounting policies and other explanatory information (hereinafter referred to as “the consolidated Ind AS financial statements”).
MANAGEMENT’S RESPONSIBILITY FOR THE CONSOLIDATED IND AS FINANCIAL STATEMENTSThe Holding Company’s Board of Directors is responsible for the preparation of these consolidated Ind AS financial statements in terms of the requirements of the Companies Act, 2013 (hereinafter referred to as “the Act”) that give a true and fair view of the consolidated state of affairs, consolidated profit (including other comprehensive income), consolidated statement of changes in equity and consolidated cash flows of the Group including its joint ventures in accordance with the accounting principles generally accepted in India, including the Indian Accounting Standards (Ind AS) specified under Section 133 of the Act. The respective Board of Directors of the companies included in the Group and of its joint ventures are responsible for maintenance of adequate accounting records in accordance with the provisions of the Act for safeguarding the assets of the Group and of its joint ventures and for preventing and detecting frauds and other irregularities; the selection and application of appropriate accounting policies; making judgments and estimates that are reasonable and prudent; and the design, implementation and maintenance of adequate internal financial controls that were operating effectively for ensuring the accuracy and completeness of the accounting records, relevant to the preparation and presentation of the consolidated Ind AS financial statements that give a true and fair view and are free from material misstatement, whether due to fraud or error, which have been used for the purpose of preparation of the consolidated Ind AS financial statements by the Directors of the Holding Company, as aforesaid.
In preparing the consolidated Ind AS financial statements, the respective Board of Directors of the companies included in the Group and of its joint ventures are responsible for assessing the ability of the Group and of its joint ventures to continue as a going concern, disclosing, as applicable, matters related to going concern and using the going concern basis of accounting unless management either intends to liquidate the Group or to cease operations, or has no realistic alternative but to do so.
AUDITOR’S RESPONSIBILITYOur responsibility is to express an opinion on these consolidated Ind AS financial statements based on our audit. While conducting the audit, we have taken into account the provisions of the Act, the accounting and auditing standards and matters which are required to be included in the audit report under the provisions of the Act and the Rules made thereunder.
We conducted our audit of the consolidated Ind AS financial statements in accordance with the Standards on Auditing specified under Section 143 (10) of the Act. Those Standards require that we comply with ethical requirements and plan and perform the audit to obtain reasonable assurance about whether the consolidated Ind AS financial statements are free from material misstatement.
An audit involves performing procedures to obtain audit evidence about the amounts and the disclosures in the consolidated Ind AS financial statements. The procedures selected depend on the auditor’s judgment, including the assessment of the risks of material misstatement of the consolidated Ind AS financial statements, whether due to fraud or error. In making those risk assessments, the auditor considers internal financial control relevant to the Holding Company’s preparation of the consolidated Ind AS financial statements that give a true and fair view in order to design audit procedures that are appropriate in the circumstances. An audit also includes evaluating the appropriateness of the accounting policies used and the reasonableness of the accounting estimates made by the Holding Company’s Board of Directors, as well as evaluating the overall presentation of the consolidated Ind AS financial statements.
We are also responsible to conclude on the appropriateness of management’s use of the going concern basis of accounting and, based on the audit evidence obtained, whether a material uncertainty exists related to events or conditions that may cast significant doubt on the ability of Group and of its joint ventures to continue as a going concern. If we conclude that a material uncertainty exists, we are required to draw attention in the auditor’s report to the related disclosures in the consolidated Ind AS financial statements or, if such disclosures are inadequate, to modify our opinion. Our conclusions are based on the audit evidence obtained up to the date of our auditor’s report. However, future events or conditions may cause Group and its joint ventures to cease to continue as a going concern.
We believe that the audit evidence obtained by us and the audit evidence obtained by the other auditors in terms of their reports referred to in sub-paragraph 2 of the Other Matters paragraph below, is sufficient and appropriate to provide a basis for our audit opinion on the consolidated Ind AS financial statements.
OPINIONIn our opinion and to the best of our information and according to the explanations given to us and based on the consideration of reports of other auditors on separate financial statements and
INDEPENDENT AUDITOR’S REPORT
Annual Report 2017-18 201200
on the other financial information of the subsidiaries and joint ventures, the aforesaid consolidated Ind AS financial statements give the information required by the Act in the manner so required and give a true and fair view in conformity with the accounting principles generally accepted in India, of the consolidated state of affairs of the Group and its joint ventures as at 31 March 2018, their consolidated profit (including other comprehensive income), consolidated statement of changes in equity and consolidated cash flows for the year ended on that date.
OTHER MATTERS1. Corresponding figures of the Group and its joint ventures
for the year ended 31 March, 2017 have been audited by another auditor who expressed an unmodified opinion dated 29 May, 2017 on the consolidated Ind AS Financial Statements of the Group and its joint ventures for the year ended 31 March 2017.
Our opinion on the consolidated Ind AS Financial Statements is not modified in respect of the above matter.
2. We did not audit the financial statements and other financial information of fifty five subsidiaries and four joint ventures, whose financial statements reflect total assets of ` 147,473 million and net assets of ` 61,292 million as at 31 March 2018, total revenues of ` 116,566 million and net cash inflows amounting to ` 5,169 million for the year ended on that date, as considered in the consolidated Ind AS financial statements. The consolidated Ind AS financial statements also include the Group’s share of net profit of ` 25 million for the year ended 31 March, 2018, as considered in the consolidated Ind AS financial statements, in respect of four joint ventures, whose financial statements and other financial information have not been audited by us. These financial statements and other financial information have been audited by other auditors whose reports have been furnished to us by the Management and our opinion on the consolidated Ind AS financial statements, in so far as it relates to the amounts and disclosures included in respect of these subsidiaries and joint ventures and our report in terms of sub-section (3) of Section 143 of the Act, insofar as it relates to the aforesaid subsidiaries and joint ventures is based solely on the reports of the other auditors.
Certain of these subsidiaries and joint ventures are located outside India whose financial statements and other financial information have been prepared in accordance with accounting principles generally accepted in their respective countries and which have been audited by other auditors under generally accepted auditing standards applicable in their respective countries. The Company’s management has converted the financial statements of such subsidiaries and joint ventures located outside India from accounting principles generally accepted in their respective countries
to accounting principles generally accepted in India. We have audited these conversion adjustments made by the Company’s management. Our opinion in so far as it relates to the balances and affairs of such subsidiaries and joint ventures located outside India is based on the report of other auditors and the conversion adjustments prepared by the management of the Company and audited by us.
Our opinion above on the consolidated Ind AS financial statements, and our report on Other Legal and Regulatory Requirements below, is not modified in respect of the above matters with respect to our reliance on the work done and the reports of the other auditors.
REPORT ON OTHER LEGAL AND REGULATORY REQUIREMENTSAs required by Section 143(3) of the Act, based on our audit and on the consideration of report of the other auditors on separate financial statements and the other financial information of subsidiaries and joint ventures, as noted in the ‘Other Matters’ paragraph, we report, to the extent applicable, that:
a) We / the other auditors whose reports we have relied upon have sought and obtained all the information and explanations which to the best of our knowledge and belief were necessary for the purposes of our audit of the aforesaid consolidated Ind AS financial statements;
b) In our opinion, proper books of account as required by law relating to preparation of the aforesaid consolidated Ind AS financial statements have been kept so far as it appears from our examination of those books and the reports of the other auditors;
c) The Consolidated Balance Sheet, the Consolidated Statement of Profit and Loss, Consolidated Statement of Changes in Equity and the Consolidated Statement of Cash flow dealt with by this report are in agreement with the relevant books of account maintained for the purpose of preparation of the consolidated IND AS financial statements;
d) In our opinion, the aforesaid consolidated Ind AS financial statements comply with the Indian Accounting Standards specified under Section 133 of the Act;
e) On the basis of the written representations received from the directors of the Holding Company as on 31 March 2018 taken on record by the Board of Directors of the Holding Company and the reports of the statutory auditors of its subsidiary companies and joint ventures incorporated in India, none of the directors of the Group companies and joint ventures incorporated in India is disqualified as on 31 March 2018 from being appointed as a director in terms of Section 164(2) of the Act;
Annual Report 2017-18 201200
Com
pany O
verviewS
tatutory Rep
ortsFinancial S
tatements
f) With respect to the adequacy of the internal financial controls with reference to financial statements of the Holding Company, its subsidiary companies and joint ventures incorporated in India and the operating effectiveness of such controls, refer to our separate Report in “Annexure A”;
g) With respect to the other matters to be included in the Auditor’s Report in accordance with Rule 11 of the Companies (Audit and Auditor’s) Rules, 2014, in our opinion and to the best of our information and according to the explanations given to us and based on the consideration of the report of the other auditors on separate financial statements as also the other financial information of the subsidiaries and joint ventures, as noted in the ‘Other Matters’ paragraph:
i. The consolidated Ind AS financial statements disclose the impact of pending litigations on the consolidated financial position of the Group and its joint ventures. Refer Note 33 to the consolidated Ind AS financial statements;
ii. The Group and its joint ventures did not have any long-term contracts including derivative contracts for which there were any material foreseeable losses;
iii. There has been no delay in transferring amounts, required to be transferred, to the Investor Education and Protection Fund by the Holding Company, its subsidiary companies and joint ventures incorporated in India during the year ended 31 March 2018; and
iv. The disclosures in the consolidated Ind AS financial statements regarding holdings as well as dealings in specified bank notes during the period from 8 November 2016 to 30 December 2016 have not been made since they do not pertain to the financial year ended 31 March 2018. However amounts as appearing in the audited consolidated Ind AS financial statements for the period ended 31 March 2017 have been disclosed.
For B S R & Associates LLPChartered Accountants
ICAI Firm Registration Number: 116231W/ W-100024
Amit Kumar AgarwalPartnerMembership No.214198
Place: HyderabadDate: 28 May 2018
Annual Report 2017-18 203202
ANNEXURE A TO THE INDEPENDENT AUDITOR’S REPORT ON THE AUDIT OF CONSOLIDATED IND AS FINANCIAL STATEMENTS
REPORT ON THE INTERNAL FINANCIAL CONTROLS UNDER CLAUSE (I) OF SUB-SECTION 3 OF THE SECTION 143 OF THE COMPANIES ACT, 2013 (“THE ACT”)In conjunction with our audit of the consolidated Ind AS financial statements of Aurobindo Pharma Limited as of and for the year ended 31 March 2018, we have audited the internal financial controls over financial reporting of Aurobindo Pharma Limited (hereinafter referred to as the “Holding Company”), its subsidiary companies, and joint ventures which are companies incorporated in India, as of that date.
MANAGEMENT’S RESPONSIBILITY FOR INTERNAL FINANCIAL CONTROLSThe respective Board of Directors of the Holding Company, its subsidiary companies, and joint ventures, which are companies incorporated in India, are responsible for establishing and maintaining internal financial controls based on the internal control over financial reporting criteria established by the Holding Company considering the essential components of internal control stated in the Guidance Note on Audit of Internal Financial Controls over Financial Reporting (‘Guidance note”) issued by the Institute of Chartered Accountants of India (‘ICAI’). These responsibilities include the design, implementation and maintenance of adequate internal financial controls that were operating effectively for ensuring the orderly and efficient conduct of its business, including adherence to the respective Company’s policies, the safeguarding of its assets, the prevention and detection of frauds and errors, the accuracy and completeness of the accounting records, and the timely preparation of reliable financial information, as required under the Act.
AUDITOR’S RESPONSIBILITYOur responsibility is to express an opinion on the Company’s internal financial controls over financial reporting based on our audit. We conducted our audit in accordance with the Guidance Note on Audit of Internal Financial Controls Over Financial Reporting (the “Guidance Note”) and the Standards on Auditing, both issued by ICAI, and deemed to be prescribed under Section 143(10) of the Act, to the extent applicable to an audit of internal financial controls. Those Standards and the Guidance Note require that we comply with ethical requirements and plan and perform the audit to obtain reasonable assurance about whether adequate internal financial controls over financial reporting was established and maintained and if such controls operated effectively in all material respects.
Our audit involves performing procedures to obtain audit evidence about the adequacy of the internal financial controls system over financial reporting and their operating effectiveness. Our audit of internal financial controls over financial reporting included obtaining an understanding of internal financial controls over financial reporting, assessing the risk that a material weakness exists, and testing and evaluating the design and operating effectiveness of internal control based on the assessed risk. The procedures selected depend on the auditor’s judgment, including the assessment of the risks of material misstatement of the consolidated Ind AS financial statements, whether due to fraud or error.
We believe that the audit evidence we have obtained and the audit evidence obtained by the other auditors in terms of their reports referred to in the Other Matter paragraph below, is sufficient and appropriate to provide a basis for our audit opinion on the Company’s internal financial controls system over financial reporting.
Annual Report 2017-18 203202
Com
pany O
verviewS
tatutory Rep
ortsFinancial S
tatements
MEANING OF INTERNAL FINANCIAL CONTROLS OVER FINANCIAL REPORTINGA Company’s internal financial control over financial reporting is a process designed to provide reasonable assurance regarding the reliability of financial reporting and the preparation of consolidated Ind AS financial statements for external purposes in accordance with the generally accepted accounting principles. A Company’s internal financial control over financial reporting includes those policies and procedures that:
1. pertain to the maintenance of records that, in reasonable detail, accurately and fairly reflect the transactions and dispositions of the assets of the Company;
2. provide reasonable assurance that transactions are recorded as necessary to permit preparation of financial statements in accordance with generally accepted accounting principles, and that receipts and expenditures of the Company are being made only in accordance with authorizations of management and directors of the Company; and
3. provide reasonable assurance regarding prevention or timely detection of unauthorized acquisition, use, or disposition of the Company’s assets that could have a material effect on the financial statements.
INHERENT LIMITATIONS OF INTERNAL FINANCIAL CONTROLS OVER FINANCIAL REPORTINGBecause of the inherent limitations of internal financial controls over financial reporting, including the possibility of collusion or improper management override of controls, material misstatements due to error or fraud may occur and not be detected. Also, projections of any evaluation of the internal financial controls over financial reporting to future periods are subject to the risk that the internal financial control over financial reporting may become inadequate because of changes in conditions, or that the degree of compliance with the policies or procedures may deteriorate.
OPINIONIn our opinion, the Holding Company, its subsidiary companies and joint ventures, which are companies incorporated in India, have maintained in all material respects, an adequate internal financial controls system over financial reporting and such internal financial controls over financial reporting were operating effectively as at 31 March 2018, based on the internal control over financial reporting criteria established by the Holding Company considering the essential components of internal control stated in the Guidance Note on Audit of Internal Financial Controls Over Financial Reporting issued by the ICAI.
OTHER MATTERSOur report under Section 143(3)(i) of the Act on the adequacy and operating effectiveness of the internal financial controls over financial reporting of the Holding Company, insofar as it relates to these nine subsidiary companies, and three joint ventures companies, which are companies incorporated in India, is based on the corresponding reports of the auditors of such subsidiary, and joint venture companies incorporated in India.
For B S R & Associates LLPChartered Accountants
ICAI Firm Registration Number: 116231W/ W-100024
Amit Kumar AgarwalPartnerMembership No.214198
Place: HyderabadDate: 28 May 2018
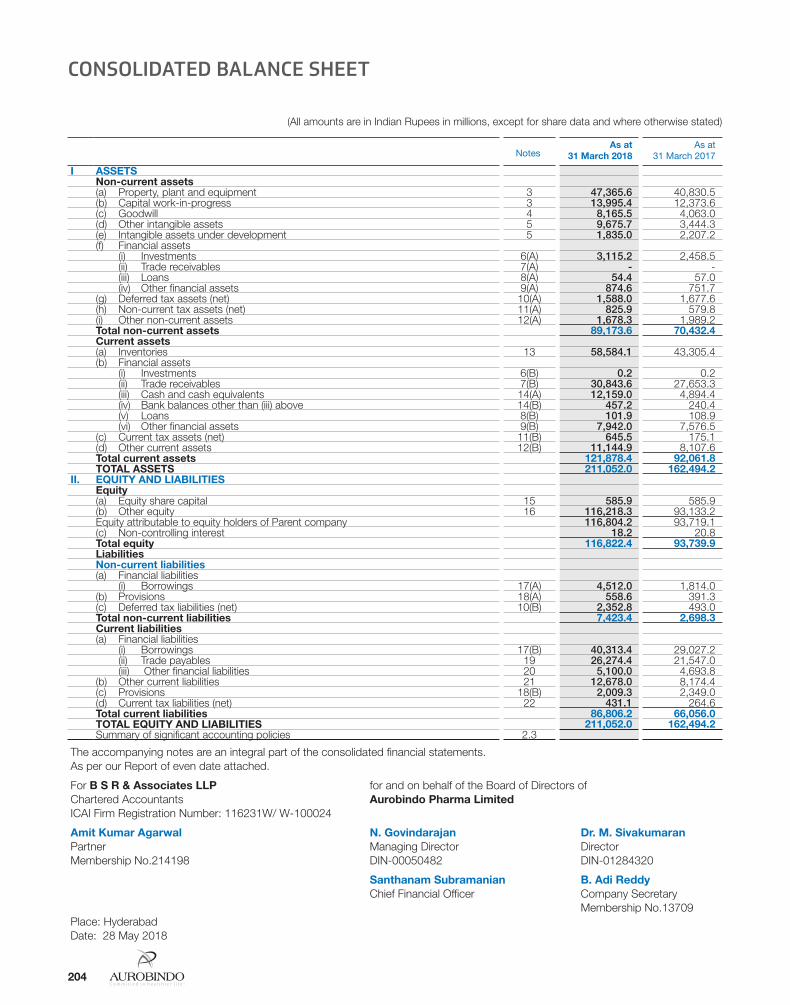
Annual Report 2017-18 205204
(All amounts are in Indian Rupees in millions, except for share data and where otherwise stated)
CONSOLIDATED BALANCE SHEET
The accompanying notes are an integral part of the consolidated financial statements.As per our Report of even date attached.
For B S R & Associates LLP for and on behalf of the Board of Directors ofChartered Accountants Aurobindo Pharma LimitedICAI Firm Registration Number: 116231W/ W-100024
Amit Kumar Agarwal N. Govindarajan Dr. M. SivakumaranPartner Managing Director DirectorMembership No.214198 DIN-00050482 DIN-01284320
Santhanam Subramanian B. Adi ReddyChief Financial Officer Company Secretary
Membership No.13709Place: HyderabadDate: 28 May 2018
NotesAs at
31 March 2018 As at
31 March 2017
I ASSETSNon-current assets(a) Property, plant and equipment 3 47,365.6 40,830.5 (b) Capital work-in-progress 3 13,995.4 12,373.6 (c) Goodwill 4 8,165.5 4,063.0 (d) Other intangible assets 5 9,675.7 3,444.3 (e) Intangible assets under development 5 1,835.0 2,207.2 (f) Financial assets
(i) Investments 6(A) 3,115.2 2,458.5 (ii) Trade receivables 7(A) - - (iii) Loans 8(A) 54.4 57.0 (iv) Other financial assets 9(A) 874.6 751.7 (g) Deferred tax assets (net) 10(A) 1,588.0 1,677.6 (h) Non-current tax assets (net) 11(A) 825.9 579.8 (i) Other non-current assets 12(A) 1,678.3 1,989.2 Total non-current assets 89,173.6 70,432.4 Current assets(a) Inventories 13 58,584.1 43,305.4 (b) Financial assets (i) Investments 6(B) 0.2 0.2 (ii) Trade receivables 7(B) 30,843.6 27,653.3 (iii) Cash and cash equivalents 14(A) 12,159.0 4,894.4 (iv) Bank balances other than (iii) above 14(B) 457.2 240.4 (v) Loans 8(B) 101.9 108.9 (vi) Other financial assets 9(B) 7,942.0 7,576.5 (c) Current tax assets (net) 11(B) 645.5 175.1 (d) Other current assets 12(B) 11,144.9 8,107.6 Total current assets 121,878.4 92,061.8 TOTAL ASSETS 211,052.0 162,494.2
II. EQUITY AND LIABILITIESEquity(a) Equity share capital 15 585.9 585.9 (b) Other equity 16 116,218.3 93,133.2 Equity attributable to equity holders of Parent company 116,804.2 93,719.1 (c) Non-controlling interest 18.2 20.8 Total equity 116,822.4 93,739.9 LiabilitiesNon-current liabilities (a) Financial liabilities (i) Borrowings 17(A) 4,512.0 1,814.0 (b) Provisions 18(A) 558.6 391.3 (c) Deferred tax liabilities (net) 10(B) 2,352.8 493.0 Total non-current liabilities 7,423.4 2,698.3 Current liabilities (a) Financial liabilities (i) Borrowings 17(B) 40,313.4 29,027.2 (ii) Trade payables 19 26,274.4 21,547.0 (iii) Other financial liabilities 20 5,100.0 4,693.8 (b) Other current liabilities 21 12,678.0 8,174.4 (c) Provisions 18(B) 2,009.3 2,349.0 (d) Current tax liabilities (net) 22 431.1 264.6 Total current liabilities 86,806.2 66,056.0 TOTAL EQUITY AND LIABILITIES 211,052.0 162,494.2 Summary of significant accounting policies 2.3

Annual Report 2017-18 205204
(All amounts are in Indian Rupees in millions, except for share data and where otherwise stated)
Com
pany O
verviewS
tatutory Rep
ortsFinancial S
tatements
The accompanying notes are an integral part of the consolidated financial statements.As per our Report of even date attached.
For B S R & Associates LLP for and on behalf of the Board of Directors ofChartered Accountants Aurobindo Pharma LimitedICAI Firm Registration Number: 116231W/ W-100024
Amit Kumar Agarwal N. Govindarajan Dr. M. SivakumaranPartner Managing Director DirectorMembership No.214198 DIN-00050482 DIN-01284320
Santhanam Subramanian B. Adi ReddyChief Financial Officer Company Secretary
Membership No.13709Place: HyderabadDate: 28 May 2018
CONSOLIDATED STATEMENT OF PROFIT AND LOSS
NoteYear ended
31 March 2018Year ended
31 March 2017
I INCOMERevenue from operations 23 164,998.3 150,898.6 Other income 24 1,019.8 1,158.9 TOTAL INCOME (I) 166,018.1 152,057.5
II EXPENSES 25Cost of materials consumed 56,293.8 51,849.2 Purchases of stock-in-trade 26 16,058.8 15,585.4 Changes in inventories of finished goods, stock-in-trade and work-in-progress 27 (4,825.2) (3,092.0)Employee benefits expense 28 21,308.4 17,677.6 Finance costs 29 777.2 667.2 Depreciation and amortisation expense 30 5,579.7 4,276.3 Other expenses 38,445.0 34,535.6 TOTAL EXPENSES (II) 133,637.7 121,499.3
III PROFIT BEFORE SHARE OF PROFIT OF JOINT VENTURES AND TAX (I-II) 32,380.4 30,558.2 IV Share of profit of joint ventures (net of tax) 31.4 50.2 V PROFIT BEFORE TAX (III+IV) 32,411.8 30,608.4 VI TAX EXPENSE : 31
Current tax 7,123.0 6,917.0 Tax credit - Minimum Alternate Tax (MAT) (433.2) (642.8)Deferred tax 1,492.9 1,322.3 TOTAL TAX EXPENSE (VI) 8,182.7 7,596.5
VII PROFIT FOR THE YEAR ATTRIBUTABLE TO (V-VI) 24,229.1 23,011.9 Owners of the Parent Company 24,231.7 23,016.6 Non-controlling interest (2.6) (4.7)PROFIT FOR THE YEAR (VII) 24,231.7 23,016.6
VIII OTHER COMPREHENSIVE INCOME (A) Items that will not to be reclassified subsequently to profit or loss:(i) Re-measurement of defined employee benefit liability (36.7) (87.6)(ii) Income-tax relating to items that will not be reclassified to profit or loss 13.1 29.7 (B) Items that will be reclassified subsequently to profit or loss:(i) Exchange differences on translating the financial statements of foreign operations 1,519.1 (804.4)(ii) Income-tax on items that will be reclassified subsequently to profit or loss - - TOTAL OTHER COMPREHENSIVE INCOME FOR THE YEAR (NET OF TAX) (VIII) 1,495.5 (862.3)
IX TOTAL COMPREHENSIVE INCOME FOR THE YEAR (NET OF TAX) ATTRIBUTABLE TO (VII+VIII) 25,727.2 22,154.3 Owners of the Parent Company 25,729.8 22,159.0 Non-controlling interest (2.6) (4.7)
X EARNINGS PER EQUITY SHARE: 34(i) Basic (in `) 41.36 39.33 (ii) Diluted (in `) 41.36 39.33 Nominal value per equity share 1.00 1.00 Summary of significant accounting policies 2.3
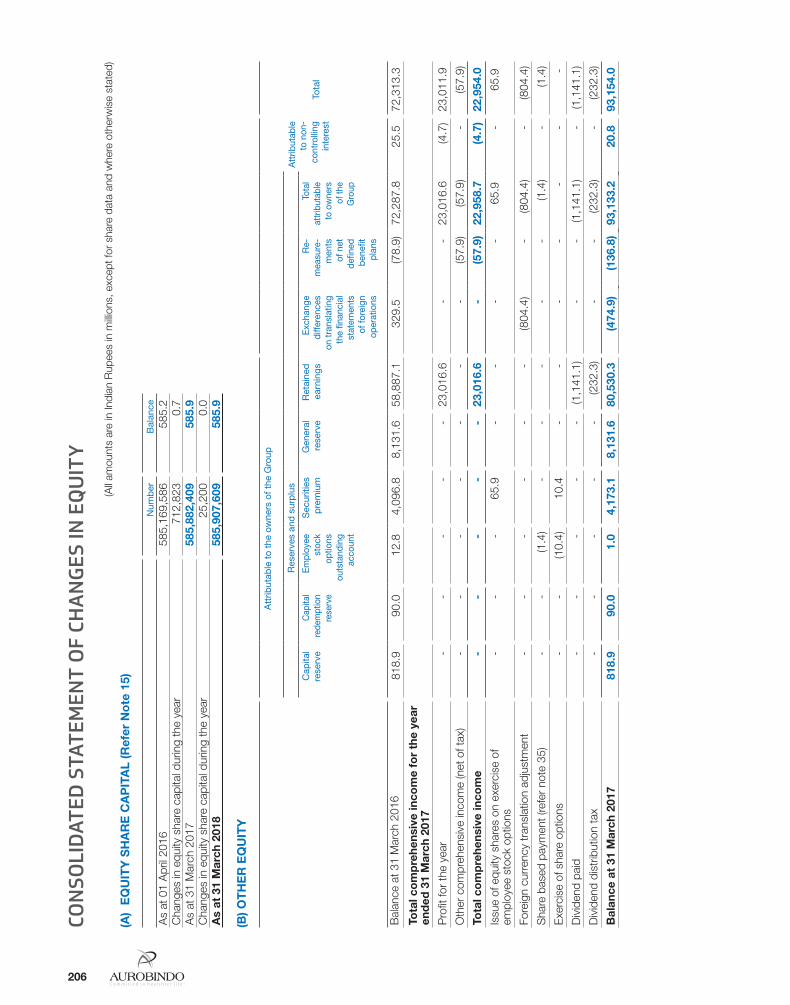
(All
amou
nts
are
in In
dian
Rup
ees
in m
illion
s, e
xcep
t for
sha
re d
ata
and
whe
re o
ther
wis
e st
ated
)
(A)
EQ
UIT
Y S
HA
RE
CA
PIT
AL
(Ref
er N
ote
15)
Num
ber
B
alan
ce
As
at 0
1 A
pril
2016
585
,169
,586
5
85.2
C
hang
es in
equ
ity s
hare
cap
ital d
urin
g th
e ye
ar
712
,823
0
.7
As
at 3
1 M
arch
201
7 5
85,8
82,4
09
585
.9
Cha
nges
in e
quity
sha
re c
apita
l dur
ing
the
year
2
5,20
0 0
.0
As
at 3
1 M
arch
201
8 5
85,9
07,6
09
585
.9
(B) O
TH
ER
EQ
UIT
Y
Att
ribut
able
to
the
owne
rs o
f the
Gro
up
Att
ribut
able
to
non
-co
ntro
lling
in
tere
stTo
tal
Res
erve
s an
d s
urp
lus
Cap
ital
rese
rve
Cap
ital
rede
mpt
ion
rese
rve
Empl
oyee
st
ock
optio
ns
outs
tand
ing
acco
unt
Sec
uriti
es
pre
miu
mG
ener
al
rese
rve
Ret
aine
d
earn
ings
Exc
hang
e di
ffere
nces
on
tran
slat
ing
the
finan
cial
st
atem
ents
of
fore
ign
oper
atio
ns
Re-
mea
sure
-m
ents
of
net
de
fined
be
nefit
pl
ans
Tota
l at
trib
utab
le
to o
wne
rs
of th
e G
roup
Bal
ance
at 3
1 M
arch
201
6 8
18.9
9
0.0
12.
8 4
,096
.8
8,1
31.6
5
8,88
7.1
329
.5
(78.
9) 7
2,28
7.8
25.
5 7
2,31
3.3
Tota
l co
mp
rehe
nsiv
e in
com
e fo
r th
e ye
ar
end
ed 3
1 M
arch
201
7
Pro
fit fo
r th
e ye
ar -
-
-
-
-
2
3,01
6.6
-
-
23,
016.
6 (4
.7)
23,
011.
9
Oth
er c
ompr
ehen
sive
inco
me
(net
of t
ax)
-
-
-
-
-
-
-
(57.
9) (5
7.9)
-
(57.
9)
Tota
l co
mp
rehe
nsiv
e in
com
e -
-
-
-
-
2
3,01
6.6
-
(57.
9) 2
2,95
8.7
(4.7
) 2
2,95
4.0
Issu
e of
equ
ity s
hare
s on
exe
rcis
e of
em
ploy
ee s
tock
opt
ions
-
-
-
65.
9 -
-
-
-
6
5.9
-
65.
9
Fore
ign
curr
ency
tran
slat
ion
adju
stm
ent
-
-
-
-
-
-
(804
.4)
-
(804
.4)
-
(804
.4)
Sha
re b
ased
pay
men
t (re
fer
note
35)
-
-
(1.4
) -
-
-
-
-
(1
.4)
-
(1.4
)
Exe
rcis
e of
sha
re o
ptio
ns -
-
(1
0.4)
10.
4 -
-
-
-
-
-
-
Div
iden
d pa
id -
-
-
-
-
(1
,141
.1)
-
-
(1,1
41.1
) -
(1
,141
.1)
Div
iden
d di
strib
utio
n ta
x -
-
-
-
-
(2
32.3
) -
-
(2
32.3
) -
(2
32.3
)
Bal
ance
at
31 M
arch
201
7 8
18.9
9
0.0
1.0
4
,173
.1
8,1
31.6
8
0,53
0.3
(474
.9)
(136
.8)
93,
133.
2 2
0.8
93,
154.
0
CON
SOLI
DAT
ED S
TATE
MEN
T O
F CH
AN
GES
IN E
QU
ITY
206

As
per
our
Rep
ort o
f eve
n da
te a
ttac
hed.
For
B S
R &
Ass
oci
ates
LLP
for
and
on b
ehal
f of t
he B
oard
of D
irect
ors
ofC
hart
ered
Acc
ount
ants
Aur
ob
ind
o P
harm
a Li
mit
edIC
AI F
irm R
egis
trat
ion
Num
ber:
116
231W
/ W
-100
024
Am
it K
umar
Ag
arw
alN
. Go
vind
araj
anD
r. M
. Siv
akum
aran
San
than
am S
ubra
man
ian
B. A
di R
edd
yP
artn
erM
anag
ing
Dire
ctor
Dire
ctor
Chi
ef F
inan
cial
Offi
cer
Com
pany
Sec
reta
ryM
embe
rshi
p N
o.21
4198
DIN
-000
5048
2D
IN-0
1284
320
Mem
bers
hip
No.
1370
9P
lace
: Hyd
erab
adD
ate:
28
May
201
8
Att
ribut
able
to
the
owne
rs o
f the
Gro
up
Att
ribut
able
to
non
-co
ntro
lling
in
tere
stTo
tal
Res
erve
s an
d s
urp
lus
Cap
ital
rese
rve
Cap
ital
rede
mpt
ion
rese
rve
Empl
oyee
st
ock
optio
ns
outs
tand
ing
acco
unt
Sec
uriti
es
pre
miu
mG
ener
al
rese
rve
Ret
aine
d
earn
ings
Exc
hang
e di
ffere
nces
on
tran
slat
ing
the
finan
cial
st
atem
ents
of
fore
ign
oper
atio
ns
Re-
mea
sure
-m
ents
of
net
de
fined
be
nefit
pl
ans
Tota
l at
trib
utab
le
to o
wne
rs
of th
e G
roup
Pro
fit fo
r th
e ye
ar -
-
-
-
2
4,23
1.7
-
-
24,
231.
7 (2
.6)
24,
229.
1
Oth
er c
ompr
ehen
sive
inco
me
(net
of t
ax)
-
-
-
-
-
-
-
(23.
7) (2
3.7)
-
(23.
7)
Tota
l co
mp
rehe
nsiv
e in
com
e -
-
-
-
-
2
4,23
1.7
-
(23.
7) 2
4,20
8.0
(2.6
) 2
4,20
5.4
Issu
e of
equ
ity s
hare
s on
exe
rcis
e of
em
ploy
ee s
tock
opt
ions
-
-
-
2.3
-
-
-
-
2
.3
-
2.3
Fore
ign
curr
ency
tran
slat
ion
adju
stm
ent
-
-
-
-
-
-
1,5
19.1
-
1
,519
.1
-
1,5
19.1
Sha
re b
ased
pay
men
t (re
fer
note
35)
-
-
(0.3
) 0
.4
-
-
-
-
0.1
-
0
.1
Exe
rcis
e of
sha
re o
ptio
ns -
-
-
-
-
-
-
-
-
-
-
Div
iden
d pa
id -
-
-
-
-
(2
,197
.1)
-
-
(2,1
97.1
) -
(2
,197
.1)
Div
iden
d di
strib
utio
n ta
x -
-
-
-
-
(4
47.3
) -
-
(4
47.3
) -
(4
47.3
)
Bal
ance
at
31 M
arch
201
8 8
18.9
9
0.0
0.7
4
,175
.8
8,1
31.6
102
,117
.6
1,0
44.2
(1
60.5
)11
6,21
8.3
18.
2 11
6,23
6.5
(All
amou
nts
are
in In
dian
Rup
ees
in m
illion
s, e
xcep
t for
sha
re d
ata
and
whe
re o
ther
wis
e st
ated
)
Annual Report 2017-18 207
Com
pany O
verviewS
tatutory Rep
ortsFinancial S
tatements

Annual Report 2017-18 209208
(All amounts are in Indian Rupees in millions, except for share data and where otherwise stated)
Year ended 31 March 2018
Year ended 31 March 2017
1 CASH FLOW FROM OPERATING ACTIVITIESNet profit before tax 32,411.8 30,608.4 Adjustments to reconcile profit before tax to net cash flows:
Depreciation and amortisation expense 5,579.7 4,276.3 Provision no longer required on doubtful receivables written back (net) (95.9) - Balances no longer required written back (net) (371.4) (83.7)Bad debts/advances written off - (70.8)Product destruction expenses / stock written off 109.4 221.2 Market-to-market loss/(gain) on derivative financial instruments 23.3 (94.8)Unrealised foreign exchange gain (net) (867.9) (69.3)Loss on sale / write-off of property, plant and equipment (net) 163.5 62.7 Share of profit of joint ventures (31.4) (50.2)Share based payment 0.1 (1.4)Change in fair value of current investment 0.1 -
Interest expense 628.9 545.1 Interest income (120.2) (161.5)Operating profit before working capital changes 37,430.0 35,182.0 Foreign currency translation adjustments 332.0 (484.4)Movements in working capital:Increase/(decrease) in trade payables 4,098.1 (1,572.7)Increase in inventories (14,126.7) (2,965.1)(Increase)/decrease in trade receivables (723.2) 17,728.6 Increase in other financial assets (705.8) (7,341.3)Increase in current / non current other assets (2,930.1) (878.0)Decrease/(increase) in loans and advances 9.6 (8.3)(Decrease)/increase in provisions (249.2) 639.1 Increase in other current liabilities 3,958.0 253.4 Decrease in other financial liabilities (20.5) (30.5)Cash generated from operating activities 27,072.2 40,522.8 Direct taxes paid (net of refunds) (7,524.0) (7,737.0)Net cash flow generated from operating activities (A) 19,548.2 32,785.8
2 CASH FLOW USED IN INVESTING ACTIVITIESPurchase of property, plant and equipment, including capital work- in- progress, capital advances and capital creditors
(15,299.2) (16,941.5)
Proceeds from sale of property, plant and equipment 2,892.9 95.4 Acquisition of subsidiary (6,658.9) - Purchase of non-current investments made in joint ventures (refer Note "c" below) (677.6) (1,179.0)Loan given to joint venture (1,065.2) -Loan repaid by joint venture (refer Note "c" below) 960.0 -Interest received (refer Note "c" below) 115.1 154.7 Dividend received 163.4 - Net cash flow used in investing activities (B) (19,569.5) (17,870.4)
3 CASH FLOW FROM FINANCING ACTIVITIESProceeds from issuance of equity share capital 2.3 66.6 Proceeds from non-current borrowings 9,164.2 - Repayment of non-current borrowings (9,370.9) (9,132.6)Proceeds from/(repayment) of current borrowings (net) 12,228.9 (8,146.5)Interest paid (741.7) (568.3)Dividends paid on equity shares (2,194.0) (1,139.5)Tax paid on equity dividend (447.3) (232.3)Net cash flow generated from/(used in) financing activities (C) 8,641.5 (19,152.6)
CONSOLIDATED STATEMENT OF CASH FLOW

Annual Report 2017-18 209208
(All amounts are in Indian Rupees in millions, except for share data and where otherwise stated)
Com
pany O
verviewS
tatutory Rep
ortsFinancial S
tatements
As per our Report of even date attached.
For B S R & Associates LLP for and on behalf of the Board of Directors ofChartered Accountants Aurobindo Pharma LimitedICAI Firm Registration Number: 116231W/ W-100024
Amit Kumar Agarwal N. Govindarajan Dr. M. SivakumaranPartner Managing Director DirectorMembership No.214198 DIN-00050482 DIN-01284320
Santhanam Subramanian B. Adi ReddyChief Financial Officer Company Secretary
Membership No.13709Place: HyderabadDate: 28 May 2018
Year ended 31 March 2018
Year ended 31 March 2017
Net increase/(decrease) in cash and cash equivalents (A+B+C) 8,620.2 (4,237.2)Cash and cash equivalents at the beginning of the year 3,196.3 7,434.9 Add: Cash and cash equivalents on acquisition 303.6 -Effect of exchange differences on cash and cash equivalents (1.7) (1.4)Cash and cash equivalents at the end of the year 12,118.4 3,196.3
Note:a) The above statement of cash flow has been prepared under the ‘Indirect Method’ as set out in the Indian Accounting Standard
7(Ind AS-7) “Statement of Cash Flow”. b) Cash and cash equivalents comprises of:
As at 31 March 2018
As at 31 March 2017
COMPONENTS OF CASH AND CASH EQUIVALENTS Cash on hand 3.3 5.8 Cheques on hand 191.9 - Balance with banks
- on current account 11,314.5 4,611.9 - on cash credit account 273.2 (1,666.7)- on deposit account 316.5 229.4 - on unpaid dividend account * 19.0 15.9
Cash and Cash equivalents considered for cash flows (refer note 14) 12,118.4 3,196.3
* The Group can utilise these balances only towards settlement of unpaid dividend.
c) The following items in the nature of non-cash transactions are not included in determining cash flow from investing activities:
Particulars 31 March 2018 31 March 2017
(i) Loans converted into optionally convertible debentures 105.2 - (ii) Interest converted into optionally convertible debentures 5.7 - Total 110.9 -
d) Reconciliation between the opening and closing balances in balance sheet for financial liabilities arising from financing activities are given below:
Particulars
As at 31 March 2017
Borrowings taken over
upon business combination
Cash flows Non-cash transactions
Foreign exchange loss
As at 31 March 2018
Non-current borrowings 4,614.2 2,984.4 (206.7) (5.9) 7,386.0 Current borrowings 27,329.1 - 12,228.9 714.8 40,272.8 Summary of significant accounting policies (Refer Note 2.3)

Annual Report 2017-18 211210
1. CORPORATE INFORMATION The consolidated financial statements comprise financial
statements of Aurobindo Pharma Limited (“APL” or “the Parent Company” or “Holding Company” or “the company”) together with its subsidiaries (collectively termed as “the Group”) and joint ventures (collectively termed as “the Consolidated Entities”) for the year ended 31 March 2018. Aurobindo Pharma Limited is a public Company domiciled in India and was incorporated under the provisions of the Companies Act applicable in India. The registered office of the Company is located at Plot No.2, Maitri Vihar, Ameerpet, Hyderabad - 500038, India and the Corporate office is located at The Water Mark Building, Plot No. 11, Survey No. 9, Hi-tech City, Hyderabad - 500084, India. The Company’s shares are listed on the Bombay Stock Exchange (BSE) and the National Stock Exchange (NSE) in India.
The Group is principally engaged in manufacturing and marketing of Active pharmaceutical ingredients, generic pharmaceuticals and related services. These consolidated financial statements were approved by the Board of Directors and authorised for issue on 28 May 2018.
2. STATEMENT OF SIGNIFICANT ACCOUNTING POLICIES
2.1. Basis of preparation a) Statement of compliance These consolidated financial statements have been
prepared in accordance with the Indian Accounting Standards (hereinafter referred to as the “Ind AS”) as notified by Ministry of Corporate Affairs pursuant to Section 133 of the Companies Act, 2013 (“the Act”) read with Rule 3 of the Companies (Indian Accounting Standards) Rules, 2015 and Companies (Indian Accounting Standards) Amendment Rules, 2016.
These consolidated financial statements comprise the consolidated balance Sheets as at 31 March 2018 and 31 March 2017, the consolidated statements of profit and loss, the consolidated statements of cash flows and the statements of changes in equity for the year ended 31 March 2018 and for the year ended 31 March 2017, and a summary of the significant accounting policies and other explanatory information (together hereinafter referred to as “Consolidated Financial Statements” or “Financial Statements”).
These consolidated financial statements have been prepared on accrual and going concern basis. The accounting policies are applied consistently to all the periods presented in these consolidated financial statements.
b) Functional and presentation currency These consolidated financial statements are presented in
Indian rupees (`), which is also the functional currency of the Parent Company. All amounts have been rounded-
off to the nearest million, unless otherwise indicated. Transactions and balances with values below ` one lac have been reflected as “0.0” in the financial statements.
c) Basis of measurement The consolidated financial statements have been
prepared on a historical cost convention and on an accrual basis, except for the following;
- certain financial assets and liabilities (including derivative instruments) are measured at fair value or amortised cost.
- employee defined benefit assets / liability recognised as the net total of the fair value of plan assets, and actuarial losses/gains, and the present value of defined benefit obligation.
- Investment in joint venture which are accounted for using the equity method.
d) Use of estimates and judgements The preparation of the consolidated financial statements
in conformity with Ind AS requires management to make estimates, judgements and assumptions. These estimates, judgements and assumptions affect the application of accounting policies and the reported amounts of assets and liabilities, the disclosures of contingent assets and liabilities at the date of the financial statements and reported amounts of revenues and expenses during the period. Accounting estimates could change from period to period. Actual results could differ from those estimates. Appropriate changes in estimates are made as management becomes aware of changes in circumstances surrounding the estimates. Changes in estimates are reflected in the financial statements in the period in which changes are made and, if material, their effects are disclosed in the notes to the standalone financial statements.
Judgements Information about judgements made in applying
accounting policies that have the most significant effects on the amounts recognised in the financial statements is included in the following notes:
- Note 32 (A) - leases: whether an arrangement contains a lease; lease classification.
- Note 2.3(q) and 46: Financial instruments
- Note 2.3(k), 10, 11 and 31: Provision for income taxes and evaluation of recoverability of deferred tax assets.
- Note 2.3(e): Useful lives of property, plant and equipment
- Note 35: Share based payments
- Note 36: Assets and obligations relating to employee benefits
NOTES TO CONSOLIDATED FINANCIAL STATEMENTSfor the year ended 31 March 2018

Annual Report 2017-18 211210
Com
pany O
verviewS
tatutory Rep
ortsFinancial S
tatements
Assumptions and estimation uncertainties The key assumptions concerning the future and other
key sources of estimation uncertainty at the reporting date, that have a significant risk of causing a material adjustment to the carrying amounts of assets and liabilities within the next financial year, are described below. The Group based its assumptions and estimates on parameters available when the financial statements were prepared. Existing circumstances and assumptions about future developments, however, may change due to market changes or circumstances arising that are beyond the control of the Group. Such changes are reflected in the assumptions when they occur.
(i) Share-based payments The grant date fair value of employee stock options
granted is recognised as an employee expense over the period that the employee becomes unconditionally entitled to the options. Estimating fair value for share-based payment transactions requires determination of the most appropriate valuation model, which is dependent on the terms and conditions of the grant. This estimation requires determination of the most appropriate inputs to the valuation model including the expected life of the share option, volatility and dividend yield and making assumptions about them. The Black Scholes valuation model has been used by the Management for share-based payment transactions. The assumptions and models used for estimating fair value for share-based payment transactions are disclosed in Note 35.
(ii) Defined employee benefit plans (Gratuity) The cost of the defined benefit gratuity plan
and other accumulated leave entitlement and the present value of the gratuity obligation and accumulated leave obligation are determined using actuarial valuations. An actuarial valuation involves making various assumptions that may differ from actual developments in the future. These include the determination of the discount rate, future salary increases and mortality rates. Due to the complexities involved in the valuation and its long-term nature, a defined benefit obligation is highly sensitive to changes in these assumptions. All assumptions are reviewed at each reporting date.
The parameter most subject to change is the discount rate. In determining the appropriate discount rate for plans operated in India, the management considers the interest rates of government bonds in currencies consistent with the currencies of the post-employment benefit obligation.
The mortality rate is based on publicly available mortality tables for the specific countries. Those mortality tables tend to change only at interval in response to demographic changes. Future salary increases and gratuity increases are based on expected future inflation rates. Further details about gratuity obligations are given in Note 36.
(iii) Fair value measurement of financial instruments When the fair values of financial assets and financial
liabilities recorded in the balance sheet cannot be measured based on quoted prices in active markets, their fair value is measured using valuation techniques including the DCF model. The inputs to these models are taken from observable markets where possible, but where this is not feasible, a degree of judgement is required in establishing fair values. Judgements include considerations of inputs such as liquidity risk, credit risk and volatility. Changes in assumptions about these factors could affect the reported fair value of financial instruments. See notes 45 and 46 for further disclosures.
(iv) Depreciation on property, plant and equipment Depreciation on property, plant and equipment
is calculated on a straight-line basis based on the useful lives estimated by the management. Considering the applicability of Schedule II of Companies Act, 2013, the management has re-estimated useful lives and residual values of all its property, plant and equipment. The management believes that useful lives currently used fairly reflect its estimate of the useful lives and residual values of property, plant and equipment, though these in certain cases are different from lives prescribed under Schedule II of the Companies Act, 2013.
(v) Impairment of non-financial assets Impairment exists when the carrying value of
an asset or cash generating unit exceeds its recoverable amount, which is the higher of its fair value less costs of disposal and its value in use. The fair value less costs of disposal calculation is based on available data from binding sales transactions, conducted at arm’s length, for similar assets or observable market prices less incremental costs for disposing of the asset. The value in use calculation is based on a DCF model.
(vi) Impairment of investments The Group reviews its carrying value of investments
annually, or more frequently when there is an indication for impairment. If the recoverable amount is less than its carrying amount, the impairment loss is accounted for.
NOTES TO CONSOLIDATED FINANCIAL STATEMENTSfor the year ended 31 March 2018
Annual Report 2017-18 213212
(vii) Intangible assets under development The Group capitalises acquired intangible asset
under development for a project in accordance with the accounting policy. In determining the amounts to be capitalised, management makes assumptions regarding the expected future cash generation of the project, discount rates to be applied and the expected period of benefits. The innovative nature of the product gives rise to some uncertainty as to whether the final approval for the products will be obtained.
(viii) Inventories The Group estimates the net realisable value
(NRV) of its inventories by taking into account their estimated selling price, estimated cost of completion, estimated costs necessary to make the sale, obsolescence by applying certain percentages over different age category of such inventories, expected loss rate considering the past trend and future outlook. Inventories are written down to NRV where such NRV is lower than their cost.
(ix) Recognition and measurement of other provisions:
The recognition and measurement of other provisions is based on the assessment of the probability of an outflow of resources, and on past experience and circumstances known at the closing date. The actual outflow of resources at a future date may therefore, vary from the amount included in other provisions.
2.2. Basis of consolidation (i) Business combinations In accordance with Ind AS 101 provisions related to
first time adoption, the Group has elected to apply Ind AS accounting for business combinations prospectively from 01 April 2015. As such, Indian GAAP balances relating to business combinations entered into before that date, including goodwill, have been carried forward with minimal adjustment. The same first time adoption exemption is also used for joint ventures.
Business combinations are accounted for using the Acquisition method. The acquisition date is the date on which control is transfered to the acquirer. The cost of an acquisition is measured as the aggregate of the consideration transferred measured at acquisition date fair value and the amount of any non-controlling interests in the acquiree. For each business combination, the Group elects whether to measure the non-controlling interests in the acquiree at fair value or at the proportionate share of the acquiree’s identifiable net assets. Acquisition-related costs are expensed as incurred.
At the acquisition date, the identifiable assets acquired and the liabilities assumed are at their acquisition date fair value. For this purpose, the liabilities assumed include contingent liabilities representing present obligation and they are measured at their acquisition fair values irrespective of the fact that outflow of resources embodying economic benefits is not probable. However, the following assets and liabilities acquired in a business combination are measured at the basis indicated below:
Deferred tax assets or liabilities, and the assets or liabilities related to employee benefit arrangements are recognised and measured in accordance with Ind AS 12 Income Tax and Ind AS 19 Employee Benefits respectively.
- Assets (or disposal Groups) that are classified as held for sale in accordance with Ind AS 105 Non-current Assets Held for Sale and Discontinued Operations are measured in accordance with that standard.
- Reacquired rights are measured at a value determined on the basis of the remaining contractual term of the related contract. Such valuation does not consider potential renewal of the reacquired right.
When the Group acquires a business, it assesses the financial assets and liabilities assumed for appropriate classification and designation in accordance with the contractual terms, economic circumstances and pertinent conditions as at the acquisition date. If the business combination is achieved in stages, any previously held equity interest is re-measured at its acquisition date fair value and any resulting gain or loss is recognised in profit or loss or OCI, as appropriate.
Any contingent consideration to be transferred by the acquirer is recognised at fair value at the acquisition date. Contingent consideration classified as an asset or liability that is a financial instrument and within the scope of Ind AS 109 Financial Instruments, is measured at fair value with changes in fair value recognised in profit or loss. If the contingent consideration is not within the scope of Ind AS 109, it is measured in accordance with the appropriate Ind AS. Contingent consideration that is classified as equity is not re-measured at subsequent reporting dates and subsequent its settlement is accounted for within equity.
Goodwill is initially measured at cost, being the excess of the aggregate of the consideration transferred and the amount recognised for non-controlling interests, and any previous interest held, over the net identifiable assets acquired and liabilities assumed. If the fair value of the net assets acquired is in excess of the aggregate consideration transferred, the Group re-assesses whether it has correctly identified all of the assets
NOTES TO CONSOLIDATED FINANCIAL STATEMENTSfor the year ended 31 March 2018
Annual Report 2017-18 213212
Com
pany O
verviewS
tatutory Rep
ortsFinancial S
tatements
acquired and all of the liabilities assumed and reviews the procedures used to measure the amounts to be recognised at the acquisition date. If the reassessment still results in an excess of the fair value of net assets acquired over the aggregate consideration transferred, then the gain is recognised in OCI and accumulated in equity as capital reserve. However, if there is no clear evidence of bargain purchase, the entity recognises the gain directly in equity as capital reserve, without routing the same through OCI.
After initial recognition, goodwill is measured at cost less any accumulated impairment losses. For the purpose of impairment testing, goodwill acquired in a business combination is, from the acquisition date, allocated to each of the Group’s cash-generating units that are expected to benefit from the combination, irrespective of whether other assets or liabilities of the acquiree are assigned to those units.
A cash generating unit to which goodwill has been allocated is tested for impairment annually, or more frequently when there is an indication that the unit may be impaired. If the recoverable amount of the cash generating unit is less than its carrying amount, the impairment loss is allocated first to reduce the carrying amount of any goodwill allocated to the unit and then to the other assets of the unit pro rata based on the carrying amount of each asset in the unit. Any impairment loss for goodwill is recognised in profit or loss. An impairment loss recognised for goodwill is not reversed in subsequent periods.
Where goodwill has been allocated to a cash-generating unit and part of the operation within that unit is disposed of, the goodwill associated with the disposed operation is included in the carrying amount of the operation when determining the gain or loss on disposal. Goodwill disposed in these circumstances is measured based on the relative values of the disposed operation and the portion of the cash-generating unit retained.
If the initial accounting for a business combination is incomplete by the end of the reporting period in which the combination occurs, the Group reports provisional amounts for the items for which the accounting is incomplete. Those provisional amounts are adjusted through goodwill during the measurement period, or additional assets or liabilities are recognised, to reflect new information obtained about facts and circumstances that existed at the acquisition date that, if known, would have affected the amounts recognized at that date. These adjustments are called as measurement period adjustments. The measurement period does not exceed one year from the acquisition date.
(ii) Subsidiaries Control is achieved when the Group is exposed, or
has rights, to variable returns from its involvement with the investee and has the ability to affect those returns through its power over the investee. Specifically, the Group controls an investee if and only if the Group has:
- Power over the investee (i.e. existing rights that give it the current ability to direct the relevant activities of the investee)
- Exposure, or rights, to variable returns from its involvement with the investee, and
- The ability to use its power over the investee to affect its returns
Generally, there is a presumption that a majority of voting rights result in control. To support this presumption and when the Group has less than a majority of the voting or similar rights of an investee, the Group considers all relevant facts and circumstances in assessing whether it has power over an investee, including:
- The contractual arrangement with the other vote holders of the investee
- Rights arising from other contractual arrangements
- The Group’s voting rights and potential voting rights
- The size of the Group’s holding of voting rights relative to the size and dispersion of the holdings of the other voting rights holders
The Group re-assesses whether or not it controls an investee if facts and circumstances indicate that there are changes to one or more of the three elements of control. Consolidation of a subsidiary begins when the Group obtains control over the subsidiary and ceases when the Group loses control of the subsidiary. Assets, liabilities, income and expenses of a subsidiary acquired or disposed of during the year are included in the consolidated financial statements from the date the Group gains control until the date the Group ceases to control the subsidiary.
Consolidated financial statements are prepared using uniform accounting policies for like transactions and other events in similar circumstances. If a member of the Group uses accounting policies other than those adopted in the consolidated financial statements for like transactions and events in similar circumstances, appropriate adjustments are made to that Group member’s financial statements in preparing the consolidated financial statements to ensure conformity with the Group’s accounting policies. The financial statements of all entities used for the
NOTES TO CONSOLIDATED FINANCIAL STATEMENTSfor the year ended 31 March 2018

Annual Report 2017-18 215214
purpose of consolidation are drawn up to same reporting date as that of the Parent Company, i.e., year ended on 31 March.
Consolidation procedures: (a) Combine like items of assets, liabilities, equity,
income, expenses and cash flows of the parent with those of its subsidiaries. For this purpose, income and expenses of the subsidiary are based on the amounts of the assets and liabilities recognised in the consolidated financial statements at the acquisition date.
(b) Offset (eliminate) the carrying amount of the parent’s investment in each subsidiary and the parent’s portion of equity of each subsidiary. Business combinations policy explains how to account for any related goodwill.
(c) Eliminate in full intra-group assets and liabilities, equity, income, expenses and cash flows relating to transactions between entities of the Group (profits or losses resulting from intra-group transactions that are recognised in assets, such as inventory and fixed assets, are eliminated in full). Intra-group losses may indicate an impairment that requires recognition in the consolidated financial statements. Ind AS12 Income Taxes applies to temporary differences that arise from the elimination of profits and losses resulting from intra-group transactions.
Profit or loss and each component of other comprehensive income (OCI) are attributed to the equity holders of the parent of the Group and to the non-controlling interests, even if this results in the non-controlling interests having a deficit balance. When necessary, adjustments are made to the financial statements of subsidiaries to bring their accounting policies into line with the Group’s accounting policies. All intra-Group assets and liabilities, equity, income, expenses and cash flows relating to transactions between members of the Group are eliminated in full on consolidation.
A change in the ownership interest of a subsidiary, without a loss of control, is accounted for as an equity transaction. If the Group loses control over a subsidiary, it:
- Derecognises the assets (including goodwill) and liabilities of the subsidiary
- Derecognises the carrying amount of any non-controlling interests
- Derecognises the cumulative translation differences recorded in equity
- Recognises the fair value of the consideration received
- Recognises the fair value of any investment retained
- Recognises any surplus or deficit in profit or loss
- Reclassifies the parent’s share of components previously recognised in OCI to profit or loss or retained earnings, as appropriate, as would be required if the Group had directly disposed of the related assets or liabilities
(iii) Investment in joint ventures (accounted under equity method)
A joint venture is a type of joint arrangement whereby the parties that have joint control of the arrangement have rights to the net assets of the joint venture. Joint control is the contractually agreed sharing of control of an arrangement, which exists only when decisions about the relevant activities require unanimous consent of the parties sharing control. The considerations made in determining whether joint control are similar to those necessary to determine control over the subsidiaries.
The Group’s investments in its joint venture are accounted for using the equity method. Under the equity method, the investment in a joint venture is initially recognised at cost. The carrying amount of the investment is adjusted to recognise changes in the Group’s share of net assets of the joint venture since the acquisition date.
The consolidated statement of profit and loss reflects the Group’s share of the results of operations of the joint venture. Any change in OCI of those investees is presented as part of the Group’s OCI. In addition, when there has been a change recognised directly in the equity of the joint venture, the Group recognises its share of any changes, when applicable, in the statement of changes in equity. Unrealised gains and losses resulting from transactions between the Group and the joint venture are eliminated to the extent of the interest in the joint venture.
If an entity’s share of losses of a joint venture equals or exceeds its interest in the joint venture (which includes any long term interest that, in substance, form part of the Group’s net investment in the joint venture), the entity discontinues recognising its share of further losses. Additional losses are recognised only to the extent that the Group has incurred legal or constructive obligations or made payments on behalf of the joint venture. If the joint venture subsequently reports profits, the entity resumes recognising its share of those profits only after its share of the profits equals the share of losses not recognised.
The aggregate of the Group’s share of profit or loss of a joint venture is shown on the face of the consolidated
NOTES TO CONSOLIDATED FINANCIAL STATEMENTSfor the year ended 31 March 2018

Annual Report 2017-18 215214
Com
pany O
verviewS
tatutory Rep
ortsFinancial S
tatements
statement of profit and loss. The financial statements of the joint venture are prepared for the same reporting period as the Group.
After application of the equity method, the Group determines whether it is necessary to recognise an impairment loss on its investment in its joint venture. At each reporting date, the Group determines whether there is objective evidence that the investment in the joint venture is impaired. If there is such evidence, the Group calculates the amount of impairment as the
difference between the recoverable amount of the joint venture and its carrying value, and then recognises the loss as ‘Share of profit of a joint venture’ in the consolidated statement of profit or loss.
Upon loss of joint control over the joint venture, the Group measures and recognises any retained investment at its fair value. Any difference between the carrying amount of the joint venture upon loss of joint control and the fair value of the retained investment and proceeds from disposal is recognised in profit or loss.
Group information: The Consolidated Financial Statements have been prepared on the basis of the financial statements of the following
subsidiaries and joint ventures:S. No. Name of the Consolidated Entities
Country of Incorporation
Nature of Interest
% of Interest as at
31 March 2018 31 March 2017
1 Agile Pharma B.V. The Netherlands Subsidiary 100% 100%2 All Pharma (Shanghai) Trading Company Limited China Subsidiary 100% 100%3 APL Healthcare Limited India Subsidiary 100% 100%4 APL Pharma Thai Ltd Thailand Subsidiary 97.9% 97.9%5 APL Research Centre Limited India Subsidiary 100% 100%6 APL Swift Services (Malta) Limited Malta Subsidiary 100% 100%7 Arrow Generiques SAS France Subsidiary 100% 100%8 Aurex B.V. (formerly Pharmacin B.V. ) The Netherlands Subsidiary 100% 100%9 Auro AR LLC (w.e.f. 02 May 2016)1 USA Subsidiary 100% 100%10 Auro Health LLC USA Subsidiary 100% 100%11 Auro Healthcare (Nigeria) Limited Nigeria Subsidiary 100% 100%12 Auro Medics Pharma LLC USA Subsidiary 100% 100%13 Auro Peptides Limited India Subsidiary 100% 95%14 Auro Pharma Inc. Canada Subsidiary 100% 100%15 Auro Vaccines LLC (w.e.f. 27 January 2017)1 USA Subsidiary 100% 100%16 Raidurgam Developers Limited (Formerly Aurobindo
Antibiotics Ltd)6India Joint Venture 40% 100%
17 Aurobindo ILAC Sanayi ve Ticaret Limited Sirketi3 Turkey Subsidiary - 100%18 Aurobindo Pharma (Italia) S.r.l Italy Subsidiary 100% 100%19 Aurobindo Pharma (Malta) Limited Malta Subsidiary 100% 100%20 Aurobindo Pharma (Portugal) Unipessoal Lda Portugal Subsidiary 100% 100%21 Aurobindo Pharma (Pty) Limited South Africa Subsidiary 100% 100%22 Aurobindo Pharma (Romania) s.r.l Romania Subsidiary 100% 100%23 Aurobindo Pharma B.V. (formerly Actavis B.V.) The Netherlands Subsidiary 100% 100%24 Aurobindo Pharma Colombia S.A.S. Colombia Subsidiary 100% 100%25 Aurobindo Pharma GmbH Germany Subsidiary 100% 100%26 Aurobindo Pharma Industria Farmaceutica Ltda Brazil Subsidiary 99.97% 99.97%27 Aurobindo Pharma Japan K.K. Japan Subsidiary 100% 100%28 Aurobindo Pharma Produtos Farmaceuticos Ltda Brazil Subsidiary 100% 100%29 Aurobindo Pharma USA Inc. USA Subsidiary 100% 100%30 Aurobindo Pharma USA LLC (w.e.f. 14 April 2016) 1 & 8 USA Subsidiary 100% 100%31 Aurogen South Africa (PTY) Ltd (w.e.f. 25 January 2017) 1 South Africa Subsidiary 100% 100%32 Aurolife Pharma LLC USA Subsidiary 100% 100%33 Auronext Pharma Private Limited India Subsidiary 100% 100%34 Aurovida Farmaceutica S.A. de C.V. Mexico Subsidiary 100% 100%35 Aurovitas Pharma Polska (w.e.f. 31 March 2017) 1 Poland Subsidiary 100% 100%36 Aurovitas Spain SA (formerly Actavis Spain S.A.) Spain Subsidiary 100% 100%37 Aurovitas Unipessoal LDA Portugal Subsidiary 100% 100%38 AuroZymes Limited India Subsidiary 100% 100%39 Curepro parenterals Limited India Subsidiary 100% 100%
NOTES TO CONSOLIDATED FINANCIAL STATEMENTSfor the year ended 31 March 2018

Annual Report 2017-18 217216
S. No. Name of the Consolidated Entities
Country of Incorporation
Nature of Interest
% of Interest as at
31 March 2018 31 March 2017
40 Eugia Pharma Specialities Limited India Joint Venture 67.82% 67.82%41 Helix Healthcare B.V. The Netherlands Subsidiary 100% 100%42 Hyacinths Pharma Private Limited India Subsidiary 100% 100%43 Laboratorios Aurobindo, S.L. Spain Subsidiary 100% 100%44 Milpharm Limited UK Subsidiary 100% 100%45 Natrol LLC USA Subsidiary 100% 100%46 Novagen Pharma (Pty) Ltd South Africa Joint Venture 50% 50%47 Pharmacin B.V. (formerly Aurex B.V.) The Netherlands Subsidiary 100% 100%48 Puren Pharma GmbH & Co., KG (formerly Actavis
Deutschland GmbH & Co., KG)Germany Subsidiary 100% 100%
49 Silicon Life Sciences Private Limited India Subsidiary 100% 100%50 Tergene Biotech Pvt.Ltd 7 India Joint Venture 76.84% 60%51 1980 Puren Pharma GmbH (formerly Actavis
Management GmbH)Germany Subsidiary 100% 100%
52 Aurovitas Pharma Ceska Republica s.r.o (w.e.f. 23 December 2017)2
Czech Republic Subsidiary 100% -
53 Generis Farmaceutica S.A. ( w.e.f. 01 May 2017)2 Portugal Subsidiary 100% - 54 Mer Medicamentos, Lda (w.e.f. 01 May 2017)2 Portugal Subsidiary 100% - 55 Generis Phar, Unipessoal Lda (w.e.f. 01 May 2017)2 Portugal Subsidiary 100% - 56 Farma APS - Promocao de Medicamentos,
Unipessoal Lda., (w.e.f. 01 May 2017 and Closed w.e.f. 25 January 2018)2&4
Portugal Subsidiary - -
57 Generis MZ, Lda., (w.e.f. 01 May 2017 and closed w.e.f 19 March 2018)2&5
Mozambique Subsidiary - -
58 Aurobindo Pharma Saudi Arabia Limited Company (w.e.f. 08 May 2017)2
Saudi Arabia Subsidiary 100% -
59 Aurovitas Pharma (Taizhou) Ltd (w.e.f. 29 January, 2018)2 China Subsidiary 100% - 60 AuroLogistics LLC (w.e.f 28 April 2017)2 USA Subsidiary 100% - 61 Acrotech Biopharma LLC (w.e.f. 05 January 2018)2 USA Subsidiary 100% - 62 Auro Pharma India Private Limited
(w.e.f 20 December 2017)2India Subsidiary 100% -
Notes: 1. Incorporated during the financial year 2016-17. 2. Incorporated / Acquired during the financial year 2017-18. 3. Aurobindo ILAC Sanayi ve Ticaret Limited Sirketi liquidated w.e.f. 31 October 2017 4. Farma APS - Promocao de Medicamentos, Unipessoal Lda., Closed w.e.f. 25 January 2018 5. Generis MZ, Lda., Closed w.e.f. 19 March 2018 6. With effect from 30 November 2017 ceased to be a subsidiary of Parent Company, resulting in shareholding of 40% w.e.f 30
November 2017. 7. During the financial year 2017-18 Parent Company shareholding increased from 60% to 76.84% 8. Aurobindo Pharma USA LLC closed w.e.f. 31 March 2018 The figures for the subsidiaries have been considered from the date of acquisition/incorporation/and upto the date of disposal/
liquidation as applicable.
NOTES TO CONSOLIDATED FINANCIAL STATEMENTSfor the year ended 31 March 2018

Annual Report 2017-18 217216
Com
pany O
verviewS
tatutory Rep
ortsFinancial S
tatements
2.3. Significant accounting policies a. Current versus non-current classification The Group presents assets and liabilities in the
consolidated balance sheet based on current/ non-current classification. An asset is treated as current when it is:
- Expected to be realised or intended to be sold or consumed in the Group normal operating cycle
- Held primarily for the purpose of trading;
- Expected to be realised within twelve months after the reporting period; or
- Cash or cash equivalent unless restricted from being exchanged or used to settle a liability for at least twelve months after the reporting period All other assets are classified as non-current.
A liability is current when: - It is expected to be settled in the Group normal
operating cycle;
- It is held primarily for the purpose of trading;
- It is due to be settled within twelve months after the reporting period; or
- There is no unconditional right to defer the settlement of the liability for at least twelve months after the reporting period The Group classifies all other liabilities as non-current.
Deferred tax assets and liabilities are classified as non-current assets and liabilities.
The operating cycle is the time between the acquisition of assets for processing and their realisation in cash and cash equivalents. The Group has identified twelve months as its operating cycle.
b. Foreign exchange transactions The Group’s consolidated financial statements are
presented in Indian rupees, which is the functional currency of the Parent Company. For each entity the Group determines the functional currency and items included in the financial statements of each entity are measured using that functional currency. The Group uses the direct method of consolidation and on disposal of a foreign operation the gain or loss that is reclassified to profit or loss reflects the amount that arises from using this method.
Initial recognition Foreign currency transactions are recorded by the
Group’s entities at their respective functional currency, by applying to the foreign currency amount the exchange rate between the functional currency and foreign currency at the date of the transaction.
Conversion Foreign currency monetary items are reported at
functional currency spot rate of exchange at reporting date. ‘Non-monetary items that are measured in terms of historical cost in a foreign currency are translated using the exchange rates at the dates of the initial transactions. Non-monetary items measured at fair value in a foreign currency are translated using the exchange rates at the date when the fair value is determined. The gain or loss arising on translation of non-monetary items measured at fair value is treated in line with the recognition of the gain or loss on the change in fair value of the item (i.e., translation differences on items whose fair value gain or loss is recognised in OCI or profit or loss are also recognised in OCI or profit or loss, respectively).
Exchange differences Exchange differences arising on the settlement of
monetary items or on reporting monetary items of Company at rates different from those at which they were initially recorded during the year, or reported in previous financial statements, are recognised as income or as expenses in the year in which they arise.
Group companies On consolidation, the assets and liabilities of foreign
operations are translated into Indian rupees at the rate of exchange prevailing at the reporting date and their statements of profit or loss are translated at exchange rates prevailing at the dates of the transactions. For practical reasons, the Group uses an average rate to translate income and expense items, if the average rate approximates the exchange rates at the dates of the transactions. The exchange differences arising on translation for consolidation are recognised in OCI. On disposal of a foreign operation, the component of OCI relating to that particular foreign operation is recognised in profit or loss.
Any goodwill / capital reserve arising in the acquisition/ business combination of a foreign operation and any fair value adjustments to the carrying amounts of assets and liabilities arising on the acquisition are treated as assets and liabilities of the foreign operation and translated at the spot rate of exchange at the reporting date.
Any goodwill / capital reserve or fair value adjustments arising in business combinations/ acquisitions, which occurred before the date of transition to Ind AS (01 April 2015), are treated as assets and liabilities of the entity rather than as assets and liabilities of the foreign operation. Therefore, those assets and liabilities are non-monetary items already expressed in the functional currency of the parent and no further translation differences occur.
NOTES TO CONSOLIDATED FINANCIAL STATEMENTSfor the year ended 31 March 2018
Annual Report 2017-18 219218
Cumulative currency translation differences for all foreign operations are deemed to be zero at the date of transition, viz., 01 April 2015. Gain or loss on a subsequent disposal of any foreign operation excludes translation differences that arose before the date of transition but includes only translation differences arising after the transition date.
c. Fair value measurement The Group / Consolidated entities measures financial
instruments, such as, derivatives at fair value at each balance sheet date. Fair value is the price that would be received to sell an asset or paid to transfer a liability in an orderly transaction between market participants at the measurement date. The fair value measurement is based on the presumption that the transaction to sell the asset or transfer the liability takes place either:
- In the principal market for the asset or liability, or
- In the absence of a principal market, In the most advantageous market for the asset or liability.
The principal or the most advantageous market must be accessible by the Group / Consolidated entities. The fair value of an asset or a liability is measured using the assumptions that market participants would use when pricing the asset or liability, assuming that market participants act in their economic best interest.
A fair value measurement of a non-financial asset takes into account a market participant’s ability to generate economic benefits by using the asset in its highest and best use or by selling it to another market participant that would use the asset in its highest and best use.
The Group / Consolidated entities uses valuation techniques that are appropriate in the circumstances and for which sufficient data are available to measure fair value, maximising the use of relevant observable inputs and minimising the use of unobservable inputs.
All assets and liabilities for which fair value is measured or disclosed in the financial statements are categorised within the fair value hierarchy, described as follows, based on the lowest level input that is significant to the fair value measurement as a whole:
- Level 1 — quoted (unadjusted) market prices in active markets for identical assets or liabilities.
- Level 2 — inputs other than quoted prices included in Level 1 that are observable for the asset or liability, either directly (i.e. as prices) or indirectly (i.e. derived from prices).
- Level 3 — inputs for the asset or liability that are not based on observable market data (unobservable inputs).
For assets and liabilities that are recognised in the financial statements on a recurring basis, the Group / Consolidated entities determines whether transfers have occurred between levels in the hierarchy by re-assessing categorisation (based on the lowest level input that is significant to the fair value measurement as a whole) at the end of each reporting period.
The Group’s CFO determines the appropriate valuation techniques and inputs for fair value measurements. In estimating the fair value of an asset or a liability, the Group uses market observable data to the extent it is available. Where Level 1 inputs are not available, the Group engages third party qualified valuers to perform the valuation. Any change in the fair value of each asset and liability is also compared with relevant external sources to determine whether the change is reasonable.
For the purpose of fair value disclosures, the Group / Consolidated entities has determined classes of assets and liabilities on the basis of the nature, characteristics and risks of the asset or liability and the level of the fair value hierarchy as explained above.
d. Revenue recognition Revenue is recognised to the extent that it is probable
that the economic benefits will flow to the Group / Consolidated Entities and the revenue can be reliably measured regardless of when the payment is being made. Revenue is measured at the fair value of the consideration received or receivable, taking into account contractually defined terms of payment and excluding taxes or duties collected on behalf of the government. The Group / Consolidated entities has concluded that it is the principal in all of its revenue arrangements since it is the primary obligor in all the revenue arrangements as it has pricing latitude and is also exposed to inventory and credit risks.
The specific recognition criteria described below must also be met before revenue is recognised:
i) Sale of goods: Revenue from sale of goods is recognised on dispatch (in respect of exports on the date of the bill of lading or airway bill) which coincides with transfer of significant risks and rewards to customer and is net of trade discounts, volume discounts, sales returns, chargeback, medicaid payments, rebates, shelf stock adjustments, where applicable and any taxes or duties collected on behalf of the government which are levied on sales such as sales tax, value added tax, goods and services tax, etc., where applicable and recognised based on the terms of
NOTES TO CONSOLIDATED FINANCIAL STATEMENTSfor the year ended 31 March 2018

Annual Report 2017-18 219218
Com
pany O
verviewS
tatutory Rep
ortsFinancial S
tatements
the agreements entered into with the customers. However, it includes excise duty upto 30 June 2017. Any additional amounts based on the terms of agreements entered into with customers, is recognised in the period when the collectability becomes probable and reliable measure of the same is available.
ii) Rendering of services: Revenue from sale of dossiers/licenses/services is recognised in accordance with the terms of the relevant agreements as accepted and agreed with the customers. Revenue from contract research operations is recognised in accordance with the terms of the relevant contracts with customers and when the agreed milestones are achieved, which are substantiated by the performance of related service work.
iii) Interest income: For all debt instruments measured either at amortised cost or at fair value through other comprehensive income, interest income is recorded using the effective interest rate (EIR). EIR is the rate that exactly discounts the estimated future cash payments or receipts over the expected life of the financial instrument or a shorter period, where appropriate, to the gross carrying amount of the financial asset or to the amortised cost of a financial liability. When calculating the EIR, the Group estimates the expected cash flows by considering all the contractual terms of the financial instrument (for example, prepayment, extension, call and similar options) but does not consider the expected credit losses. Interest income is included in finance income in the consolidated statement of profit and loss.
iv) Dividend income: Revenue is recognised when the Group’s right to receive the payment is established, which is generally when shareholders approve the dividend.
v) Export benefits, incentives and licenses: Export incentives are recognised as income when the right to receive credit as per the terms of the scheme is established in respect of the exports made and where there is no significant uncertainty regarding the ultimate collection of the relevant export proceeds.
e. Property, plant and equipment Freehold land and buildings (property) held for use
in the production or supply of goods or services, or administrative purposes are stated at cost less accumulated depreciation and accumulated impairment. Freehold land is not depreciated.
The cost of an item of property, plant and equipment comprises its purchase price, including import duties and non-refundable purchase taxes, after deducting trade discounts and rebates and any costs directly attributable to bringing the asset to the location and condition necessary for it to be capable of operating in the manner intended by management.
Subsequent expenditure is capitalised only if it is probable that the future economic benefits associated with the expenditure will flow to the Group.
Capital work in progress, plant and equipment is stated at cost, net of accumulated depreciation and accumulated impairment losses, if any. Such cost includes the cost of replacing part of the plant and equipment and borrowing costs for long-term construction projects if the recognition criteria are met. When significant parts of plant and equipment are required to be replaced at intervals, the Group depreciates them separately based on their specific useful lives. Likewise, when a major inspection is performed, its cost is recognised in the carrying amount of the plant and equipment as a replacement if the recognition criteria are satisfied. All other repair and maintenance costs are recognised in profit or loss as incurred. The present value of the expected cost for the decommissioning of an asset after its use is included in the cost of the respective asset if the recognition criteria for a provision are met.
Depreciation is provided on the straight-line method, based on the useful life of the assets as estimated by the Management.
The Group / Consolidated entities, based on technical assessment and management estimate, depreciates certain items of property, plant and equipment over estimated useful lives which are different from the useful life prescribed in Schedule II to the Companies Act, 2013. The management believes that these estimated useful lives are realistic and reflect fair approximation of the period over which the assets are likely to be used. The Group has estimated the following useful lives to provide depreciation on its fixed assets.
NOTES TO CONSOLIDATED FINANCIAL STATEMENTSfor the year ended 31 March 2018

Annual Report 2017-18 221220
Nature of the assetsUseful life as
estimated by the management (in
years)
Useful life as stated in the
Companies Act, 2013 (in years)
Leasehold land 10 -Leasehold buildings 20 10 - 60Freehold land development expenditure
25 -
Freehold buildings 5 - 60 10 - 60Plant and equipment 3 - 20 3 - 40Furniture & fixtures 5 - 10 10Vehicles 4 - 8 8Office equipment 3 - 10 5
Assets acquired under finance leases are depreciated over the shorter of the lease term and their useful lives unless it is reasonably certain that the Group will obtain ownership by the end of the lease term.
An item of property, plant and equipment and any significant part initially recognised is derecognised upon disposal or when no future economic benefits are expected from its use or disposal. Any gain or loss arising on derecognition of the asset (calculated as the difference between the net disposal proceeds and the carrying amount of the asset) is included in the income statement when the asset is derecognised.
The residual values, useful lives and methods of depreciation of property, plant and equipment are reviewed at each financial period/year end and adjusted prospectively, if appropriate.
f. Intangibles Intangible assets consists of goodwill, licenses, patents,
brands and product development costs.
Intangible assets acquired separately are measured on initial recognition at cost. The cost of intangible assets acquired in a business combination is their fair value at the date of acquisition. Following initial recognition, intangible assets are carried at cost less any accumulated amortisation and accumulated impairment losses. Internally generated intangibles, excluding capitalised development costs, are not capitalised and the related expenditure is reflected in profit or loss in the period in which the expenditure is incurred.
Intangible assets with finite lives are amortised over the useful economic life and assessed for impairment whenever there is an indication that the intangible asset may be impaired. The amortisation period and the amortisation method for an intangible asset with a finite useful life are reviewed at least at the end of each reporting period. Changes in the expected useful life or
the expected pattern of consumption of future economic benefits embodied in the asset are considered to modify the amortisation period or method, as appropriate, and are treated as changes in accounting estimates. The amortisation expense on intangible assets with finite lives is recognised in the consolidated statement of profit and loss unless such expenditure forms part of carrying value of another asset.
Goodwill represents the excess of purchase consideration over the net book value of assets acquired of the subsidiary companies as on the date of investment. Goodwill on consolidation and acquisition is not amortised but is tested for impairment on a periodic basis and impairment losses are recognised where applicable.
The management has estimated following useful life to amortise intangible assets.
Nature of the assetsUseful life as
estimated by the management
(in years)Product development cost 10Licenses & patents 5 - 10Brands 10
Gains or losses arising from derecognition of an intangible asset are measured as the difference between the net disposal proceeds and the carrying amount of the asset and are recognised in the consolidated statement of profit or loss when the asset is derecognised.
Research and development costs: Research costs are expensed as incurred. Development
expenditures on an individual project are recognised as an intangible asset when the Group can demonstrate:
- The technical feasibility of completing the intangible asset so that the asset will be available for use or sale
- Its intention to complete and use or sell the asset
- Its ability to use or sell the asset
- How the asset will generate future economic benefits
- The availability of resources to complete the asset
- The ability to measure reliably the expenditure during development
The expenditure to be capitalised include the cost of materials and other costs directly attributable to preparing the assets for its intended use. Other development expenditure are recognised as an expense in the consolidated statement of profit and loss.
NOTES TO CONSOLIDATED FINANCIAL STATEMENTSfor the year ended 31 March 2018

Annual Report 2017-18 221220
Com
pany O
verviewS
tatutory Rep
ortsFinancial S
tatements
Payments to third parties that generally take the form of upfront/milestone payments are capitalised as per the guidance in Ind AS 38.
Acquired research and development intangible assets that are under development are recognised as Intangible assets under development. These assets are not amortised, but evaluated for potential impairment on an annual basis or when there are indications that the carrying value may not be recoverable. Any impairment is recognised as an expense in the consolidated statement of profit and loss.
Subsequent expenditure on in process research and development project acquired separately and recognised as an intangible asset is:
- recognised as an expense, if it is research expenditure
- recognised as an expense, if its development expenditure that does not satisfy the criteria for recognition as an Intangible asset; and
- added to the carrying amount of acquired in process research and development project, if it is development expenditure that satisfies the recognition criteria.
Following initial recognition of the development expenditure as an asset, the asset is carried at cost less any accumulated amortisation and accumulated impairment losses. Amortisation of the asset begins when development is complete and the asset is available for use. It is amortised over the estimated useful lives of the assets or any other basis that reflect the period of expected future benefit. Amortisation expense is recognised in the consolidated statement of profit and loss unless such expenditure forms part of carrying value of another asset. The amortisation period and method are reviewed at each reporting date.
Intangible assets relating to products in development and other intangible assets not available for use is tested for impairment annually. The same are derecognised either on disposal or when no future economic benefits are expected. Losses on derecognition are recorded in the consolidated statement of profit and loss, and are measured as difference between the net disposal proceeds and the carrying amount of respective assets.
g. Government grants and subsidies Government grants are recognised when there is
reasonable assurance that the grant will be received and all attached conditions will be complied with. When the grant relates to an expense item, it is deducted from the related expense. When the grant relates to an asset, it is recognised as deferred income and amortised over the useful life of such assets.
h. Inventories Inventories are valued at lower of cost, calculated on
“Weighted average” basis and net realisable value. Cost incurred in bringing each product to its present location and condition are accounted as follows:
Raw materials: cost includes cost of purchase and other costs incurred in bringing the inventories to their present location and condition.
Finished goods and work-in-progress: cost includes direct materials, labour and a proportion of manufacturing overheads based on the normal operating capacity, but excludes borrowing costs.
Trading goods: cost includes cost of purchase and other costs incurred in bringing the inventories to their present location and condition.
Net realisable value is the estimated selling price in the ordinary course of business, less estimated costs of completion and the estimated costs necessary to make the sale. The net realisable value of work-in-progress is determined with reference to the selling prices of related finished products.
Raw materials, components and other supplies held for use in the production of finished products are not written down below cost except in cases where material prices have declined and it is estimated that the cost of the finished products will exceed their net realisable value.
The comparison of cost and net realisable value is made on an item-by-item basis.
i. Retirement and other employee benefits Provident fund
Retirement benefit in the form of provident fund is a defined contribution scheme. The Group / Consolidated entities has no obligation, other than the contribution payable to the provident fund. The Group / Consolidated entities recognizes contribution payable to the provident fund scheme as an expense, when an employee renders the related service. If the contribution payable to the scheme for service received before the balance sheet date exceeds the contribution already paid, the deficit payable to the scheme is recognized as a liability after deducting the contribution already paid. If the contribution already paid exceeds the contribution due for services received before the balance sheet date, then excess is recognized as an asset to the extent that the pre-payment will lead to, for example, a reduction in future payment or a cash refund.
The Group’s / Consolidated Entities contribution towards defined contribution benefit plan is accrued in compliance with the requirements of the domestic
NOTES TO CONSOLIDATED FINANCIAL STATEMENTSfor the year ended 31 March 2018
Annual Report 2017-18 223222
laws of the countries in which the consolidated entities operate in the year of which the contributions are due.
Gratuity The Group operates a defined benefit gratuity plan in
India, which requires contributions to be made to a separately administered fund. The cost of providing benefits under the defined benefit plan is determined based on actuarial valuation.
Remeasurements, comprising of actuarial gains and losses, the effect of the asset ceiling, excluding amounts included in net interest on the net defined benefit liability and the return on plan assets (excluding amounts included in net interest on the net defined benefit liability), are recognised immediately in the Consolidated balance sheet with a corresponding debit or credit to retained earnings through OCI in the period in which they occur. Remeasurements are not reclassified to consolidated profit or loss in subsequent periods.
Short term compensated absences are provided for based on estimates. The Group / Consolidated entities treats accumulated leave, as a long-term employee benefit for measurement purposes. Such accumulated leaves are provided for based on an actuarial valuation using the projected unit credit method at the period-end/ year-end. The Group / Consolidated entities presents the entire liability in respect of leave as a current liability in the consolidated balance sheet, since it does not have an unconditional right to defer its settlement beyond twelve months after the reporting date.
Past service costs are recognised in consolidated profit or loss on the earlier of:
- The date of the plan amendment or curtailment, and
- The date that the Group recognises related restructuring costs
Net interest is calculated by applying the discount rate to the net defined liability or asset. The Group recognises the following changes in the net defined benefit obligation as an expense in the Consolidated Statement of profit and loss:
- Service costs comprising current service costs, past-service costs, gains and losses on curtailments and non-routine settlements; and
- Net interest expense or income
Compensated absences Short term compensated absences are provided for
based on estimates. The Group treats accumulated leave, as a long-term employee benefit for measurement purposes. Such accumulated leaves are provided for
based on an actuarial valuation using the projected unit credit method at the period-end/ year-end. The Group presents the entire liability in respect of leave as a current liability in the balance sheet, since it does not have an unconditional right to defer its settlement beyond twelve months after the reporting date.
j. Share-based payments Employees of the Group receive remuneration in the
form of share-based payments, whereby employees render services as consideration for equity instruments (equity settlement transactions).
The cost of equity-settled transactions is determined by the fair value at the date when the grant is made using an appropriate valuation model. That cost is recognised, together with a corresponding increase in employee stock options reserves in equity, over the period in which the performance and/or service conditions are fulfilled in employee benefits expense. The cumulative expense recognised for equity-settled transactions at each reporting date until the vesting date reflects the extent to which the vesting period has expired and the Group’s best estimate of the number of equity instruments that will ultimately vest. The consolidated statement of profit and loss expense or credit for a period represents the movement in cumulative expense recognised as at the beginning and end of that period and is recognised in employee benefits expense. Service and non-market based performance conditions are not taken into account when determining the grant date fair value of awards, but the likelihood of the conditions being met is assessed as part of the Parent Company’s best estimate of the number of equity instruments that will ultimately vest. No expense is recognised for awards that do not ultimately vest because of non-market performance and/or service conditions have not been met.
The dilutive effect of outstanding options is reflected as additional share dilution in the computation of diluted earnings per share.
k. Taxes Income tax expense comprises of current and
deferred tax. Current income tax assets and liabilities is measured at the amount expected to be recovered from or paid to the tax authorities. The tax rates and tax laws used to compute the amount are those that are enacted or substantively enacted, at the reporting date in the countries where the Group / Consolidated entities operates and generates taxable income. Current income tax relating to items recognised outside profit or loss is recognised outside profit or loss (either in other comprehensive income or in equity). Current tax items are recognised in correlation to the underlying transaction either in OCI or directly in equity.
NOTES TO CONSOLIDATED FINANCIAL STATEMENTSfor the year ended 31 March 2018

Annual Report 2017-18 223222
Com
pany O
verviewS
tatutory Rep
ortsFinancial S
tatements
Management periodically evaluates positions taken in the tax returns with respect to situations in which applicable tax regulations are subject to interpretation and establishes provision where appropriate. The tax rate and tax laws used to compute the amount are those that are enacted or substantially enacted, at the reporting date.
Deferred tax is provided using the balance sheet method on temporary differences between the tax bases of assets and liabilities and their carrying amounts for financial reporting purposes at the reporting date. Deferred tax liabilities are recognised for all taxable temporary differences, except :-
(i) When the deferred tax liability arises from the initial recognition of goodwill or an asset or liability in a transaction that is not a business combination and, at the time of the transaction, affects neither the accounting profit nor taxable profit or loss
(ii) In respect of taxable temporary differences associated with investments in subsidiaries, associates and interests in joint ventures, when the timing of the reversal of the temporary differences can be controlled and it is probable that the temporary differences will not reverse in the foreseeable future
Deferred tax assets are recognised for all deductible temporary differences, the carry forward of unused tax credits and any unused tax losses. Deferred tax assets are recognised to the extent that it is probable that taxable profit will be available against which the deductible temporary differences, and the carry forward of unused tax credits and unused tax losses can be utilized, except:-
(i) When the deferred tax asset relating to the deductible temporary difference arises from the initial recognition of an asset or liability in a transaction that is not a business combination and, at the time of the transaction, affects neither the accounting profit nor taxable profit or loss.
(ii) In respect of deductible temporary differences associated with investments in subsidiaries, associates and interests in joint ventures, deferred tax assets are recognised only to the extent that it is probable that the temporary differences will reverse in the foreseeable future and taxable profit will be available against which the temporary differences can be utilised.
The carrying amount of deferred tax assets is reviewed at each reporting date and reduced to the extent that
it is no longer probable that sufficient taxable profit will be available to allow all or part of the deferred tax asset to be utilised. Unrecognised deferred tax assets are re-assessed at each reporting date and are recognised to the extent that it has become probable that future taxable profits will allow the deferred tax asset to be recovered.
Deferred tax assets and liabilities are measured at the tax rates that are expected to apply in the period/year when the asset is realised or the liability is settled, based on tax rates and tax laws that have been enacted or substantively enacted at the reporting date. Deferred tax relating to items recognised outside profit or loss is recognised outside Consolidated profit or loss (either in other comprehensive income or in equity). Deferred tax items are recognised in correlation to the underlying transaction either in OCI or directly in equity.
Deferred tax assets and deferred tax liabilities are offset if a legally enforceable right exists to set off current tax assets against current tax liabilities and the deferred taxes relate to the same taxation authority.
Taxes paid on acquisition of assets or on incurring expenses which are not subsequently recoverable : Expenses and assets are recognised net of the amount of sales/ value added taxes paid, except:
(i) When the tax incurred on a purchase of assets or services is not recoverable from the taxation authority, in which case, the tax paid is recognised as part of the cost of acquisition of the asset or as part of the expense item, as applicable
(ii) When receivables and payables are stated with the amount of tax included The net amount of tax recoverable from, or payable to, the taxation authority is included as part of receivables or payables in the consolidated balance sheet.
l. Leases The determination of whether an arrangement is
(or contains) a lease is based on the substance of the arrangement at the inception of the lease. The arrangement is, or contains, a lease if fulfillment of the arrangement is dependent on the use of a specific asset or assets and the arrangement conveys a right to use the asset or assets, even if that right is not explicitly specified in an arrangement.
Where the Group/Consolidated entities are lessee A lease is classified at the inception date as a finance
lease or an operating lease. A lease that transfers substantially all the risks and rewards incidental to ownership to the Group / Consolidated is classified as a finance lease. Finance leases are capitalised at the
NOTES TO CONSOLIDATED FINANCIAL STATEMENTSfor the year ended 31 March 2018
Annual Report 2017-18 225224
commencement of the lease at the inception date fair value of the leased property or, if lower, at the present value of the minimum lease payments. Lease payments are apportioned between finance charges and reduction of the lease liability so as to achieve a constant rate of interest on the remaining balance of the liability. Finance charges are recognised in finance costs in the Consolidated statement of profit and loss, unless they are directly attributable to qualifying assets, in which case they are capitalized in accordance with the Group’s general policy on the borrowing costs. Contingent rentals are recognised as expenses in the periods in which they are incurred. A leased asset is depreciated over the useful life of the asset. However, if there is no reasonable certainty that the Group / Consolidated will obtain ownership by the end of the lease term, the asset is depreciated over the shorter of the estimated useful life of the asset and the lease term. Operating lease payments are recognised as an expense in the consolidated statement of profit and loss on a straight-line basis over the lease term.
Where the Group/Consolidated entities are lessor Leases in which the Group / Consolidated does not
transfer substantially all the risks and rewards of ownership of an asset are classified as operating leases. Rental income from operating lease is recognised on a straight-line basis over the term of the relevant lease. Initial direct costs incurred in negotiating and arranging an operating lease are added to the carrying amount of the leased asset and recognised over the lease term on the same basis as rental income. Contingent rents are recognised as revenue in the period in which they are earned.
Leases are classified as finance leases when substantially all of the risks and rewards of ownership transfer from the Group/Consolidated entities to the lessee. Amounts due from lessees under finance leases are recorded as receivables at the Group’s net investment in the leases. Finance lease income is allocated to accounting periods so as to reflect a constant periodic rate of return on the net investment outstanding in respect of the lease.
m. Earnings Per Share Basic earnings per share is calculated by dividing the
net consolidated profit for the year attributable to equity shareholders by the weighted average number of equity shares outstanding during the year. The weighted average number of shares outstanding during the year is adjusted for events such as bonus issue that have changed the number of shares outstanding, without a corresponding change in resources.
For the purpose of calculating diluted earnings per share, the net consolidated profit for the year attributable to equity shareholders and the weighted
average number of equity shares outstanding during the year are adjusted for the effects of all dilutive potential equity shares.
n. Provision and contingent liabilities Provisions are recognised when the Group/Consolidated
entities has a present obligation (legal or constructive) as a result of a past event, it is probable that an outflow of resources embodying economic benefits will be required to settle the obligation and a reliable estimate can be made of the amount of the obligation. When the Group/Consolidated entities expects some or all of a provision to be reimbursed, for example, under an insurance contract, the reimbursement is recognised as a separate asset, but only when the reimbursement is virtually certain. The expense relating to a provision is presented in the consolidated statement of profit and loss net of any reimbursement.
If the effect of the time value of money is material, provisions are discounted using a current pre-tax rate that reflects, when appropriate, the risks specific to the liability. When discounting is used, the increase in the provision due to the passage of time is recognised as a finance cost.
Onerous contracts A contract is considered to be onerous when the
expected economic benefits to be derived by the Group from the contract are lower than the unavoidable cost of meeting its obligations under the contract. The provision for an onerous contract is measured at the present value of the lower of the expected cost of terminating the contract and the expected net cost of continuing with the contract. Before such a provision is made, the Group recognises any impairment loss on the assets associated with that contract.
Contingencies Provision in respect of loss contingencies relating to
claims, litigations, assessments, fines and penalties are recognised when it is probable that a liability has been incurred and the amount can be estimated reliably.
o. Cash and cash equivalents Cash and cash equivalent in the consolidated balance
sheet comprise cheques, cash at banks and on hand and short-term deposits with an original maturity of three months or less, which are subject to an insignificant risk of changes in value. For the purpose of the statement of cash flows, cash and cash equivalents consist of cash and short-term deposits, as defined above, net of outstanding bank overdrafts as they are considered an integral part of the Groups/consolidated entities cash management.
NOTES TO CONSOLIDATED FINANCIAL STATEMENTSfor the year ended 31 March 2018
Annual Report 2017-18 225224
Com
pany O
verviewS
tatutory Rep
ortsFinancial S
tatements
p. Borrowing cost Borrowing cost directly attributable to the acquisition,
construction or production of an asset that necessarily takes substantial period of time to get ready for its intended use or sale or capitalised as part of cost of the asset. All other borrowing costs are expensed in the period in which they occur. Borrowing costs consist of interest and other costs that an entity incurs in connection with the borrowing of funds. Borrowing cost also includes exchange differences to the extent regarded as an adjustment to the borrowing costs.
q. Impairment of non-financial assets The Group/Consolidated entities assesses, at each
reporting date, whether there is an indication that an asset may be impaired. If any indication exists, or when annual impairment testing for an asset is required, the Group/Consolidated entities estimates the asset’s recoverable amount. An asset’s recoverable amount is the higher of an asset’s or cash-generating unit’s (CGU) fair value less costs of disposal and its value in use. Recoverable amount is determined for an individual asset, unless the asset does not generate cash inflows that are largely independent of those from other assets or Groups of assets. When the carrying amount of an asset or CGU exceeds its recoverable amount, the asset is considered impaired and is written down to its recoverable amount.
In assessing value in use, the estimated future cash flows are discounted to their present value using a pre-tax discount rate that reflects current market assessments of the time value of money and the risks specific to the asset. In determining fair value less costs of disposal, recent market transactions are taken into account. If no such transactions can be identified, an appropriate valuation model is used. These calculations are corroborated by valuation multiples, quoted share prices for publicly traded companies or other available fair value indicators.
The Group/Consolidated entities bases its impairment calculation on detailed budgets and forecast calculations, which are prepared separately for each of the Group/Consolidated entities CGUs to which the individual assets are allocated. The budgets and forecast generally cover a period of five years. Impairment losses of continuing operations, including impairment on inventories, are recognised in the consolidated statement of profit and loss.
An assessment is made at each reporting date to determine whether there is an indication that previously recognised impairment losses no longer exist or have decreased. If such indication exists, the Group/Consolidated entities estimates the asset’s or
CGU’s recoverable amount. A previously recognised impairment loss is reversed only if there has been a change in the assumptions used to determine the asset’s recoverable amount since the last impairment loss was recognised. The reversal is limited so that the carrying amount of the asset does not exceed its recoverable amount, nor exceed the carrying amount that would have been determined, net of depreciation, had no impairment loss been recognised for the asset in prior periods/ years. Such reversal is recognised in the consolidated statement of profit or loss unless the asset is carried at a revalued amount, in which case, the reversal is treated as a revaluation increase.
Goodwill is tested for impairment annually and when circumstances indicate that the carrying value may be impaired. Impairment is determined for goodwill by assessing the recoverable amount of each CGU (or Group of CGUs) to which the goodwill relates. When the recoverable amount of the CGU is less than its carrying amount, an impairment loss is recognised. Impairment losses relating to goodwill cannot be reversed in future periods.
r. Financial instruments A financial instrument is any contract that gives rise to
a financial asset of one entity and a financial liability or equity instrument of another entity.
Financial assets Initial recognition and measurement
All financial assets are recognised initially at fair value plus, in the case of financial assets not recorded at fair value through consolidated profit or loss, transaction costs that are attributable to the acquisition of the financial asset. Purchases or sales of financial assets that require delivery of assets within a time frame established by regulation or convention in the market place (regular way trades) are recognised on the trade date, i.e., the date that the Group/Consolidated entities commits to purchase or sell the asset.
Subsequent measurement For purposes of subsequent measurement, a ‘debt
instrument’ is measured at the amortised cost if both the following conditions are met:
(i) The asset is held within a business model whose objective is to hold assets for collecting contractual cash flows, and
(ii) Contractual terms of the asset give rise on specified dates to cash flows that are solely payments of principal and interest (SPPI) on the principal amount outstanding.
This category is the most relevant to the Group/Consolidated entities. After initial measurement,
NOTES TO CONSOLIDATED FINANCIAL STATEMENTSfor the year ended 31 March 2018

Annual Report 2017-18 227226
such financial assets are subsequently measured at amortised cost using the effective interest rate (EIR) method. Amortised cost is calculated by taking into account any discount or premium on acquisition and fees or costs that are an integral part of the EIR. The EIR amortisation is included in finance income in the profit or loss. The losses arising from impairment are recognised in the consolidated profit or loss. This category generally applies to trade and other receivables.
A ‘debt instrument’ is classified as at the FVTOCI if both of the following criteria are met:
(i) The objective of the business model is achieved both by collecting contractual cashflows and selling the financial assets, and
(ii) The assets contractual cashflows represents SPPI
Debt instruments included within the FVTOCI category are measured initially as well as at each reporting date at fair value. Fair value movements are recognized in the other comprehensive income (OCI). However, the Group recognizes interest income, impairment losses & reversals and foreign exchange gain or loss in the consolidated statement of profit and loss. On derecognition of the asset, cumulative gain or loss previously recognised in OCI is reclassified from the equity to consolidated statement of profit and loss. Interest earned whilst holding FVTOCI debt instrument is reported as interest income using the EIR method.
Any debt instrument, which does not meet the criteria for categorization as at amortized cost or as FVTOCI, is classified as at FVTPL. In addition, the Group may elect to designate a debt instrument, which otherwise meets amortized cost or FVTOCI criteria, as at FVTPL. However, such election is allowed only if doing so reduces or eliminates a measurement or recognition inconsistency (referred to as ‘accounting mismatch’). The Group has not designated any debt instrument as at FVTPL. Debt instruments included within the FVTPL category are measured at fair value with all changes recognized in the consolidated statement of profit and loss.
Equity investments: All equity investments in subsidiaries are measured at
cost less diminution other than temporary. All equity investments in scope of Ind AS 109 are measured at fair value. Equity investments which are held for trading are classified as FVTPL. For all other equity investments, the Group/Consolidated entities may make an irrevocable election to present in OCI subsequent changes in fair value. The Group/Consolidated entities makes such election on an instrument by instrument basis. The classification is made on initial recognition and is irrevocable.
If the Group/Consolidated entities decides to classify an equity instrument as at FVOCI, then all fair value changes on the instrument, excluding dividends, are recognised in OCI. There is no recycling of amounts from OCI to Consolidated Profit and loss, even on sale of investment. However, the Group/Consolidated entities may transfer the cumulative gain/loss within equity. Equity instruments included within the FVTPL category are measured at fair value with all changes recognised in the consolidated profit and loss.
Derecognition A financial asset (or, where applicable, a part of a
financial asset or part of a Group of similar financial assets) is primarily derecognised (i.e. removed from the Group/Consolidated entities Consolidated balance sheet) when:
(i) the rights to receive cash flows from the asset have expired, or
(ii) the Group/Consolidated entities has transferred its rights to receive cash flows from the asset, and the Group/Consolidated entities has transferred substantially all the risks and rewards of the asset, or the Group/Consolidated entities has neither transferred nor retained substantially all the risks and rewards of the asset, but has transferred control of the asset.
When the Group has transferred its rights to receive cash flows from an asset or has entered into a pass-through arrangement, it evaluates if and to what extent it has retained the risks and rewards of ownership. When it has neither transferred nor retained substantially all of the risks and rewards of the asset, nor transferred control of the asset, the Group continues to recognise the transferred asset to the extent of the Group’s continuing involvement. In that case, the Group also recognises an associated liability. The transferred asset and the associated liability are measured on a basis that reflects the rights and obligations that the Group has retained.
Continuing involvement that takes the form of a guarantee over the transferred asset is measured at the lower of the original carrying amount of the asset and the maximum amount of consideration that the Group could be required to repay.
Impairment of financial assets In accordance with Ind AS 109, the Group/Consolidated
entities applies expected credit loss (ECL) model for measurement and recognition of impairment loss on the following financial assets:
(i) Financial assets that are debt instruments, and are measured at amortised cost, e.g. loans, deposits, debt securities, etc.
NOTES TO CONSOLIDATED FINANCIAL STATEMENTSfor the year ended 31 March 2018

Annual Report 2017-18 227226
Com
pany O
verviewS
tatutory Rep
ortsFinancial S
tatements
(ii) Trade receivables that result from transactions that are within the scope of Ind AS 18 - Revenue Recognition.
The Group/Consolidated entities follows ‘simplified approach’ for recognition of impairment loss allowance. The application of simplified approach does not require the Group/Consolidated entities to track changes in credit risk. Rather, it recognises impairment loss allowance based on lifetime ECLs at each reporting date, right from its initial recognition.
For recognition of impairment loss on other financial assets and risk exposure, the Group/Consolidated entities determines that whether there has been a significant increase in the credit risk since initial recognition. If credit risk has not increased significantly, 12-month ECL is used to provide for impairment loss. However, if credit risk has increased significantly, lifetime ECL is used. If, in a subsequent period, credit quality of the instrument improves such that there is no longer a significant increase in credit risk since initial recognition, then the entity reverts to recognising impairment loss allowance based on 12-month ECL. Lifetime ECL are the expected credit losses resulting from all possible default events over the expected life of a financial instrument. The 12-month ECL is a portion of the lifetime ECL which results from default events that are possible within 12 months after the reporting date.
ECL is the difference between all contractual cash flows that are due to the Group/Consolidated entities in accordance with the contract and all the cash flows that the entity expects to receive (i.e., all cash shortfalls), discounted at the original EIR. When estimating the cash flows, an entity is required to consider:
(i) All contractual terms of the financial instrument (including prepayment, extension, call and similar options) over the expected life of the financial instrument. However, in rare cases when the expected life of the financial instrument cannot be estimated reliably, then the entity is required to use the remaining contractual term of the financial instrument
(ii) Cash flows from the sale of collateral held or other credit enhancements that are integral to the contractual terms
As a practical expedient, the Group/Consolidated entities uses a provision matrix to determine impairment loss allowance on portfolio of its trade receivables. The provision matrix is based on its historically observed default rates over the expected life of the trade receivables and is adjusted for forward-looking estimates. At every reporting date, the historical
observed default rates are updated and changes in the forward-looking estimates are analysed.
ECL impairment loss allowance (or reversal) recognized during the period is recognized as income/ expense in the Consolidated statement of profit and loss. This amount is reflected under the head other expenses / other income in the consolidated statement of profit and loss. ECL is presented as an allowance, i.e., as an integral part of the measurement of those assets in the Consolidated balance sheet. The allowance reduces the net carrying amount. Until the asset meets write-off criteria, the Group/Consolidated entities does not reduce impairment allowance from the gross carrying amount.
For assessing increase in credit risk and impairment loss, the Group/Consolidated entities combines financial instruments on the basis of shared credit risk characteristics with the objective of facilitating an analysis that is designed to enable significant increases in credit risk to be identified on a timely basis. The Group/Consolidated entities does not have any purchased or originated credit-impaired (POCI) financial assets, i.e., financial assets which are credit impaired on purchase/ origination.
Financial liabilities Initial recognition and measurement
Financial liabilities are classified, at initial recognition, as financial liabilities at fair value through profit or loss, loans and borrowings, payables, or as derivatives designated as hedging instruments in an effective hedge, as appropriate. All financial liabilities are recognised initially at fair value and, in the case of loans and borrowings and payables, net of directly attributable transaction costs. The Group/Consolidated entities financial liabilities include trade and other payables, loans and borrowings including bank overdrafts, financial guarantee contracts and derivative financial instruments.
Subsequent measurement The measurement of financial liabilities depends on their
classification, as described below:
Financial liabilities at fair value through profit or loss Financial liabilities at fair value through profit or loss
include financial liabilities designated upon initial recognition as at fair value through profit or loss. Financial liabilities designated upon initial recognition at fair value through profit or loss are designated as such at the initial date of recognition, and only if the criteria in Ind AS 109 are satisfied. For liabilities designated as FVTPL, fair value gains/ losses attributable to changes in own credit risk are recognized in OCI.
NOTES TO CONSOLIDATED FINANCIAL STATEMENTSfor the year ended 31 March 2018

Annual Report 2017-18 229228
These gains/ loss are not subsequently transferred to consolidated statement of profit and loss. However, the Group may transfer the cumulative gain or loss within equity. All other changes in fair value of such liability are recognised in the Consolidated statement of profit or loss. The Group/Consolidated entities has not designated any financial liability as at fair value through profit and loss.
Loans and borrowings This is the category most relevant to the Group/
Consolidated entities. After initial recognition, interest-bearing loans and borrowings are subsequently measured at amortised cost using the EIR method. Gains and losses are recognised in consolidated profit or loss when the liabilities are derecognised as well as through the EIR amortisation process.
Amortised cost is calculated by taking into account any discount or premium on acquisition and fees or costs that are an integral part of the EIR. The EIR amortisation is included as finance costs in the consolidated statement of profit and loss.
Derecognition A financial liability is derecognised when the obligation
under the liability is discharged or cancelled or expires. When an existing financial liability is replaced by another from the same lender on substantially different terms, or the terms of an existing liability are substantially modified, such an exchange or modification is treated as the derecognition of the original liability and the recognition of a new liability. The difference in the respective carrying amounts is recognised in the consolidated statement of profit or loss.
Reclassification of financial assets The Group/Consolidated entities determines
classification of financial assets and liabilities on initial recognition. After initial recognition, no reclassification is made for financial assets which are equity instruments and financial liabilities. For financial assets which are debt instruments, a reclassification is made only if there is a change in the business model for managing those assets. Changes to the business model are expected to be infrequent. The Group’s senior management determines change in the business model as a result of external or internal changes which are significant to the Group’s operations. Such changes are evident to external parties. A change in the business model occurs when the Group either begins or ceases to perform an activity that is significant to its operations. If the Group/Consolidated entities reclassifies financial assets, it applies the reclassification prospectively from the reclassification date which is the first day of the
immediately next reporting period following the change in business model. The Group/Consolidated entities does not restate any previously recognised gains, losses (including impairment gains or losses) or interest.
The following table shows various reclassification and how they are accounted for:
Original classification
Revised classification
Accounting treatment
Amortised cost
FVTPL Fair value is measured at reclassification date. Difference between previous amortized cost and fair value is recognised in consolidated statement of profit and loss.
FVTPL Amortised Cost
Fair value at reclassification date becomes its new gross carrying amount. EIR is calculated based on the new gross carrying amount.
Amortised cost
FVTOCI Fair value is measured at reclassification date. Difference between previous amortised cost and fair value is recognised in OCI. No change in EIR due to reclassification.
FVTOCI Amortised cost
Fair value at reclassification date becomes its new amortised cost carrying amount. However, cumulative gain or loss in OCI is adjusted against fair value. Consequently, the asset is measured as if it had always been measured at amortised cost.
FVTPL FVTOCI Fair value at reclassification date becomes its new carrying amount. No other adjustment is required.
FVTOCI FVTPL Assets continue to be measured at fair value. Cumulative gain or loss previously recognized in OCI is reclassified to consolidated statement of profit and loss at the reclassification date.
Financial assets and financial liabilities are offset and the net amount is reported in the consolidated balance sheet if there is a currently enforceable legal right to offset the recognised amounts and there is an intention to settle on a net basis, to realise the assets and settle the liabilities simultaneously.
NOTES TO CONSOLIDATED FINANCIAL STATEMENTSfor the year ended 31 March 2018

Annual Report 2017-18 229228
Com
pany O
verviewS
tatutory Rep
ortsFinancial S
tatements
s. Derivative financial instruments The Group / Consolidated entities uses derivative financial
instruments, such as forward currency contracts to hedge its foreign currency risks. Such derivative financial instruments are initially recognised at fair value on the date on which a derivative contract is entered into and are subsequently re-measured at fair value. Derivatives are carried as financial assets when the fair value is positive and as financial liabilities when the fair value is negative. The forward contracts that meet the definition of a derivative under Ind AS 109 are recognised in the Consolidated statement of profit and loss. Any gains or losses arising from changes in the fair value of derivatives are taken directly to Consolidated profit or loss.
t. Cash dividend and non cash distribution to equity holders
The Group recognises a liability to make cash and non cash distribution to equity holders when the distribution is authorised and the distribution is no longer at the discretion of the Group. As per the Corporate laws in India, a final dividend distribution is authorised when it is approved by the shareholders whereas for interim dividend when authorised by board. A corresponding amount is recognised directly in equity. Non cash distribution are measured at fair value of the assets distributed with fair value re-measurement recognised directly in equity.
u. Non-current assets held for sale The Group classifies non-current assets and disposal
Groups as held for sale/ distribution to owners if their carrying amounts will be recovered principally through a sale/ distribution rather than through continuing use. Actions required to complete the sale/ distribution should indicate that it is unlikely that significant changes to the sale/ distribution will be made or that the decision to sell/ distribute will be withdrawn. Management must be committed to the sale/ distribution expected within one year from the date of classification. For these purposes, sale transactions include exchanges of non-current assets for other non-current assets when the exchange has commercial substance. The criteria for held for sale/ distribution classification is regarded met only when the assets or disposal Group is available for immediate sale/ distribution in its present condition, subject only to terms that are usual and customary for sales/ distribution of such assets (or disposal Groups), its sale/ distribution is highly probable; and it will genuinely be sold, not abandoned. The Group treats sale/ distribution of the asset or disposal Group to be highly probable when:
- The appropriate level of management is committed to a plan to sell the asset (or disposal Group),
- An active programme to locate a buyer and complete the plan has been initiated (if applicable),
- The asset (or disposal Group) is being actively marketed for sale at a price that is reasonable in relation to its current fair value,
- The sale is expected to qualify for recognition as a completed sale within one year from the date of classification , and
- Actions required to complete the plan indicate that it is unlikely that significant changes to the plan will be made or that the plan will be withdrawn.
Non-current assets held for sale are measured at the lower of their carrying amount and the fair value less cost to sell. Assets held for sale are presented separately in the balance sheet. Property Plant and Equipment and Intangible Assets once classified as held for sale are not depreciated or amortised.
v. Recent accounting pronouncements Standards issued but not yet effective & not early
adopted by the Group: Ind AS 115, Revenue from Contracts with
Customers In March 2018, the Ministry of Corporate Affairs
issued the Companies (Indian Accounting Standards) Amendment Rules, 2018, notifying Ind AS 115 ‘Revenue from Contracts with Customers’ (New Revenue Standard), which replaces Ind AS 11 ‘Construction Contracts’ and Ind AS 18 ‘Revenue’. This establishes a comprehensive framework for determining whether, how much and when revenue should be recognised. It replaces existing revenue recognition guidance, including Ind AS 18 Revenue, Ind AS 11 Construction Contracts and Guidance Note on Accounting for Real Estate Transactions. Ind AS 115 is effective for annual periods beginning on or after 01 April 2018 and will be applied accordingly.
The core principle of Ind AS 115 is that an entity should recognise revenue to depict the transfer of promised goods or services to customers in an amount that reflects the consideration to which the entity expects to be entitled in exchange for those goods or services. Specifically, the standard introduces a 5-step approach to revenue recognition.
Step 1: Identify the contract(s) with a customer
Step 2: Identify the performance obligation in contract
Step 3: Determine the transaction price
Step 4: Allocate the transaction price to the performance obligations in the contract
Step 5: Recognise revenue when (or as) the entity satisfies a performance obligation
NOTES TO CONSOLIDATED FINANCIAL STATEMENTSfor the year ended 31 March 2018
Annual Report 2017-18 231230
For the sale of goods, revenue is currently recognised when related risks and rewards of ownership are transferred. Revenue is recognised at this point provided that the revenue and costs can be measured reliably, the recovery of the consideration is probable and there is no continuing management involvement with the goods.
Under Ind AS 115, revenue will be recognised when a customer obtains control of the goods.
For certain contracts that permit the customer to return an item, revenue is currently recognised when a reasonable estimate of the returns can be made, provided that all other criteria for revenue recognition are met. If a reasonable estimate cannot be made, then revenue recognition is deferred until the return period lapses or a reasonable estimate of returns can be made. Some of the key changes introduced by Ind AS 115 include additional guidance for measurement approaches for variable consideration.
Under Ind AS 115, revenue will be recognised for these contracts to the extent that it is probable that a significant reversal in the amount of cumulative revenue recognised will not occur. As a consequence, for those contracts for which the Group is unable to make a reasonable estimate of return, revenue is expected to be recognised sooner than when the return period lapses or a reasonable estimate can be made. A refund liability and an asset for recovery will be recognised for these contracts and presented separately in the consolidated balance sheet.
Significant additional disclosures in relation to revenue are also prescribed. The New Revenue Standard also provides two broad alternative transition options – Retrospective Method and Cumulative Effect Method – with certain practical expedients available under the Retrospective Method. The Group is in the process of evaluating the impact of the New Revenue Standard on the present and future arrangements and shall determine the appropriate transition option once the said evaluation has been completed.
Ind AS 21, The effect of changes in foreign exchange rates
The amendment clarifies on the accounting of transactions that include the receipt or payment of advance consideration in a foreign currency. The appendix explains that the date of the transaction, for the purpose of determining the exchange rate, is the date of initial recognition of the non-monetary prepayment asset or deferred income liability. If there are multiple payments or receipts in advance, a date of transaction is established for each payment or receipt. The Group is evaluating the impact of this amendment on its financial statements.
NOTES TO CONSOLIDATED FINANCIAL STATEMENTSfor the year ended 31 March 2018

Annual Report 2017-18 231230
Com
pany O
verviewS
tatutory Rep
ortsFinancial S
tatements
(All
amou
nts
are
in In
dian
Rup
ees
in m
illion
s, e
xcep
t for
sha
re d
ata
and
whe
re o
ther
wis
e st
ated
)
3.
PR
OP
ER
TY,
PLA
NT
AN
D E
QU
IPM
EN
T
Leas
ehol
d
land
Fr
eeho
ld
land
Le
aseh
old
b
uild
ings
Free
hold
b
uild
ings
Pla
nt a
nd
equi
pm
ent
Furn
iture
and
fix
ture
sVe
hicl
esO
ffice
eq
uip
men
tTo
tal
Gro
ss c
arry
ing
val
ue (a
t co
st)
As
at 0
1 A
pril
2016
158
.3
3,0
93.9
3
21.4
8
,833
.1
23,
763.
0 7
01.9
1
14.2
2
73.5
3
7,25
9.3
Add
ition
s -
1
,306
.8
14.
7 2
,126
.1
7,0
70.1
2
86.9
1
25.3
7
3.0
11,
002.
9 D
ispo
sals
/ a
djus
tmen
ts -
-
-
0
.2
76.
5 1
.2
10.
8 1
0.9
99.
6 A
dditi
ons
on a
cqui
sitio
n -
-
-
-
-
-
-
-
-
O
ther
adj
ustm
ents
- E
xcha
nge
diffe
renc
es -
(1
9.3)
(15.
4) (4
1.3)
(80.
1) (4
.3)
0.2
(4
.3)
(164
.5)
As
at 3
1 M
arch
201
7 1
58.3
4
,381
.4
320
.7
10,
917.
7 3
0,67
6.5
983
.3
228
.9
331
.3
47,
998.
1 A
dditi
ons
2.0
5
.6
44.
2 4
,006
.8
7,7
04.7
2
94.4
4
1.7
123
.0
12,
222.
4 D
ispo
sals
/ a
djus
tmen
ts -
2
,508
.6
0.4
-
1
03.9
9
.1
10.
2 1
3.7
2,6
45.9
A
dditi
ons
on a
cqui
sitio
n -
2
90.4
-
6
58.8
3
80.5
-
-
2
1.0
1,3
50.7
O
ther
adj
ustm
ents
- E
xcha
nge
diffe
renc
es -
3
3.8
30.
2 8
2.8
120
.5
6.0
-
9
.7
283
.0
As
at 3
1 M
arch
201
8 1
60.3
2
,202
.6
394
.7
15,
666.
1 3
8,77
8.3
1,2
74.6
2
60.4
4
71.3
5
9,20
8.3
Dep
reci
atio
nA
s at
01
Apr
il 20
16 8
.5
0.6
1
0.2
365
.6
2,8
67.5
9
9.9
30.
1 7
3.0
3,4
55.4
C
harg
e fo
r th
e ye
ar 4
.9
1.1
1
3.9
397
.7
3,1
47.8
1
14.1
3
9.9
64.
2 3
,783
.6
Dis
posa
ls /
adj
ustm
ents
-
-
-
-
21.
4 0
.1
5.5
0
.5
27.
5 A
dditi
ons
on a
cqui
sitio
n -
-
-
-
-
-
-
-
-
O
ther
adj
ustm
ents
- E
xcha
nge
diffe
renc
es -
-
(0
.9)
(5.3
) (3
3.7)
(1.9
) -
(2
.1)
(43.
9)A
s at
31
Mar
ch 2
017
13.
4 1
.7
23.
2 7
58.0
5
,960
.2
212
.0
64.
5 1
34.6
7
,167
.6
Cha
rge
for
the
year
4
.9
1.1
1
5.9
562
.3
3,8
07.0
1
43.4
5
7.4
82.
5 4
,674
.5
Dis
posa
ls /
adj
ustm
ents
-
-
0.1
-
3
9.6
6.7
4
.6
13.
7 6
4.7
Add
ition
s on
acq
uisi
tion
-
-
-
-
-
-
-
-
-
Oth
er a
djus
tmen
ts-
Exc
hang
e di
ffere
nces
-
-
2.7
7
.6
47.
8 2
.6
-
4.6
6
5.3
As
at 3
1 M
arch
201
8 1
8.3
2.8
4
1.7
1,3
27.9
9
,775
.4
351
.3
117
.3
208
.0
11,
842.
7 N
et c
arry
ing
val
ueA
s at
31
Mar
ch 2
017
144
.9
4,3
79.7
2
97.5
1
0,15
9.7
24,
716.
3 7
71.3
1
64.4
1
96.7
4
0,83
0.5
As
at 3
1 M
arch
201
8 1
42.0
2
,199
.8
353
.0
14,
338.
2 2
9,00
2.9
923
.3
143
.1
263
.3
47,
365.
6
Cap
ital
wo
rk-i
n-p
rog
ress
` 1
3,99
5.4
(31
Mar
ch 2
017:
`12
,373
.6) (
incl
udin
g ex
pend
iture
dur
ing
cons
truc
tion
perio
d) (r
efer
Not
e 37
)
No
tes:
1.
Th
e tit
le d
eeds
of l
and
and
build
ings
agg
rega
ting
to `
166.
5 (3
1 M
arch
201
7: `
166.
5) a
re p
endi
ng tr
ansf
er to
the
Par
ent C
ompa
ny’s
nam
e.
2.
Dep
reci
atio
n fo
r th
e ye
ar in
clud
e `3
.1 (3
1 M
arch
, 201
7: `
4.6
) tak
en a
s pr
e-op
erat
ive
capi
tal e
xpen
ditu
re o
n ca
pita
l pro
ject
s pe
ndin
g ca
pita
lisat
ion.
3.
D
etai
ls o
f fina
nce
leas
e -
refe
r no
te 3
2(A
).
4.
La
nd o
f one
of t
he s
ubsi
diar
ies
to th
e ex
tent
of 1
00.4
4 ac
res
amou
ntin
g to
` 9
9.0
(31
Mar
ch 2
017
` 99
.0) h
as b
een
atta
ched
by
the
Dire
ctor
ate
of E
nfor
cem
ent d
urin
g th
e fin
anci
al y
ear
2012
-13
in a
lega
l cas
e pe
rtai
ning
to th
e P
aren
t Com
pany
.
NO
TES
TO C
ON
SOLI
DAT
ED F
INA
NCI
AL
STAT
EMEN
TSfo
r the
yea
r end
ed 3
1 M
arch
201
8

232
(All amounts are in Indian Rupees in millions, except for share data and where otherwise stated)
NOTES TO CONSOLIDATED FINANCIAL STATEMENTSfor the year ended 31 March 2018
4. GOODWILL
Goodwill
Gross carrying value (at cost)As at 01 April 2016 4,063.0 Additions - Disposals / Adjustments - Acquisition through business combination - Other adjustments- Exchange differences - As at 31 March 2017 4,063.0 Additions - Disposals / Adjustments - Acquisition through business combination 3,740.9 Other adjustments- Exchange differences 361.6 As at 31 March 2018 8,165.5
5. INTANGIBLE ASSETS
Brands Product development
cost
Licences and
patents
Total
Gross carrying value (at cost)As at 01 April 2016 2,043.6 125.4 2,207.0 4,376.0 Additions - 4.9 292.1 297.0 Disposals / Adjustments - 2.6 131.6 134.2 Acquisition through business combination - - - - Other adjustments- Exchange differences (43.4) (2.8) (198.8) (245.0)As at 31 March 2017 2,000.2 124.9 2,168.7 4,293.8 Additions 2.2 22.3 2,430.0 2,454.5 Disposals / Adjustments - 47.7 390.3 438.0 Acquisition through business combination* 3,149.5 - 1,403.0 4,552.5 Other adjustments- Exchange differences 314.5 3.4 393.3 711.2 As at 31 March 2018 5,466.4 102.9 6,004.7 11,574.0 Accumulated amortizationAs at 01 April 2016 210.7 29.9 205.4 446.0 Charge for the year 212.9 25.4 259.0 497.3 Disposals / Adjustments - 2.7 45.6 48.3 Acquisition through business combination - - - - Other adjustments - - Exchange differences (11.2) (1.8) (32.5) (45.5)As at 31 March 2017 412.4 50.8 386.3 849.5 Charge for the year 212.3 31.0 665.0 908.3 Disposals / Adjustments - - (37.1) (37.1)Acquisition through business combination - - - - Other adjustments- Exchange differences 5.0 2.1 96.3 103.4 As at 31 March 2018 629.7 83.9 1,184.7 1,898.3 Net carrying valueAs at 31 March 2017 1,587.8 74.1 1,782.4 3,444.3 As at 31 March 2018 4,836.7 19.0 4,820.0 9,675.7
Intangible assets under development ` 1,835.0 (31 March 2017: `2,207.2)* Excludes intangibles under development of ` 12.5 acquired through business combination.

Annual Report 2017-18 233
(All amounts are in Indian Rupees in millions, except for share data and where otherwise stated)
Com
pany O
verviewS
tatutory Rep
ortsFinancial S
tatements
NOTES TO CONSOLIDATED FINANCIAL STATEMENTSfor the year ended 31 March 2018
6. INVESTMENTS(A)(i) Investments accounted for using the equity method
Face value
As at 31 March 2018 As at 31 March 2017
Quantity Amount Quantity Amount
Investments in unquoted equity shares (fully paid, carried at cost, unless stated otherwise)In joint venturesNovagen Pharma (Pty) Limited, South Africa - 927,236 320.9 927,236 394.7 Eugia Pharma Specialities Limited, India `10 198,901,611 1,956.7 198,901,611 1,972.4 Tergene Biotech Private Limited, India `10 7,500,000 - 3,390,000 - Raidugam Developers Limited, India (formerly Aurobindo Antibiotics Limited, India)
`10 4,000,000 30.3 - -
A 2,307.9 2,367.1 (ii) Non-current investmentsInvestments in unquoted equity shares (fully paid, carried at cost, unless stated otherwise)In others (At fair value through profit and loss) Jeedimetla Effluent Treatment Limited, India `100 753 0.1 753 0.1 Patancheru Envirotech Limited, India ` 10 103,709 1.0 103,709 1.0 Progressive Effluent Treatment Limited, India ` 100 1,000 0.1 1,000 0.1
B 1.2 1.2 Investments in unquoted preference shares (fully paid, carried at amortised cost, unless stated otherwise)In joint venturesTergene Biotech Private Limited, India ` 100 950,000 95.0 900,000 90.0 (10.5% Cumulative Preference shares redeemable at par within five years from the date of issue)
C 95.0 90.0 Investments in unquoted optionally convertible debentures (fully paid, carried at cost, unless stated otherwise)In joint venturesRaidurgam Developers Limited, India (formerly Aurobindo Antibiotics Limited, India)
` 1000 710,933 710.9 - -
(1.5% to 9.5% over a period of ten years redeemable at par within ten years from date of issue, convertible into 100 equity shares per debenture at any time after one year)
D 710.9 - Unquoted investment in government securities (Carried at fair value through profit and loss)National Savings Certificate (includes held by Income tax authorities ` 0.1 (31 March 2017: `0.1))
0.2 0.2
E 0.2 0.2 A+B+C+D+E 3,115.2 2,458.5
Aggregate value of unquoted investments 3,115.2 2,458.5 (B) Current investmentsInvestments in unquoted equity shares (fully paid, carried at fair value through profit and loss)Citadel Aurobindo Biotech Limited, India ` 100 70,000 - 70,000 - (Aggregate impairment of `7.0 (31 March 2017: `7.0)
Investments in quoted equity shares (fully paid, carried at fair value through profit and loss)Andhra Bank ` 10 4,520 0.2 4,520 0.2
0.2 0.2
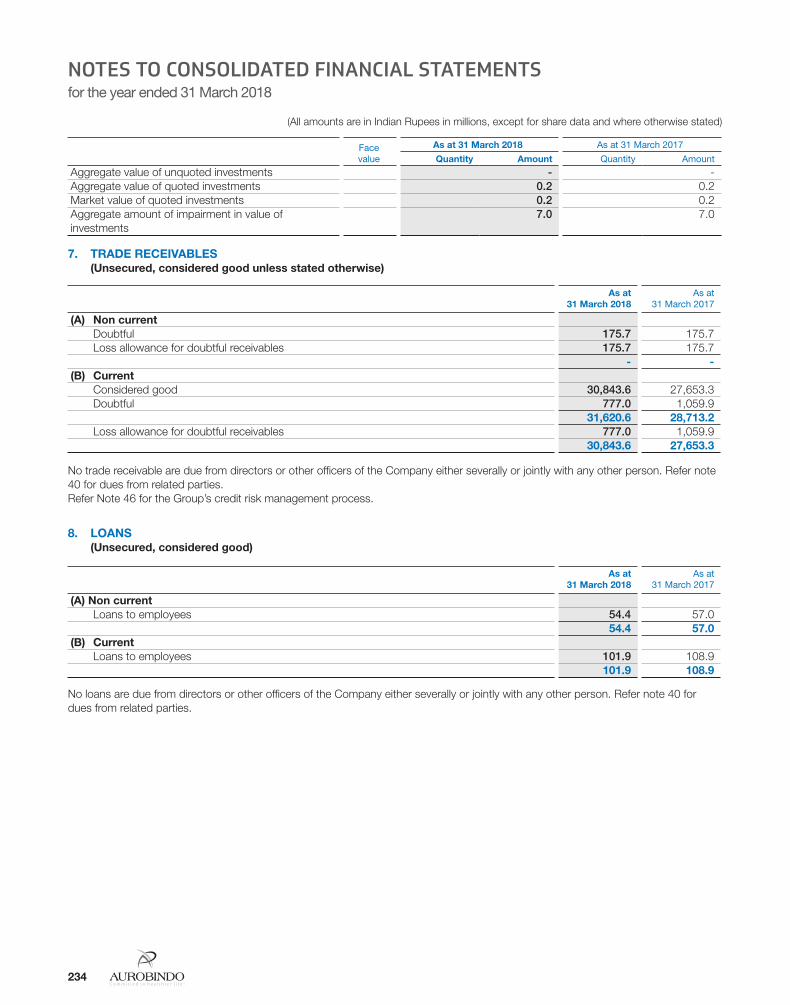
234
(All amounts are in Indian Rupees in millions, except for share data and where otherwise stated)
NOTES TO CONSOLIDATED FINANCIAL STATEMENTSfor the year ended 31 March 2018
Face value
As at 31 March 2018 As at 31 March 2017
Quantity Amount Quantity Amount
Aggregate value of unquoted investments - - Aggregate value of quoted investments 0.2 0.2 Market value of quoted investments 0.2 0.2 Aggregate amount of impairment in value of investments
7.0 7.0
7. TRADE RECEIVABLES (Unsecured, considered good unless stated otherwise)
As at 31 March 2018
As at 31 March 2017
(A) Non current Doubtful 175.7 175.7 Loss allowance for doubtful receivables 175.7 175.7
- - (B) Current Considered good 30,843.6 27,653.3 Doubtful 777.0 1,059.9
31,620.6 28,713.2 Loss allowance for doubtful receivables 777.0 1,059.9
30,843.6 27,653.3
No trade receivable are due from directors or other officers of the Company either severally or jointly with any other person. Refer note 40 for dues from related parties. Refer Note 46 for the Group’s credit risk management process.
8. LOANS (Unsecured, considered good)
As at 31 March 2018
As at 31 March 2017
(A) Non current Loans to employees 54.4 57.0
54.4 57.0 (B) Current Loans to employees 101.9 108.9
101.9 108.9
No loans are due from directors or other officers of the Company either severally or jointly with any other person. Refer note 40 for dues from related parties.
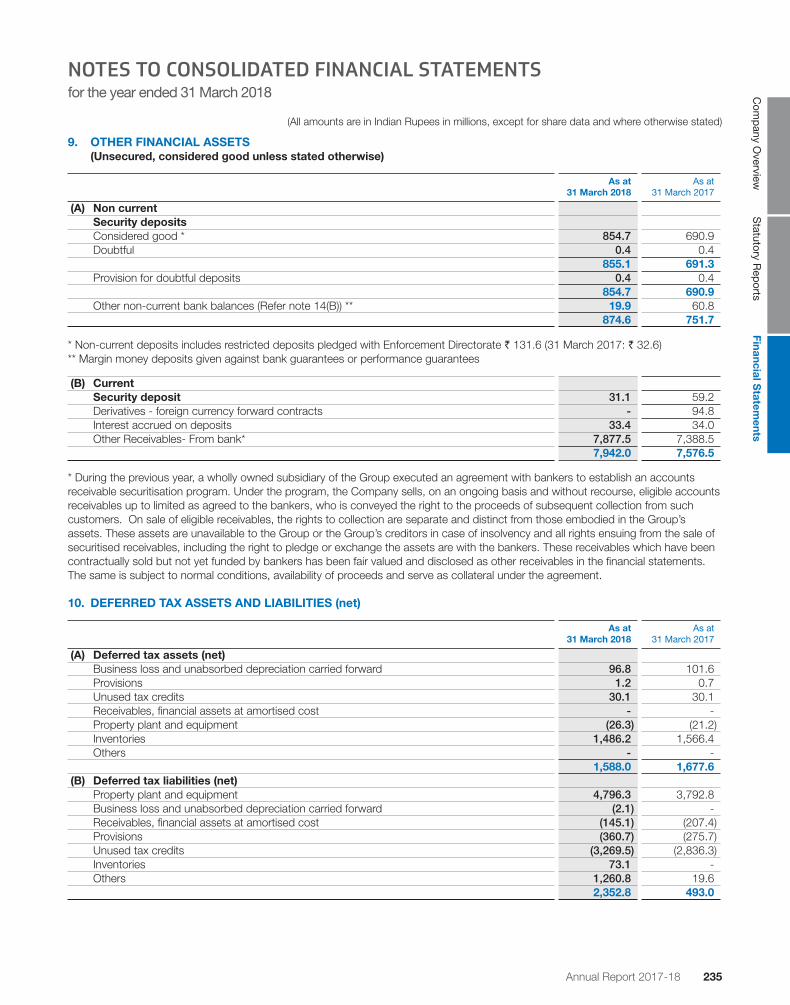
Annual Report 2017-18 235
(All amounts are in Indian Rupees in millions, except for share data and where otherwise stated)
Com
pany O
verviewS
tatutory Rep
ortsFinancial S
tatements
NOTES TO CONSOLIDATED FINANCIAL STATEMENTSfor the year ended 31 March 2018
9. OTHER FINANCIAL ASSETS (Unsecured, considered good unless stated otherwise)
As at 31 March 2018
As at 31 March 2017
(A) Non current Security deposits Considered good * 854.7 690.9 Doubtful 0.4 0.4
855.1 691.3 Provision for doubtful deposits 0.4 0.4
854.7 690.9 Other non-current bank balances (Refer note 14(B)) ** 19.9 60.8
874.6 751.7
* Non-current deposits includes restricted deposits pledged with Enforcement Directorate ` 131.6 (31 March 2017: ` 32.6)** Margin money deposits given against bank guarantees or performance guarantees
(B) Current Security deposit 31.1 59.2 Derivatives - foreign currency forward contracts - 94.8 Interest accrued on deposits 33.4 34.0 Other Receivables- From bank* 7,877.5 7,388.5
7,942.0 7,576.5
* During the previous year, a wholly owned subsidiary of the Group executed an agreement with bankers to establish an accounts receivable securitisation program. Under the program, the Company sells, on an ongoing basis and without recourse, eligible accounts receivables up to limited as agreed to the bankers, who is conveyed the right to the proceeds of subsequent collection from such customers. On sale of eligible receivables, the rights to collection are separate and distinct from those embodied in the Group’s assets. These assets are unavailable to the Group or the Group’s creditors in case of insolvency and all rights ensuing from the sale of securitised receivables, including the right to pledge or exchange the assets are with the bankers. These receivables which have been contractually sold but not yet funded by bankers has been fair valued and disclosed as other receivables in the financial statements. The same is subject to normal conditions, availability of proceeds and serve as collateral under the agreement.
10. DEFERRED TAX ASSETS AND LIABILITIES (net)
As at 31 March 2018
As at 31 March 2017
(A) Deferred tax assets (net) Business loss and unabsorbed depreciation carried forward 96.8 101.6 Provisions 1.2 0.7 Unused tax credits 30.1 30.1 Receivables, financial assets at amortised cost - - Property plant and equipment (26.3) (21.2) Inventories 1,486.2 1,566.4 Others - -
1,588.0 1,677.6 (B) Deferred tax liabilities (net) Property plant and equipment 4,796.3 3,792.8 Business loss and unabsorbed depreciation carried forward (2.1) - Receivables, financial assets at amortised cost (145.1) (207.4) Provisions (360.7) (275.7) Unused tax credits (3,269.5) (2,836.3) Inventories 73.1 - Others 1,260.8 19.6
2,352.8 493.0

236
(All amounts are in Indian Rupees in millions, except for share data and where otherwise stated)
NOTES TO CONSOLIDATED FINANCIAL STATEMENTSfor the year ended 31 March 2018
Movement in deferred tax assets/deferred tax liabilities
As at 1 April 2017
Recognised in statement of
profit and loss
Recognised in OCI
Business Combination
Foreign Currency
Translation
31 March 2018
Deferred tax asset Business loss and unabsorbed depreciation carried forward
101.6 (10.8) - - 6.0 96.8
Provisions 0.7 0.5 0.4 - (0.4) 1.2 Unused tax credits 30.1 - - - - 30.1 Receivables, financial assets at amortised cost
- - - - - -
Property plant and equipment (21.2) (5.1) - - - (26.3)Inventories 1,566.4 (80.2) - - - 1,486.2 Others - - - - - -
1,677.6 (95.6) 0.4 - 5.6 1,588.0 Deferred tax liability Property plant and equipment 3,792.8 997.4 - - 6.1 4,796.3 Business loss and unabsorbed depreciation carried forward
- (2.1) - - - (2.1)
Receivables, financial assets at amortised cost
(207.4) 62.3 - - - (145.1)
Provisions (275.7) (72.3) (12.7) - - (360.7)Unused tax credits (2,836.3) (433.2) - - - (3,269.5)Inventories - 72.2 - - 0.9 73.1 Others 19.6 339.8 - 836.1 65.3 1,260.8
493.0 964.1 (12.7) 836.1 72.3 2,352.8
(i) The Parent Company has unused tax credits (Minimum Alternate Tax (MAT)) credit of `3,269.5 as on 31 March 2018 (31 March 2017: ` 2,836.3). The Parent Company based on its business plan along with supporting convincing evidence including future projections of profit believes that the used tax credits would be utilized within the stipulated time period as per the Income-tax Act, 1961.
(ii) The Group’s tax jurisdictions are in various countries, primarily in India, USA and Europe. Significant judgements are involved in determining the provision for current tax, including amounts expected to be paid / recovered for uncertain tax positions.
(iii) Deferred tax assets are recognised for unused tax losses to the extent that it is probable that taxable profit will be available against which the losses can be utilised. Significant management judgement is required to determine the amount of deferred tax assets that can be recognised, based on the likely timing and the level of future taxable profits together with the future tax planning strategies.
11. TAX ASSETS (net)
As at 31 March 2018
As at 31 March 2017
(A) Non current Advance income-tax (net of provision for taxation) 825.9 579.8
825.9 579.8 (B) Current Advance income-tax (net of provision for taxation) 645.5 175.1
645.5 175.1
Refer note 31 for details of income tax expense.
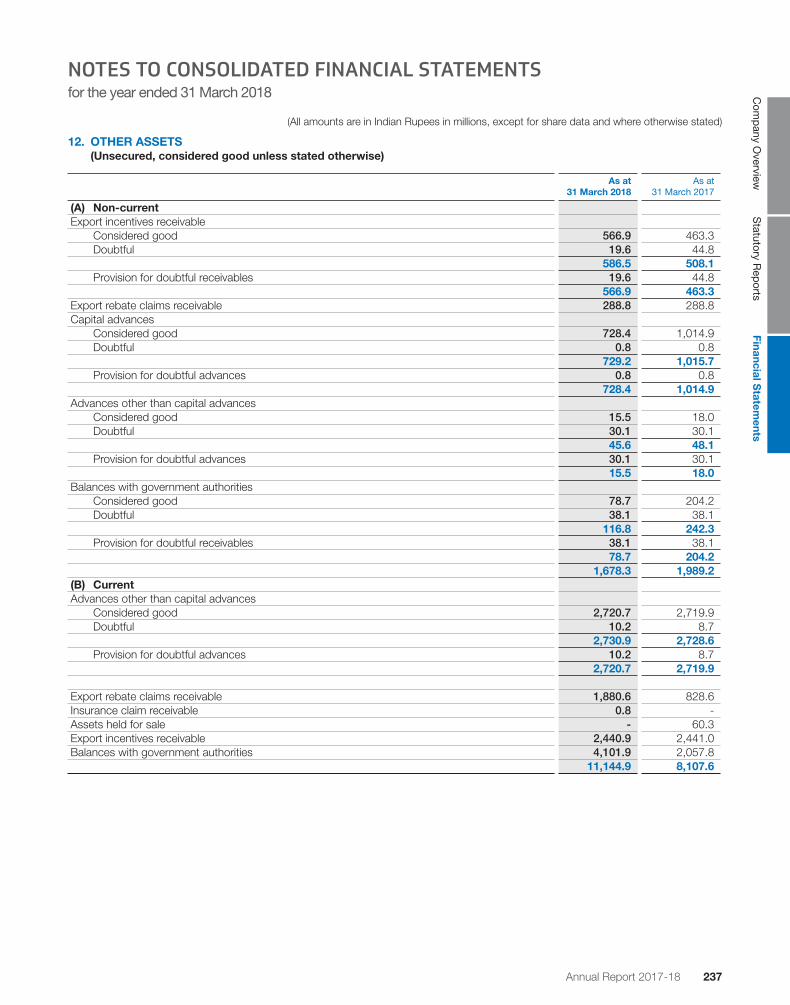
Annual Report 2017-18 237
(All amounts are in Indian Rupees in millions, except for share data and where otherwise stated)
Com
pany O
verviewS
tatutory Rep
ortsFinancial S
tatements
NOTES TO CONSOLIDATED FINANCIAL STATEMENTSfor the year ended 31 March 2018
12. OTHER ASSETS (Unsecured, considered good unless stated otherwise)
As at 31 March 2018
As at 31 March 2017
(A) Non-currentExport incentives receivable Considered good 566.9 463.3 Doubtful 19.6 44.8
586.5 508.1 Provision for doubtful receivables 19.6 44.8
566.9 463.3 Export rebate claims receivable 288.8 288.8 Capital advances Considered good 728.4 1,014.9 Doubtful 0.8 0.8
729.2 1,015.7 Provision for doubtful advances 0.8 0.8
728.4 1,014.9 Advances other than capital advances Considered good 15.5 18.0 Doubtful 30.1 30.1
45.6 48.1 Provision for doubtful advances 30.1 30.1
15.5 18.0 Balances with government authorities Considered good 78.7 204.2 Doubtful 38.1 38.1
116.8 242.3 Provision for doubtful receivables 38.1 38.1
78.7 204.2 1,678.3 1,989.2
(B) CurrentAdvances other than capital advances Considered good 2,720.7 2,719.9 Doubtful 10.2 8.7
2,730.9 2,728.6 Provision for doubtful advances 10.2 8.7
2,720.7 2,719.9
Export rebate claims receivable 1,880.6 828.6 Insurance claim receivable 0.8 - Assets held for sale - 60.3 Export incentives receivable 2,440.9 2,441.0 Balances with government authorities 4,101.9 2,057.8
11,144.9 8,107.6

238
(All amounts are in Indian Rupees in millions, except for share data and where otherwise stated)
NOTES TO CONSOLIDATED FINANCIAL STATEMENTSfor the year ended 31 March 2018
13. INVENTORIES (Valued at lower of cost and net realisable value)
As at 31 March 2018
As at 31 March 2017
Raw materials 22,071.4 15,201.0 Packing materials 2,805.1 1,991.5 Work-in-progress 10,794.7 8,626.7 Finished goods 6,300.2 3,186.8 Stock-in-trade 15,183.7 13,027.5 Stores, spares and consumables 1,429.0 1,271.9
58,584.1 43,305.4 Details of material in transit included in inventories aboveRaw materials 888.3 665.9 Finished goods 1,359.7 80.6
14. CASH AND CASH EQUIVALENTS AND OTHER BANK BALANCES(A) Cash and cash equivalents
As at 31 March 2018
As at 31 March 2017
Balances with banks: in current accounts 11,314.5 4,611.9 in cash credit accounts 313.8 31.4 in unpaid dividend account 19.0 15.9 in deposit accounts - with orginal maturity of less than 3 months 316.5 229.4 Cash on hand 3.3 5.8 Cheques on hand 191.9 -
12,159.0 4,894.4
(B) Other bank balances
As at 31 March 2018
As at 31 March 2017
Balances with banks - deposits with maturity less than 12 months 457.2 240.4 Earmarked balances with banks:Margin money deposits - given against bank guarantees/performance guarantees 19.9 60.8
477.1 301.2 Amount disclosed under non-current financial assets (refer note 9(A)) (19.9) (60.8)
457.2 240.4
(C) For the purpose of statement of cash flows, cash and cash equivalents comprise of following:
As at 31 March 2018
As at 31 March 2017
Cash and cash equivalents as above 12,159.0 4,894.4 Less: Bank overdraft (refer note 17(B)) (40.6) (1,698.1)
12,118.4 3,196.3

Annual Report 2017-18 239
(All amounts are in Indian Rupees in millions, except for share data and where otherwise stated)
Com
pany O
verviewS
tatutory Rep
ortsFinancial S
tatements
NOTES TO CONSOLIDATED FINANCIAL STATEMENTSfor the year ended 31 March 2018
(D) Details of Specified Bank Notes (SBN) held and transacted during the period 8 November 2016 to 30 December 2016
SBN* Other denominations
Total
Closing cash on hand - 8 November 2016 2.7 4.1 6.8 Add: Permitted receipts - 1.2 1.2 Add: Withdrawal from bank - 0.9 0.9 Less: Permitted payments - 2.3 2.3 Less: Amount deposited into bank 2.7 0.6 3.3 Closing cash on hand - 30 December 2016 - 3.3 3.3
* For the purposes of this clause, the term “ Specified Bank Notes” shall have the same meaning provided in the notification of the Government of India, in the Ministry of Finance, Department of Economic Affairs number S.O.3407(E), dated the 8th November 2016.
15. EQUITY SHARE CAPITAL
As at 31 March 2018
As at 31 March 2017
(a) Authorised Share Capital 660,000,000 (31 March 2017: 660,000,000) equity shares of `1 each 660.0 660.0 1,000,000 (31 March 2017: 1,000,000) preference shares of `100 each 100.0 100.0
760.0 760.0
b) Issued, subscribed and fully paid-up equity shares
Equity Shares
Numbers Value
As at 01 April 2016 585,169,586 585.2 Issued during the year under employee stock option plan (ESOP) 712,823 0.7 As at 31 March 2017 585,882,409 585.9 Issued during the year under employee stock option plan (ESOP) 25,200 0.0 As at 31 March 2018 585,907,609 585.9
c) Terms/rights attached to equity shares The Parent Company has only one class of equity shares having a par values of `1 per share. Each holder of equity shares is
entitled to one vote per share.
The Parent Company declares and pays dividends in Indian rupees. The dividend proposed by the Board of Directors is subject to the approval of shareholders in the ensuing Annual General Meeting, except in case of interim dividend. For the year ended 31 March 2018, the amount of dividend per share declared as distribution to equity shareholders was ` 2.50 (31 March 2017: ` 2.50). Refer note 16(c) for details of dividend declared/recognised in the consolidated financial statements.
In the event of liquidation of the Parent Company, the holders of equity shares will be entitled to receive remaining assets of the Parent Company, after distribution of all preferential amounts. However, no such preferential amounts exist currently. The distribution will be in proportion to the number of equity shares held by the shareholders.
d) Details of shareholders holding more than 5% of total number of equity shares in the Parent Company:
As at 31 March 2017
Numbers % holding
RPR Sons Advisors Private Limited & Mrs.P.Suneela Rani (Joint Holders) 196,376,250 33.52%
As at 31 March 2018
Numbers % holding
RPR Sons Advisors Private Limited & Mrs.P.Suneela Rani (Joint Holders) 196,376,250 33.52%
As per records of the Parent Company, including its register of shareholders/members and other declarations received from shareholders, the above shareholding represents legal ownerships of shares and the beneficial ownership is with RPR Enterprises, a partnership firm.

240
(All amounts are in Indian Rupees in millions, except for share data and where otherwise stated)
NOTES TO CONSOLIDATED FINANCIAL STATEMENTSfor the year ended 31 March 2018
e) Aggregate number of bonus shares issued, shares issued for consideration other than cash during the period of five years immediately preceeding the reporting date:
Number
Equity shares allotted as fully paid bonus shares by capitalisation of securities premium Year ended 31 March 2018 - Year ended 31 March 2017 - Year ended 31 March 2016 291,982,275 Year ended 31 March 2015 - Year ended 31 March 2014 -
f) For details of shares reserved for issue under Employee stock option plan (ESOP) of the Company, refer note 35.
16. OTHER EQUITY
As at 31 March 2018
As at 31 March 2017
Capital reserve 818.9 818.9 Capital redemption reserve 90.0 90.0 Employee stock options outstanding account 0.7 1.0 Securities premium account 4,175.8 4,173.1 General reserve 8,131.6 8,131.6 Retained earnings 102,117.6 80,530.3 Other Comprehensive Income (OCI) 883.7 (611.7)
116,218.3 93,133.2
a) For details of stock options refer note 35.b) The disaggregation of changes in reserves and surplus and OCI are disclosed in statement of changes in equity.c) The details of distribution of dividend made and proposed are as under:
As at 31 March 2018
As at 31 March 2017
Cash dividends on equity shares declared and paid during the yearInterim dividend for the year ended 31 March 2018 ` 3.75 per share (31 March 2017 `1.95 per share)
2,197.1 1,141.1
Dividend distribution tax on interim dividend 447.3 232.3 2,644.4 1,373.4
As at 31 March 2018
As at 31 March 2017
Proposed dividend on equity shares declared at year end*Interim dividend for the year ended 31 March 2018 ` Nil per share (31 March 2017 `1.25 per share)
- 732.4
Dividend distribution tax on interim dividend - 149.1 - 881.5
* Under Ind AS dividend is recognised as a liability in the period in which it is declared by the Parent Company. Accordingly, the above dividend and dividend distribution tax has not been recognised in the consolidated financial statements for the year ended 31 March 2018 and 31 March 2017 respectively.
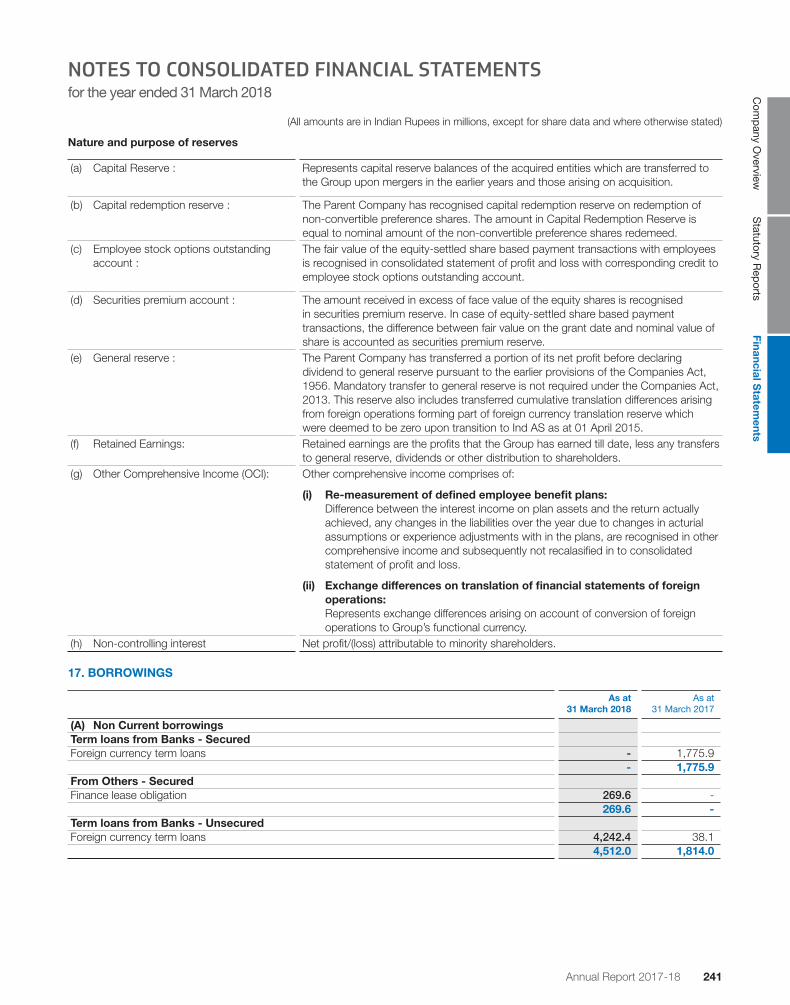
Annual Report 2017-18 241
(All amounts are in Indian Rupees in millions, except for share data and where otherwise stated)
Com
pany O
verviewS
tatutory Rep
ortsFinancial S
tatements
NOTES TO CONSOLIDATED FINANCIAL STATEMENTSfor the year ended 31 March 2018
Nature and purpose of reserves
(a) Capital Reserve : Represents capital reserve balances of the acquired entities which are transferred to the Group upon mergers in the earlier years and those arising on acquisition.
(b) Capital redemption reserve : The Parent Company has recognised capital redemption reserve on redemption of non-convertible preference shares. The amount in Capital Redemption Reserve is equal to nominal amount of the non-convertible preference shares redemeed.
(c) Employee stock options outstanding account :
The fair value of the equity-settled share based payment transactions with employees is recognised in consolidated statement of profit and loss with corresponding credit to employee stock options outstanding account.
(d) Securities premium account : The amount received in excess of face value of the equity shares is recognised in securities premium reserve. In case of equity-settled share based payment transactions, the difference between fair value on the grant date and nominal value of share is accounted as securities premium reserve.
(e) General reserve : The Parent Company has transferred a portion of its net profit before declaring dividend to general reserve pursuant to the earlier provisions of the Companies Act, 1956. Mandatory transfer to general reserve is not required under the Companies Act, 2013. This reserve also includes transferred cumulative translation differences arising from foreign operations forming part of foreign currency translation reserve which were deemed to be zero upon transition to Ind AS as at 01 April 2015.
(f) Retained Earnings: Retained earnings are the profits that the Group has earned till date, less any transfers to general reserve, dividends or other distribution to shareholders.
(g) Other Comprehensive Income (OCI): Other comprehensive income comprises of:
(i) Re-measurement of defined employee benefit plans: Difference between the interest income on plan assets and the return actually
achieved, any changes in the liabilities over the year due to changes in acturial assumptions or experience adjustments with in the plans, are recognised in other comprehensive income and subsequently not recalasified in to consolidated statement of profit and loss.
(ii) Exchange differences on translation of financial statements of foreign operations:
Represents exchange differences arising on account of conversion of foreign operations to Group’s functional currency.
(h) Non-controlling interest Net profit/(loss) attributable to minority shareholders.
17. BORROWINGS
As at 31 March 2018
As at 31 March 2017
(A) Non Current borrowingsTerm loans from Banks - SecuredForeign currency term loans - 1,775.9
- 1,775.9 From Others - SecuredFinance lease obligation 269.6 -
269.6 - Term loans from Banks - UnsecuredForeign currency term loans 4,242.4 38.1
4,512.0 1,814.0

242
(All amounts are in Indian Rupees in millions, except for share data and where otherwise stated)
NOTES TO CONSOLIDATED FINANCIAL STATEMENTSfor the year ended 31 March 2018
As at 31 March 2018
As at 31 March 2017
(B) Current borrowingsTerm loans from BanksCurrent maturities of foreign currency term loans (Secured) 651.8 1,884.6 Current maturities of foreign currency term loans (Unsecured) 2,222.2 915.6 Loans repayable on demand from Banks - working capital loans
- Cash credit facilities (secured) 40.6 1,698.1 - Buyers credit (secured) 78.7 - - Working capital demand loan (Unsecured) - 750.0 - Packing credit loans (secured) 3,151.2 347.1 - Packing credit loans (unsecured) 31,995.3 24,100.3 - Bill discounting facility (secured) 1,432.8 702.3 - Bill discounting facility (Unsecured) 18.8 18.6 - Short term loans from Banks (Unsecured) 3,596.0 1,410.8
43,187.4 31,827.4 Amount disclosed under the head "Other financial liabilities" (refer note 20) (2,874.0) (2,800.2)
40,313.4 29,027.2
(C) Details of secured and unsecured borrowings
As at 31 March 2018
As at 31 March 2017
Secured borrowings 5,624.7 6,408.0 Unsecured borrowings 42,074.7 27,233.4
47,699.4 33,641.4
(D) Terms of borrowings (i) Secured term loans in foreign currency carry interest in the range of LIBOR plus 1.2% to 1.5% (31 March 2017: LIBOR plus
1% to 1.5%). Out of these loans, loans amounting to ` Nil (31 March 2017: ` 1,080.9) are repayable in Nil (31 March 2017: two) equal annual installments and loan amounting to ` 651.8 (31 March 2017: ` 1,945.5) is repayable in equal half yearly installment of one (31 March 2017: three). Loans amounting to ` Nil (31 March 2017: ` 625.3, 1.5 and 7.3) are repayable in Nil (31 March 2017: monthly equal installments over a period of 6 years, 6 years and 3 years respectively) instalments.
(ii) Unsecured foreign currency term loan amounting to ` 6,464.6 (31 March 2017: Nil) carrying interest rate of 0.91% (31 March 2017: Nil) and is payable in equal quarterly installments and the last installment is payable in March 2022. Unsecured foreign currency term loan amounting to Nil (31 March 2017: ` 953.7) carrying interest rate of LIBOR plus 1.05% is repayable in Nil (31 March 2017: equal quarterly installments upto December 2019).
(iii) Unsecured foreign currency term loans amounting to ` Nil (31 March 2017: ` 953.7) carry interest rate of LIBOR plus 1.05%, repayable in equal quarterly installments.
(iv) Term loans are secured by first pari passu charge on all the present and future property, plant and equipment, both movable and immoveable property of the Parent Company. Term loans amounting to ` 625.3 outstanding as of 31 March 2017 were secured by property, fixed assets, inventory and trade receivable of Aurolife Pharma LLC, Aurobindo Pharma USA Inc and Auromedics Pharma LLC. Term loans amounting to ` 8.8 outstanding as of 31 March 2017 were secured by equipments of Aurolife Pharma LLC, Aurobindo Pharma USA Inc and Auromedics Pharma LLC.
(v) All secured loans payable on demand and secured short term loans from banks are secured by first pari passu charge by way of hypothecation of all the stocks, book debts and other current assets (both present and future).
(vi) All secured packing credit foreign currency loans carry interest in the range of LIBOR plus 20 to 50 basis points. All unsecured packing credit foreign currency loans carry interest in the range of 1 month’s LIBOR plus (20) to 50 basis points.
(vii) Finance lease obligation is secured by the warehouse equipment of Aurobindo Pharma USA, Inc. acquired under finance lease. See note 32(A) for details.

Annual Report 2017-18 243
(All amounts are in Indian Rupees in millions, except for share data and where otherwise stated)
Com
pany O
verviewS
tatutory Rep
ortsFinancial S
tatements
NOTES TO CONSOLIDATED FINANCIAL STATEMENTSfor the year ended 31 March 2018
18. PROVISIONS
As at 31 March 2018
As at 31 March 2017
(A) Non-currentFor employee benefits Gratuity and other retirement benefits (refer note 36(b)) 553.4 388.3 Compensated absences 5.2 3.0
558.6 391.3 (B) CurrentFor employee benefits Gratuity and other retirement benefits (refer note 36(b)) 204.6 148.7 Compensated absences 660.1 555.0
Other provisions 1,144.6 1,645.3 2,009.3 2,349.0
19. TRADE PAYABLES
As at 31 March 2018
As at 31 March 2017
Trade payables for supplies and services 26,274.4 21,547.0 26,274.4 21,547.0
(Refer note 46 for the Group’s liquidity risk management process)
20. OTHER FINANCIAL LIABILITIES
As at 31 March 2018
As at 31 March 2017
Current maturities of non-current borrowings (Refer note 17(B)) 2,874.0 2,800.2 Capital creditors 2,170.9 1,854.2 Security deposits 1.5 1.5 Unclaimed dividend 19.0 15.9 Interest accrued but not due on borrowings 11.1 22.0 Derivatives - foreign currency forward contracts 23.3 - Others 0.2 -
5,100.0 4,693.8
21. OTHER LIABILITIES
As at 31 March 2018
As at 31 March 2017
Advances from customers 671.7 390.0 Statutory liabilities 930.6 596.0 Employee payables 1,088.7 501.0 Other payables 9,987.0 6,687.4
12,678.0 8,174.4
22. CURRENT TAX LIABILITIES
As at 31 March 2018
As at 31 March 2017
Provision for income-tax (net of advance tax) 431.1 264.6
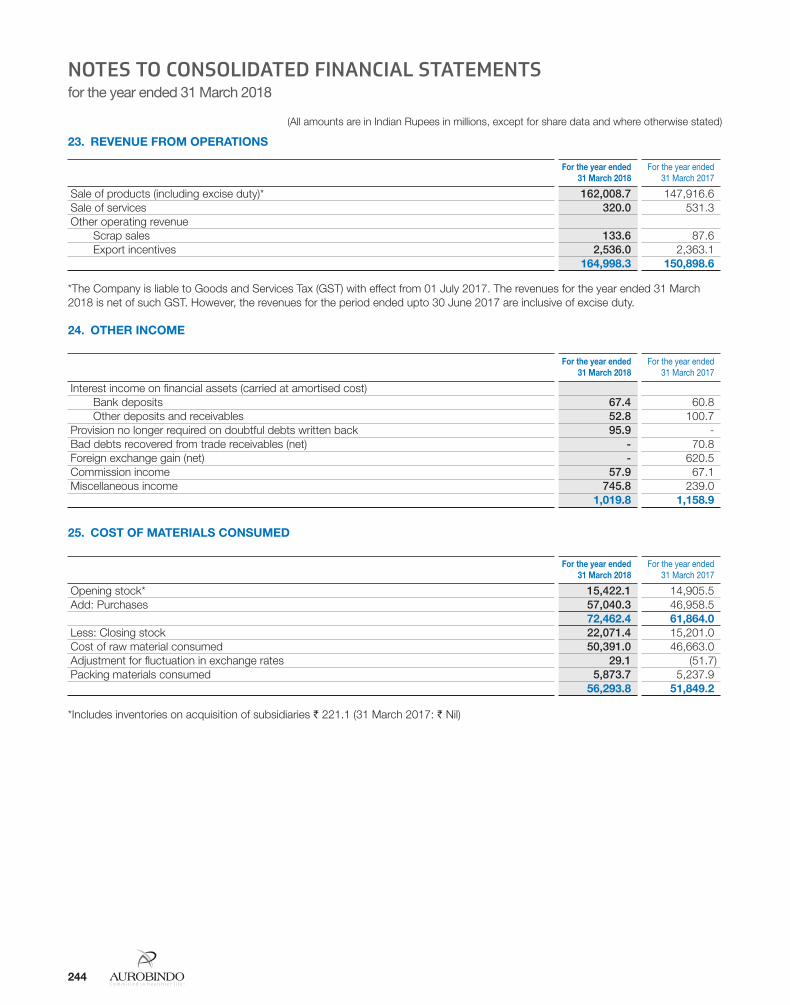
244
(All amounts are in Indian Rupees in millions, except for share data and where otherwise stated)
NOTES TO CONSOLIDATED FINANCIAL STATEMENTSfor the year ended 31 March 2018
23. REVENUE FROM OPERATIONS
For the year ended 31 March 2018
For the year ended 31 March 2017
Sale of products (including excise duty)* 162,008.7 147,916.6 Sale of services 320.0 531.3 Other operating revenue
Scrap sales 133.6 87.6 Export incentives 2,536.0 2,363.1
164,998.3 150,898.6
*The Company is liable to Goods and Services Tax (GST) with effect from 01 July 2017. The revenues for the year ended 31 March 2018 is net of such GST. However, the revenues for the period ended upto 30 June 2017 are inclusive of excise duty.
24. OTHER INCOME
For the year ended 31 March 2018
For the year ended 31 March 2017
Interest income on financial assets (carried at amortised cost)Bank deposits 67.4 60.8 Other deposits and receivables 52.8 100.7
Provision no longer required on doubtful debts written back 95.9 - Bad debts recovered from trade receivables (net) - 70.8 Foreign exchange gain (net) - 620.5 Commission income 57.9 67.1 Miscellaneous income 745.8 239.0
1,019.8 1,158.9
25. COST OF MATERIALS CONSUMED
For the year ended 31 March 2018
For the year ended 31 March 2017
Opening stock* 15,422.1 14,905.5 Add: Purchases 57,040.3 46,958.5
72,462.4 61,864.0 Less: Closing stock 22,071.4 15,201.0 Cost of raw material consumed 50,391.0 46,663.0 Adjustment for fluctuation in exchange rates 29.1 (51.7)Packing materials consumed 5,873.7 5,237.9
56,293.8 51,849.2
*Includes inventories on acquisition of subsidiaries ` 221.1 (31 March 2017: ` Nil)
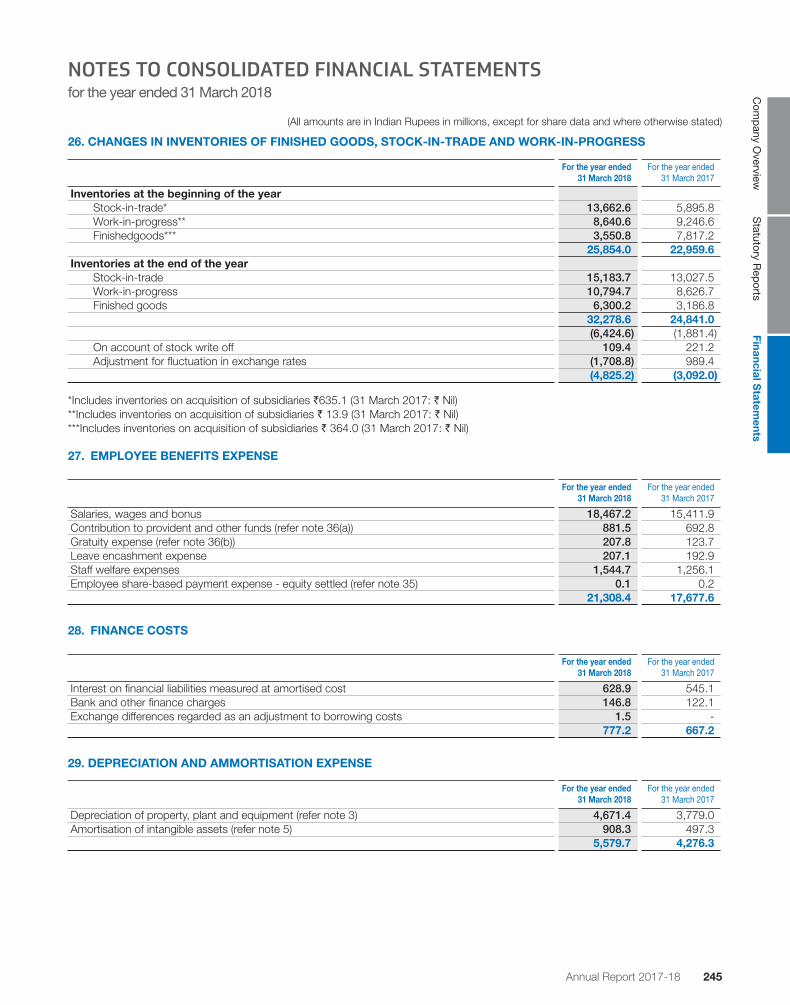
Annual Report 2017-18 245
(All amounts are in Indian Rupees in millions, except for share data and where otherwise stated)
Com
pany O
verviewS
tatutory Rep
ortsFinancial S
tatements
NOTES TO CONSOLIDATED FINANCIAL STATEMENTSfor the year ended 31 March 2018
26. CHANGES IN INVENTORIES OF FINISHED GOODS, STOCK-IN-TRADE AND WORK-IN-PROGRESS
For the year ended 31 March 2018
For the year ended 31 March 2017
Inventories at the beginning of the year Stock-in-trade* 13,662.6 5,895.8 Work-in-progress** 8,640.6 9,246.6 Finishedgoods*** 3,550.8 7,817.2
25,854.0 22,959.6 Inventories at the end of the year
Stock-in-trade 15,183.7 13,027.5 Work-in-progress 10,794.7 8,626.7 Finished goods 6,300.2 3,186.8
32,278.6 24,841.0 (6,424.6) (1,881.4)
On account of stock write off 109.4 221.2 Adjustment for fluctuation in exchange rates (1,708.8) 989.4
(4,825.2) (3,092.0)
*Includes inventories on acquisition of subsidiaries `635.1 (31 March 2017: ` Nil) **Includes inventories on acquisition of subsidiaries ` 13.9 (31 March 2017: ` Nil) ***Includes inventories on acquisition of subsidiaries ` 364.0 (31 March 2017: ` Nil)
27. EMPLOYEE BENEFITS EXPENSE
For the year ended 31 March 2018
For the year ended 31 March 2017
Salaries, wages and bonus 18,467.2 15,411.9 Contribution to provident and other funds (refer note 36(a)) 881.5 692.8 Gratuity expense (refer note 36(b)) 207.8 123.7 Leave encashment expense 207.1 192.9 Staff welfare expenses 1,544.7 1,256.1 Employee share-based payment expense - equity settled (refer note 35) 0.1 0.2
21,308.4 17,677.6
28. FINANCE COSTS
For the year ended 31 March 2018
For the year ended 31 March 2017
Interest on financial liabilities measured at amortised cost 628.9 545.1 Bank and other finance charges 146.8 122.1 Exchange differences regarded as an adjustment to borrowing costs 1.5 -
777.2 667.2
29. DEPRECIATION AND AMMORTISATION EXPENSE
For the year ended 31 March 2018
For the year ended 31 March 2017
Depreciation of property, plant and equipment (refer note 3) 4,671.4 3,779.0 Amortisation of intangible assets (refer note 5) 908.3 497.3
5,579.7 4,276.3

246
(All amounts are in Indian Rupees in millions, except for share data and where otherwise stated)
NOTES TO CONSOLIDATED FINANCIAL STATEMENTSfor the year ended 31 March 2018
30. OTHER EXPENSES
For the year ended 31 March 2018
For the year ended 31 March 2017
Conversion charges 551.3 342.5 Consumption of stores and spares 1,588.5 1,554.3 Chemicals consumed 2,413.6 1,893.8 Power and fuel 4,709.5 4,371.4 Carriage inward 642.8 642.5 Factory maintenance 474.8 349.2 Effluent treatment expenses 219.2 182.9 Excise duty on sales 368.0 1,803.2 Excise duty on changes in inventories (31.4) 5.3 Repairs and maintenance i) Plant and machinery 1,102.9 995.6 ii) Buildings 450.5 506.1 iii) Others 263.3 155.7 Rent (Refer note 32(A)) 1,105.4 773.1 Rates and taxes 645.3 612.7 Printing and stationery 186.6 155.2 Postage, telegrams and telephones 228.2 225.0 Insurance 389.6 415.7 Legal and professional charges 3,693.6 2,883.1 Directors sitting fees 3.5 1.9 Remuneration to auditors 13.6 15.6 Sales commission 1,168.9 820.1 Carriage outwards 5,224.3 4,405.5 Selling expenses 3,865.3 3,258.7Delayed supply charges 2,193.6 2,548.8 Travelling and conveyance 584.1 563.8 Vehicle maintenance expenses 195.0 154.9 Analytical charges 1,276.6 915.2 Donations 2.3 9.4 Registration, license and filing charges 1,506.7 1,648.3 Foreign exchange loss (net) 167.6 - Product development expenses 292.2 165.8 Product destruction expenses / Stock written off 109.4 221.2 Software license and implementation expenses 131.9 130.0 Loss on sale/write-off of fixed assets (net) 163.5 62.7 Fair value of changes to current investments 0.1 - Corporate Social Responsibility (CSR) expenditure (refer note below) 200.0 193.6 Miscellaneous expenses 2,344.7 1,552.8
38,445.0 34,535.6
Details of CSR expenditurea) Gross amount required to be spent by the Parent Company during the year 424.9 424.5
in cash Yet to be paid in cash
Total
b) Amount spent during the year ending on 31 March 2018: i) Construction/acquisition of any asset - - - ii) On purposes other than (i) above 200.0 - 200.0 c) Amount spent during the year ending on 31 March 2017: i) Construction/acquisition of any asset - - - ii) On purposes other than (i) above 193.6 - 193.6

Annual Report 2017-18 247
(All amounts are in Indian Rupees in millions, except for share data and where otherwise stated)
Com
pany O
verviewS
tatutory Rep
ortsFinancial S
tatements
NOTES TO CONSOLIDATED FINANCIAL STATEMENTSfor the year ended 31 March 2018
31. INCOME TAX
For the year ended 31 March 2018
For the year ended 31 March 2017
The major components of income tax expense for the year ended 31 March 2018 and 31 March 2017 are:Statement of profit and loss Current income tax charge 7,123.0 6,917.0 Deferred tax and Tax credit - relating to origination and reversal of temporary differences 1,059.7 679.5
8,182.7 7,596.5 Other comprehensive income Deferred tax - net loss on remeasurements of defined benefit plans 13.1 29.7
13.1 29.7 Reconciliation of effective tax rate for the year ended 31 March 2018 and 31 March 2017:Profit before tax 32,411.8 30,608.4 Enacted tax rate in India 34.608% 34.608%Tax at statutory tax rate 11,217.0 10,593.0 Other than temporary differencesTax holidays (Refer Note "a" below) (2,132.1) (1,313.4)Weighted deduction allowed for research and development expenditure (765.0) (1,299.8)Differences in tax rate (715.6) (39.7)Unrecognised taxes 250.1 171.3 Others 328.3 (514.9)Total (3,034.3) (2,996.5)Income tax expense 8,182.7 7,596.5 Effective tax rate 25.246% 24.818%
Notes: (a) The Company benefits from the tax holiday available for units set up under the Special Economic Zone Act, 2005.These tax
holidays are available for a period of fifteen years from the date of commencement of operations. Under the SEZ scheme, the unit which begins providing services on or after 01 April, 2005 will be eligible for deductions of 100% of profits or gains derived from export of services for the first five years, 50% of such profit or gains for a further period of five years and 50% of such profits or gains for the balance period of five years subject to fulfillment of certain conditions. From 01 April, 2011 units set up under SEZ scheme are subject to Minimum Alternate Tax (MAT).
(b) During the year ended 31 March 2018 and 31 March 2017 the Company has paid dividend to shareholders, this has resulted in payment of dividend distribution tax to the taxation authorities. The Company believes that dividend distribution tax represents additional payment to tax authorities on behalf of shareholders. Hence, dividend distribution tax paid is charged to equity.
(c) Deferred taxes have not been recognised on undistributed earnings of subsidiaries and joint ventures, where it is expected that the profits of its subsidiaries and joint ventures will not be distributed in the foreseeable future. The Group reinvests the profits of its subsidiaries and joint ventures, and accordingly, has not recorded any deferred taxes for the same. Significant judgements are involved in determining provision for current tax and deferred tax on deductible temporary differences. Deferred tax is not recognised on deductible temporary differences, where the Group believes that availability of taxable profits against which such temporary differences can be utilised, is not probable.

248
(All amounts are in Indian Rupees in millions, except for share data and where otherwise stated)
NOTES TO CONSOLIDATED FINANCIAL STATEMENTSfor the year ended 31 March 2018
32. COMMITMENTS AND CONTINGENCIES A. Leases a. Operating lease commitments - Group as lessee i The Group has operating leases agreements, which are mainly in the nature of lease of office premises for a period up
to five years, with no restrictions and are renewable/ cancellable at the option of either of the parties except for details in (ii) below. These leases include a general clause to enable upward revision of the rental charge on an annual basis according to the prevailing market conditions. There is no other escalation clause in the lease agreement. There are no sub-leases. There are no restrictions imposed by lease arrangements. The aggregate amount of operating lease payments recognised in the consolidated statement of profit and loss is ` 1,105.4 (31 March 2017: `773.1). The Group has not recognised any contingent rent as expense in the consolidated statement of profit and loss.
ii) The Group has entered into non cancellable leases for office premises in current year and previous year. These leases have remaining non cancellable period of 6 months (31 March 2017: 5 months). The lease includes an escalation clause in the lease agreement. Future minimum lease rentals under non cancellable operating leases are as follows:
31 March 2018 31 March 2017
a) With in one year 6.0 21.1 b) After one year and not more than three years - - c) After three years and not more than five years - -
b. Finance lease - Group as lessee i) Building includes factory buildings acquired on finance lease. The lease term is for major part of the economic life of the
buildings and the agreement is silent on renewal terms and transfer of legal title at the end of lease term.
ii) The lease agreement did not specify minimum lease payments over the future period.
iii) The net carrying amount of the buildings obtained on finance lease as at 31 March 2018 is ` 353.0 (31 March 2017: ` 297.5).
iv) The Group’s property, plant and equipment include warehouse equipment acquired under finance lease arrangements. The future lease rents payable and other related information in respect of such assets are as follows:
As at31 March 2018
As at31 March 2017
Net carrying amount 269.6 - Future minimum lease payments 270.6 - Less: Interest included in the above 20.3 - Present value of future minimum lease payments 250.3 -
v) Future Minimum lease payments and their present value at the Balance Sheet date for each of the following periods.
Minimum Lease payments Present value of future lease payments
31 March 2018 31 March 2017 31 March 2018 31 March 2017
Not later than one year 58.0 - 56.6 - Later than one year not later than 5 years 212.6 - 193.7 -
270.6 - 250.3 -
Lease commitments - the Group as lessor The Group has entered into agreements in the nature of non-cancellable leases for office premises. The Group has
identified assets under operating and finance lease based on the factors indicated under Appendix C to Ind AS 17 and terms of the agreement, viz., economic life of the asset vs. lease term, ownership of the asset after the lease term.
Lease commitments - the Group as lessee The Group has entered into leases for land and office premises. The Group has determined, based on an evaluation
of the terms and conditions of the arrangements, such as the lease term not constituting a major part of the economic life of the land and office premises and the fair value of the asset, that it does not retain significant risks and rewards of ownership of the land and the office premises and accounts for the contracts as operating leases.

Annual Report 2017-18 249
(All amounts are in Indian Rupees in millions, except for share data and where otherwise stated)
Com
pany O
verviewS
tatutory Rep
ortsFinancial S
tatements
NOTES TO CONSOLIDATED FINANCIAL STATEMENTSfor the year ended 31 March 2018
B. Capital and other commitments
As at31 March 2018
As at31 March 2017
Estimated amount of contracts (net of advances) remaining to be executed on capital account and not provided for
5,051.6 6,528.1
33. CONTINGENT LIABILITIES
31 March 2018 31 March 2017
(A) Claims against the Group not acknowledged as debt Claims arising from disputes not acknowledged as debts - indirect taxes (excise duty and
service tax)* 339.3 342.0
Claims arising from disputes not acknowledged as debts - direct taxes * 568.8 586.3 Claims against the Group not acknowledged as debts - other duties/ claims ^ 150.3 150.3 (B) Guarantees Outstanding bank guarantees 1,059.5 891.1
* in respect of above matters, future cash outflows in respect of contingent liabilities are determinable only by the occurrence or non occurrence of one or more uncertain future events not wholly within the control of the Group. The Group is contesting these demands and the Management, including its advisors, believe that its position will likely be upheld in the appellate process. No expense has been accrued in the financial statements for the demands raised. The Management believes that the ultimate outcome of this proceeding will not have a material adverse effect on the Group’s financial position and results of operations.
The Group is involved in disputes, claims, Governmental and/or regulatory inspection, inquires, including patents and commercial maters that arise from time to time in the ordinary course of business. The same are subject to uncertain future events not wholly within the control of the Group. The management does not expect the same to have materially adverse effect on its financial position, as it believes the likely hood of any loss is not probable.
34. EARNINGS PER SHARE The following reflects the income and share data used in the basic and diluted EPS computations:
For the year ended 31 March 2018
For the year ended 31 March 2017
EarningsConsolidated profit after taxation considered for calculation of basic and diluted earnings per share 24,231.7 23,016.6 SharesWeighted average number of Equity Shares considered for calculation of basic earnings per share (a) 585,882,685 585,213,641 Effect of dilution on account of Employee Stock Options granted (b) 5,039 9,782 Weighted average number of Equity Shares considered for calculation of diluted earnings per share (a+b)
585,887,724 585,223,423
Earnings per share of face value `1/- - Basic 41.36 39.33 - Diluted 41.36 39.33
35. SHARE BASED PAYMENTS Employee Stock Option Plan “ESOP-2006” The Parent Company instituted an Employee Stock Option Plan “ESOP-2006” for issue of shares to eligible employees of the
Group as per the special resolution passed in the 19th Annual General Meeting held on 18 September 2006. The compensation committee of the Board of directors accordingly, granted 3,240,500 options under eight grants of 175,000, 25,000, 90,000, 1,205,000, 300,000, 500,000, 915,500 and 30,000 options to eligible employees on 30 October 2006, 31 July 2007, 31 October 2007, 16 December 2011, 19 June 2012, 09 January 2013, 28 January 2013 and 09 August 2013 respectively. The method of settlement under scheme is by issue of equity shares of the Parent Company and there are no cash settlement alternatives for the employees. Each option comprises of one underlying Equity Share of `1/- each. The said options vest on an annual basis at 10%,

250
(All amounts are in Indian Rupees in millions, except for share data and where otherwise stated)
NOTES TO CONSOLIDATED FINANCIAL STATEMENTSfor the year ended 31 March 2018
15%, 25% and 50% over a period of four years and can be exercised over a period of six years from the date of grant of options. The options have been granted at the then prevailing market price of ` 120.70, ` 132.35, ` 114.50, ` 91.60, ` 106.05, ` 200.70, ` 187.40 and ` 161.30 per share respectively. The fair value of share options grants is estimated at the date of grant using Black-Scholes model, taking into account the terms and conditions upon which the share options were granted.
The details of ESOP 2006 Scheme are summarised below:
Grant Grant date Number of options granted*
Exercise price* Weighted Average Fair
value of option at grant date*
1st Grant 30 October 2006 175,000 60.35 73.102nd Grant 31 July 2007 25,000 66.18 78.823rd Grant 31 October 2007 90,000 57.25 68.184th Grant 16 December 2011 1,753,800 45.80 54.355th Grant 19 June 2012 300,000 53.03 57.426th Grant 09 January 2013 500,000 100.35 119.227th Grant 28 January 2013 1,483,170 93.70 111.328th Grant 09 August 2013 57,000 80.65 96.30
*Adjusted for bonus issue.
The details of activity under the Scheme ESOP 2006 are summarised below :
31 March 2018 31 March 2017
Options outstanding at the beginning of the year 56,219 1,027,120 Granted during the year - - Vested / exercisable during the year 56,219 638,932 Exercised during the year 25,200 712,823 Forfeited during the year subject to reissue - 258,078 Options outstanding at end of the year 31,019 56,219 Exercisable at the end of the year 31,019 27,719 Weighted average exercise price for all the above options (`) 80.66 88.76 Weighted average fair value of options at the date of grant (`) 96.30 105.63
The details of share options outstanding are summarised below:
Range of exercise prices
Number of options
outstanding
Weighted average remaining contractual
life of options (in years)
As at 31 March 2018 80 to 94 31,019 1.36 As at 31 March 2017 80 to 94 56,219 2.23
The following table lists the assumptions used for the plan:
31 March 2018
Grant Dividend yield Expected volatility
Risk-free interest rate
Expected life of options granted in years
7th Grant 0.80% 0.31% 8% 48th Grant 0.61% 0.31% 8% 4
The following table lists the assumptions used for the plan:
31 March 2017
Grant Dividend yield Expected volatility
Risk-free interest rate
Expected life of options granted in years
7th Grant 0.80% 0.31% 8% 48th Grant 0.61% 0.31% 8% 4

Annual Report 2017-18 251
(All amounts are in Indian Rupees in millions, except for share data and where otherwise stated)
Com
pany O
verviewS
tatutory Rep
ortsFinancial S
tatements
NOTES TO CONSOLIDATED FINANCIAL STATEMENTSfor the year ended 31 March 2018
36. EMPLOYEE BENEFITS
a) Disclosures related to defined contribution plan
In accordance with Indian law, all eligible employees of APL and its subsidiaries are entitled to receive benefits under the provident fund, a defined contribution plan in which both the employee and employer (at a determined rate) contribute monthly. APL and its subsidiaries in India contribute as specified under the law to the Provident Fund:
31 March 2018 31 March 2017
Provident fund contribution recognised as expense in the consolidated statement of profit and loss*
322.1 274.7
* Includes `19.3 (31 March 2017: `14.3) transferred to capital work in progress
b) Disclosures related to defined benefit plan of the Parent Company The Parent Company has a defined benefit gratuity plan governed by the Payment of Gratuity Act, 1972. Every employee
who has completed five years or more of service is entitled to gratuity on departure at 15 days last drawn salary for each completed year of service or part thereof in excess of six months.
This defined benefit plan exposes the Parent Company to acturial risk, such as longevity risk, currency risk, interest rate risk and market (investment) risk.
The plan is funded with Life Insurance Corporation in the form of a qualifying insurance policy. The following tables summarise the components of net benefit expense recognised in the consolidated statement of profit and loss, the fund status and amounts recognised in the consolidated balance sheet:
Net employee benefit expense (included under employee benefit expenses)
31 March 2018 31 March 2017
Current service cost 143.5 114.4 Past service cost 55.3 - Interest on defined benefit liability 12.8 18.1 Net employee benefit expenses* 211.6 132.5
* Includes ` 8.2 (31 March 2017: ` 10.9) transferred to capital work in progress
Details of the employee benefits obligations and plan assets are as follows:
31 March 2018 31 March 2017
Present value of funded obligation 1,054.5 818.3 Fair value of plan assets 628.5 544.6 Net defined benefit liability 426.0 273.7
Details of changes in present value of defined benefit obligation are as follows:
31 March 2018 31 March 2017
Opening defined benefit obligation 818.3 618.1 Current service cost 143.5 114.4 Past service cost 55.3 - Interest on defined benefit obligation 59.0 47.9 Benefits paid (49.9) (47.3)Remeasurement due to:
Actuarial loss arising from changes in experience 43.8 14.4 Actuarial loss arising from changes in demographic assumptions 6.3 - Actuarial (gain)/loss arising from changes in financial assumptions (21.8) 70.8
Closing defined benefit obligation 1,054.5 818.3

252
(All amounts are in Indian Rupees in millions, except for share data and where otherwise stated)
NOTES TO CONSOLIDATED FINANCIAL STATEMENTSfor the year ended 31 March 2018
Details of changes in fair value of plan assets are as follows:
31 March 2018 31 March 2017
Opening fair value of plan assets 544.6 340.5 Interest on plan assets 46.1 29.8 Employer Contribution 93.9 222.2 Benefits paid (49.9) (47.3)Remeasurement due to - actual return on plan assets less interest on plan assets (6.2) (0.6)Closing fair value of plan assets 628.5 544.6
Sensitivity analysis The sensitivity of over all plan obligations to changes in key assumptions are as follows:
31 March 2018 31 March 2017
The sensitivity of over all plan obligations to changes in key assumptions are as follows:Defined benefit obligation without effect of projected salary growth rate 677.4 381.1 Add: effect of salary growth rate 377.1 437.2 Defined benefit obligation with effect of projected salary growth 1,054.5 818.3 Defined benefit obligation, using discount rate plus 50 basis points 1,019.8 769.2 Defined benefit obligation, using discount rate minus 50 basis points 1,091.3 871.9 Defined benefit obligation, using salary growth rate plus 50 basis points 1,089.9 864.4 Defined benefit obligation, using salary growth rate minus 50 basis points 1,020.8 774.8
The major categories of plan assets as a percentage of the fair value of total plan assets are as follows:
31 March 2018 31 March 2017
Funds managed by Insurers 100.00% 100.00%
The principal assumptions used in determining gratuity obligations for the Parent Company’s plans are shown below: Financial assumptions
31 March 2018 31 March 2017
Discount rate (p.a.) 7.70% 7.40%Expected salary increase (p.a)
Until 2 years - 10.00%Beyond 2 years - 7.00%Until 1 year 10.00% - Beyond 1 year 7.00% -
Demographic assumptionsMortality rate (% of IALM 06-08) 100% 100%
Attrition rate 2018 2017
Age (years) Rates (p.a) Age (years) Rates (p.a)
21 - 30 16% 21 - 30 8%31 - 40 12% 31 - 40 4%41 - 50 3% 41 - 57 1%51 - 57 23% - -
Discount rate : The discount rate is based on the prevailing market yields of Indian Government securities as at the balance sheet date for the estimated term of obligations.
Salary escalation rate : The estimate of future salary increases considered takes into account the inflation, seniority, promotion and other related factors.

Annual Report 2017-18 253
(All amounts are in Indian Rupees in millions, except for share data and where otherwise stated)
Com
pany O
verviewS
tatutory Rep
ortsFinancial S
tatements
NOTES TO CONSOLIDATED FINANCIAL STATEMENTSfor the year ended 31 March 2018
Maturity profile of the defined benefit obligation
31 March 2018 31 March 2017
Weighted average duration of defined benefit obligation (in years) 6.77 12.53 Expected future cash flow of gratuity
Within 12 months 143.2 43.0 Between 2 and 5 years 488.3 160.8 Between 5 and 10 years 399.6 223.5 Beyond 10 years 984.3 2,099.6
Notes: 1. The estimates of future salary increases, considered in actuarial valuation, take account of inflation, seniority, promotion and
other relevant factors, such as supply and demand in the employment market.
2. The Parent Company expects to contribute ` 90.0 (31 March 2017: `65.0) during the year ending 31 March 2019 to the qualifying insurance policy.
3. The sensitivity analysis above have been determined based on a method that extrapolates the impact on defined benefit obligation as a result of reasonable changes in key assumptions occuring at the end of the reporting period by varying one actuarial assumption, keeping all other actuarial assumptions constant.
37. CAPITAL WORK-IN-PROGRESS INCLUDES EXPENDITURE DURING CONSTRUCTION PERIOD PENDING CAPITALISATION:
31 March 2018 31 March 2017
Balance brought forward 1,397.8 999.6 Add: Incurred during the year Salaries, wages and bonus 356.1 460.2 Consumption of material for testing 173.5 249.2 Consumption of stores and spares 95.1 208.3 Carriage inward 1.5 1.5 Power and fuel 122.9 270.2 Conversion charges 39.2 50.8 Rates and taxes 9.0 30.7 Printing and stationery 5.7 8.6 Postage, telegram and telephones 2.0 2.4 Insurance 1.9 (1.0)Legal and professional charges 9.2 8.9 Travelling and conveyance 7.8 10.5 Depreciation 3.1 4.6 Factory maintenance 42.4 46.5 Miscellaneous expenses 37.8 74.6
2,305.0 2,425.6 Less: Capitalised to property, plant and equipment during the year 623.3 1,027.8 Balance carried forward 1,681.7 1,397.8
38. ACQUISITION OF SUBSIDIARY Effective 01 May 2017, the Parent Company through its step-down subsidiary, Agile Pharma B.V. acquired 100% equity of
Generis Farmacêutica S.A. (“acquired entity” or “Generis”) which in turn had the following wholly owned subsidiaries on the date of acquisition.
(i). Mer Medicamentos, Lda (ii). Generis Phar, Unipessoal Lda (iii). Farma APS - Promocao de Medicamentos, Unipessoal Lda., (iv). Generis MZ, Lda.,
Generis Farmaceutica S.A., is engaged in the manufacture and sale of pharmaceutical products in Portugal. The acquisition includes the manufacturing facility in Amadora, Portugal.
Generis Farmacêutica S.A. is a generic pharmaceutical Company that focuses on both the retail and hospital segments apart from exports. Generis has a wide portfolio of products with share in the therapeutic areas of cardiovascular (CVS), Central Nervous
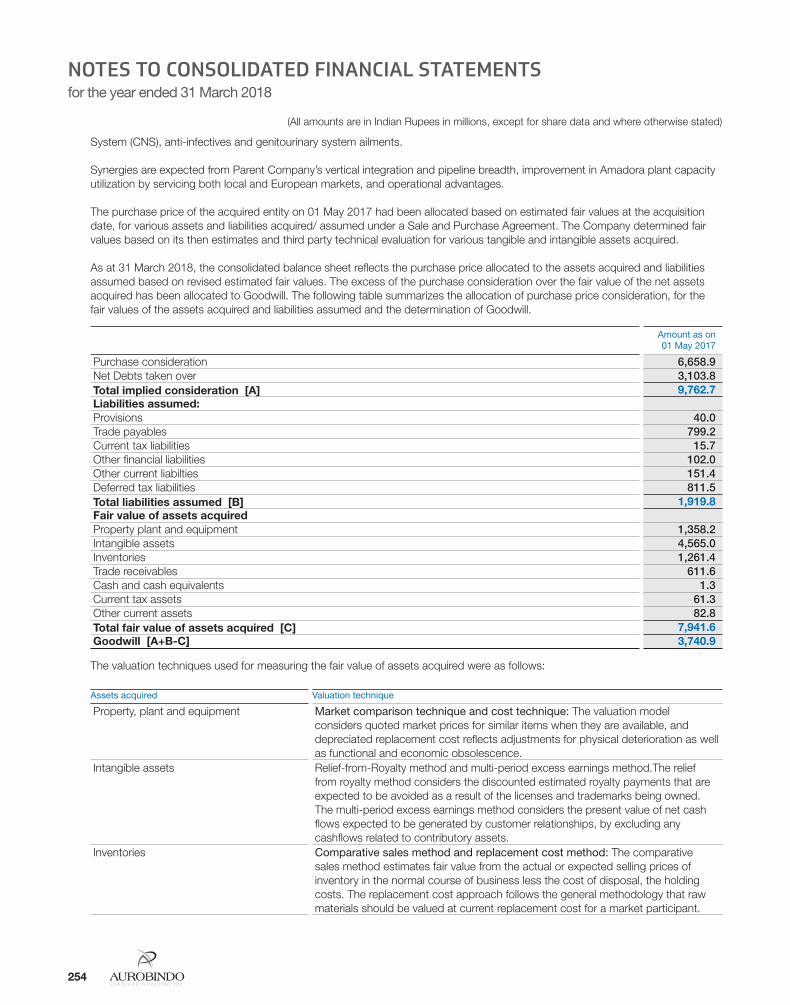
254
(All amounts are in Indian Rupees in millions, except for share data and where otherwise stated)
NOTES TO CONSOLIDATED FINANCIAL STATEMENTSfor the year ended 31 March 2018
System (CNS), anti-infectives and genitourinary system ailments.
Synergies are expected from Parent Company’s vertical integration and pipeline breadth, improvement in Amadora plant capacity utilization by servicing both local and European markets, and operational advantages.
The purchase price of the acquired entity on 01 May 2017 had been allocated based on estimated fair values at the acquisition date, for various assets and liabilities acquired/ assumed under a Sale and Purchase Agreement. The Company determined fair values based on its then estimates and third party technical evaluation for various tangible and intangible assets acquired.
As at 31 March 2018, the consolidated balance sheet reflects the purchase price allocated to the assets acquired and liabilities assumed based on revised estimated fair values. The excess of the purchase consideration over the fair value of the net assets acquired has been allocated to Goodwill. The following table summarizes the allocation of purchase price consideration, for the fair values of the assets acquired and liabilities assumed and the determination of Goodwill.
Amount as on 01 May 2017
Purchase consideration 6,658.9 Net Debts taken over 3,103.8 Total implied consideration [A] 9,762.7 Liabilities assumed:Provisions 40.0 Trade payables 799.2 Current tax liabilities 15.7 Other financial liabilities 102.0 Other current liabilties 151.4 Deferred tax liabilities 811.5 Total liabilities assumed [B] 1,919.8 Fair value of assets acquiredProperty plant and equipment 1,358.2 Intangible assets 4,565.0 Inventories 1,261.4 Trade receivables 611.6 Cash and cash equivalents 1.3 Current tax assets 61.3 Other current assets 82.8 Total fair value of assets acquired [C] 7,941.6 Goodwill [A+B-C] 3,740.9
The valuation techniques used for measuring the fair value of assets acquired were as follows:
Assets acquired Valuation technique
Property, plant and equipment Market comparison technique and cost technique: The valuation model considers quoted market prices for similar items when they are available, and depreciated replacement cost reflects adjustments for physical deterioration as well as functional and economic obsolescence.
Intangible assets Relief-from-Royalty method and multi-period excess earnings method.The relief from royalty method considers the discounted estimated royalty payments that are expected to be avoided as a result of the licenses and trademarks being owned. The multi-period excess earnings method considers the present value of net cash flows expected to be generated by customer relationships, by excluding any cashflows related to contributory assets.
Inventories Comparative sales method and replacement cost method: The comparative sales method estimates fair value from the actual or expected selling prices of inventory in the normal course of business less the cost of disposal, the holding costs. The replacement cost approach follows the general methodology that raw materials should be valued at current replacement cost for a market participant.
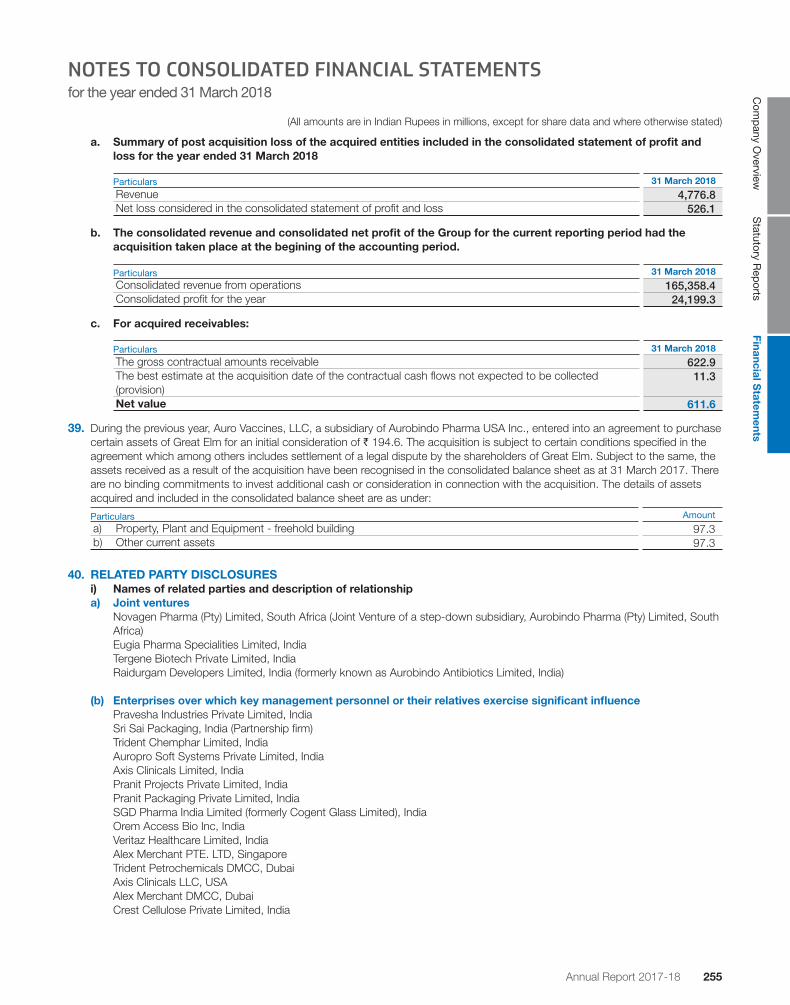
Annual Report 2017-18 255
(All amounts are in Indian Rupees in millions, except for share data and where otherwise stated)
Com
pany O
verviewS
tatutory Rep
ortsFinancial S
tatements
NOTES TO CONSOLIDATED FINANCIAL STATEMENTSfor the year ended 31 March 2018
a. Summary of post acquisition loss of the acquired entities included in the consolidated statement of profit and loss for the year ended 31 March 2018
Particulars 31 March 2018
Revenue 4,776.8 Net loss considered in the consolidated statement of profit and loss 526.1
b. The consolidated revenue and consolidated net profit of the Group for the current reporting period had the acquisition taken place at the begining of the accounting period.
Particulars 31 March 2018
Consolidated revenue from operations 165,358.4 Consolidated profit for the year 24,199.3
c. For acquired receivables:
Particulars 31 March 2018
The gross contractual amounts receivable 622.9 The best estimate at the acquisition date of the contractual cash flows not expected to be collected (provision)
11.3
Net value 611.6
39. During the previous year, Auro Vaccines, LLC, a subsidiary of Aurobindo Pharma USA Inc., entered into an agreement to purchase certain assets of Great Elm for an initial consideration of ` 194.6. The acquisition is subject to certain conditions specified in the agreement which among others includes settlement of a legal dispute by the shareholders of Great Elm. Subject to the same, the assets received as a result of the acquisition have been recognised in the consolidated balance sheet as at 31 March 2017. There are no binding commitments to invest additional cash or consideration in connection with the acquisition. The details of assets acquired and included in the consolidated balance sheet are as under:
Particulars Amount
a) Property, Plant and Equipment - freehold building 97.3b) Other current assets 97.3
40. RELATED PARTY DISCLOSURES i) Names of related parties and description of relationship a) Joint ventures Novagen Pharma (Pty) Limited, South Africa (Joint Venture of a step-down subsidiary, Aurobindo Pharma (Pty) Limited, South
Africa) Eugia Pharma Specialities Limited, India Tergene Biotech Private Limited, India Raidurgam Developers Limited, India (formerly known as Aurobindo Antibiotics Limited, India) (b) Enterprises over which key management personnel or their relatives exercise significant influence Pravesha Industries Private Limited, India Sri Sai Packaging, India (Partnership firm) Trident Chemphar Limited, India
Auropro Soft Systems Private Limited, IndiaAxis Clinicals Limited, IndiaPranit Projects Private Limited, India Pranit Packaging Private Limited, IndiaSGD Pharma India Limited (formerly Cogent Glass Limited), IndiaOrem Access Bio Inc, IndiaVeritaz Healthcare Limited, IndiaAlex Merchant PTE. LTD, Singapore Trident Petrochemicals DMCC, DubaiAxis Clinicals LLC, USAAlex Merchant DMCC, DubaiCrest Cellulose Private Limited, India

256
(All amounts are in Indian Rupees in millions, except for share data and where otherwise stated)
NOTES TO CONSOLIDATED FINANCIAL STATEMENTSfor the year ended 31 March 2018
East Pharma Technologies, India (Partnership firm)Axis Clinicals Latina SA DE CV, MexicoViwyn Pharma Private limited, IndiaGelcaps Industries, India
c) Key managerial personnel
Mr. K. Nityananda Reddy, Whole-time Director Dr. M. Sivakumaran, Whole-time Director Mr. M. Madan Mohan Reddy, Whole-time Director Mr. P. Sarath Chandra Reddy, Whole-time Director (from 01 June 2016) Mr. N. Govindarajan, Managing Director Mr. Santhanam Subramanian, Chief Financial Officer Mr. A. Mohan Rami Reddy, Company Secretary (upto 31 May 2016) Mr. B. Adi Reddy, Company Secretary (w.e.f. 01 June 2016) Mr. K. Ragunathan, Independent Director Mr. M. Sitarama Murty, Independent Director Mr. D. Rajagopala Reddy, Independent Director (Upto 08 February 2017) Dr.(Mrs.) Avnit Bimal Singh, Independent Director Mr. Rangaswamy Rathakrishnan Iyer, Independent Director (Upto 09 December 2017) Mr. P.V.Ramprasad Reddy, Non Executive promoter director Mrs. Savitha Mahajan, Independent Diretor (w.e.f. 16 December 2017)
d) Relatives to Key Managerial Personnel Mr. Vishnu M Sriram (Son-in-law of Dr. M. Sivakumaran, Whole-time Director) ii) Transactions with related parties a. Transactions with joint ventures
Particulars 31 March 2018 31 March 2017
Loans given and repayment thereofRaidurgam Developers Limited
Receipt/ converted into optionally convertible debentures against loan and interest 1,071.8 - Interest accrued 8.3 - Loan given 1,065.2 - Balance receivable 1.8 -
Other transactionsSale of land 1,681.2 - Reimbursement of expenses 152.1 - Equity allotment 31.0 - Investment in optionally convertible debentures 710.9 -
Novagen Pharma (Pty) Limited, South AfricaSale of goods 209.7 274.9
Eugia Pharma Specialities Ltd, IndiaSale of goods 10.2 0.5 Purchase of goods 0.5 - Reimbursement of Expenses Received 3.4 2.4
Tergene Biotech Pvt. Ltd, India Equity allotment 41.1 -
Investment in 10.5% Cumulative Redeemable Preference shares 5.0 -
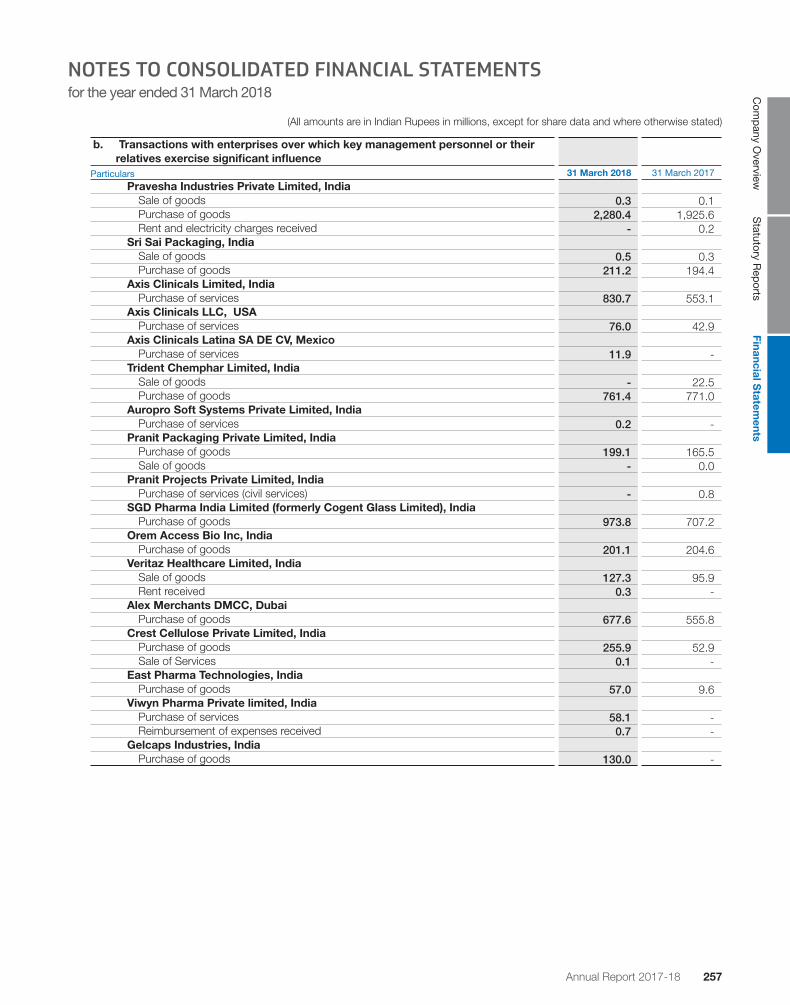
Annual Report 2017-18 257
(All amounts are in Indian Rupees in millions, except for share data and where otherwise stated)
Com
pany O
verviewS
tatutory Rep
ortsFinancial S
tatements
NOTES TO CONSOLIDATED FINANCIAL STATEMENTSfor the year ended 31 March 2018
b. Transactions with enterprises over which key management personnel or their relatives exercise significant influence
Particulars 31 March 2018 31 March 2017
Pravesha Industries Private Limited, India Sale of goods 0.3 0.1 Purchase of goods 2,280.4 1,925.6 Rent and electricity charges received - 0.2
Sri Sai Packaging, IndiaSale of goods 0.5 0.3 Purchase of goods 211.2 194.4
Axis Clinicals Limited, IndiaPurchase of services 830.7 553.1
Axis Clinicals LLC, USAPurchase of services 76.0 42.9
Axis Clinicals Latina SA DE CV, MexicoPurchase of services 11.9 -
Trident Chemphar Limited, IndiaSale of goods - 22.5 Purchase of goods 761.4 771.0
Auropro Soft Systems Private Limited, IndiaPurchase of services 0.2 -
Pranit Packaging Private Limited, IndiaPurchase of goods 199.1 165.5 Sale of goods - 0.0
Pranit Projects Private Limited, India Purchase of services (civil services) - 0.8
SGD Pharma India Limited (formerly Cogent Glass Limited), IndiaPurchase of goods 973.8 707.2
Orem Access Bio Inc, IndiaPurchase of goods 201.1 204.6
Veritaz Healthcare Limited, IndiaSale of goods 127.3 95.9 Rent received 0.3 -
Alex Merchants DMCC, DubaiPurchase of goods 677.6 555.8
Crest Cellulose Private Limited, IndiaPurchase of goods 255.9 52.9 Sale of Services 0.1 -
East Pharma Technologies, India Purchase of goods 57.0 9.6
Viwyn Pharma Private limited, IndiaPurchase of services 58.1 - Reimbursement of expenses received 0.7 -
Gelcaps Industries, India Purchase of goods 130.0 -
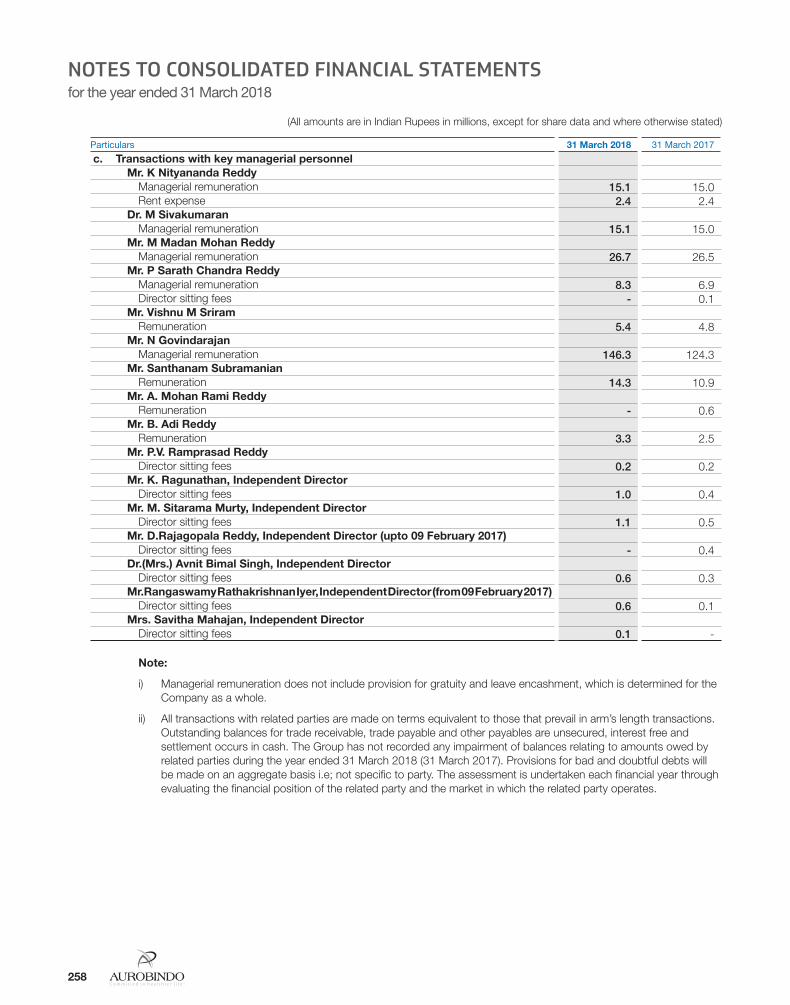
258
(All amounts are in Indian Rupees in millions, except for share data and where otherwise stated)
NOTES TO CONSOLIDATED FINANCIAL STATEMENTSfor the year ended 31 March 2018
c. Transactions with key managerial personnelMr. K Nityananda Reddy
Managerial remuneration 15.1 15.0 Rent expense 2.4 2.4
Dr. M SivakumaranManagerial remuneration 15.1 15.0
Mr. M Madan Mohan ReddyManagerial remuneration 26.7 26.5
Mr. P Sarath Chandra ReddyManagerial remuneration 8.3 6.9 Director sitting fees - 0.1
Mr. Vishnu M SriramRemuneration 5.4 4.8
Mr. N GovindarajanManagerial remuneration 146.3 124.3
Mr. Santhanam Subramanian Remuneration 14.3 10.9
Mr. A. Mohan Rami ReddyRemuneration - 0.6
Mr. B. Adi ReddyRemuneration 3.3 2.5
Mr. P.V. Ramprasad ReddyDirector sitting fees 0.2 0.2
Mr. K. Ragunathan, Independent DirectorDirector sitting fees 1.0 0.4
Mr. M. Sitarama Murty, Independent DirectorDirector sitting fees 1.1 0.5
Mr. D.Rajagopala Reddy, Independent Director (upto 09 February 2017)Director sitting fees - 0.4
Dr.(Mrs.) Avnit Bimal Singh, Independent DirectorDirector sitting fees 0.6 0.3
Mr.Rangaswamy Rathakrishnan Iyer, Independent Director (from 09 February 2017)Director sitting fees 0.6 0.1
Mrs. Savitha Mahajan, Independent Director Director sitting fees 0.1 -
Note:
i) Managerial remuneration does not include provision for gratuity and leave encashment, which is determined for the Company as a whole.
ii) All transactions with related parties are made on terms equivalent to those that prevail in arm’s length transactions. Outstanding balances for trade receivable, trade payable and other payables are unsecured, interest free and settlement occurs in cash. The Group has not recorded any impairment of balances relating to amounts owed by related parties during the year ended 31 March 2018 (31 March 2017). Provisions for bad and doubtful debts will be made on an aggregate basis i.e; not specific to party. The assessment is undertaken each financial year through evaluating the financial position of the related party and the market in which the related party operates.
Particulars 31 March 2018 31 March 2017

Annual Report 2017-18 259
(All amounts are in Indian Rupees in millions, except for share data and where otherwise stated)
Com
pany O
verviewS
tatutory Rep
ortsFinancial S
tatements
NOTES TO CONSOLIDATED FINANCIAL STATEMENTSfor the year ended 31 March 2018
iii) Closing balances of related parties a. Balances with Joint venture at the year end
Particulars 31 March 2018 31 March 2017
Novagen Pharma (Pty) Limited, South AfricaBalance receivable 59.9 74.2
Raidurgam Developers Limited, IndiaBalance receivable 152.1 -
Eugia Pharma Specialities Ltd, India Balance receivable 4.8 -
b. Enterprises over which key management personnel or their relatives exercise significant influence Particulars 31 March 2018 31 March 2017
Pravesha Industries Private Limited, India Balance receivable - 0.1 Balance payable 486.0 77.7
Sri Sai Packaging, IndiaBalance payable 15.6 0.6
Axis Clinicals Limited, IndiaBalance payable 77.1 62.4
Trident Chemphar Limited, IndiaBalance payable 155.4 204.1
Pranit Packaging Private Limited, IndiaBalance receivable 0.8 - Balance payable 8.3 2.6
SGD Pharma India Limited (formerly Cogent Glass Limited), IndiaBalance payable 305.9 132.7
Veritaz Healthcare Limited, IndiaBalance receivable 36.5 53.7
Alex Merchants DMCC, DubaiBalance receivable 38.2 173.7
East Pharma Technologies, India Balance payable 6.8 2.5
Crest Cellulose Private Limited, India Balance receivable 0.1 - Balance payable 35.9 16.5
Orem Access Bio Inc, IndiaBalance payable 39.6 -
Viwyn Pharma Private limitedBalance receivable 2.0 -
Gelcaps IndustriesBalance receivable 3.6 - Balance Payable 25.5 -
c. Key managerial personnel Particulars 31 March 2018 31 March 2017
Mr.N GovindarajanBalance payable 100.0 90.0

260
(All amounts are in Indian Rupees in millions, except for share data and where otherwise stated)
NOTES TO CONSOLIDATED FINANCIAL STATEMENTSfor the year ended 31 March 2018
41. Details of advances due from private companies in which Parent Company’s director is a director. Pranit Packaging Private Limited, India `0.8 (31 March 2017: `Nil)
42. i) Details of trade receivables due from private companies in which Parent Company’s director is a director. Pravesha Industries Private Limited, India `Nil (31 March 2017: ` 0.1)
ii) Details of trade receivables due from partnership firm in which Parent Company’s director is a partner. Sri Sai Packaging, India `Nil (31 March 2017: `0.0)
43. The amount of research and development expenditure charged to consolidated statement of profit and loss is ` 6,664.6 (31 March 2017: ` 5,427.2)
44. INTEREST IN JOINT VENTURES The Group has investment in two entities, Eugia Pharma Specialities Limited and Tergene Biotech Private Limited with a voting
share of 67.82% and 76.84% respectively. As a result of a contractual arrangement with the third party partner, the Group has a majority representation on the entity’s board of directors. However, the approval of directors represented by the third party partner are required for all major decisions with regard to operating and financing activities. As the Group does not control these entities and the other partners have significant participating rights, the Group’s interest in these entities has been accounted under the equity method of accounting under Ind AS 111 - Joint Arrangements.
The group has investment in one entity, Raidurgam Developers Limited (Formerly Aurobindo Antibiotics Ltd) with a voting share of 40%. As a result of a contractual arrangement with the third party partner, the Group does not have majority/equal representation on the entity’s Board of Directors. However, the approval of directors represented by both the Group and the third party partner are required for all major decisions with regard to operating and financing activities. As the Group jointly controls the entity with the third party partner, the Group’s interest in this entity has been accounted under the equity method of accounting under Ind AS 111 - Joint Arrangements.
The Group has interest in the following joint ventures;
31 March 2018 31 March 2017
Novagen Pharma Pty Ltd, South Africa 50.00% 50.00%Eugia Pharma Specialities Limited, India 67.82% 67.82%Tergene Biotech Private Limited, India 76.84% 60.00%Raidurgam Developers Limited (formerly Aurobindo Antibiotics Limited), India * 40.00% -
*Joint Venture w.e.f. 01 December 2017
These joint ventures are engaged in distribution of pharmaceuticals products except, Raidurgam Developers Limited, which is engaged in construction and infrastructure development. The Group’s interest in these joint ventures is accounted using the equity method in the consolidated financial statements. Summarised financial information of the joint ventures, based on its Ind AS financial statements, and reconciliation with the carrying amount of the investment in consolidated financial statements are set out below:
(a) Novagen Pharma Pty Ltd, South Africa (i). Summarised balance sheet
31 March 2018 31 March 2017
Current Assets 587.3 642.9 Non - Current Assets 185.2 167.3
772.5 810.2 Current liabilities 209.0 152.1 Equity 563.5 658.1
772.5 810.2
(ii). Details of other financial information
31 March 2018 31 March 2017
Cash and cash equivalents 111.7 110.1

Annual Report 2017-18 261
(All amounts are in Indian Rupees in millions, except for share data and where otherwise stated)
Com
pany O
verviewS
tatutory Rep
ortsFinancial S
tatements
NOTES TO CONSOLIDATED FINANCIAL STATEMENTSfor the year ended 31 March 2018
(iii). Summarised statement of profit and loss
31 March 2018 31 March 2017
Revenue 1,331.2 1,205.3 Interest income 10.7 2.9 Interest expenses 1.0 1.3 Depreciation 10.3 8.5 Profit before tax 209.7 136.8 Income tax expense (59.1) (38.4)Profit for the year 150.6 98.5 Total comprehensive income for the year 150.6 98.5
The Group’s Share of Dividend received 161.3 -
The Group’s share of profits for the year ended 31 March 2018 and 31 March 2017 was ` 89.5 and ` 59.4 respectively. The carrying value of the Group’s investment in equity shares in the joint venture as at 31 March 2018 and 31 March 2017 was ` 320.9 and ` 394.7 respectively.
(b) Eugia Pharma Specialities Limited, India (i). Summarised balance sheet
31 March 2018 31 March 2017
Current Assets 117.7 597.7 Non - Current Assets 5,174.3 3,541.4
5,292.0 4,139.1 Current liabilities 270.5 166.1 Non - Current liabilities 2,122.4 1,064.8 Equity 2,899.1 2,908.2
5,292.0 4,139.1
(ii). Details of other financial information
31 March 2018 31 March 2017
Cash and cash equivalents 56.6 440.5 Non-current financial liabilities 2,118.3 1,062.3 Current financial liabilities 102.4 78.3 Capital Commitments (Group's Share) 443.2 67.1
(iii). Summarised statement of profit and loss
31 March 2018 31 March 2017
Interest income 5.1 - Profit before tax (7.9) (12.1)Income tax expense (1.3) - Profit for the year (9.2) (12.1)Total comprehensive income for the year (9.2) (12.1)
` The Group’s Share of loss for the year ended 31 March 2018 and 31 March 2017 was ` 15.8 and ` 7.9 respectively. The carrying value of the Group’s investment in equity shares in joint venture as at 31 March 2018 and 31 March 2017 was ` 1,956.7 and ` 1,972.4 respectively.

262
(All amounts are in Indian Rupees in millions, except for share data and where otherwise stated)
NOTES TO CONSOLIDATED FINANCIAL STATEMENTSfor the year ended 31 March 2018
(c) Tergene Biotech Pvt.Ltd, India (i). Summarised balance sheet
31 March 2018 31 March 2017
Current Assets 7.3 2.2 Non - Current Assets 43.7 51.1
51.0 53.3 Current liabilities 22.1 12.5 Non - Current liabilities 97.3 94.3 Equity (68.4) (53.5)
51.0 53.3
(ii). Details of other financial information
31 March 2018 31 March 2017
Cash and cash equivalents 2.2 0.4 Non-current financial liabilities 96.5 92.4 Current financial liabilities 17.9 9.0
(iii). Summarised statement of profit and loss
31 March 2018 31 March 2017
Revenue - 0.1 Interest income - - Interest expenses 8.9 6.3 Depreciation 4.6 3.7 Profit before tax (55.7) (48.3)Profit for the year (55.7) (48.3)Total comprehensive income for the year (56.1) (49.4)
The Group’s share of loss for the year ended 31 March 2018 and 31 March 2017 was ` 41.1 and ` 1.3 respectively. The carrying value of the Group’s investment in equity shares in the joint venture as at 31 March 2018 and 31 March 2017 was ` Nil and ` Nil respectively and investment in Preference shares in the joint venture as at 31 March 2018 and 31 March 2017 was ` 95.0 and ` 90.0 respectively.
(d) Raidurgam Developers Limited (formerly Aurobindo Antibiotics Limited), India (i). Summarised balance sheet
31 March 2018
Current Assets 49.6 Non - Current Assets 2,076.4
2,126.0 Current liabilities 260.1 Non - Current liabilities 1,777.3 Equity 88.6
2,126.0
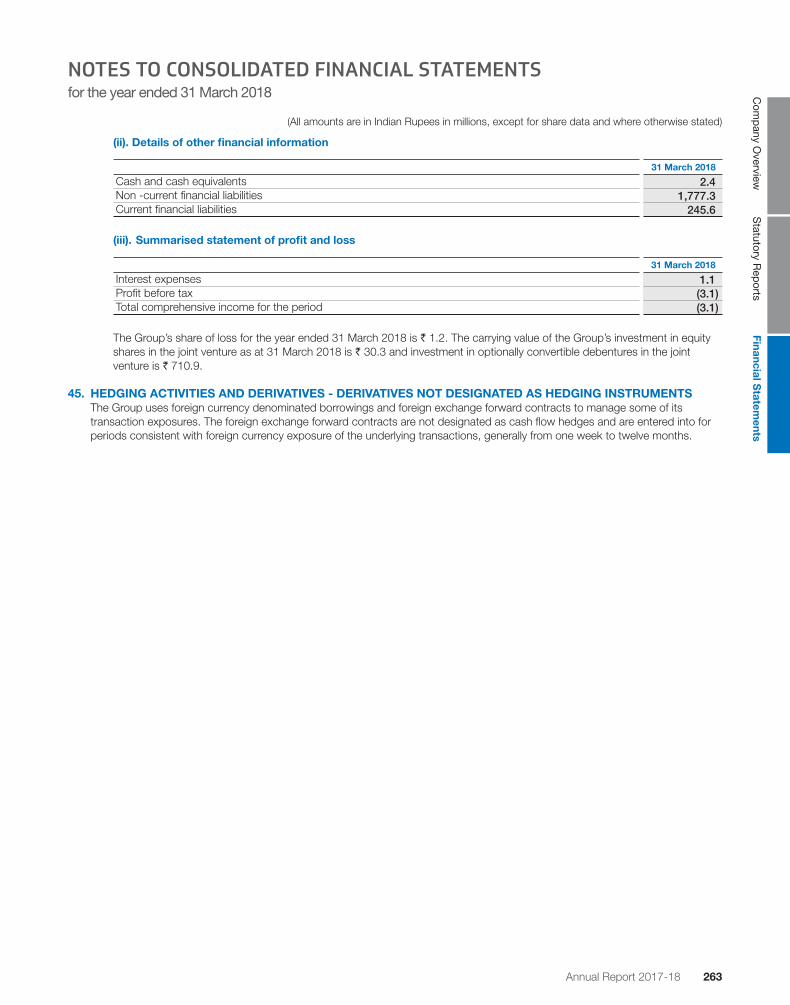
Annual Report 2017-18 263
(All amounts are in Indian Rupees in millions, except for share data and where otherwise stated)
Com
pany O
verviewS
tatutory Rep
ortsFinancial S
tatements
NOTES TO CONSOLIDATED FINANCIAL STATEMENTSfor the year ended 31 March 2018
(ii). Details of other financial information
31 March 2018
Cash and cash equivalents 2.4 Non -current financial liabilities 1,777.3 Current financial liabilities 245.6
(iii). Summarised statement of profit and loss
31 March 2018
Interest expenses 1.1 Profit before tax (3.1)Total comprehensive income for the period (3.1)
The Group’s share of loss for the year ended 31 March 2018 is ` 1.2. The carrying value of the Group’s investment in equity shares in the joint venture as at 31 March 2018 is ` 30.3 and investment in optionally convertible debentures in the joint venture is ` 710.9.
45. HEDGING ACTIVITIES AND DERIVATIVES - DERIVATIVES NOT DESIGNATED AS HEDGING INSTRUMENTS The Group uses foreign currency denominated borrowings and foreign exchange forward contracts to manage some of its
transaction exposures. The foreign exchange forward contracts are not designated as cash flow hedges and are entered into for periods consistent with foreign currency exposure of the underlying transactions, generally from one week to twelve months.
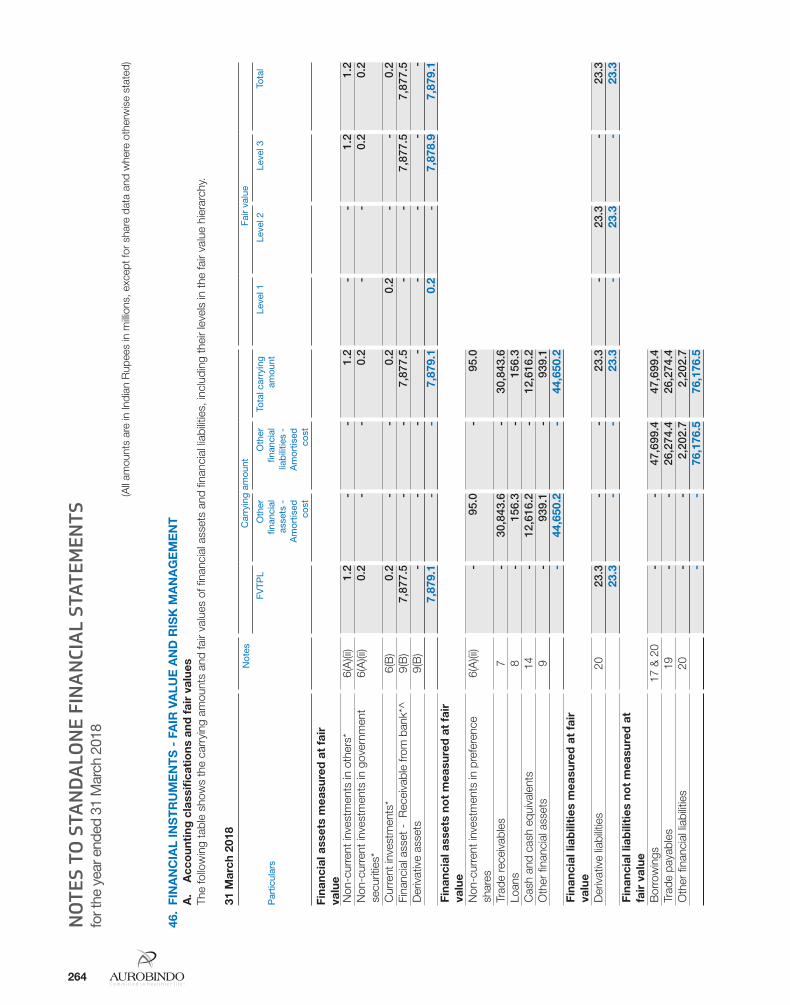
Annual Report 2017-18 265264
(All
amou
nts
are
in In
dian
Rup
ees
in m
illion
s, e
xcep
t for
sha
re d
ata
and
whe
re o
ther
wis
e st
ated
)
NO
TES
TO S
TAN
DA
LON
E FI
NA
NCI
AL
STAT
EMEN
TSfo
r the
yea
r end
ed 3
1 M
arch
201
8
46.
FIN
AN
CIA
L IN
ST
RU
ME
NT
S -
FA
IR V
ALU
E A
ND
RIS
K M
AN
AG
EM
EN
T
A.
Acc
oun
ting
cla
ssifi
cati
ons
and
fai
r va
lues
Th
e fo
llow
ing
tabl
e sh
ows
the
carr
ying
am
ount
s an
d fa
ir va
lues
of fi
nanc
ial a
sset
s an
d fin
anci
al li
abilit
ies,
incl
udin
g th
eir
leve
ls in
the
fair
valu
e hi
erar
chy.
31
Mar
ch 2
018
Par
ticul
ars
Not
esC
arry
ing
amou
ntFa
ir va
lue
FVTP
LO
ther
fin
anci
al
asse
ts -
A
mor
tised
co
st
Oth
er
finan
cial
lia
bili
ties
- A
mor
tised
co
st
Tota
l car
ryin
g am
ount
Leve
l 1Le
vel 2
Leve
l 3To
tal
Fina
ncia
l ass
ets
mea
sure
d a
t fa
ir
valu
eN
on-c
urre
nt in
vest
men
ts in
oth
ers*
6(A
)(ii)
1.2
-
-
1
.2
-
-
1.2
1
.2
Non
-cur
rent
inve
stm
ents
in g
over
nmen
t se
curit
ies*
6(A
)(ii)
0.2
-
-
0
.2
-
-
0.2
0
.2
Cur
rent
inve
stm
ents
*6(
B)
0.2
-
-
0
.2
0.2
-
-
0
.2
Fina
ncia
l ass
et -
Rec
eiva
ble
from
ban
k*^
9(B
) 7
,877
.5
-
-
7,8
77.5
-
-
7
,877
.5
7,8
77.5
D
eriv
ativ
e as
sets
9(B
) -
-
-
-
-
-
-
-
7
,879
.1
-
-
7,8
79.1
0
.2
-
7,8
78.9
7
,879
.1
Fina
ncia
l ass
ets
not
mea
sure
d a
t fa
ir
valu
eN
on-c
urre
nt in
vest
men
ts in
pre
fere
nce
shar
es6(
A)(i
i) -
9
5.0
-
95.
0
Trad
e re
ceiv
able
s7
-
30,
843.
6 -
3
0,84
3.6
Loan
s8
-
156
.3
-
156
.3
Cas
h an
d ca
sh e
quiv
alen
ts14
-
12,
616.
2 -
1
2,61
6.2
Oth
er fi
nanc
ial a
sset
s9
-
939
.1
-
939
.1
-
44,
650.
2 -
4
4,65
0.2
Fina
ncia
l lia
bili
ties
mea
sure
d a
t fa
ir
valu
eD
eriv
ativ
e lia
bilit
ies
20 2
3.3
-
-
23.
3 -
2
3.3
-
23.
3 2
3.3
-
-
23.
3 -
2
3.3
-
23.
3 Fi
nanc
ial l
iab
iliti
es n
ot
mea
sure
d a
t fa
ir v
alue
Bor
row
ings
17 &
20
-
-
47,
699.
4 4
7,69
9.4
Trad
e pa
yabl
es19
-
-
26,
274.
4 2
6,27
4.4
Oth
er fi
nanc
ial l
iabi
litie
s20
-
-
2,2
02.7
2
,202
.7
-
-
76,
176.
5 7
6,17
6.5
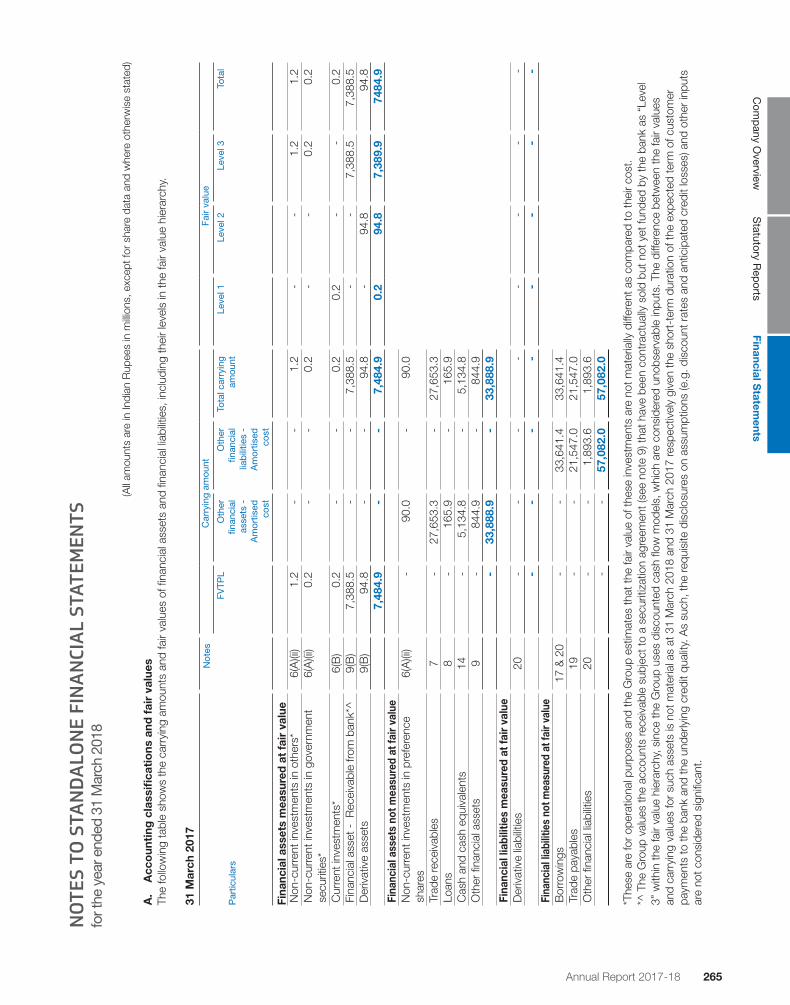
Annual Report 2017-18 265264
Com
pany O
verviewS
tatutory Rep
ortsFinancial S
tatements
(All
amou
nts
are
in In
dian
Rup
ees
in m
illion
s, e
xcep
t for
sha
re d
ata
and
whe
re o
ther
wis
e st
ated
)
NO
TES
TO S
TAN
DA
LON
E FI
NA
NCI
AL
STAT
EMEN
TSfo
r the
yea
r end
ed 3
1 M
arch
201
8
A
. A
cco
unti
ng c
lass
ifica
tio
ns a
nd f
air
valu
es
The
follo
win
g ta
ble
show
s th
e ca
rryi
ng a
mou
nts
and
fair
valu
es o
f fina
ncia
l ass
ets
and
finan
cial
liab
ilitie
s, in
clud
ing
thei
r le
vels
in th
e fa
ir va
lue
hier
arch
y.
31
Mar
ch 2
017
Par
ticul
ars
Not
esC
arry
ing
amou
ntFa
ir va
lue
FVTP
LO
ther
fin
anci
al
asse
ts -
A
mor
tised
co
st
Oth
er
finan
cial
lia
bili
ties
- A
mor
tised
co
st
Tota
l car
ryin
g am
ount
Leve
l 1Le
vel 2
Leve
l 3To
tal
Fina
ncia
l ass
ets
mea
sure
d at
fair
val
ueN
on-c
urre
nt in
vest
men
ts in
oth
ers*
6(A
)(ii)
1.2
-
-
1
.2
-
-
1.2
1
.2
Non
-cur
rent
inve
stm
ents
in g
over
nmen
t se
curit
ies*
6(A
)(ii)
0.2
-
-
0
.2
-
-
0.2
0
.2
Cur
rent
inve
stm
ents
*6(
B)
0.2
-
-
0
.2
0.2
-
-
0
.2
Fina
ncia
l ass
et -
Rec
eiva
ble
from
ban
k*^
9(B
) 7
,388
.5
-
-
7,3
88.5
-
-
7
,388
.5
7,3
88.5
D
eriv
ativ
e as
sets
9(B
) 9
4.8
-
-
94.
8 -
9
4.8
94.8
7,4
84.9
-
-
7
,484
.9
0.2
9
4.8
7,3
89.9
74
84.9
Fina
ncia
l ass
ets
not m
easu
red
at fa
ir va
lue
Non
-cur
rent
inve
stm
ents
in p
refe
renc
e sh
ares
6(A
)(ii)
-
90.
0 -
9
0.0
Trad
e re
ceiv
able
s7
-
27,
653.
3 -
2
7,65
3.3
Loan
s8
-
165
.9
-
165
.9
Cas
h an
d ca
sh e
quiv
alen
ts14
-
5,1
34.8
-
5
,134
.8
Oth
er fi
nanc
ial a
sset
s9
-
844
.9
-
844
.9
-
33,
888.
9 -
3
3,88
8.9
Fina
ncia
l lia
bilit
ies
mea
sure
d at
fair
valu
eD
eriv
ativ
e lia
bilit
ies
20 -
-
-
-
-
-
-
-
-
-
-
-
-
-
-
-
Fi
nanc
ial l
iabi
litie
s no
t mea
sure
d at
fair
valu
eB
orro
win
gs17
& 2
0 -
-
3
3,64
1.4
33,
641.
4 Tr
ade
paya
bles
19 -
-
2
1,54
7.0
21,
547.
0 O
ther
fina
ncia
l lia
bilit
ies
20 -
-
1
,893
.6
1,8
93.6
-
-
5
7,08
2.0
57,
082.
0
*T
hese
are
for
oper
atio
nal p
urpo
ses
and
the
Gro
up e
stim
ates
that
the
fair
valu
e of
thes
e in
vest
men
ts a
re n
ot m
ater
ially
diff
eren
t as
com
pare
d to
thei
r co
st.
*^
The
Gro
up v
alue
s th
e ac
coun
ts re
ceiv
able
sub
ject
to a
sec
uriti
zatio
n ag
reem
ent (
see
note
9) t
hat h
ave
been
con
trac
tual
ly s
old
but n
ot y
et fu
nded
by
the
bank
as
“Lev
el
3” w
ithin
the
fair
valu
e hi
erar
chy,
sin
ce th
e G
roup
use
s di
scou
nted
cas
h flo
w m
odel
s, w
hich
are
con
side
red
unob
serv
able
inpu
ts. T
he d
iffer
ence
bet
wee
n th
e fa
ir va
lues
an
d ca
rryi
ng v
alue
s fo
r su
ch a
sset
s is
not
mat
eria
l as
at 3
1 M
arch
201
8 an
d 31
Mar
ch 2
017
resp
ectiv
ely
give
n th
e sh
ort-
term
dur
atio
n of
the
expe
cted
term
of c
usto
mer
pa
ymen
ts to
the
bank
and
the
unde
rlyin
g cr
edit
qual
ity. A
s su
ch, t
he re
quis
ite d
iscl
osur
es o
n as
sum
ptio
ns (e
.g. d
isco
unt r
ates
and
ant
icip
ated
cre
dit l
osse
s) a
nd o
ther
inpu
ts
are
not c
onsi
dere
d si
gnifi
cant
.
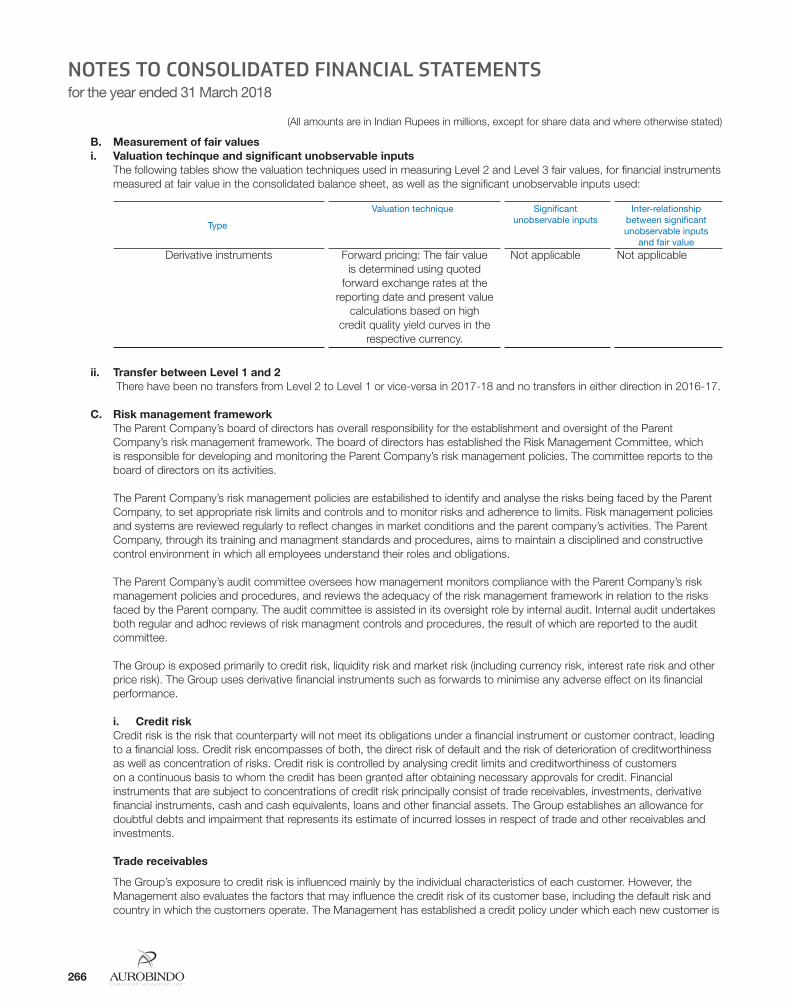
266
(All amounts are in Indian Rupees in millions, except for share data and where otherwise stated)
NOTES TO CONSOLIDATED FINANCIAL STATEMENTSfor the year ended 31 March 2018
B. Measurement of fair values i. Valuation techinque and significant unobservable inputs The following tables show the valuation techniques used in measuring Level 2 and Level 3 fair values, for financial instruments
measured at fair value in the consolidated balance sheet, as well as the significant unobservable inputs used:
Type
Valuation technique Significant unobservable inputs
Inter-relationship between significant unobservable inputs
and fair valueDerivative instruments Forward pricing: The fair value
is determined using quoted forward exchange rates at the
reporting date and present value calculations based on high
credit quality yield curves in the respective currency.
Not applicable
Not applicable
ii. Transfer between Level 1 and 2 There have been no transfers from Level 2 to Level 1 or vice-versa in 2017-18 and no transfers in either direction in 2016-17.
C. Risk management framework The Parent Company’s board of directors has overall responsibility for the establishment and oversight of the Parent
Company’s risk management framework. The board of directors has established the Risk Management Committee, which is responsible for developing and monitoring the Parent Company’s risk management policies. The committee reports to the board of directors on its activities.
The Parent Company’s risk management policies are estabilished to identify and analyse the risks being faced by the Parent Company, to set appropriate risk limits and controls and to monitor risks and adherence to limits. Risk management policies and systems are reviewed regularly to reflect changes in market conditions and the parent company’s activities. The Parent Company, through its training and managment standards and procedures, aims to maintain a disciplined and constructive control environment in which all employees understand their roles and obligations.
The Parent Company’s audit committee oversees how management monitors compliance with the Parent Company’s risk management policies and procedures, and reviews the adequacy of the risk management framework in relation to the risks faced by the Parent company. The audit committee is assisted in its oversight role by internal audit. Internal audit undertakes both regular and adhoc reviews of risk managment controls and procedures, the result of which are reported to the audit committee.
The Group is exposed primarily to credit risk, liquidity risk and market risk (including currency risk, interest rate risk and other price risk). The Group uses derivative financial instruments such as forwards to minimise any adverse effect on its financial performance.
i. Credit risk Credit risk is the risk that counterparty will not meet its obligations under a financial instrument or customer contract, leading
to a financial loss. Credit risk encompasses of both, the direct risk of default and the risk of deterioration of creditworthiness as well as concentration of risks. Credit risk is controlled by analysing credit limits and creditworthiness of customers on a continuous basis to whom the credit has been granted after obtaining necessary approvals for credit. Financial instruments that are subject to concentrations of credit risk principally consist of trade receivables, investments, derivative financial instruments, cash and cash equivalents, loans and other financial assets. The Group establishes an allowance for doubtful debts and impairment that represents its estimate of incurred losses in respect of trade and other receivables and investments.
Trade receivables
The Group’s exposure to credit risk is influenced mainly by the individual characteristics of each customer. However, the Management also evaluates the factors that may influence the credit risk of its customer base, including the default risk and country in which the customers operate. The Management has established a credit policy under which each new customer is

Annual Report 2017-18 267
(All amounts are in Indian Rupees in millions, except for share data and where otherwise stated)
Com
pany O
verviewS
tatutory Rep
ortsFinancial S
tatements
NOTES TO CONSOLIDATED FINANCIAL STATEMENTSfor the year ended 31 March 2018
analysed individually for creditworthiness before the Group’s standard payment and delivery terms and conditions are offered. The Group review includes external ratings, if available, financial statements, credit agency information, industry information and in some case bank references. Sales limits are established for each customer and reviewed quarterly.
The Group’s receivables turnover is quick and historically, there was no significant default on account of trade and other receivables. An impairment analysis is performed at each reporting date on an individual basis for major clients. In addition, a large number of minor receivables are grouped into homogenous groups and assessed for impairment collectively. The Group assesses at each reporting date whether a financial asset or a group of financial assets is impaired. Expected credit losses are measured at an amount equal to the 12 months expected credit losses or at an amount equal to the life time expected credit losses if the credit risk on the financial asset has increased significantly since initial recognition. The Group has used a practical expedient by computing the expected credit loss allowance for trade receivables based on a provision matrix. The provision matrix takes into account historical credit loss experience and is adjusted for forward looking information. The maximum exposure to credit risk at the reporting date is the carrying value of trade and other receivables. The Group does not hold collateral as security. The Group evaluates the concentration of risk with respect to trade receivables as low, as its customers are located in several jurisdictions and operate in largely independent markets.
Other financial assets The Group maintains exposure in cash and cash equivalents, other receivables from bank and derivative instruments with
financial institutions.
The Group’s maximum exposure to credit risk as at 31 March 2018 and 31 March 2017 is the carrying value of each class of financial assets.
ii. Liquidity risk Liquidity risk is the risk that the Group will encounter difficulty in meeting the obligations associated with its financial liabilities
that are settled by delivering cash or another financial asset. The Group’s approach to managing liquidity is to ensure, as far as possible, that it will have sufficient liquidity to meet its liabilities when they are due, under both normal and stressed conditions, without incurring unacceptable losses or risking damage to the Group’s reputation.
The objective of liquidity risk management is to maintain sufficient liquidity and ensure that funds are available for use as per requirements. The Group manages liquidity risk by maintaining adequate reserves, banking facilities and reserve borrowing facilities, by continuously monitoring forecast and actual cash flows, and by matching the maturity profiles of financial assets and liabilities. The following are the remaining contractual maturities of financial liabilities at reporting date:
As at 31 March 2018 Carrying amount
Contractual cash flows
< 12 months 1 to 5 years > 5 years Total
Non-derivative financial liabilitiesNon-current borrowings 7,116.4 2,934.0 4,253.6 - 7,187.6 Current borrowings 40,313.4 40,510.9 - - 40,510.9 Finance lease obligation 269.6 58.0 231.9 - 289.9 Trade payables 26,274.4 26,274.4 - - 26,274.4 Other financial liabilities 2,202.7 2,202.7 - - 2,202.7 Derivative financial liabilitiesForeign exchange forward contracts 23.3 23.3 - - 23.3
As at 31 March 2017 Carrying amount Contractual cash flows
< 12 months 1 to 5 years > 5 years Total
Non-derivative financial liabilitiesNon-current borrowings 4,614.2 2,845.4 1,817.5 - 4,662.9 Current borrowings 29,027.2 29,077.0 - - 29,077.0 Finance lease obligation - - - - - Trade payables 21,547.0 21,547.0 - - 21,547.0 Other financial liabilities 1,893.6 1,893.6 - - 1,893.6 Derivative financial liabilitiesForeign exchange forward contracts - - - - -
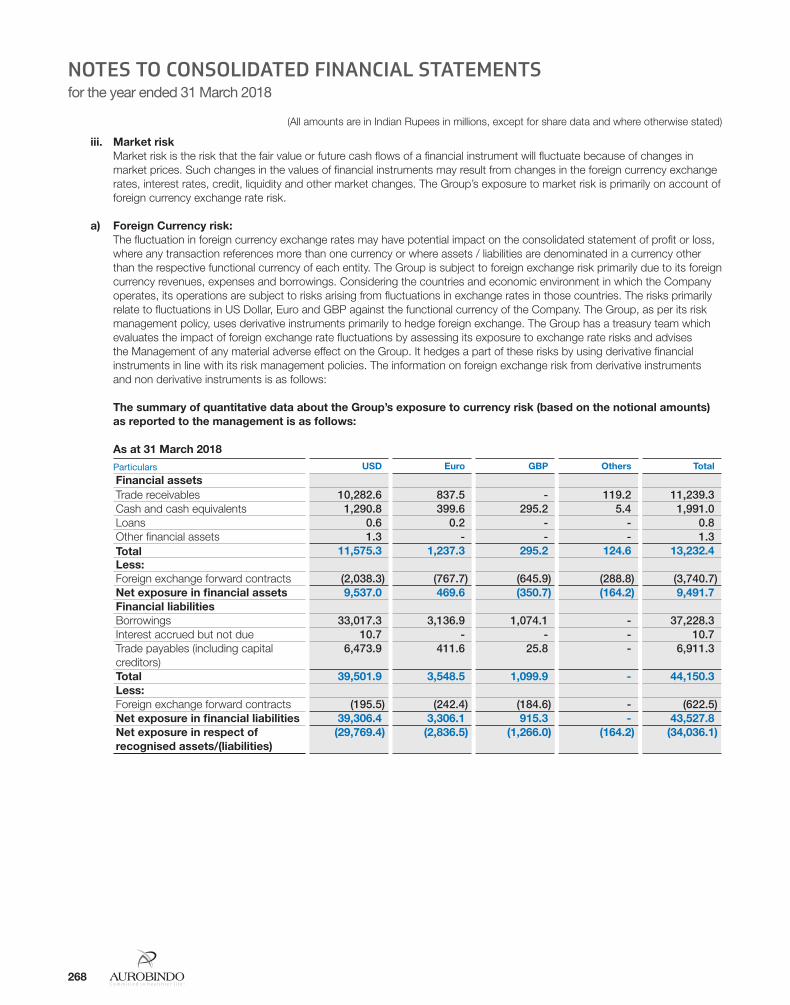
268
(All amounts are in Indian Rupees in millions, except for share data and where otherwise stated)
NOTES TO CONSOLIDATED FINANCIAL STATEMENTSfor the year ended 31 March 2018
iii. Market risk Market risk is the risk that the fair value or future cash flows of a financial instrument will fluctuate because of changes in
market prices. Such changes in the values of financial instruments may result from changes in the foreign currency exchange rates, interest rates, credit, liquidity and other market changes. The Group’s exposure to market risk is primarily on account of foreign currency exchange rate risk.
a) Foreign Currency risk: The fluctuation in foreign currency exchange rates may have potential impact on the consolidated statement of profit or loss,
where any transaction references more than one currency or where assets / liabilities are denominated in a currency other than the respective functional currency of each entity. The Group is subject to foreign exchange risk primarily due to its foreign currency revenues, expenses and borrowings. Considering the countries and economic environment in which the Company operates, its operations are subject to risks arising from fluctuations in exchange rates in those countries. The risks primarily relate to fluctuations in US Dollar, Euro and GBP against the functional currency of the Company. The Group, as per its risk management policy, uses derivative instruments primarily to hedge foreign exchange. The Group has a treasury team which evaluates the impact of foreign exchange rate fluctuations by assessing its exposure to exchange rate risks and advises the Management of any material adverse effect on the Group. It hedges a part of these risks by using derivative financial instruments in line with its risk management policies. The information on foreign exchange risk from derivative instruments and non derivative instruments is as follows:
The summary of quantitative data about the Group’s exposure to currency risk (based on the notional amounts) as reported to the management is as follows:
As at 31 March 2018
Particulars USD Euro GBP Others Total
Financial assetsTrade receivables 10,282.6 837.5 - 119.2 11,239.3 Cash and cash equivalents 1,290.8 399.6 295.2 5.4 1,991.0 Loans 0.6 0.2 - - 0.8 Other financial assets 1.3 - - - 1.3 Total 11,575.3 1,237.3 295.2 124.6 13,232.4 Less:Foreign exchange forward contracts (2,038.3) (767.7) (645.9) (288.8) (3,740.7)Net exposure in financial assets 9,537.0 469.6 (350.7) (164.2) 9,491.7 Financial liabilitiesBorrowings 33,017.3 3,136.9 1,074.1 - 37,228.3 Interest accrued but not due 10.7 - - - 10.7 Trade payables (including capital creditors)
6,473.9 411.6 25.8 - 6,911.3
Total 39,501.9 3,548.5 1,099.9 - 44,150.3 Less:Foreign exchange forward contracts (195.5) (242.4) (184.6) - (622.5)Net exposure in financial liabilities 39,306.4 3,306.1 915.3 - 43,527.8 Net exposure in respect of recognised assets/(liabilities)
(29,769.4) (2,836.5) (1,266.0) (164.2) (34,036.1)
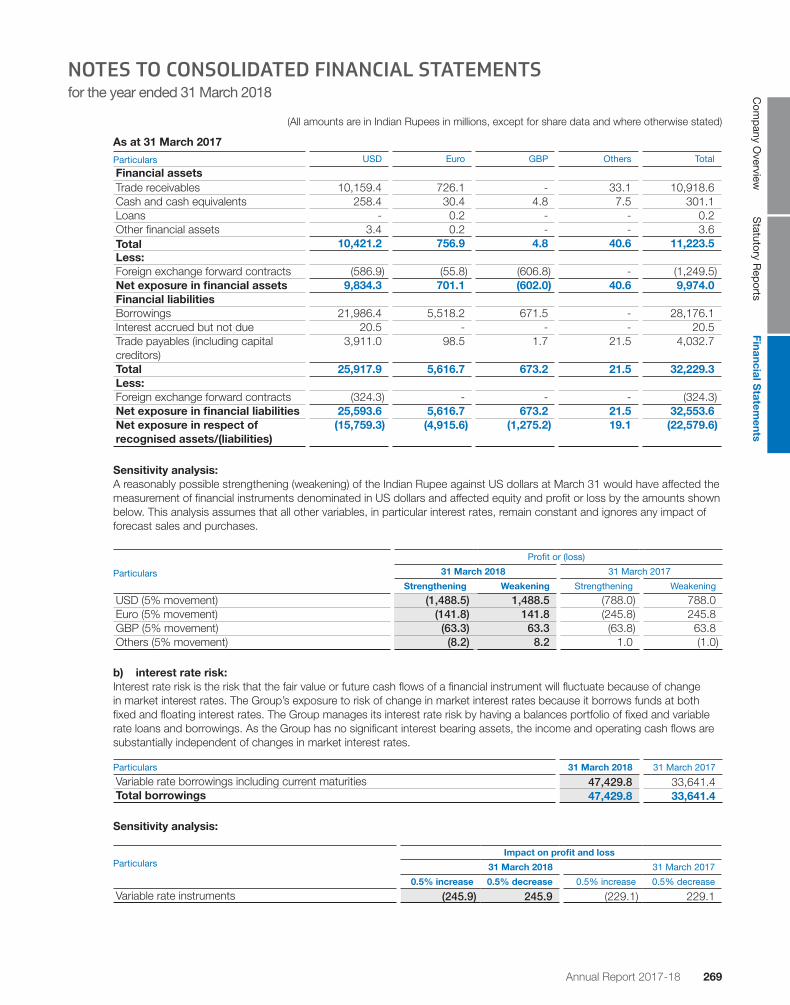
Annual Report 2017-18 269
(All amounts are in Indian Rupees in millions, except for share data and where otherwise stated)
Com
pany O
verviewS
tatutory Rep
ortsFinancial S
tatements
NOTES TO CONSOLIDATED FINANCIAL STATEMENTSfor the year ended 31 March 2018
As at 31 March 2017
Particulars USD Euro GBP Others Total
Financial assetsTrade receivables 10,159.4 726.1 - 33.1 10,918.6 Cash and cash equivalents 258.4 30.4 4.8 7.5 301.1 Loans - 0.2 - - 0.2 Other financial assets 3.4 0.2 - - 3.6 Total 10,421.2 756.9 4.8 40.6 11,223.5 Less:Foreign exchange forward contracts (586.9) (55.8) (606.8) - (1,249.5)Net exposure in financial assets 9,834.3 701.1 (602.0) 40.6 9,974.0 Financial liabilitiesBorrowings 21,986.4 5,518.2 671.5 - 28,176.1 Interest accrued but not due 20.5 - - - 20.5 Trade payables (including capital creditors)
3,911.0 98.5 1.7 21.5 4,032.7
Total 25,917.9 5,616.7 673.2 21.5 32,229.3 Less:Foreign exchange forward contracts (324.3) - - - (324.3)Net exposure in financial liabilities 25,593.6 5,616.7 673.2 21.5 32,553.6 Net exposure in respect of recognised assets/(liabilities)
(15,759.3) (4,915.6) (1,275.2) 19.1 (22,579.6)
Sensitivity analysis: A reasonably possible strengthening (weakening) of the Indian Rupee against US dollars at March 31 would have affected the
measurement of financial instruments denominated in US dollars and affected equity and profit or loss by the amounts shown below. This analysis assumes that all other variables, in particular interest rates, remain constant and ignores any impact of forecast sales and purchases.
Particulars
Profit or (loss)
31 March 2018 31 March 2017
Strengthening Weakening Strengthening Weakening
USD (5% movement) (1,488.5) 1,488.5 (788.0) 788.0 Euro (5% movement) (141.8) 141.8 (245.8) 245.8 GBP (5% movement) (63.3) 63.3 (63.8) 63.8 Others (5% movement) (8.2) 8.2 1.0 (1.0)
b) interest rate risk: Interest rate risk is the risk that the fair value or future cash flows of a financial instrument will fluctuate because of change in market interest rates. The Group’s exposure to risk of change in market interest rates because it borrows funds at both fixed and floating interest rates. The Group manages its interest rate risk by having a balances portfolio of fixed and variable rate loans and borrowings. As the Group has no significant interest bearing assets, the income and operating cash flows are substantially independent of changes in market interest rates.
Particulars 31 March 2018 31 March 2017
Variable rate borrowings including current maturities 47,429.8 33,641.4 Total borrowings 47,429.8 33,641.4
Sensitivity analysis:
ParticularsImpact on profit and loss
31 March 2018 31 March 2017
0.5% increase 0.5% decrease 0.5% increase 0.5% decrease
Variable rate instruments (245.9) 245.9 (229.1) 229.1
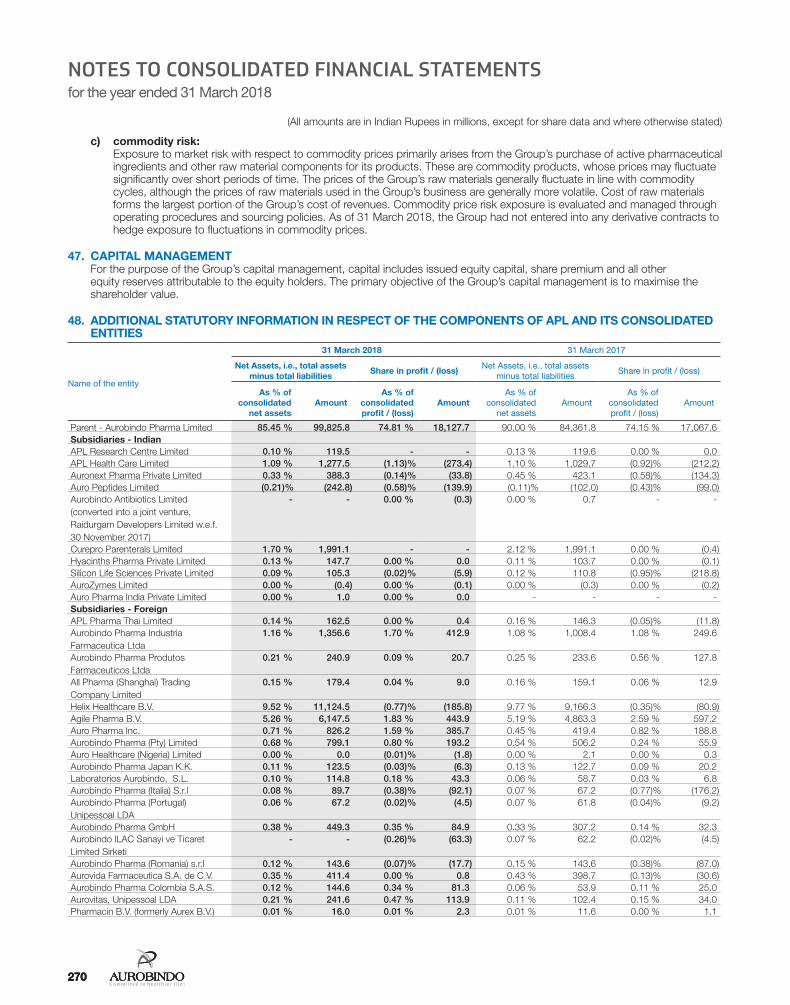
270
(All amounts are in Indian Rupees in millions, except for share data and where otherwise stated)
NOTES TO CONSOLIDATED FINANCIAL STATEMENTSfor the year ended 31 March 2018
270270
c) commodity risk: Exposure to market risk with respect to commodity prices primarily arises from the Group’s purchase of active pharmaceutical ingredients and other raw material components for its products. These are commodity products, whose prices may fluctuate significantly over short periods of time. The prices of the Group’s raw materials generally fluctuate in line with commodity cycles, although the prices of raw materials used in the Group’s business are generally more volatile. Cost of raw materials forms the largest portion of the Group’s cost of revenues. Commodity price risk exposure is evaluated and managed through operating procedures and sourcing policies. As of 31 March 2018, the Group had not entered into any derivative contracts to hedge exposure to fluctuations in commodity prices.
47. CAPITAL MANAGEMENT For the purpose of the Group’s capital management, capital includes issued equity capital, share premium and all other
equity reserves attributable to the equity holders. The primary objective of the Group’s capital management is to maximise the shareholder value.
48. ADDITIONAL STATUTORY INFORMATION IN RESPECT OF THE COMPONENTS OF APL AND ITS CONSOLIDATED ENTITIES
Name of the entity
31 March 2018 31 March 2017
Net Assets, i.e., total assets minus total liabilities
Share in profit / (loss) Net Assets, i.e., total assets
minus total liabilities Share in profit / (loss)
As % of consolidated
net assets Amount
As % of consolidated profit / (loss)
Amount As % of
consolidated net assets
Amount As % of
consolidated profit / (loss)
Amount
Parent - Aurobindo Pharma Limited 85.45 % 99,825.8 74.81 % 18,127.7 90.00 % 84,361.8 74.15 % 17,067.6 Subsidiaries - IndianAPL Research Centre Limited 0.10 % 119.5 - - 0.13 % 119.6 0.00 % 0.0 APL Health Care Limited 1.09 % 1,277.5 (1.13)% (273.4) 1.10 % 1,029.7 (0.92)% (212.2)Auronext Pharma Private Limited 0.33 % 388.3 (0.14)% (33.8) 0.45 % 423.1 (0.58)% (134.3)Auro Peptides Limited (0.21)% (242.8) (0.58)% (139.9) (0.11)% (102.0) (0.43)% (99.0)Aurobindo Antibiotics Limited (converted into a joint venture, Raidurgam Developers Limited w.e.f. 30 November 2017)
- - 0.00 % (0.3) 0.00 % 0.7 - -
Curepro Parenterals Limited 1.70 % 1,991.1 - - 2.12 % 1,991.1 0.00 % (0.4)Hyacinths Pharma Private Limited 0.13 % 147.7 0.00 % 0.0 0.11 % 103.7 0.00 % (0.1)Silicon Life Sciences Private Limited 0.09 % 105.3 (0.02)% (5.9) 0.12 % 110.8 (0.95)% (218.8)AuroZymes Limited 0.00 % (0.4) 0.00 % (0.1) 0.00 % (0.3) 0.00 % (0.2)Auro Pharma India Private Limited 0.00 % 1.0 0.00 % 0.0 - - - - Subsidiaries - ForeignAPL Pharma Thai Limited 0.14 % 162.5 0.00 % 0.4 0.16 % 146.3 (0.05)% (11.8)Aurobindo Pharma Industria Farmaceutica Ltda
1.16 % 1,356.6 1.70 % 412.9 1.08 % 1,008.4 1.08 % 249.6
Aurobindo Pharma Produtos Farmaceuticos Ltda
0.21 % 240.9 0.09 % 20.7 0.25 % 233.6 0.56 % 127.8
All Pharma (Shanghai) Trading Company Limited
0.15 % 179.4 0.04 % 9.0 0.16 % 159.1 0.06 % 12.9
Helix Healthcare B.V. 9.52 % 11,124.5 (0.77)% (185.8) 9.77 % 9,166.3 (0.35)% (80.9)Agile Pharma B.V. 5.26 % 6,147.5 1.83 % 443.9 5.19 % 4,863.3 2.59 % 597.2 Auro Pharma Inc. 0.71 % 826.2 1.59 % 385.7 0.45 % 419.4 0.82 % 188.8 Aurobindo Pharma (Pty) Limited 0.68 % 799.1 0.80 % 193.2 0.54 % 506.2 0.24 % 55.9 Auro Healthcare (Nigeria) Limited 0.00 % 0.0 (0.01)% (1.8) 0.00 % 2.1 0.00 % 0.3 Aurobindo Pharma Japan K.K. 0.11 % 123.5 (0.03)% (6.3) 0.13 % 122.7 0.09 % 20.2 Laboratorios Aurobindo, S.L. 0.10 % 114.8 0.18 % 43.3 0.06 % 58.7 0.03 % 6.8 Aurobindo Pharma (Italia) S.r.l 0.08 % 89.7 (0.38)% (92.1) 0.07 % 67.2 (0.77)% (176.2)Aurobindo Pharma (Portugal) Unipessoal LDA
0.06 % 67.2 (0.02)% (4.5) 0.07 % 61.8 (0.04)% (9.2)
Aurobindo Pharma GmbH 0.38 % 449.3 0.35 % 84.9 0.33 % 307.2 0.14 % 32.3 Aurobindo ILAC Sanayi ve Ticaret Limited Sirketi
- - (0.26)% (63.3) 0.07 % 62.2 (0.02)% (4.5)
Aurobindo Pharma (Romania) s.r.l 0.12 % 143.6 (0.07)% (17.7) 0.15 % 143.6 (0.38)% (87.0)Aurovida Farmaceutica S.A. de C.V. 0.35 % 411.4 0.00 % 0.8 0.43 % 398.7 (0.13)% (30.6)Aurobindo Pharma Colombia S.A.S. 0.12 % 144.6 0.34 % 81.3 0.06 % 53.9 0.11 % 25.0 Aurovitas, Unipessoal LDA 0.21 % 241.6 0.47 % 113.9 0.11 % 102.4 0.15 % 34.0 Pharmacin B.V. (formerly Aurex B.V.) 0.01 % 16.0 0.01 % 2.3 0.01 % 11.6 0.00 % 1.1

Annual Report 2017-18 271
(All amounts are in Indian Rupees in millions, except for share data and where otherwise stated)
Com
pany O
verviewS
tatutory Rep
ortsFinancial S
tatements
NOTES TO CONSOLIDATED FINANCIAL STATEMENTSfor the year ended 31 March 2018
Name of the entity
31 March 2018 31 March 2017
Net Assets, i.e., total assets minus total liabilities
Share in profit / (loss) Net Assets, i.e., total assets
minus total liabilities Share in profit / (loss)
As % of consolidated
net assets Amount
As % of consolidated profit / (loss)
Amount As % of
consolidated net assets
Amount As % of
consolidated profit / (loss)
Amount
Aurobindo Pharma USA Inc. 7.88 % 9,203.8 6.19 % 1,499.8 8.46 % 7,928.3 4.21 % 969.8 Aurolife Pharma LLC 8.76 % 10,228.0 4.60 % 1,115.4 9.56 % 8,966.8 8.03 % 1,847.3 Auromedics Pharma LLC 0.80 % 937.9 0.97 % 234.5 0.51 % 473.5 0.25 % 57.5 Auro Health LLC (0.48)% (561.7) 0.60 % 145.3 (0.75)% (705.2) (0.68)% (156.9)Natrol LLC 2.26 % 2,639.0 2.59 % 628.3 1.72 % 1,626.1 4.13 % 949.5 Auro AR LLC 0.01 % 6.5 - - 0.01 % 6.5 - - Aurobindo Pharma USA LLC - - - - - - - - Auro Vaccines LLC 0.02 % 26.2 (0.02)% (4.2) 0.03 % 30.3 (0.01)% (2.2)AuroLogistics LLC 0.03 % 32.6 0.00 % 0.0 - - - - Acrotech Biopharma LLC 0.03 % 32.6 - - - - - - Aurex B.V. (formerly Pharmacin B.V.) 0.16 % 184.8 0.19 % 46.9 0.12 % 115.3 0.12 % 27.7 Milpharm Limited 0.96 % 1,119.1 0.81 % 196.5 0.85 % 795.0 0.38 % 87.3 Aurobindo Pharma (Malta) Limited 0.56 % 649.8 0.00 % (1.1) 0.60 % 558.2 (0.01)% (2.3)APL Swift Services (Malta) Limited 0.31 % 359.7 0.29 % 70.7 0.26 % 243.4 0.26 % 60.0 Arrow Generiques SAS 2.74 % 3,198.0 4.33 % 1,048.9 1.90 % 1,777.7 0.25 % 56.7 1980 Puren Pharma GmbH (formerly Actavis Management GmbH), Germany
0.00 % 4.3 0.00 % 0.0 0.00 % 3.7 0.00 % 0.1
Puren Pharma GmbH (formerlyActavis Deutschland GmbH & Co., KG, Germany)
1.40 % 1,640.0 3.43 % 831.3 1.37 % 1,285.5 2.97 % 682.6
Aurovitas Spain SA 0.74 % 862.1 0.79 % 190.8 0.60 % 563.7 (0.27)% (61.7)Aurovitas Pharma Polska 0.10 % 113.3 0.01 % 1.8 0.02 % 16.4 - - Aurobindo Pharma B.V. (formerly Actavis B.V.)
0.34 % 393.7 0.58 % 140.3 0.22 % 208.6 0.74 % 171.1
Generis Farmaceutica S.A. 6.58 % 7,681.4 (2.17)% (526.0) - - - - Mer Medicamentos, Lda 0.00 % 1.8 0.00 % (0.1) - - - - Generis Phar, Unipessoal Lda 0.00 % 0.2 0.00 % 0.0 - - - - Farma APS - Promocao de Medicamentos, Unipessoal Lda.,
0.00 % 0.4 - - - - - -
Generis MZ, Lda., - - - - - - - - Aurovitas Pharma Ceska Republica s.r.o
0.00 % 0.3 0.00 % 0.0 - - - -
Aurogen South Africa (PTY) Ltd - - - - - - - - Aurobindo Pharma Saudi Arabia Limited Company
0.13 % 150.8 (0.09)% (21.7) - - - -
Aurovitas Pharma (Taizhou) Ltd - - - - - - - - Joint Ventures Joint Ventures - ForeignNovagen Pharma (Pty) Ltd NA NA 0.31 % 75.3 NA NA 0.21 % 49.2 Joint Ventures - Indian NA NAEugia Pharma Specialities Limited NA NA (0.03)% (6.2) NA NA (0.04)% (8.2)Tergene Biotech Pvt Limited NA NA (0.16)% (39.3) NA NA (0.13)% (29.6)Raidurgam Developers Limited (formerly Aurobindo Antibiotics Limited)
NA NA 0.00 % (1.2) NA NA NA NA
Minority Interests in all subsidiaries 0.02 % 18.2 (0.01)% (2.6) 0.02 % 20.8 (0.02)% (4.7)Total 141.36% 1,65,137.8 102.03 % 24,723.7 138.470% 1,29,805.9 95.83 % 22,056.9 Consolidation adjustments (41.36)% (48,315.4) (2.03)% (492.0) (38.47)% (36,065.9) 4.17 % 959.7 Net amount 100.00% 1,16,822.4 100.00% 24,231.7 100.00% 93,740.0 100.00% 23,016.6
* NA represents Not Applicable
Note : 1. The disclosure as above represents separate information for each of the consolidated entities before elimination of inter-company transactions. The net
impacts on elimination of inter company transactions / profits / Consolidation adjustments have been disclosed separately. Based on the group structure, the management is of the view that the above disclosure is appropriate under requirements of the Companies Act, 2013.
2. Percentages below 0.01% have been disclosed as 0.00%.

272
(All amounts are in Indian Rupees in millions, except for share data and where otherwise stated)
NOTES TO CONSOLIDATED FINANCIAL STATEMENTSfor the year ended 31 March 2018
49. SEGMENT INFORMATION a) Identification of Reportable Segments: Segments are identified in line with Indian Accounting Standard (Ind AS) 108 “Segment Reporting”, taking into consideration
the internal organisation and management structure as well as the differential risk and returns of the segment.
Based on the Group’s / Consolidated entities business model of vertical integration, pharmaceuticals have been considered as the only reportable business segment and hence no separate financial disclosures provided in respect of its single business segment.
Operations of the Group / Consolidated entities are managed from independent locations, which are located in different geographical locations. However each of these operating locations are further aggregated based on the following factors: (a) similarity of economic and political conditions; (b) relationships between operations in different geographical areas; (c) proximity of operations; (d) special risks associated with operations in a particular area; (e) exchange control regulations; and (f) the underlying currency risk. Accordingly, the following have been identified as operating and reportable segments: (a) “India”, (b) “USA” (c) “Europe” and (d) “Rest of the World”.
The geographic information analyses the Group’s revenues and non-current assets by the Company’s country of domicile and other countries. In presenting geographic information, segment revenue has been based on the selling location in relation to sales to customers and segment assets are based on geographical location of assets.
a) Revenue from external customers
31 March 2018 31 March 2017
India 19,802.8 20,134.9 USA 76,721.7 70,853.1 Europe 51,491.6 43,112.7 Rest of the world 16,982.2 16,797.9
164,998.3 150,898.6
b) Non-current assets (other than financial instruments and deferred tax assets) 31 March 2018 31 March 2017
India 50,819.0 46,067.8 USA 16,621.6 14,162.3 Europe 15,027.3 4,307.1 Rest of the world 1,073.5 950.4
83,541.4 65,487.6
As per our Report of even date attached.
For B S R & Associates LLPfor and on behalf of the Board of Directors of
Chartered AccountantsAurobindo Pharma Limited
ICAI Firm Registration Number: 116231W/ W-100024
Amit Kumar Agarwal N. Govindarajan Dr. M. SivakumaranPartner Managing Director DirectorMembership No.214198 DIN-00050482 DIN-01284320
Santhanam Subramanian B. Adi ReddyChief Financial Officer Company Secretary
Membership No.13709Place: HyderabadDate: 28 May 2018

31ST ANNUAL GENERAL MEETING – THURSDAY, AUGUST 30, 2018
PROXY FORM
(CIN - L24239TG1986PLC015190)Regd.Office: Plot No.2, Maitrivihar, Ameerpet, Hyderabad – 500 038
Tel No. +91 40 23736370, Fax No. +91 40 23747340E-mail: [email protected]; Website: www.aurobindo.com
Name of the Member(s):.......................................................................................................................................................................................
Registered address:..............................................................................................................................................................................................
E-mail Id:..............................................................................................................................................................................................................
Folio No. / Client ID: ............................................................................ DP ID: .....................................................................................................
I / We, being the holder(s) of ............................................................... Equity Shares of Aurobindo Pharma Limited, hereby appoint:
1. Name : .........................................................................................................................................................................................................
Address: ......................................................................................................................................................................................................
E-mail ID: .....................................................................................Signature:..........................................................................., or failing him
2. Name : .........................................................................................................................................................................................................
Address: ......................................................................................................................................................................................................
E-mail ID: .....................................................................................Signature:..........................................................................., or failing him
3. Name : .........................................................................................................................................................................................................
Address: ......................................................................................................................................................................................................
E-mail ID: .....................................................................................Signature:..........................................................................., or failing him
as my/our proxy to attend and vote (on poll) for me/us, on my/our behalf at the Annual General Meeting of the Company to be held on Thursday, the 30th day of August, 2018 at 3.00 p.m. at Kaveri Ball Room, Hotel Trident, Hi-tech City, Near Cyber Towers, Madhapur, Hyderabad - 500 081 and at any adjournment thereof in respect of such resolutions as are indicated below:
Resolution No. Resolution For AgainstOrdinary Business
1 To receive, consider and adopt the Standalone Balance Sheet as at March 31, 2018, Statement of Profit and Loss for the financial year ended on March 31, 2018, Cash Flow Statement for the financial year ended March 31, 2018 and reports of Directors and Auditors thereon
2 To receive, consider and adopt the Consolidated Balance Sheet as at March 31, 2018, Statement of Profit and Loss for the financial year ended on March 31, 2018, Cash Flow Statement for the financial year ended March 31, 2018 and report of Auditors thereon.
3 To confirm the first interim dividend of `1.50 and Second Interim Dividend of `1.00 in aggregate `2.50 per equity share of `1/- each, as dividend for the financial year 2017-18.
4 To appoint a Director in place of Mr. K. Nithyananda Reddy who retires by rotation and being eligible, seeks re-appointment.5 To appoint a Director in place of Mr. M Madan Mohan Reddy who retires by rotation and being eligible, seeks re-appointment.Special Business6 To appoint Mrs. Savita Mahajan as an Independent Director of the Company7 To re-appoint Mr.K.Nithyananda Reddy as Whole-time Director of the Company.8 To re-appoint Mr.N.Govindarajan as Managing Director of the Company.9 To re-appoint Dr. M. Sivakumaran as Whole-time Director of the Company.10 To re-appoint Mr. M. Madan Mohan Reddy as Whole-time Director of the Company.
Signed this _____________________ day of ___________________ 2018
Signature of Member ______________________________________ Signature of Proxy __________________________________
Notes: a. Proxy need not be a member of the Company. b. The proxy form duly filled in and signed by the Member(s) across the revenue stamp should reach the Company’s Registered
Office at Plot No.2, Maitrivihar, Ameerpet, Hyderabad - 500 038 at least 48 hours before the commencement of the meeting. c. Corporate Members intending to send their authorized representative(s) to attend the meeting are requested to send a certified
copy of the Board resolution authorizing their representative(s) to attend and vote on their behalf at the meeting.
Revenue
Stamp
Aurobindo Pharma Limited

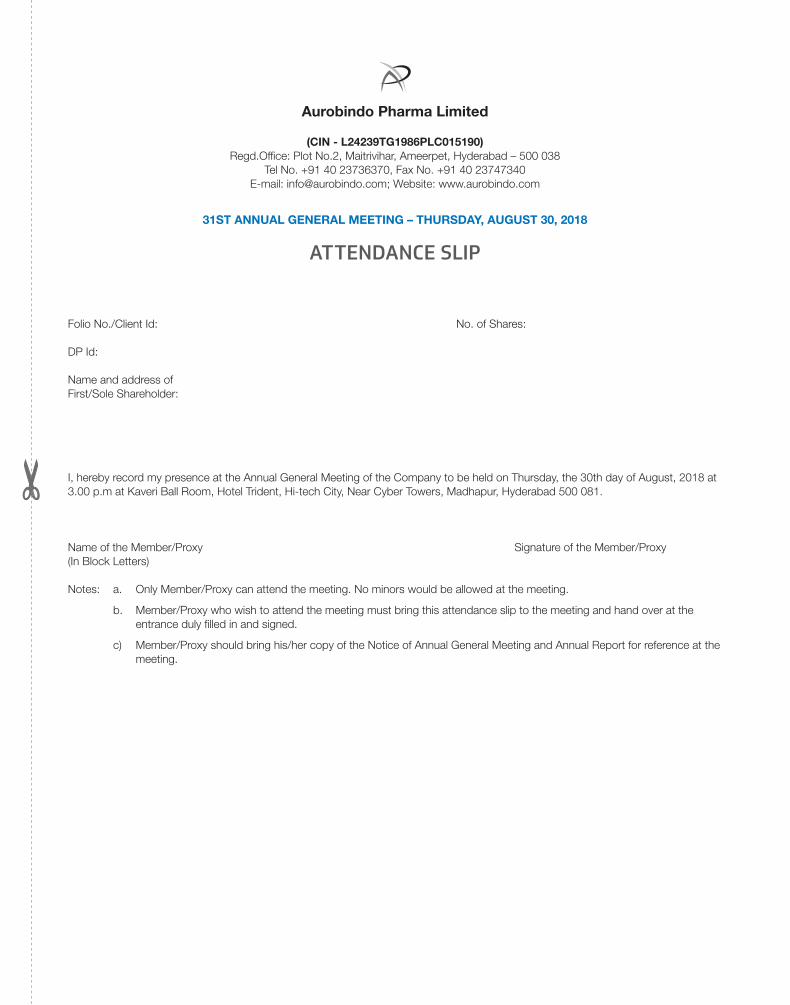
31ST ANNUAL GENERAL MEETING – THURSDAY, AUGUST 30, 2018
ATTENDANCE SLIP
(CIN - L24239TG1986PLC015190)Regd.Office: Plot No.2, Maitrivihar, Ameerpet, Hyderabad – 500 038
Tel No. +91 40 23736370, Fax No. +91 40 23747340E-mail: [email protected]; Website: www.aurobindo.com
Folio No./Client Id: No. of Shares:
DP Id:
Name and address ofFirst/Sole Shareholder:
I, hereby record my presence at the Annual General Meeting of the Company to be held on Thursday, the 30th day of August, 2018 at 3.00 p.m at Kaveri Ball Room, Hotel Trident, Hi-tech City, Near Cyber Towers, Madhapur, Hyderabad 500 081.
Name of the Member/Proxy Signature of the Member/Proxy(In Block Letters)
Notes: a. Only Member/Proxy can attend the meeting. No minors would be allowed at the meeting.
b. Member/Proxy who wish to attend the meeting must bring this attendance slip to the meeting and hand over at the entrance duly filled in and signed.
c) Member/Proxy should bring his/her copy of the Notice of Annual General Meeting and Annual Report for reference at the meeting.
Aurobindo Pharma Limited

AGM Venue - Route MapKaveri Ball Room, Hotel Trident, Hi-tech City, Near Cyber Towers, Madhapur, Hyderabad - 500 081

DISCLAIMERThis communication contains statements that constitute ‘forward looking statements’ including, without limitation, statements relating to the implementation of strategic initiatives and other statements relating to our future business developments and economic performance. While these forward looking statements represent our judgements and future expectations concerning the development of our business, a number of risks, uncertainties and other important factors could cause actual developments and results to differ materially from our expectations. These factors include, but are not limited to, general market, macro-economic, governmental and regulatory trends, movements in currency exchange and interest rates, competitive pressures, technological developments, changes in the financial conditions of third parties dealing with us, legislative developments, and other key factors that we have indicated could adversely affect our business and financial performance. Aurobindo undertakes no obligation to publicly revise any forward looking statements to reflect future events or circumstances.

REGISTERED OFFICEPlot No. 2, Maitri Vihar Ameerpet Hyderabad - 500 038 Telangana, India
CORPORATE OFFICEWater Mark Building Plot No. 11, Survey No. 9 Kondapur, Hitech City Hyderabad - 500 084 Telangana, India
www.aurobindo.com