Embed Size (px)
Citation preview
INVESTOR PRESENTATION
October 2017
Driving Value Through Culture, Innovation and Results

22
Forward-Looking Statements
This presentation includes “forward-looking statements” within the meaning of U.S. federal securities laws, and we intend that such forward-looking statements be subject to the safe harbor created thereby. Our use of words “estimate,” “expect,” “anticipate,” “project,” “plan,” “intend,” “believe,” “forecast,” or future or conditional verbs, such as “will,” “should,” “could,” “would,” or “may,” and variations of such words or similar expressions are intended to identify forward-looking statements. All forward-looking statements are based upon our current expectations and various assumptions. Our expectations, beliefs, and projections are expressed in good faith and we believe there is a reasonable basis for them. However, we cannot assure you that these expectations, beliefs, and projections will be achieved. Forward-looking statements are not guarantees of future performance and are subject to significant risks and uncertainties that may cause actual results or achievements to be materially different from the future results or achievements expressed or implied by the forward-looking statements. Among other items, such factors may include: prolonged or material contractions in automotive sales and production volumes; our inability to realize sales represented by awarded business; escalating pricing pressures; loss of large customers or significant platforms; our ability to successfully compete in the automotive parts industry; availability and increasing volatility in costs of manufactured components and raw materials; disruption in our supply base; possible variability of our working capital requirements; risks associated with our international operations; foreign currency exchange rate fluctuations; our ability to control the operations of our joint ventures for our sole benefit; our substantial amount of indebtedness; our ability to obtain adequate financing sources in the future; operating and financial restrictions imposed on us under our debt instruments; the underfunding of our pension plans; significant changes in discount rates and the actual return on pension assets; effectiveness of continuous improvement programs and other cost savings plans; manufacturing facility closings or consolidation; our ability to execute new program launches; our ability to meet customers' needs for new and improved products; the possibility that our acquisitions and divestitures may not be successful; product liability, warranty and recall claims brought against us; laws and regulations, including environmental, health and safety laws and regulations; legal proceedings, claims or investigations against us; work stoppages or other labor disruptions; the ability of our intellectual property to withstand legal challenges; cyber-attacks or other disruptions in our information technology systems; the possible volatility of our annual effective tax rate; the possibility of future impairment charges to our goodwill and long-lived assets; and our dependence on our subsidiaries for cash to satisfy our obligations.
You should not place undue reliance on these forward-looking statements. We undertake no obligation to publicly update or otherwise revise any forward-looking statement, whether as a result of new information, future events or otherwise, except where we are expressly required to do so by law.
This presentation also contains estimates and other information that is based on industry publications, surveys, and forecasts. This information involves a number of assumptions and limitations, and we have not independently verified the accuracy or completeness of the information.

33
COMPANY OVERVIEW
44
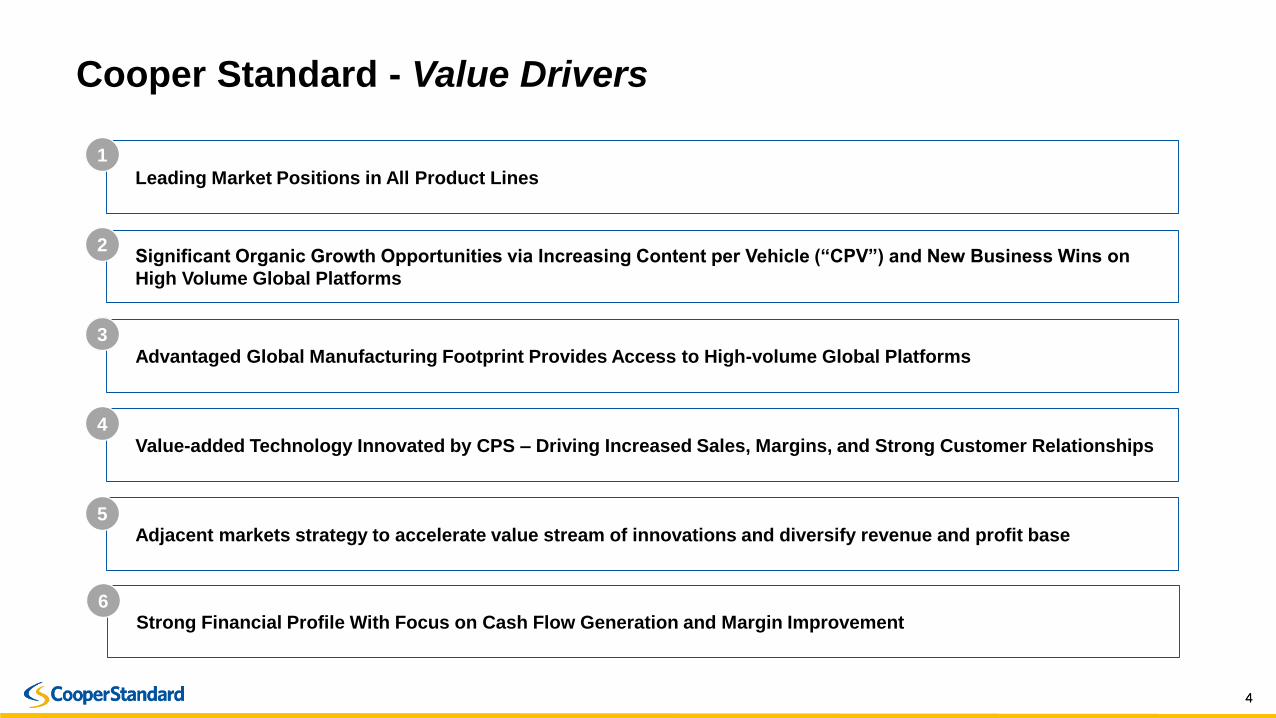
Leading Market Positions in All Product Lines
Value-added Technology Innovated by CPS – Driving Increased Sales, Margins, and Strong Customer Relationships
Significant Organic Growth Opportunities via Increasing Content per Vehicle (“CPV”) and New Business Wins on
High Volume Global Platforms
Advantaged Global Manufacturing Footprint Provides Access to High-volume Global Platforms
Adjacent markets strategy to accelerate value stream of innovations and diversify revenue and profit base
Cooper Standard - Value Drivers
1
3
4
5
2
Strong Financial Profile With Focus on Cash Flow Generation and Margin Improvement6
55
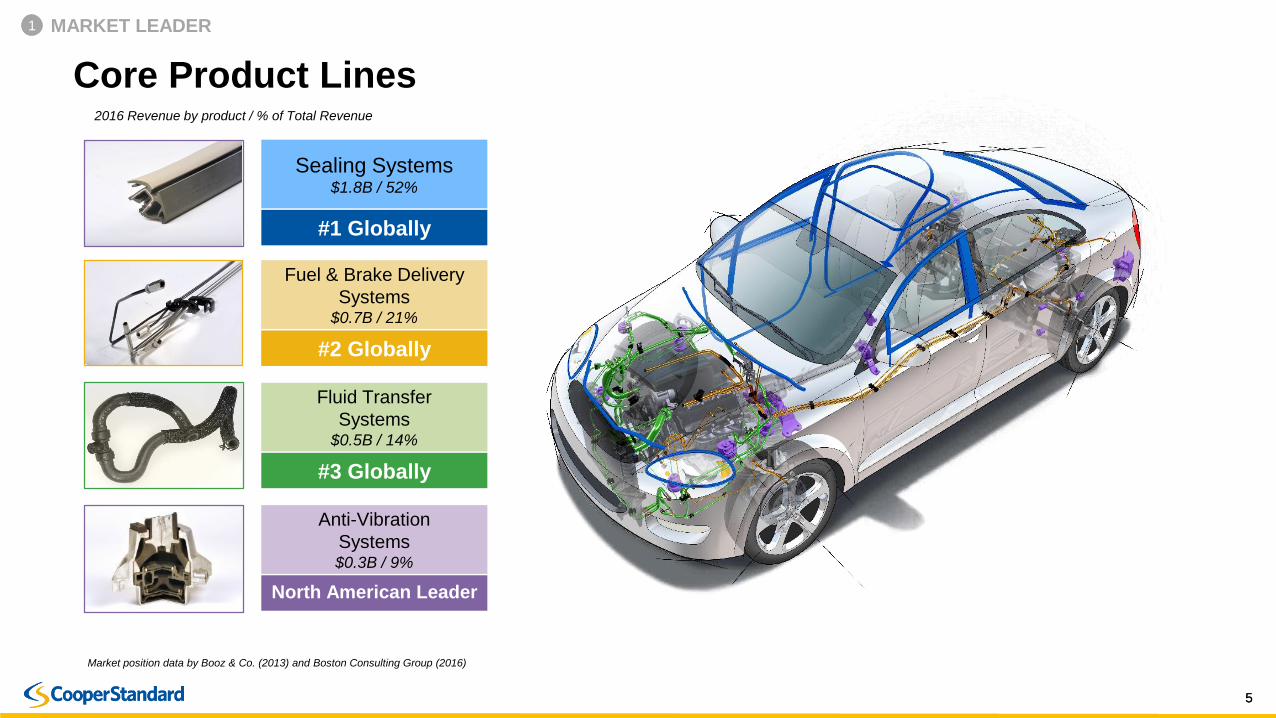
Core Product Lines2016 Revenue by product / % of Total Revenue
Sealing Systems
#1 Globally
Fuel & Brake Delivery
Systems
#2 Globally
Fluid Transfer
Systems
#3 Globally
Anti-Vibration
Systems
North American Leader
Sealing Systems$1.8B / 52%
#1 Globally
Fuel & Brake Delivery
Systems$0.7B / 21%
#2 Globally
Fluid Transfer
Systems$0.5B / 14%
#3 Globally
Anti-Vibration
Systems$0.3B / 9%
North American Leader
Market position data by Booz & Co. (2013) and Boston Consulting Group (2016)
1 MARKET LEADER
66
Sealing Systems
#1 Globally
Fuel & Brake Delivery
Systems
#2 Globally
Fluid Transfer
Systems
#3 Globally
Anti-Vibration
Systems
North American Leader
Sealing Systems$1.8B / 52%
#1 Globally
Fuel & Brake Delivery
Systems$0.7B / 21%
#2 Globally
Fluid Transfer
Systems$0.5B / 14%
#3 Globally
Anti-Vibration
Systems$0.3B / 9%
North American Leader
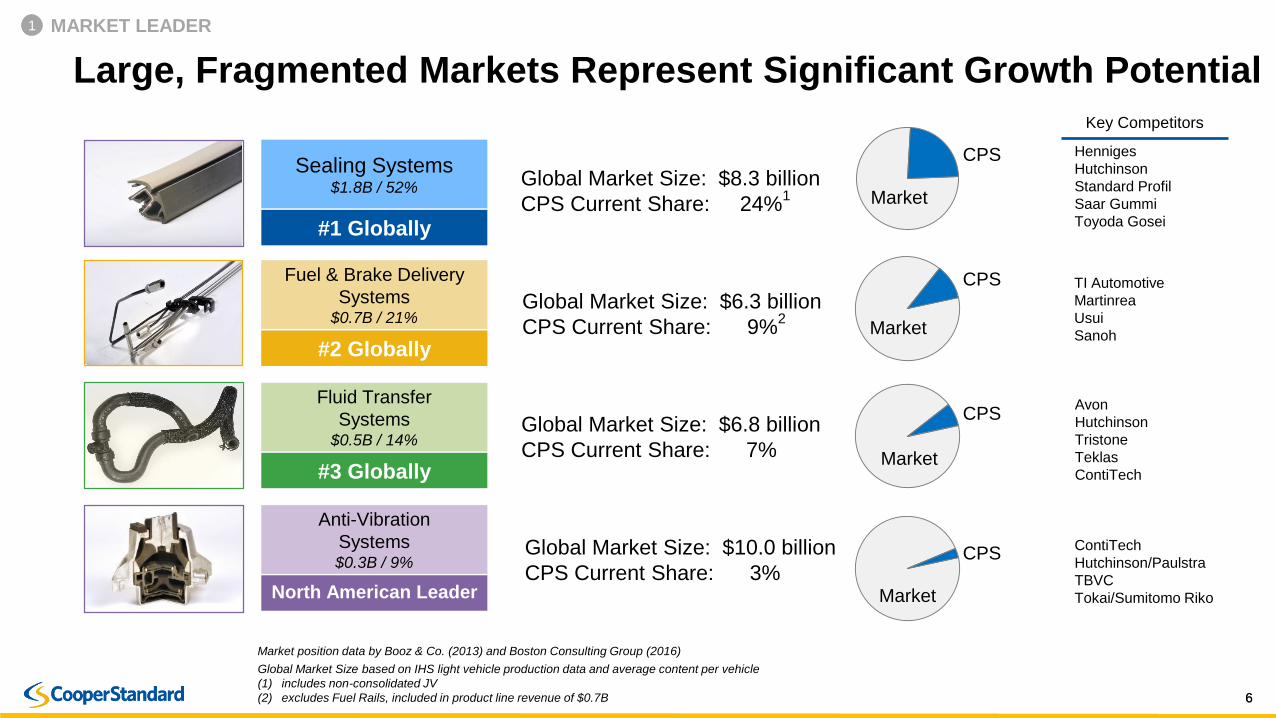
Large, Fragmented Markets Represent Significant Growth Potential
Global Market Size based on IHS light vehicle production data and average content per vehicle
(1) includes non-consolidated JV
(2) excludes Fuel Rails, included in product line revenue of $0.7B
Global Market Size: $8.3 billion
CPS Current Share: 24%1
Global Market Size: $6.3 billion
CPS Current Share: 9%2
Global Market Size: $6.8 billion
CPS Current Share: 7%
Global Market Size: $10.0 billion
CPS Current Share: 3%
Market
Market
Market
Market
CPS
CPS
CPS
CPS
1 MARKET LEADER
Market position data by Booz & Co. (2013) and Boston Consulting Group (2016)
Key Competitors
Henniges
Hutchinson
Standard Profil
Saar Gummi
Toyoda Gosei
TI Automotive
Martinrea
Usui
Sanoh
Avon
Hutchinson
Tristone
Teklas
ContiTech
ContiTech
Hutchinson/Paulstra
TBVC
Tokai/Sumitomo Riko
77
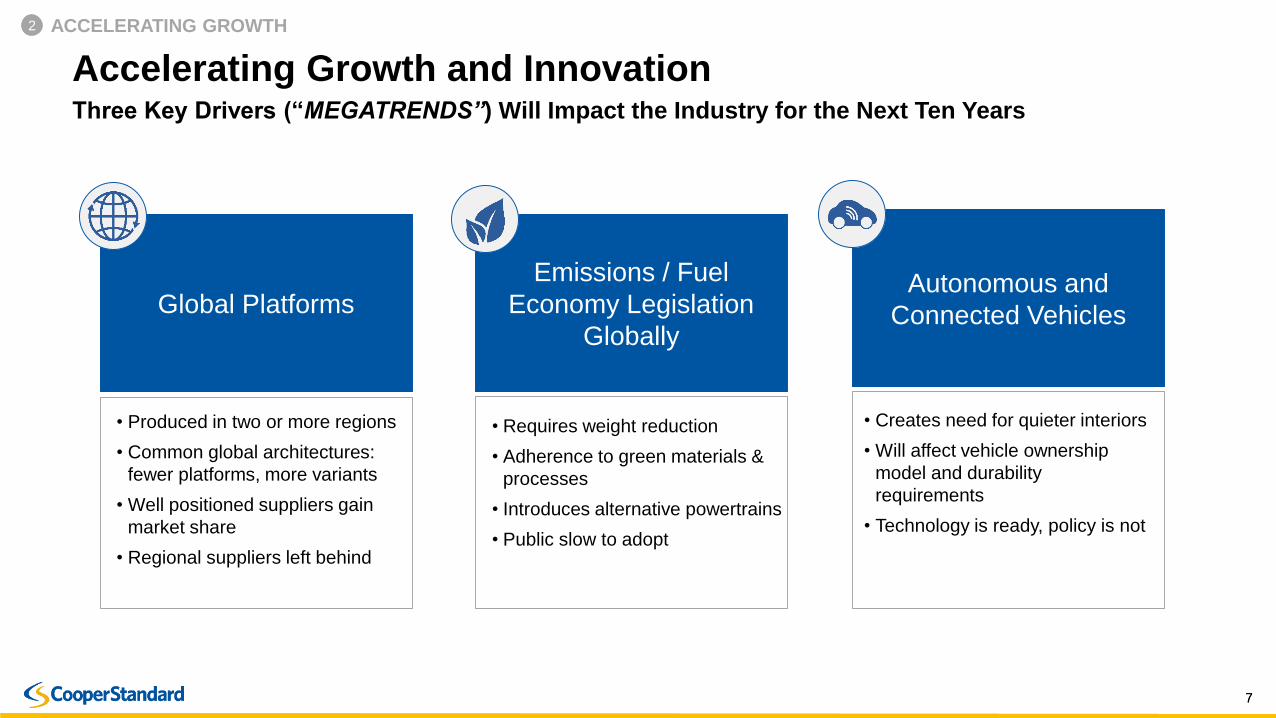
• Creates need for quieter interiors
• Will affect vehicle ownership
model and durability
requirements
• Technology is ready, policy is not
• Requires weight reduction
• Adherence to green materials &
processes
• Introduces alternative powertrains
• Public slow to adopt
• Produced in two or more regions
• Common global architectures:
fewer platforms, more variants
• Well positioned suppliers gain
market share
• Regional suppliers left behind
Accelerating Growth and InnovationThree Key Drivers (“MEGATRENDS”) Will Impact the Industry for the Next Ten Years
Global PlatformsAutonomous and
Connected Vehicles
Emissions / Fuel
Economy Legislation
Globally
2 ACCELERATING GROWTH
88
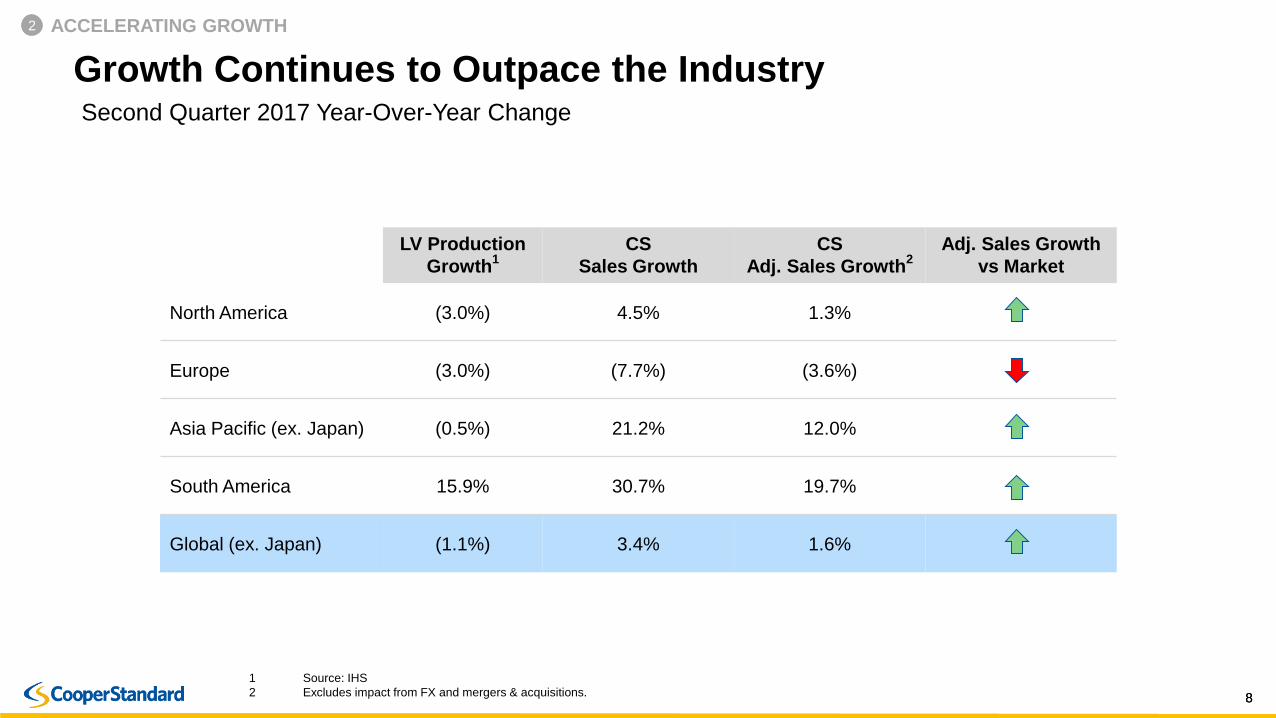
Growth Continues to Outpace the Industry
LV Production
Growth1
CS
Sales Growth
CS
Adj. Sales Growth2
Adj. Sales Growth
vs Market
North America (3.0%) 4.5% 1.3%
Europe (3.0%) (7.7%) (3.6%)
Asia Pacific (ex. Japan) (0.5%) 21.2% 12.0%
South America 15.9% 30.7% 19.7%
Global (ex. Japan) (1.1%) 3.4% 1.6%
1 Source: IHS
2 Excludes impact from FX and mergers & acquisitions.
Second Quarter 2017 Year-Over-Year Change
2 ACCELERATING GROWTH
99
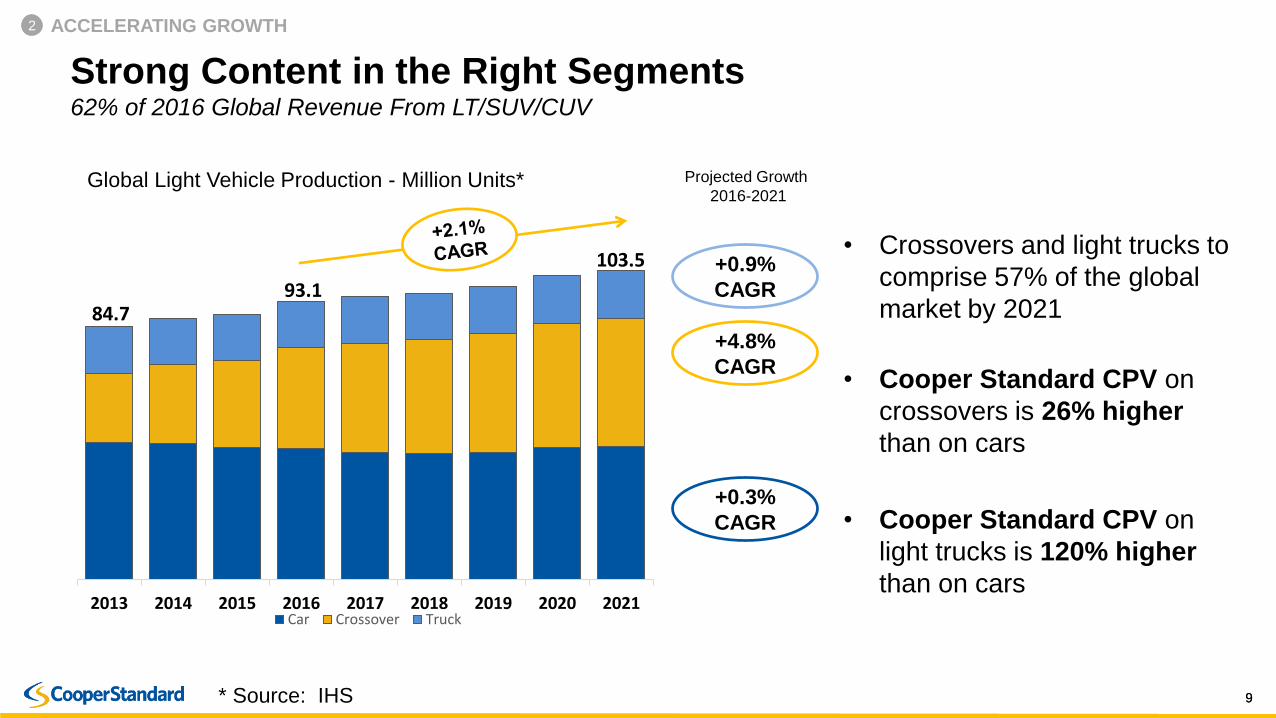
Strong Content in the Right Segments62% of 2016 Global Revenue From LT/SUV/CUV
2013 2014 2015 2016 2017 2018 2019 2020 2021Car Crossover Truck
84.793.1
103.5• Crossovers and light trucks to
comprise 57% of the global
market by 2021
• Cooper Standard CPV on
crossovers is 26% higher
than on cars
• Cooper Standard CPV on
light trucks is 120% higher
than on cars
+0.9%
CAGR
+4.8%
CAGR
+0.3%
CAGR
Projected Growth
2016-2021
* Source: IHS
Global Light Vehicle Production - Million Units*
2 ACCELERATING GROWTH
1010
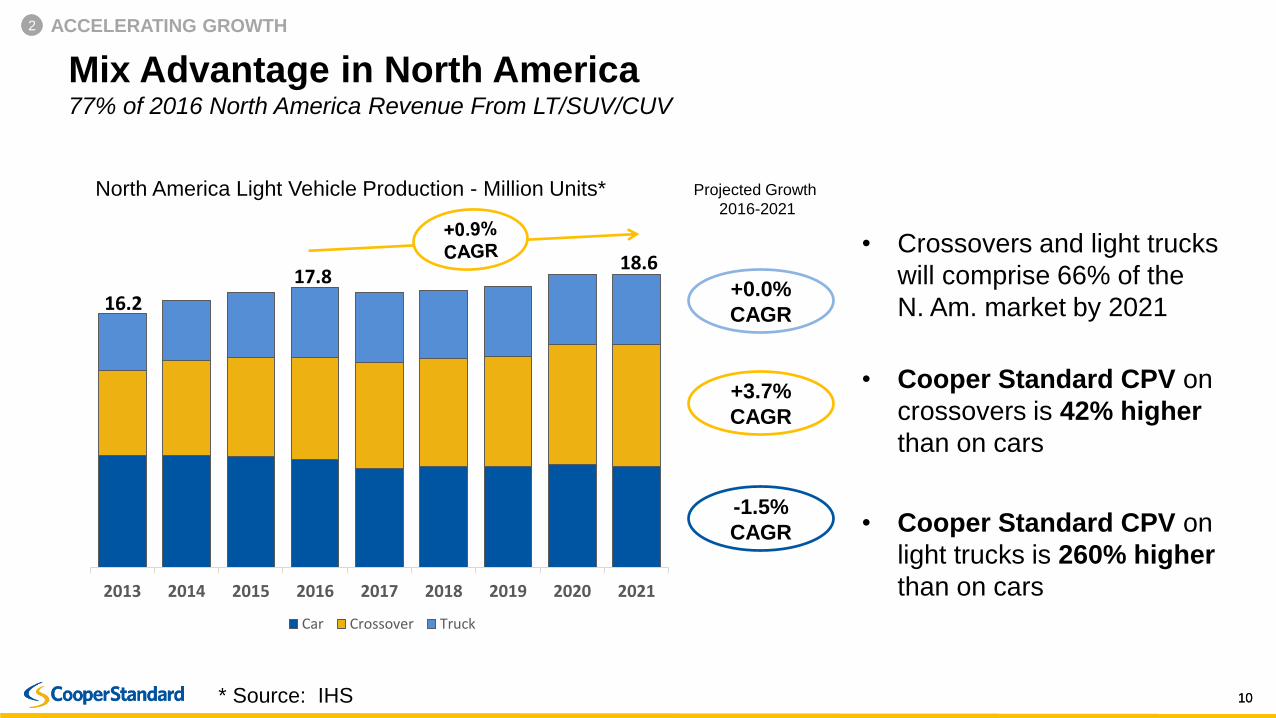
2013 2014 2015 2016 2017 2018 2019 2020 2021
Car Crossover Truck
16.2
17.818.6
+0.0%
CAGR
+3.7%
CAGR
Mix Advantage in North America77% of 2016 North America Revenue From LT/SUV/CUV
• Crossovers and light trucks
will comprise 66% of the
N. Am. market by 2021
• Cooper Standard CPV on
crossovers is 42% higher
than on cars
• Cooper Standard CPV on
light trucks is 260% higher
than on cars
-1.5%
CAGR
Projected Growth
2016-2021
* Source: IHS
North America Light Vehicle Production - Million Units*
2 ACCELERATING GROWTH
1111
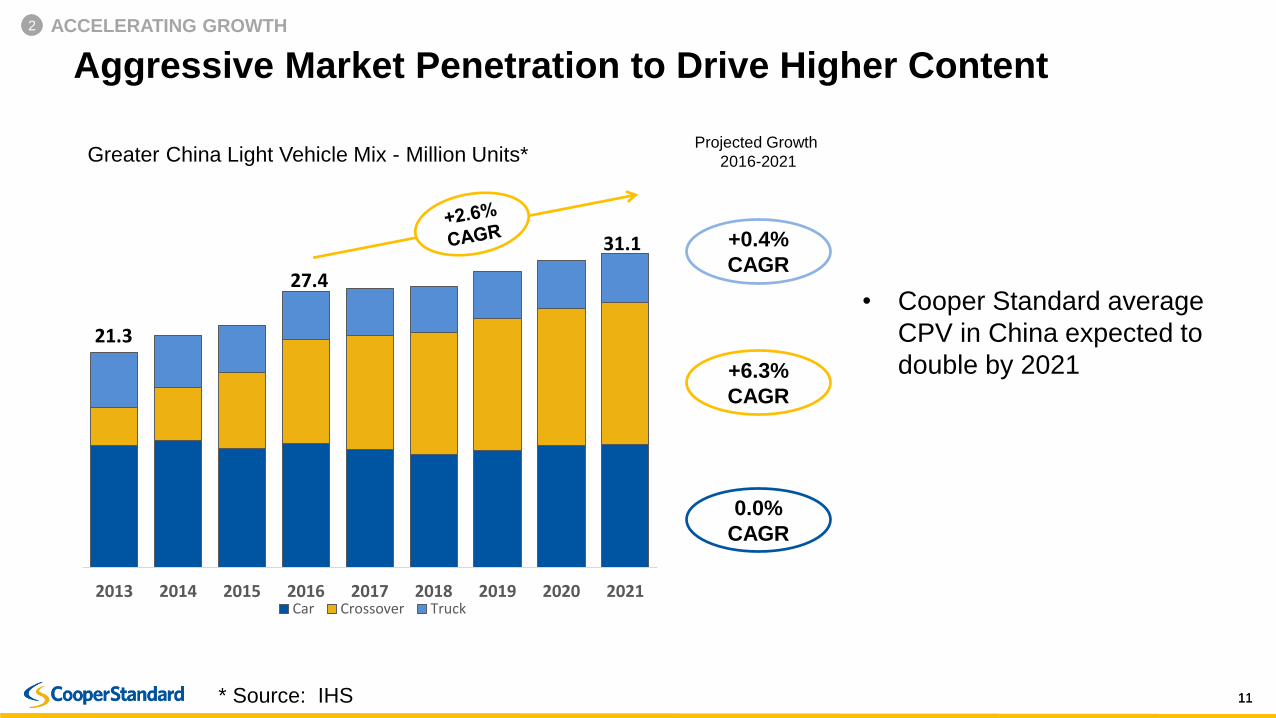
Aggressive Market Penetration to Drive Higher Content
2013 2014 2015 2016 2017 2018 2019 2020 2021Car Crossover Truck
21.3
27.4
31.1
• Cooper Standard average
CPV in China expected to
double by 2021
+0.4%
CAGR
+6.3%
CAGR
0.0%
CAGR
Projected Growth
2016-2021
* Source: IHS
Greater China Light Vehicle Mix - Million Units*
2 ACCELERATING GROWTH
1212
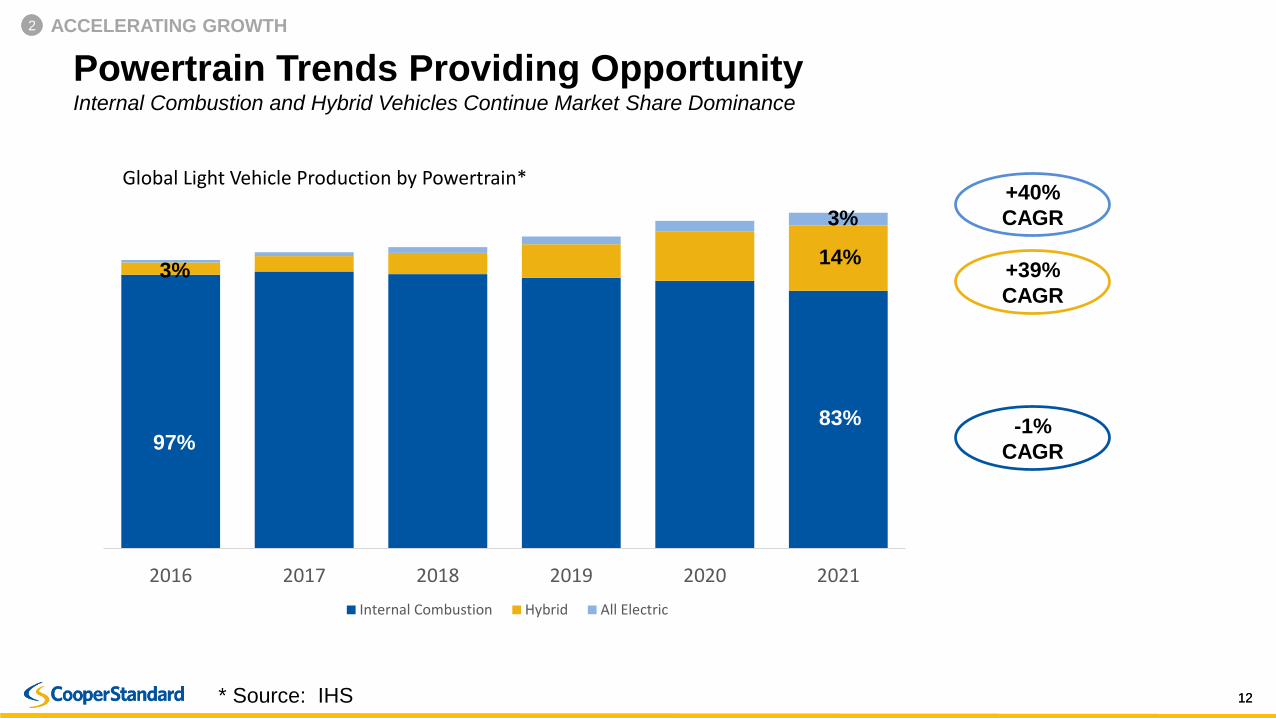
Powertrain Trends Providing OpportunityInternal Combustion and Hybrid Vehicles Continue Market Share Dominance
2016 2017 2018 2019 2020 2021
Internal Combustion Hybrid All Electric
97%
3%
3%
14%
83%
+40%
CAGR
+39%
CAGR
-1%
CAGR
* Source: IHS
Global Light Vehicle Production by Powertrain*
2 ACCELERATING GROWTH
1313
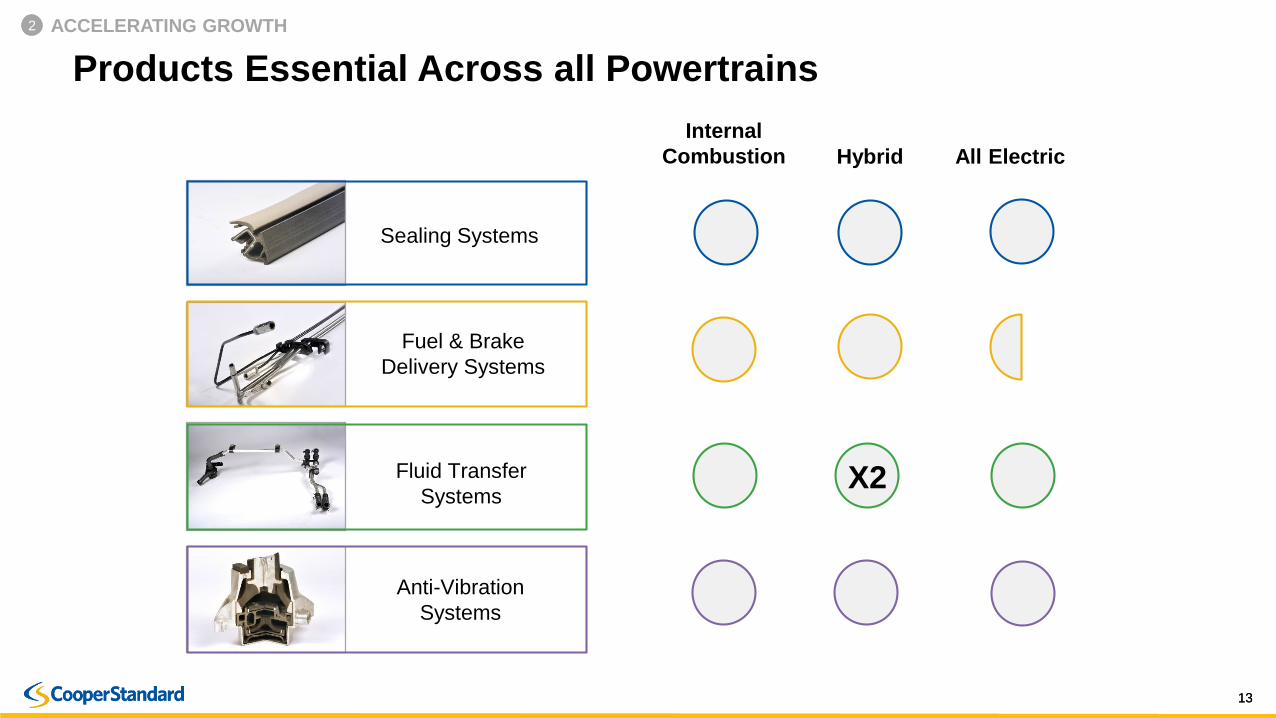
Products Essential Across all Powertrains
X2
Internal
Combustion Hybrid All Electric
Sealing Systems
Fuel & Brake
Delivery Systems
Fluid Transfer
Systems
Anti-Vibration
Systems
2 ACCELERATING GROWTH

1414
2017 Planned New Product/Plant Launches
Q1 Q2 Q3 Q4 Total
North America 7 18 12 7 44
Europe 14 20 19 21 74
Asia Pacific 5 15 13 17 50
South America 0 1 4 0 5
Total 26 54 48 45 173
• Planned launches up nearly 8% vs.
2016
• Majority of new launches are on global
platforms
• Includes both new and replacement
business
• Newly launched business, continued
improvements in operating efficiency
and restructuring savings expected to
drive higher margins in 2H 2017
– 3Q margins subject to typical industry
seasonality
– 4Q margins to benefit most from ramp
up of new launches, operating
efficiencies
2 ACCELERATING GROWTH
1515
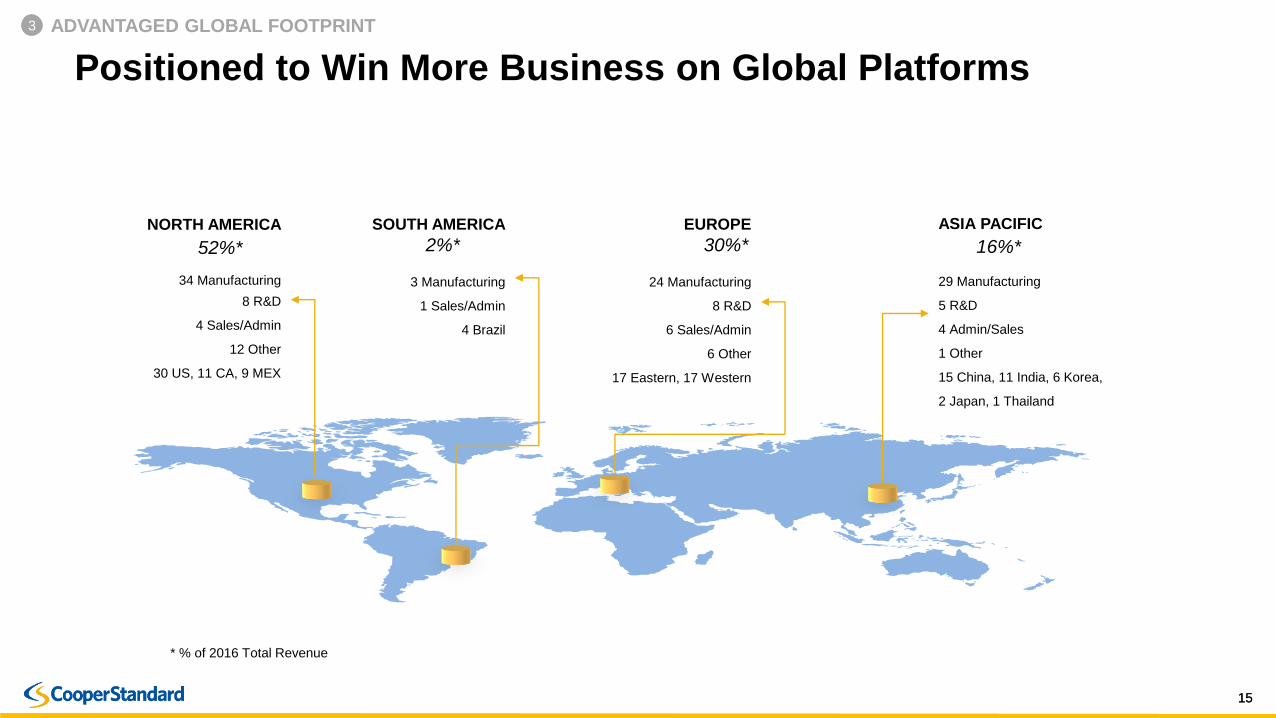
NORTH AMERICA
34 Manufacturing
8 R&D
4 Sales/Admin
12 Other
30 US, 11 CA, 9 MEX
SOUTH AMERICA
3 Manufacturing
1 Sales/Admin
4 Brazil
EUROPE
24 Manufacturing
8 R&D
6 Sales/Admin
6 Other
17 Eastern, 17 Western
ASIA PACIFIC
29 Manufacturing
5 R&D
4 Admin/Sales
1 Other
15 China, 11 India, 6 Korea,
2 Japan, 1 Thailand
Positioned to Win More Business on Global Platforms
52%* 2%* 30%* 16%*
* % of 2016 Total Revenue
3 ADVANTAGED GLOBAL FOOTPRINT
1616
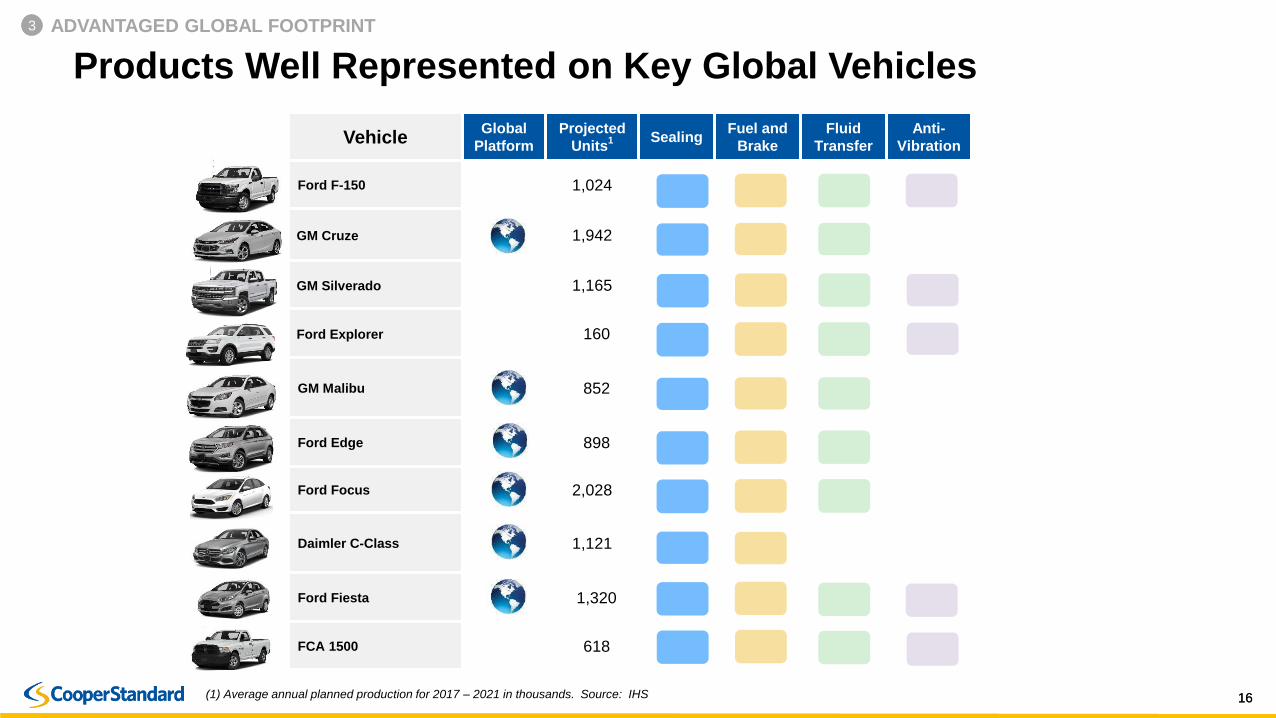
Products Well Represented on Key Global Vehicles
VehicleGlobal
Platform
Projected
Units1 Sealing
Fuel and
Brake
Fluid
Transfer
Anti-
Vibration
Ford F-150 1,024 • • • •
GM Cruze 1,942 • • •
GM Silverado 1,165 • • •
Ford Explorer 160 • • •
GM Malibu 852 • • •
Ford Edge 898 • • •
Ford Focus 2,028 • • •
Daimler C-Class 1,121 • •
Ford Fiesta 1,320 • • • •
FCA 1500 618 • •
(1) Average annual planned production for 2017 – 2021 in thousands. Source: IHS
3 ADVANTAGED GLOBAL FOOTPRINT
1717
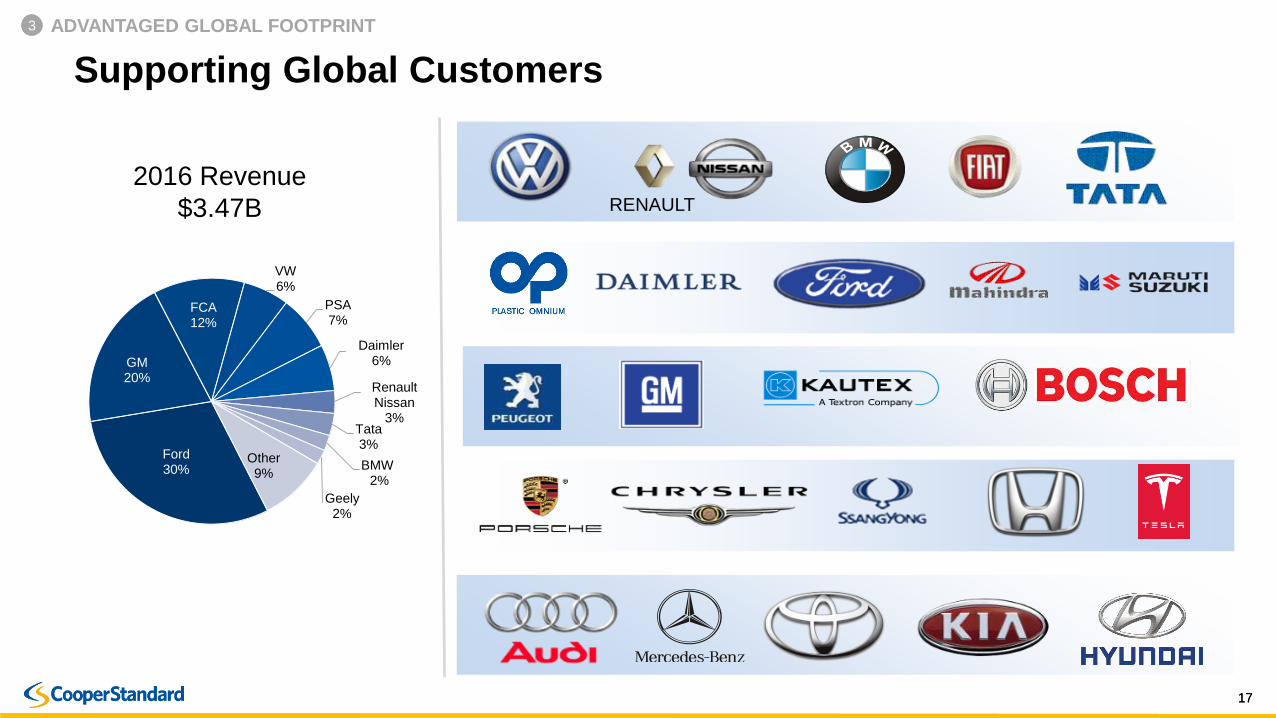
Ford30%
GM20%
FCA12%
VW6%
PSA7%
Daimler6%
Renault Nissan
3%Tata3%
BMW 2%
Geely2%
Other9%
Supporting Global Customers
RENAULT
2016 Revenue
$3.47B
3 ADVANTAGED GLOBAL FOOTPRINT
1818
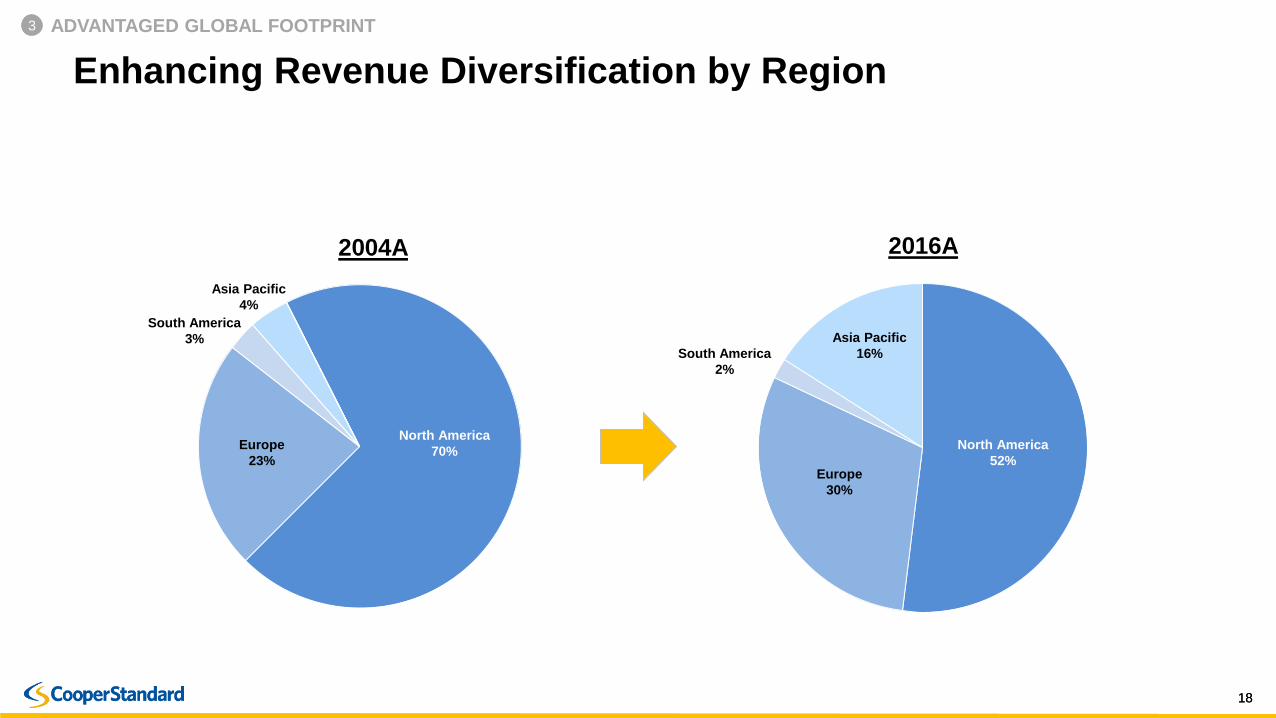
2004A
South America
2%
North America
52%Europe
30%
2016A
Asia Pacific
16%
South America
3%
North America
70%Europe
23%
Asia Pacific
4%
Enhancing Revenue Diversification by Region
3 ADVANTAGED GLOBAL FOOTPRINT
1919
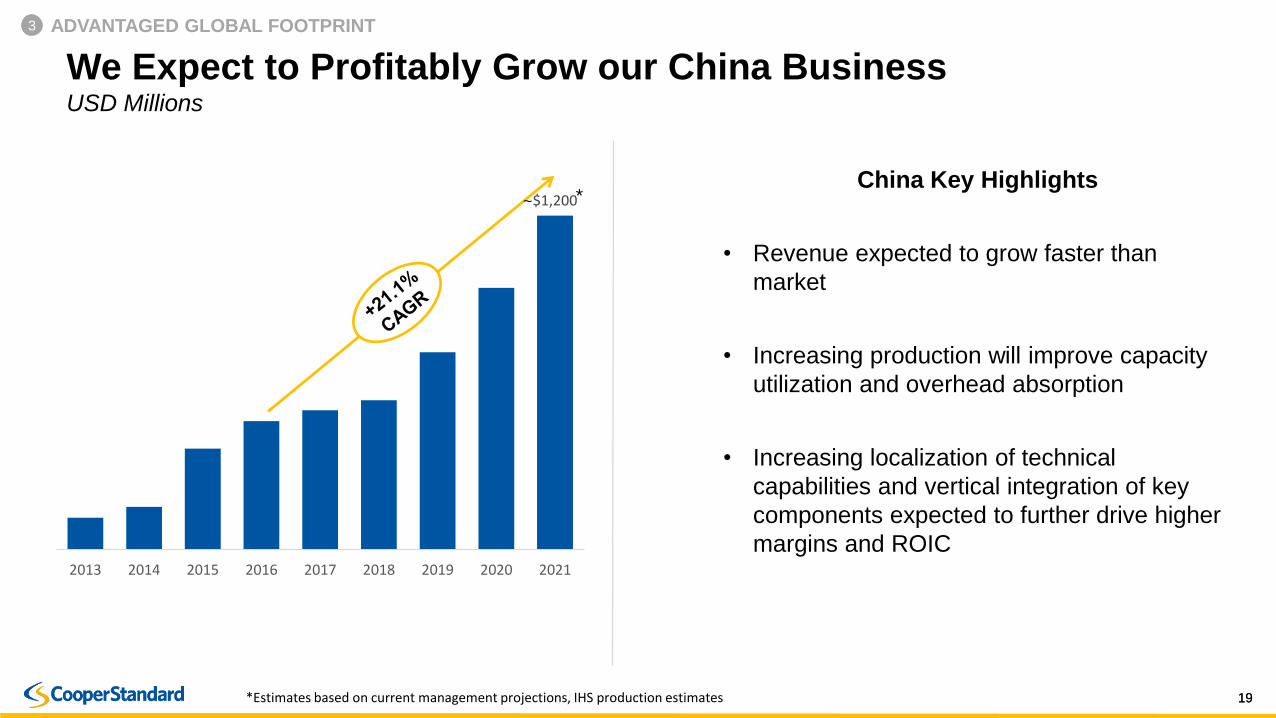
We Expect to Profitably Grow our China BusinessUSD Millions
China Key Highlights
• Revenue expected to grow faster than
market
• Increasing production will improve capacity
utilization and overhead absorption
• Increasing localization of technical
capabilities and vertical integration of key
components expected to further drive higher
margins and ROIC
$1,200
2013 2014 2015 2016 2017 2018 2019 2020 2021
*Estimates based on current management projections, IHS production estimates
~
3 ADVANTAGED GLOBAL FOOTPRINT
*
2020
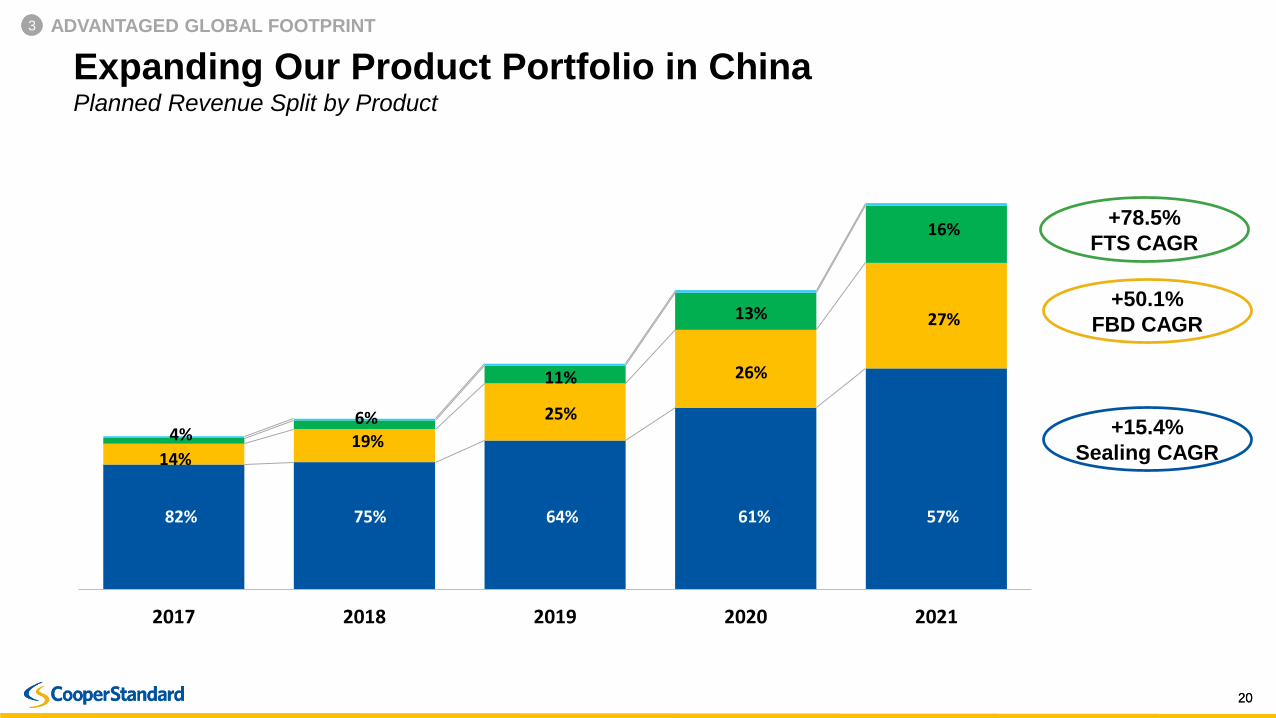
2017 2018 2019 2020 2021
75% 64% 61% 57%
14%19%
25%
26%
27%
4%6%
11%
13%
16%
82%
Expanding Our Product Portfolio in ChinaPlanned Revenue Split by Product
+78.5%
FTS CAGR
+50.1%
FBD CAGR
+15.4%
Sealing CAGR
3 ADVANTAGED GLOBAL FOOTPRINT
2121
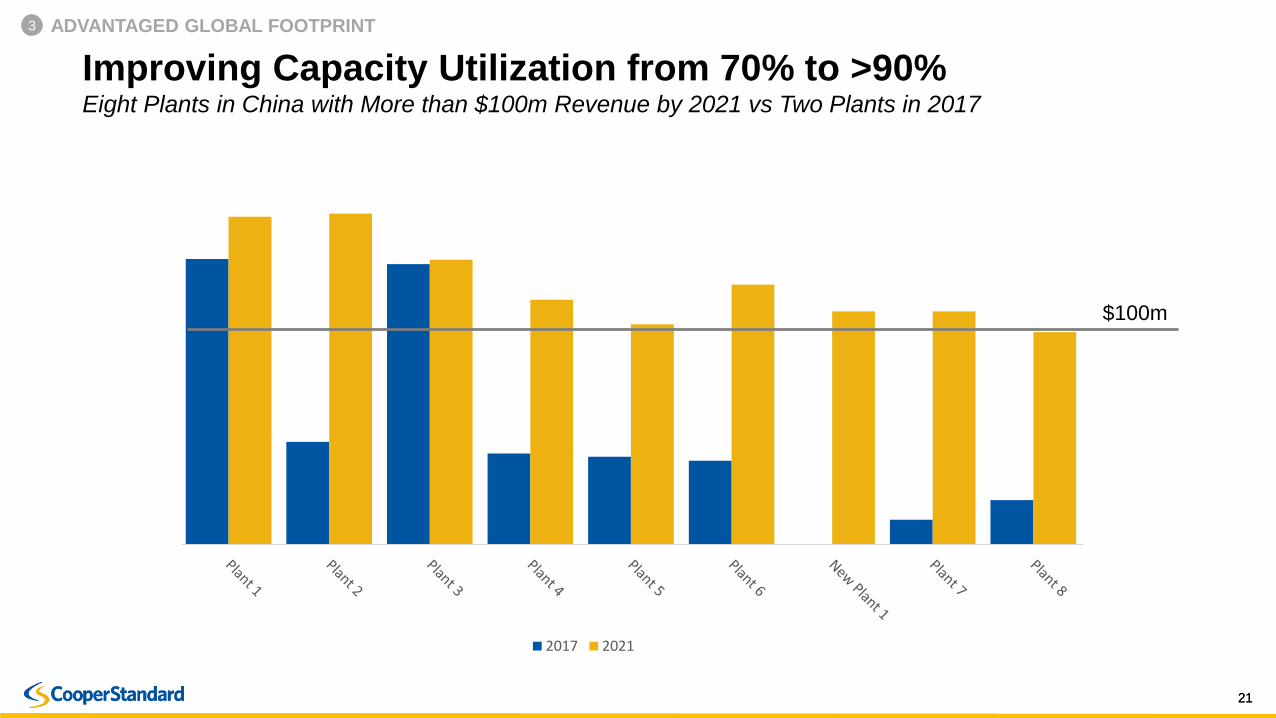
Improving Capacity Utilization from 70% to >90%Eight Plants in China with More than $100m Revenue by 2021 vs Two Plants in 2017
2017 2021
$100m
3 ADVANTAGED GLOBAL FOOTPRINT
2222
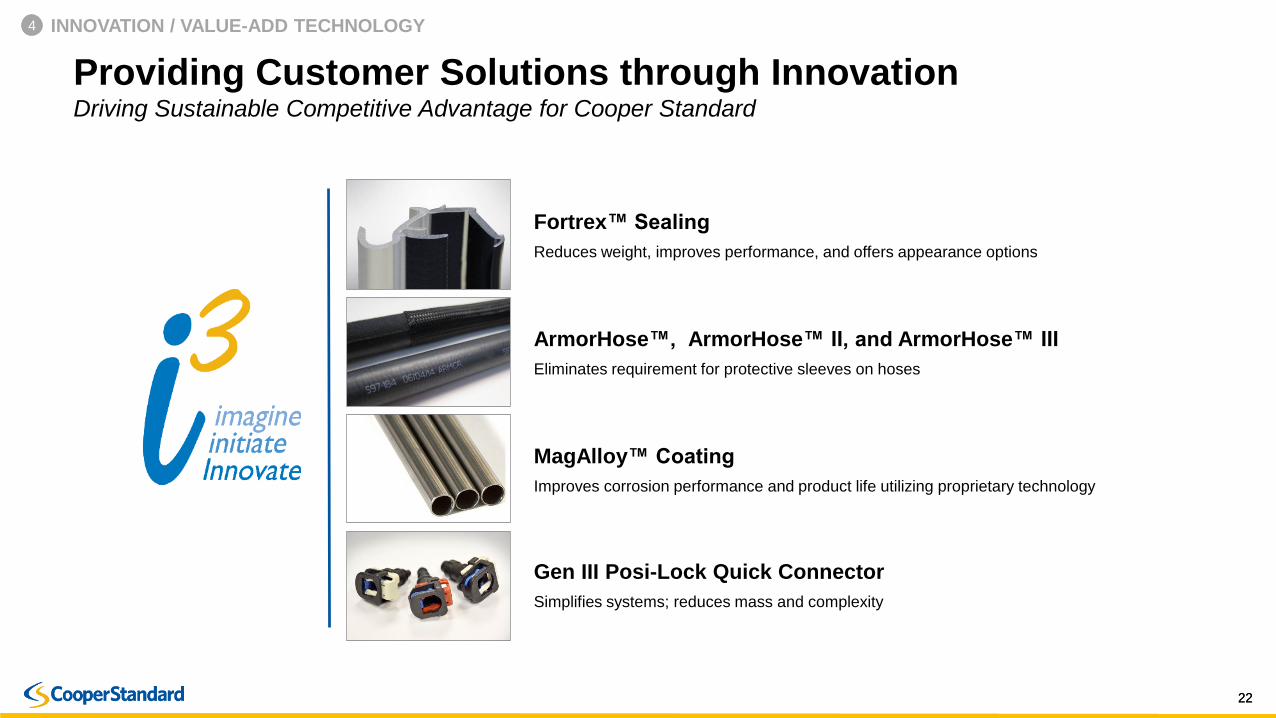
Providing Customer Solutions through InnovationDriving Sustainable Competitive Advantage for Cooper Standard
ArmorHose™, ArmorHose™ II, and ArmorHose™ III
Eliminates requirement for protective sleeves on hoses
MagAlloy™ Coating
Improves corrosion performance and product life utilizing proprietary technology
Fortrex™ Sealing
Reduces weight, improves performance, and offers appearance options
Gen III Posi-Lock Quick Connector
Simplifies systems; reduces mass and complexity
4 INNOVATION / VALUE-ADD TECHNOLOGY
2323
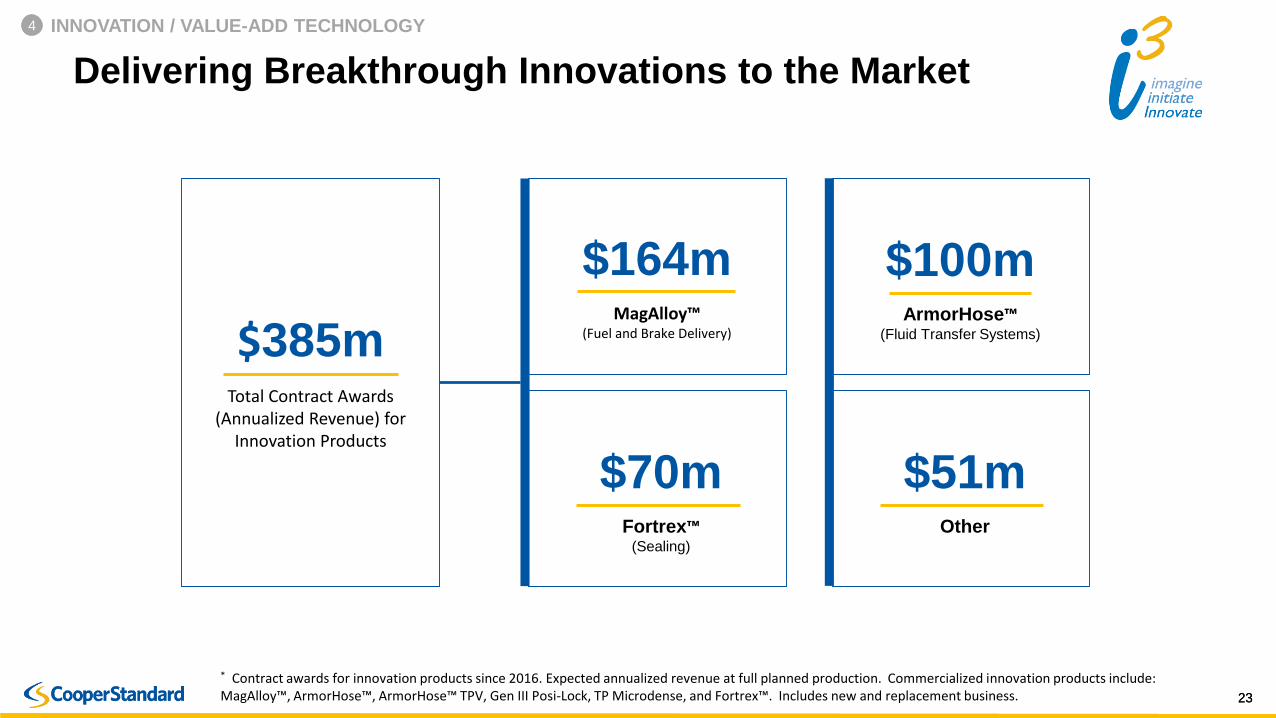
Delivering Breakthrough Innovations to the Market
$164m MagAlloy™
(Fuel and Brake Delivery)
$100m ArmorHose™
(Fluid Transfer Systems)
$70m Fortrex™
(Sealing)
* Contract awards for innovation products since 2016. Expected annualized revenue at full planned production. Commercialized innovation products include: MagAlloy™, ArmorHose™, ArmorHose™ TPV, Gen III Posi-Lock, TP Microdense, and Fortrex™. Includes new and replacement business.
$385mTotal Contract Awards
(Annualized Revenue) for Innovation Products
$51m Other
4 INNOVATION / VALUE-ADD TECHNOLOGY
2424
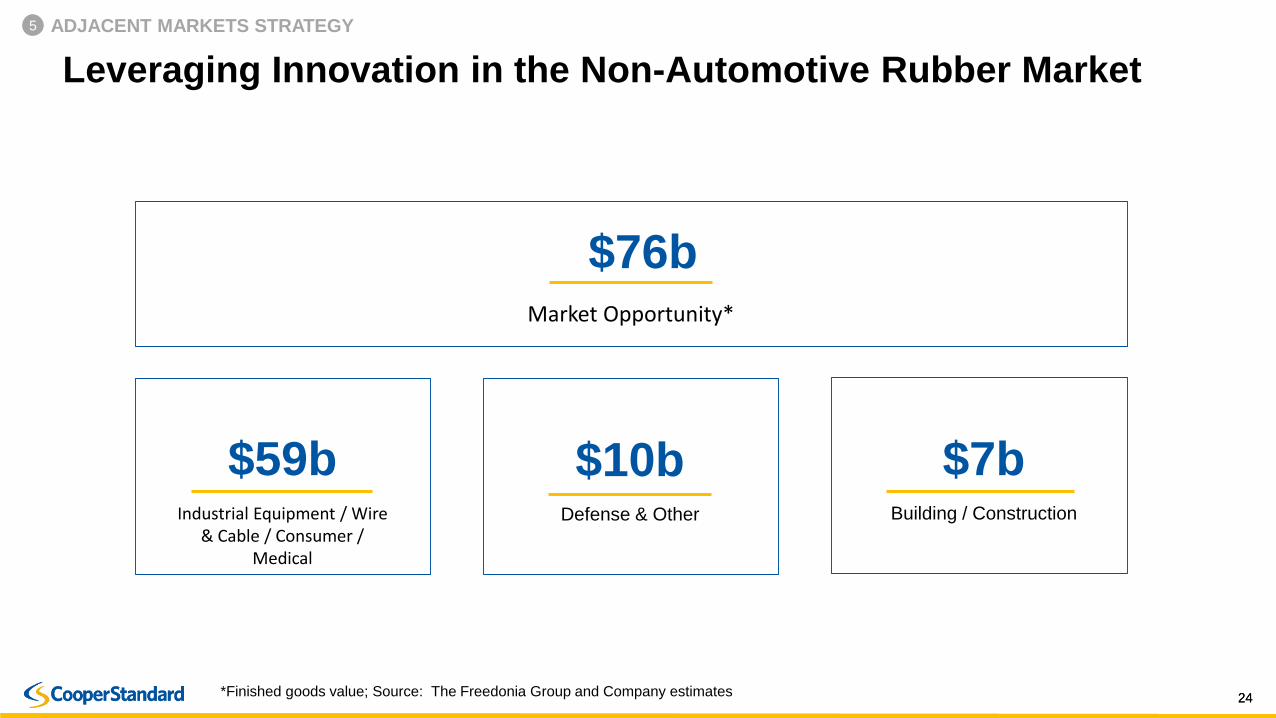
Leveraging Innovation in the Non-Automotive Rubber Market
$59b Industrial Equipment / Wire
& Cable / Consumer / Medical
$10b Defense & Other
$7b Building / Construction
$76bMarket Opportunity*
*Finished goods value; Source: The Freedonia Group and Company estimates
5 ADJACENT MARKETS STRATEGY
2525
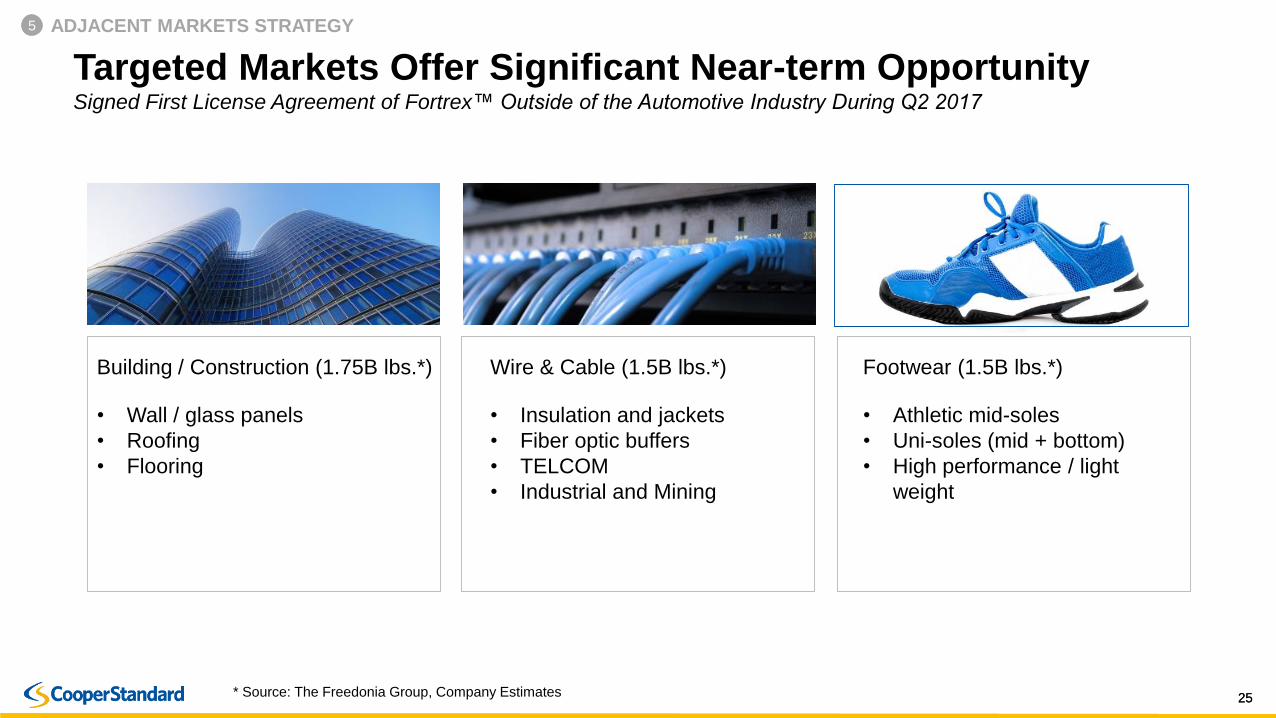
Targeted Markets Offer Significant Near-term OpportunitySigned First License Agreement of Fortrex™ Outside of the Automotive Industry During Q2 2017
Building / Construction (1.75B lbs.*)
• Wall / glass panels
• Roofing
• Flooring
Wire & Cable (1.5B lbs.*)
• Insulation and jackets
• Fiber optic buffers
• TELCOM
• Industrial and Mining
Footwear (1.5B lbs.*)
• Athletic mid-soles
• Uni-soles (mid + bottom)
• High performance / light
weight
* Source: The Freedonia Group, Company Estimates
5 ADJACENT MARKETS STRATEGY
2626
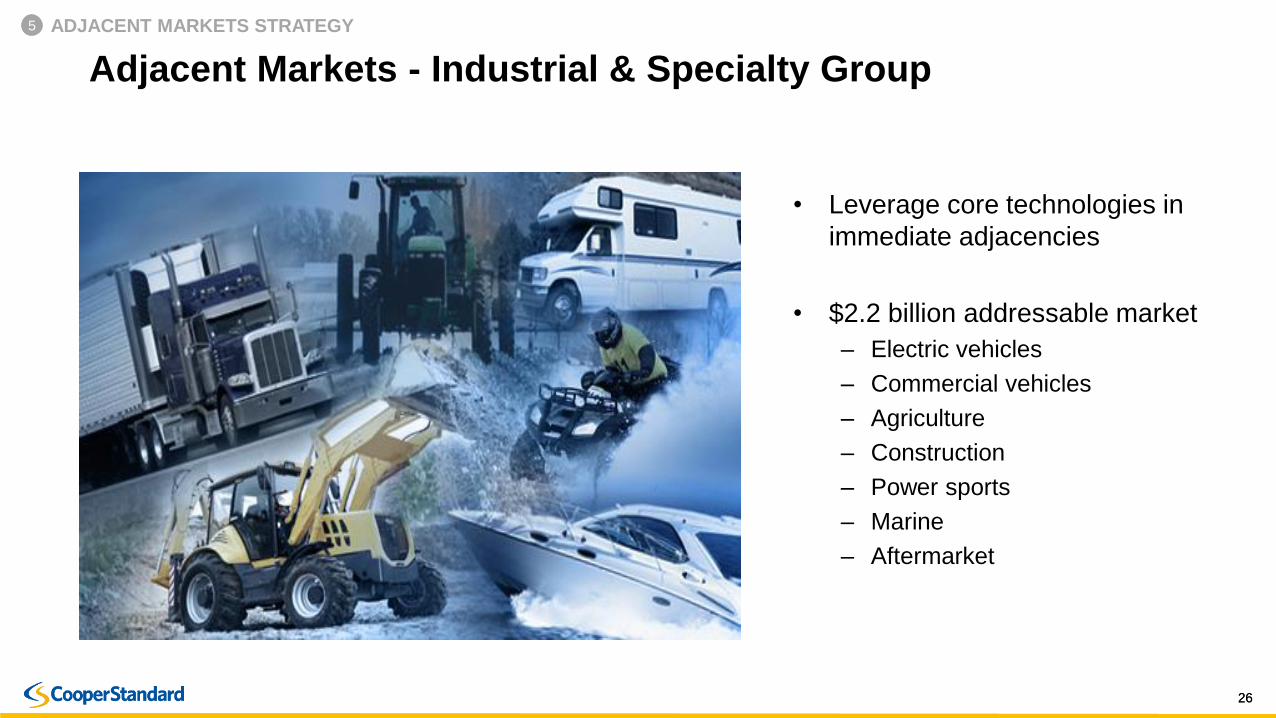
Adjacent Markets - Industrial & Specialty Group
• Leverage core technologies in
immediate adjacencies
• $2.2 billion addressable market
– Electric vehicles
– Commercial vehicles
– Agriculture
– Construction
– Power sports
– Marine
– Aftermarket
5 ADJACENT MARKETS STRATEGY

2727
FINANCIAL OVERVIEW
2828
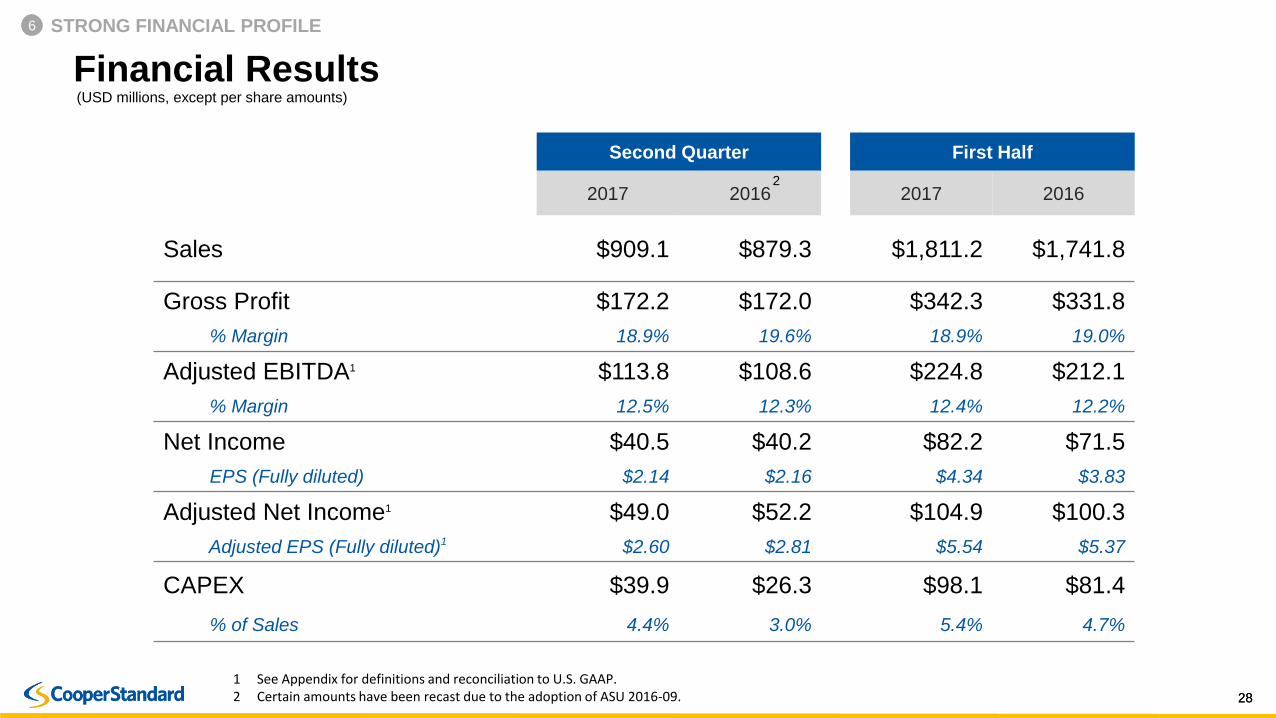
Financial Results
Second Quarter First Half
2017 2016 2017 2016
Sales $909.1 $879.3 $1,811.2 $1,741.8
Gross Profit $172.2 $172.0 $342.3 $331.8
% Margin 18.9% 19.6% 18.9% 19.0%
Adjusted EBITDA1 $113.8 $108.6 $224.8 $212.1
% Margin 12.5% 12.3% 12.4% 12.2%
Net Income $40.5 $40.2 $82.2 $71.5
EPS (Fully diluted) $2.14 $2.16 $4.34 $3.83
Adjusted Net Income1 $49.0 $52.2 $104.9 $100.3
Adjusted EPS (Fully diluted)1 $2.60 $2.81 $5.54 $5.37
CAPEX $39.9 $26.3 $98.1 $81.4
% of Sales 4.4% 3.0% 5.4% 4.7%
(USD millions, except per share amounts)
1 See Appendix for definitions and reconciliation to U.S. GAAP.2 Certain amounts have been recast due to the adoption of ASU 2016-09.
2
6 STRONG FINANCIAL PROFILE
2929
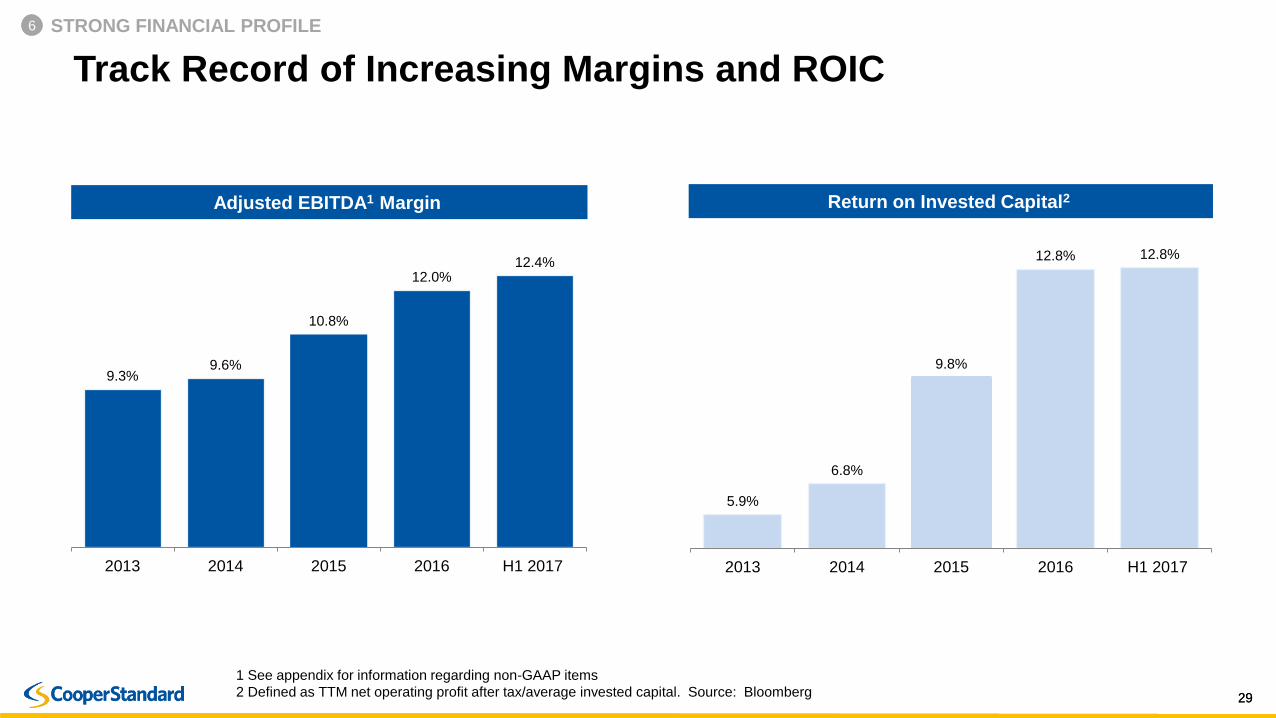
Track Record of Increasing Margins and ROIC
9.3%9.6%
10.8%
12.0%12.4%
2013 2014 2015 2016 H1 2017
5.9%
6.8%
9.8%
12.8% 12.8%
2013 2014 2015 2016 H1 2017
Adjusted EBITDA1 Margin Return on Invested Capital2
1 See appendix for information regarding non-GAAP items
2 Defined as TTM net operating profit after tax/average invested capital. Source: Bloomberg
6 STRONG FINANCIAL PROFILE
3030
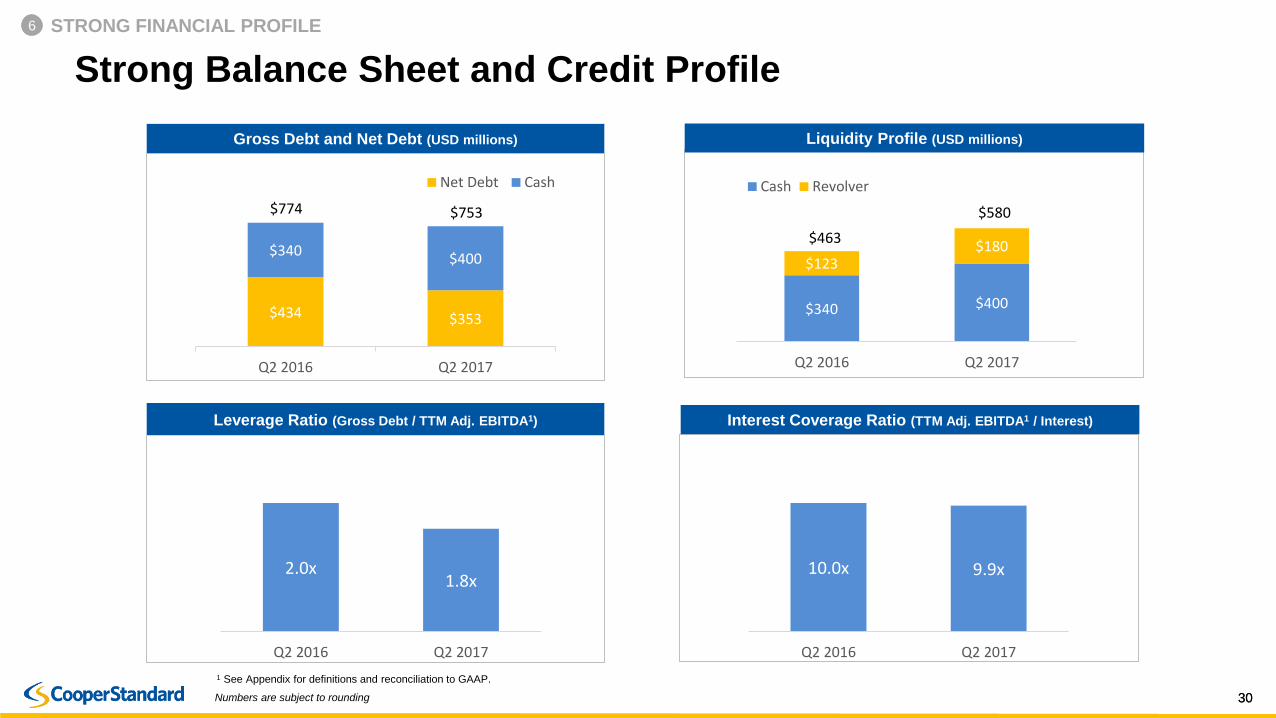
Strong Balance Sheet and Credit Profile
Gross Debt and Net Debt (USD millions)
2.0x1.8x
Q2 2016 Q2 2017
$434 $353
$340$400
Q2 2016 Q2 2017
Net Debt Cash
$774
Leverage Ratio (Gross Debt / TTM Adj. EBITDA1)
Numbers are subject to rounding
1 See Appendix for definitions and reconciliation to GAAP.
Liquidity Profile (USD millions)
10.0x 9.9x
Q2 2016 Q2 2017
Interest Coverage Ratio (TTM Adj. EBITDA1 / Interest)
$340 $400
$123$180
Q2 2016 Q2 2017
Cash Revolver
$580
$463
$753
6 STRONG FINANCIAL PROFILE
3131
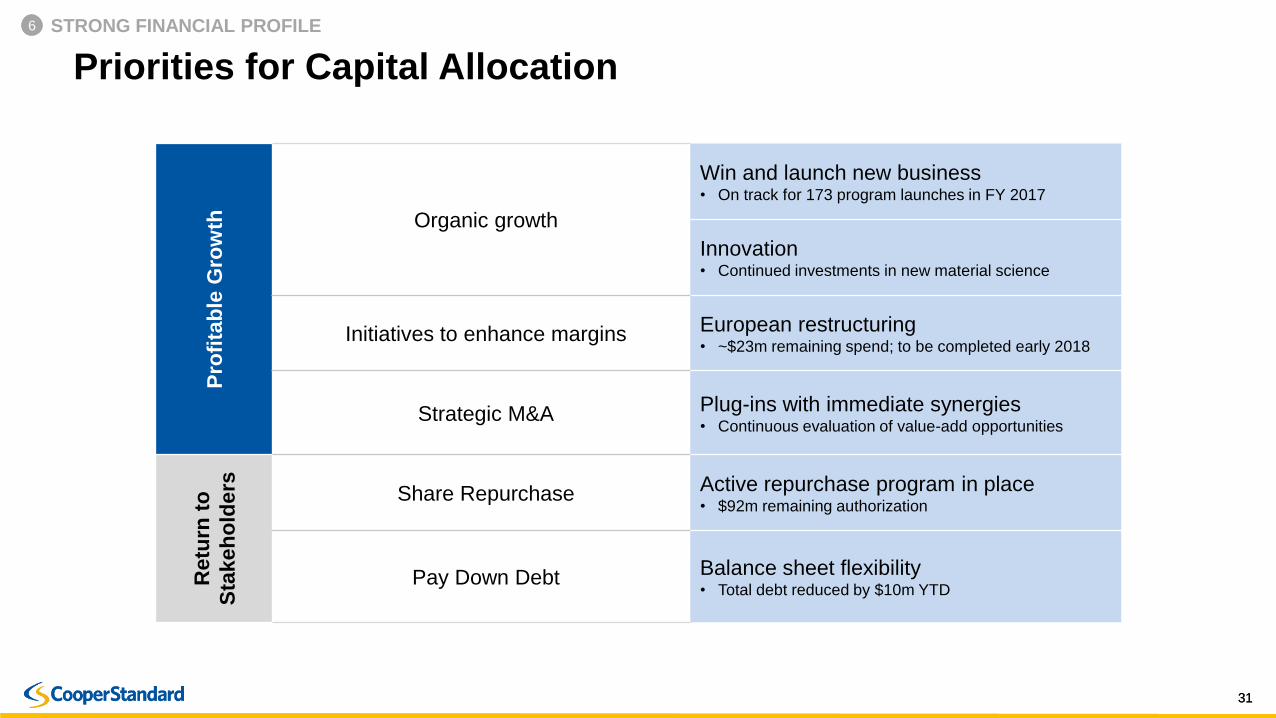
Priorities for Capital Allocation
Pro
fita
ble
Gro
wth Organic growth
Win and launch new business• On track for 173 program launches in FY 2017
Innovation• Continued investments in new material science
Initiatives to enhance margins European restructuring• ~$23m remaining spend; to be completed early 2018
Strategic M&A Plug-ins with immediate synergies• Continuous evaluation of value-add opportunities
Retu
rnto
Sta
keh
old
ers Share Repurchase Active repurchase program in place
• $92m remaining authorization
Pay Down Debt Balance sheet flexibility• Total debt reduced by $10m YTD
6 STRONG FINANCIAL PROFILE
3232
APPENDIX

3333
Non-GAAP Financial MeasuresEBITDA, adjusted EBITDA, adjusted EBITDA margin, adjusted net income, adjusted earnings per share and free cash flow are measures not
recognized under U.S. GAAP and which exclude certain non-cash and special items that may obscure trends and operating performance not indicative
of the Company's core financial activities. Management considers EBITDA, adjusted EBITDA, adjusted EBITDA margin, adjusted net income, adjusted
earnings per share and free cash flow to be key indicators of the Company's operating performance and believes that these and similar measures are
widely used by investors, securities analysts and other interested parties in evaluating the Company's performance. In addition, similar measures are
utilized in the calculation of the financial covenants and ratios contained in the Company’s financing arrangements and management uses these
measures for developing internal budgets and forecasting purposes. EBITDA is defined as net income adjusted to reflect income tax expense, interest
expense net of interest income, depreciation and amortization, and adjusted EBITDA is defined as EBITDA further adjusted to reflect certain items that
management does not consider to be reflective of the Company's core operating performance. Adjusted EBITDA margin is defined as adjusted
EBITDA divided by sales. Adjusted net income is defined as net income adjusted to reflect certain items that management does not consider to be
reflective of the Company's core operating performance. Adjusted basic and diluted earnings per share is defined as adjusted net income and adjusted
diluted net income, respectively, divided by the weighted average number of basic and diluted shares, respectively, outstanding during the period. Free
cash flow is defined as net cash provided by operating activities minus capital expenditures and is useful to both management and investors in
evaluating the Company’s ability to service and repay its debt.
When analyzing the Company’s operating performance, investors should use EBITDA, adjusted EBITDA, adjusted EBITDA margin, adjusted net
income, adjusted earnings per share and free cash flow as supplements to, and not as alternatives for, net income, operating income, or any other
performance measure derived in accordance with U.S. GAAP, and not as an alternative to cash flow from operating activities as a measure of the
Company’s liquidity. EBITDA, adjusted EBITDA, adjusted EBITDA margin, adjusted net income, adjusted earnings per share and free cash flow have
limitations as analytical tools and should not be considered in isolation or as substitutes for analysis of the Company’s results of operations as reported
under U.S. GAAP. Other companies may report EBITDA, adjusted EBITDA, adjusted EBITDA margin, adjusted net income, adjusted earnings per
share and free cash flow differently and therefore the Company's results may not be comparable to other similarly titled measures of other companies.
In addition, in evaluating adjusted EBITDA and adjusted net income, it should be noted that in the future the Company may incur expenses similar to or
in excess of the adjustments in the below presentation. This presentation of adjusted EBITDA and adjusted net income should not be construed as an
inference that the Company's future results will be unaffected by special items. Reconciliations of EBITDA, adjusted EBITDA, adjusted net income,
adjusted earnings per share and free cash flow follow.
3434
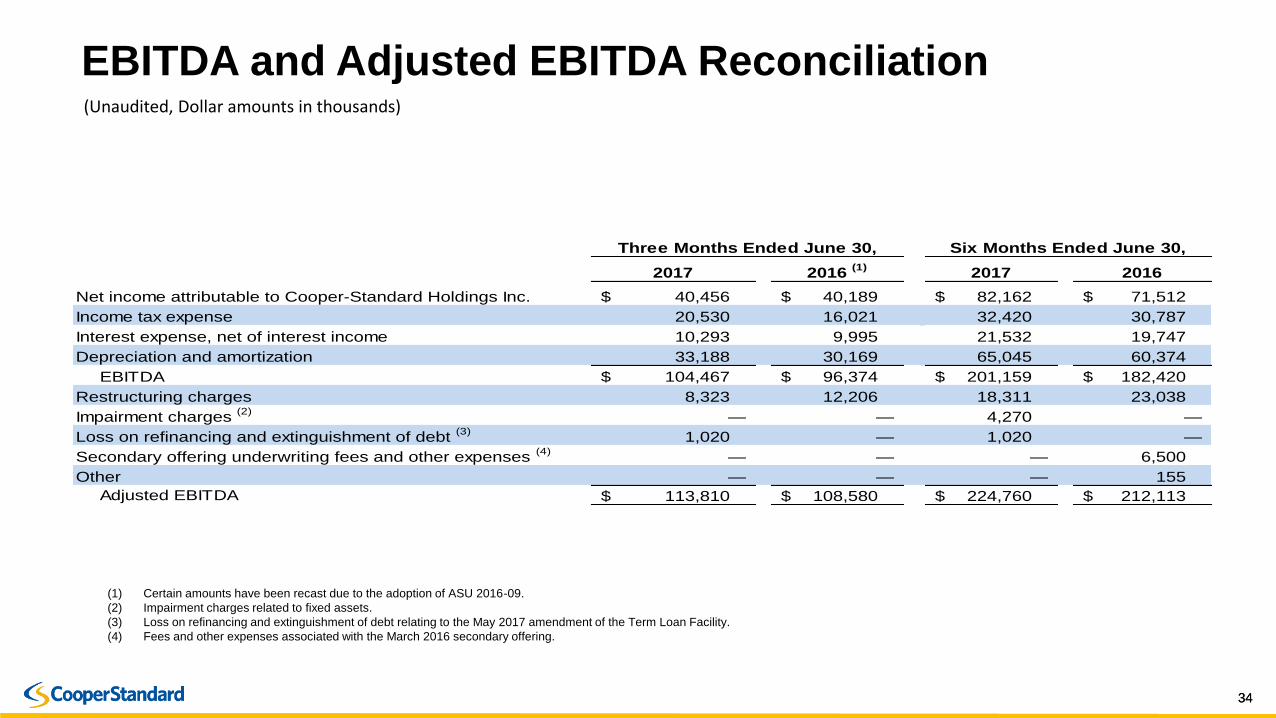
EBITDA and Adjusted EBITDA Reconciliation
(1) Certain amounts have been recast due to the adoption of ASU 2016-09.
(2) Impairment charges related to fixed assets.
(3) Loss on refinancing and extinguishment of debt relating to the May 2017 amendment of the Term Loan Facility.
(4) Fees and other expenses associated with the March 2016 secondary offering.
(Unaudited, Dollar amounts in thousands)
2017 2016 (1)
2017 2016
Net income attributable to Cooper-Standard Holdings Inc. 40,456$ 40,189$ 82,162$ 71,512$
Income tax expense 20,530 16,021 32,420 30,787
Interest expense, net of interest income 10,293 9,995 21,532 19,747
Depreciation and amortization 33,188 30,169 65,045 60,374
EBITDA 104,467$ 96,374$ 201,159$ 182,420$
Restructuring charges 8,323 12,206 18,311 23,038
Impairment charges (2)
— — 4,270 —
Loss on refinancing and extinguishment of debt (3)
1,020 — 1,020 —
Secondary offering underwriting fees and other expenses (4)
— — — 6,500
Other — — — 155
Adjusted EBITDA 113,810$ 108,580$ 224,760$ 212,113$
Three Months Ended June 30, Six Months Ended June 30,
3535
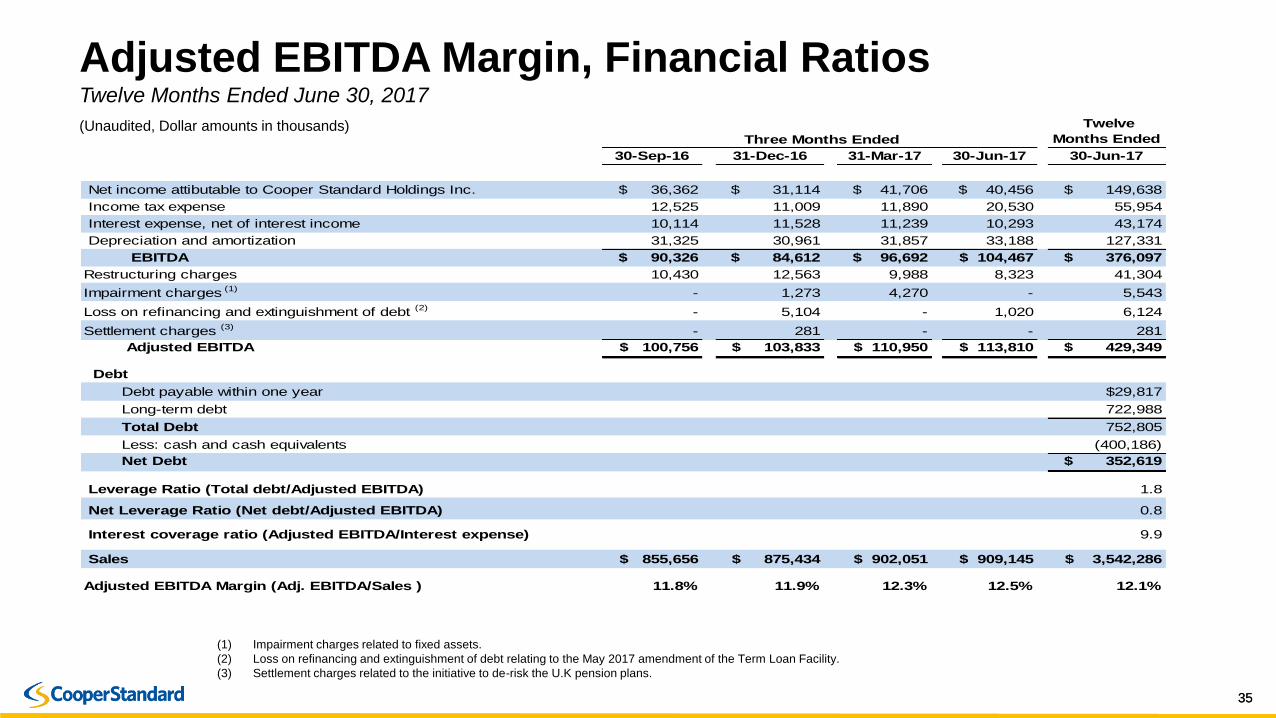
Adjusted EBITDA Margin, Financial RatiosTwelve Months Ended June 30, 2017
(1) Impairment charges related to fixed assets.
(2) Loss on refinancing and extinguishment of debt relating to the May 2017 amendment of the Term Loan Facility.
(3) Settlement charges related to the initiative to de-risk the U.K pension plans.
(Unaudited, Dollar amounts in thousands) Twelve
Months Ended
30-Sep-16 31-Dec-16 31-Mar-17 30-Jun-17 30-Jun-17
Net income attibutable to Cooper Standard Holdings Inc. $ 36,362 $ 31,114 $ 41,706 $ 40,456 $ 149,638
Income tax expense 12,525 11,009 11,890 20,530 55,954
Interest expense, net of interest income 10,114 11,528 11,239 10,293 43,174
Depreciation and amortization 31,325 30,961 31,857 33,188 127,331
EBITDA $ 90,326 $ 84,612 $ 96,692 $ 104,467 $ 376,097
Restructuring charges 10,430 12,563 9,988 8,323 41,304
Impairment charges (1)
- 1,273 4,270 - 5,543
Loss on refinancing and extinguishment of debt (2)
- 5,104 - 1,020 6,124
Settlement charges (3)
- 281 - - 281
Adjusted EBITDA $ 100,756 $ 103,833 $ 110,950 $ 113,810 $ 429,349
Debt
Debt payable within one year $29,817
Long-term debt 722,988
Total Debt 752,805
Less: cash and cash equivalents (400,186)
Net Debt $ 352,619
Leverage Ratio (Total debt/Adjusted EBITDA) 1.8
Net Leverage Ratio (Net debt/Adjusted EBITDA) 0.8
Interest coverage ratio (Adjusted EBITDA/Interest expense) 9.9
Sales $ 855,656 $ 875,434 $ 902,051 $ 909,145 $ 3,542,286
Adjusted EBITDA Margin (Adj. EBITDA/Sales ) 11.8% 11.9% 12.3% 12.5% 12.1%
Three Months Ended
3636
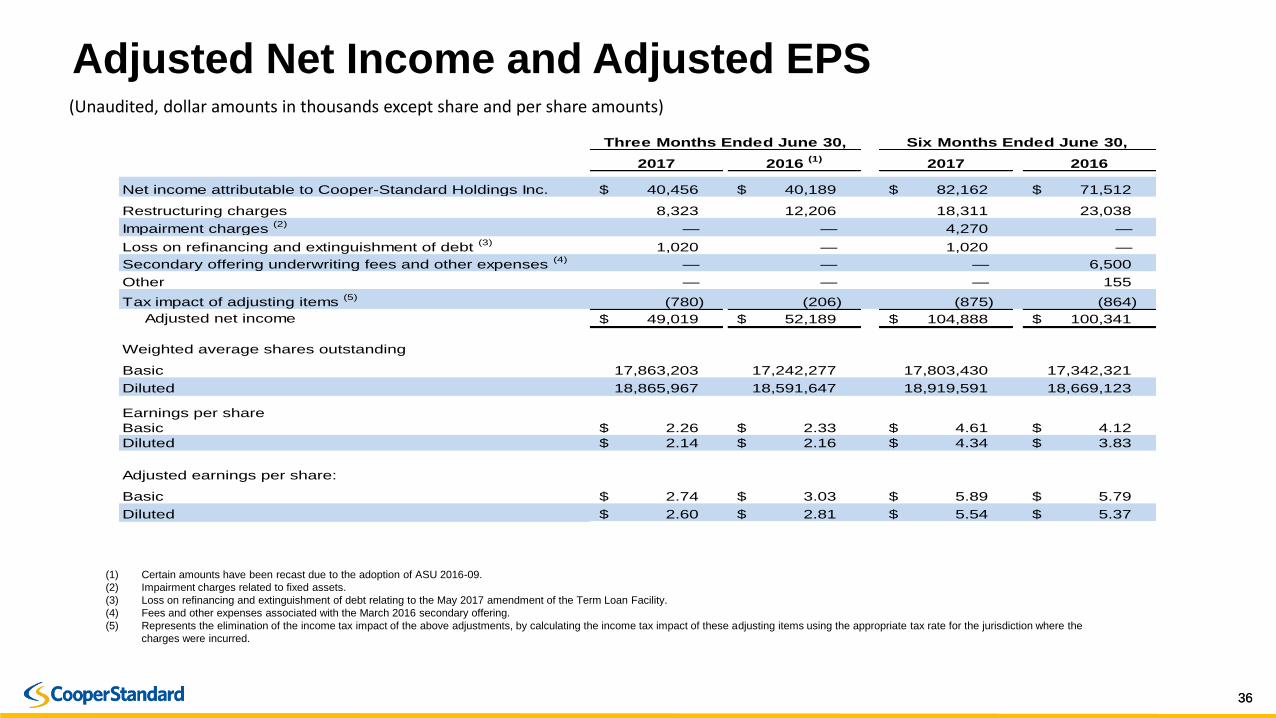
Adjusted Net Income and Adjusted EPS (Unaudited, dollar amounts in thousands except share and per share amounts)
2017 2016 (1)
2017 2016
Net income attributable to Cooper-Standard Holdings Inc. 40,456$ 40,189$ 82,162$ 71,512$
Restructuring charges 8,323 12,206 18,311 23,038
Impairment charges (2)
— — 4,270 —
Loss on refinancing and extinguishment of debt (3)
1,020 — 1,020 —
Secondary offering underwriting fees and other expenses (4)
— — — 6,500
Other — — — 155
Tax impact of adjusting items (5)
(780) (206) (875) (864)
Adjusted net income 49,019$ 52,189$ 104,888$ 100,341$
Weighted average shares outstanding
Basic 17,863,203 17,242,277 17,803,430 17,342,321
Diluted 18,865,967 18,591,647 18,919,591 18,669,123
Earnings per share
Basic 2.26$ 2.33$ 4.61$ 4.12$
Diluted 2.14$ 2.16$ 4.34$ 3.83$
Adjusted earnings per share:
Basic 2.74$ 3.03$ 5.89$ 5.79$
Diluted 2.60$ 2.81$ 5.54$ 5.37$
Three Months Ended June 30, Six Months Ended June 30,
(1) Certain amounts have been recast due to the adoption of ASU 2016-09.
(2) Impairment charges related to fixed assets.
(3) Loss on refinancing and extinguishment of debt relating to the May 2017 amendment of the Term Loan Facility.
(4) Fees and other expenses associated with the March 2016 secondary offering.
(5) Represents the elimination of the income tax impact of the above adjustments, by calculating the income tax impact of these adjusting items using the appropriate tax rate for the jurisdiction where the
charges were incurred.