Embed Size (px)
DESCRIPTION
Driving Relationships, Balances and Profitability T hrough Insurance and Investments. 4. Contact Information. Bob Shibla Strategic Consultant Raddon Financial Group 701 E 22 nd Lombard, IL 60148 Office: 800.827.3500 x6531 [email protected]. - PowerPoint PPT Presentation
Citation preview

©2011 Open Solutions Inc. Raddon Financial Group (RFG) is a business unit of Open Solutions Inc. www.raddon.com | 800.827.3500
Driving Relationships, Balances and Profitability Through
Insurance and Investments
©2011 Open Solutions Inc. Raddon Financial Group (RFG) is a business unit of Open Solutions Inc. www.raddon.com | 800.827.3500
CEO I&IHouseholds Penetration Average
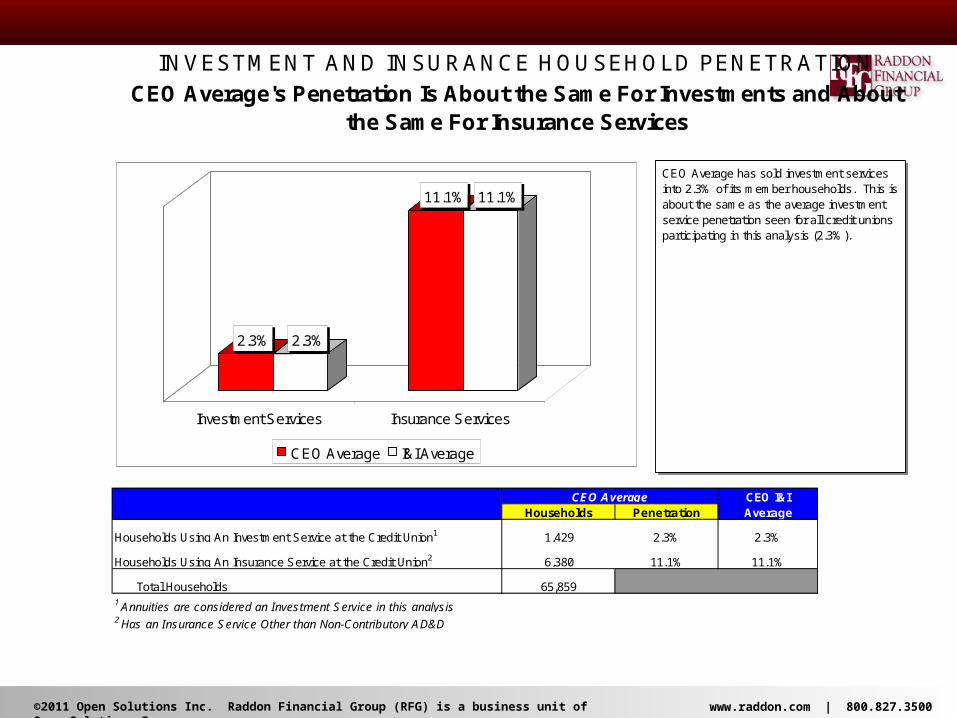
Households Using An Investment Service at the Credit Union1 1,429 2.3% 2.3%
Households Using An Insurance Service at the Credit Union2 6,380 11.1% 11.1%
Total Households 65,8591 Annuities are considered an Investment Service in this analysis2 Has an Insurance Service Other than Non-Contributory AD&D
INVESTMENT AND INSURANCE HOUSEHOLD PENETRATIONCEO Average's Penetration Is About the Same For Investments and About
the Same For Insurance Services
CEO Average
2.3% 2.3%
11.1% 11.1%
Investment Services Insurance Services
CEO Average I&I Average
CEO Average has sold investment services into 2.3% of its member households. This is about the same as the average investment service penetration seen for all credit unions participating in this analysis (2.3%).
The credit union has sold insurance services into 11.1% of its member households. This is about the same as the average insurance service penetration seen for all credit unions participating in this analysis (11.1%).
Note that annuities are defined as an investment product in this analysis.
Households with only a Non-Contributory AD&D Policy are not considered an Insurance Household in this analysis.
©2011 Open Solutions Inc. Raddon Financial Group (RFG) is a business unit of Open Solutions Inc. www.raddon.com | 800.827.3500
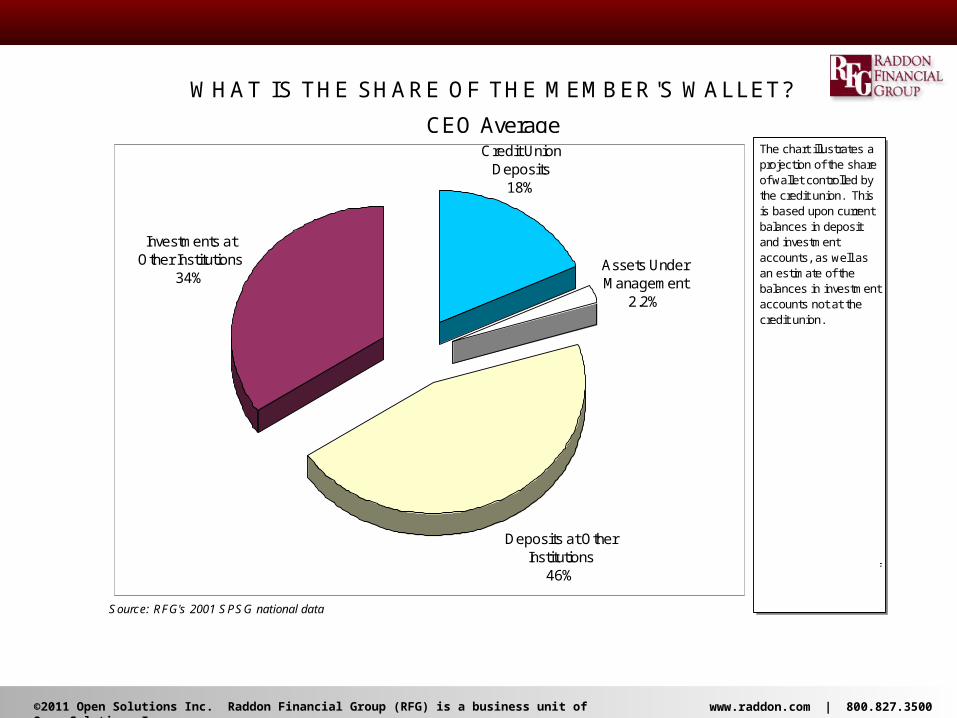
Source: RFG's 2001 SPSG national data
WHAT IS THE SHARE OF THE MEMBER'S WALLET?
CEO Average
Deposits at Other Institutions
46%
Investments at Other Institutions
34%Assets Under Management
2.2%
Credit Union Deposits
18%
The chart illustrates a projection of the share of wallet controlled by the credit union. This is based upon current balances in deposit and investment accounts, as well as an estimate of the balances in investment accounts not at the credit union.
It is estimated that deposits at the credit union represent approximately 18% of the member's wallet.
Assets under management at the credit union are estimated to equal 2.2% of the typical member's assets.
Investments at other institutions is projected to be 34% of the typical member's wallet.
©2011 Open Solutions Inc. Raddon Financial Group (RFG) is a business unit of Open Solutions Inc. www.raddon.com | 800.827.3500
Total Net Income Deposits Loans Investments Insurance Total Income
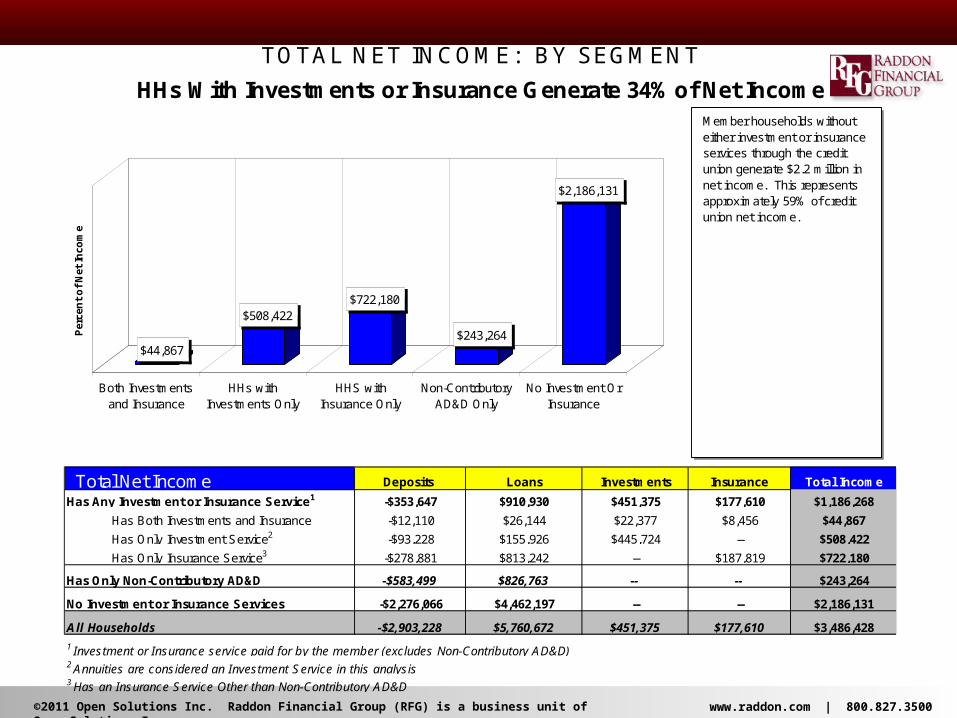
Has Any Investment or Insurance Service1 -$353,647 $910,930 $451,375 $177,610 $1,186,268
Has Both Investments and Insurance -$12,110 $26,144 $22,377 $8,456 $44,867
Has Only Investment Service2 -$93,228 $155,926 $445,724 -- $508,422
Has Only Insurance Service3 -$278,881 $813,242 -- $187,819 $722,180
Has Only Non-Contributory AD&D -$583,499 $826,763 -- -- $243,264
No Investment or Insurance Services -$2,276,066 $4,462,197 -- -- $2,186,131
All Households -$2,903,228 $5,760,672 $451,375 $177,610 $3,486,428
1 Investment or Insurance service paid for by the member (excludes Non-Contributory AD&D)2 Annuities are considered an Investment Service in this analysis3 Has an Insurance Service Other than Non-Contributory AD&D
TOTAL NET INCOME: BY SEGMENT
HHs With Investments or Insurance Generate 34% of Net IncomeMember households without either investment or insurance services through the credit union generate $2.2 million in net income. This represents approximately 59% of credit union net income.
Households that have purchased investment or insurance services through the credit union generate $1.2 million in net income, or 34% of credit union net income.
This represents income from both deposit and loan services as well as income generated by the sale of investments and insurance products.
$44,867
$508,422$722,180
$243,264
$2,186,131
Per
cen
t o
f N
et In
com
e
Both Investmentsand Insurance
HHs withInvestments Only
HHS withInsurance Only
Non-ContributoryAD&D Only
No Investment OrInsurance
©2011 Open Solutions Inc. Raddon Financial Group (RFG) is a business unit of Open Solutions Inc. www.raddon.com | 800.827.3500
Percent of Households
Percent of Net
Income3Percent of
Households
Percent of Net
Income3
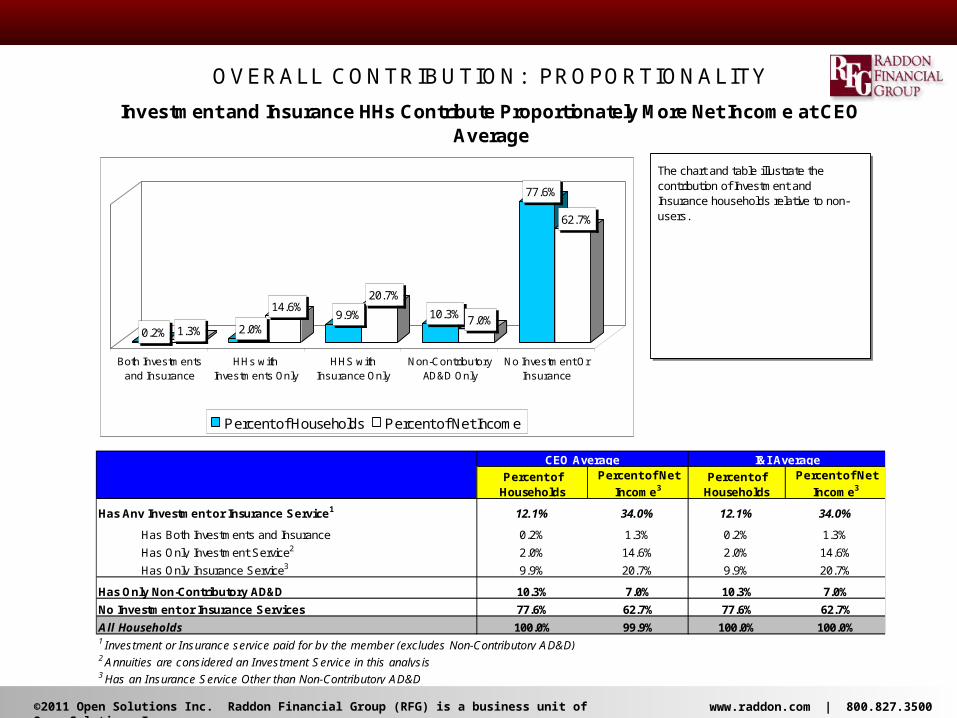
Has Any Investment or Insurance Service1 12.1% 34.0% 12.1% 34.0%
Has Both Investments and Insurance 0.2% 1.3% 0.2% 1.3%
Has Only Investment Service2 2.0% 14.6% 2.0% 14.6%
Has Only Insurance Service3 9.9% 20.7% 9.9% 20.7%
Has Only Non-Contributory AD&D 10.3% 7.0% 10.3% 7.0%
No Investment or Insurance Services 77.6% 62.7% 77.6% 62.7%
All Households 100.0% 99.9% 100.0% 100.0%1 Investment or Insurance service paid for by the member (excludes Non-Contributory AD&D)2 Annuities are considered an Investment Service in this analysis3 Has an Insurance Service Other than Non-Contributory AD&D
Investment and Insurance HHs Contribute Proportionately More Net Income at CEO Average
I&I AverageCEO Average
OVERALL CONTRIBUTION: PROPORTIONALITY
0.2% 1.3% 2.0%
14.6%9.9%
20.7%
10.3% 7.0%
77.6%
62.7%
Both Investmentsand Insurance
HHs withInvestments Only
HHS withInsurance Only
Non-ContributoryAD&D Only
No Investment OrInsurance
Percent of Households Percent of Net Income
The chart and table illustrate the contribution of Investment and Insurance households relative to non-users.
While 12% of member households have investment or insurance services through the credit union, these households generate 34% of the credit union's net income. These households are responsible for a disproportionately high share of net income.
©2011 Open Solutions Inc. Raddon Financial Group (RFG) is a business unit of Open Solutions Inc. www.raddon.com | 800.827.3500
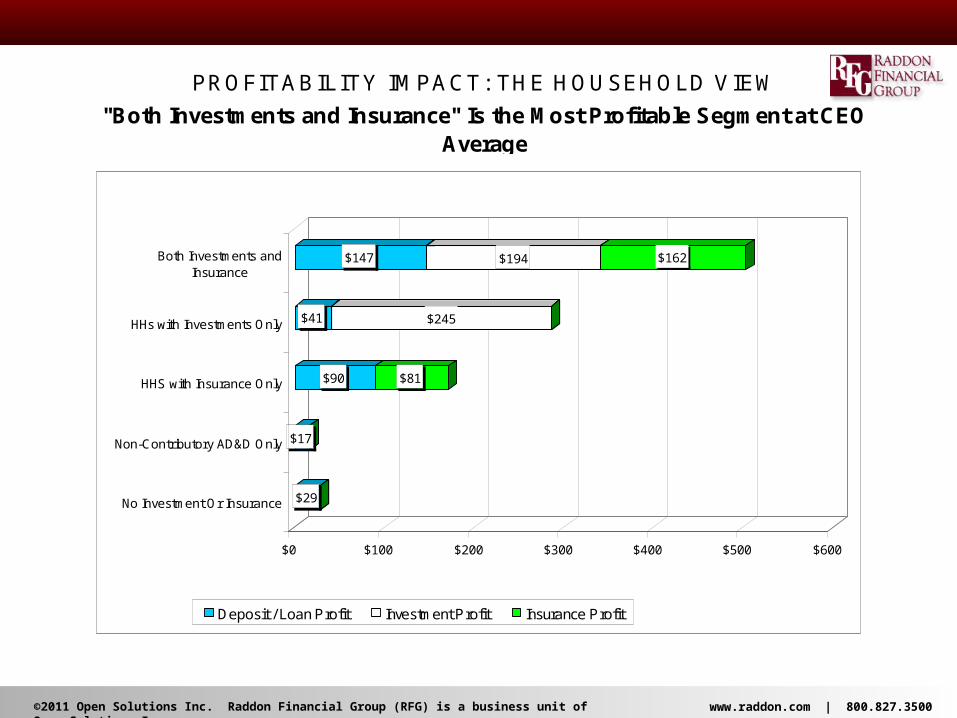
PROFITABILITY IMPACT: THE HOUSEHOLD VIEW
"Both Investments and Insurance" Is the Most Profitable Segment at CEO Average
$29
$17
$90 $81
$41 $245
$147 $194 $162
$0 $100 $200 $300 $400 $500 $600
Both Investments andInsurance
HHs with Investments Only
HHS with Insurance Only
Non-Contributory AD&D Only
No Investment Or Insurance
Deposit / Loan Profit Investment Profit Insurance Profit
©2011 Open Solutions Inc. Raddon Financial Group (RFG) is a business unit of Open Solutions Inc. www.raddon.com | 800.827.3500
Net Income per Household All Households
Has Both Investments and
Insurance
Has Only Investment
Service
Has Only Insurance Service
Has Only Non-Contributory
AD&D
No Investment or Insurance Services
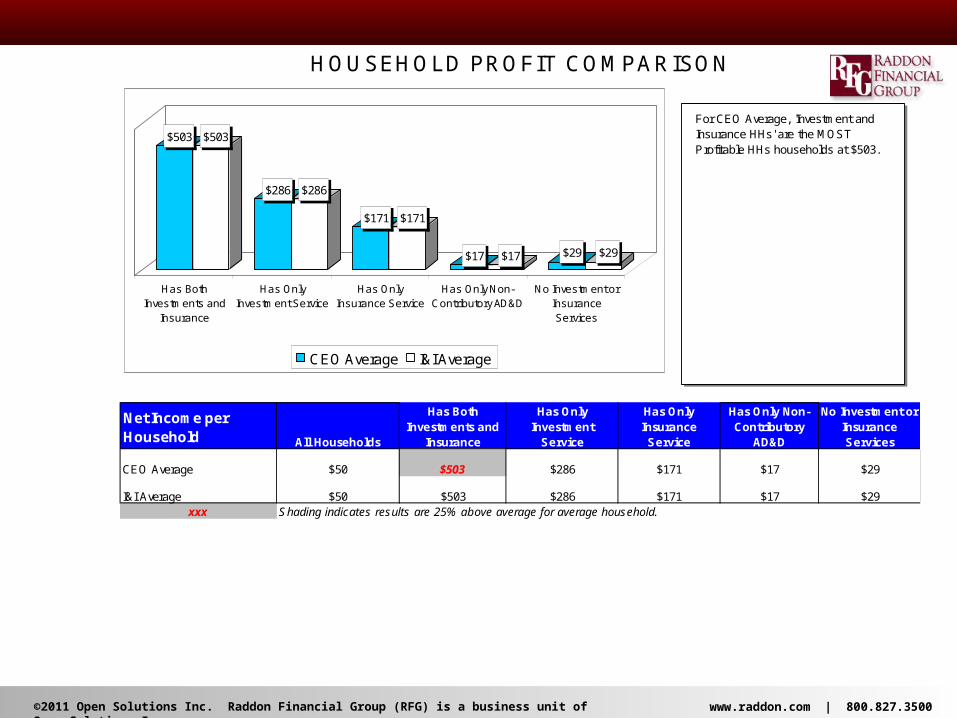
CEO Average $50 $503 $286 $171 $17 $29
I&I Average $50 $503 $286 $171 $17 $29xxx Shading indicates results are 25% above average for average household.
HOUSEHOLD PROFIT COMPARISON
$503 $503
$286 $286
$171 $171
$17 $17 $29 $29
Has BothInvestments and
Insurance
Has OnlyInvestment Service
Has OnlyInsurance Service
Has Only Non-Contributory AD&D
No Investment orInsuranceServices
CEO Average I&I Average
For CEO Average, 'Investment and Insurance HHs' are the MOST Profitable HHs households at $503.
'Only Non-Contributory AD&D HHs' are the LEAST Profitable HHs households at $17.
How Do The Results for CEO Average Compare With Other Credit Unions?
The following page shows the profit detail (deposits, loans, investments, and insurance) with comparisons to the CEO I&I Average.
©2011 Open Solutions Inc. Raddon Financial Group (RFG) is a business unit of Open Solutions Inc. www.raddon.com | 800.827.3500
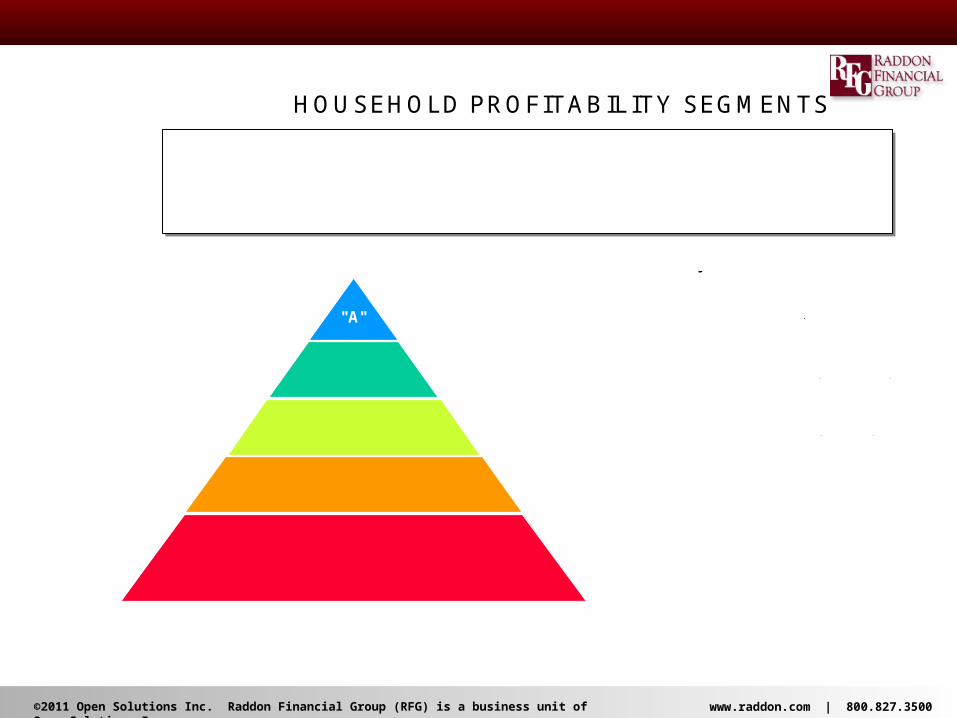
HOUSEHOLD PROFITABILITY SEGMENTS
"A" Annual Net Income exceeds $500
"B"
"C"
"D"
"E"
Annual Net Income is between $1 and $99
Annual Net Income is less than -$100
Annual Net Income is between $0 and -$100
Annual Net Income is between $100 and $499
The "A" to "E" segmentation looks exclusively at household net income - the value of the household to the credit union each year. It is not a measure of the credit worthiness of a household. "A" households are most profitable, and "E" households are the least profitable.
Definition
©2011 Open Solutions Inc. Raddon Financial Group (RFG) is a business unit of Open Solutions Inc. www.raddon.com | 800.827.3500
Percent of Member Households All Households
Has Both Investments and
Insurance
Has Only Investment
Service
Has Only Insurance Service
Has Only Non-Contributory
AD&D
No Investment or Insurance Services
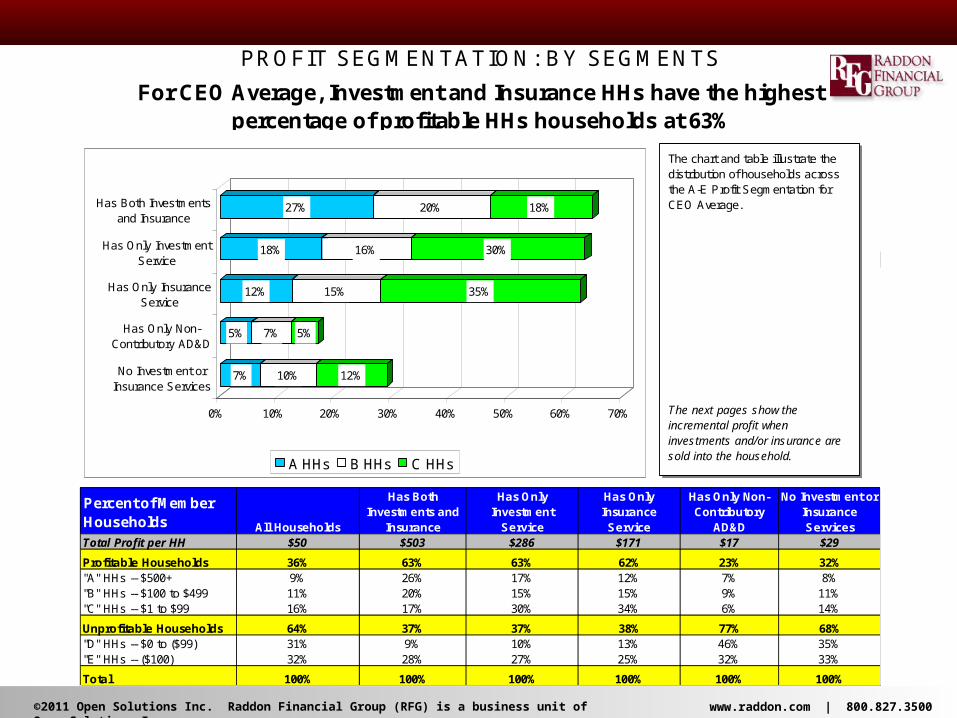
Total Profit per HH $50 $503 $286 $171 $17 $29
Profitable Households 36% 63% 63% 62% 23% 32%"A" HHs -- $500+ 9% 26% 17% 12% 7% 8%"B" HHs -- $100 to $499 11% 20% 15% 15% 9% 11%"C" HHs -- $1 to $99 16% 17% 30% 34% 6% 14%
Unprofitable Households 64% 37% 37% 38% 77% 68%"D" HHs -- $0 to ($99) 31% 9% 10% 13% 46% 35%"E" HHs -- ($100) 32% 28% 27% 25% 32% 33%
Total 100% 100% 100% 100% 100% 100%
PROFIT SEGMENTATION: BY SEGMENTS
For CEO Average, Investment and Insurance HHs have the highest percentage of profitable HHs households at 63%
7% 10% 12%
5% 7% 5%
12% 15% 35%
18% 16% 30%
27% 20% 18%
0% 10% 20% 30% 40% 50% 60% 70%
Has Both Investmentsand Insurance
Has Only InvestmentService
Has Only InsuranceService
Has Only Non-Contributory AD&D
No Investment orInsurance Services
A HHs B HHs C HHs
The chart and table illustrate the distribution of households across the A-E Profit Segmentation for CEO Average.
For households with BOTH investment and insurance services, 63% of households are profitable. The percent that are extremely profitable ('A' status) is 26%.
Compare this to HHs with no investment or insurance services, the percent profitable is 32%, and 8% are 'A' households.
1 1 1
0 0.5 1 1.5 2 2.5 3
1
#REF! #REF! #REF!
3 0% 9 0%2 3 % 7 4 %
2 5 % 1 01 %
2 7 % 1 01 %
2 9 % 1 02 % 1
0% 5 0% 1 00% 1 5 0% 2 00% 2 5 0%
9 %
3 1 %
E HHs #REF!
The next pages show the incremental profit when investments and/or insurance are sold into the household.
©2011 Open Solutions Inc. Raddon Financial Group (RFG) is a business unit of Open Solutions Inc. www.raddon.com | 800.827.3500
Total HH RelationshipAll Households
Has Both Investments and
Insurance
Has Only Investment
Service
Has Only Insurance Service
Has Only Non-Contributory
AD&D
No Investment or Insurance Services
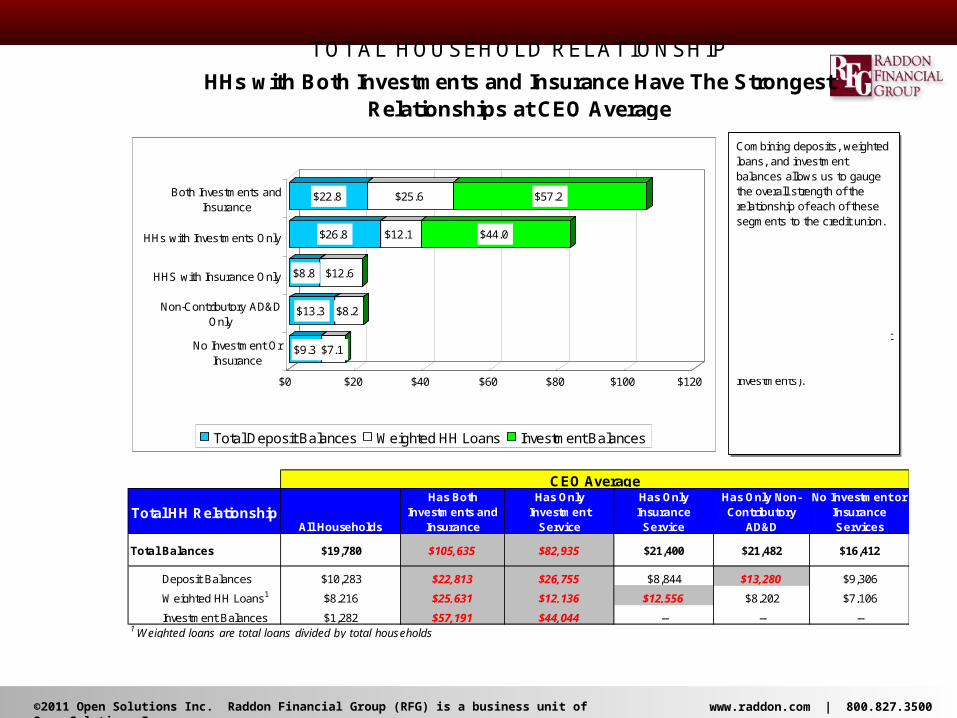
Total Balances $19,780 $105,635 $82,935 $21,400 $21,482 $16,412
Deposit Balances $10,283 $22,813 $26,755 $8,844 $13,280 $9,306
Weighted HH Loans1 $8,216 $25,631 $12,136 $12,556 $8,202 $7,106
Investment Balances $1,282 $57,191 $44,044 -- -- --1 Weighted loans are total loans divided by total households
CEO Average
HHs with Both Investments and Insurance Have The Strongest Relationships at CEO Average
TOTAL HOUSEHOLD RELATIONSHIP
$9.3 $7.1
$13.3 $8.2
$8.8 $12.6
$26.8 $12.1 $44.0
$22.8 $25.6 $57.2
$0 $20 $40 $60 $80 $100 $120
Both Investments andInsurance
HHs with Investments Only
HHS with Insurance Only
Non-Contributory AD&DOnly
No Investment OrInsurance
Total Deposit Balances Weighted HH Loans Investment Balances
Combining deposits, weighted loans, and investment balances allows us to gauge the overall strength of the relationship of each of these segments to the credit union.
Which of the segments has the strongest overall relationship with the credit union? The chart shows that HHs with Both Investments and Insurance have the largest total balances (combining deposits, loans, and investments).
The overall relationship totals $105,635 in balances for this segment.
©2011 Open Solutions Inc. Raddon Financial Group (RFG) is a business unit of Open Solutions Inc. www.raddon.com | 800.827.3500
Services per Household
All Households
Has Both Investments and
Insurance
Has Only Investment
Service
Has Only Insurance Service
Has Only Non-Contributory
AD&D
No Investment or Insurance Services
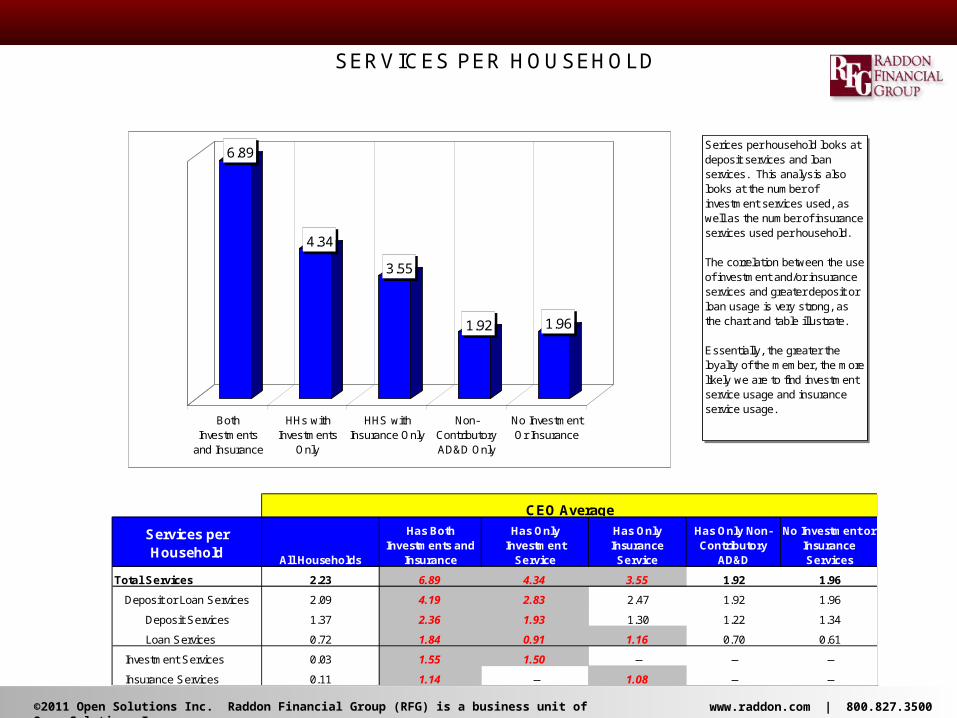
Total Services 2.23 6.89 4.34 3.55 1.92 1.96
Deposit or Loan Services 2.09 4.19 2.83 2.47 1.92 1.96
Deposit Services 1.37 2.36 1.93 1.30 1.22 1.34
Loan Services 0.72 1.84 0.91 1.16 0.70 0.61
Investment Services 0.03 1.55 1.50 -- -- --
Insurance Services 0.11 1.14 -- 1.08 -- --
CEO Average
SERVICES PER HOUSEHOLD
6.89
4.34
3.55
1.92 1.96
BothInvestments
and Insurance
HHs withInvestments
Only
HHS withInsurance Only
Non-ContributoryAD&D Only
No InvestmentOr Insurance
Serices per household looks at deposit services and loan services. This analysis also looks at the number of investment services used, as well as the number of insurance services used per household.
The correlation between the use of investment and/or insurance services and greater deposit or loan usage is very strong, as the chart and table illustrate.
Essentially, the greater the loyalty of the member, the more likely we are to find investment service usage and insurance service usage.

©2011 Open Solutions Inc. Raddon Financial Group (RFG) is a business unit of Open Solutions Inc. www.raddon.com | 800.827.3500
CEO Average
INVESTMENT SERVICES
©2011 Open Solutions Inc. Raddon Financial Group (RFG) is a business unit of Open Solutions Inc. www.raddon.com | 800.827.3500
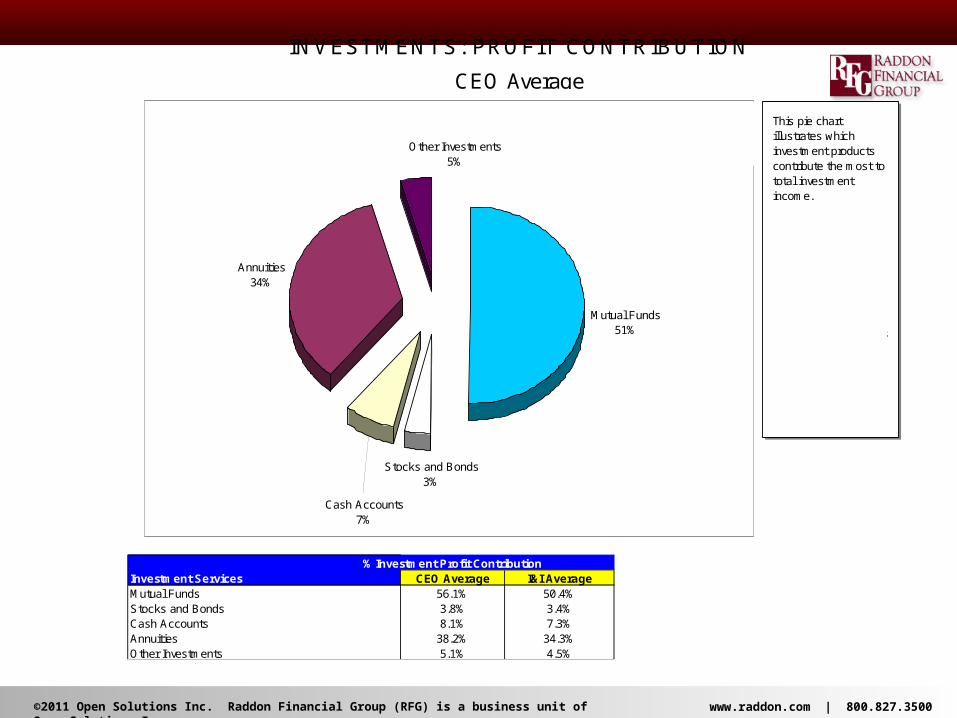
% Investment Profit ContributionInvestment Services CEO Average I&I AverageMutual Funds 56.1% 50.4%Stocks and Bonds 3.8% 3.4%Cash Accounts 8.1% 7.3%Annuities 38.2% 34.3%Other Investments 5.1% 4.5%
INVESTMENTS: PROFIT CONTRIBUTION
CEO Average
Mutual Funds51%
Annuities34%
Other Investments5%
Cash Accounts7%
Stocks and Bonds3%
This pie chart illustrates which investment products contribute the most to total investment income.
For CEO Average, Mutual Funds are the largest contributor to total investment income.
Their overall percentage represents 56% of the total investment income.
©2011 Open Solutions Inc. Raddon Financial Group (RFG) is a business unit of Open Solutions Inc. www.raddon.com | 800.827.3500
CEO Average Number of Number of Total Average
Households Accounts Position Position
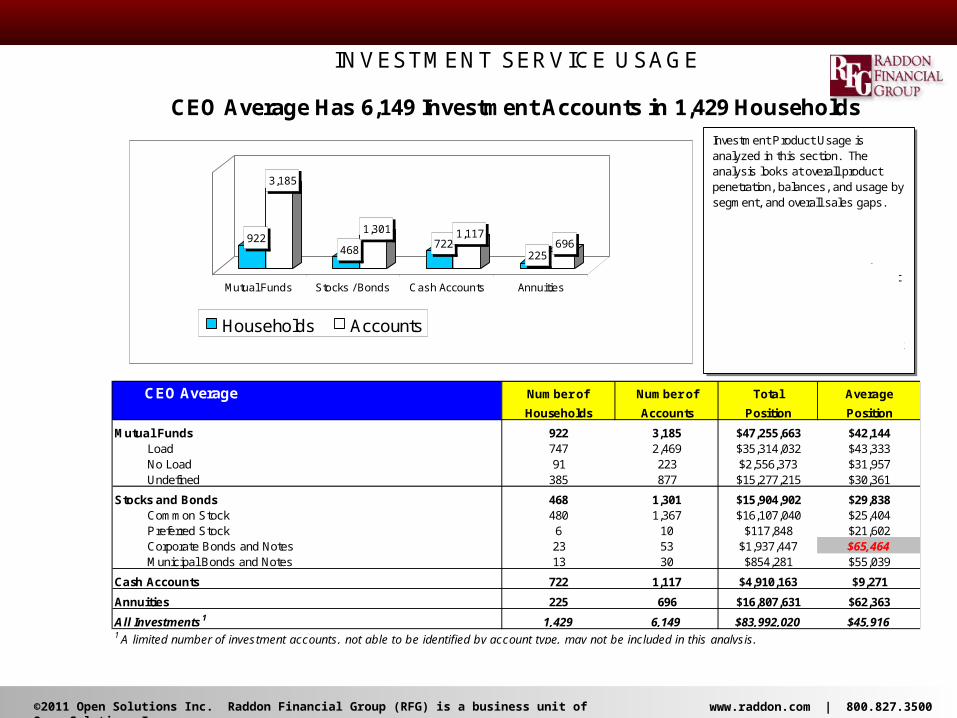
Mutual Funds 922 3,185 $47,255,663 $42,144Load 747 2,469 $35,314,032 $43,333No Load 91 223 $2,556,373 $31,957Undefined 385 877 $15,277,215 $30,361
Stocks and Bonds 468 1,301 $15,904,902 $29,838Common Stock 480 1,367 $16,107,040 $25,404Preferred Stock 6 10 $117,848 $21,602Corporate Bonds and Notes 23 53 $1,937,447 $65,464Municipal Bonds and Notes 13 30 $854,281 $55,039
Cash Accounts 722 1,117 $4,910,163 $9,271
Annuities 225 696 $16,807,631 $62,363
All Investments1 1,429 6,149 $83,992,020 $45,9161 A limited number of investment accounts, not able to be identified by account type, may not be included in this analysis.
INVESTMENT SERVICE USAGE
CEO Average Has 6,149 Investment Accounts in 1,429 Households
922
3,185
468
1,301722
1,117
225696
Mutual Funds Stocks / Bonds Cash Accounts Annuities
Households Accounts
Investment Product Usage is analyzed in this section. The analysis looks at overall product penetration, balances, and usage by segment, and overall sales gaps.
Annuities, while technically an insurance product, are treated as an investment service in this analysis.
CEO Average has 6,149 investment accounts of various types found in 1,429 households.
These investment accounts generate $84.0 million in investment balances.
©2011 Open Solutions Inc. Raddon Financial Group (RFG) is a business unit of Open Solutions Inc. www.raddon.com | 800.827.3500
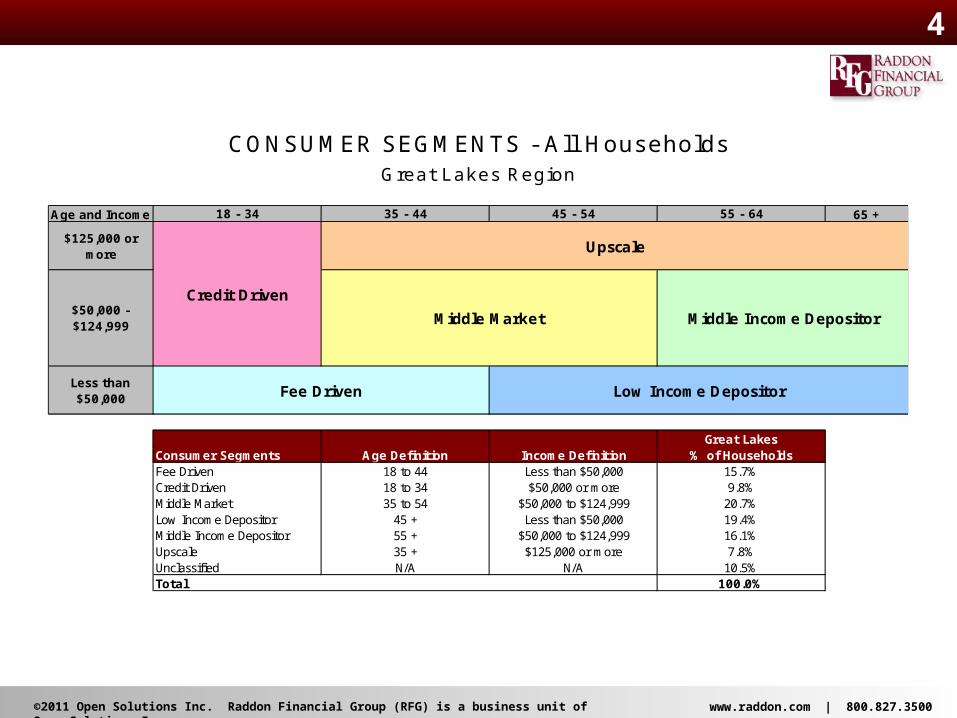
CONSUMER SEGMENTS - All HouseholdsGreat Lakes Region
Age and Income 65 +
Great LakesConsumer Segments Age Definition Income Definition % of HouseholdsFee Driven 18 to 44 Less than $50,000 15.7%Credit Driven 18 to 34 $50,000 or more 9.8%Middle Market 35 to 54 $50,000 to $124,999 20.7%Low Income Depositor 45 + Less than $50,000 19.4%Middle Income Depositor 55 + $50,000 to $124,999 16.1%Upscale 35 + $125,000 or more 7.8%Unclassified N/A N/A 10.5%Total 100.0%
Credit Driven
$125,000 or more
$50,000 - $124,999
Less than $50,000 Low Income Depositor
55 - 6418 - 34
Middle Income Depositor
Fee Driven
Middle Market
Upscale
35 - 44 45 - 54
4
©2011 Open Solutions Inc. Raddon Financial Group (RFG) is a business unit of Open Solutions Inc. www.raddon.com | 800.827.3500
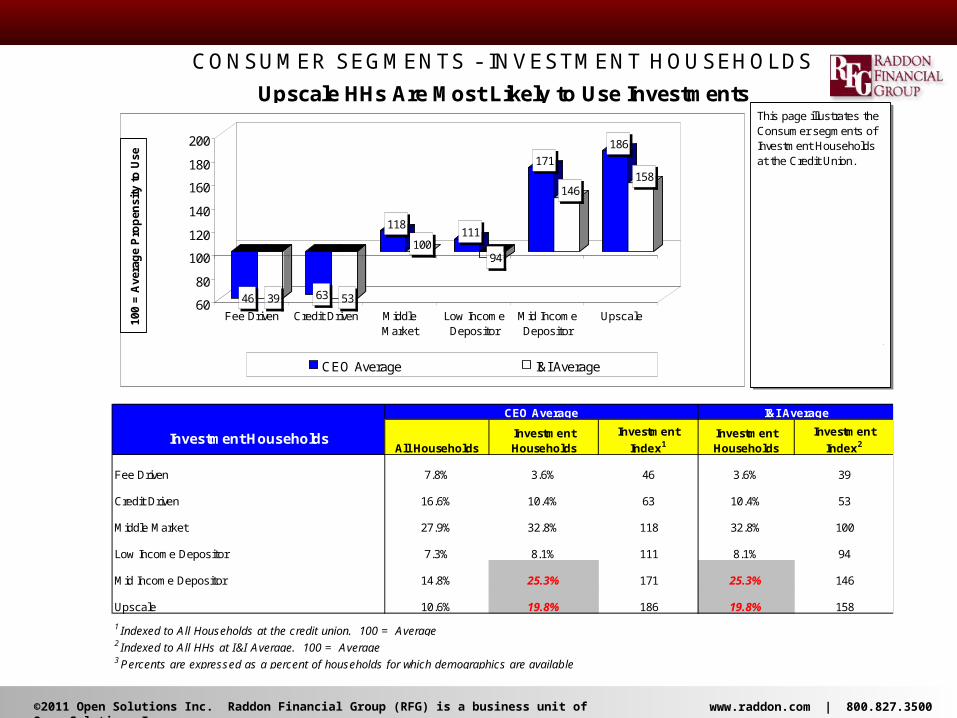
All HouseholdsInvestment Households
Investment
Index1Investment Households
Investment
Index2
Fee Driven 7.8% 3.6% 46 3.6% 39
Credit Driven 16.6% 10.4% 63 10.4% 53
Middle Market 27.9% 32.8% 118 32.8% 100
Low Income Depositor 7.3% 8.1% 111 8.1% 94
Mid Income Depositor 14.8% 25.3% 171 25.3% 146
Upscale 10.6% 19.8% 186 19.8% 158
1 Indexed to All Households at the credit union. 100 = Average2 Indexed to All HHs at I&I Average. 100 = Average3 Percents are expressed as a percent of households for which demographics are available
CONSUMER SEGMENTS - INVESTMENT HOUSEHOLDS
Upscale HHs Are Most Likely to Use Investments
I&I AverageCEO Average
Investment Households
46 39 63 53
118
100111
94
171
146
186
158
60
80
100
120
140
160
180
200
Fee Driven Credit Driven MiddleMarket
Low IncomeDepositor
Mid IncomeDepositor
Upscale
CEO Average I&I Average
100
= A
vera
ge
Pro
pen
sity
to
Use
This page illustrates the Consumer segments of Investment Households at the Credit Union.
The index indicates whether a particular segment is more or less likely to use Investment Services through the credit union.
The segment with the highest propensity to use Investment Services at CEO Average is Upscale households. The Investment Index for this segment is 186.
©2011 Open Solutions Inc. Raddon Financial Group (RFG) is a business unit of Open Solutions Inc. www.raddon.com | 800.827.3500
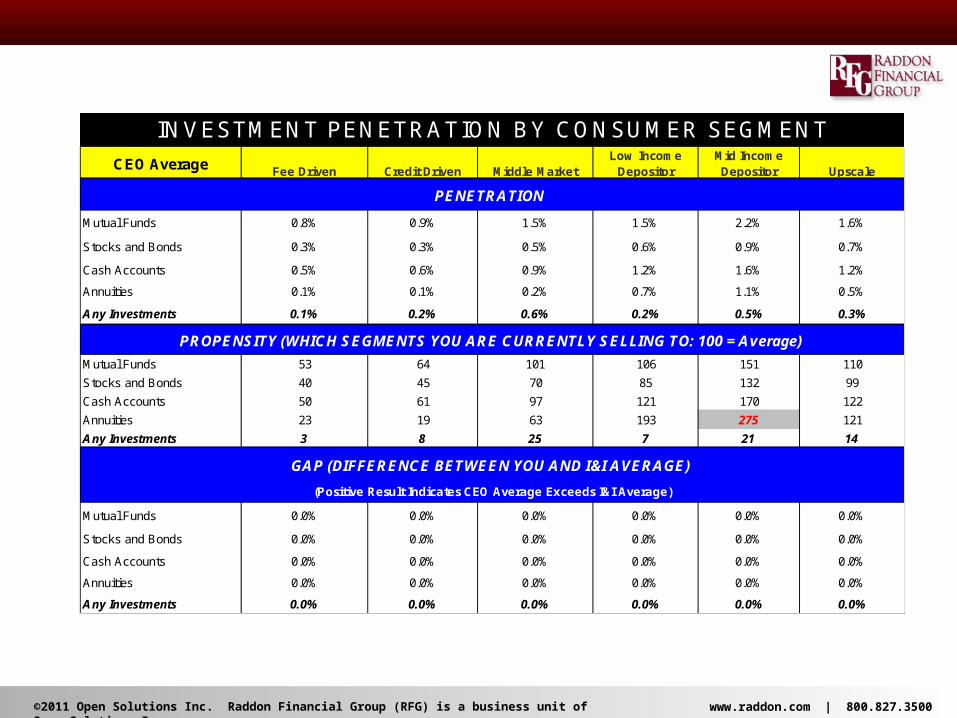
CEO AverageFee Driven Credit Driven Middle Market
Low Income Depositor
Mid Income Depositor Upscale
Mutual Funds 0.8% 0.9% 1.5% 1.5% 2.2% 1.6%
Stocks and Bonds 0.3% 0.3% 0.5% 0.6% 0.9% 0.7%
Cash Accounts 0.5% 0.6% 0.9% 1.2% 1.6% 1.2%
Annuities 0.1% 0.1% 0.2% 0.7% 1.1% 0.5%
Any Investments 0.1% 0.2% 0.6% 0.2% 0.5% 0.3%
Mutual Funds 53 64 101 106 151 110
Stocks and Bonds 40 45 70 85 132 99
Cash Accounts 50 61 97 121 170 122
Annuities 23 19 63 193 275 121
Any Investments 3 8 25 7 21 14
Mutual Funds 0.0% 0.0% 0.0% 0.0% 0.0% 0.0%
Stocks and Bonds 0.0% 0.0% 0.0% 0.0% 0.0% 0.0%
Cash Accounts 0.0% 0.0% 0.0% 0.0% 0.0% 0.0%
Annuities 0.0% 0.0% 0.0% 0.0% 0.0% 0.0%
Any Investments 0.0% 0.0% 0.0% 0.0% 0.0% 0.0%
(Positive Result Indicates CEO Average Exceeds I&I Average)
INVESTMENT PENETRATION BY CONSUMER SEGMENT
PENETRATION
PROPENSITY (WHICH SEGMENTS YOU ARE CURRENTLY SELLING TO: 100 = Average)
GAP (DIFFERENCE BETWEEN YOU AND I&I AVERAGE)
©2011 Open Solutions Inc. Raddon Financial Group (RFG) is a business unit of Open Solutions Inc. www.raddon.com | 800.827.3500
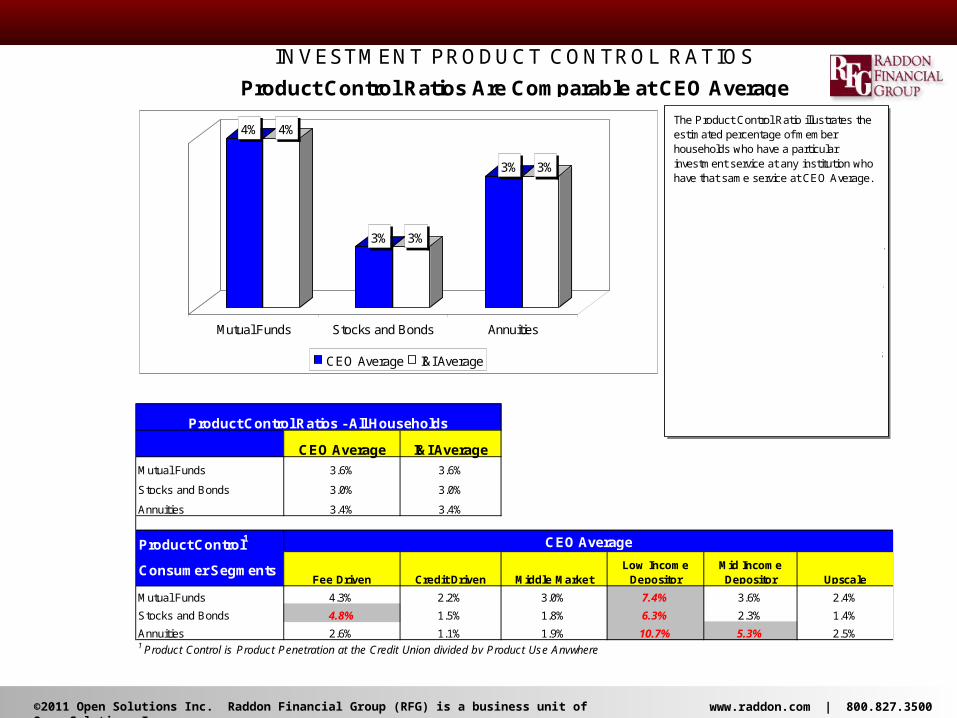
CEO Average I&I Average
Mutual Funds 3.6% 3.6%
Stocks and Bonds 3.0% 3.0%
Annuities 3.4% 3.4%
Product Control1
Consumer SegmentsFee Driven Credit Driven Middle Market
Low Income Depositor
Mid Income Depositor Upscale
Mutual Funds 4.3% 2.2% 3.0% 7.4% 3.6% 2.4%
Stocks and Bonds 4.8% 1.5% 1.8% 6.3% 2.3% 1.4%
Annuities 2.6% 1.1% 1.9% 10.7% 5.3% 2.5%1 Product Control is Product Penetration at the Credit Union divided by Product Use Anywhere
CEO Average
Product Control Ratios - All Households
Product Control Ratios Are Comparable at CEO Average
INVESTMENT PRODUCT CONTROL RATIOS
4% 4%
3% 3%
3% 3%
Mutual Funds Stocks and Bonds Annuities
CEO Average I&I Average
The Product Control Ratio illustrates the estimated percentage of member households who have a particular investment service at any institution who have that same service at CEO Average.
Keep in mind that while a member may have a particular investment service with the credit union, they may also have that same service at another institution as well.
The Product Control Ratio for Mutual Funds is 3.6%. That is, 3.6% of members that use mutual funds have mutual fund balances invested through CEO Average.
The Control Ratio for Stocks and Bonds is 3%.
The control ratio for Annuities at CEO Average is 3%.

©2011 Open Solutions Inc. Raddon Financial Group (RFG) is a business unit of Open Solutions Inc. www.raddon.com | 800.827.3500
INSURANCE SERVICESCEO Average
©2011 Open Solutions Inc. Raddon Financial Group (RFG) is a business unit of Open Solutions Inc. www.raddon.com | 800.827.3500
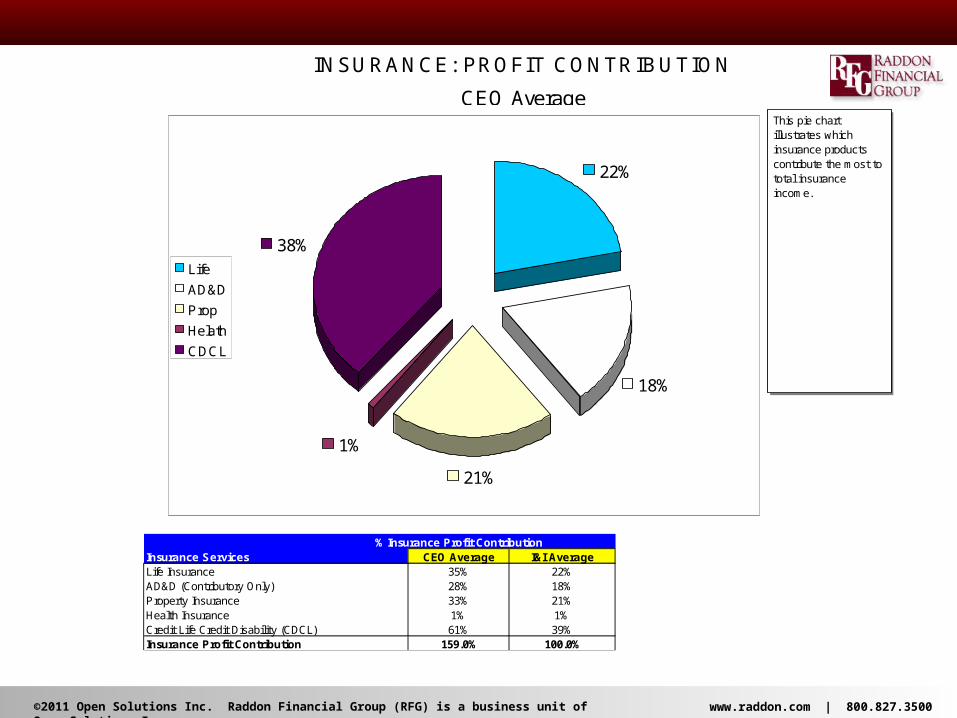
% Insurance Profit ContributionInsurance Services CEO Average I&I AverageLife Insurance 35% 22%AD&D (Contributory Only) 28% 18%Property Insurance 33% 21%Health Insurance 1% 1%Credit Life Credit Disability (CDCL) 61% 39%Insurance Profit Contribution 159.0% 100.0%
INSURANCE: PROFIT CONTRIBUTION
CEO Average
22%
21%
1%
38%
18%
Life
AD&D
Prop
Helath
CDCL
This pie chart illustrates which insurance products contribute the most to total insurance income.
For CEO Average, Life is the largest contributor to total insurance income.
Their overall percentage represents 35% of the total insurance income.
©2011 Open Solutions Inc. Raddon Financial Group (RFG) is a business unit of Open Solutions Inc. www.raddon.com | 800.827.3500
Insurance HouseholdsAll Households
Insurance Households Insurance Index1
Insurance Households Insurance Index2
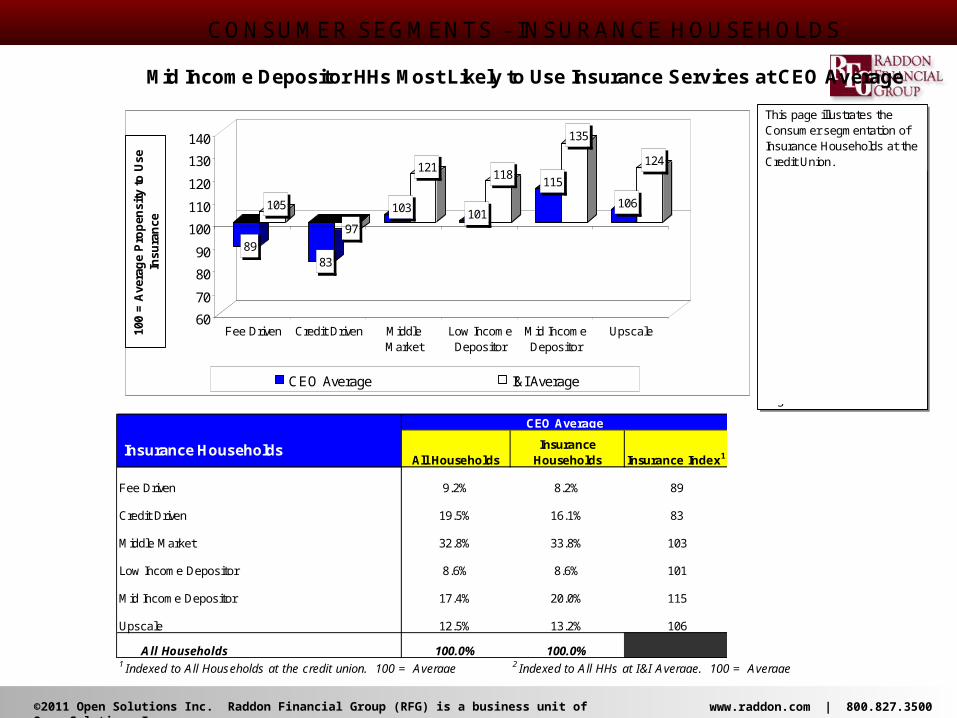
Fee Driven 9.2% 8.2% 89 8.2% 105
Credit Driven 19.5% 16.1% 83 16.1% 97
Middle Market 32.8% 33.8% 103 33.8% 121
Low Income Depositor 8.6% 8.6% 101 8.6% 118
Mid Income Depositor 17.4% 20.0% 115 20.0% 135
Upscale 12.5% 13.2% 106 13.2% 124
All Households 100.0% 100.0% 100.0%1 Indexed to All Households at the credit union. 100 = Average 2 Indexed to All HHs at I&I Average. 100 = Average
I&I AverageCEO Average
CONSUMER SEGMENTS - INSURANCE HOUSEHOLDS
Mid Income Depositor HHs Most Likely to Use Insurance Services at CEO Average
89
105
83
97
103
121
101
118115
135
106
124
60
70
80
90
100
110
120
130
140
Fee Driven Credit Driven MiddleMarket
Low IncomeDepositor
Mid IncomeDepositor
Upscale
CEO Average I&I Average
100
= A
vera
ge
Pro
pen
sity
to
Use
In
sura
nce
This page illustrates the Consumer segmentation of Insurance Households at the Credit Union.
The index indicates whether a particular segment is more or less likely to use Insurance Services through the credit union. 100 = average propensity to use Insurance Services.
The segment with the highest propensity to use Insurance Services at CEO Average is Mid Income Depositor households. The Insurance Index for this segment is 115.
©2011 Open Solutions Inc. Raddon Financial Group (RFG) is a business unit of Open Solutions Inc. www.raddon.com | 800.827.3500
Usage With Any Insurer1
Fee Driven Credit Driven Middle MarketLow Income
DepositorMid Income Depositor Upscale
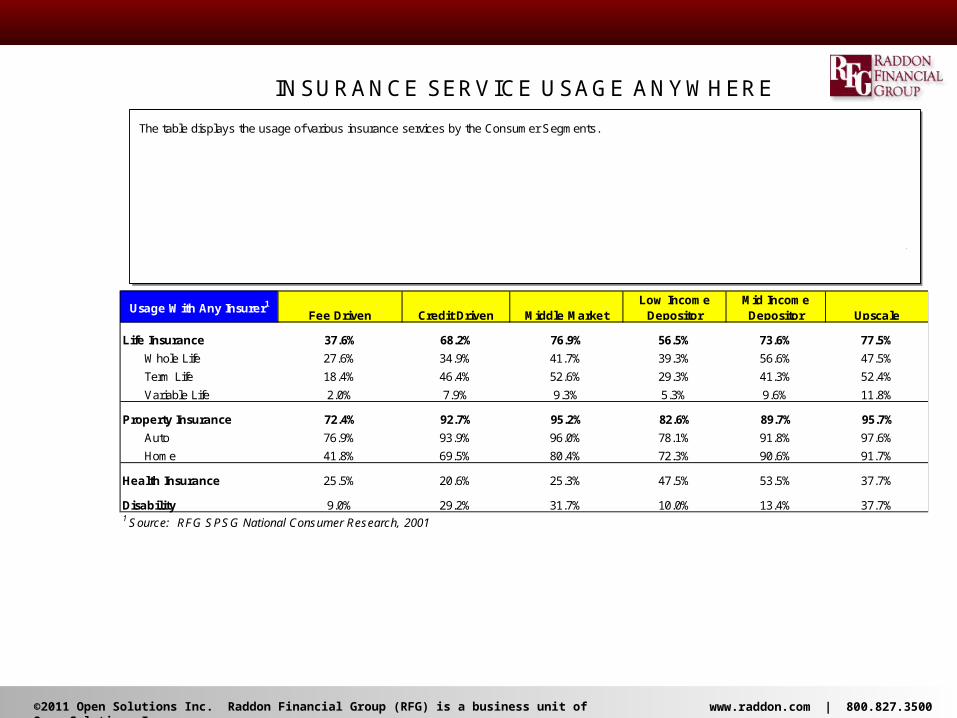
Life Insurance 37.6% 68.2% 76.9% 56.5% 73.6% 77.5%
Whole Life 27.6% 34.9% 41.7% 39.3% 56.6% 47.5%
Term Life 18.4% 46.4% 52.6% 29.3% 41.3% 52.4%
Variable Life 2.0% 7.9% 9.3% 5.3% 9.6% 11.8%
Property Insurance 72.4% 92.7% 95.2% 82.6% 89.7% 95.7%
Auto 76.9% 93.9% 96.0% 78.1% 91.8% 97.6%
Home 41.8% 69.5% 80.4% 72.3% 90.6% 91.7%
Health Insurance 25.5% 20.6% 25.3% 47.5% 53.5% 37.7%
Disability 9.0% 29.2% 31.7% 10.0% 13.4% 37.7%1 Source: RFG SPSG National Consumer Research, 2001
INSURANCE SERVICE USAGE ANY WHERE
The table displays the usage of various insurance services by the Consumer Segments.
This represents usage with ANY INSURER.
The source of this data is Raddon Financial Group's Strategic Planning Study Group (SPSG). This is national consumer research conducted every six months by RFG through which financial trends and usage patterns are monitored.
Insurance service use anywhere can be compared with insurance service use at the credit union to project share of the insurance wallet and sales potential. This is shown on following pages.
©2011 Open Solutions Inc. Raddon Financial Group (RFG) is a business unit of Open Solutions Inc. www.raddon.com | 800.827.3500
Product Control1Life Insurance
Property Insurance Health Insurance
Disability Insurance
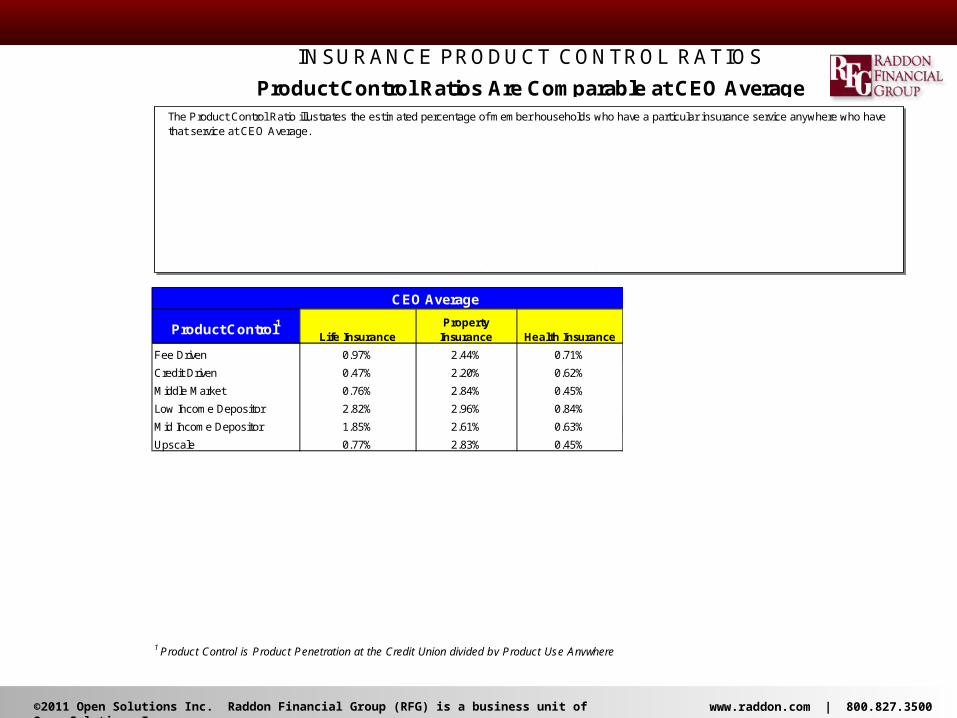
Fee Driven 0.97% 2.44% 0.71% 130.18%
Credit Driven 0.47% 2.20% 0.62% 39.53%
Middle Market 0.76% 2.84% 0.45% 36.53%
Low Income Depositor 2.82% 2.96% 0.84% 107.98%
Mid Income Depositor 1.85% 2.61% 0.63% 88.83%
Upscale 0.77% 2.83% 0.45% 28.62%
Product Control1 Life InsuranceProperty
Insurance Health InsuranceDisability Insurance
Fee Driven 2.0% 3.4% 0.6% 124.6%
Credit Driven 0.5% 1.9% 0.9% 40.1%
Middle Market 0.4% 2.1% 0.5% 36.4%
Low Income Depositor 1.0% 3.3% 0.2% 115.8%
Mid Income Depositor 2.2% 2.7% 0.7% 80.6%
Upscale 1.8% 2.4% 0.9% 31.6%
1 Product Control is Product Penetration at the Credit Union divided by Product Use Anywhere
CEO Average
INSURANCE PRODUCT CONTROL RATIOS
Product Control Ratios Are Comparable at CEO Average
I&I Average
The Product Control Ratio illustrates the estimated percentage of member households who have a particular insurance service anywhere who have that service at CEO Average.
Keep in mind that while a member may have a particular insurance service with the credit union, they may also have that another policy in that same service class with another insurer.
The Product Control Ratio for Life Insurance is 7.6%. That is, 7.6% of members that have a life insurance policy have a policy through CEO Average.
The Control Ratio for Property Insurance is 15.9%. The control ratio for Health Insurance is 3.7%.
Compare your insurance product control ratios by Consumer Segment to the I&I Average.
©2011 Open Solutions Inc. Raddon Financial Group (RFG) is a business unit of Open Solutions Inc. www.raddon.com | 800.827.3500
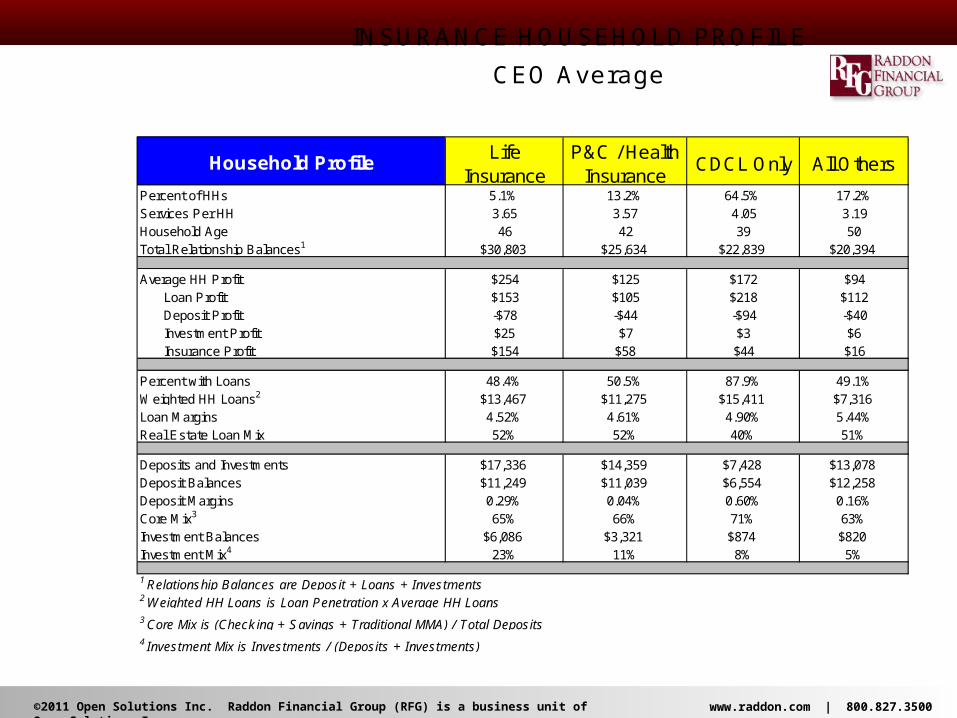
Life Insurance
P&C / Health Insurance
CDCL Only All Others
Percent of HHs 5.1% 13.2% 64.5% 17.2%Services Per HH 3.65 3.57 4.05 3.19Household Age 46 42 39 50Total Relationship Balances1 $30,803 $25,634 $22,839 $20,394
Average HH Profit $254 $125 $172 $94Loan Profit $153 $105 $218 $112Deposit Profit -$78 -$44 -$94 -$40Investment Profit $25 $7 $3 $6Insurance Profit $154 $58 $44 $16
Percent with Loans 48.4% 50.5% 87.9% 49.1%Weighted HH Loans2 $13,467 $11,275 $15,411 $7,316Loan Margins 4.52% 4.61% 4.90% 5.44%Real Estate Loan Mix 52% 52% 40% 51%
Deposits and Investments $17,336 $14,359 $7,428 $13,078Deposit Balances $11,249 $11,039 $6,554 $12,258Deposit Margins 0.29% 0.04% 0.60% 0.16%Core Mix3 65% 66% 71% 63%Investment Balances $6,086 $3,321 $874 $820Investment Mix4 23% 11% 8% 5%
1 Relationship Balances are Deposit + Loans + Investments2 Weighted HH Loans is Loan Penetration x Average HH Loans3 Core Mix is (Checking + Savings + Traditional MMA) / Total Deposits4 Investment Mix is Investments / (Deposits + Investments)
Household Profile
CEO Average
INSURANCE HOUSEHOLD PROFILE

©2011 Open Solutions Inc. Raddon Financial Group (RFG) is a business unit of Open Solutions Inc. www.raddon.com | 800.827.3500
Contact Information
Bob ShiblaStrategic Consultant
Raddon Financial Group701 E 22nd
Lombard, IL 60148
Office: 800.827.3500 [email protected]

©2011 Open Solutions Inc. Raddon Financial Group (RFG) is a business unit of Open Solutions Inc. www.raddon.com | 800.827.3500