Embed Size (px)
Citation preview

Driving New Success Strategies in Graduate Recruitment
Talent Report 2014
Eugene Burke, Chief Science & Analytics Officer
Tom Gibbs, Director of Service Development
2
Driving New Success Strategies in Graduate Recruitment
2
While graduate job opportunities are increasing as economic conditions improve in many economies, organisations continue to struggle to fill their graduate vacancies.
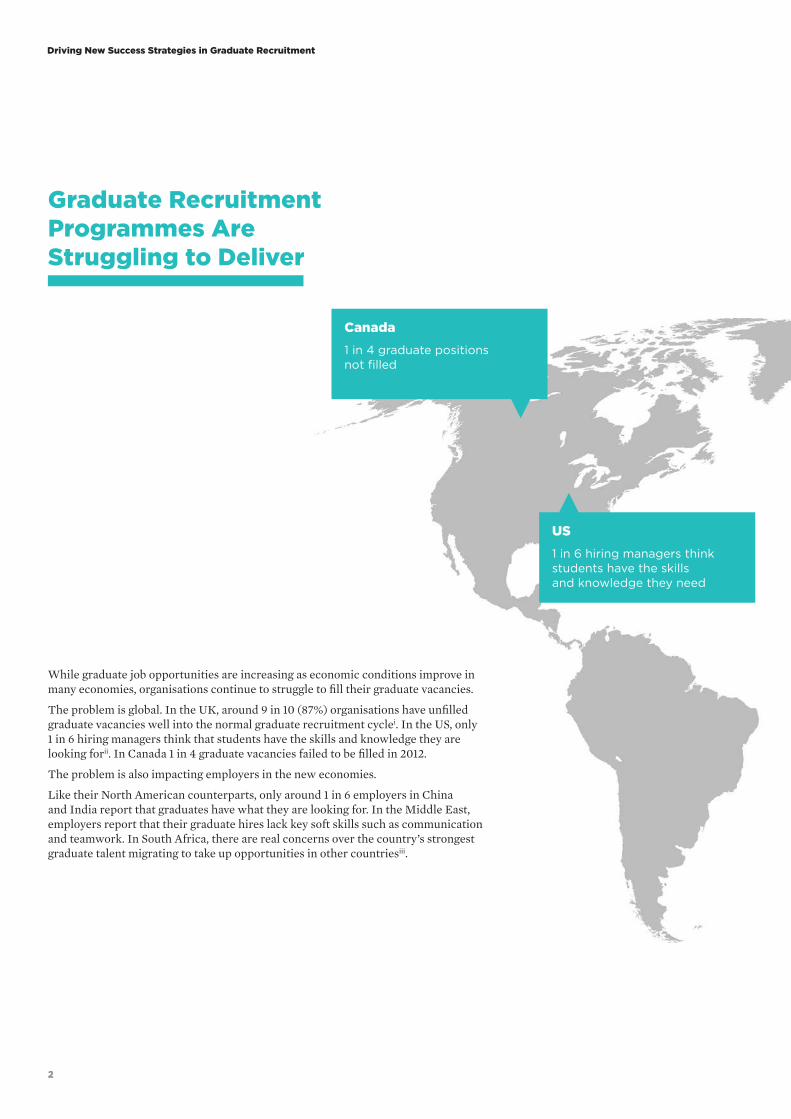
The problem is global. In the UK, around 9 in 10 (87%) organisations have unfilled graduate vacancies well into the normal graduate recruitment cyclei. In the US, only 1 in 6 hiring managers think that students have the skills and knowledge they are looking forii. In Canada 1 in 4 graduate vacancies failed to be filled in 2012.
The problem is also impacting employers in the new economies.
Like their North American counterparts, only around 1 in 6 employers in China and India report that graduates have what they are looking for. In the Middle East, employers report that their graduate hires lack key soft skills such as communication and teamwork. In South Africa, there are real concerns over the country’s strongest graduate talent migrating to take up opportunities in other countriesiii.
Canada1 in 4 graduate positions not filled
US1 in 6 hiring managers think students have the skillsand knowledge they need
Graduate Recruitment Programmes Are Struggling to Deliver
3
SHL Talent Measurement
3
Figure 1. Employers Locally and Globally Are Struggling to Fill Their Graduate Vacancies
UK7 in 10 employers thinkstudents need to do more toprepare themselves for work
Middle EastGraduate hires lack softskills in areas such ascommunication and teamwork
India & ChinaOnly 1 in 6 employers say graduates have what they are looking for
South AfricaStudents with technicaldegrees in short supply andmany emigrate
4
Driving New Success Strategies in Graduate Recruitment
4
Increased Graduate Mobility Is Changing the Dynamics of Graduate Recruitment With graduate talent more mobile today than ever before, organisations are increasingly having to compete for it in a global market.
Surveys conducted by the Organisation for Economic Co-operation and Development (OECD) show that the number of students enrolling in educational programmes outside their own country has more than doubled in the past decade to around 4.5 million. Australia, the UK and the US are popular destinations.
For many of these educational migrants, the country in which they choose to study is also where they choose to seek employment, with 1 in 5 staying on to look for work. With over half of these student migrants coming from Asia, such migration patterns impact graduate talent pools in the country of origin as well as the chosen country of destinationiv.
Emigration is a factor in more mature economies as well. CEB research conducted in 2013 found that 8 in 9 UK graduates would consider moving overseas to pursue job and career opportunitiesv. Their top potential employment destinations included Australia, North America and both Eastern and Western Europe.
And what happens in China may well impact on the aspirations of organisations in other parts of the world.
With 78% of the growth in global GDP projected to come from new markets by 2030vi and 61% of CEOs placing greater emphasis on global expansionvii, talent shortages and shifts in employer preference in geographies such as China are presenting challenges in achieving multinational corporations (MNCs’) aspirations for growth.
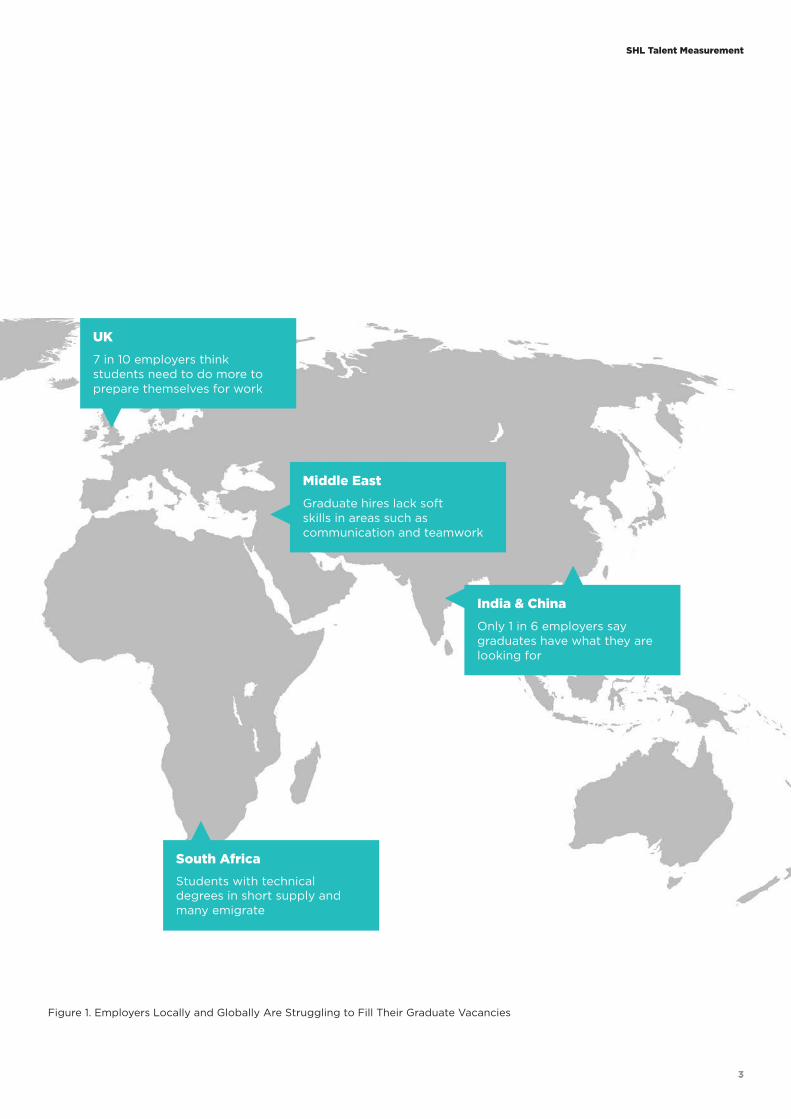
While MNCs in China enjoyed a 5 to 1 advantage in employer preference in early 2007 that advantage has now disappeared, with preference for Chinese companies rising to more than 50% higher than MNCs by Q4 2013viii.
Figure 2: What Happens in China Will Impact What Happens Locally and Globally
Q4 2013 n = 989.Source: CEB 2007-2013 Global Labour Market Survey
MNC Preference in China
60%
30%
0%
49.0%
9.0%
31.2%
27.9%
11.5%
Q22007
Q22008
Q42008
Q22010
Q22011
Q42011
Q1 Q2 Q3 Q42012
Q1 Q2 Q3 Q42013
Foreign-Based MNCs
Domestic-Based Firms:Domestic and Regional Operations
Domestic-Based Firms:Global Operations
5
SHL Talent Measurement
5
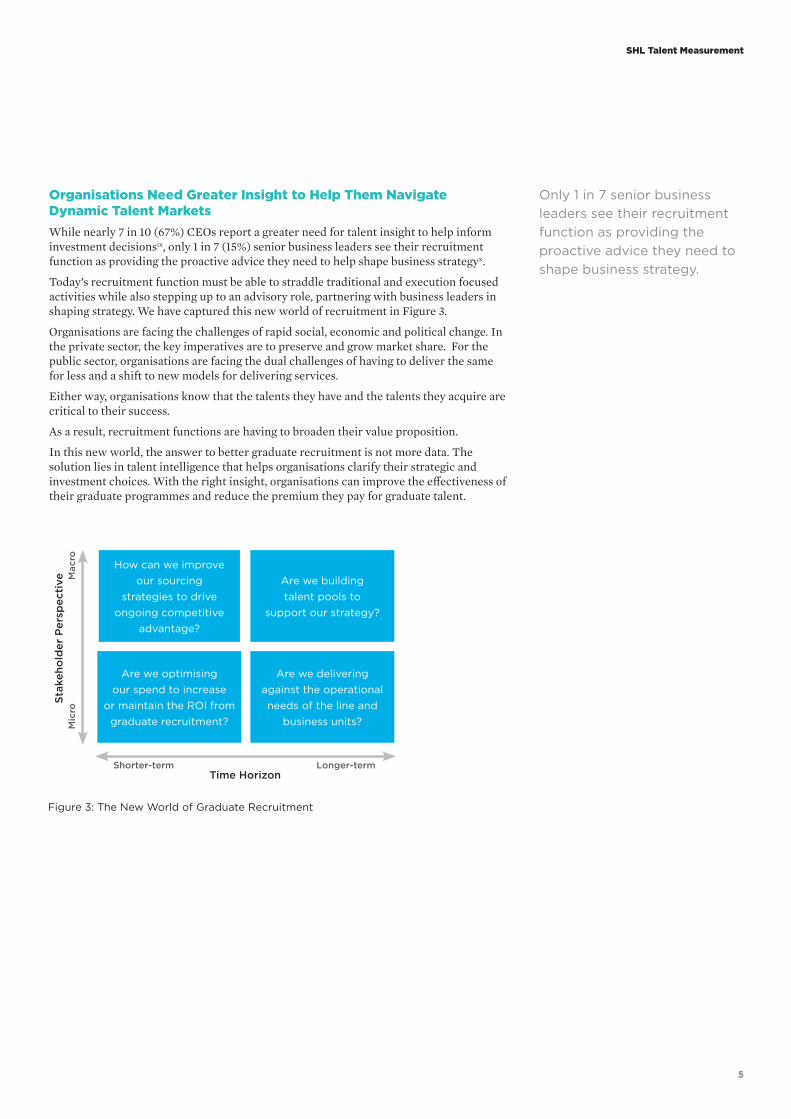
Organisations Need Greater Insight to Help Them Navigate Dynamic Talent Markets While nearly 7 in 10 (67%) CEOs report a greater need for talent insight to help inform investment decisionsix, only 1 in 7 (15%) senior business leaders see their recruitment function as providing the proactive advice they need to help shape business strategyx.
Today’s recruitment function must be able to straddle traditional and execution focused activities while also stepping up to an advisory role, partnering with business leaders in shaping strategy. We have captured this new world of recruitment in Figure 3.
Organisations are facing the challenges of rapid social, economic and political change. In the private sector, the key imperatives are to preserve and grow market share. For the public sector, organisations are facing the dual challenges of having to deliver the same for less and a shift to new models for delivering services.
Either way, organisations know that the talents they have and the talents they acquire are critical to their success.
As a result, recruitment functions are having to broaden their value proposition.
In this new world, the answer to better graduate recruitment is not more data. The solution lies in talent intelligence that helps organisations clarify their strategic and investment choices. With the right insight, organisations can improve the effectiveness of their graduate programmes and reduce the premium they pay for graduate talent.
Figure 3: The New World of Graduate Recruitment
How can we improve our sourcing
strategies to drive ongoing competitive
advantage?
Time Horizon
Stak
eho
lder
Per
spec
tive
Longer-termShorter-term
Mac
roM
icro
Are we buildingtalent pools to
support our strategy?
Are we optimising our spend to increase
or maintain the ROI from graduate recruitment?
Are we delivering against the operational needs of the line and
business units?
Only 1 in 7 senior business leaders see their recruitment function as providing the proactive advice they need to shape business strategy.

66
Outcome-Based Evidence Is Crucial to the Value from Graduate Recruitment The shift to talent intelligence means moving away from an approach founded largely on intuition. It means questioning assumptions and former habits such as:
“We have a long tradition of recruiting from University X.”
“These universities get the best academic ratings, so that’s where we go to find the best talent.”
“We like to pitch at universities that we have not explored before so we can keep our search for talent fresh.”
“Our line managers and seniors like us to focus on where they went as they have clearly been successful in their careers.”
If recruiters are to challenge these assumptions and habits, they need the right kind of outcome-based evidence to drive and shape more effective recruitment solutions.
Meeting both the operational and strategic needs of the organisation requires metrics that can predict whether graduate hires are more likely to be the stronger performers of the future, will be engaged employees and stay with the organisation, and whether they have the talents to rise to and be effective in more senior and challenging roles.
This shift to an intelligence-led approach means learning to use and apply predictive metrics to create clear frameworks for evaluating recruitment investment options. To achieve that, a very fundamental question needs to be addressed.
Co
nsis
tenc
y o
f Ta
lent
Less
Co
nsis
tent
Mo
re C
ons
iste
nt
Weaker StrongerStrength of Talent
Strongest and most consistent sources of graduate talent
matching client need
ContextUK client wanted to test assumptions on whether their investment in on-campus recruitment reflected strongest and most consistent sources of talent. Levels of client’s current investment were based on annual university rankings published in the UK (The Times and the Guardian’s Complete University Guide).
MetricsIndex of talent strength aligned with company’s definition of high-potential. Data collected through company’s graduate recruitment assessments. Indices developed to show Strength of Talent (average per university) and Consistency
of Talent (range from lowest to highest on index for each university with smaller range indicating higher consistency).
OutcomeModest correlation found between publicly available university rankings and strength and consistency of graduate talent in line with company needs. Some universities in lower tiers based on rankings identified as potential talent hotspots offering strong and consistent graduate talent (Tiers 3 and 4). Some universities in higher tiers (1 and 2) shown as over-invested given strength and consistency of talent aligned with company need.
Industry Sector: Professional Services
Universities segmented by The Times and Guardian ranking quartile
Tier 1 Tier 2 Tier 3 Tier 4
Case Story 1:
Are University Rankings the Best Indicator of Graduate Talent for Our Organisation?
7
SHL Talent Measurement
7
What Are Employers’ Key Requirements for Graduate Talent? There is a clear gap between employers and educators on the employability of today’s graduates. As Peter Cheese, CEO of the UK’s Chartered Institute of Personnel and Development (CIPD), commented at the launch of a 2013 CIPD report:
“When it comes to recruitment, it can feel as though young people and employers are on completely different planets. Too many young people are struggling to find their first job, whereas many employers are finding it difficult to get the skills they want.”xi
So what are employers looking for?
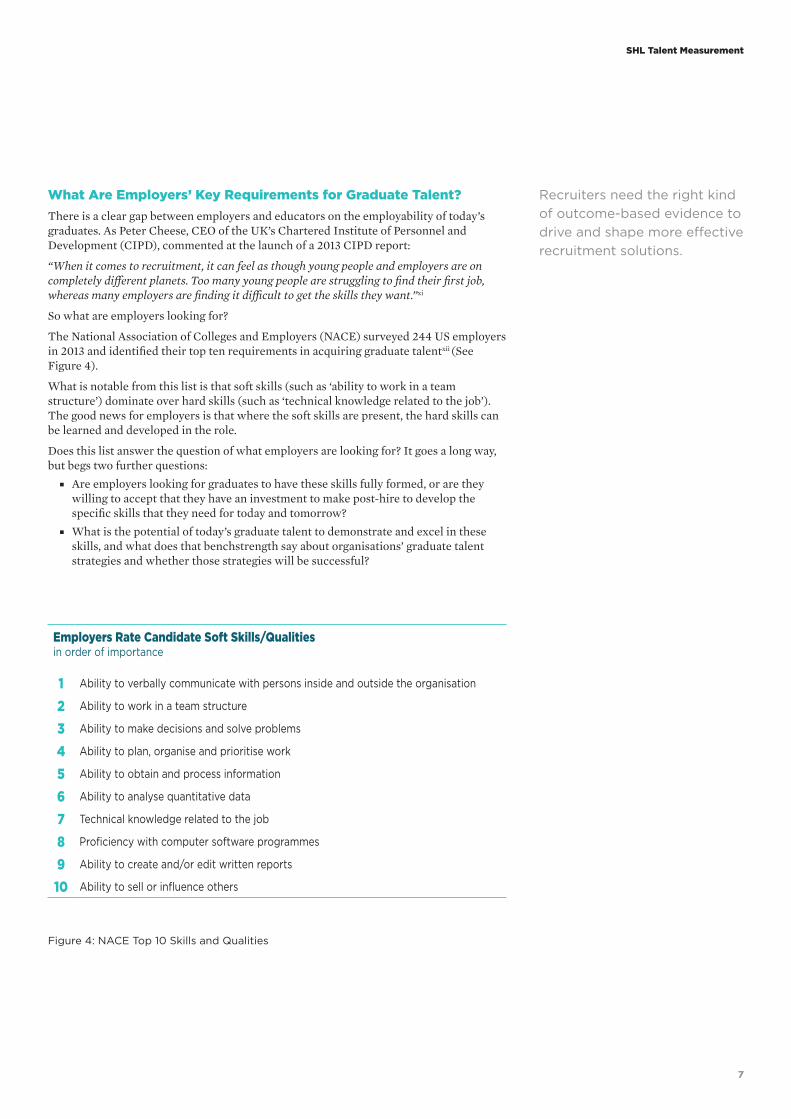
The National Association of Colleges and Employers (NACE) surveyed 244 US employers in 2013 and identified their top ten requirements in acquiring graduate talentxii (See Figure 4).
What is notable from this list is that soft skills (such as ‘ability to work in a team structure’) dominate over hard skills (such as ‘technical knowledge related to the job’). The good news for employers is that where the soft skills are present, the hard skills can be learned and developed in the role.
Does this list answer the question of what employers are looking for? It goes a long way, but begs two further questions:
■ Are employers looking for graduates to have these skills fully formed, or are they willing to accept that they have an investment to make post-hire to develop the specific skills that they need for today and tomorrow?
■ What is the potential of today’s graduate talent to demonstrate and excel in these skills, and what does that benchstrength say about organisations’ graduate talent strategies and whether those strategies will be successful?
Recruiters need the right kind of outcome-based evidence to drive and shape more effective recruitment solutions.
Employers Rate Candidate Soft Skills/Qualitiesin order of importance
1 Ability to verbally communicate with persons inside and outside the organisation
2 Ability to work in a team structure
3 Ability to make decisions and solve problems
4 Ability to plan, organise and prioritise work
5 Ability to obtain and process information
6 Ability to analyse quantitative data
7 Technical knowledge related to the job
8 Proficiency with computer software programmes
9 Ability to create and/or edit written reports
10 Ability to sell or influence others
Figure 4: NACE Top 10 Skills and Qualities
88
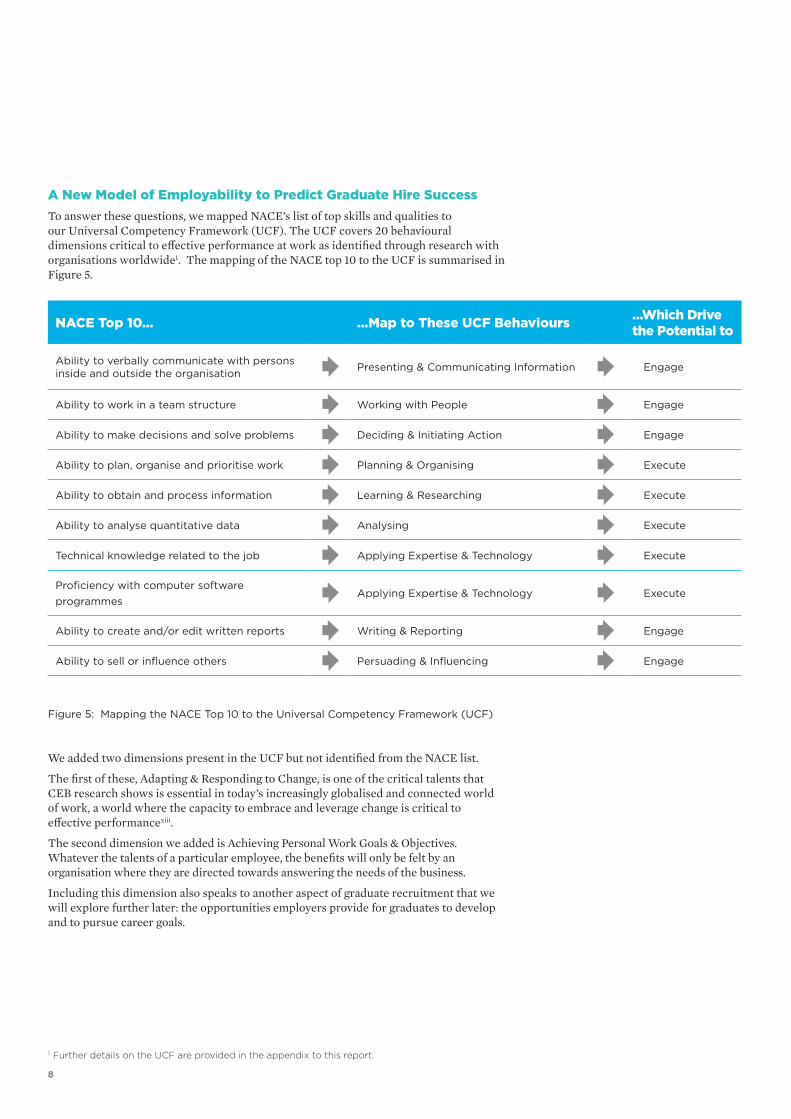
A New Model of Employability to Predict Graduate Hire Success To answer these questions, we mapped NACE’s list of top skills and qualities to our Universal Competency Framework (UCF). The UCF covers 20 behavioural dimensions critical to effective performance at work as identified through research with organisations worldwide1. The mapping of the NACE top 10 to the UCF is summarised in Figure 5.
NACE Top 10… …Map to These UCF Behaviours …Which Drive the Potential to
Ability to verbally communicate with persons inside and outside the organisation Presenting & Communicating Information Engage
Ability to work in a team structure Working with People Engage
Ability to make decisions and solve problems Deciding & Initiating Action Engage
Ability to plan, organise and prioritise work Planning & Organising Execute
Ability to obtain and process information Learning & Researching Execute
Ability to analyse quantitative data Analysing Execute
Technical knowledge related to the job Applying Expertise & Technology Execute
Proficiency with computer software programmes
Applying Expertise & Technology Execute
Ability to create and/or edit written reports Writing & Reporting Engage
Ability to sell or influence others Persuading & Influencing Engage
Figure 5: Mapping the NACE Top 10 to the Universal Competency Framework (UCF)
1 Further details on the UCF are provided in the appendix to this report.
We added two dimensions present in the UCF but not identified from the NACE list.
The first of these, Adapting & Responding to Change, is one of the critical talents that CEB research shows is essential in today’s increasingly globalised and connected world of work, a world where the capacity to embrace and leverage change is critical to effective performancexiii.
The second dimension we added is Achieving Personal Work Goals & Objectives. Whatever the talents of a particular employee, the benefits will only be felt by an organisation where they are directed towards answering the needs of the business.
Including this dimension also speaks to another aspect of graduate recruitment that we will explore further later: the opportunities employers provide for graduates to develop and to pursue career goals.
9
SHL Talent Measurement
9
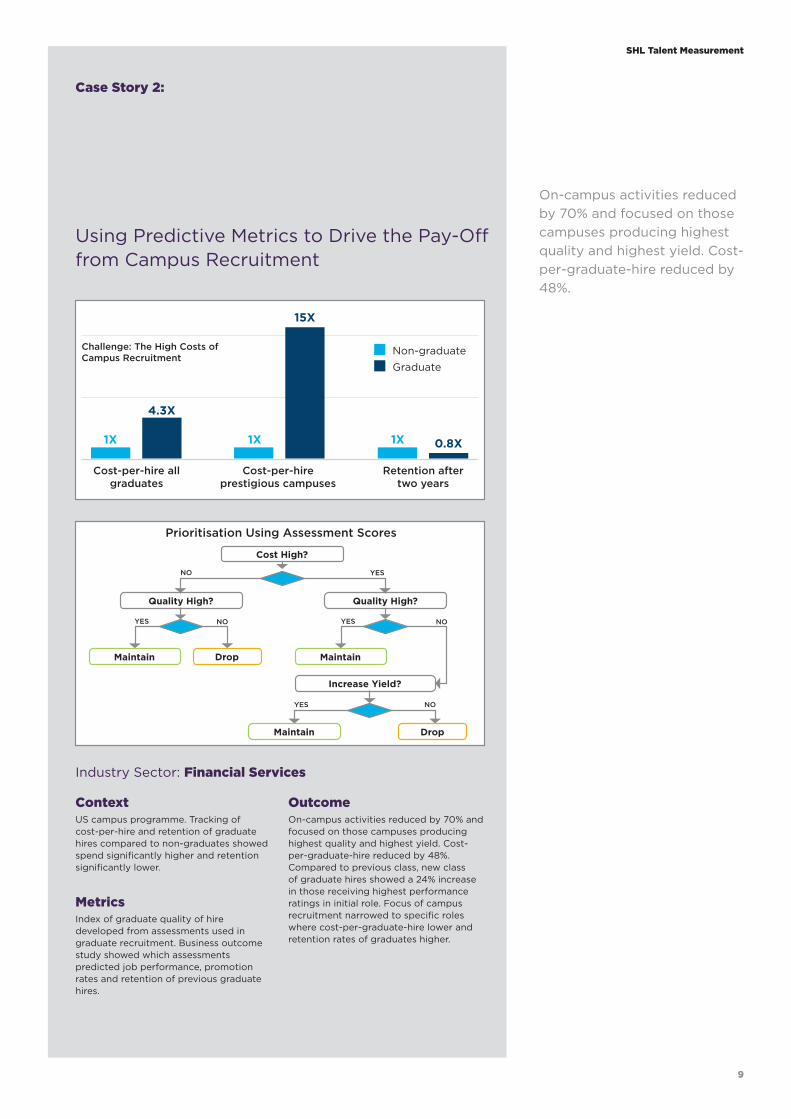
Cost-per-hire all graduates
Cost-per-hire prestigious campuses
Retention after two years
4.3X
15X
0.8X
Challenge: The High Costs of Campus Recruitment
Non-graduateGraduate
Prioritisation Using Assessment Scores
NO
NO NO
Increase Yield?
Quality High?
Cost High?
Maintain Maintain
Maintain Drop
Drop
Quality High?
YES
NOYES
YES
YES
Using Predictive Metrics to Drive the Pay-Off from Campus Recruitment
ContextUS campus programme. Tracking of cost-per-hire and retention of graduate hires compared to non-graduates showed spend significantly higher and retention significantly lower.
MetricsIndex of graduate quality of hire developed from assessments used in graduate recruitment. Business outcome study showed which assessments predicted job performance, promotion rates and retention of previous graduate hires.
OutcomeOn-campus activities reduced by 70% and focused on those campuses producing highest quality and highest yield. Cost-per-graduate-hire reduced by 48%. Compared to previous class, new class of graduate hires showed a 24% increase in those receiving highest performance ratings in initial role. Focus of campus recruitment narrowed to specific roles where cost-per-graduate-hire lower and retention rates of graduates higher.
Industry Sector: Financial Services
Case Story 2:
On-campus activities reduced by 70% and focused on those campuses producing highest quality and highest yield. Cost-per-graduate-hire reduced by 48%.
1X 1X 1X
10
Driving New Success Strategies in Graduate Recruitment
10
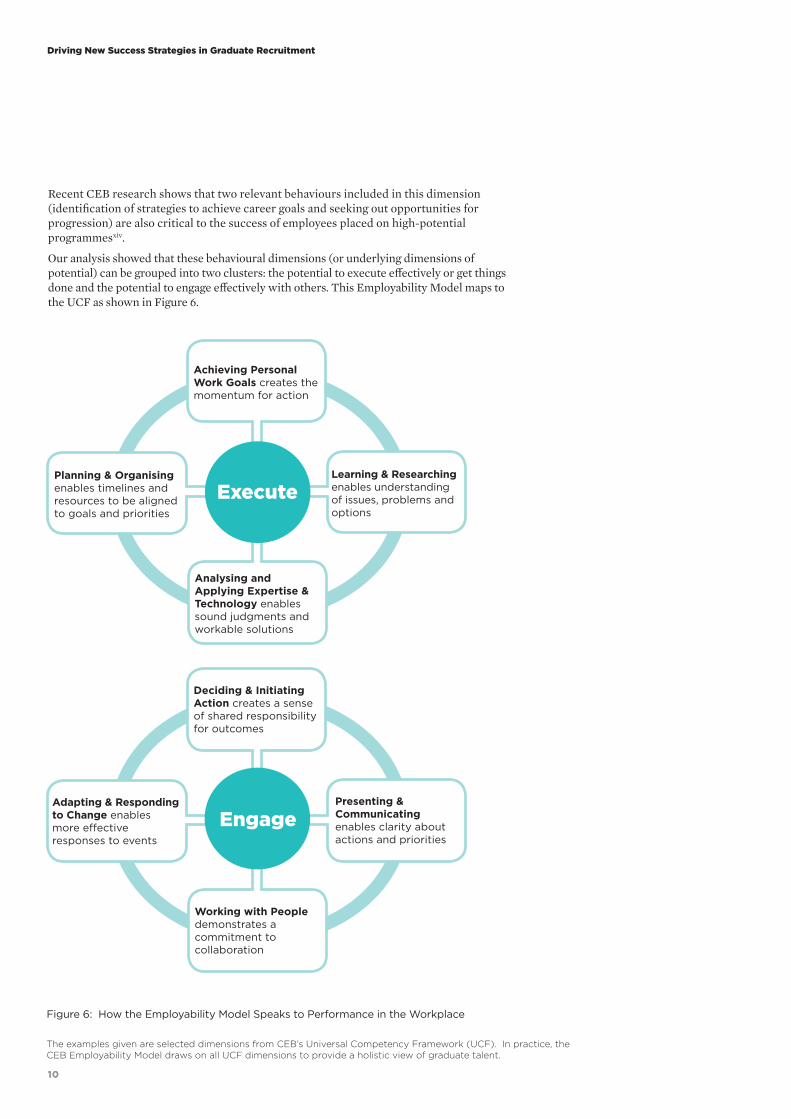
Figure 6: How the Employability Model Speaks to Performance in the Workplace
Recent CEB research shows that two relevant behaviours included in this dimension (identification of strategies to achieve career goals and seeking out opportunities for progression) are also critical to the success of employees placed on high-potential programmesxiv.
Our analysis showed that these behavioural dimensions (or underlying dimensions of potential) can be grouped into two clusters: the potential to execute effectively or get things done and the potential to engage effectively with others. This Employability Model maps to the UCF as shown in Figure 6.
Engage
Deciding & Initiating Action creates a sense of shared responsibility for outcomes
Presenting & Communicating enables clarity about actions and priorities
Working with People demonstrates a commitment to collaboration
Adapting & Responding to Change enables more effective responses to events
Achieving Personal Work Goals creates the momentum for action
Learning & Researching enables understanding of issues, problems and options
Planning & Organising enables timelines and resources to be aligned to goals and priorities
Analysing and Applying Expertise & Technology enables sound judgments and workable solutions
Execute
The examples given are selected dimensions from CEB’s Universal Competency Framework (UCF). In practice, the CEB Employability Model draws on all UCF dimensions to provide a holistic view of graduate talent.
11
SHL Talent Measurement
11
2 These 29 studies included 3,971 employees across a range of industry sectors.3 In addition to splitting our metrics for potential at the upper quartile, we also split our measure of performance into
the upper quartile. Those in the upper quartile on ratings for job performance we defined as top performers. Our analysis therefore focuses on whether those in the upper quartile on our measures of potential are also likely to be in the upper quartile for their performance as employees.
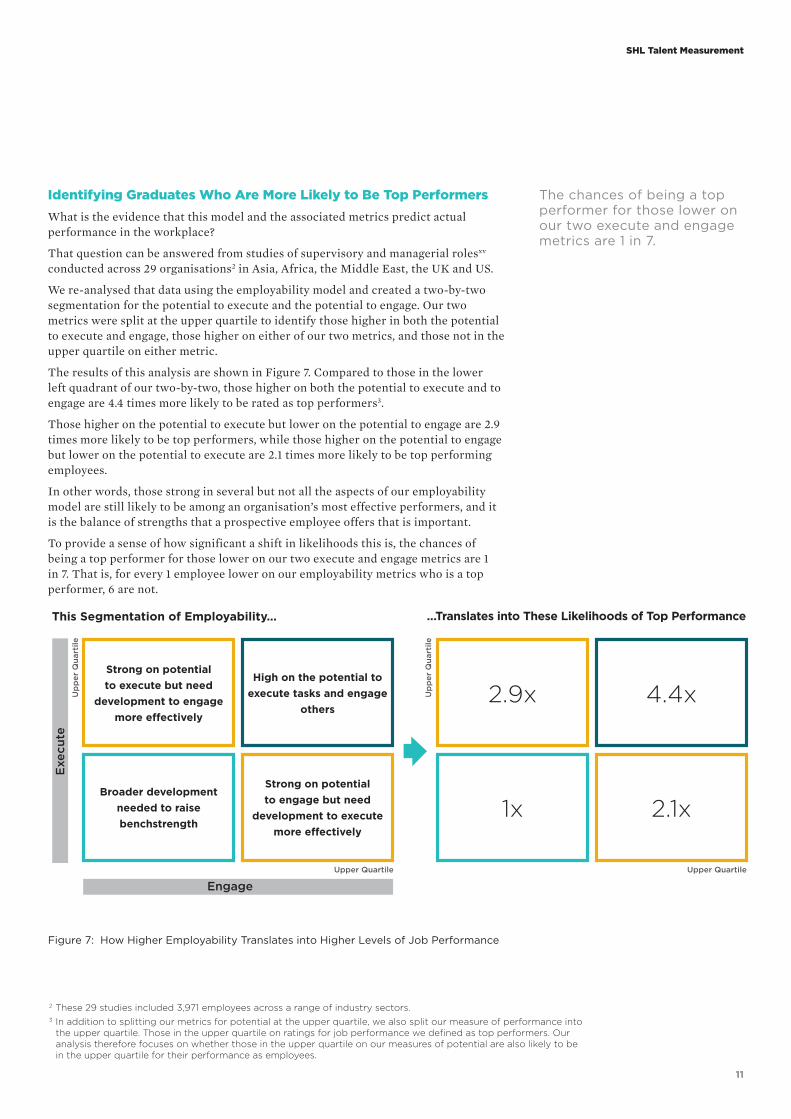
Identifying Graduates Who Are More Likely to Be Top Performers What is the evidence that this model and the associated metrics predict actual performance in the workplace?
That question can be answered from studies of supervisory and managerial rolesxv conducted across 29 organisations2 in Asia, Africa, the Middle East, the UK and US.
We re-analysed that data using the employability model and created a two-by-two segmentation for the potential to execute and the potential to engage. Our two metrics were split at the upper quartile to identify those higher in both the potential to execute and engage, those higher on either of our two metrics, and those not in the upper quartile on either metric.
The results of this analysis are shown in Figure 7. Compared to those in the lower left quadrant of our two-by-two, those higher on both the potential to execute and to engage are 4.4 times more likely to be rated as top performers3.
Those higher on the potential to execute but lower on the potential to engage are 2.9 times more likely to be top performers, while those higher on the potential to engage but lower on the potential to execute are 2.1 times more likely to be top performing employees.
In other words, those strong in several but not all the aspects of our employability model are still likely to be among an organisation’s most effective performers, and it is the balance of strengths that a prospective employee offers that is important.
To provide a sense of how significant a shift in likelihoods this is, the chances of being a top performer for those lower on our two execute and engage metrics are 1 in 7. That is, for every 1 employee lower on our employability metrics who is a top performer, 6 are not.
Figure 7: How Higher Employability Translates into Higher Levels of Job Performance
Strong on potential to execute but need
development to engage more effectively
Engage
Exe
cute
Upper Quartile
Up
per
Qua
rtile
High on the potential to execute tasks and engage
others
Broader development needed to raise benchstrength
Strong on potential to engage but need
development to execute more effectively
This Segmentation of Employability…
2.9x 4.4x
1x 2.1x
…Translates into These Likelihoods of Top Performance
Upper Quartile
Up
per
Qua
rtile
The chances of being a top performer for those lower on our two execute and engage metrics are 1 in 7.
12
Driving New Success Strategies in Graduate Recruitment
12
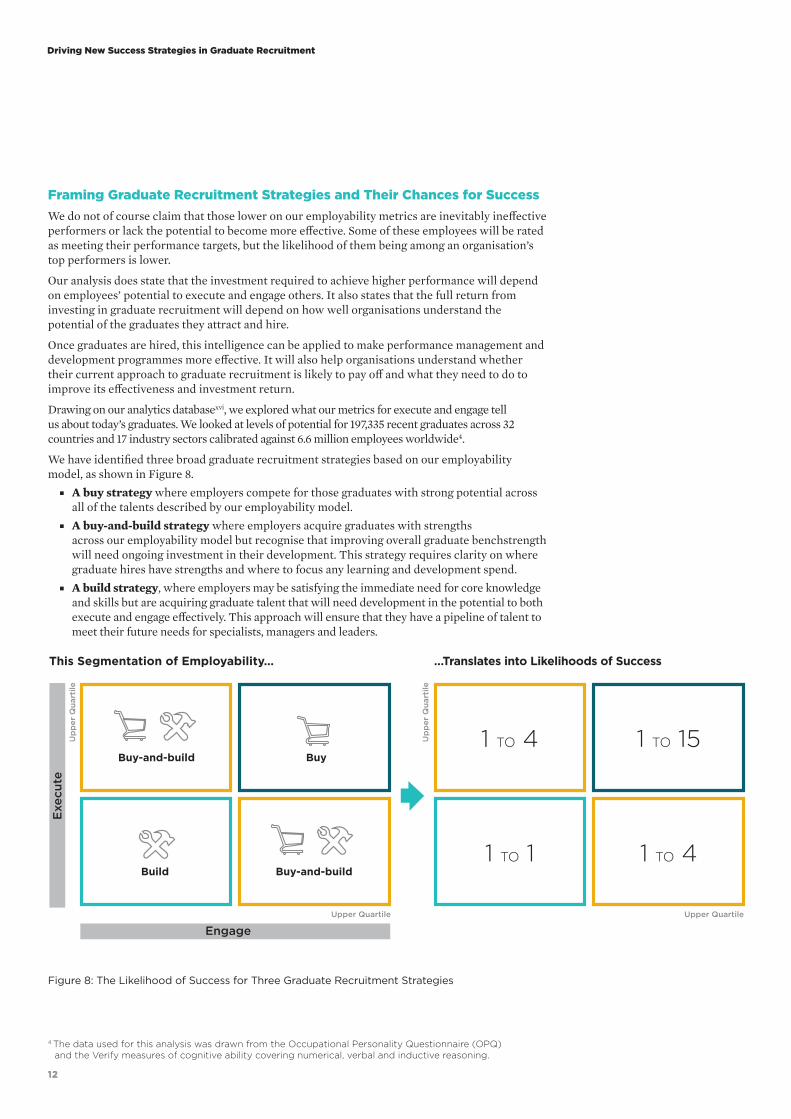
Figure 8: The Likelihood of Success for Three Graduate Recruitment Strategies
This Segmentation of Employability…
1 TO 4 1 TO 15
1 TO 1 1 TO 4
…Translates into Likelihoods of Success
Upper Quartile
Up
per
Qua
rtile
Engage
Exe
cute
Upper Quartile
Up
per
Qua
rtile
Buy-and-build
Buy-and-build
Build
Buy
Framing Graduate Recruitment Strategies and Their Chances for Success We do not of course claim that those lower on our employability metrics are inevitably ineffective performers or lack the potential to become more effective. Some of these employees will be rated as meeting their performance targets, but the likelihood of them being among an organisation’s top performers is lower.
Our analysis does state that the investment required to achieve higher performance will depend on employees’ potential to execute and engage others. It also states that the full return from investing in graduate recruitment will depend on how well organisations understand the potential of the graduates they attract and hire.
Once graduates are hired, this intelligence can be applied to make performance management and development programmes more effective. It will also help organisations understand whether their current approach to graduate recruitment is likely to pay off and what they need to do to improve its effectiveness and investment return.
Drawing on our analytics databasexvi, we explored what our metrics for execute and engage tell us about today’s graduates. We looked at levels of potential for 197,335 recent graduates across 32 countries and 17 industry sectors calibrated against 6.6 million employees worldwide4.
We have identified three broad graduate recruitment strategies based on our employability model, as shown in Figure 8.
■ A buy strategy where employers compete for those graduates with strong potential across all of the talents described by our employability model.
■ A buy-and-build strategy where employers acquire graduates with strengths across our employability model but recognise that improving overall graduate benchstrength will need ongoing investment in their development. This strategy requires clarity on where graduate hires have strengths and where to focus any learning and development spend.
■ A build strategy, where employers may be satisfying the immediate need for core knowledge and skills but are acquiring graduate talent that will need development in the potential to both execute and engage effectively. This approach will ensure that they have a pipeline of talent to meet their future needs for specialists, managers and leaders.
4 The data used for this analysis was drawn from the Occupational Personality Questionnaire (OPQ) and the Verify measures of cognitive ability covering numerical, verbal and inductive reasoning.
13
SHL Talent Measurement
13
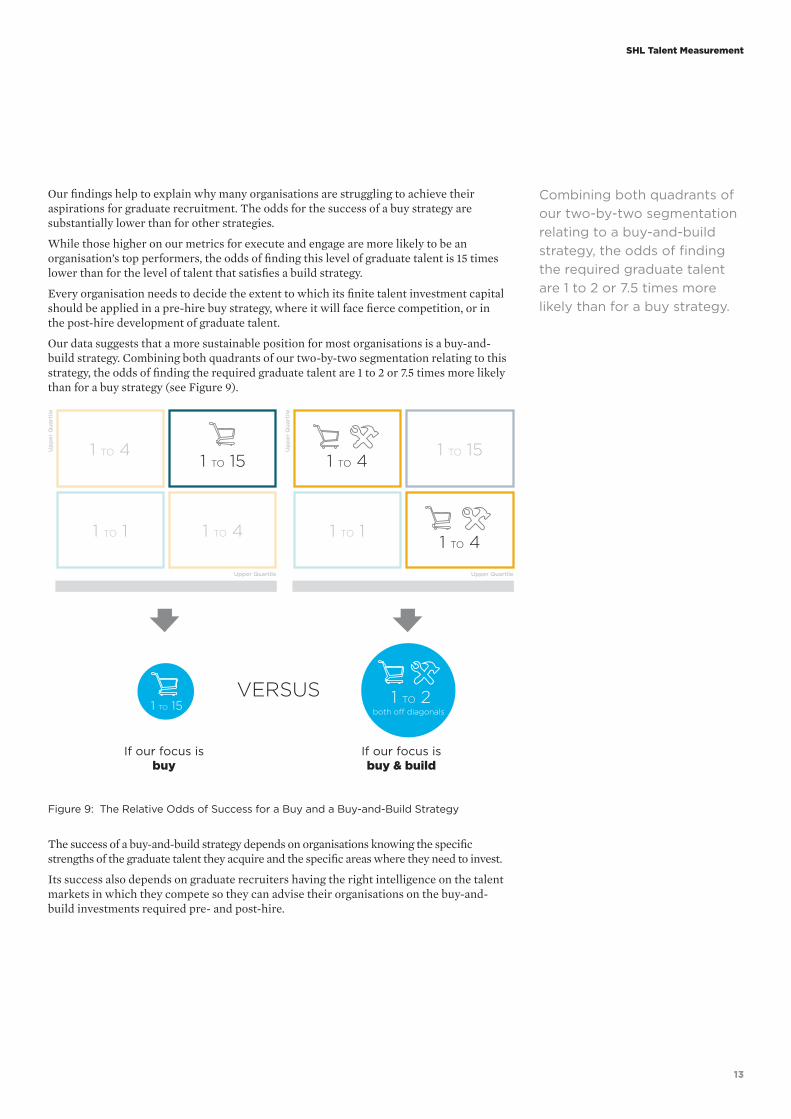
Our findings help to explain why many organisations are struggling to achieve their aspirations for graduate recruitment. The odds for the success of a buy strategy are substantially lower than for other strategies.
While those higher on our metrics for execute and engage are more likely to be an organisation’s top performers, the odds of finding this level of graduate talent is 15 times lower than for the level of talent that satisfies a build strategy.
Every organisation needs to decide the extent to which its finite talent investment capital should be applied in a pre-hire buy strategy, where it will face fierce competition, or in the post-hire development of graduate talent.
Our data suggests that a more sustainable position for most organisations is a buy-and-build strategy. Combining both quadrants of our two-by-two segmentation relating to this strategy, the odds of finding the required graduate talent are 1 to 2 or 7.5 times more likely than for a buy strategy (see Figure 9).
Figure 9: The Relative Odds of Success for a Buy and a Buy-and-Build Strategy
1 TO 41 TO 15
1 TO 1 1 TO 4
Upper Quartile
Up
per
Qua
rtile
1 TO 41 TO 15
1 TO 11 TO 4
Upper Quartile
Up
per
Qua
rtile
If our focus isbuy & build
1 TO 2both off diagonals
1 TO 15
If our focus is buy
VERSUS
The success of a buy-and-build strategy depends on organisations knowing the specific strengths of the graduate talent they acquire and the specific areas where they need to invest.
Its success also depends on graduate recruiters having the right intelligence on the talent markets in which they compete so they can advise their organisations on the buy-and-build investments required pre- and post-hire.
Combining both quadrants of our two-by-two segmentation relating to a buy-and-build strategy, the odds of finding the required graduate talent are 1 to 2 or 7.5 times more likely than for a buy strategy.
14
Driving New Success Strategies in Graduate Recruitment
14
Buy-and-BuildBuy
Figure 10: How the Odds Vary by Industry Sector
BetterOdds
AllSectors
LowerOdds
1 to 7
1 to 15
1 to 29
Retail
Insurance &Finance
Travel &Leisure
Oil & Gas
BetterOdds
AllSectors
LowerOdds
Healthcare
Travel & Leisure
Engineering
Consumer (Goods Heavy)
Public Sector
Banking
1 to 1.2
1 to 1.5
1 to 1.8
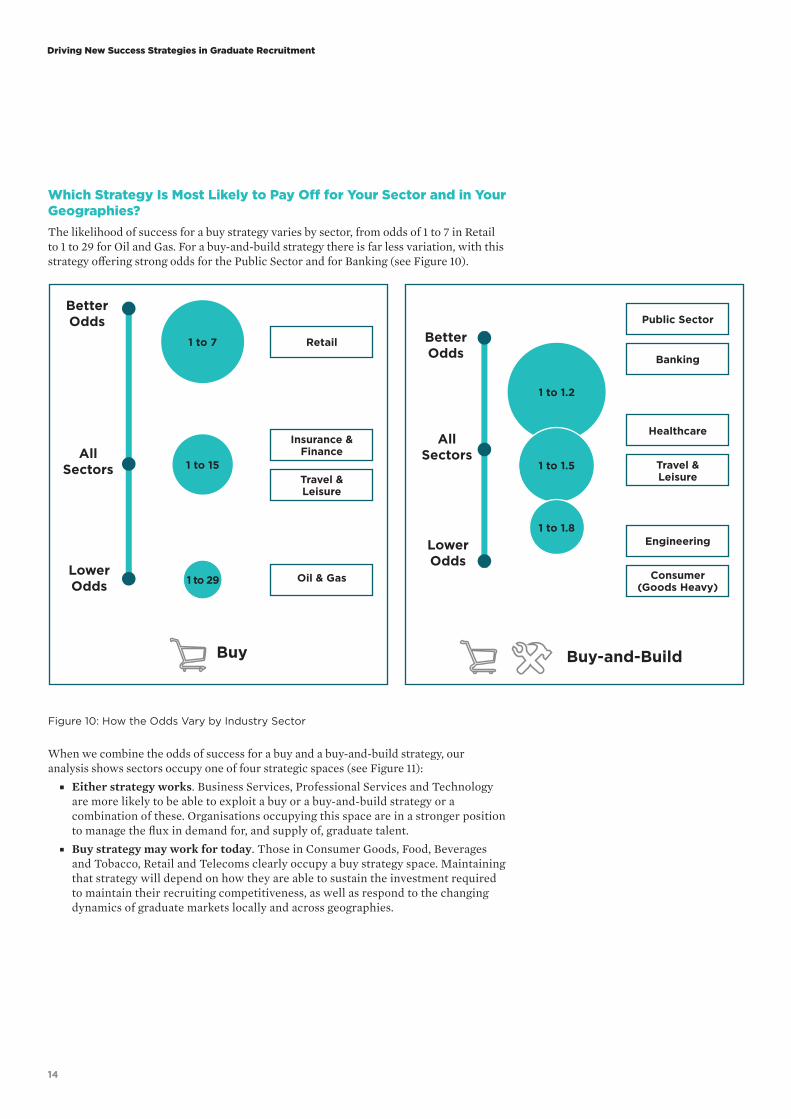
Which Strategy Is Most Likely to Pay Off for Your Sector and in Your Geographies? The likelihood of success for a buy strategy varies by sector, from odds of 1 to 7 in Retail to 1 to 29 for Oil and Gas. For a buy-and-build strategy there is far less variation, with this strategy offering strong odds for the Public Sector and for Banking (see Figure 10).
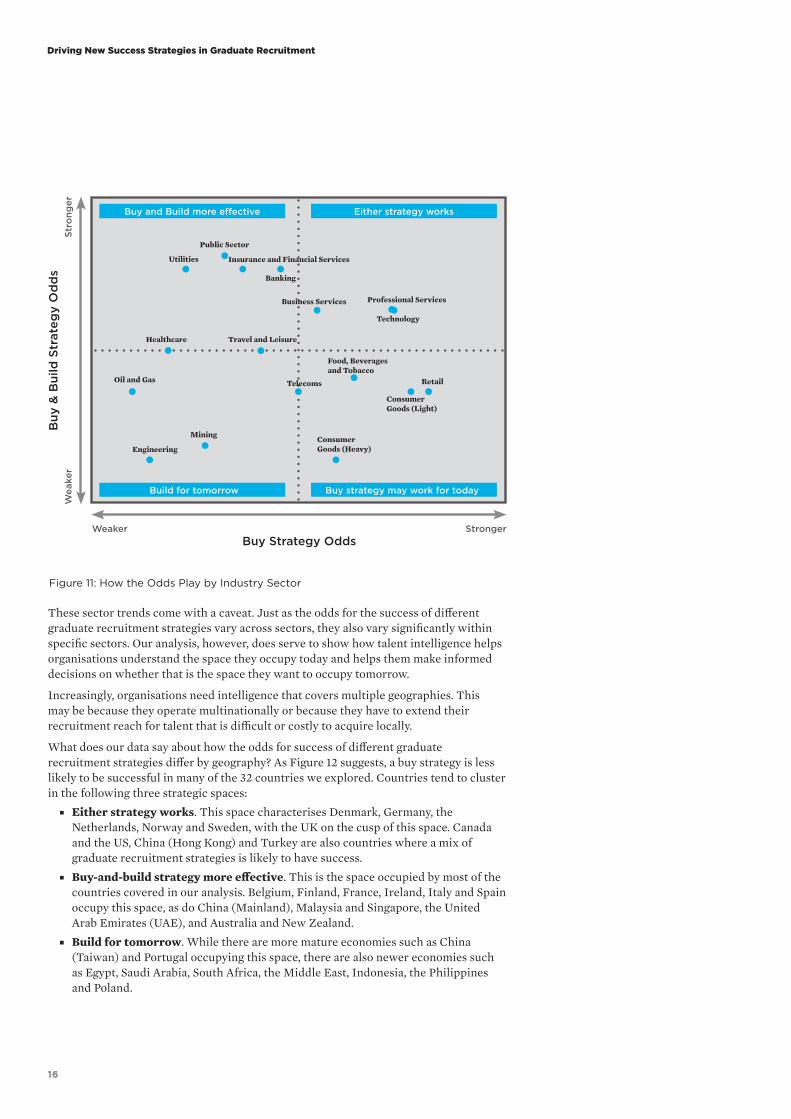
When we combine the odds of success for a buy and a buy-and-build strategy, our analysis shows sectors occupy one of four strategic spaces (see Figure 11):
■ Either strategy works. Business Services, Professional Services and Technology are more likely to be able to exploit a buy or a buy-and-build strategy or a combination of these. Organisations occupying this space are in a stronger position to manage the flux in demand for, and supply of, graduate talent.
■ Buy strategy may work for today. Those in Consumer Goods, Food, Beverages and Tobacco, Retail and Telecoms clearly occupy a buy strategy space. Maintaining that strategy will depend on how they are able to sustain the investment required to maintain their recruiting competitiveness, as well as respond to the changing dynamics of graduate markets locally and across geographies.
15
SHL Talent Measurement
15
■ Buy-and-build strategy more effective. For those in Banking, Insurance and Financial Services, the Public Sector and Utilities, the balance of pre-hire and post-hire investment in graduate talent is critical. Getting that balance right requires talent intelligence to ensure that organisations are able to compete for the graduate talent they need in the short-term, and to target learning and development to close talent gaps and build sustainable talent pipelines for the longer-term.
■ Build for tomorrow. Engineering, Mining, and Oil and Gas are sectors that rely on technical knowledge and skills. However, to provide a pipeline for managerial and leadership roles, our data shows organisations in this sector should consider whether their investment in the broader talents needed for success in more senior roles is sufficient. If this investment is insufficient, then organisations in these sectors may have to adopt a later buy strategy, competing externally to acquire the future managers and leaders they need. In contrast to the Technology sector, our data suggests that these sectors may be applying too narrow a lens on the talents they are looking for in graduate recruitment.
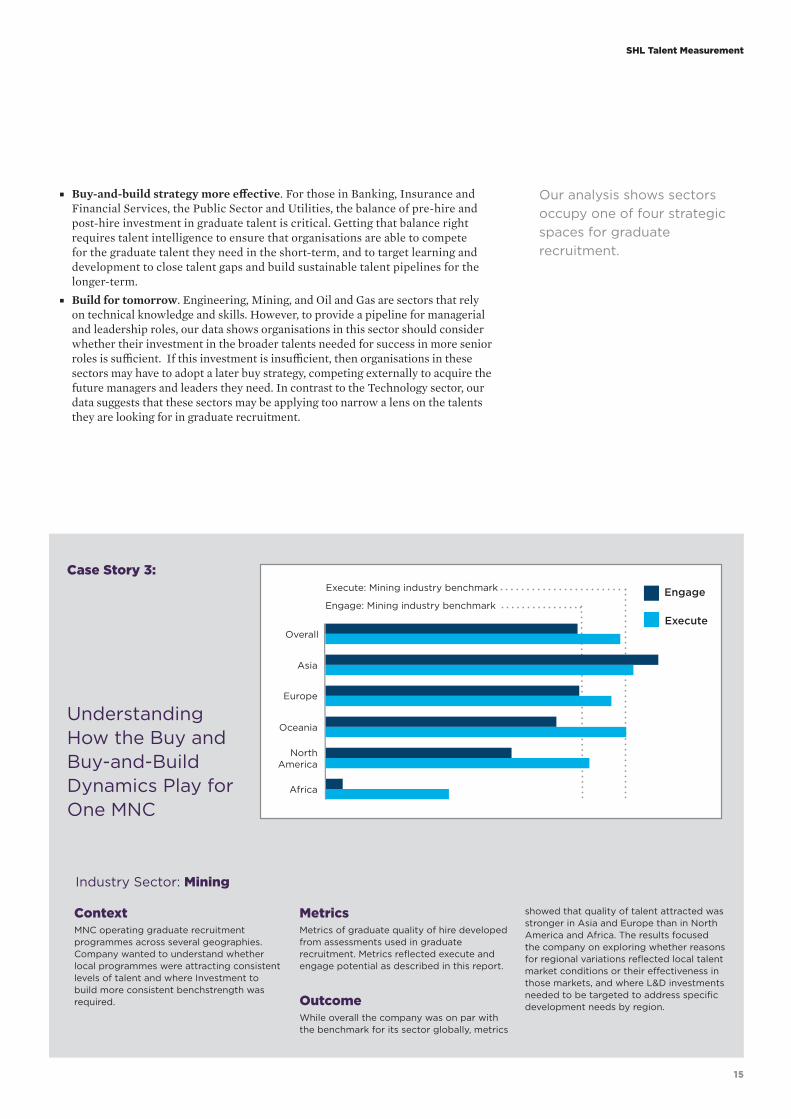
Case Story 3:
Understanding How the Buy and Buy-and-Build Dynamics Play for One MNC
ContextMNC operating graduate recruitment programmes across several geographies. Company wanted to understand whether local programmes were attracting consistent levels of talent and where Investment to build more consistent benchstrength was required.
MetricsMetrics of graduate quality of hire developed from assessments used in graduate recruitment. Metrics reflected execute and engage potential as described in this report.
OutcomeWhile overall the company was on par with the benchmark for its sector globally, metrics
showed that quality of talent attracted was stronger in Asia and Europe than in North America and Africa. The results focused the company on exploring whether reasons for regional variations reflected local talent market conditions or their effectiveness in those markets, and where L&D investments needed to be targeted to address specific development needs by region.
Industry Sector: Mining
Execute: Mining industry benchmark
Overall
Asia
Europe
Oceania
North America
Africa
Engage: Mining industry benchmark
Execute
Engage
Our analysis shows sectors occupy one of four strategic spaces for graduate recruitment.
16
Driving New Success Strategies in Graduate Recruitment
16
Figure 11: How the Odds Play by Industry Sector
Buy
& B
uild
Str
ateg
y O
dd
sW
eake
rSt
rong
er
Weaker StrongerBuy Strategy Odds
Consumer Goods (Light)
RetailTelecoms
Food, Beverages and Tobacco
Consumer Goods (Heavy)
Technology
Professional ServicesBusiness Services
Travel and LeisureHealthcare
Oil and Gas
Mining
Engineering
Utilities
Banking
Public Sector
Insurance and Financial Services
Buy strategy may work for today
Either strategy works
Build for tomorrow
Buy and Build more effective
These sector trends come with a caveat. Just as the odds for the success of different graduate recruitment strategies vary across sectors, they also vary significantly within specific sectors. Our analysis, however, does serve to show how talent intelligence helps organisations understand the space they occupy today and helps them make informed decisions on whether that is the space they want to occupy tomorrow.
Increasingly, organisations need intelligence that covers multiple geographies. This may be because they operate multinationally or because they have to extend their recruitment reach for talent that is difficult or costly to acquire locally.
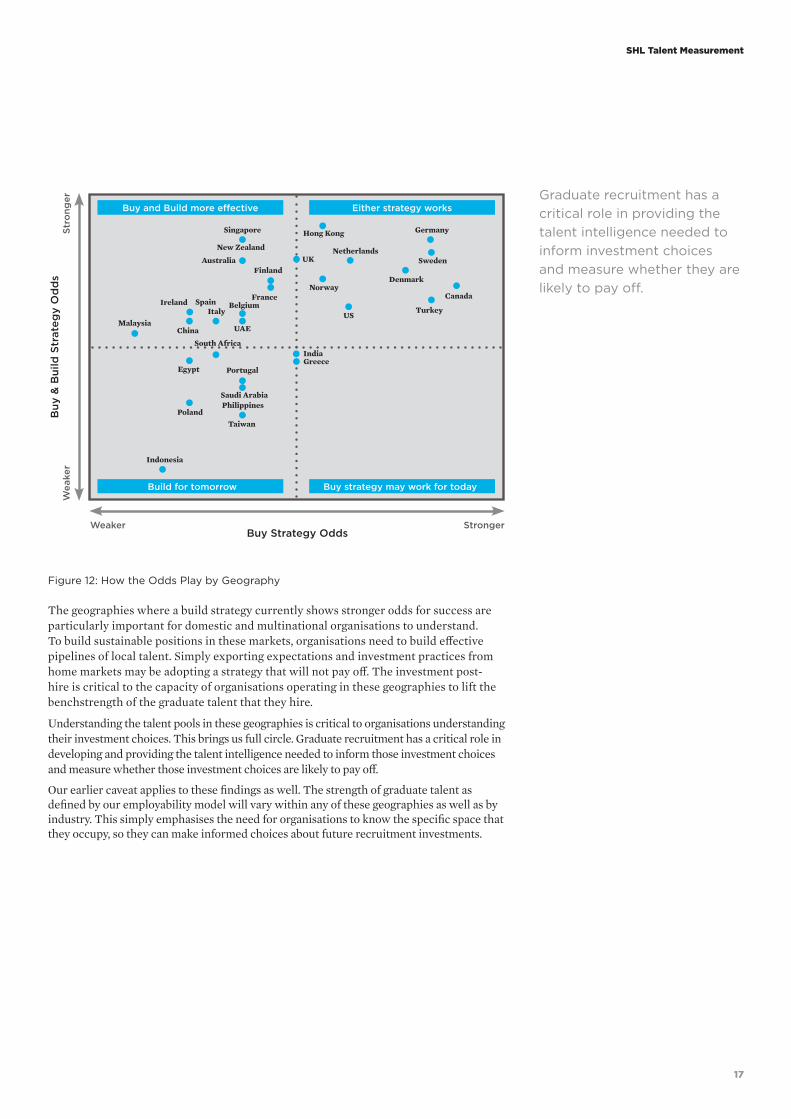
What does our data say about how the odds for success of different graduate recruitment strategies differ by geography? As Figure 12 suggests, a buy strategy is less likely to be successful in many of the 32 countries we explored. Countries tend to cluster in the following three strategic spaces:
■ Either strategy works. This space characterises Denmark, Germany, the Netherlands, Norway and Sweden, with the UK on the cusp of this space. Canada and the US, China (Hong Kong) and Turkey are also countries where a mix of graduate recruitment strategies is likely to have success.
■ Buy-and-build strategy more effective. This is the space occupied by most of the countries covered in our analysis. Belgium, Finland, France, Ireland, Italy and Spain occupy this space, as do China (Mainland), Malaysia and Singapore, the United Arab Emirates (UAE), and Australia and New Zealand.
■ Build for tomorrow. While there are more mature economies such as China (Taiwan) and Portugal occupying this space, there are also newer economies such as Egypt, Saudi Arabia, South Africa, the Middle East, Indonesia, the Philippines and Poland.
17
SHL Talent Measurement
17
Figure 12: How the Odds Play by Geography
Buy
& B
uild
Str
ateg
y O
dd
sW
eake
rSt
rong
er
Weaker StrongerBuy Strategy Odds
Egypt
Saudi Arabia
Portugal
Turkey
PolandTaiwan
Indonesia
Sweden
Germany
Denmark
Buy strategy may work for today
Either strategy works
Build for tomorrow
Buy and Build more effective
South Africa
GreeceIndia
US
CanadaNorway
Netherlands
Hong Kong
UK
Philippines
France
FinlandAustralia
Singapore
New Zealand
MalaysiaChina
IrelandItaly
Belgium
UAE
Spain
The geographies where a build strategy currently shows stronger odds for success are particularly important for domestic and multinational organisations to understand. To build sustainable positions in these markets, organisations need to build effective pipelines of local talent. Simply exporting expectations and investment practices from home markets may be adopting a strategy that will not pay off. The investment post-hire is critical to the capacity of organisations operating in these geographies to lift the benchstrength of the graduate talent that they hire.
Understanding the talent pools in these geographies is critical to organisations understanding their investment choices. This brings us full circle. Graduate recruitment has a critical role in developing and providing the talent intelligence needed to inform those investment choices and measure whether those investment choices are likely to pay off.
Our earlier caveat applies to these findings as well. The strength of graduate talent as defined by our employability model will vary within any of these geographies as well as by industry. This simply emphasises the need for organisations to know the specific space that they occupy, so they can make informed choices about future recruitment investments.
Graduate recruitment has a critical role in providing the talent intelligence needed to inform investment choices and measure whether they are likely to pay off.
1818
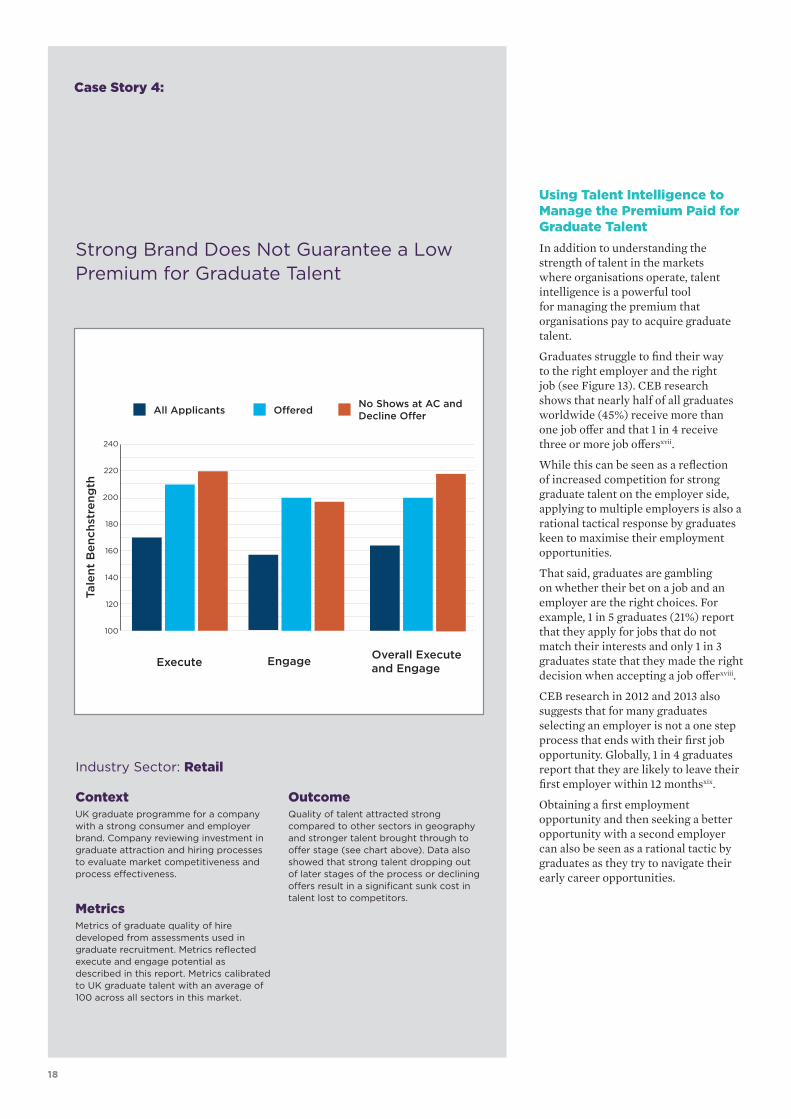
Case Story 4:
ContextUK graduate programme for a company with a strong consumer and employer brand. Company reviewing investment in graduate attraction and hiring processes to evaluate market competitiveness and process effectiveness.
MetricsMetrics of graduate quality of hire developed from assessments used in graduate recruitment. Metrics reflected execute and engage potential as described in this report. Metrics calibrated to UK graduate talent with an average of 100 across all sectors in this market.
OutcomeQuality of talent attracted strong compared to other sectors in geography and stronger talent brought through to offer stage (see chart above). Data also showed that strong talent dropping out of later stages of the process or declining offers result in a significant sunk cost in talent lost to competitors.
Industry Sector: Retail
OfferedAll Applicants No Shows at AC and Decline Offer
240
220
200
180
160
140
120
100
Execute Engage Overall Execute and Engage
Tale
nt B
ench
stre
ngth
Using Talent Intelligence to Manage the Premium Paid for Graduate Talent In addition to understanding the strength of talent in the markets where organisations operate, talent intelligence is a powerful tool for managing the premium that organisations pay to acquire graduate talent.
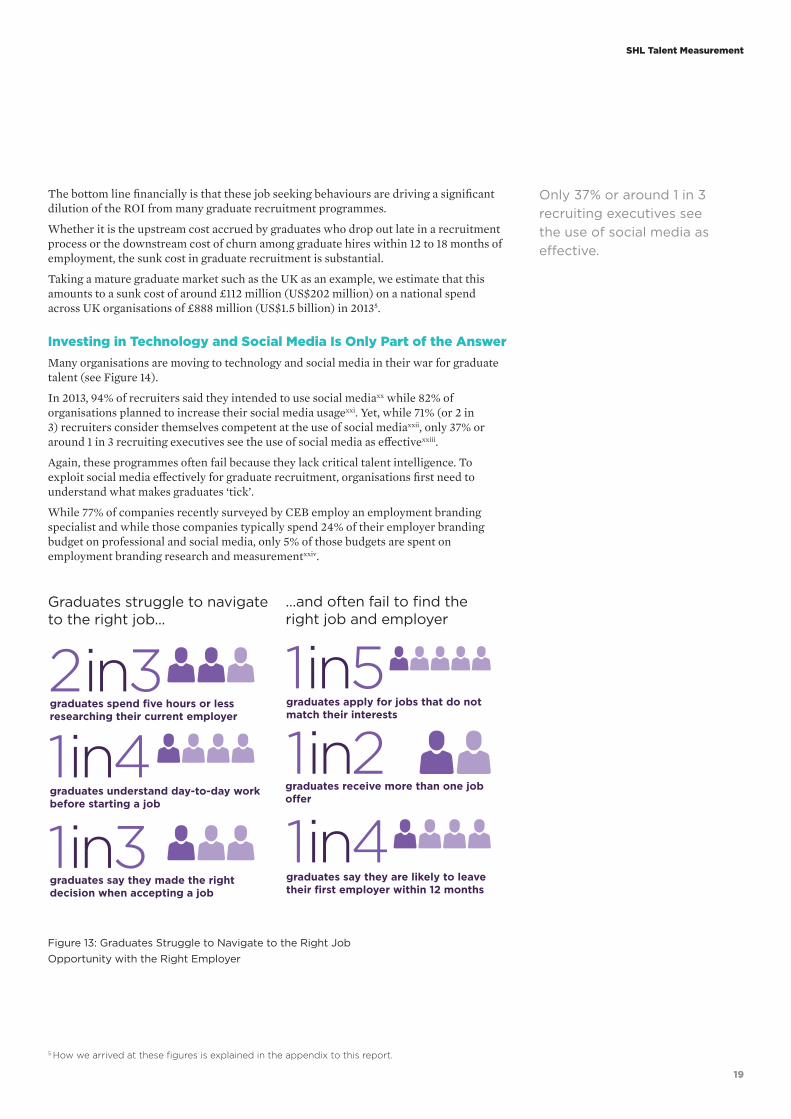
Graduates struggle to find their way to the right employer and the right job (see Figure 13). CEB research shows that nearly half of all graduates worldwide (45%) receive more than one job offer and that 1 in 4 receive three or more job offersxvii.
While this can be seen as a reflection of increased competition for strong graduate talent on the employer side, applying to multiple employers is also a rational tactical response by graduates keen to maximise their employment opportunities.
That said, graduates are gambling on whether their bet on a job and an employer are the right choices. For example, 1 in 5 graduates (21%) report that they apply for jobs that do not match their interests and only 1 in 3 graduates state that they made the right decision when accepting a job offerxviii.
CEB research in 2012 and 2013 also suggests that for many graduates selecting an employer is not a one step process that ends with their first job opportunity. Globally, 1 in 4 graduates report that they are likely to leave their first employer within 12 monthsxix.
Obtaining a first employment opportunity and then seeking a better opportunity with a second employer can also be seen as a rational tactic by graduates as they try to navigate their early career opportunities.
Strong Brand Does Not Guarantee a Low Premium for Graduate Talent
19
SHL Talent Measurement
19
The bottom line financially is that these job seeking behaviours are driving a significant dilution of the ROI from many graduate recruitment programmes.
Whether it is the upstream cost accrued by graduates who drop out late in a recruitment process or the downstream cost of churn among graduate hires within 12 to 18 months of employment, the sunk cost in graduate recruitment is substantial.
Taking a mature graduate market such as the UK as an example, we estimate that this amounts to a sunk cost of around £112 million (US$202 million) on a national spend across UK organisations of £888 million (US$1.5 billion) in 20135.
Investing in Technology and Social Media Is Only Part of the Answer Many organisations are moving to technology and social media in their war for graduate talent (see Figure 14).
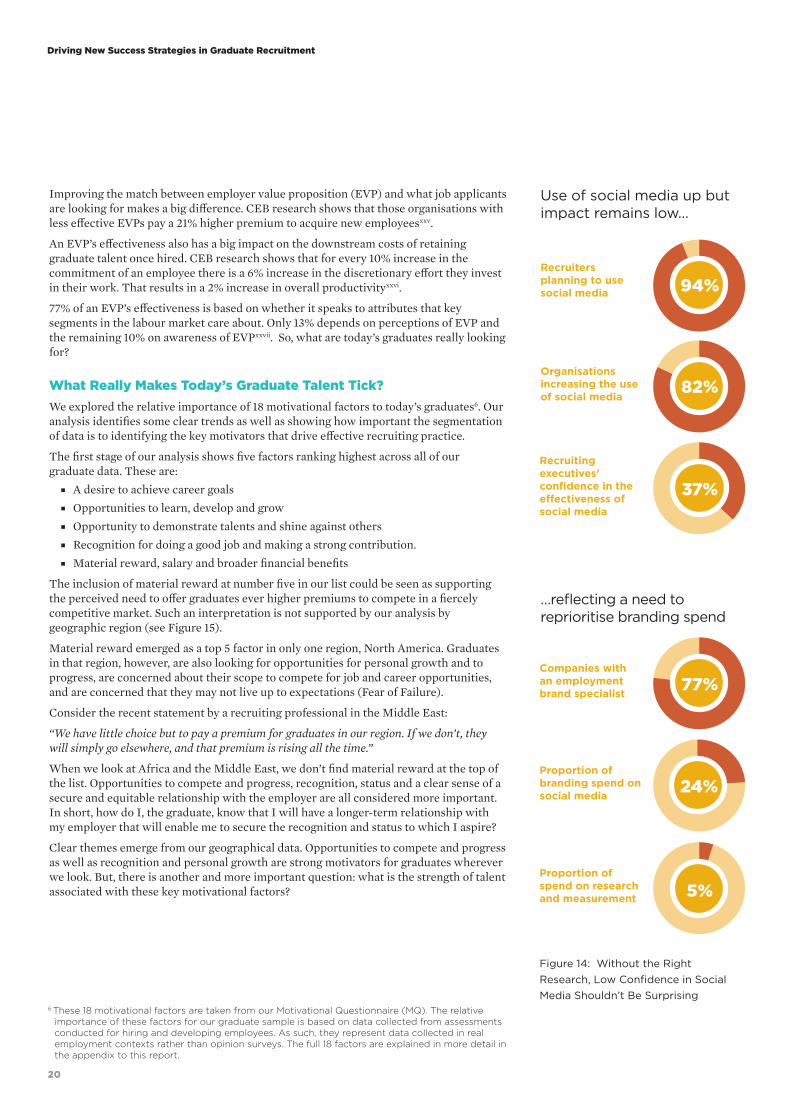
In 2013, 94% of recruiters said they intended to use social mediaxx while 82% of organisations planned to increase their social media usagexxi. Yet, while 71% (or 2 in 3) recruiters consider themselves competent at the use of social mediaxxii, only 37% or around 1 in 3 recruiting executives see the use of social media as effectivexxiii.
Again, these programmes often fail because they lack critical talent intelligence. To exploit social media effectively for graduate recruitment, organisations first need to understand what makes graduates ‘tick’.
While 77% of companies recently surveyed by CEB employ an employment branding specialist and while those companies typically spend 24% of their employer branding budget on professional and social media, only 5% of those budgets are spent on employment branding research and measurementxxiv.
5 How we arrived at these figures is explained in the appendix to this report.
graduates spend five hours or less researching their current employer
2in3
graduates understand day-to-day work before starting a job
1in4
graduates say they made the right decision when accepting a job
1in3
1in5graduates apply for jobs that do not match their interests
graduates receive more than one job offer
1in2
Figure 13: Graduates Struggle to Navigate to the Right Job Opportunity with the Right Employer
graduates say they are likely to leave their first employer within 12 months
1in4
…and often fail to find the right job and employer
Graduates struggle to navigate to the right job...
Only 37% or around 1 in 3 recruiting executives see the use of social media as effective.
20
Driving New Success Strategies in Graduate Recruitment
20
Improving the match between employer value proposition (EVP) and what job applicants are looking for makes a big difference. CEB research shows that those organisations with less effective EVPs pay a 21% higher premium to acquire new employeesxxv.
An EVP’s effectiveness also has a big impact on the downstream costs of retaining graduate talent once hired. CEB research shows that for every 10% increase in the commitment of an employee there is a 6% increase in the discretionary effort they invest in their work. That results in a 2% increase in overall productivityxxvi.
77% of an EVP’s effectiveness is based on whether it speaks to attributes that key segments in the labour market care about. Only 13% depends on perceptions of EVP and the remaining 10% on awareness of EVPxxvii. So, what are today’s graduates really looking for?
What Really Makes Today’s Graduate Talent Tick? We explored the relative importance of 18 motivational factors to today’s graduates6. Our analysis identifies some clear trends as well as showing how important the segmentation of data is to identifying the key motivators that drive effective recruiting practice.
The first stage of our analysis shows five factors ranking highest across all of our graduate data. These are:
■ A desire to achieve career goals ■ Opportunities to learn, develop and grow ■ Opportunity to demonstrate talents and shine against others ■ Recognition for doing a good job and making a strong contribution. ■ Material reward, salary and broader financial benefits
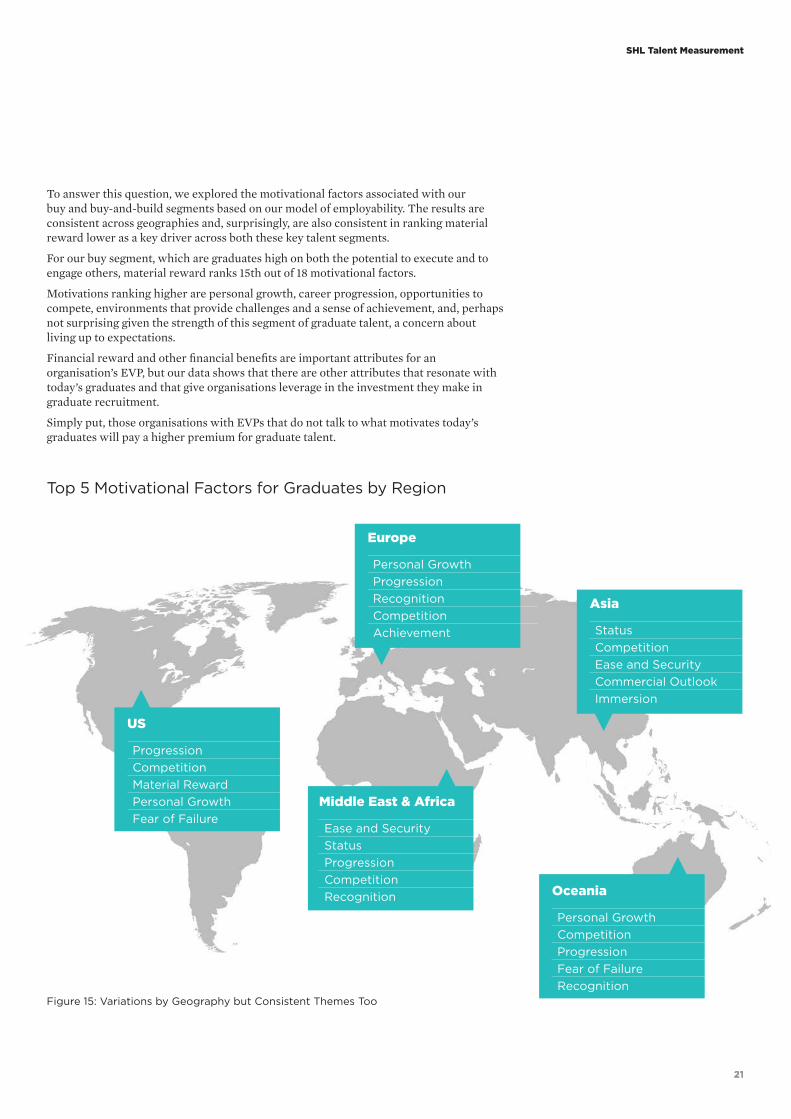
The inclusion of material reward at number five in our list could be seen as supporting the perceived need to offer graduates ever higher premiums to compete in a fiercely competitive market. Such an interpretation is not supported by our analysis by geographic region (see Figure 15).
Material reward emerged as a top 5 factor in only one region, North America. Graduates in that region, however, are also looking for opportunities for personal growth and to progress, are concerned about their scope to compete for job and career opportunities, and are concerned that they may not live up to expectations (Fear of Failure).
Consider the recent statement by a recruiting professional in the Middle East:
“We have little choice but to pay a premium for graduates in our region. If we don’t, they will simply go elsewhere, and that premium is rising all the time.”
When we look at Africa and the Middle East, we don’t find material reward at the top of the list. Opportunities to compete and progress, recognition, status and a clear sense of a secure and equitable relationship with the employer are all considered more important. In short, how do I, the graduate, know that I will have a longer-term relationship with my employer that will enable me to secure the recognition and status to which I aspire?
Clear themes emerge from our geographical data. Opportunities to compete and progress as well as recognition and personal growth are strong motivators for graduates wherever we look. But, there is another and more important question: what is the strength of talent associated with these key motivational factors?
6 These 18 motivational factors are taken from our Motivational Questionnaire (MQ). The relative importance of these factors for our graduate sample is based on data collected from assessments conducted for hiring and developing employees. As such, they represent data collected in real employment contexts rather than opinion surveys. The full 18 factors are explained in more detail in the appendix to this report.
Recruiters planning to use social media 94%
Figure 14: Without the Right Research, Low Confidence in Social Media Shouldn’t Be Surprising
82%Organisations increasing the use of social media
37%
Recruiting executives’ confidence in the effectiveness of social media
77%Companies with an employment brand specialist
Proportion of branding spend on social media
24%
Proportion of spend on research and measurement 5%
…reflecting a need to reprioritise branding spend
Use of social media up but impact remains low…
21
SHL Talent Measurement
21
Figure 15: Variations by Geography but Consistent Themes Too
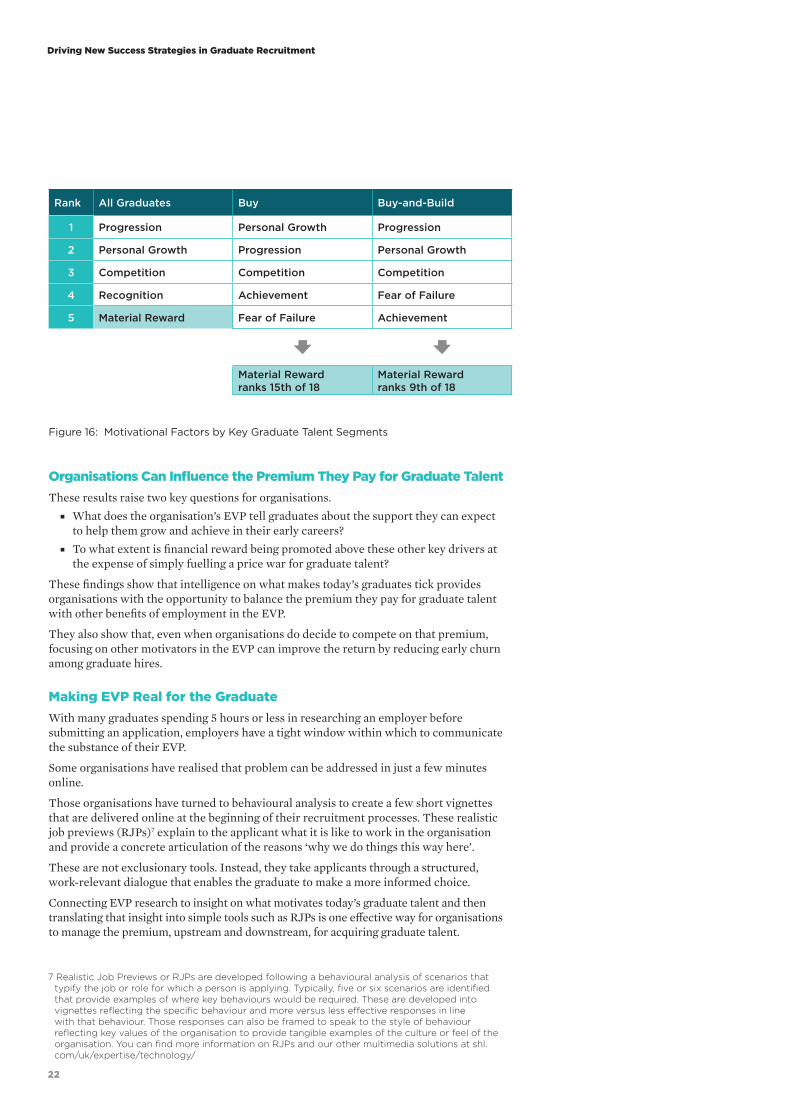
To answer this question, we explored the motivational factors associated with our buy and buy-and-build segments based on our model of employability. The results are consistent across geographies and, surprisingly, are also consistent in ranking material reward lower as a key driver across both these key talent segments.
For our buy segment, which are graduates high on both the potential to execute and to engage others, material reward ranks 15th out of 18 motivational factors.
Motivations ranking higher are personal growth, career progression, opportunities to compete, environments that provide challenges and a sense of achievement, and, perhaps not surprising given the strength of this segment of graduate talent, a concern about living up to expectations.
Financial reward and other financial benefits are important attributes for an organisation’s EVP, but our data shows that there are other attributes that resonate with today’s graduates and that give organisations leverage in the investment they make in graduate recruitment.
Simply put, those organisations with EVPs that do not talk to what motivates today’s graduates will pay a higher premium for graduate talent.
US
ProgressionCompetitionMaterial RewardPersonal GrowthFear of Failure
Middle East & Africa
Ease and SecurityStatusProgressionCompetitionRecognition
Europe
Personal GrowthProgressionRecognitionCompetitionAchievement
Oceania
Personal GrowthCompetitionProgressionFear of FailureRecognition
Top 5 Motivational Factors for Graduates by Region
Asia
StatusCompetitionEase and SecurityCommercial OutlookImmersion
22
Driving New Success Strategies in Graduate Recruitment
22
Organisations Can Influence the Premium They Pay for Graduate Talent These results raise two key questions for organisations.
■ What does the organisation’s EVP tell graduates about the support they can expect to help them grow and achieve in their early careers?
■ To what extent is financial reward being promoted above these other key drivers at the expense of simply fuelling a price war for graduate talent?
These findings show that intelligence on what makes today’s graduates tick provides organisations with the opportunity to balance the premium they pay for graduate talent with other benefits of employment in the EVP.
They also show that, even when organisations do decide to compete on that premium, focusing on other motivators in the EVP can improve the return by reducing early churn among graduate hires.
Making EVP Real for the Graduate With many graduates spending 5 hours or less in researching an employer before submitting an application, employers have a tight window within which to communicate the substance of their EVP.
Some organisations have realised that problem can be addressed in just a few minutes online.
Those organisations have turned to behavioural analysis to create a few short vignettes that are delivered online at the beginning of their recruitment processes. These realistic job previews (RJPs)7 explain to the applicant what it is like to work in the organisation and provide a concrete articulation of the reasons ‘why we do things this way here’.
These are not exclusionary tools. Instead, they take applicants through a structured, work-relevant dialogue that enables the graduate to make a more informed choice.
Connecting EVP research to insight on what motivates today’s graduate talent and then translating that insight into simple tools such as RJPs is one effective way for organisations to manage the premium, upstream and downstream, for acquiring graduate talent.
7 Realistic Job Previews or RJPs are developed following a behavioural analysis of scenarios that typify the job or role for which a person is applying. Typically, five or six scenarios are identified that provide examples of where key behaviours would be required. These are developed into vignettes reflecting the specific behaviour and more versus less effective responses in line with that behaviour. Those responses can also be framed to speak to the style of behaviour reflecting key values of the organisation to provide tangible examples of the culture or feel of the organisation. You can find more information on RJPs and our other multimedia solutions at shl.com/uk/expertise/technology/
Figure 16: Motivational Factors by Key Graduate Talent Segments
Rank All Graduates Buy Buy-and-Build
1 Progression Personal Growth Progression
2 Personal Growth Progression Personal Growth
3 Competition Competition Competition
4 Recognition Achievement Fear of Failure
5 Material Reward Fear of Failure Achievement
Material Rewardranks 15th of 18
Material Rewardranks 9th of 18
23
SHL Talent Measurement
23
The Value of a Talent Intelligence Led Recruitment Function The need for graduate recruiters to provide proactive intelligence was reinforced by a recent observation made by a former chief strategy officer at a leading US company:
“Executives, by nature, have trouble seeing bad news coming … [They need] the ability to see problems before they arrive, in time to do something about them.”
Our analysis shows that graduate recruitment processes can provide talent intelligence to meet this need. A simple model of employability, framed by key behaviours that drive effective job performance in the short-term and fuel broader potential for future roles, provides a clear lens through which organisations can know the talent space they occupy.
That lens, combined with intelligence on what really motivates today’s graduates, is a powerful lever for driving more effective investment in graduate recruitment, and for managing the premium that organisations pay for graduate talent and the return they see for paying that premium.
That intelligence goes further in increasing the likelihood that graduates make an informed choice when they apply to an employer, that they commit to and persevere through an organisation’s recruitment process, and that they stay with the organisation once they are hired.
A simple model of employability, framed by key behaviours that drive effective job performance, provides a clear lens through which organisations can know the talent space they occupy.
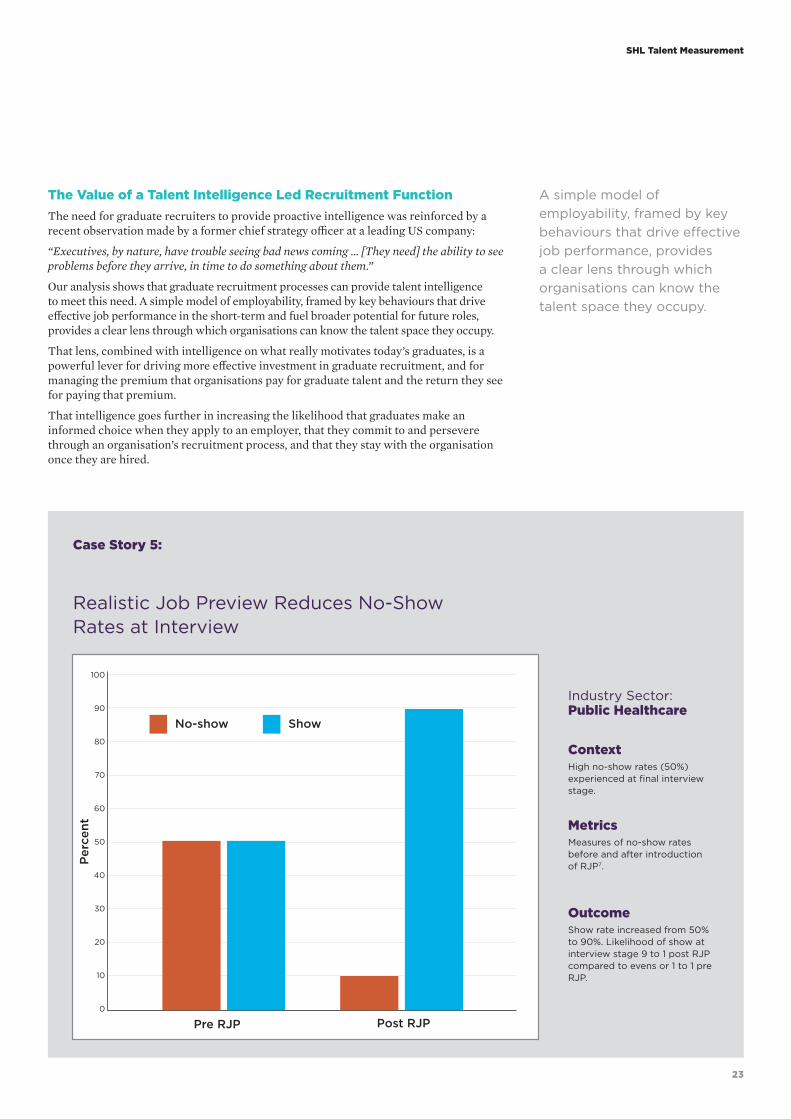
Case Story 5:
Realistic Job Preview Reduces No-Show Rates at Interview
ContextHigh no-show rates (50%) experienced at final interview stage.
MetricsMeasures of no-show rates before and after introduction of RJP7.
OutcomeShow rate increased from 50% to 90%. Likelihood of show at interview stage 9 to 1 post RJP compared to evens or 1 to 1 pre RJP.
Industry Sector: Public Healthcare
100
90
80
70
60
50
40
30
20
10
0
Pre RJP Post RJP
No-show Show
Per
cent
24
Driving New Success Strategies in Graduate Recruitment
24
Recruitment Know Thyself: the Rise of the Talent Advisor So far, we have explored talent intelligence in the context of understanding the landscape of graduate recruitment and how to manage the premium paid for graduate talent. That alone drives a new set of requirements for the talents needed by today’s graduate recruitment function.
Added to the demand for a more proactive role in shaping the thinking of business leaders and in ensuring that graduate recruitment is aligned to both shorter-term and longer-terms needs, there is an even stronger imperative for the graduate recruitment function to know whether it has the talents in place to deliver against those needs.
This new world of recruitment is seeing the rise of a new role, that of the talent advisorxxviii. This is a role that goes beyond responding to line management demands to fill vacancies. Talent advisors work with business partners and leaders to shape talent strategy in line with business strategy.
A talent advisor requires effective networks within and outside an organisation to develop and refine the kind of talent intelligence we describe in this report. The role also demands that recruitment professionals and leaders do more than just communicate that intelligence. They need to exert influence in shaping the action that business leaders will take.
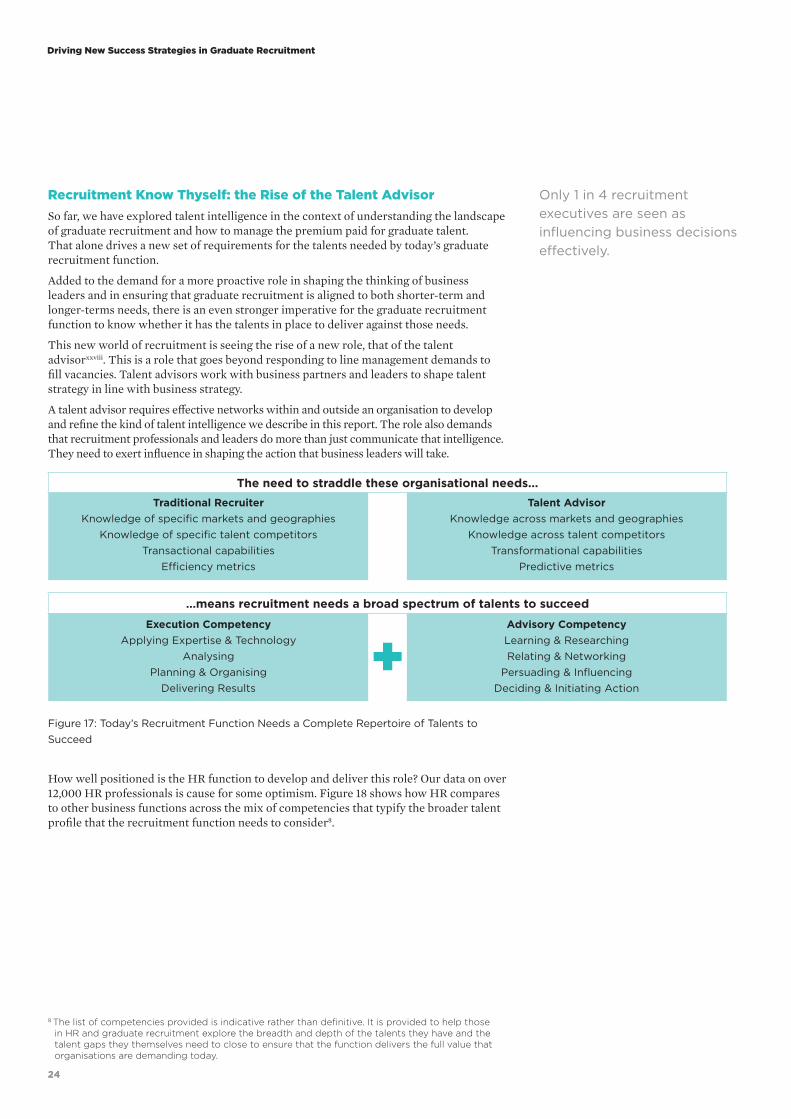
…means recruitment needs a broad spectrum of talents to succeed
Execution CompetencyApplying Expertise & Technology
AnalysingPlanning & Organising
Delivering Results
Advisory CompetencyLearning & ResearchingRelating & Networking
Persuading & InfluencingDeciding & Initiating Action
Figure 17: Today’s Recruitment Function Needs a Complete Repertoire of Talents to Succeed
The need to straddle these organisational needs...Traditional Recruiter
Knowledge of specific markets and geographiesKnowledge of specific talent competitors
Transactional capabilitiesEfficiency metrics
Talent AdvisorKnowledge across markets and geographies
Knowledge across talent competitorsTransformational capabilities
Predictive metrics
+
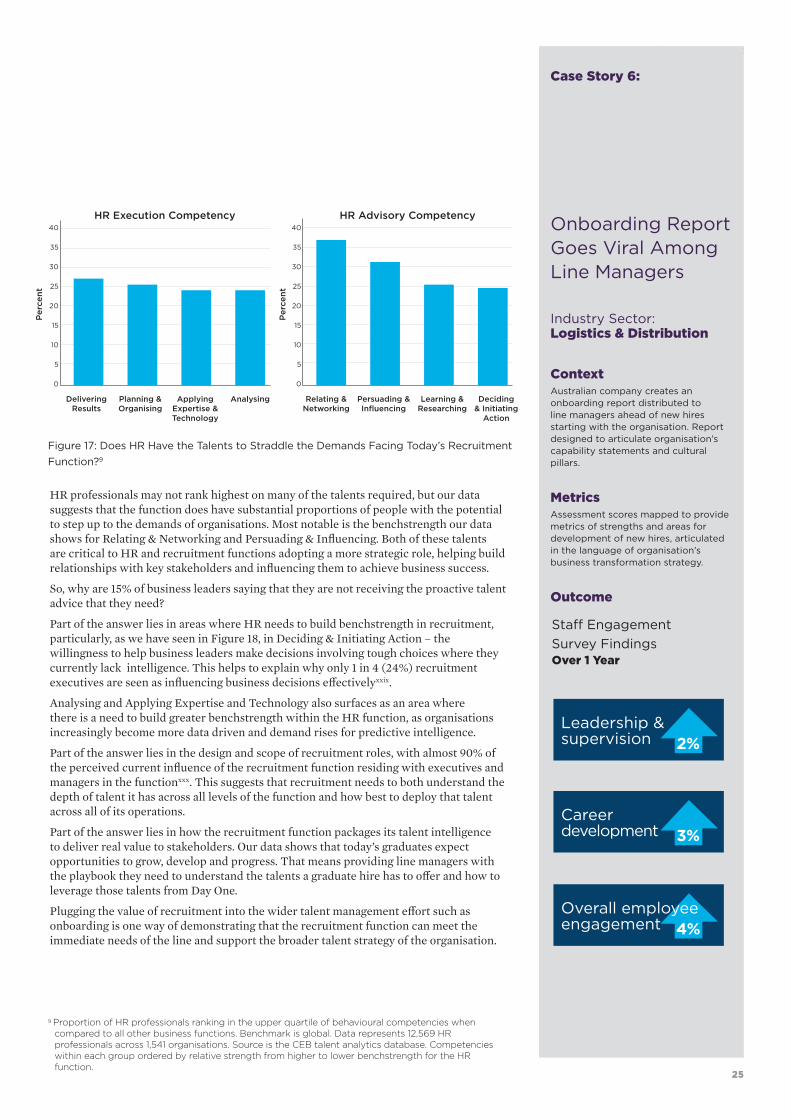
How well positioned is the HR function to develop and deliver this role? Our data on over 12,000 HR professionals is cause for some optimism. Figure 18 shows how HR compares to other business functions across the mix of competencies that typify the broader talent profile that the recruitment function needs to consider8.
8 The list of competencies provided is indicative rather than definitive. It is provided to help those in HR and graduate recruitment explore the breadth and depth of the talents they have and the talent gaps they themselves need to close to ensure that the function delivers the full value that organisations are demanding today.
Only 1 in 4 recruitment executives are seen as influencing business decisions effectively.
25
SHL Talent Measurement
25
HR professionals may not rank highest on many of the talents required, but our data suggests that the function does have substantial proportions of people with the potential to step up to the demands of organisations. Most notable is the benchstrength our data shows for Relating & Networking and Persuading & Influencing. Both of these talents are critical to HR and recruitment functions adopting a more strategic role, helping build relationships with key stakeholders and influencing them to achieve business success.
So, why are 15% of business leaders saying that they are not receiving the proactive talent advice that they need?
Part of the answer lies in areas where HR needs to build benchstrength in recruitment, particularly, as we have seen in Figure 18, in Deciding & Initiating Action – the willingness to help business leaders make decisions involving tough choices where they currently lack intelligence. This helps to explain why only 1 in 4 (24%) recruitment executives are seen as influencing business decisions effectivelyxxix.
Analysing and Applying Expertise and Technology also surfaces as an area where there is a need to build greater benchstrength within the HR function, as organisations increasingly become more data driven and demand rises for predictive intelligence.
Part of the answer lies in the design and scope of recruitment roles, with almost 90% of the perceived current influence of the recruitment function residing with executives and managers in the functionxxx. This suggests that recruitment needs to both understand the depth of talent it has across all levels of the function and how best to deploy that talent across all of its operations.
Part of the answer lies in how the recruitment function packages its talent intelligence to deliver real value to stakeholders. Our data shows that today’s graduates expect opportunities to grow, develop and progress. That means providing line managers with the playbook they need to understand the talents a graduate hire has to offer and how to leverage those talents from Day One.
Plugging the value of recruitment into the wider talent management effort such as onboarding is one way of demonstrating that the recruitment function can meet the immediate needs of the line and support the broader talent strategy of the organisation.
Figure 17: Does HR Have the Talents to Straddle the Demands Facing Today’s Recruitment Function?9
40
35
30
25
20
15
10
5
0
DeliveringResults
Planning & Organising
ApplyingExpertise &Technology
Analysing
HR Execution Competency40
35
30
25
20
15
10
5
0
Relating & Networking
Persuading & Influencing
Learning &Researching
Deciding & Initiating
Action
HR Advisory Competency
Per
cent
Per
cent
Case Story 6:
Onboarding Report Goes Viral Among Line Managers
ContextAustralian company creates an onboarding report distributed to line managers ahead of new hires starting with the organisation. Report designed to articulate organisation’s capability statements and cultural pillars.
MetricsAssessment scores mapped to provide metrics of strengths and areas for development of new hires, articulated in the language of organisation’s business transformation strategy.
Outcome
Industry Sector: Logistics & Distribution
Staff Engagement Survey FindingsOver 1 Year
Leadership & supervision 2%
Career development 3%
4%Overall employee engagement
9 Proportion of HR professionals ranking in the upper quartile of behavioural competencies when compared to all other business functions. Benchmark is global. Data represents 12,569 HR professionals across 1,541 organisations. Source is the CEB talent analytics database. Competencies within each group ordered by relative strength from higher to lower benchstrength for the HR function.
26
Driving New Success Strategies in Graduate Recruitment
26
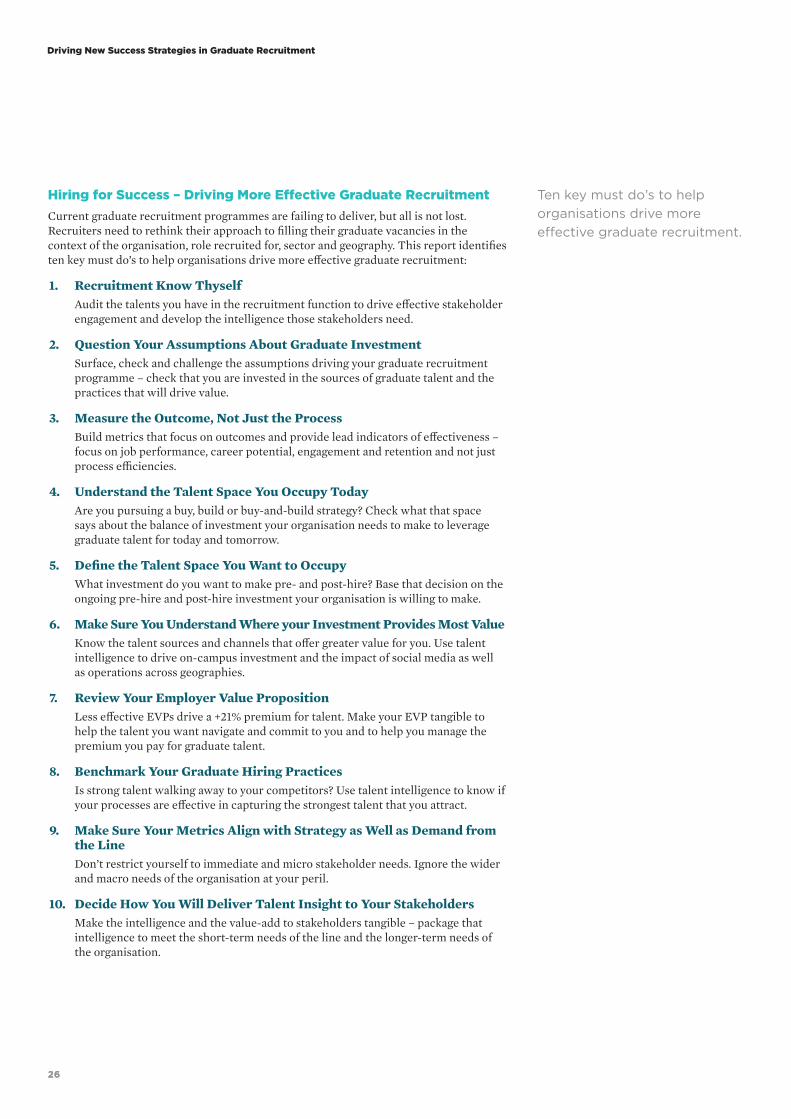
Hiring for Success – Driving More Effective Graduate RecruitmentCurrent graduate recruitment programmes are failing to deliver, but all is not lost. Recruiters need to rethink their approach to filling their graduate vacancies in the context of the organisation, role recruited for, sector and geography. This report identifies ten key must do’s to help organisations drive more effective graduate recruitment:
1. Recruitment Know Thyself Audit the talents you have in the recruitment function to drive effective stakeholder
engagement and develop the intelligence those stakeholders need.
2. Question Your Assumptions About Graduate Investment Surface, check and challenge the assumptions driving your graduate recruitment
programme – check that you are invested in the sources of graduate talent and the practices that will drive value.
3. Measure the Outcome, Not Just the Process Build metrics that focus on outcomes and provide lead indicators of effectiveness –
focus on job performance, career potential, engagement and retention and not just process efficiencies.
4. Understand the Talent Space You Occupy Today Are you pursuing a buy, build or buy-and-build strategy? Check what that space
says about the balance of investment your organisation needs to make to leverage graduate talent for today and tomorrow.
5. Define the Talent Space You Want to Occupy What investment do you want to make pre- and post-hire? Base that decision on the
ongoing pre-hire and post-hire investment your organisation is willing to make.
6. Make Sure You Understand Where your Investment Provides Most Value Know the talent sources and channels that offer greater value for you. Use talent
intelligence to drive on-campus investment and the impact of social media as well as operations across geographies.
7. Review Your Employer Value Proposition Less effective EVPs drive a +21% premium for talent. Make your EVP tangible to
help the talent you want navigate and commit to you and to help you manage the premium you pay for graduate talent.
8. Benchmark Your Graduate Hiring Practices Is strong talent walking away to your competitors? Use talent intelligence to know if
your processes are effective in capturing the strongest talent that you attract.
9. Make Sure Your Metrics Align with Strategy as Well as Demand from the Line
Don’t restrict yourself to immediate and micro stakeholder needs. Ignore the wider and macro needs of the organisation at your peril.
10. Decide How You Will Deliver Talent Insight to Your Stakeholders Make the intelligence and the value-add to stakeholders tangible – package that
intelligence to meet the short-term needs of the line and the longer-term needs of the organisation.
Ten key must do’s to help organisations drive more effective graduate recruitment.
27
SHL Talent Measurement
27
Eugene Burke is Chief Science & Analytics Officer, SHL Talent Measurement™ solutions, and a member of the CEB Global Leadership Group, where his work focuses on frameworks, models and assessment tools to enable organisations to implement solutions to talent issues. Recent projects include innovation effectiveness, the future of the retail bank, improving the success of high-potential programmes, behavioural risk models and unpacking myths around gender differences in leadership potential. He has held positions in R&D, Product Development, Product Management and has had P&L responsibility for Consulting Services. His contributions to professional bodies include Chair of the European Association of Test Publishers, Chair of the British Psychological Society’s Steering Committee for Test Standards, Council Member of the International Test Commission, Chair of the British Psychological Society’s Division of Occupational Psychology, and the International Standards Organisation’s Working Group for the 10667 standard for the use of assessment data in personnel decisions. He is Chair of the ATP Board for 2014. As well as scientific journal articles on psychometrics, computer-based and Internet-based testing, personnel selection, decision-making and chapter contributions to the APA Handbook of Testing and Assessment in Psychology and the SIOP Professional Practice Series Technology-Enhanced Assessment of Talent, Eugene has also published articles in Talent Management, T+D Magazine, People Matters and the Harvard Business Review, as well as main press such as The Times, Financial Times, Forbes, the Washington Post and the Wall Street Journal.
Tom Gibbs is Director of Service Development in the SHL Talent Measurement™ Central Professional Services function. His experience ranges from the development of psychometric models, the design of assessments including a range of cognitive ability tests and Situational Judgment Tests (SJTs), as well as the development and application of talent analytics solutions. He has presented at a number of events including the Association of Test Publishers in the US, the Association of Graduate Recruiters, the British Psychological Society’s Division of Occupational Psychology in the UK, and the Society for Industrial and Organizational Psychology of South Africa.
About the Authors
28
Driving New Success Strategies in Graduate Recruitment
28
Overview of Data Sources The data used in this report were drawn from two sources:
■ SHL Talent Measurement™ solutions from CEB, used by 10,000 organisations globally to provide scientifically researched and objective assessments of people’s potential to improve the validity and fairness of the decisions they make in hiring, developing and promoting people. CEB delivers over 30 million assessments a year to organisations that include over 50% of the Global Fortune 500, over 80% of the Financial Times Stock Exchange (FTSE) and over 50% of the Australian Stock Exchange.
■ CEB insight research and labour surveys conducted with leading organisations globally, specifically with organisations at the leading edge of developing and implementing solutions to the talent challenges facing organisations today. Details of the CEB insight and labour survey data are provided in the reference section of this report and copies of the research findings from those sources are available to CEB members.
SHL Talent Measurement™ Data Used in This Report The data used in this report focuses on the assessments most relevant to the talent issues we cover. All of the data used comes from live assessments of people’s talents. That is, the data reflects assessments that were delivered to help organisations identify those most suited for opportunities as new employees, as part of development programmes for individuals and groups and as part of succession planning and promotions.
That means the data is real data obtained for a real purpose – identifying people’s talents. While the data does not represent a random population survey, it does provide a unique snapshot based on hard data that shows the quality of talent that organisations worldwide attract and employ.
The data used and cited in this report covers a period from 2006 to 2012 and therefore reflects the impact of the significant changes that have occurred in the past eight years prior to and following the financial crisis.
Behavioural Frame for Developing the Models Described in This Report The assessments used in this report cover behavioural style, reasoning abilities and motivation framed in the context of how a person is more or less likely to act and behave at work. We work with organisations to understand the critical behaviours that drive success in a role. That understanding is developed using a framework we call the Universal Competency Framework, or UCF, which covers 112 specific workplace behaviours.
Appendix: Data and Methodology
29
SHL Talent Measurement
29
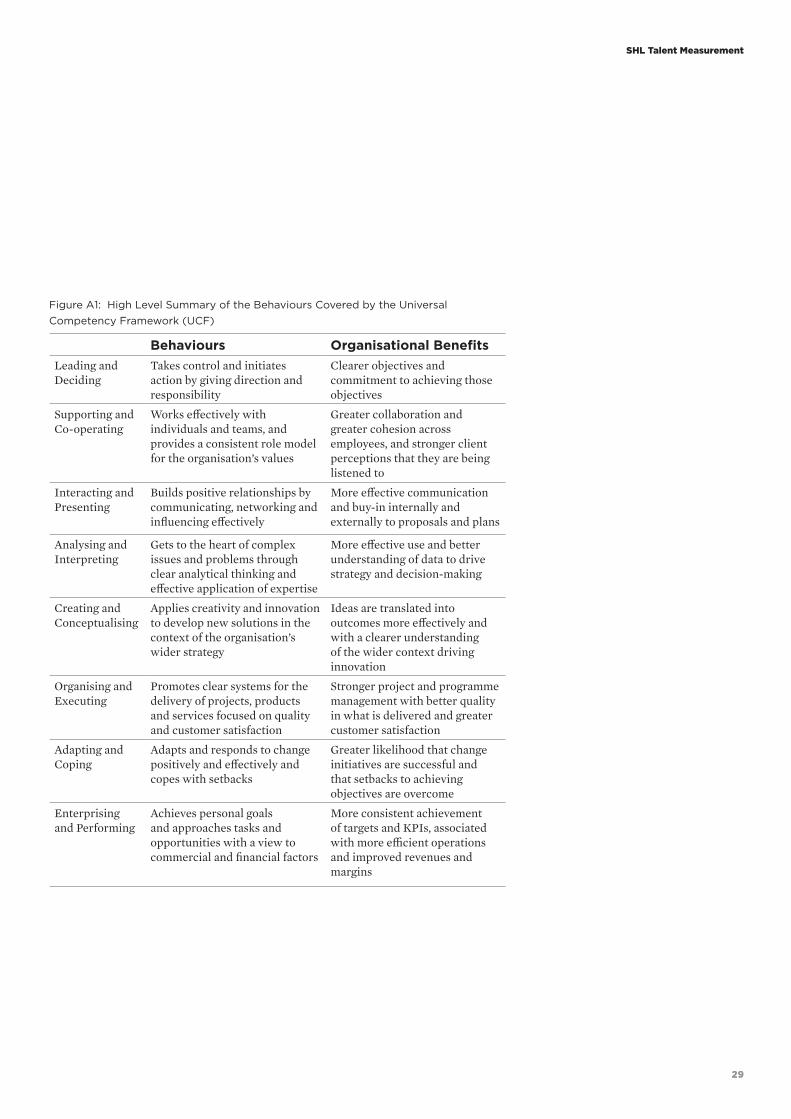
Figure A1: High Level Summary of the Behaviours Covered by the Universal Competency Framework (UCF)
Behaviours Organisational BenefitsLeading and Deciding
Takes control and initiates action by giving direction and responsibility
Clearer objectives and commitment to achieving those objectives
Supporting and Co-operating
Works effectively with individuals and teams, and provides a consistent role model for the organisation’s values
Greater collaboration and greater cohesion across employees, and stronger client perceptions that they are being listened to
Interacting and Presenting
Builds positive relationships by communicating, networking and influencing effectively
More effective communication and buy-in internally and externally to proposals and plans
Analysing and Interpreting
Gets to the heart of complex issues and problems through clear analytical thinking and effective application of expertise
More effective use and better understanding of data to drive strategy and decision-making
Creating and Conceptualising
Applies creativity and innovation to develop new solutions in the context of the organisation’s wider strategy
Ideas are translated into outcomes more effectively and with a clearer understanding of the wider context driving innovation
Organising and Executing
Promotes clear systems for the delivery of projects, products and services focused on quality and customer satisfaction
Stronger project and programme management with better quality in what is delivered and greater customer satisfaction
Adapting and Coping
Adapts and responds to change positively and effectively and copes with setbacks
Greater likelihood that change initiatives are successful and that setbacks to achieving objectives are overcome
Enterprising and Performing
Achieves personal goals and approaches tasks and opportunities with a view to commercial and financial factors
More consistent achievement of targets and KPIs, associated with more efficient operations and improved revenues and margins
30
Driving New Success Strategies in Graduate Recruitment
30
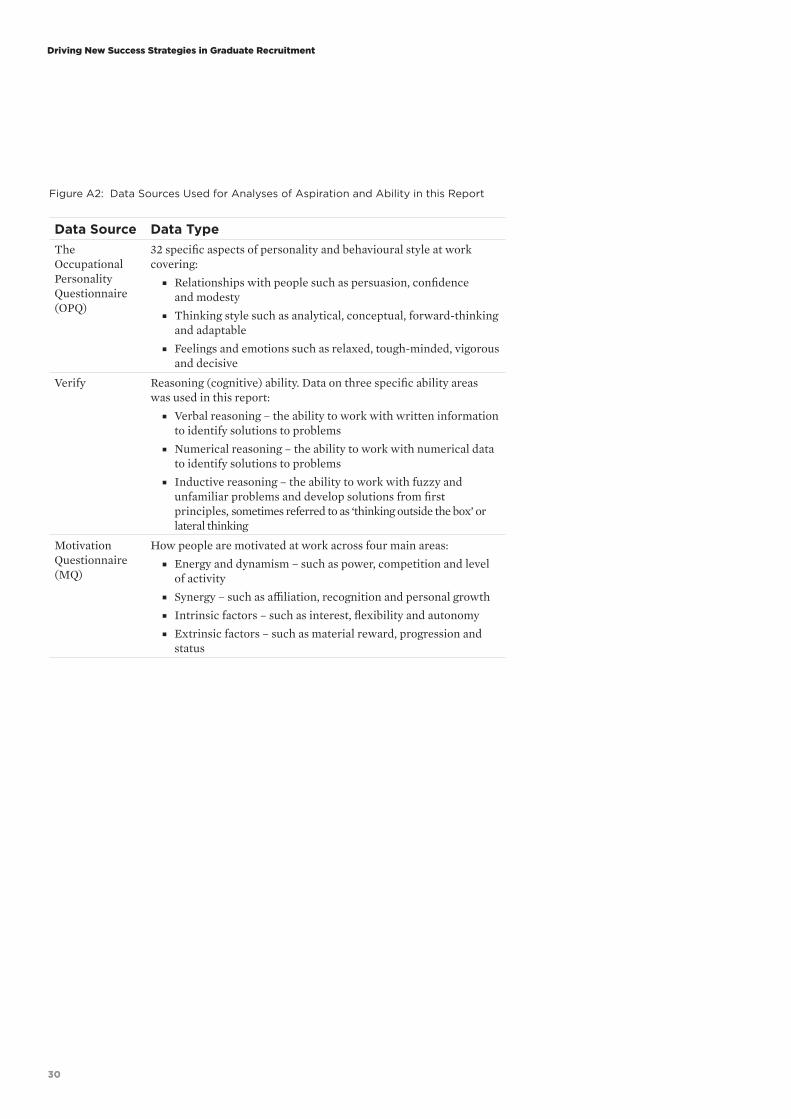
Figure A2: Data Sources Used for Analyses of Aspiration and Ability in this Report
Data Source Data TypeThe Occupational Personality Questionnaire (OPQ)
32 specific aspects of personality and behavioural style at work covering:
■ Relationships with people such as persuasion, confidence and modesty
■ Thinking style such as analytical, conceptual, forward-thinking and adaptable
■ Feelings and emotions such as relaxed, tough-minded, vigorous and decisive
Verify Reasoning (cognitive) ability. Data on three specific ability areas was used in this report:
■ Verbal reasoning – the ability to work with written information to identify solutions to problems
■ Numerical reasoning – the ability to work with numerical data to identify solutions to problems
■ Inductive reasoning – the ability to work with fuzzy and unfamiliar problems and develop solutions from first principles, sometimes referred to as ‘thinking outside the box’ or lateral thinking
Motivation Questionnaire (MQ)
How people are motivated at work across four main areas: ■ Energy and dynamism – such as power, competition and level
of activity ■ Synergy – such as affiliation, recognition and personal growth ■ Intrinsic factors – such as interest, flexibility and autonomy ■ Extrinsic factors – such as material reward, progression and
status
31
SHL Talent Measurement
31
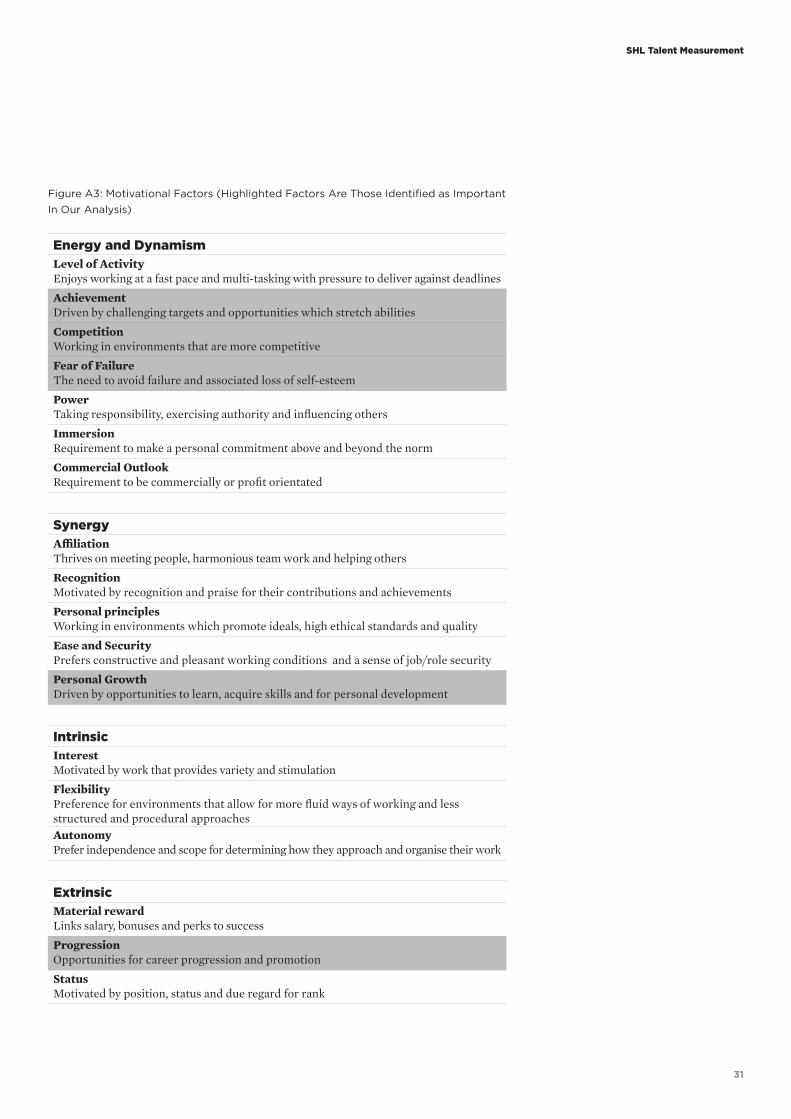
Figure A3: Motivational Factors (Highlighted Factors Are Those Identified as Important In Our Analysis)
Energy and Dynamism Level of ActivityEnjoys working at a fast pace and multi-tasking with pressure to deliver against deadlines
AchievementDriven by challenging targets and opportunities which stretch abilities
CompetitionWorking in environments that are more competitive
Fear of FailureThe need to avoid failure and associated loss of self-esteem
PowerTaking responsibility, exercising authority and influencing others
ImmersionRequirement to make a personal commitment above and beyond the norm
Commercial OutlookRequirement to be commercially or profit orientated
Synergy AffiliationThrives on meeting people, harmonious team work and helping others
RecognitionMotivated by recognition and praise for their contributions and achievements
Personal principlesWorking in environments which promote ideals, high ethical standards and quality
Ease and SecurityPrefers constructive and pleasant working conditions and a sense of job/role security
Personal GrowthDriven by opportunities to learn, acquire skills and for personal development
Intrinsic InterestMotivated by work that provides variety and stimulation
FlexibilityPreference for environments that allow for more fluid ways of working and less structured and procedural approachesAutonomyPrefer independence and scope for determining how they approach and organise their work
Extrinsic Material rewardLinks salary, bonuses and perks to success
ProgressionOpportunities for career progression and promotion
StatusMotivated by position, status and due regard for rank

32
Driving New Success Strategies in Graduate Recruitment
32
Data Screening
The data used in this report is drawn from a global database of 6.6 million assessments. Specific samples were drawn from this database to analyse aspiration and ability using the following process:
■ All metrics used in the analyses of aspiration and ability were calibrated globally and across industry sectors.
■ Our assessments are subject to statistical checks by language and geography prior to their deployment to ensure that they function equivalently and provide the same quality of information irrespective of the language and geography in which they are deployed. For this report, additional checks were conducted to ensure that metrics used were not subject to biases favouring any particular country.
■ Only data that could be assigned directly to a client project was employed to ensure it represented a true assessment deployed in the recruitment, development or succession of staff.
Demographics for Data Used in the Analyses Reported: ■ Gender: Male 56.4%, Female 43.6% ■ Age: 48.3% between 21 and 24 years of age; 51.7% between 25 and 29 years of age ■ Educational level achieved: 66.5% first degree, 31.5% masters degree and 2%
postgraduate degree or equivalent ■ Geography: 21.8% Asia, 6.9% Australia & New Zealand, 58.0% Europe, 8.6% Middle
East & Africa and 4.8% North America
Estimating the Investment in and Sunk Cost from Graduate Recruitment in the UK
We used data collated from external UK surveys as well as our own research on graduates in the UK and globally. The two external sources were surveys conducted with UK employers in 2013 by the Association of Graduate Recruiters (The AGR Graduate Recruitment Survey 2013) and Highfliers (The Graduate Market in 2013).
From those sources, estimates were obtained on marketing spend, median salaries and the number of graduate vacancies in the UK. We included salary in the investment made in graduate recruitment given that our data also showed some uncertainty among graduates’ intention to stay with a first employer, and to factor in the full life cost for the initial 18 months of a hiring decision as well as the upfront costs of attraction and recruitment. We also factored in oncosts associated with employment (e.g. taxes, employment portion of running costs) using an average of 20% of salary.
Our figure of £888 million was obtained by summing: ■ Marketing Spend = number of graduate vacancies (averaged across UK surveys) x
marketing spend per graduate (taken from the AGR survey) ■ Lifetime Investment Over 18 Months = number of graduate vacancies (averaged
across UK surveys) x median annual salary (averaged across surveys) x 1.2 (for oncosts) x 1.5 (to reflect a life cost of at least 18 months)
Our estimate of the sunk cost of £122 million from that investment was calculated by taking the proportion of graduates stating they are likely to leave their first employer from the UK and global CEB surveys cited in the report, averaging those statistics and then multiplying the figure of £888 million by that average.
We believe our figure of £888 million is an underestimate. For example, we did not have figures across the UK for the average spend across employers for running recruitment campaigns, processing applications, assessing and interviewing candidates, decision time and effort to make final offers, process those offers and onboard graduate hires.
33
SHL Talent Measurement
33
References
i Graduate employers struggling to fill vacancies, The Independent, 29 May 2014
ii CEB (2012), Rethinking University Recruiting
iii CEB (2012), Rethinking University Recruiting
iv Education Indicators in Focus, OECD, July 2013. http://www.oecd-ilibrary.org/education/how-is-international-student-mobility-shaping-up_5k43k8r4k821-en
v CEB SHL Talent Measurement survey of 1,000 UK graduates in May 2013
vi Goldman Sachs (2010), EM Equity in Two Decades: A Changing Landscape, Global Economics Paper No. 204.
vii CEB (2012), Realising Recruiting Success in a Global Environment
viii CEB (2013), 2007-2013 Global Labour Market Survey
ix PwC (2012), 15th Annual Global CEO Survey
x CEB (2012), Realising Recruiting Success in a Global Environment
xi Press release issued by the CIPD on 25 April 2013 on the launch of Employers are from Mars, Young People are from Venus report. http://www.cipd.co.uk/pressoffice/press-releases/employers-from-mars-young-people-venus-250413.aspx
xii National Association for Colleges and Employers (2013), Job Outlook 2013
xiii CEB (2012), Breakthrough Performance in the New Work Environment: Identifying and Enabling the New High Performer
xiv CEB (2014), Improving the Odds for Success of High-Potential Programmes
xv Bartram, D. (2005). The Great Eight Competencies: A Criterion-Centric Approach to Validation. Journal of Applied Psychology, Volume 90, pp. 1185-1203.
xvi For more information on our talent analytics database and models, see Burke, E. (2013). CEB’s SHL Talent Analytics™
xvii CEB (2012), Rethinking University Recruiting
xviii CEB (2012), Rethinking University Recruiting
xix CEB (2012), Global Labour Survey
xx Jobvite (2013), Social Recruiting Survey. http://web.jobvite.com/rs/jobvite/images/Jobvite_ SocialRecruiting 2013.pdf
xxi CEB (2013), Recruiting Forecast Survey
xxii Jobvite (2012), Social Media Recruiting Survey. http://web.jobvite.com/Social_Recruiting_Survey-2012-13.html
xxiii CEB (2012), Global Recruiting Effectiveness Survey
xxiv CEB (2014), Benchmarking the Employment Branding function
xxv CEB (2006), Attracting and Retaining Critical Talent Segments
xxvi CEB (2004), Driving Performance and Retention Through Employee Engagement
xxvii CEB (2006), Attracting and Retaining Critical Talent Segments
xxviii CEB (2012), Realising Recruiting Success in a Global Environment
xxix CEB (2012), Global Recruiting Effectiveness Survey
xxx CEB (2012), Global Recruiting Effectiveness Survey

34
Driving New Success Strategies in Graduate Recruitment
34
Notes

35
SHL Talent Measurement
35
Notes
ceb.shl.com
© 2014 SHL, a part of CEB. All rights reserved. SHL Group Ltd. Registered in England. Registration No: 01328744. VAT No: GB664160247. Registered office: The Pavilion, 1 Atwell Place, Thames Ditton, KT7 0NE, UK.
TALREPORT-052014-UKeng-UK
CEB is the leading member-
based advisory company. By
combining the best practices
of thousands of member
companies with our advanced
research methodologies and
human capital analytics, we
equip senior leaders and
their teams with insight
and actionable solutions to
transform operations. This
distinctive approach, pioneered
by CEB, enables executives
to harness peer perspectives
and tap into breakthrough
innovation without costly
consulting or reinvention. The
CEB member network includes
more than 16,000 executives
and the majority of top
companies globally.
The Pavilion, 1 Atwell Place, Thames Ditton, Surrey, KT7 0NE, UK 0870 070 8000 [email protected]


![e627 Graduate Recruitment Singlepage[1]](https://img.pdfslide.us/doc/110x75/55cf8df3550346703b8cf63e/e627-graduate-recruitment-singlepage1.jpg)