Embed Size (px)
Citation preview

DrivingInnovationThroughBioengineeringSolutionsaworld-classbusinessinaglobalhubforbiotechnology
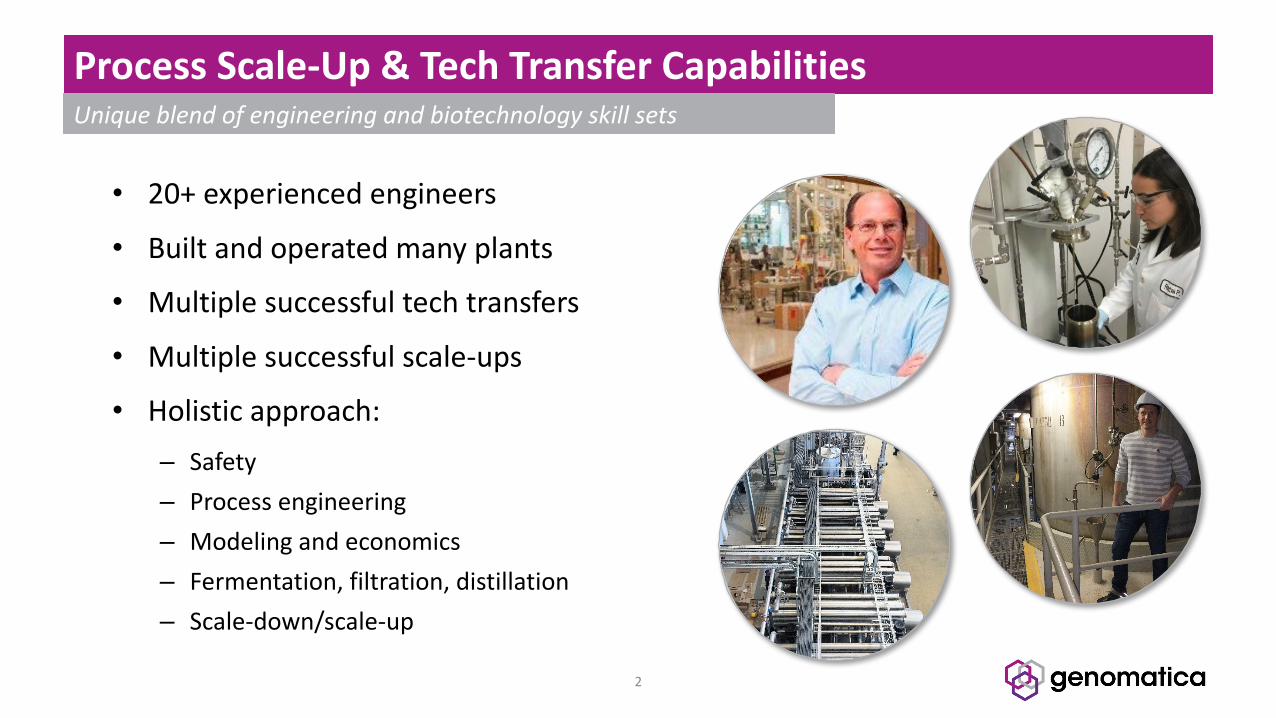
ProcessScale-Up&TechTransferCapabilities
2
Uniqueblendofengineeringandbiotechnologyskillsets
• 20+experiencedengineers
• Builtandoperatedmanyplants
• Multiplesuccessfultechtransfers
• Multiplesuccessfulscale-ups
• Holisticapproach:– Safety– Processengineering– Modelingandeconomics– Fermentation,filtration,distillation– Scale-down/scale-up

ThinkBig,ThenSmall
3
• Processeconomics• Bioreactordesignandmodeofoperation• Aerobicity oranaerobicity• Masstransferrates• Hydrostaticandgaspressures• Heattransferandcoolingmethodology• Brothproperties(viscosity,foam,composition)• Brothmixingandheterogeneity• Asepticdesign(cleaning,sterilization)• Geneticstability• Industrialgraderawmaterials• Downstreamprocessingeffects
Beginwiththeendinmind,thenscaleitdown
Howarelab-scaleandcommercial-scaledifferent?Considerthesefactorstodesignlab‘scale-down’experimentsandde-riskthescale-upprocess
LauriSuominen
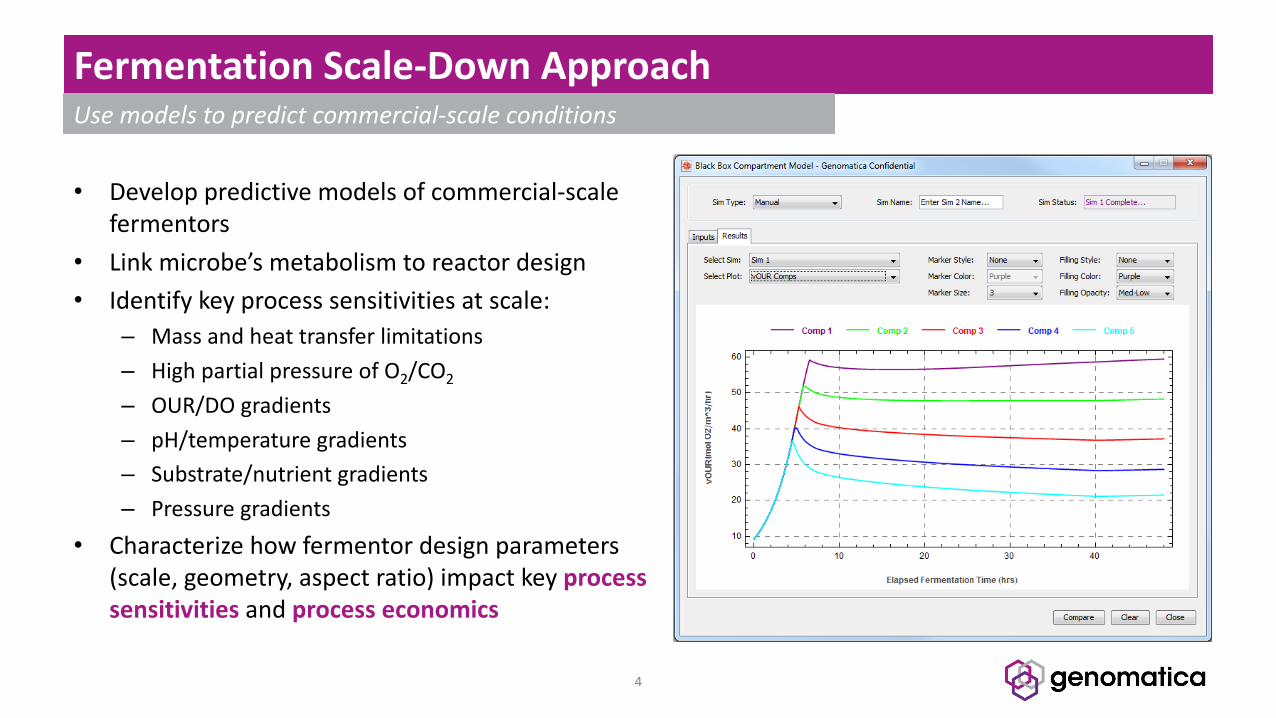
FermentationScale-DownApproach
4
Usemodelstopredictcommercial-scaleconditions
• Developpredictivemodelsofcommercial-scalefermentors
• Linkmicrobe’smetabolismtoreactordesign• Identifykeyprocesssensitivitiesatscale:
– Massandheattransferlimitations– HighpartialpressureofO2/CO2
– OUR/DOgradients– pH/temperaturegradients– Substrate/nutrientgradients– Pressuregradients
• Characterizehowfermentordesignparameters(scale,geometry,aspectratio)impactkeyprocesssensitivitiesandprocesseconomics
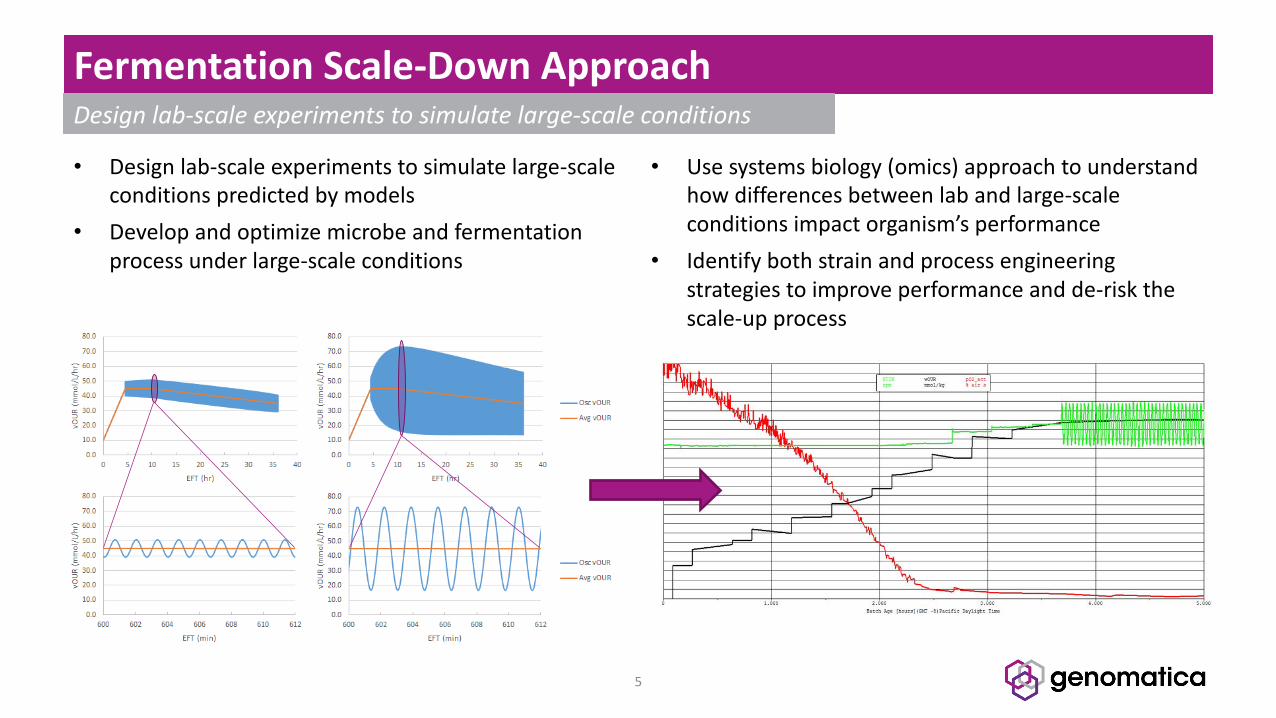
FermentationScale-DownApproach
5
Designlab-scaleexperimentstosimulatelarge-scaleconditions
• Designlab-scaleexperimentstosimulatelarge-scaleconditionspredictedbymodels
• Developandoptimizemicrobeandfermentationprocessunderlarge-scaleconditions
• Usesystemsbiology(omics)approachtounderstandhowdifferencesbetweenlabandlarge-scaleconditionsimpactorganism’sperformance
• Identifybothstrainandprocessengineeringstrategiestoimproveperformanceandde-riskthescale-upprocess
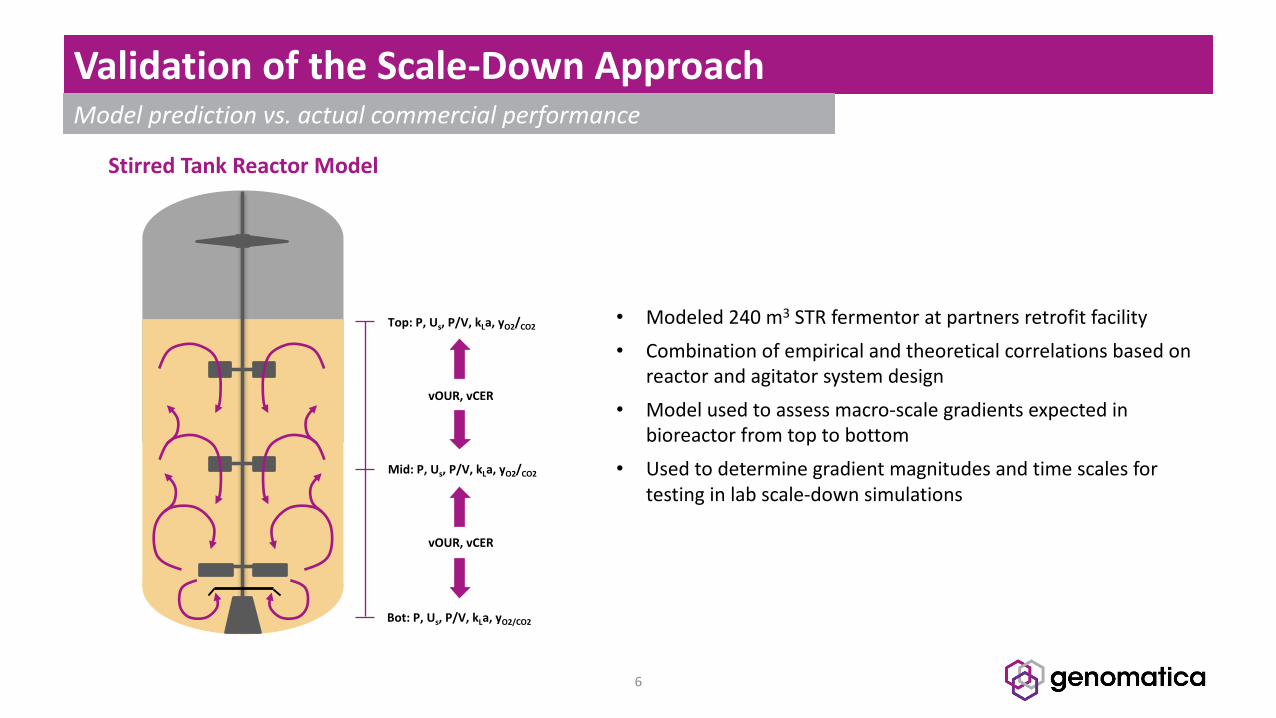
ValidationoftheScale-DownApproach
6
Modelpredictionvs.actualcommercialperformance
StirredTankReactorModel
Mid:P,Us,P/V,kLa,yO2/CO2
Bot:P,Us,P/V,kLa,yO2/CO2
Top:P,Us,P/V,kLa,yO2/CO2
vOUR,vCER
vOUR,vCER
• Modeled240m3 STRfermentoratpartnersretrofitfacility• Combinationofempiricalandtheoreticalcorrelationsbasedon
reactorandagitatorsystemdesign• Modelusedtoassessmacro-scalegradientsexpectedin
bioreactorfromtoptobottom• Usedtodeterminegradientmagnitudesandtimescalesfor
testinginlabscale-downsimulations
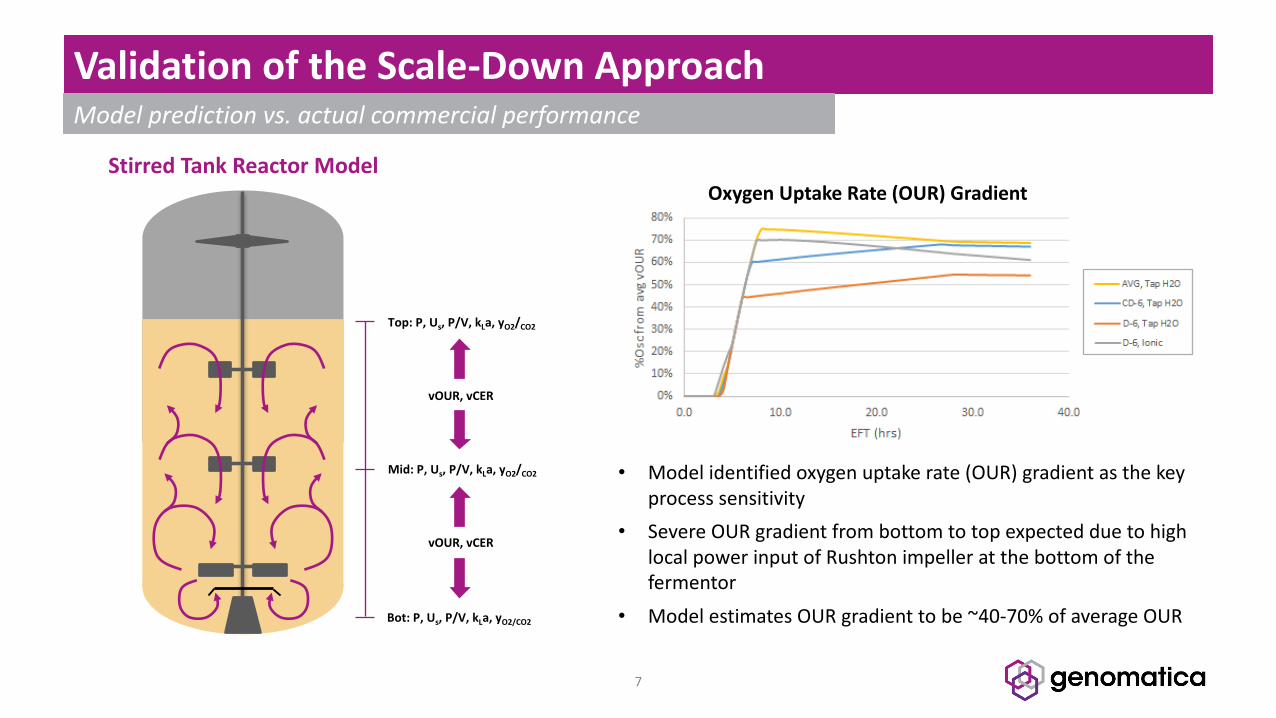
ValidationoftheScale-DownApproach
7
Modelpredictionvs.actualcommercialperformance
StirredTankReactorModel
Mid:P,Us,P/V,kLa,yO2/CO2
Bot:P,Us,P/V,kLa,yO2/CO2
Top:P,Us,P/V,kLa,yO2/CO2
vOUR,vCER
vOUR,vCER
• Modelidentifiedoxygenuptakerate(OUR)gradientasthekeyprocesssensitivity
• SevereOURgradientfrombottomtotopexpectedduetohighlocalpowerinputofRushtonimpelleratthebottomofthefermentor
• ModelestimatesOURgradienttobe~40-70%ofaverageOUR
OxygenUptakeRate(OUR)Gradient
0
20
40
60
80
100
120
140
0 10 20 30 40
Titer,g/L
EFT, hr
Titer
0.00.51.01.52.02.53.03.54.04.5
0 10 20 30 40Rate,g/L/hrEFT, hr
Rate
0.000.050.100.150.200.250.300.350.400.450.50
0 10 20 30 40
ProcessYield,g/gsu
bsfe
d
EFT, hr
ProcessYield
0
2
4
6
8
10
12
14
16
0 10 20 30 40
Biom
ass,gdcw/L
EFT, hr
Biomass
0123456789
10
0 10 20 30 40
Cond
uctiv
ity,m
S/cm
EFT, hr
Conductivity
%90
%92
%94
%96
%98
%100
%102
%104
%106
0 10 20 30 40
TotD
oRBal,%
TotDoR
Con
sEFT, hr
TotDoRBal
012345678910
0 10 20 30 40
Cond
uctiv
ity,m
S/cm
EFT, hr
Conductivity
%0
%20
%40
%60
%80
%100
%120
0 10 20 30 40
TotN
Bal,%
TotNIn
EFT, hr
TotNBal
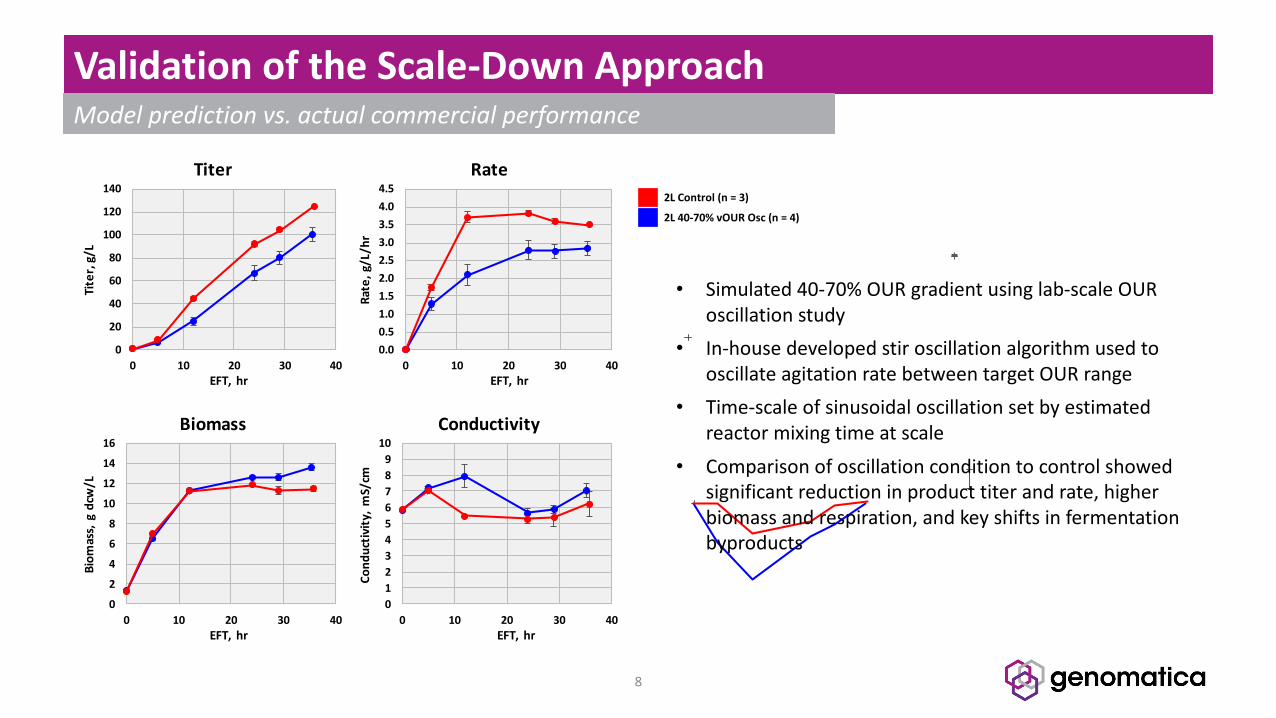
ValidationoftheScale-DownApproach
8
Modelpredictionvs.actualcommercialperformance
2LControl(n=3)
2L40-70%vOUR Osc (n=4)
• Simulated40-70%OURgradientusinglab-scaleOURoscillationstudy
• In-housedevelopedstiroscillationalgorithmusedtooscillateagitationratebetweentargetOURrange
• Time-scaleofsinusoidaloscillationsetbyestimatedreactormixingtimeatscale
• Comparisonofoscillationconditiontocontrolshowedsignificantreductioninproducttiterandrate,higherbiomassandrespiration,andkeyshiftsinfermentationbyproducts
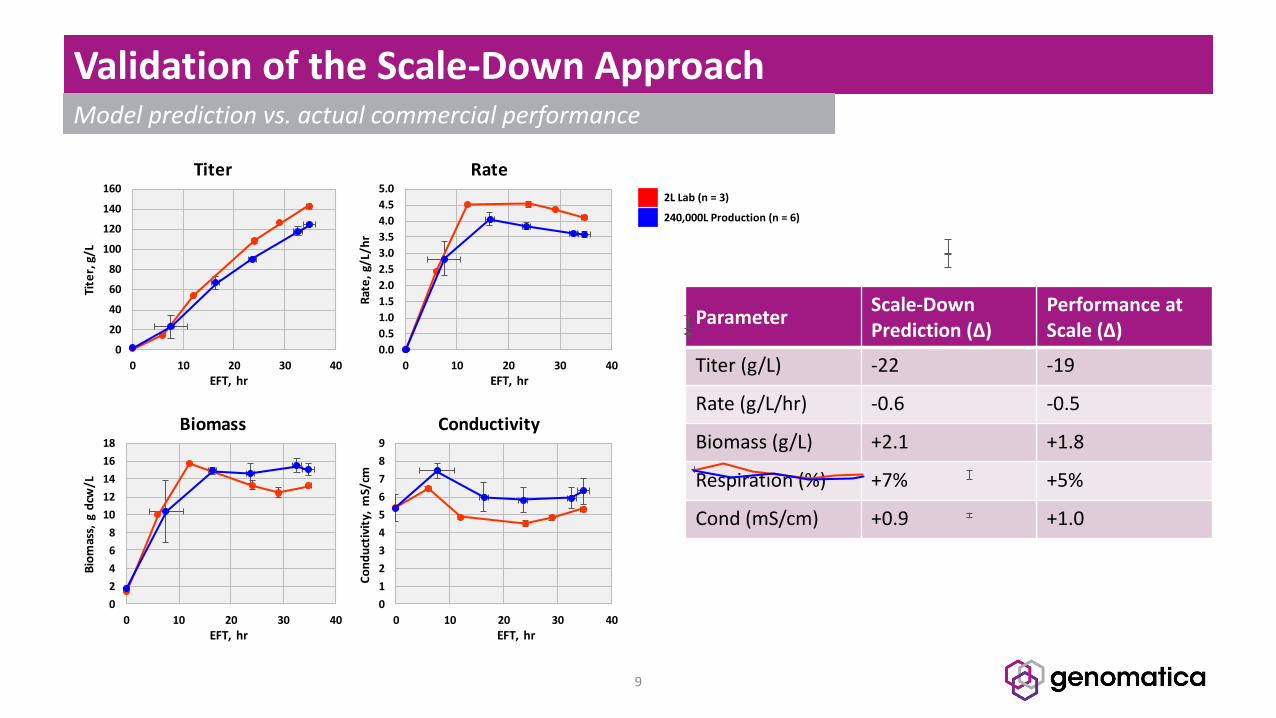
ValidationoftheScale-DownApproach
9
Modelpredictionvs.actualcommercialperformance
2L Lab (n=3)
240,000LProduction (n=6)
Parameter Scale-DownPrediction(Δ)
PerformanceatScale(Δ)
Titer(g/L) -22 -19
Rate(g/L/hr) -0.6 -0.5
Biomass (g/L) +2.1 +1.8
Respiration(%) +7% +5%
Cond (mS/cm) +0.9 +1.0
0
20
40
60
80
100
120
140
160
0 10 20 30 40
Titer,g/L
EFT, hr
Titer
0.00.51.01.52.02.53.03.54.04.55.0
0 10 20 30 40Rate,g/L/hrEFT, hr
Rate
0.000.050.100.150.200.250.300.350.400.45
0 10 20 30 40
ProcessYield,g/gsu
bsfe
d
EFT, hr
ProcessYield
024681012141618
0 10 20 30 40
Biom
ass,gdcw/L
EFT, hr
Biomass
0123456789
0 10 20 30 40
Cond
uctiv
ity,m
S/cm
EFT, hr
Conductivity
%0
%20
%40
%60
%80
%100
%120
0 10 20 30 40
TotD
oRBal,%
TotDoR
Con
sEFT, hr
TotDoRBal
0123456789
0 10 20 30 40
Cond
uctiv
ity,m
S/cm
EFT, hr
Conductivity
%0
%20
%40
%60
%80
%100
%120
0 10 20 30 40
TotN
Bal,%
TotNIn
EFT, hr
TotNBal
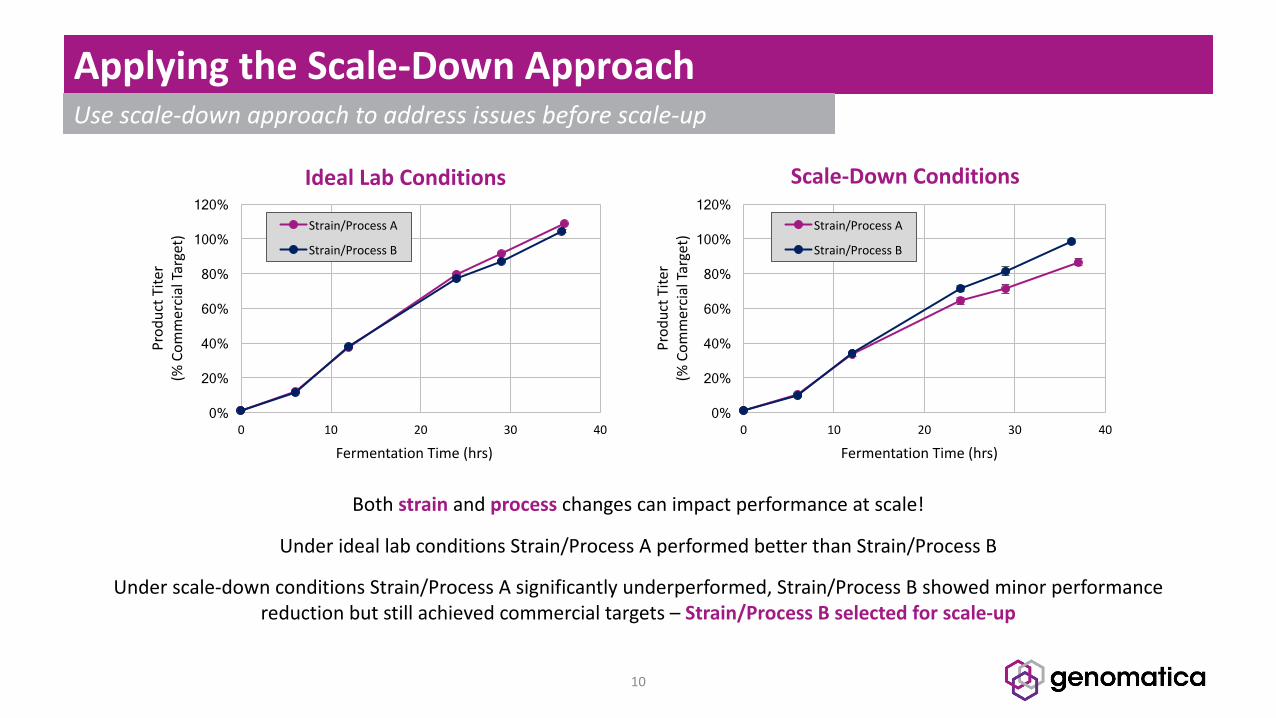
ApplyingtheScale-DownApproach
10
Usescale-downapproachtoaddressissuesbeforescale-up
Bothstrain andprocess changescanimpactperformanceatscale!
UnderideallabconditionsStrain/ProcessAperformedbetterthanStrain/ProcessB
Underscale-downconditionsStrain/ProcessAsignificantlyunderperformed,Strain/ProcessBshowedminorperformancereductionbutstillachievedcommercialtargets– Strain/ProcessBselectedforscale-up
0%
20%
40%
60%
80%
100%
120%
0 10 20 30 40
Prod
uctT
iter
(%Com
mercialTa
rget)
FermentationTime(hrs)
IdealLabConditions
Strain/ProcessA
Strain/ProcessB
0%
20%
40%
60%
80%
100%
120%
0 10 20 30 40
Prod
uctT
iter
(%Com
mercialTa
rget)
FermentationTime(hrs)
Scale-DownConditions
Strain/ProcessA
Strain/ProcessB
0% 20% 40% 60% 80%
100% 120%
2L 30L 13kL
Rate,g/L.hr
(as%
of2
L)
ApplyingtheScale-DownApproach
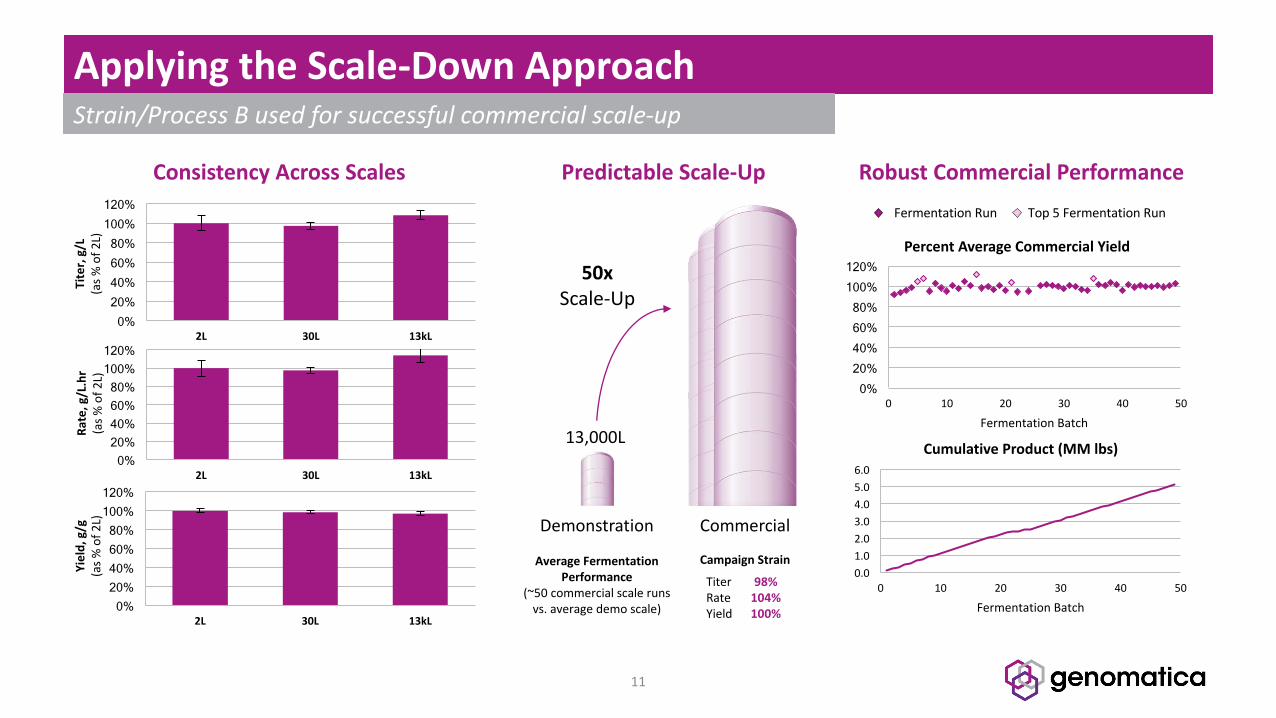
11
Strain/ProcessBusedforsuccessfulcommercialscale-up
RobustCommercialPerformancePredictableScale-Up
13,000L
Demonstration Commercial
50xScale-Up
AverageFermentationPerformance
(~50commercialscalerunsvs.averagedemoscale)
0% 20% 40% 60% 80%
100% 120%
0 10 20 30 40 50
FermentationBatch
PercentAverageCommercialYield
Top5FermentationRunFermentationRun
ConsistencyAcrossScales
0% 20% 40% 60% 80%
100% 120%
2L 30L 13kL
Titer,g/L
(as%
of2
L)
0% 20% 40% 60% 80%
100% 120%
2L 30L 13kL
Yield,g/g
(as%
of2
L)
CampaignStrain
TiterRateYield
98%104%100%
0.01.02.03.04.05.06.0
0 10 20 30 40 50
FermentationBatch
CumulativeProduct(MMlbs)
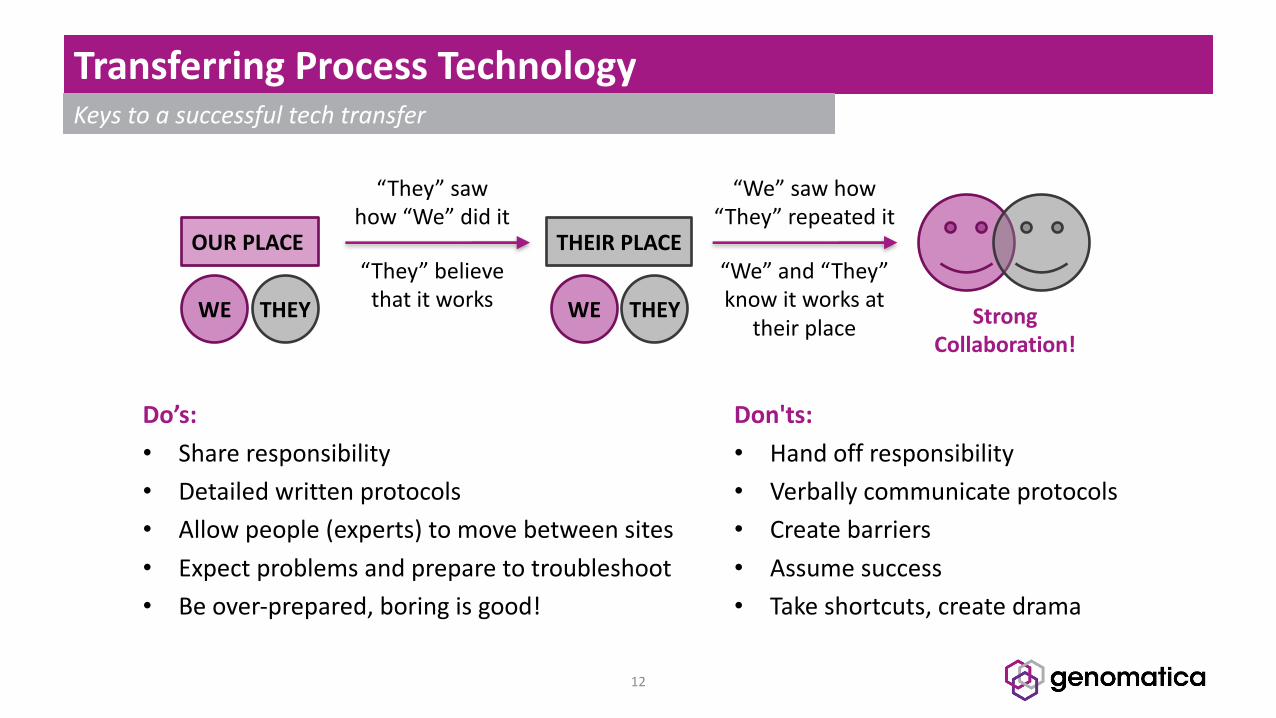
TransferringProcessTechnology
12
Keystoasuccessfultechtransfer
OURPLACE
“They”sawhow“We”didit
“They”believethatitworks
THEIRPLACE
“We”sawhow“They”repeatedit
“We”and“They”knowitworksat
theirplace StrongCollaboration!
WE THEYWE THEY
Do’s:• Shareresponsibility• Detailedwrittenprotocols• Allowpeople(experts)tomovebetweensites• Expectproblemsandpreparetotroubleshoot• Beover-prepared,boringisgood!
Don'ts:• Handoffresponsibility• Verballycommunicateprotocols• Createbarriers• Assumesuccess• Takeshortcuts,createdrama
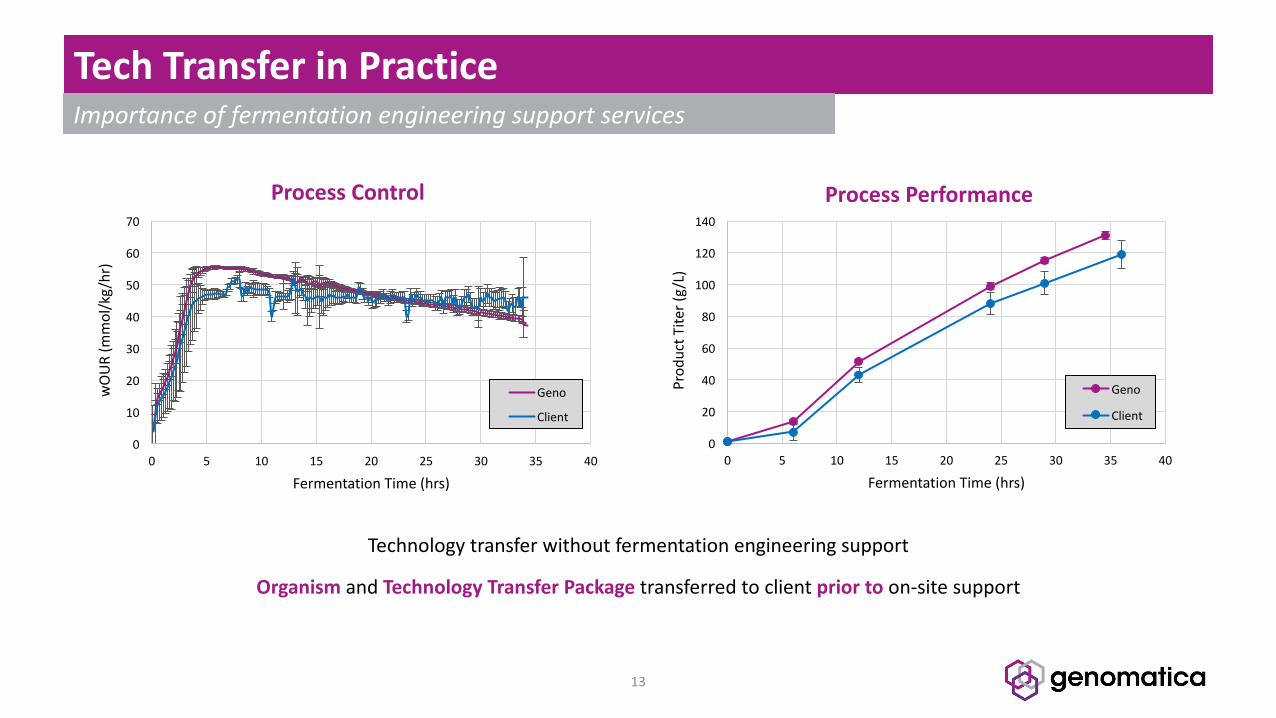
TechTransferinPractice
13
Importanceoffermentationengineeringsupportservices
0
20
40
60
80
100
120
140
0 5 10 15 20 25 30 35 40
Prod
uctT
iter(g/L)
FermentationTime(hrs)
ProcessPerformance
Geno
Client
0
10
20
30
40
50
60
70
0 5 10 15 20 25 30 35 40
wOUR
(mmol/kg/hr)
FermentationTime(hrs)
ProcessControl
Geno
Client
Technologytransferwithoutfermentationengineeringsupport
Organismand TechnologyTransferPackagetransferredtoclientpriortoon-sitesupport
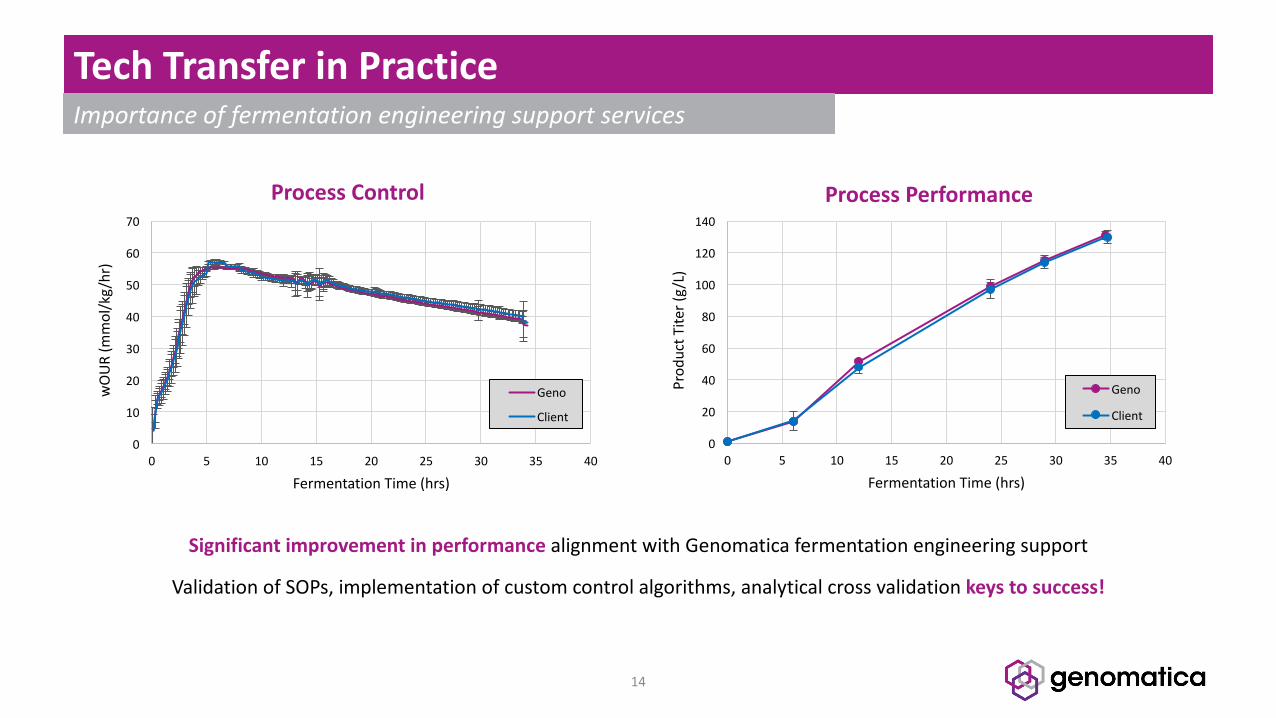
TechTransferinPractice
14
Importanceoffermentationengineeringsupportservices
0
20
40
60
80
100
120
140
0 5 10 15 20 25 30 35 40
Prod
uctT
iter(g/L)
FermentationTime(hrs)
ProcessPerformance
Geno
Client
0
10
20
30
40
50
60
70
0 5 10 15 20 25 30 35 40
wOUR
(mmol/kg/hr)
FermentationTime(hrs)
ProcessControl
Geno
Client
SignificantimprovementinperformancealignmentwithGenomaticafermentationengineeringsupport
ValidationofSOPs,implementationofcustomcontrolalgorithms,analyticalcrossvalidationkeystosuccess!
TechTransferinPractice
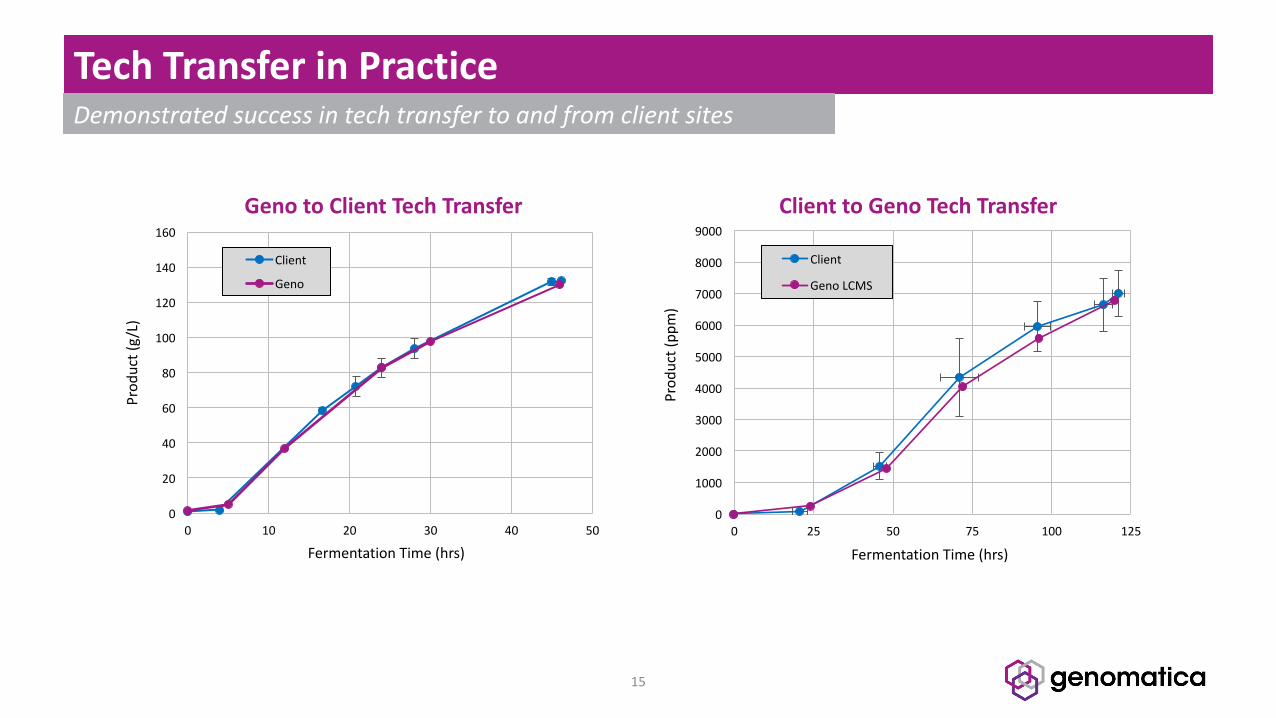
15
Demonstratedsuccessintechtransfertoandfromclientsites
0
1000
2000
3000
4000
5000
6000
7000
8000
9000
0 25 50 75 100 125
Prod
uct(pp
m)
FermentationTime(hrs)
ClienttoGenoTechTransfer
Client
GenoLCMS
0
20
40
60
80
100
120
140
160
0 10 20 30 40 50
Prod
uct(g/L)
FermentationTime(hrs)
GenotoClientTechTransfer
Client
Geno
BioprocessScale-Up&TechTransferMethodology
16
1. Beginwiththeendinmind
2. Build,test,andrefinemodels
3. Scale-down beforescale-up
4. Noshortcuts whentransferringtechnology
Keyprinciplesforsuccess
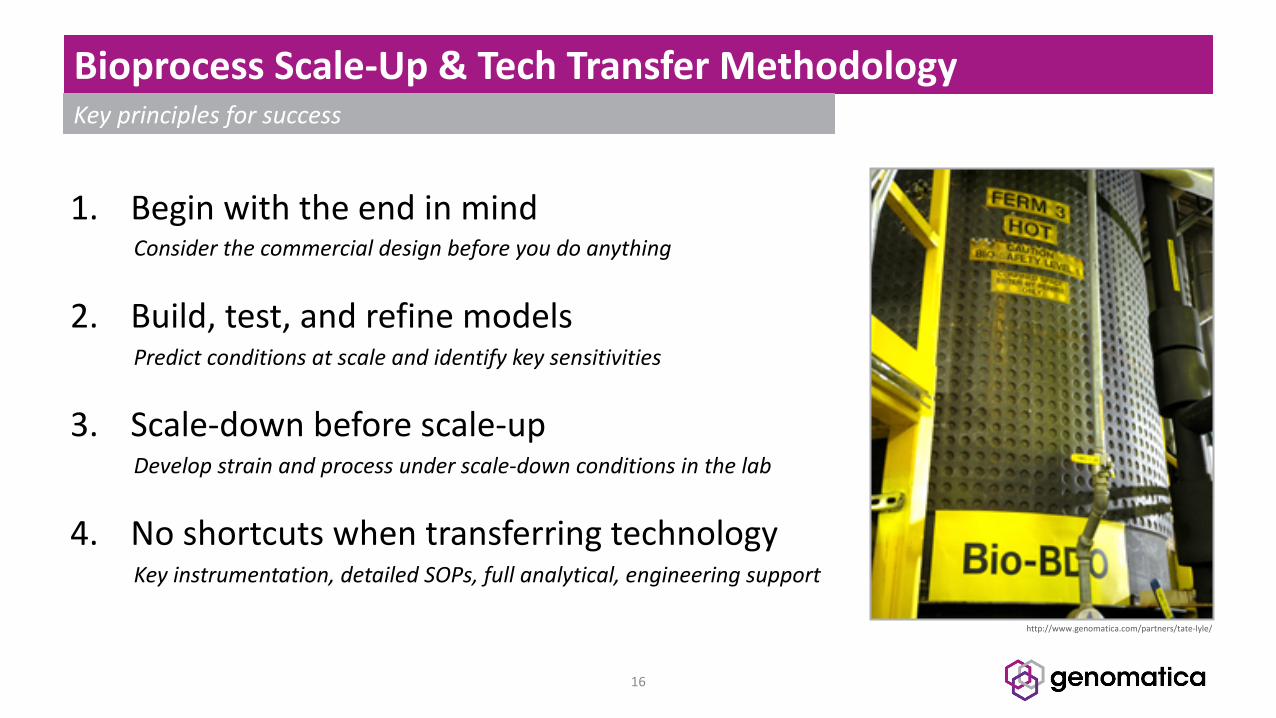
http://www.genomatica.com/partners/tate-lyle/
Considerthecommercialdesignbeforeyoudoanything
Developstrainandprocessunderscale-downconditionsinthelab
Predictconditionsatscaleandidentifykeysensitivities
Keyinstrumentation,detailedSOPs,fullanalytical,engineeringsupport