Embed Size (px)
Citation preview
Driving for work A strategic review of risks associated with cars and light vans and implications for policy and practice
Heather Ward, Nicola Christie (UCL) and Bruce Walton (Agilysis)
CENTRE FOR TRANSPORT STUDIES, DEPARTMENT
FOR CIVIL, ENVIRONMENTAL AND GEOMATIC
ENGINEERING, FACULTY OF ENGINEERING
2
Contents Highlights .......................................... 3
1. Introduction ................................ 4
1.1 Aim of report ............................ 4
1.2 Changing context ..................... 7
1.2.1 Vans used for work journeys
................................................... 7
1.3 Cars used for work journeys .... 9
1.4 The ‘gig’ economy and lifestyle
couriers ........................................ 10
1.5 Mileage of cars ...................... 11
2. Understanding risk of driving for
work ................................................ 11
2.1 How we compare to other
countries ...................................... 11
2.2 Working drivers: estimating the
true picture .................................. 11
2.2.1 Assumptions made in
reallocating journey purpose of
vehicles .................................... 12
2.3 Estimates of pedestrians killed
or injured by working drivers ........ 13
2.4 Background to inclusion in
STATS19 of journey purpose ....... 15
2.4.1 Support for the inclusion of
journey purpose in STATS19 ... 15
3. What strategic stakeholders told
us 16
3.1 What we did ........................... 16
3.2 What we found ....................... 16
3.2.1 New employment models
and risk .................................... 16
3.2.2 Disregard for health and
safety ....................................... 17
3.2.3 Data on risk associated with
gig workers and the grey fleet .. 17
3.2.4 Grey fleet risks ................ 18
3.2.5 Lack of awareness and
acceptance of risk by national
stakeholders ............................. 18
3.2.6 Licensing ......................... 18
3.2.7 Newly qualified drivers .... 18
3.2.8 A hard to reach group...... 19
3.2.9 Policy .............................. 19
3.2.10 Interventions ................. 19
3.2.11 Role of HSE .................. 19
3.2.12 Role of the employer ..... 19
3.2.13 Responsibility ................ 20
3.2.13 Enforcement .................. 20
3.2.14 Interactive courses ........ 20
3.2.15 National media .............. 20
3.2.16 Managed fleet ............... 21
3.3 Summary ............................... 21
4. Conclusions ............................. 23
5. Actions required to address the
gaps ................................................ 23
Acknowledgements ......................... 25
References ..................................... 25
Appendices ..................................... 27
Appendix 1: Estimation of under-
recording ..................................... 27
Appendix 2: Topic guide .............. 29
3
Highlights More deaths occur from road
travel whilst working than at the
workplace
88 working drivers/riders and
their passengers died in 2018
but 432 other road users were
killed in collisions where at
least one driver was working
About 1 in 3 road deaths, 1 in 5
seriously injured casualties and
1 in 4 casualties of all
severities are sustained when
someone is driving for work
We have estimated that 39
percent of killed pedestrians
were hit by a working driver
The economy is changing, and
associated with this is a rapid
increase in vans and people
working in the gig economy
Vans and their drivers are not
subject to the same strict
regulations as HGV, bus, and
coach occupational drivers.
On average, vans drive 12,800
miles a year, which is 15.4% of
all vehicle mileage. 20% of
these miles is on minor urban
roads
Gaps in our knowledge partly
stem from the lack of attention
to work-related road safety by
policymakers who are
custodians of casualty data
More needs to be done to
strengthen casualty data to
identify work-related collisions
Strategic stakeholders
recognise the emerging safety
issues associated with the
changing economy and its
impact on occupational road
risk and they need to work in
partnership to manage this risk
4
1. Introduction
1.1 Aim of report This review updates Helman et al’s
(2014) strategic review of the
management of occupational road risk
and its aim is to identify new trends,
gaps, and risks for occupational
drivers themselves and other road
users they collide with and injure. In
this report we have described the
vehicles driven for work and on which
types of road they travel, undertaken
an analysis of casualties and
interviewed key strategic stakeholders
to gain their understanding of the
problem and what they see as the way
forward for policies and interventions
for safer driving.
Understanding risk of driving for work
is important and it matters to
employers, employees, policy makers,
industry groups, trades unions, and
the public. Key stakeholders include:
Institute of Directors
Chambers of commerce
Business Employers
Confederation
Department for Transport GB
Road Safety Authority Ireland
Driver and Vehicle Standards
Agency (DVSA)
Police
Highways England as the
network operator
Construction Industry Federation
Trade unions
Institute of Couriers
Insurers
Road Haulage Association.
Freight Transport Association
Chartered Institute of Logistics
and Transport Facilitators
Given the expected change in work
and commuting patterns arising from
Covid-19 this report provides a
baseline from 2020 of occupational
road risk. Over the last ten years or so
there has been a change in the
composition of the vehicle fleet used
for work purposes. Examples of areas
which have seen increased activity are
in the use of:
light vans partly influenced by
the growth in internet shopping
and home deliveries
privately owned cars, vans and
powered two wheeled motor
vehicles (TWMVS) for work
related journeys on employers
business (large companies and
small and medium enterprises
(SMEs)). These are known as
the grey fleet.
vans, cars, TWMVS, and
bicycles by the self employed
vans, cars, TWMVS, and
bicycles by those engaged in the
lifestyle or gig economy (where a
few hours are worked around
other commitments e.g. taxis,
food deliveries, internet
shopping home deliveries)
This review concentrates on the van,
company car and grey fleet transport
sectors because apart from a focus
within the Driving for Better Business
programme most fleet operator
engagement programmes such as
those offered by Transport for London
and European Transport Safety
5
Council (through its PRAISE work) aim
primarily at those with HGVs and vans.
By contrast, the working van, car, and
grey fleet drivers and riders are
recently emerging as an increasing
group on our roads, but little is known
about them. Many drive or ride for
public sector employers such as NHS,
social services, or other local authority
departments but many more are
employed by SMEs or are self-
employed.
According to the Health and Safety
Executive (HSE 2014)
“Managing the risks to employees who
drive at work requires more than just
compliance with road traffic legislation.
The Health and Safety at Work etc Act
1974 requires employers to take
appropriate steps to ensure the health
and safety of their employees and
others who may be affected by their
activities when at work. This includes
the time when they are driving or riding
at work, whether this is in a company
or hired vehicle, or in the employee’s
own vehicle.
There will always be risks associated
with driving. Although these cannot be
completely controlled, an employer
has a responsibility to take all
reasonable steps to manage these
risks and do everything reasonably
practicable to protect people from
harm in the same way as they would in
the workplace”.
The UK definition of a work-related
journey is where a driver uses a
vehicle in the course of their work. The
journey may be in any type of vehicle
(or by pedal cycle) which could be
corporately or privately owned or
leased. “Working” refers to the driver,
not the passengers so bus
1 Such as agriculture 7 fatalities, construction 5 fatalities, mining 0 fatalities, transportation and storage 51 fatalities
passengers, taxi and private hire
passengers are excluded so are
people being given lifts to work,
school, or college. A work trip
excludes commuting but includes
those where the driver travels from
their home to a work location which is
not their normal place of work. A
commuting trip is from home to and
from a drivers’ normal place of work.
There is a high level of risk associated
with occupational driving. Helman et
al’s (2014) strategic review of the
management of occupational road risk
stated that:
“It is widely accepted that for most
workers driving is one of the riskiest
activities undertaken as part of work.
In Great Britain it is estimated that at
least a fifth of road injuries are
sustained in a collision in which
someone was driving for work at the
time”
In 2017/18 there were 144 people
killed in the workplace during the
course of work. In addition, 100
members of the public died at
workplaces (excluding rail suicides
and deaths in health and social care)
(HSE 2018). By contrast in 2018, 63
working drivers/riders were killed
together with 25 passengers. But 432
other non-working road users were
killed in collisions where at least one
driver was working (DfT 2019a). It is
clear that working drivers/riders pose a
greater risk of death to members of the
public than do workers in other
occupations1
The casualty data on journey purpose
is collected by the police and it is
generally recognised that there is a
degree of incorrect recording. This is
discussed further in Section 2.2.
However, the 2018 data (as published
6
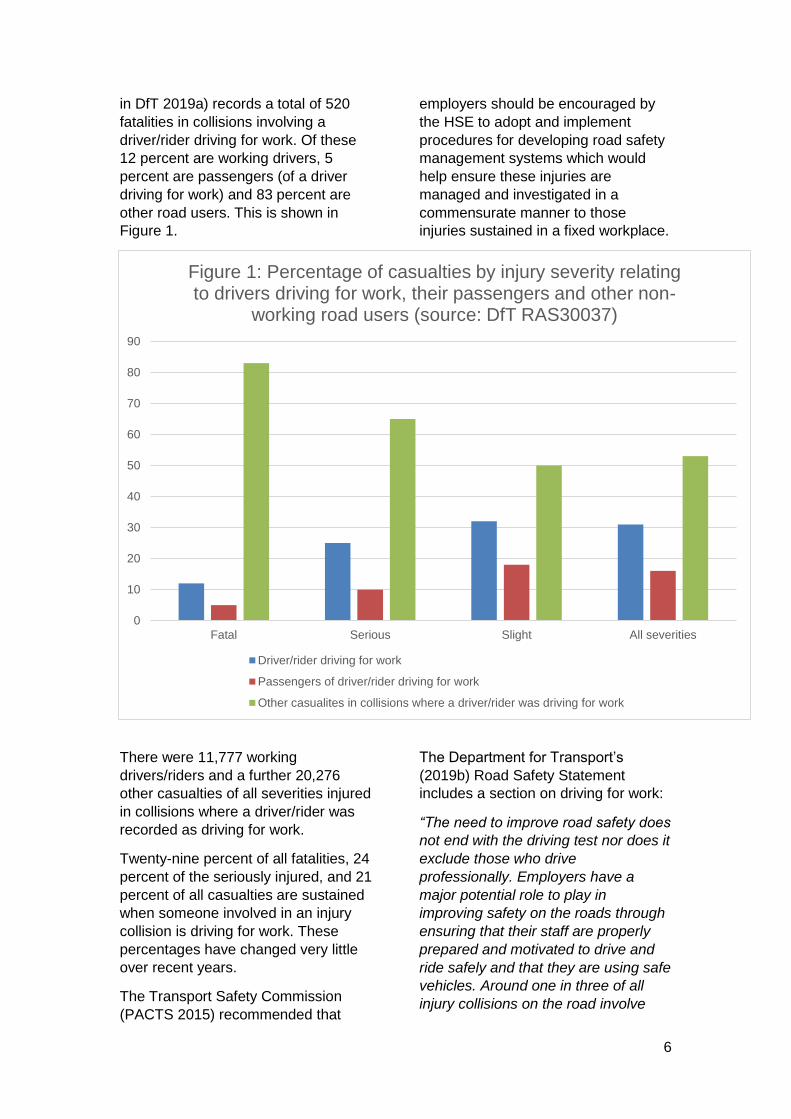
in DfT 2019a) records a total of 520
fatalities in collisions involving a
driver/rider driving for work. Of these
12 percent are working drivers, 5
percent are passengers (of a driver
driving for work) and 83 percent are
other road users. This is shown in
Figure 1.
There were 11,777 working
drivers/riders and a further 20,276
other casualties of all severities injured
in collisions where a driver/rider was
recorded as driving for work.
Twenty-nine percent of all fatalities, 24
percent of the seriously injured, and 21
percent of all casualties are sustained
when someone involved in an injury
collision is driving for work. These
percentages have changed very little
over recent years.
The Transport Safety Commission
(PACTS 2015) recommended that
employers should be encouraged by
the HSE to adopt and implement
procedures for developing road safety
management systems which would
help ensure these injuries are
managed and investigated in a
commensurate manner to those
injuries sustained in a fixed workplace.
The Department for Transport’s
(2019b) Road Safety Statement
includes a section on driving for work:
“The need to improve road safety does
not end with the driving test nor does it
exclude those who drive
professionally. Employers have a
major potential role to play in
improving safety on the roads through
ensuring that their staff are properly
prepared and motivated to drive and
ride safely and that they are using safe
vehicles. Around one in three of all
injury collisions on the road involve
0
10
20
30
40
50
60
70
80
90
Fatal Serious Slight All severities
Figure 1: Percentage of casualties by injury severity relating to drivers driving for work, their passengers and other non-
working road users (source: DfT RAS30037)
Driver/rider driving for work
Passengers of driver/rider driving for work
Other casualites in collisions where a driver/rider was driving for work
7
people ‘at work’ at the time which
underlines to scope for improvement”.
1.2 Changing context
1.2.1 Vans used for work journeys The number and mix of vehicles
registered for use on GB roads is
changing and there has been a rapid
increase in the number of vans. This is
against a backdrop of a slowly rising
number of British registered HGVs as
businesses change their last mile
deliveries and become more flexible in
their operation. Vans and drivers are
not subject to the same strict
regulation of driver training, drivers’
hours restrictions and roadworthiness
testing as HGVs and buses/coaches.
In 2019 there were 4.12m light
goods vehicles registered in
Great Britain (gross vehicle
weight less than 3.5 tonnes)
compared with 3.24m in 2011
(DfT 2019c).
This represents a 27% increase
over this period.
By far the biggest user of vans is
the construction industry and the
Society of Motor Manufacturers
and Traders report (BearingPoint
2019) estimates that about 1m of
all vans (about 24%) are used by
drivers in this sector which
includes all the building trades
and road maintenance.
Given that we in Britain are
amongst the biggest online
2 87% of the UK population shopped on-line in 2019 compared with the EU(27) average of 60% (Eurostat 2020)
shoppers in Europe2 we may
think that the percentage of vans
involved in home deliveries is
commensurably large. However,
the SMMT report estimates that
it accounts for about 9% of
registered LCVs
By contrast, between 2011 and
2019 the number of HGVs
registered rose by about 10%
(465,500 to 501,500. DfT
2019d).
Cars registered in GB increased
by 11% over the same period
(28.5 m to 31.9m) (DfT 2019e).
About half the vans are registered to
private individuals with men
outnumbering women by 10:1. The
other half are registered to companies
which include fleets and the
rental/leasing sector (DfT 2020c). The
SMMT report suggests that with the
large increase in self-employment over
the last decade the vast majority of
these private registrations is to SMEs
and sole traders.
An estimate of annual mileage is about
12,800 miles per van and this
accounts for 15.4% of all vehicle
mileage but we do not have an
estimate of mileage for the different
business sectors such as home
deliveries.
In 2011, 86% of company van
journeys and 78% of privately-owned
van journeys were made for work
purposes (Clarke et al., 2014). It is
quite common for privately registered
vans to double up as the family car
8
and even some company vans are
used for private journeys.
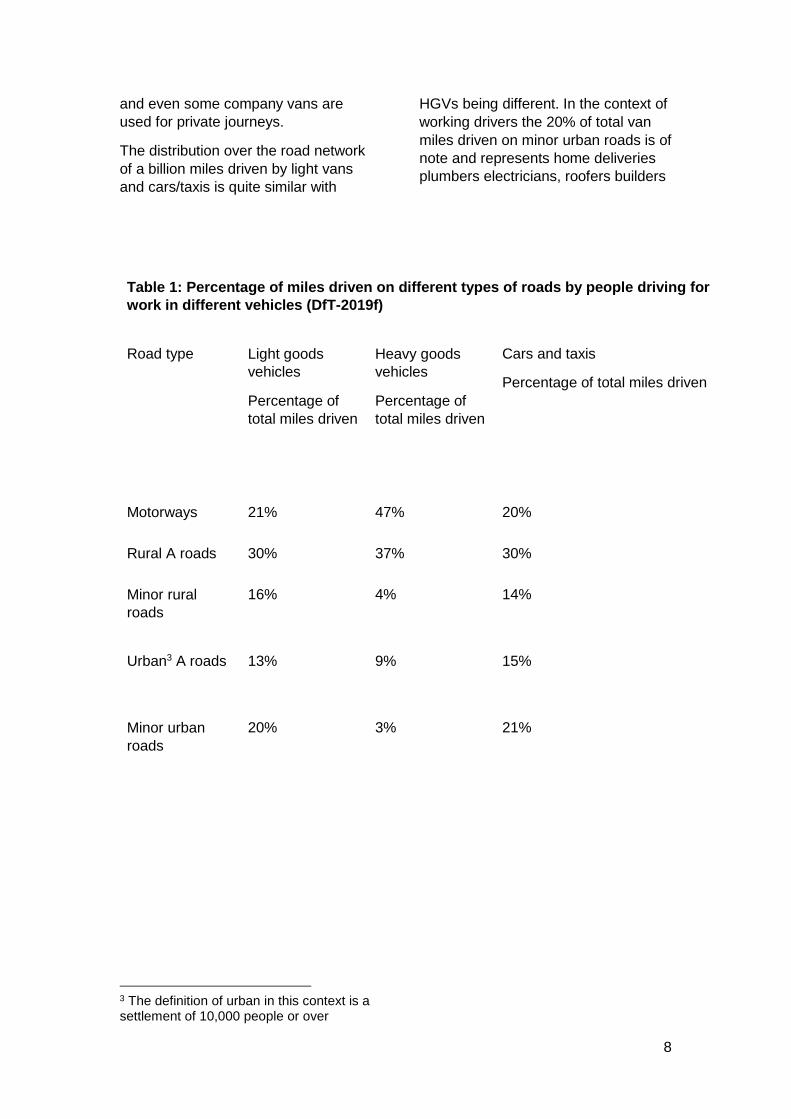
The distribution over the road network
of a billion miles driven by light vans
and cars/taxis is quite similar with
HGVs being different. In the context of
working drivers the 20% of total van
miles driven on minor urban roads is of
note and represents home deliveries
plumbers electricians, roofers builders
3 The definition of urban in this context is a settlement of 10,000 people or over
Table 1: Percentage of miles driven on different types of roads by people driving for
work in different vehicles (DfT-2019f)
Road type Light goods
vehicles
Percentage of
total miles driven
Heavy goods
vehicles
Percentage of
total miles driven
Cars and taxis
Percentage of total miles driven
Motorways 21% 47% 20%
Rural A roads 30% 37% 30%
Minor rural
roads
16% 4% 14%
Urban3 A roads 13% 9% 15%
Minor urban
roads
20% 3% 21%

9
The large proportion of vans involved
in the construction sector may go
some way to explaining the reductions
in van traffic during the Covid-19 lock
down in March, April, May, and June
2020. DfT estimates that in the
immediate pre Covid-19 phase in
March van traffic was about 110% of
its February 2020 levels. During the
lockdown phase when all construction,
accommodation, food services and
many others were affected then van
travel in April dropped to 35 to 40% of
its February levels. It crept up during
May and as the construction sector
started to work again the levels rose
steadily through May and June until by
mid July 2020 van traffic was back to
its pre Covid-19 levels. During this
period, car travel dropped off faster
than van travel, was consistently
below that of vans and recovered
more slowly to about 90% of its pre
Covid-19 levels (DfT 2020).
1.3 Cars used for work journeys Company cars were first introduced to
individuals in the 1970s as way of
increasing benefits to circumvent the
wage freeze. Over time since then
various changes in government
taxation policy have had dramatic
effects on the numbers of such
vehicles registered. In the 2009/10 tax
year 970,000 UK tax payers paid tax
for the use of a company car
compared with 1.65m in 1995/96 (Le
Vine et al, 2013). In 2016/17 this had
fallen further to 940,000 (HMRC 2018)
In the 1990s just over 10% of cars
were company registered peaking at
10.5% in 1997 (2.4 million cars out of
a total registered of 23.3 million). From
then until 2019 the percentage
dropped steadily to 8.6% (2.7 million
4 In the main these are cars but can include vans, TWMV and pedal cycles,
company registered cars out of
31.9million cars (DfT 2019e). More
than 85% of these are registered to
fleets which are defined as those
companies having more than 25
vehicles.
A pool car is also a company
registered car as it used for work and
is owned and run by the company who
is also the keeper since these cars are
not assigned to individuals. The
business might have only one pool
car, or several of them. Because they
are not available for use to any one
employee pool cars do not attract tax
as benefit in kind for the employee nor
is it an employment related benefit for
the employer.
The car is not for personal use and
should not be kept at or near an
employee’s home overnight nor is it for
the exclusive use of any one
employee.
The term Grey Fleet refers to
vehicles4 that are owned by
employees but used for business
purposes.
One of the effects of the changes in
taxation was for employees to forgo
the company car in exchange for an
increase in salary with which they
could purchase and run their own car
for use on company business and be
reimbursed for these miles, but not for
commuting miles, at the prevailing
rate. This is common in the public
sector where it is estimated that they
account for 57% of the estimated 1.4
billion miles/year total public sector
road mileage. The mileage allowance
payments which are not liable for tax
are 45 pence per mile for the first
10,000 miles and 25p per mile
thereafter for cars. These rates were

10
set in 2011/12 tax year and are still
current in 2019 (HMRC 2019).
Reimbursement for miles driven has
the perverse effect of acting as a
disincentive to reduce mileage. Most
drivers see the cost of a business
journey in terms of fuel which accounts
for about half of the pence per mile
payment. The rest is seen as tax free
cash income and this financially
assists the driver in the running of their
own car. It is relatively common for
mileage to be rounded up by a mile or
two per journey claim. The upshot is
that companies who do not keep a
close eye on the expenses ended up
paying too much to run their grey
fleets (Energy Saving Trust, 2015).
Within this type of scheme many
employers do not collect data on cars
driven by employees for work
purposes (BVRLA and Energy Saving
Trust 2016).
We do not know how many cars there
are in the grey fleet. Estimates range
from 4m (Energy Saving Trust, 2012),
to 14m (Lex Autolease 2015). This
latter figure seems high as it
represents almost 40% of all cars
registered in 2016. According to the
2011 census there were 23,366,044
households in England and Wales
which between them had access to
27,081,066 cars or vans. 5,989,770
households had no cars. It is unlikely
that almost 50% of this 27m are used
for work related trips in the grey fleet.5
We do not have an updated estimate
of the numbers of cars in the grey fleet
for 2019/20 but more of the larger
companies and organisations have
recognised the safety and economic
benefits of leasing cars for employees
to use or hiring for shorter trips. This
5 In this report we have not estimated grey
fleet numbers but have estimated grey
fleet mileage (see Appendix 1).
may have led to a stabilisation in the
number of grey fleet cars.
1.4 The ‘gig’ economy and lifestyle couriers There has been a large increase in the
number of gig workers who use their
own cars and vans for their delivery
work but these are not part of the grey
fleet because the drivers are not
employees and are responsible for
their own operating costs. The gig
economy involves people who do not
get paid a salary but get paid per gig -
similar to a ‘piece rate’ whereby
service providers are linked to service
users via an app. Examples of this
type of employment are taxi services,
food and parcel delivery (Christie and
Ward 2018).
From current statistical series, it is not
possible to estimate how many such
workers there are and whether they
drive vans or cars nor how many hours
they work or miles they drive. An
independent survey would be required
to assist in the estimation of their
travel patterns.
Privately owned cars (whether or not
used for business purposes) are on
average about 7 years old whilst
company cars are, on average, less
than 2 years old. Privately owned vans
predominantly used by sole traders
and SMEs are on average 8 years old
compared with company fleets at two
to three years.
In 2019 (DVSA 2020) more than 32
percent of cars and light vans, and 41
percent of vans 3-3.5 tonnes failed the
MOT test at the first examination. The
age of privately owned vehicles has
implications for the speed at which
new technologies and safety features
11
permeate into privately owned grey
fleet cars and vans.
1.5 Mileage of cars The miles driven by all cars has fallen
since 2002. Of the 20,500 miles per
year in 2002 for company cars the
business mileage was 9,000,
commuting 5,700 and private 5,700.
By 2016 this had reduced to 18,900
(7100 business, 6700 commuting and
5100 private). A similar picture
emerges for privately owned cars
which do fewer miles in each category,
Overall, the annual mileage has
dropped from 8400 to 7500 with
business mileage halving from 800 to
400. People are commuting further
2,500 to 2600 miles per year, but
private mileage has also dropped from
5100 to 4400 (DfT 2019e). Reduction
in company car mileage is key factor in
explaining the overall reduction in
distance travelled by car for 30+ year
olds living outside London.
2. Understanding risk of driving for work
We do not have estimates for the
numbers of people who drive for work
which means it is difficult to estimate
fatality rates per 100,000 workers or
working drivers. The Transport Safety
Commission report (Transport Safety
Commission 2015) highlighted that the
risk of driving a heavy goods vehicle
for work is comparable to other high-
risk occupations:
“The HSE have estimated the fatality
rate for drivers of heavy goods
vehicles (HGVs) over 7.5 tonnes to be
4.4/100,000 HGV Drivers (based on 5
year average 2006/07–20210/11 with
a 5 year average of 12 fatalities a
year) which is second only to
agriculture with a death rate of 10.3
per 100,000 workers over the same
period”
2.1 How we compare to other countries Currently, we do not have comparative
data on work-related driving risk to
compare our performance with that of
other countries such as the
Netherlands or Germany. In 2017, the
European Transport Safety Council
published How to improve the safety of
goods vehicles in the EU under its
Safety Performance Index Programme
(PIN) This enabled good practice
across Europe to be identified. One
major challenge is lack of consistent
definition of a road death arising from
a work-related journey because some
countries include commuting and very
few include third parties killed or
injured by a working driver or rider.
Few countries link coroner’s data,
occupational health data and road
death data so the extent of work-
related road deaths is under-reported.
An exception to this is in employee
deaths and injuries in Germany where
the road death and injury data
reported by employers is complete as
injury reports are an integral part of the
statutory accident insurance system
which covers employer’s liability for
compensation to employees if they are
injured whilst at work.
We do not have statutory employer
accident insurance in the UK.
Employers in the UK report an at work
accident where there is more than four
days absence to RIDDOR (HSE
Reporting of Injuries, Diseases and
Dangerous Occurrences). However,
this excludes the reporting of injuries
on the road which are collected by the
police and not the HSE (see Section
2.4)
2.2 Working drivers: estimating the true picture There are few sources of information
about number and type of collisions
involving injury where at least one of
the drivers has been driving for work at
12
the time. One such source is the
casualty statistics reported to the
police (STATS19a) and published
annually by the DfT in Reported Road
Casualties Great Britain.
Using STATS19 records from 2011 to
2018-19:
16.0 % of all collision-involved
drivers were recorded under the
heading journey as part of work.
This is generally assumed to be
an underestimation (a further
10.2% were recorded as
commuting). This does not mean
that these drivers were injured.
They represent the journey
purpose of drivers of vehicles
involved in injury collisions.
We have assumed that heavy
good vehicles, buses, other
vehicles, taxis, and a
proportion of vans do not
commute. This assumption
alone increases the estimate to
17.7% of all collision-involved
drivers (and reduces the
percentage commuting to
9.6%).
Using data on grey fleet,
business mileage of private
cars and vans, and business
mileage of company cars and
vans this note brings forward
an aggregate estimate of
21.6% of all collision involved
drivers were working drivers.
working car drivers are under-
recorded in STATS19 by
approximately 40%
working van drivers are under-
recorded by approximately 47%
over the adjusted working driver
figures this includes journeys to
and from places of work
There are no independent
estimates of fleet size or
business mileage for
motorcycles and pedal cycles
therefore the raw STATS19
records of 6.4% working pedal
cycles and 9.6% working
motorcycles has been taken.
2.2.1 Assumptions made in reallocating journey purpose of vehicles Where vehicles are categorised as
HGV (3.5t and over), Bus, or Other
(including tractors and trams), the
journey purpose is always assumed
to be Working even if not so coded in
STATS19. This means that these
larger vehicles are assumed not to
commute, not to be used on a school
journey, not to be used as ‘other’ (i.e.
personal business)
Large vehicles are unlikely to be used
for personal journeys. However, 3% of
known journey purposes are recorded
as “commuting” or “other” and 20% are
recorded as “unknown” journey
purpose. Assumption: All large
vehicles were driven for work. This
is less wrong than assuming that 23%
were not driven for work
Taxis are assumed to be working if
coded as working or commuting.
They can be used for other journeys
because many taxis are used as
13
private cars when not working. They
are assumed not to commute as they
do not go to the same place of work
each day. Many taxi journeys are
recorded as “commuting” this refers to
passengers. 3% of known purposes
are recorded as “commuting”.
Assumption: all taxis recorded as
“commuting” were working. This is
less wrong than assuming 3% were
genuinely commuting. The problem is
that 27% are recorded as “unknown”
journey purpose. Data to estimate the
true purpose of these journeys is hard
to find
Where vehicles are categorised as
Van (under 3.5t, including goods
vehicles of unknown weight) the
journey purpose is assumed to be
Working if coded in STATS19 as
Working or Commuting. Vans are
similar to taxis in that many vans act
as the ‘family car’ when not being used
for work. In Appendix 1 we describe
the method we have used to estimate
this split between working and non-
working van use. Within this
categorisation of working vans we
have assumed that they do not
commute. These vans are classed as
‘working’ as they do not go to the
same place of work each day (the
definition of commuting) – such as
trades (electricians, builders, plumbers
etc).
Cars used for work provide a unique
challenge. We have not estimated the
size of the working car fleet but we do
have estimates of mileage driven for
work. By using our assumptions we
estimate that the grey fleet and
company cars account for 12.6% of all
car mileage. Based on the
assumptions listed in Appendix 1, the
estimated proportion of total light
goods vehicle mileage driven for
business purposes in 2018 was
81.9%.
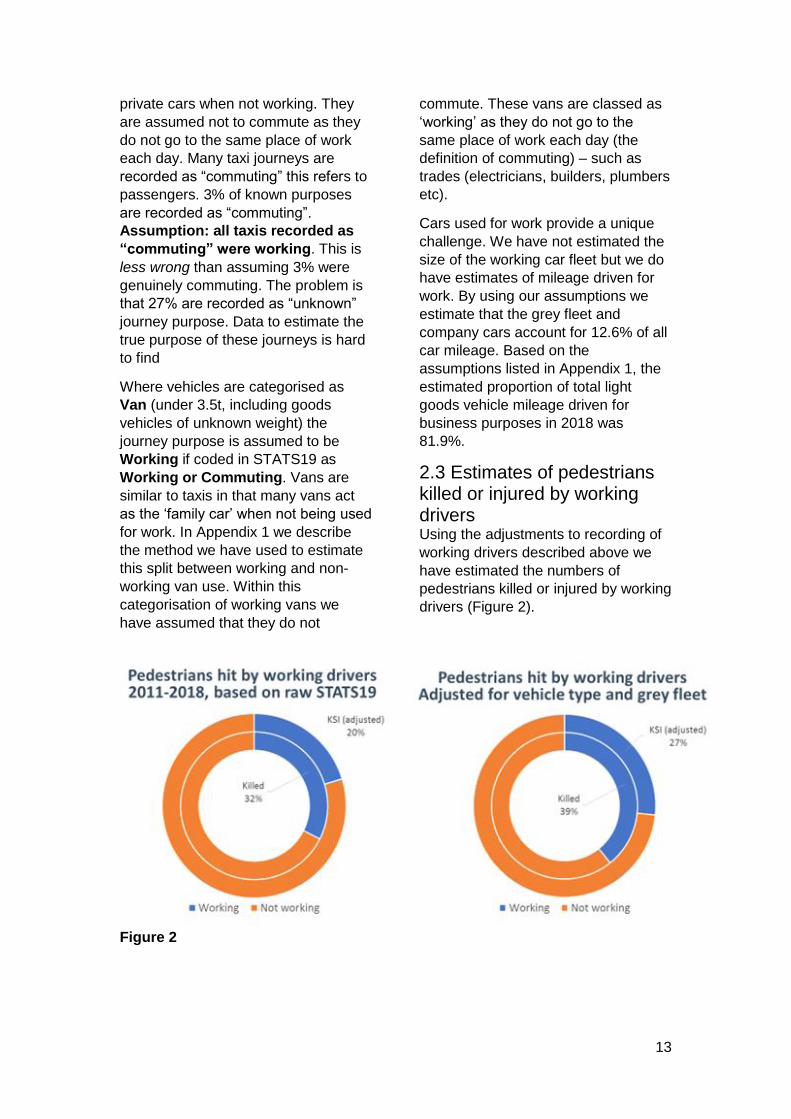
2.3 Estimates of pedestrians killed or injured by working drivers Using the adjustments to recording of
working drivers described above we
have estimated the numbers of
pedestrians killed or injured by working
drivers (Figure 2).
Figure 2
14
Based on STATS19 Journey Purpose
field alone, over 8 years:
974 pedestrians were recorded
as killed by a working driver
7,880 pedestrians were recorded
as seriously injured
If injury-based reporting had
been in place, serious injuries
would be around 9,675
20% of KSI pedestrians were
hit by a working driver
32% of killed pedestrians
Equivalent to over 9 deaths a
month
If adjustments are made based on
vehicle type where large vehicles are
always used for work and van and taxi
drivers do not “commute”:
1,070 pedestrians recorded as
killed by a working vehicle over 8
years
8,808 pedestrians were recorded
as seriously injured
If injury-based reporting had
been in place, serious injuries
would be around 10,796
23% of KSI pedestrians were
hit by a working driver
36% of killed pedestrians
Estimate of grey fleet in STATS19
based on vehicle usage:
Car grey fleet: nearly 5% of cars
recorded as “Unknown” (52,178
vehicles in 8 years) were
probably working
Van grey fleet: about 62% of
vans recorded as “Unknown”
(28,219 vehicles in 8 years)
were probably working
It is not possible to identify
individual “Unknown” journey
purposes to change
Adding these grey fleet estimates to
our vehicle type assumptions:
About 1,179 pedestrians were
killed by a working vehicle
About 10,356 pedestrians were
recorded as seriously injured
If injury-based reporting had
been in place, serious injuries
would be around 12,794
27% of KSI pedestrians were
hit by a working driver
39% of killed pedestrians
Equivalent to about two extra
deaths a month
From further analysis it can be
estimated that:
In single vehicle collisions where
a working van driver was
involved - in 69% of the records
a pedestrian was injured (over 8
years 4863 van drivers hit a
pedestrian and 2194 did not)
compared with 76% of collisions
involving non-working van
drivers (4387 hit pedestrian and
1381 did not).
For working cars the numbers
are larger but the percentages
are very similar at 57.7% single
vehicle working driver in collision
with a pedestrian compared with
15
56.7% for non-working car
drivers.
The number of single vehicle
working cars injuring a
pedestrian is only twice that of
single vehicle working vans.
DfT figures indicate that the
fatality rate for vans is about 3.4
per billion vehicle miles
compared with cars at about 7.3
fatalities per billion vehicle miles
but these figures do not take into
account working drivers but our
analysis indicated that a higher
percentage of vans are working
than cars.
For comparison, the rate for
HGVs is about 16 fatalities per
billion vehicle miles.
2.4 Background to inclusion in STATS19 of journey purpose In 2000 the government and the
Health and Safety Commission (HSC)
set up an independent Work-related
Road Safety Task Group (WRRSTG)
under the chairmanship of Richard
Dykes to promote a national debate on
the issue of employers’ management
of occupational road risks as part of
health and safety management. Their
report Reducing at-work road traffic
incidents was published in 2001.
In its response to the Dykes report the
HSE’s main concern was that it did not
want to be subject to any enforcement
or investigative activity relating to road
traffic incidents but there was
recognition that something needed to
be done to improve at-work road
safety in co-operation with others. The
position of HSE with regards to road
related injuries is that these are
covered by Road Traffic Acts which
protect public and worker safety and
therefore occupational road risk is not
an area for HSE. Of the 18 Dykes
recommendations which were
accepted was the inclusion of journey
purpose in STATS19.
2.4.1 Support for the inclusion of journey purpose in STATS19
The collection of data on pupil on a
school journey is a long standing item
and has been included in STATS19
since 1979 but as a result of the Dykes
recommendation a new item called
journey purpose was introduced in
2005 to include commuting, journey as
part of work, unknown, and other. The
pupil on a school journey was changed
to Taking pupil to/from school and
Pupil riding to/from school. Between
2005 and 2011 unknown and other
were treated together.
The collection and recording of this
data is challenging for police officers to
record consistently. Data analysis
shows that in general there is
considerable room for improvement in
the way in which journey purpose is
collected. While this field is useful, it is
not realistic to rely on it alone because
under a third of collision involved
vehicles have a journey purpose
recorded as opposed to unknown or
other. Therefore, we need to use other
methods to understand the true extent
of driving for work.
We are unable to say anything about
under-reporting as we cannot know
the journey purpose of unreported
drivers of involved vehicles. We can,
however, roughly estimate the journey
purpose of those reported

16
drivers/vehicles where there has been
obvious miscoding or where we can
use other data sources to provide
estimates of fleet size and whether a
driver/vehicle is at work.
3. What strategic stakeholders told us
3.1 What we did We interviewed eight national strategic
stakeholders who have an interest in
road safety or role in the management
of occupational road risk. The names
of the participants and organisations
have been anonymised. The
interviews were semi structured based
on a topic guide shown in Appendix 2.
All participants were asked the same
questions. Framework analysis was
used to understand the key themes in
the data, an approach which is often
used in applied policy research
(Ritchie & Spencer, 1994). After all the
interviews were completed the data
were sorted in accordance with key
issues and themes. In this case the
thematic framework was informed by
the areas of questioning provided by
the topic guide but was also adapted
to include new themes emerging from
participants responses. Finally, a
thematic map was developed to show
the inter relationships between themes
(Braun and Clarke, 2006). Verbatim
quotes are provided to illustrate
themes and are attributed to according
to the participants as shown in Table
2.
Table 2: Code and description for participants in interview survey
Participants Organization
A Union
B National government
C Health and safety regulator (Ireland)
D Emergency services
E Health and safety regulator (England)
F Charity - Injury prevention
G Highways Operator
H Charity road safety
3.2 What we found
3.2.1 New employment models and risk Participants felt that the new models of
employment such as for those hired in
the gig economy meant that all
corporate risks were passed to the
individuals. It was felt that this model
of employment was ’shrouded in confusion’ and ‘disguise’ and there was a general lack of acceptance that there was a growing problem in this area. For these reasons, it was felt to
17
be difficult to identify and regulate this area of work because the employment status of workers was unclear, and this had implications for public safety.
3.2.2 Disregard for health and safety One participant argued that these new
models of employment were being
adopted by companies that had a total
disregard for the health and safety of
their workers. It was felt that this
created risks for these workers,
especially for those using motorcycles
being vulnerable to vehicle theft and
gang attacks. From a union
perspective, it was acknowledged that
it was good for people to be employed
but they felt that questions needed to
be asked about whether workers were
being exploited and were conditions of
work fair.
It was felt that the onus should be
shifted to companies to prove that
these people are self-employed, not
the individuals. It was felt that it would
take a ‘political sea change’ to ensure
that health and safety was not
dismissed as an argument about ‘red
tape’ and ‘burdens’. The ‘bogus’
employment status of gig workers
meant that they were a hard to reach
group ‘like finding a needle in a
haystack’ and increasingly difficult to
identify due to a major growth in this
type of work. One participant
(Participant E- Health and safety
regulator) suggested that gig workers
should be regarded as employees
because ‘they’re told where to go and
how long they have to do their work,
they get paid per delivery or hourly
rates’ arguing that there should be a
change in employment laws to bring
them into scope.
Participants felt that it was
questionable whether gig workers had
the correct insurance and were also
concerned that they were paid below
the minimum wage, were not trained
or not given the correct safety
equipment and were not working
within driving hours guidelines for
commercial drivers. The growth in gig
services was linked to an increase in
vans in city centres and a feeling of
being ‘surrounded by vans’ with one
participant describing it as a ‘free-for-
all’ and ‘posing a real problem‘. One
participant had clear concerns about
delivery drivers because of their
unclear employment status because
their ‘managers’ would not know if they
were working for multiple companies
and driving long hours as result.
3.2.3 Data on risk associated with gig workers and the grey fleet Participants also felt that there was
little data to help understand the road
safety risk associated with these new
ways of working. STATS19 (police
reported casualty data) was not
regarded as a reliable source of data
about worker related collisions
because under a third of collision
involved vehicles have a journey
purpose recorded as opposed to
unknown or other. One participant
argued that more should be done to
address this lack of intelligence by
encouraging the police to fill in journey
purpose and going further to make it ‘a
mandatory field’(Participant G-
Highways operator). However, the
government department official felt
that they had ‘not seen that data and
analysis suggesting there's something
to be really concerned about’
(Participant B, National Government).
It was felt that there was a genuine
problem with the way data are
collected about collisions and that the
police should be asking more probing
questions about whether the journey
was work related. (Participant E-
Health and safety regulator).
Moreover, it was felt that ‘There was
no data on size of the problem and

18
that ‘nobody really understands what’s
happening’.
Whilst many of the participants said
that vans were a real and growing
safety concern it was felt more data
was needed that ‘drills into collisions
involving vans and really build up a
profile of what the issues are, you
know, really, really look into it
‘ (Participant C, Health and Safety
Regulator). One participant reported
that in their free speed survey that lack
of speed compliance was a greater
problem among trucks and vans
compared to other vehicles.
One of the participants, based in
Ireland, reported that their legislation
was changed so that road crashes
were reportable to Health and Safety
Authority. This participant also said
that they were now contributing to a
Eurostat indicator on the number work-
related road collisions.
3.2.4 Grey fleet risks The risks associated with the grey fleet
were regarded as ‘hidden’. Initiatives
such as Driving for Better Business
were raising awareness that that the
grey fleet was a problem that was not
being tackled by businesses even
though they can reduce costs by
managing the risks. It was felt there
was a need to link coroner’s data and
crash data and develop a protocol for
analysing work-related collisions.
3.2.5 Lack of awareness and acceptance of risk by national stakeholders Because of the lack of data it was felt
that key national stakeholders such as
the Health and Safety Executive,
Department for Transport,
Confederation of British Industry were
‘very muted’ around the issue of road
safety risk because ‘people come from
a more traditional model of
employment so don’t understand the
total implications around the gig
economy’.
The lack of awareness among
stakeholders was seen as a major
barrier to addressing safety because
‘they don’t see there is a problem,
because it doesn’t manifest itself
because they don’t measure it.’ It was
felt that if they started to realise that
the collisions had costs associated
with them in terms of financial costs to
the business as well as injury and
deaths they may be more motivated to
act.
3.2.6 Licensing Participants felt that there should be
more scrutiny of the licences of people
who drive for work in the gig or grey
fleet to ensure they are valid and
check whether they were any
endorsements. One participant said
questions should be asked as whether
people are covered to carry parcels or
other goods or people. Participants
were asked what role licensing could
have but most felt it did not have a role
to play because of the wide variety of
types of licences needed and that it
would be problematic to implement. It
was noted that the type of licence
required was clear when the vehicles
are above 3.5 tonnes but much less
clear for vans and cars driven for work
though instituting a regulatory regime
for all vehicles used for work, including
bicycles, might be too onerous. One
participant suggested that there was a
need for an extra licencing module on
driving for work though acknowledged
there were implementation issues. It
was also felt that there was a lack of
awareness amongst employers about
the licence requirements in order to be
able to drive certain vehicles.
3.2.7 Newly qualified drivers One participant acknowledged the
particular vulnerability of newly
qualified young drivers and that they
needed extra training in order to deal
19
with the risks they face ‘because ‘you
wouldn’t give them a chainsaw next
week and tell them to go and cut a tree
down because he’s now 18. You
would train him’.
3.2.8 A hard to reach group People in the gig economy were
considered to be a hard to reach group
in terms of addressing occupational
road risks because of their uncertain
employment status. It was felt to be
difficult for employers to understand
who is working for them, what those
drivers are doing, how to communicate
with them or even perceive a need to
communicate with them other than
making sure that they know where
they are delivering. It was felt that
employers or owners of digital
platforms that connect drivers to
customers might say that they are not
our employees, so they need to look
after themselves. Similarly, people
who drove their own cars and were
reimbursed the mileage by their
employer were regarded as hard to
target because employees were
present in many different sectors
carrying out different types of work. It
was felt that the challenge for
managing occupational road risk for
these workers was to understand how
to get to them, how to engage with
them, and how to change their
behaviours.
3.2.9 Policy Participants felt that the role of
government and regulators should be
strengthened to address the safety
risks associated with occupational
driving and riding. There was support
for a road safety indicator in national
policy to focus attention on the issue to
enable measurement and monitoring
and to support intervention efforts.
Such metrics would demonstrate the
importance of occupational road safety
and encourage its management. It was
felt that the HSE ‘shunned’ any
responsibility of the management of
occupational road risk and that this
should change.
3.2.10 Interventions Participants felt that there was a lack
of evidence-based interventions for
addressing work-related road safety
but felt there was scope for tailored
interventions supported by
enforcement. Whilst it was felt that
employers needed to implement
interventions it was felt gathering
evidence on good practice should be
carried out by national and local
government
3.2.11 Role of HSE It was also felt that the role of the HSE
should be strengthened and that
occupational road risk should be fully
brought under their remit.
3.2.12 Role of the employer Participants felt that the management
of occupational road risk by employers
was not universally or consistently
implemented with risk assessments or
‘clear procedures for their staff, and
instruction, information and training
about their drivers or their personnel
around driving for work risk’. Engaging
with employers was felt to be a key
way to address occupational road risk
and road safety in general so that they
understand the business benefits they
gain from managing occupational risks
and the relationship between good
management and safety. It was felt
employers should be targeted and that
the key lever was the commercial and
corporate advantage they would get
from managing risk by ensuring ‘their
staff and vehicles were compliant they
could reduce the risks and costs of
crashes [and] make the business more
competitive’.
For people driving for work as part of
the grey fleet it was felt that
interventions need to be directed at
employers and the management of
20
occupational road risk strategically
embedded as a health and safety
priority at board level. Employers were
seen as able to improve safety by
making it clear to their staff that they
expected them to abide by the rules
with the expectation that if they break
the rules this would be followed up and
this would provide an opportunity for
people to be educated and understand
the consequences of taking risks.
One participant felt that there needed
to be more focus on the grey fleet
which should be seen as a ‘company’
asset’ but it was difficult to identify
‘someone to start a dialogue and raise
awareness with’. This was important
because there was a ‘duty of care from
them and their organisation ‘. Another
participant argued that Directors of
Public Services could take a leading
role to raise awareness of insurance
and staff using their private cars as
grey fleet cars.
3.2.13 Responsibility The participant from government
commented that they felt it was a
shared responsibility to address work
related road safety and an opportunity
for partnership working with the HSE
and businesses ‘because we care
about reducing death, serious injury,
on our roads, and employers have a
responsibility, as an employer, to keep
their employees safe’(Participant B,
National Government).
Participants felt that there was a lack
of direct engagement with employer
organisations, and there needed to be
clearer understanding of the
responsibility of companies and more
investigation of the safety risks
associated with this model of
employment. Participants mentioned
that a high-level strategic approach
was needed involving key
stakeholders such as:
Institute of Directors
Chambers of commerce
Business Employers
Confederation
Department for Transport
Road Safety Authority of
Ireland
DVSA
Police
Highways England as the
network operator
Construction Industry
Federation
Trade unions
Insurers
Road Haulage Association.
Freight Transport Association.
Chartered Institute of Logistics
and Transport Facilitators
3.2.13 Enforcement The police were seen as an essential
partner who could engage with
businesses and thereby influence a
large number of employees.
Participants felt that enforcement and
fear of being detected were required to
ensure that individuals and employers
took occupational road risk seriously.
3.2.14 Interactive courses In terms of training on health and
safety there was some concern that
small businesses might struggle to
manage risk suggesting that some
online interactive courses should be
developed.
3.2.15 National media Most participants felt that given the
diverse target audience and the varied
nature of work carried out under the

21
umbrella of ‘driving for work’ national
media did not have a role to play other
than very generic messages such as
those on the strategic network e.g.
Take a Break to combat fatigue related
collisions. There was a perceived need
for a more targeted and tailored
approach for particular sectors, or
types of employers, or types of drivers.
3.2.16 Managed fleet One participant had been involved in a
significant review of their own
organisation’s grey fleet operations.
They uncovered issues around vehicle
use and insurance such as people
using their own vehicles for business
trips and not always declaring it to
HMRC, some vehicles not being fit for
purpose or people’s insurance not
covering them for using the car for
business. This led to a move to a
managed fleet rather than grey fleet
which gave them much more control
over the vehicles, their servicing
history, insurance standards and took
away any personal liability around tax.
This participant also commented on
the role that technology had in
supporting the management of the
fleet such as 360-degree dash cams,
speed limiters and telematics that
helped to provide management
information about behaviours such as
speeding.
3.3 Summary 1. The strong narrative that came
through the interviews was that there
was new models of employment
involving driving or riding for work that
meant that there were emerging
issues for the management of
occupational road risk, but a lack of
detailed data around risk and effective
interventions.
2. Participants felt that conditions
of employment were a key issue and
employers or people who contract
services should have a clear
responsibility for managing risk and
they were the most important conduit
for engaging workers.
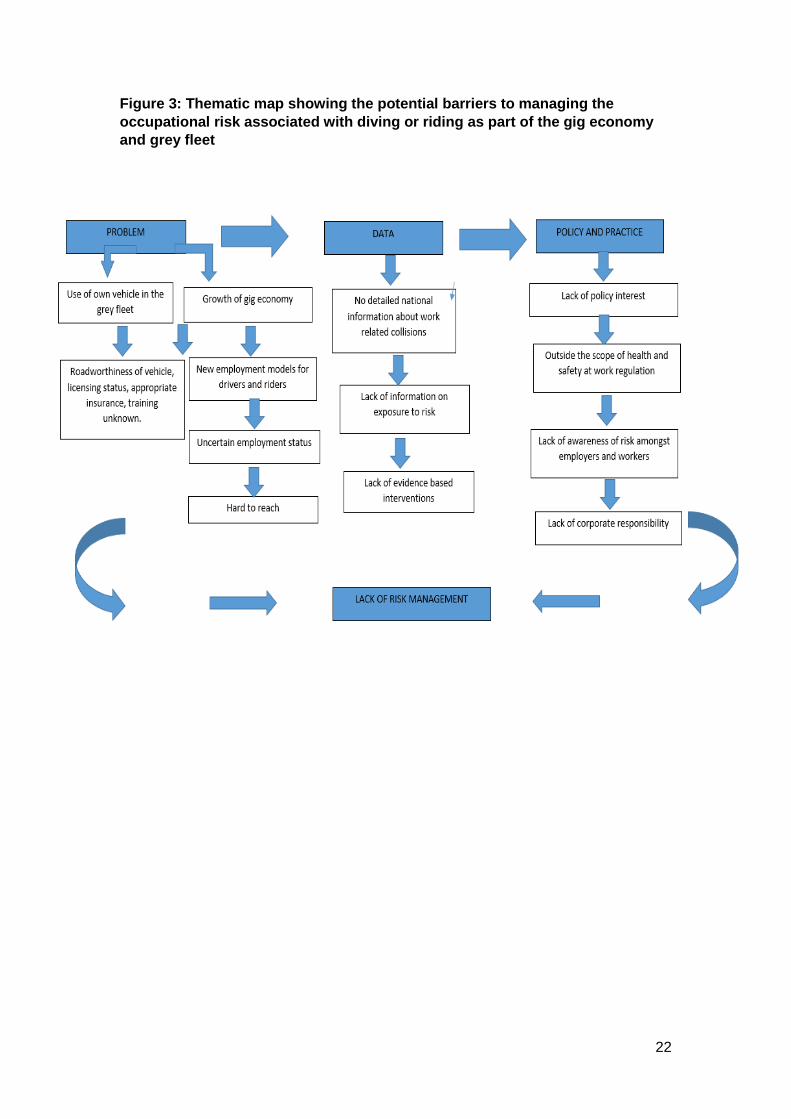
3. The nature of driving for work
in the gig economy or as part of the
grey fleet created barriers to managing
occupational road risk of these
workers (described in the thematic
map in Figure 3).
4. A high-level strategic
partnership approach was thought to
be the best way forward with a clear
focus on employers at board level and
as a way to resource interventions.
5. There was support for HSE to
put occupational road risk within their
scope and make injuries reportable.
6. There was support for a
national indicator for work-related
collisions as a way of measuring and
monitoring risk.
7. It was felt that interventions
should be directed at board level
across all sectors of employers and
this should involve holding people to
account and raising awareness of the
commercial advantage and corporate
responsibility for managing
occupational road risk.
8. For the grey fleets, a move to
managed fleet was seen as desirable
with technologies such as telematics
to support the management of risk.
22
Figure 3: Thematic map showing the potential barriers to managing the
occupational risk associated with diving or riding as part of the gig economy
and grey fleet

23
4. Conclusions Our strategic review has helped
identify a number of gaps in our
understanding of the nature of risk
posed by people who drive for work
using vans and cars.
1. In the first six months of 2020, we
have seen changes in the amount
of home deliveries and reductions
in commuting and in driving for
work. We do not know what the
medium and long term is going to
look like but to calculate how it
differs from pre 2020 we need
better data on who is working,
what they are driving/riding, how
much and on what types of road.
We need to know who is injured
and establish whether more
pedestrians and cyclists are at risk
of injury from more working miles
being driven on local roads.
2. We know nothing about the
numbers of gig workers in the
transport area who, in particular,
deliver food and parcels. Without
this knowledge we cannot estimate
their risk as working drivers nor
develop interventions to improve
their safety. We assume they are
using their own cars, vans, and
motorcycles/mopeds which we do
know are generally older than
company provided vehicles.
3. We do not have an accurate
estimate of the number of cars in
the grey fleet and how this is
changing over time but we have
provided estimates of the mileage
of the grey fleet.
4. We do not know the current
percentage of van mileage that is
work related and that which is
private. We do know that privately
registered vans are often used for
private mileage.
5. The journey purpose field in
STATS19 is poorly completed by
the police. It needs to be improved.
6. There is no data on the numbers of
motorcycles and mopeds being
used for work. Whilst this report
focusses on vans and cars,
changing work patterns and
incidence of home deliveries in a
post Covid-19 world will be
expected to affect the casualty and
collision rates of all working drivers
especially in regard to other road
users who are not working.
7. There is a lack of detailed data
around risk and effective
interventions.
8. There is a lack of ownership,
leadership, and management of
the problem among some key
stakeholders.
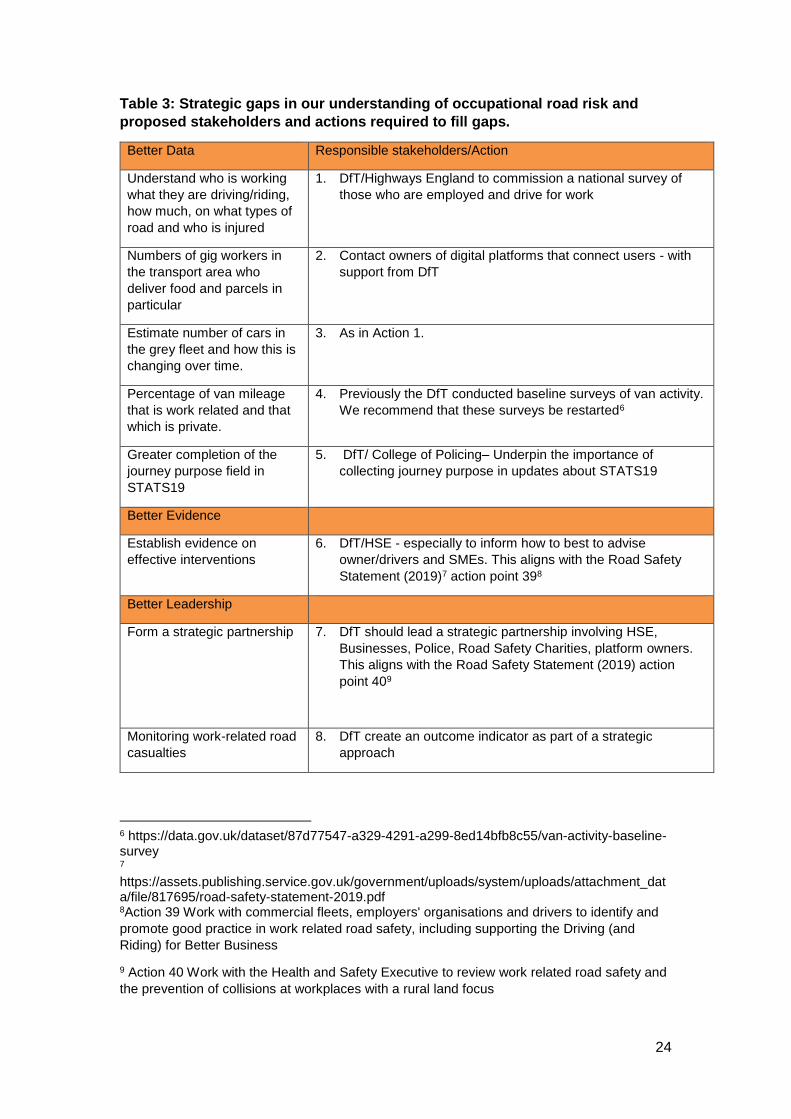
5. Actions required to address the gaps
Our strategic review has identified a
number of gaps in the data and
evidence that need to be filled. In
Table 3 below, we identify the gaps
and the stakeholders and action
needed to help fill these gaps.
24
Table 3: Strategic gaps in our understanding of occupational road risk and
proposed stakeholders and actions required to fill gaps.
Better Data Responsible stakeholders/Action
Understand who is working
what they are driving/riding,
how much, on what types of
road and who is injured
1. DfT/Highways England to commission a national survey of
those who are employed and drive for work
Numbers of gig workers in
the transport area who
deliver food and parcels in
particular
2. Contact owners of digital platforms that connect users - with
support from DfT
Estimate number of cars in
the grey fleet and how this is
changing over time.
3. As in Action 1.
Percentage of van mileage
that is work related and that
which is private.
4. Previously the DfT conducted baseline surveys of van activity.
We recommend that these surveys be restarted6
Greater completion of the
journey purpose field in
STATS19
5. DfT/ College of Policing– Underpin the importance of
collecting journey purpose in updates about STATS19
Better Evidence
Establish evidence on
effective interventions
6. DfT/HSE - especially to inform how to best to advise
owner/drivers and SMEs. This aligns with the Road Safety
Statement (2019)7 action point 398
Better Leadership
Form a strategic partnership 7. DfT should lead a strategic partnership involving HSE,
Businesses, Police, Road Safety Charities, platform owners.
This aligns with the Road Safety Statement (2019) action
point 409
Monitoring work-related road
casualties
8. DfT create an outcome indicator as part of a strategic
approach
6 https://data.gov.uk/dataset/87d77547-a329-4291-a299-8ed14bfb8c55/van-activity-baseline-survey 7 https://assets.publishing.service.gov.uk/government/uploads/system/uploads/attachment_data/file/817695/road-safety-statement-2019.pdf 8Action 39 Work with commercial fleets, employers' organisations and drivers to identify and
promote good practice in work related road safety, including supporting the Driving (and
Riding) for Better Business
9 Action 40 Work with the Health and Safety Executive to review work related road safety and
the prevention of collisions at workplaces with a rural land focus

25
Acknowledgements This research was funded by Highways England. The authors would like to thank
RoadSafe and Highways England for their support for this research. We would also
like to thank all of the stakeholders who participated.
References BearingPoint (2019) Light commercial
vehicles delivering for the UK
economy. Society of Motor
Manufacturers and Traders (SMMT
2019), https://www.smmt.co.uk/)
Braun, V. and Clarke, V. (2006) Using
thematic analysis in psychology.
Qualitative Research
BVRLA (2016) Getting to Grips with
Grey Fleet,
https://www.bvrla.co.uk/resource/insig
ht-getting-to-grips-with-grey-fleet.html
Christie, N and H Ward (2018) The
emerging issues for management of
occupational road risk in a changing
economy: A survey of gig economy
drivers, riders and their managers
https://www.ucl.ac.uk/drupal/site_news
/sites/news/files/a-survey-of-gig-
economy-drivers-riders-and-their-
managers_1.pdf
Clarke, M., Johnson, A., Nankivell, J.,
and M. Turpin (AECOM 2014) Van
travel trends in Great Britain
https://www.racfoundation.org/assets/r
ac_foundation/content/downloadables/
van_report_aecom_100414.pdf
Department for Transport (2019a)
Reported casualties in accidents, by
journey purpose and casualty type
Great Britain 2013-2018. RAS30037
https://www.gov.uk/government/public
ations/reported-road-casualties-great-
britain-annual-report-2018
Department for Transport (2019b)
‘Road Safety Statement
https://www.gov.uk/government/public
ations/road-safety-statement-2019-a-
lifetime-of-road-safety)
Department for Transport (2019c)
Licensed light good vehicles at the end
of the year by keepership (private and
company). Great Britain from 1994
VEH0402. Vehicle Licensing Statistics
(https://www.gov.uk/government/collec
tions/vehicles-statistics)
Department for Transport (2019d)
Licensed heavy goods vehicles at end
of year by propulsion/fuel type Great
Britain from 1994 VEH0503 Vehicle
Licensing Statistics
(https://www.gov.uk/government/collec
tions/vehicles-statistics)
Department of Transport (2019e) Cars
licensed by keepership (private and
company), Great Britain, from 1994;
VEH0202
https://www.gov.uk/government/collect
ions/vehicles-statistics
Department for Transport (2019f)
Road traffic (vehicle miles) by vehicle
type and road class in Great Britain.
Annual; 2018 TRA0104 Traffic
(www.gov.uk/government/organisation
s/department-for-transport/series/road-
traffic-statistics).
Department of Transport (2020) Use of
transport modes: Great Britain since 1
March 2020
https://www.gov.uk/government/statisti
cs/transport-use-during-the-
coronavirus-covid-19-pandemic
Driver and Vehicle Standards Agency
(2020) MOT test results by class of
vehicle. 2nd quarter 2019/20 MOT-01
DVSA
Energy Saving Trust (2012) Take your
workforce to another level with green
26
fleet management training.
http://www.energysavingtrust.org.uk/O
rganisations/Transport
Energy Saving Trust (2015) A guide to
managing and reducing grey fleet
mileage
European Transport Safety Council
(various) PRAISE
https://etsc.eu/projects/praise/)
European Transport Safety Council
(2019) How to improve the safety of
goods vehicles in the EU.
https://etsc.eu/how-to-improve-the-
safety-of-goods-vehicles-in-the-eu-pin-
flash-39
Eurostat (2020) On line shopping
continues to grow.
https://ec.europa.eu/eurostat/web/prod
ucts-eurostat-news/-/DDN-20200420-2
Health and Safety Executive (2014)
Driving at work: managing work
related road safety
https://www.hse.gov.uk/roadsafety/em
ployers.htm
Health and Safety Executive (2018)
Health and Safety Statistics.
https://www.hse.gov.uk/statistics/fatals
.htm
Helman, S., Christie, N., Ward, H.,
Grayson, G., Delmonte, E., &
Hutchins, R. (2014). A strategic review
of the management of occupational
road risk. Retrieved from
http://www.rospa.com/drivertraining/m
orr/info/morr-strategic-review.pdf
HM Revenue and Customs (2018)
Analysis of company cars, employer-
provided fuel and private medical
insurance, by range of total income
2016-17. T4.3
HM Revenue and Customs (2019)
Rates and allowances for travel.
https://www.gov.uk/government/public
ations/rates-and-allowances-travel-
mileage-and-fuel-allowances/travel-
mileage-and-fuel-rates-and-
allowances
Le Vine, S., Luan., J; Polak., J (2013)
Van travel in Great Britain: What do
we know from the National Travel
Survey?
http://www.theitc.org.uk/docs/111.pdf
Lex Autolease (2015) Where next for
company cars. Lex Autolease
Amersham
Ritchie, J. & Spencer, L. 1994.
Qualitative data analysis for applied
policy research" by Jane Ritchie and
Liz Spencer in A.Bryman and R. G.
Burgess [eds.] “Analyzing qualitative
data”, 1994, pp.173-194.
The Transport Safety Commission
(PACTS 2015)
(https://www.pacts.org.uk/transport-
safety-commission/)
Work-related Road Safety Task Group
(2001). Reducing at-work road traffic
incidents. HSE Books (see also
hse.gov.uk/road/content/traffic1).
27
Appendices
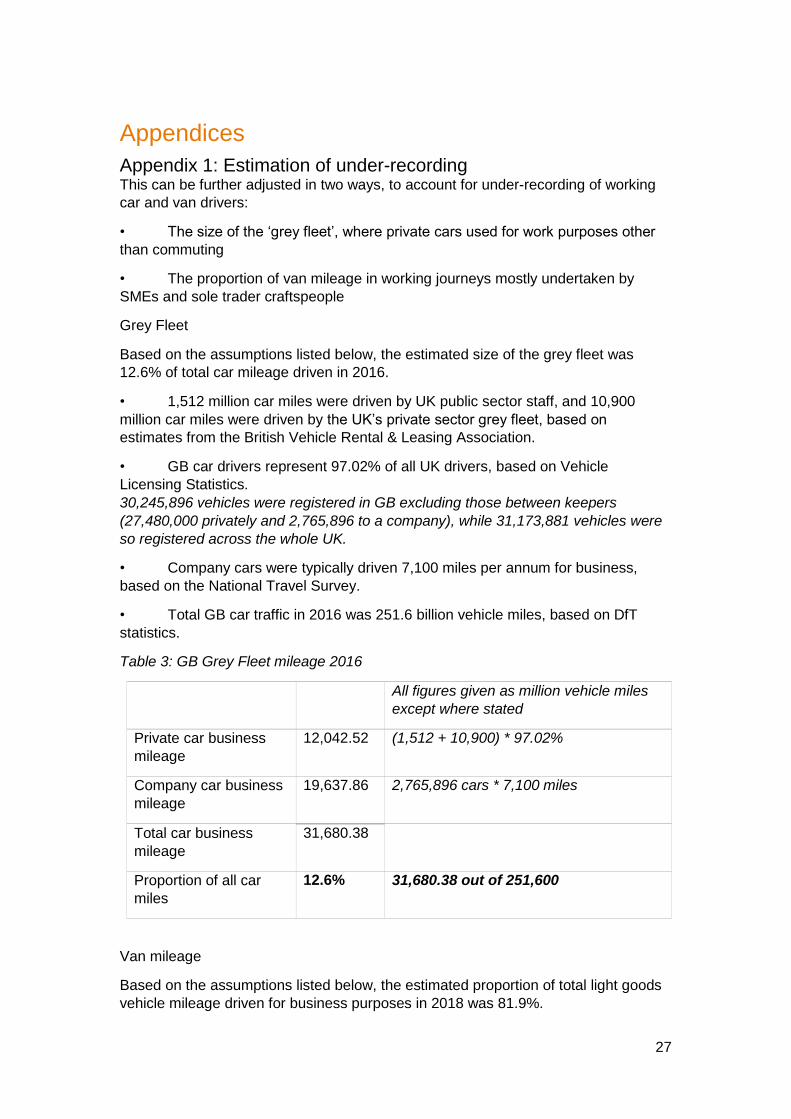
Appendix 1: Estimation of under-recording This can be further adjusted in two ways, to account for under-recording of working
car and van drivers:
• The size of the ‘grey fleet’, where private cars used for work purposes other
than commuting
• The proportion of van mileage in working journeys mostly undertaken by
SMEs and sole trader craftspeople
Grey Fleet
Based on the assumptions listed below, the estimated size of the grey fleet was
12.6% of total car mileage driven in 2016.
• 1,512 million car miles were driven by UK public sector staff, and 10,900
million car miles were driven by the UK’s private sector grey fleet, based on
estimates from the British Vehicle Rental & Leasing Association.
• GB car drivers represent 97.02% of all UK drivers, based on Vehicle
Licensing Statistics.
30,245,896 vehicles were registered in GB excluding those between keepers
(27,480,000 privately and 2,765,896 to a company), while 31,173,881 vehicles were
so registered across the whole UK.
• Company cars were typically driven 7,100 miles per annum for business,
based on the National Travel Survey.
• Total GB car traffic in 2016 was 251.6 billion vehicle miles, based on DfT
statistics.
Table 3: GB Grey Fleet mileage 2016
All figures given as million vehicle miles
except where stated
Private car business
mileage
12,042.52 (1,512 + 10,900) * 97.02%
Company car business
mileage
19,637.86 2,765,896 cars * 7,100 miles
Total car business
mileage
31,680.38
Proportion of all car
miles
12.6% 31,680.38 out of 251,600
Van mileage
Based on the assumptions listed below, the estimated proportion of total light goods
vehicle mileage driven for business purposes in 2018 was 81.9%.
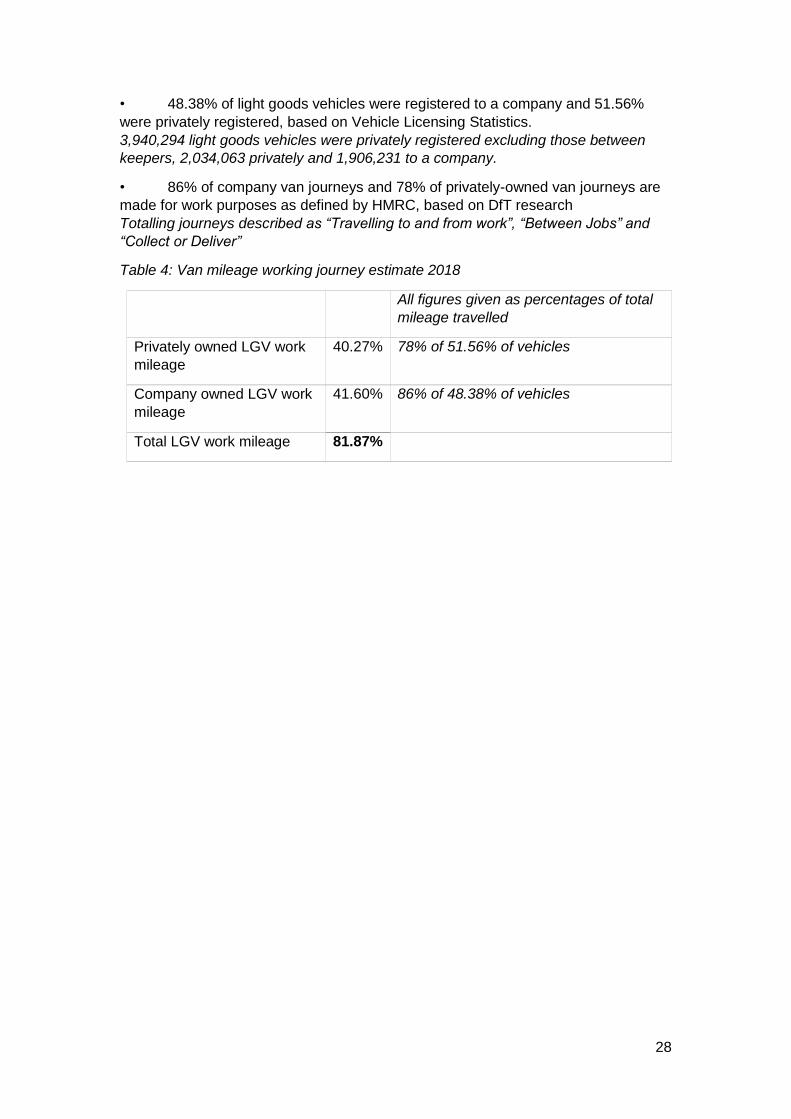
28
• 48.38% of light goods vehicles were registered to a company and 51.56%
were privately registered, based on Vehicle Licensing Statistics.
3,940,294 light goods vehicles were privately registered excluding those between
keepers, 2,034,063 privately and 1,906,231 to a company.
• 86% of company van journeys and 78% of privately-owned van journeys are
made for work purposes as defined by HMRC, based on DfT research
Totalling journeys described as “Travelling to and from work”, “Between Jobs” and
“Collect or Deliver”
Table 4: Van mileage working journey estimate 2018
All figures given as percentages of total
mileage travelled
Privately owned LGV work
mileage
40.27% 78% of 51.56% of vehicles
Company owned LGV work
mileage
41.60% 86% of 48.38% of vehicles
Total LGV work mileage 81.87%

29
Appendix 2: Topic guide
What do you feel are the current policy issues around the safety of people
who drive for work?
Who do you think is most at risk and why?
What data is helping you understand the size of the problem?
Where are the gaps?
What data would you need to fill the gaps?
(if a commissioner of research) Are you commissioning any
research to fill these gaps?
What activities are you currently undertaking to address occupational road
risk for grey fleet/gig workers?
Whose responsibility is it to raise awareness of the issues around managing
occupational road risk?
To what extent are the grey fleet and gig drivers a’ hard to reach’ group?
What are your views on having an indicator in the road safety statement on
driving for work?
What evidence do you have of effective interventions for managing
occupational road risk?
Whose responsibility is it to implement interventions?
What do you think is the role of the driver licensing system?
What are your views on a module on driving for work?
What do you think is the role of public information campaigns?
Who should be funding these?
What stakeholders are you consulting with to understand the risks associated
with driving for work?
What other stakeholders do you feel need to be engaged with?
What challenges are there in engaging with stakeholders?
What do you feel of the facilitators for addressing occupational road risk of
the grey fleet/gig workers?
What are the barriers?
Do you have anything else you would like to add?
Who else should we be speaking to?