Embed Size (px)
Citation preview
Driving Cost Reductions in Offshore Wind
THE LEANWIND PROJECT FINAL PUBLICATION
Co-funded by the Intelligent Energy Europe
Programme of the European Union
This project has received funding from the European Union’s Seventh Programme for research, technological development and demonstration under grant agreement No. 614020.

Driving Cost Reductions in Offshore Wind
THE LEANWIND PROJECT FINAL PUBLICATION
www.leanwind.eu

4
Driving Cost Reductions in Offshore WindThe LEANWIND Project Final Publication
EDITORS: Fiona Devoy McAuliffe (University College Cork);Jimmy Murphy (University College Cork);Katie Lynch (University College Cork);Cian Desmond (University College Cork);Jan Arthur Norbeck (SINTEF Ocean);Lars Magne Nonås (SINTEF Ocean);Yegenah Attari (Gavin and Doherty Geosolutions);Paul Doherty (Gavin and Doherty Geosolutions);John Dalsgaard Sorensen (Aalborg University);Jochen Giebhardt (Fraunhofer IWES);Carlos Lopez (PLOCAN);Silvia Hildebrandt (PLOCAN);Sabina Potestio (Wind Europe);Venkata Swarupanand Godavarthi (Lloyd’s Register).
CONTRIBUTORS:
LEANWIND consortium
5
Driving Cost Reductions in Offshore WindThe LEANWIND Project Final Publication
Project partners
COORDINATOR
LEGAL DISCLAIMERThe content of the publication herein is the sole responsibility of the authors and does not necessarily represent the views of the European Commission or its services.While the information contained in the documents is believed to be accurate, the authors(s) or any other participant in the LEANWIND consortium make no warranty of any kind with regard to this material including, but not limited to the implied warranties of merchantability and fitness for a particular purpose.Neither the LEANWIND Consortium nor any of its members, their officers, employees or agents shall be responsible or liable in negligence or otherwise howsoever in respect of any inaccuracy or omission herein.Without derogating from the generality of the foregoing neither the LEANWIND Consortium nor any of its members, their officers, employees or agents shall be liable for any direct or indirect or consequential loss or damage caused by or arising from any information advice or inaccuracy or omission herein.
PROJECT PARTICIPANTS

CO
NTE
NTS
ABBREVIATIONS ..................................................................................................................10
EXECUTIVE SUMMARY ....................................................................................................11
Project Summary .........................................................................................................11
Background and context ...........................................................................................11
LEANWIND objectives and methodology ..........................................................12
Results and Findings ...................................................................................................13
INTRODUCTION ....................................................................................................................15
1. INSTALLATION ....................................................................................................................16
1.1 Offshore Wind Installation - Chal-lenges and Solutions ...................16
1.2 Optimised support structures for construction, deployment and decommissioning activities ............................................................................17
1.2.1 Foundation Optimisation ............................................................................18
1.2.2 Concept Development & testing ...............................................................23
1.3 Installation vessels & lifting operations equipment .............................25
1.3.1 Industry challenges – Wind farm installation and maintenance vessels ......................................................................................................................25
1.3.2 Vessel concepts – design & evaluation ....................................................25
1.3.3 Installation vessel – final design ................................................................28
1.3.4 Lifting operations equipment ....................................................................29
1.3.5 Simulation of Installation activities ..........................................................29
2. OPERATION & MAINTENANCE .....................................................................................31
2.1 Offshore Wind O&M - Challenges & Solutions .......................................31
2.2 Operation and maintenance strategies ....................................................32
2.2.1 Strategy optimisation .................................................................................32
2.2.2 Reliability based design implications .....................................................36
2.2.3 Condition monitoring and remote presence .........................................38
2.2.4 O&M access ................................................................................................39
2.2.5 Case studies on integration of solutions .................................................41

CO
NTE
NTS
2.3 O&M vessel concept and access equipment ..........................................42
2.3.1 Industry challenges – Wind farm maintenance vessels ........................43
2.3.2 Vessel concept – design and evaluation .................................................43
2.3.3 O&M vessel – final design ..........................................................................43
2.3.4 Simulation of O&M activities ....................................................................44
3. LOGISTICS & SUPPLY-CHAIN .........................................................................................46
3.1 Offshore Wind Logistics Challenges and Solutions ............................46
3.1.1 Port selection & Layout ...............................................................................47
3.1.2 Prior to port .................................................................................................48
3.1.3 Port to site/Site to port ..............................................................................49
3.1.4 Holistic use of logistic models & potential end users ............................52
3.2 Financial cost model .........................................................................................52
3.2.1 Installation ....................................................................................................53
3.2.2 O&M ..............................................................................................................54
3.2.3 Decommissioning ........................................................................................56
3.2.4 Risk & Life-Cycle Analysis (LCA) assessment ........................................57
3.3 Integrated use of models & potential end-users .................................58
3.4 Application and recommendations .............................................................61
4. VIABILITY AND STRATEGY ROADMAP ....................................................................63
5. CONCLUSION .........................................................................................................................68

10 Driving Cost Reductions in Offshore WindThe LEANWIND Project Final Publication
ABBREVIATIONS
Artificial Neural Networks ANN
Capital Expenditure CAPEX
Condition Monitoring System CMS
Crew Transfer Vessel CTV
Dynamic Bayesian Networks DBN
Decommissioning costs DECEX
Dynamic Positioning DP
Decision Support Systems DSS
Engineering, Procurement and Construction EPC
Finite Element FE
Front End Engineering Design FEED
Foundation Transport and Installation Jack-up FTIJ
Failure Modes Effect Analysis FMEA
Failure Modes Effect and Criticality Analysis FMECA
Gravity Base Foundation GBF
Geographical Information System GIS
Graphical User Interface GUI
Heavy Lift Vessel HLV
Health and Safety H&S
Jack Up Vessel JUP
Life-Cycle Analysis LCA
Levelised Cost Of Energy LCOE
Lift on-lift off Lo-Lo
Nominal Power Classification NPC
OWF OWF
Offshore Wind Turbine OWT
Operation and Maintenance O&M
Service Operation Vessel SOV
Operational Expenditure OPEX
Reliability, Availability and Maintenance RAM
Research, Development and Planning RD&P
Roll on-roll off Ro-Ro
Self-propelled Installation Vessel SPIV
Self-propelled Modular Transporter SPMT
Support Vector Machine SVM
Turbine Installation Vessel TIV
Weather Down Turn WDT
Wind Turbine WT
Wind turbine Transport and Installation Jack-up WTIJ
Extra Large XL
11Driving Cost Reductions in Offshore WindThe LEANWIND Project Final Publication
PROJECT SUMMARY
LEANWIND was awarded to a consortium of 31 partici-pants (52% from industry) from 11 countries and is led by University College Cork, Ireland. The diverse team brings together experts from multiple sectors including oil and gas, maritime, shipping and offshore wind industries with representatives across the supply-chain including devel-opers, utilities, turbine suppliers, vessel owners, ship-building, classification societies, academics, and other industry representatives. The project received funding of almost €10million from the European Commission and has a total value of €14.8million. LEANWIND commenced in December 2013 and ran for 4 years.
BACKGROUND AND CONTEXTThe European Union has a long-term commitment to re-duce greenhouse gas emissions by 80-95% compared to 1990 levels by 2050. This has important implications for
1 BVG Associates and WindEurope, (2017). Unleashing Europe’s offshore wind potential: A new resource assessment. 2 EEA, (2009). Europe’s onshore and offshore wind energy potential.3 WindEurope, (2017). Wind energy today.
the current energy system. Wind power plays a crucial role in reaching the EU’s renewable goals. The offshore wind industry in Europe is, in fact, moving fast to a main-stream supplier of low-carbon electricity1. It has grown exponentially in recent years and is expected to cover up to 23% of EU’s electricity demand to 20302. Today, wind energy already meets 11% of the EU’s power demand, with high penetration levels in several countries (e.g. Denmark (42%), Spain (20%), Germany (13%) and UK (11%)). The wind energy sector represents over 300,000 jobs and generates €72 billion in annual turnover3. This unprecedented growth is due to an increased competi-tiveness of the sector due to several factors, such as the reduction in the cost of capital, industrial expansion and technological developments3.
The LEANWIND project began in December of 2013, at which time the Levelised Cost Of Energy (LCOE) for off-shore wind energy was €140/MWh. Over the lifetime of the project, this cost has plummeted, surpassing 2020 targets of €100/MWh. Vattenfall’s offshore wind price bid of €49.9/MWh in 2016 for the Kriegers Flak project set a
EXECUTIVE SUMMARY
12
Executive Summary
Driving Cost Reductions in Offshore WindThe LEANWIND Project Final Publication
record LCOE forecast of €40/MWh4. While LEANWIND is not responsible for the massive shift in energy cost expec-tations, innovations, novel design and LEAN construction have played a massive role in the quest for subsidy free offshore wind energy. This report outlines many of the ar-eas in which cost reductions have been promoted and im-plemented throughout the life-cycle of an Offshore Wind Farm (OWF). It also presents the research undertaken by the project to address future industry challenges.
There is still work to be done to actually achieve and maintain the expected cost reductions and ensure the cost-competitiveness of offshore wind in the energy sec-tor. The anticipated fall in LCOE has and will increase price competition as developers are under pressure to match these forecasts. New markets in East Asia and North America still need to achieve these targets using the les-sons learned by the existing industry. In addition, chal-lenges are presented by future sites located further from shore, in harsher conditions and deeper waters. Larger turbines and projects also mean larger equipment re-quirements and new logistics and maintenance issues. It is expected that LEANWIND results will contribute similar optimisation for future farms and, alongside applied re-search in years to come, guarantee the future of offshore wind within our energy mix.
LEANWIND OBJECTIVES AND METHODOLOGYThe primary LEANWIND objective is to provide cost re-ductions across the OWF life-cycle and supply-chain through the application of lean principles and the devel-opment of state of the art technologies and tools. “Lean thinking” is the dynamic, knowledge driven, and end-us-er focused process through which people in a defined enterprise continuously eliminate wasteful stages and streamline processes with the goal of creating value5. Key principles include:
4 WindEnergyUpdate, (2016). Europe’s new record offshore LCOE forecast at 40 euros/MWh. Retrieved July 28, 2017, from http://newen-ergyupdate.com/wind-energy-update/europes-new-record-offshore-lcoe-forecast-40-eurosmwh
5 Shili Sun, (2011). The Strategic Role of Lean Production in SOE’s Development. International Journal of Business and Management, Vol. 6, No. 2; February 2011, p 160.
1. Identify what the customer needs
2. Track, reduce or eliminate wasteful stages in and between processes
3. Seek continuous improvement
4. Approach improvements from a whole system perspective
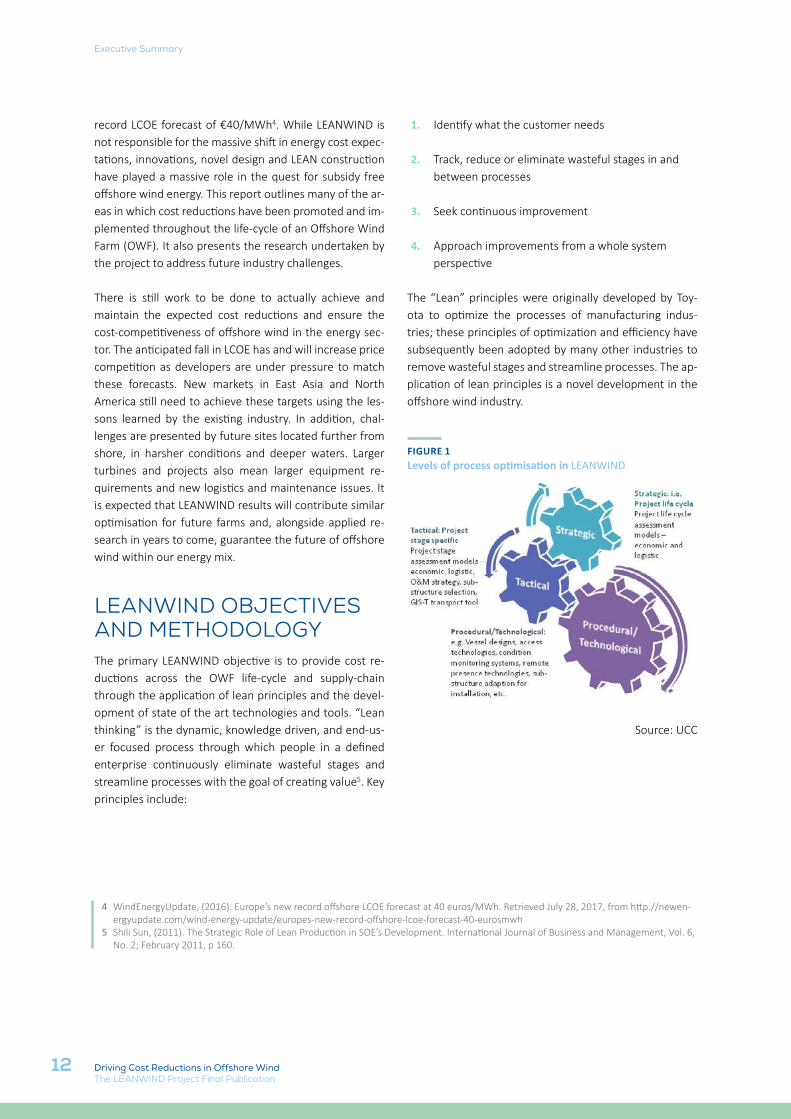
The “Lean” principles were originally developed by Toy-ota to optimize the processes of manufacturing indus-tries; these principles of optimization and efficiency have subsequently been adopted by many other industries to remove wasteful stages and streamline processes. The ap-plication of lean principles is a novel development in the offshore wind industry.
FIGURE 1 Levels of process optimisation in LEANWIND
Source: UCC
13
Executive Summary
Driving Cost Reductions in Offshore WindThe LEANWIND Project Final Publication
Taking a whole system perspective, the lean paradigm is applied in LEANWIND to each of the critical project stages from Installation, Operation and Maintenance (O&M) to Decommissioning, supporting efficient holistic strategies for the development of an OWF. As illustrated in Figure 1, efficiencies have been sought at 3 levels to consider the needs of different industry stakeholders: 1) strategic pro-ject planning and management level, 2) tactical project operations level and 3) specific technological or procedur-al level.
LEANWIND specifically addresses the logistical challeng-es of deploying, installing and operating large scale wind turbines (WT) (in the range 5-10MW) in transitional water depths using fixed foundations as well as floating struc-tures more relevant to longer term wind farm prospects. The transport, logistical and maintenance operations associated with these structures are addressed through novel approaches to vessel design, vessel management, sub-structure alterations and O&M strategies in order to reduce both the CAPEX and OPEX cost. The innovations have been rigorously tested and validated where possible and assessed for their cost benefit to industry. The project has also evaluated the applicability of the innovations to industry in order to facilitate market uptake of developed innovations and ensure there are immediate cost reduc-tions seen by industry, thereby contributing to the com-petitiveness of the sector and to the creation of new jobs.
RESULTS AND FINDINGS
The following are some key results and impacts of the LEANWIND project :
• Supplied comprehensive analysis of the industry challenges, facilitating effective development of relevant solutions;
• Designed novel adaptations for fixed and floating substructures and a substructure selection framework to minimise costs and installation time;
• Streamlined the deployment and installation of large-scale turbines and both fixed and floating substructures with improved installation processes e.g. optimising vessel deck usage and developing efficient processes for turbine erection
and technology that facilitates quicker and/or safer loading, transport or ballasting operations for substructures;
• Developed a holistic supply-chain logistics model to optimise scenarios, increasing efficiency and reducing bottlenecks. This includes individual modules applicable to port logistics, transport, vessel chartering etc.; a Geographical Information System (GIS) transport model; and a decision-making model for port layout/configuration to improve planning of on-land logistics;
• Constructed a full life-cycle financial model considering CAPEX and installation, OPEX, decommissioning, risk and life-cycle assessment;
• Developed a range of models and provided recommendations for optimised O&M strategies for representative existing and planned farms, which will help reduce costs and improve efficiency. This includes a strategic decision-support tool; a dynamic-scheduling model; and a risk-based framework model;
• Assessed Reliability, Availability and Maintenance (RAM) methodologies, existing software tools and suitable modelling approaches to identify WT’s critical components and develop selected failure/degradation models to provide input to the O&M tools, facilitating strategy optimisation and the cost-time benefits of reliability-centred maintenance.
• Fabricated and tested a remote presence device and Condition Monitoring Software (CMS) to reduce the need for human intervention and maintenance costs;
• Delivered purpose-built installation and servicing vessel concepts, meeting the increased demand;
• undertook tank and field testing activities to validate and assess the benefits of selected project innovations and procedures e.g. remote presence device, gravity based substructure, floating substructure and offshore operations;
• developed and showcased vessel simulation technologies to assess novel design concepts and
14
Executive Summary
Driving Cost Reductions in Offshore WindThe LEANWIND Project Final Publication
replicate deployment and O&M activities, mitigating the risks associated with new strategies;
• identified industry specific safety and training procedures for installation and O&M;
• assessed business models at European level for large offshore systems to encourage existing and new sources of investment;
• evaluated the benefits of optimised procedures and technical solutions with a combined financial and logistics OWF model, resulting in recommendations for wind farm development;
• assessed the non-technical positive and adverse impacts of project innovations from environmental, societal and economic perspectives;
• provided recommendations for future growth and development in the business and policy landscape to adequately support the industry.
As the above illustrates, the project has successfully pro-vided a large range of novel solutions that can improve ex-isting practices and set standards in order to help industry meet their LCOE aspirations and maintain cost reductions as the industry develops. The full report presents the key outputs of the LEANWIND project including procedures, tools and technologies developed.

15Driving Cost Reductions in Offshore WindThe LEANWIND Project Final Publication
The report is broken up into 4 main Sections. The first two Sections cover the innovative technologies, procedures etc. to provide cost reductions at the key phases of Instal-lation and Operation and Maintenance (O&M).
Section 3 describes the logistics and financial models developed to assess and optimise Offshore Wind Farm (OWF) scenarios across the supply-chain as well as evalu-ate the innovations developed in the project.
Section 4 reviews the results considering the market po-tential of the technical innovations, addresses non-tech-nical impacts (e.g. environmental), and provides recom-mendations (e.g. regulations and business models) to support the uptake of results and to inform policy as the industry grows in maturity and scale.
The conclusion summarises the content of this report and project results as a whole, addressing how LEANWIND has and will drive cost-reductions for offshore wind.
INTRODUCTION
16 Driving Cost Reductions in Offshore WindThe LEANWIND Project Final Publication
1.
1.1 OFFSHORE WIND INSTALLATION - CHAL-LENGES AND SOLUTIONS The development of wind farms further offshore in deeper water requires advances in both turbine foun-dation technology and the vessels required to construct and service these wind farms. Farms far from shore are subject to harsher met-ocean conditions with fewer fa-vourable weather windows that further limit the oper-ability of vessels. Grid connections and electrical infra-structure are also costlier. These factors can considerably increase the cost of offshore wind projects with regard to foundation solutions, transportation, deployment and ultimately decommissioning.
Optimised foundations and novel designs need to be de-veloped along with transportation methods, transport and installation vessels, installation procedures and decom-missioning strategies, in order to reach and maintain the expected reductions in LCOE. Some of the main challenges involved in the design of OWFs are summarised below:• adapted and novel foundation designs are needed for
larger turbines and deeper waters;• novel vessels are required to transport bigger
turbines and foundations;
• vessels with higher lifting capacity and reach are required for installation;
• lifting gears need to be adapted based on the requirements of novel foundation sizes;
• port infrastructure needs to be upgraded based on novel foundation and vessel requirements;
• stricter transport restrictions are imposed on-land;• possible installation fleet shift;• harsher environment and sites further from
shore mean fewer weather windows for working offshore. This requires more careful planning of staff transportation.
Considering the challenges associated with the new generation of OWFs, LEANWIND aimed to improve the overall costs of developing an OWF by optimising sub-structure concepts including design and material con-sumption as well as transportation strategies and design modifications to reduce installation time. In addition, the project developed concepts for deep water to meet future industry needs. This chapter summarises how LEANWIND project innovations (in terms of substruc-ture design, manufacturing, installation, transportation and deployment), identify and contribute to the cost savings of future wind farm developments.
INSTALLATION
17
Installation
Driving Cost Reductions in Offshore WindThe LEANWIND Project Final Publication
1.2 OPTIMISED SUPPORT STRUCTURES FOR CON-STRUCTION, DEPLOYMENT AND DECOMMISSIONING ACTIVITIES The LEANWIND project identified relevant substruc-ture concepts and associated fabrication methods and installation strategies that offer the highest potential for cost reductions across the wind energy sector over the next 10 years. This included both fixed and floating substructure types that were felt to offer potential for value engineering.
For fixed foundations, the technical work was broken down into gravity based concepts and steel structures, which were investigated independently using a variety of numerical tools, combined with some physical model testing. Gravity based concepts were considered from a generic standpoint to determine the relative merits of buoyant structures that can initially be floated into posi-tion before ballasting versus the more conventional struc-tures installed using heavy lift vessels. This study included conceptual engineering, detailed analysis, supply-chain studies and economic modelling. The study on steel struc-tures investigated innovations for both jacket structures and extra large (XL) monopiles to determine how the de-sign, construction and deployment can be achieved in a more efficient and “leaner” manner. The outcome of this
work was to identify key technical modifications that ena-ble cost reductions.
For floating concepts, it was recognised that the associat-ed installation strategies (including the turbine erection) were not as technologically mature; therefore the initial aspect of this work was a study to identify the concepts that are closest to coming to market. This preliminary in-vestigation then allowed innovations to be applied to one specific form of floating solution, either a Tension Leg Plat-form, Semi-submersible or Spar concept.
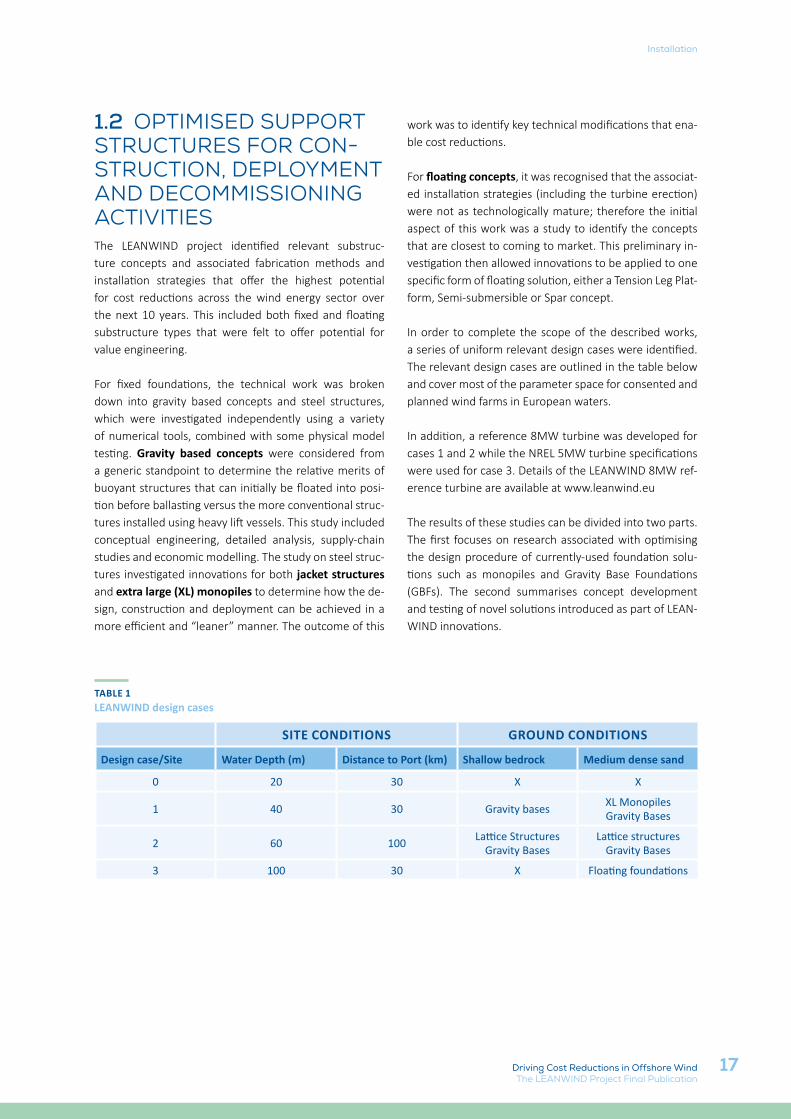
In order to complete the scope of the described works, a series of uniform relevant design cases were identified. The relevant design cases are outlined in the table below and cover most of the parameter space for consented and planned wind farms in European waters.
In addition, a reference 8MW turbine was developed for cases 1 and 2 while the NREL 5MW turbine specifications were used for case 3. Details of the LEANWIND 8MW ref-erence turbine are available at www.leanwind.eu
The results of these studies can be divided into two parts. The first focuses on research associated with optimising the design procedure of currently-used foundation solu-tions such as monopiles and Gravity Base Foundations (GBFs). The second summarises concept development and testing of novel solutions introduced as part of LEAN-WIND innovations.
TABLE 1LEANWIND design cases
SITE CONDITIONS GROUND CONDITIONS
Design case/Site Water Depth (m) Distance to Port (km) Shallow bedrock Medium dense sand
0 20 30 X X
1 40 30 Gravity basesXL MonopilesGravity Bases
2 60 100Lattice Structures
Gravity BasesLattice structures
Gravity Bases
3 100 30 X Floating foundations
18
Installation
Driving Cost Reductions in Offshore WindThe LEANWIND Project Final Publication
1.2.1 FOUNDATION OPTIMISATION
XL MONOPILES
Monopiles are generally large-diameter steel tubes driven or drilled into the soil that transfer axial and lateral load to the stronger subsoil to support the WT. Monopiles are by far the most common foundation type in the offshore in-dustry and are likely to remain the most preferred option in the future6. Simple and routine design procedures as well as relatively quick installation procedures make them a suitable choice for most OWFs under development. The popularity of monopiles in offshore construction is diminishing as more wind farms are planned further off-shore and in sites with deeper water; however, the new generation of monopiles with increased diameters (up to 10 mm) could make them more suitable for deployment in deeper waters.
6 Doherty, P., & K. Gavin, (2012). Laterally loaded monopile design for OWFs. Proceedings of the Institution of Civil Engineers - Energy, 165(1), 7–17.
7 4C Offshore, (2017). Gemini Wind Farm. Available at http://www.4coffshore.com/windfarms/gemini-netherlands-nl18.html
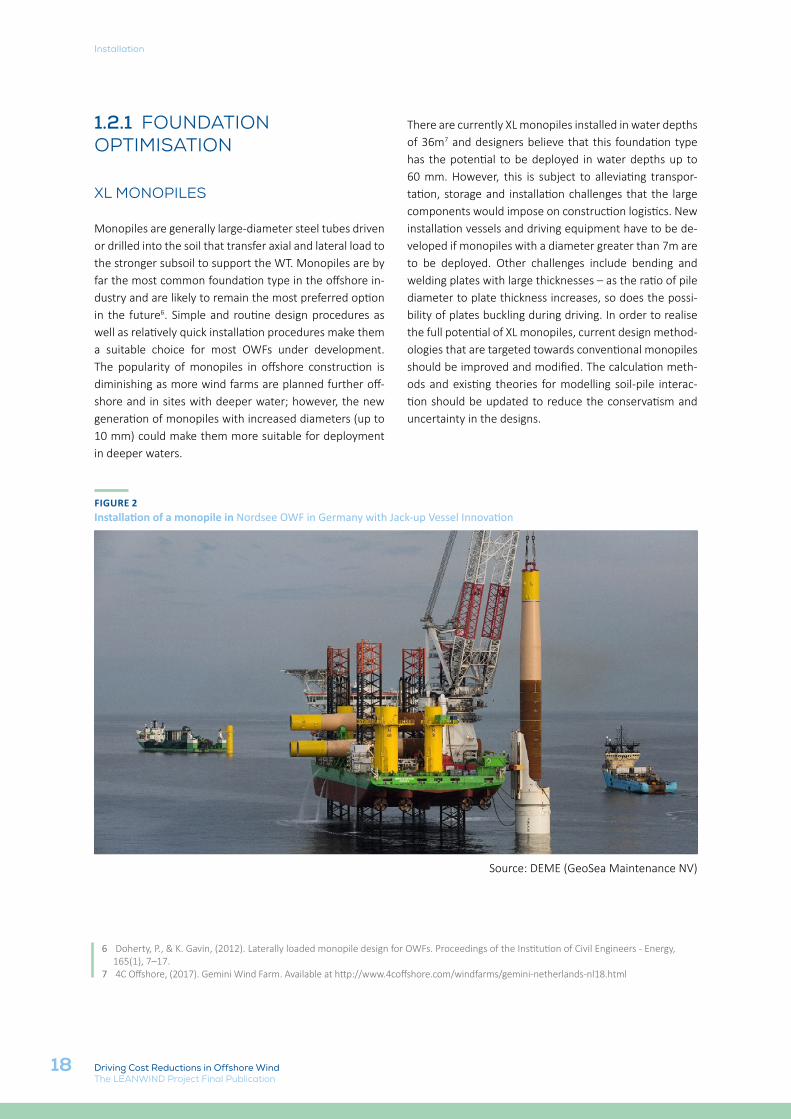
There are currently XL monopiles installed in water depths of 36m7 and designers believe that this foundation type has the potential to be deployed in water depths up to 60 mm. However, this is subject to alleviating transpor-tation, storage and installation challenges that the large components would impose on construction logistics. New installation vessels and driving equipment have to be de-veloped if monopiles with a diameter greater than 7m are to be deployed. Other challenges include bending and welding plates with large thicknesses – as the ratio of pile diameter to plate thickness increases, so does the possi-bility of plates buckling during driving. In order to realise the full potential of XL monopiles, current design method-ologies that are targeted towards conventional monopiles should be improved and modified. The calculation meth-ods and existing theories for modelling soil-pile interac-tion should be updated to reduce the conservatism and uncertainty in the designs.
FIGURE 2Installation of a monopile in Nordsee OWF in Germany with Jack-up Vessel Innovation
Source: DEME (GeoSea Maintenance NV)
19
Installation
Driving Cost Reductions in Offshore WindThe LEANWIND Project Final Publication
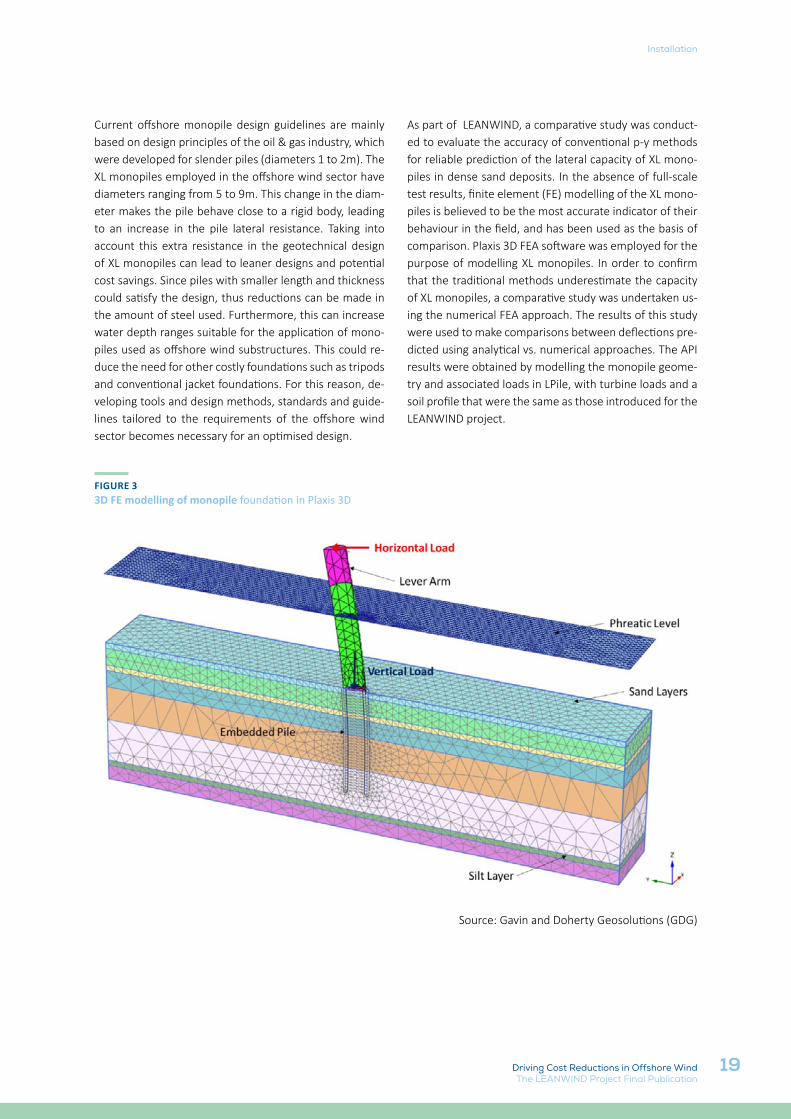
Current offshore monopile design guidelines are mainly based on design principles of the oil & gas industry, which were developed for slender piles (diameters 1 to 2m). The XL monopiles employed in the offshore wind sector have diameters ranging from 5 to 9m. This change in the diam-eter makes the pile behave close to a rigid body, leading to an increase in the pile lateral resistance. Taking into account this extra resistance in the geotechnical design of XL monopiles can lead to leaner designs and potential cost savings. Since piles with smaller length and thickness could satisfy the design, thus reductions can be made in the amount of steel used. Furthermore, this can increase water depth ranges suitable for the application of mono-piles used as offshore wind substructures. This could re-duce the need for other costly foundations such as tripods and conventional jacket foundations. For this reason, de-veloping tools and design methods, standards and guide-lines tailored to the requirements of the offshore wind sector becomes necessary for an optimised design.
As part of LEANWIND, a comparative study was conduct-ed to evaluate the accuracy of conventional p-y methods for reliable prediction of the lateral capacity of XL mono-piles in dense sand deposits. In the absence of full-scale test results, finite element (FE) modelling of the XL mono-piles is believed to be the most accurate indicator of their behaviour in the field, and has been used as the basis of comparison. Plaxis 3D FEA software was employed for the purpose of modelling XL monopiles. In order to confirm that the traditional methods underestimate the capacity of XL monopiles, a comparative study was undertaken us-ing the numerical FEA approach. The results of this study were used to make comparisons between deflections pre-dicted using analytical vs. numerical approaches. The API results were obtained by modelling the monopile geome-try and associated loads in LPile, with turbine loads and a soil profile that were the same as those introduced for the LEANWIND project.
FIGURE 33D FE modelling of monopile foundation in Plaxis 3D
Source: Gavin and Doherty Geosolutions (GDG)
20
Installation
Driving Cost Reductions in Offshore WindThe LEANWIND Project Final Publication
The results of this study showed the API method results in larger deflections compared to the Plaxis approach. It shall also be noted that as the pile size increases, the dif-ference in deflection prediction becomes larger. This con-firms that application of the numerical models (instead of the conventional API analytical approach) results in more economical designs in large diameter monopiles and that cost saving benefits become more significant as the pile diameter increases.
GBFS
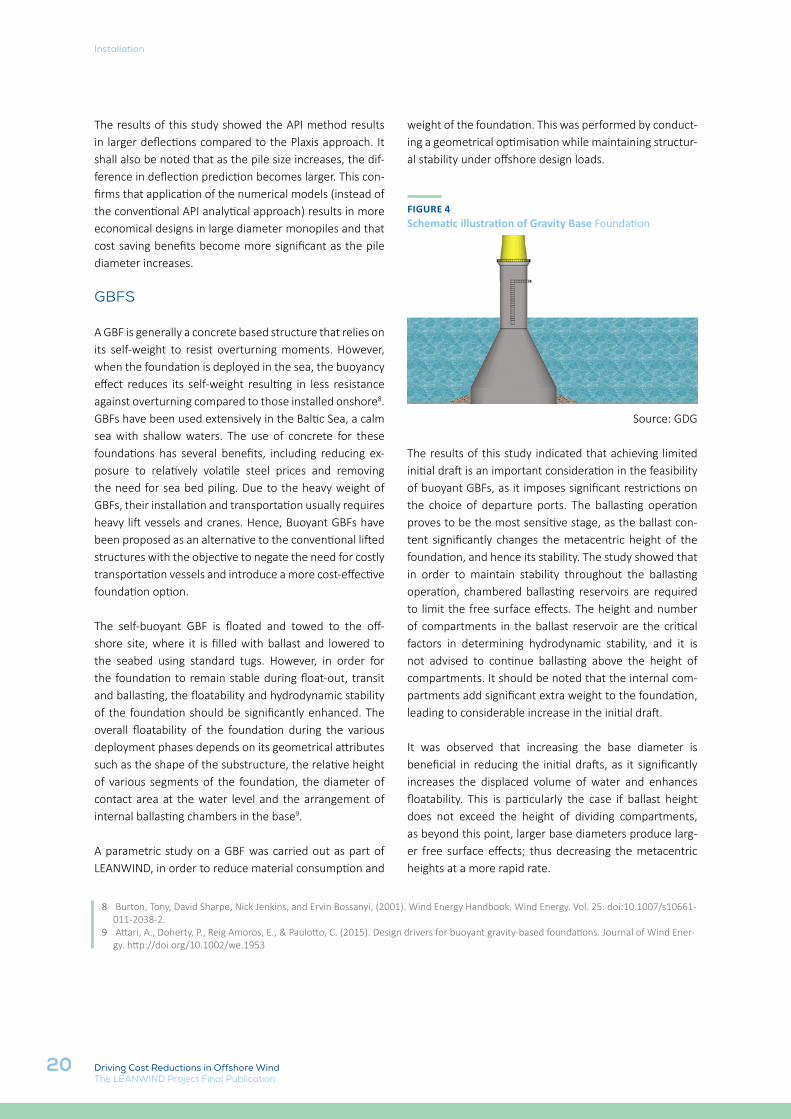
A GBF is generally a concrete based structure that relies on its self-weight to resist overturning moments. However, when the foundation is deployed in the sea, the buoyancy effect reduces its self-weight resulting in less resistance against overturning compared to those installed onshore8. GBFs have been used extensively in the Baltic Sea, a calm sea with shallow waters. The use of concrete for these foundations has several benefits, including reducing ex-posure to relatively volatile steel prices and removing the need for sea bed piling. Due to the heavy weight of GBFs, their installation and transportation usually requires heavy lift vessels and cranes. Hence, Buoyant GBFs have been proposed as an alternative to the conventional lifted structures with the objective to negate the need for costly transportation vessels and introduce a more cost-effective foundation option.
The self-buoyant GBF is floated and towed to the off-shore site, where it is filled with ballast and lowered to the seabed using standard tugs. However, in order for the foundation to remain stable during float-out, transit and ballasting, the floatability and hydrodynamic stability of the foundation should be significantly enhanced. The overall floatability of the foundation during the various deployment phases depends on its geometrical attributes such as the shape of the substructure, the relative height of various segments of the foundation, the diameter of contact area at the water level and the arrangement of internal ballasting chambers in the base9.
A parametric study on a GBF was carried out as part of LEANWIND, in order to reduce material consumption and
8 Burton, Tony, David Sharpe, Nick Jenkins, and Ervin Bossanyi, (2001). Wind Energy Handbook. Wind Energy. Vol. 25. doi:10.1007/s10661-011-2038-2.
9 Attari, A., Doherty, P., Reig Amoros, E., & Paulotto, C. (2015). Design drivers for buoyant gravity-based foundations. Journal of Wind Ener-gy. http://doi.org/10.1002/we.1953
weight of the foundation. This was performed by conduct-ing a geometrical optimisation while maintaining structur-al stability under offshore design loads.
FIGURE 4 Schematic illustration of Gravity Base Foundation
Source: GDG
The results of this study indicated that achieving limited initial draft is an important consideration in the feasibility of buoyant GBFs, as it imposes significant restrictions on the choice of departure ports. The ballasting operation proves to be the most sensitive stage, as the ballast con-tent significantly changes the metacentric height of the foundation, and hence its stability. The study showed that in order to maintain stability throughout the ballasting operation, chambered ballasting reservoirs are required to limit the free surface effects. The height and number of compartments in the ballast reservoir are the critical factors in determining hydrodynamic stability, and it is not advised to continue ballasting above the height of compartments. It should be noted that the internal com-partments add significant extra weight to the foundation, leading to considerable increase in the initial draft.
It was observed that increasing the base diameter is beneficial in reducing the initial drafts, as it significantly increases the displaced volume of water and enhances floatability. This is particularly the case if ballast height does not exceed the height of dividing compartments, as beyond this point, larger base diameters produce larg-er free surface effects; thus decreasing the metacentric heights at a more rapid rate.
21
Installation
Driving Cost Reductions in Offshore WindThe LEANWIND Project Final Publication
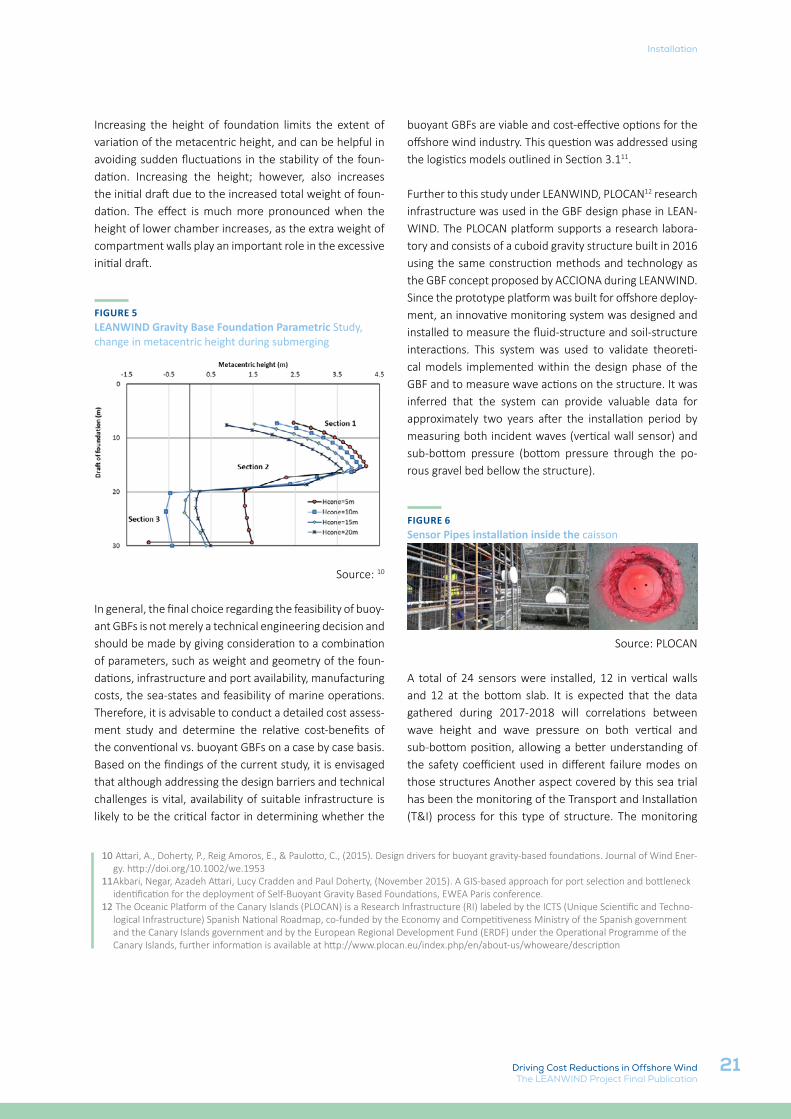
Increasing the height of foundation limits the extent of variation of the metacentric height, and can be helpful in avoiding sudden fluctuations in the stability of the foun-dation. Increasing the height; however, also increases the initial draft due to the increased total weight of foun-dation. The effect is much more pronounced when the height of lower chamber increases, as the extra weight of compartment walls play an important role in the excessive initial draft.
FIGURE 5LEANWIND Gravity Base Foundation Parametric Study, change in metacentric height during submerging
Source: 10
In general, the final choice regarding the feasibility of buoy-ant GBFs is not merely a technical engineering decision and should be made by giving consideration to a combination of parameters, such as weight and geometry of the foun-dations, infrastructure and port availability, manufacturing costs, the sea-states and feasibility of marine operations. Therefore, it is advisable to conduct a detailed cost assess-ment study and determine the relative cost-benefits of the conventional vs. buoyant GBFs on a case by case basis. Based on the findings of the current study, it is envisaged that although addressing the design barriers and technical challenges is vital, availability of suitable infrastructure is likely to be the critical factor in determining whether the
10 Attari, A., Doherty, P., Reig Amoros, E., & Paulotto, C., (2015). Design drivers for buoyant gravity-based foundations. Journal of Wind Ener-gy. http://doi.org/10.1002/we.1953
11 Akbari, Negar, Azadeh Attari, Lucy Cradden and Paul Doherty, (November 2015). A GIS-based approach for port selection and bottleneck identification for the deployment of Self-Buoyant Gravity Based Foundations, EWEA Paris conference.
12 The Oceanic Platform of the Canary Islands (PLOCAN) is a Research Infrastructure (RI) labeled by the ICTS (Unique Scientific and Techno-logical Infrastructure) Spanish National Roadmap, co-funded by the Economy and Competitiveness Ministry of the Spanish government and the Canary Islands government and by the European Regional Development Fund (ERDF) under the Operational Programme of the Canary Islands, further information is available at http://www.plocan.eu/index.php/en/about-us/whoweare/description
buoyant GBFs are viable and cost-effective options for the offshore wind industry. This question was addressed using the logistics models outlined in Section 3.111.
Further to this study under LEANWIND, PLOCAN12 research infrastructure was used in the GBF design phase in LEAN-WIND. The PLOCAN platform supports a research labora-tory and consists of a cuboid gravity structure built in 2016 using the same construction methods and technology as the GBF concept proposed by ACCIONA during LEANWIND. Since the prototype platform was built for offshore deploy-ment, an innovative monitoring system was designed and installed to measure the fluid-structure and soil-structure interactions. This system was used to validate theoreti-cal models implemented within the design phase of the GBF and to measure wave actions on the structure. It was inferred that the system can provide valuable data for approximately two years after the installation period by measuring both incident waves (vertical wall sensor) and sub-bottom pressure (bottom pressure through the po-rous gravel bed bellow the structure).
FIGURE 6Sensor Pipes installation inside the caisson
Source: PLOCAN
A total of 24 sensors were installed, 12 in vertical walls and 12 at the bottom slab. It is expected that the data gathered during 2017-2018 will correlations between wave height and wave pressure on both vertical and sub-bottom position, allowing a better understanding of the safety coefficient used in different failure modes on those structures Another aspect covered by this sea trial has been the monitoring of the Transport and Installation (T&I) process for this type of structure. The monitoring
22
Installation
Driving Cost Reductions in Offshore WindThe LEANWIND Project Final Publication
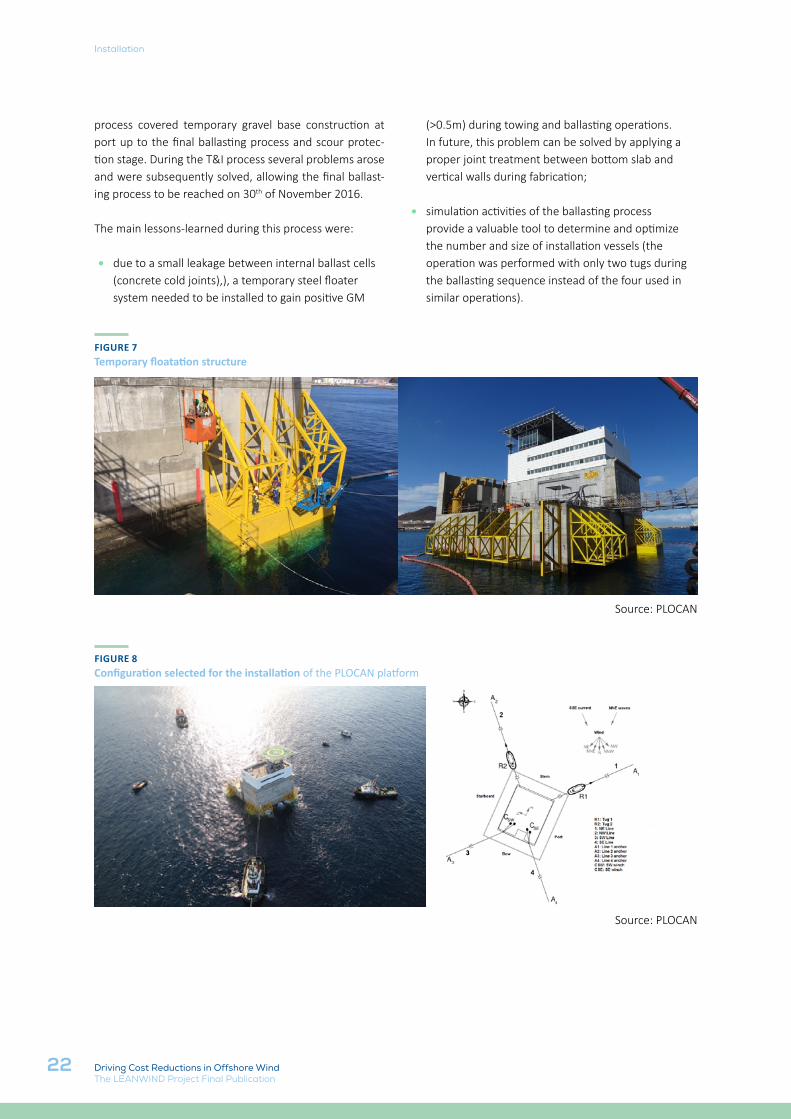
process covered temporary gravel base construction at port up to the final ballasting process and scour protec-tion stage. During the T&I process several problems arose and were subsequently solved, allowing the final ballast-ing process to be reached on 30th of November 2016.
The main lessons-learned during this process were:
• due to a small leakage between internal ballast cells (concrete cold joints),), a temporary steel floater system needed to be installed to gain positive GM
(>0.5m) during towing and ballasting operations. In future, this problem can be solved by applying a proper joint treatment between bottom slab and vertical walls during fabrication;
• simulation activities of the ballasting process provide a valuable tool to determine and optimize the number and size of installation vessels (the operation was performed with only two tugs during the ballasting sequence instead of the four used in similar operations).
FIGURE 7Temporary floatation structure
Source: PLOCAN
FIGURE 8Configuration selected for the installation of the PLOCAN platform
Source: PLOCAN
23
Installation
Driving Cost Reductions in Offshore WindThe LEANWIND Project Final Publication
1.2.2 CONCEPT DEVELOPMENT & TESTING
FLOATING JACKETS
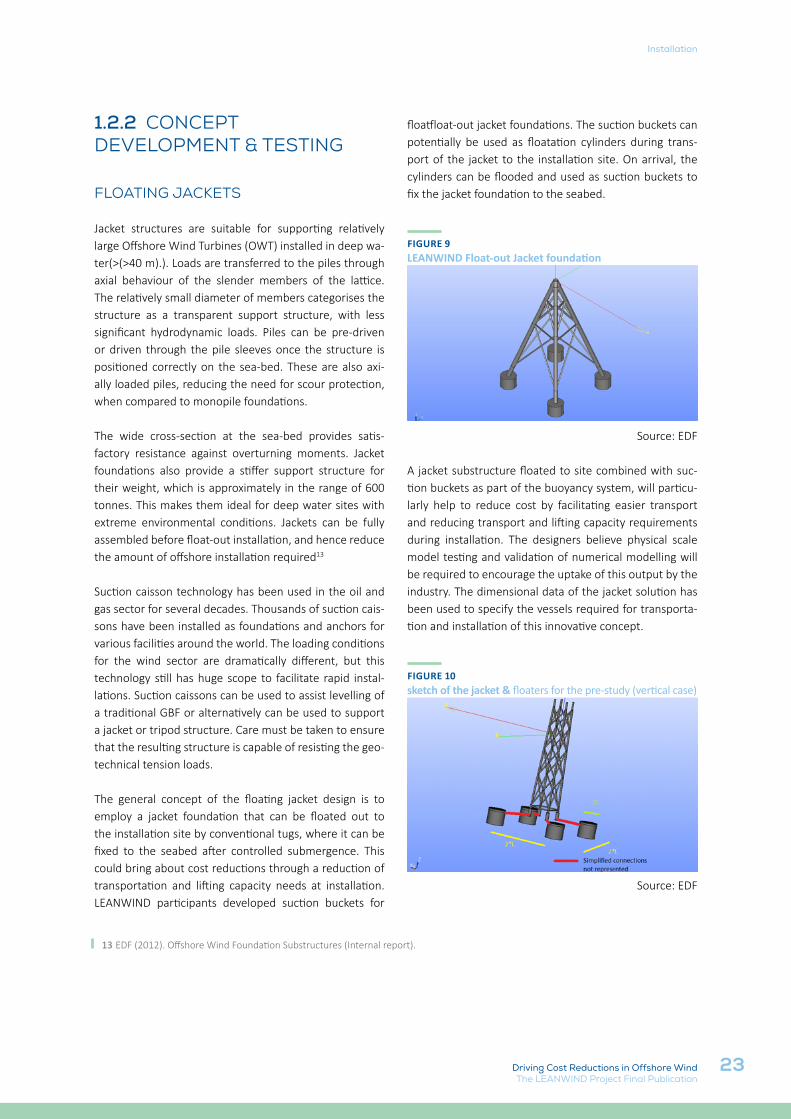
Jacket structures are suitable for supporting relatively large Offshore Wind Turbines (OWT) installed in deep wa-ter(>(>40 m).). Loads are transferred to the piles through axial behaviour of the slender members of the lattice. The relatively small diameter of members categorises the structure as a transparent support structure, with less significant hydrodynamic loads. Piles can be pre-driven or driven through the pile sleeves once the structure is positioned correctly on the sea-bed. These are also axi-ally loaded piles, reducing the need for scour protection, when compared to monopile foundations.
The wide cross-section at the sea-bed provides satis-factory resistance against overturning moments. Jacket foundations also provide a stiffer support structure for their weight, which is approximately in the range of 600 tonnes. This makes them ideal for deep water sites with extreme environmental conditions. Jackets can be fully assembled before float-out installation, and hence reduce the amount of offshore installation required13
Suction caisson technology has been used in the oil and gas sector for several decades. Thousands of suction cais-sons have been installed as foundations and anchors for various facilities around the world. The loading conditions for the wind sector are dramatically different, but this technology still has huge scope to facilitate rapid instal-lations. Suction caissons can be used to assist levelling of a traditional GBF or alternatively can be used to support a jacket or tripod structure. Care must be taken to ensure that the resulting structure is capable of resisting the geo-technical tension loads.
The general concept of the floating jacket design is to employ a jacket foundation that can be floated out to the installation site by conventional tugs, where it can be fixed to the seabed after controlled submergence. This could bring about cost reductions through a reduction of transportation and lifting capacity needs at installation. LEANWIND participants developed suction buckets for
13 EDF (2012). Offshore Wind Foundation Substructures (Internal report).
floatfloat-out jacket foundations. The suction buckets can potentially be used as floatation cylinders during trans-port of the jacket to the installation site. On arrival, the cylinders can be flooded and used as suction buckets to fix the jacket foundation to the seabed.
FIGURE 9 LEANWIND Float-out Jacket foundation
Source: EDF
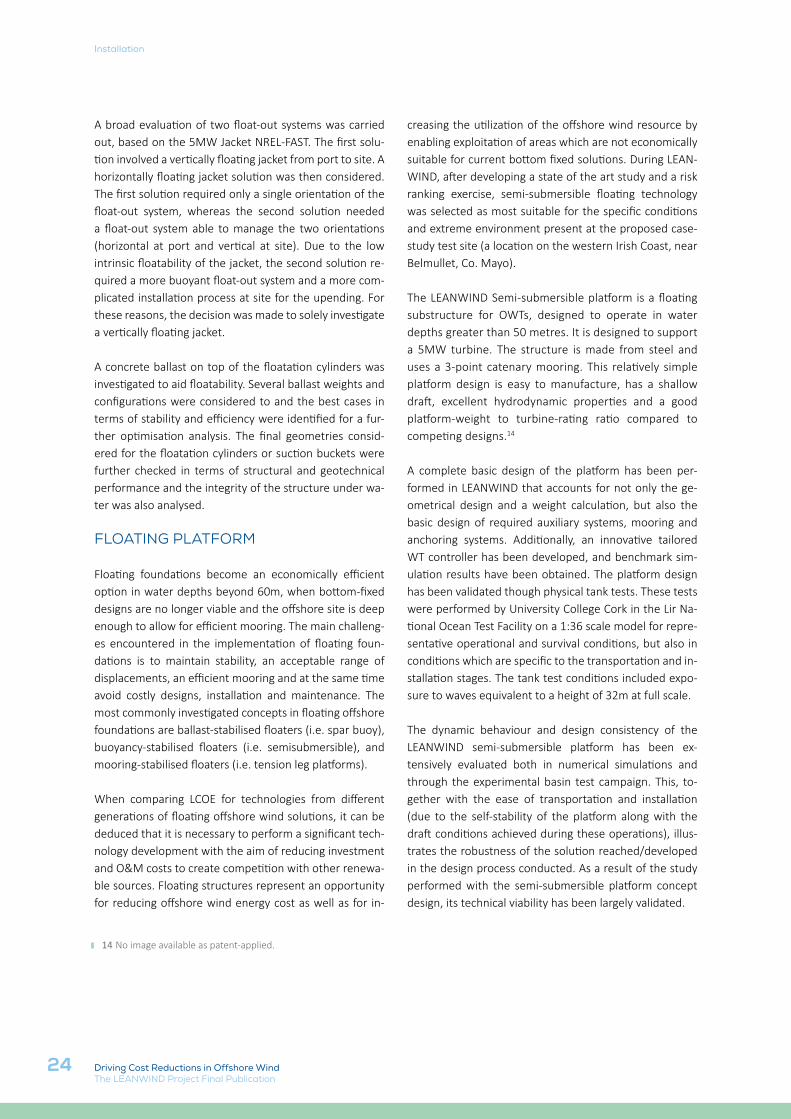
A jacket substructure floated to site combined with suc-tion buckets as part of the buoyancy system, will particu-larly help to reduce cost by facilitating easier transport and reducing transport and lifting capacity requirements during installation. The designers believe physical scale model testing and validation of numerical modelling will be required to encourage the uptake of this output by the industry. The dimensional data of the jacket solution has been used to specify the vessels required for transporta-tion and installation of this innovative concept.
FIGURE 10sketch of the jacket & floaters for the pre-study (vertical case)
Source: EDF
24
Installation
Driving Cost Reductions in Offshore WindThe LEANWIND Project Final Publication
A broad evaluation of two float-out systems was carried out, based on the 5MW Jacket NREL-FAST. The first solu-tion involved a vertically floating jacket from port to site. A horizontally floating jacket solution was then considered. The first solution required only a single orientation of the float-out system, whereas the second solution needed a float-out system able to manage the two orientations (horizontal at port and vertical at site). Due to the low intrinsic floatability of the jacket, the second solution re-quired a more buoyant float-out system and a more com-plicated installation process at site for the upending. For these reasons, the decision was made to solely investigate a vertically floating jacket.
A concrete ballast on top of the floatation cylinders was investigated to aid floatability. Several ballast weights and configurations were considered to and the best cases in terms of stability and efficiency were identified for a fur-ther optimisation analysis. The final geometries consid-ered for the floatation cylinders or suction buckets were further checked in terms of structural and geotechnical performance and the integrity of the structure under wa-ter was also analysed.
FLOATING PLATFORM
Floating foundations become an economically efficient option in water depths beyond 60m, when bottom-fixed designs are no longer viable and the offshore site is deep enough to allow for efficient mooring. The main challeng-es encountered in the implementation of floating foun-dations is to maintain stability, an acceptable range of displacements, an efficient mooring and at the same time avoid costly designs, installation and maintenance. The most commonly investigated concepts in floating offshore foundations are ballast-stabilised floaters (i.e. spar buoy), buoyancy-stabilised floaters (i.e. semisubmersible), and mooring-stabilised floaters (i.e. tension leg platforms).
When comparing LCOE for technologies from different generations of floating offshore wind solutions, it can be deduced that it is necessary to perform a significant tech-nology development with the aim of reducing investment and O&M costs to create competition with other renewa-ble sources. Floating structures represent an opportunity for reducing offshore wind energy cost as well as for in-
14 No image available as patent-applied.
creasing the utilization of the offshore wind resource by enabling exploitation of areas which are not economically suitable for current bottom fixed solutions. During LEAN-WIND, after developing a state of the art study and a risk ranking exercise, semi-submersible floating technology was selected as most suitable for the specific conditions and extreme environment present at the proposed case-study test site (a location on the western Irish Coast, near Belmullet, Co. Mayo).
The LEANWIND Semi-submersible platform is a floating substructure for OWTs, designed to operate in water depths greater than 50 metres. It is designed to support a 5MW turbine. The structure is made from steel and uses a 3-point catenary mooring. This relatively simple platform design is easy to manufacture, has a shallow draft, excellent hydrodynamic properties and a good platform-weight to turbine-rating ratio compared to competing designs.14
A complete basic design of the platform has been per-formed in LEANWIND that accounts for not only the ge-ometrical design and a weight calculation, but also the basic design of required auxiliary systems, mooring and anchoring systems. Additionally, an innovative tailored WT controller has been developed, and benchmark sim-ulation results have been obtained. The platform design has been validated though physical tank tests. These tests were performed by University College Cork in the Lir Na-tional Ocean Test Facility on a 1:36 scale model for repre-sentative operational and survival conditions, but also in conditions which are specific to the transportation and in-stallation stages. The tank test conditions included expo-sure to waves equivalent to a height of 32m at full scale.
The dynamic behaviour and design consistency of the LEANWIND semi-submersible platform has been ex-tensively evaluated both in numerical simulations and through the experimental basin test campaign. This, to-gether with the ease of transportation and installation (due to the self-stability of the platform along with the draft conditions achieved during these operations), illus-trates the robustness of the solution reached/developed in the design process conducted. As a result of the study performed with the semi-submersible platform concept design, its technical viability has been largely validated.
25
Installation
Driving Cost Reductions in Offshore WindThe LEANWIND Project Final Publication
1.3 INSTALLATION VESSELS & LIFTING OPERATIONS EQUIPMENT This section describes the LEANWIND tasks carried out to provide economical and novel installation vessel de-sign solutions, incorporating technological innovations and tailored to specifically identified industry challenges. In addition to vessel design, the lifting activities involved during the installation phase of OWF development have also been studied. The primary focus was to improve effi-ciency and reduce project downtime, ultimately providing cost and time savings.
Vessel concepts have been tested via modelling and simu-lation activities (Section 1.3.5) and implemented to iden-tify where cost savings can be realised through the use of efficient strategies and technologies (Section 3.4).
The steps followed to derive the final vessel design solu-tions are listed below. These steps form the basis for the discussion in this Section:• identify the industry challenges for the wind farm
sector relating to installation activities;• outline the specifications for the novel vessel design;• finalise design of vessel and lifting & access equipment.
1.3.1 INDUSTRY CHALLENGES - WIND FARM INSTALLATION VESSELSInstallation has been identified as an area that would ben-efit from technological innovation. Potential cost reduc-tions are closely linked to reducing time needed for the various operations and extending the weather windows in which operations are feasible. An industry survey was conducted to identify where cost reductions could best be achieved. The methodology for this survey is described in a public LEANWIND report15 and the areas identified are listed below:• decrease the use of offshore lifts by increasing
the amount of onshore preassembly or increasing loading capability for components being lifted;
• decrease operating constraints due to meteorological
15 LEANWIND consortium, (2015). Key design parameters and criteria related to installation and maintenance vessels design; their layouts, crane operations and access systems. Available at http://www.leanwind.eu/wp-content/uploads/GA_614020_LEANWIND_D3.2.pdf
conditions;• improved vessel design for less restrictive weather
limitations;• increased maximum sea state in which jacking
operations can be carried out;• increased maximum crane operating wind speed;• improved weather prediction;• improved weather monitoring and decision support
system;• decreased transit time;• increased number of turbines loaded per trip;• increased deck payload;• increased usable deck area;• increased transit speed;• decreased offshore operation duration;• increased jacking speed;• decreased leg-preload duration (by using 4- or 6-leg
vessels).
In Section 1.3.4, crane operations and lifting capacity of an installation vessel are discussed. In this respect, the main limitations are the lifting capacity, which needs to be based on the heaviest possible parts to be lifted, and crane geometry, i.e. minimum clearance in order to avoid clashes between primary and secondary cranes. Related vessel technical limitations are primarily the main dimen-sions and the vessel stability, as the positioning of heavy cargo items influences the static stability of the vessel. Other important limitations are related to the jacking capacity of the jack-up vessel (JUP), i.e. the maximum elevated weight of JUP vessels, deck strength, size of components, size of sea fastening, gangway position for installation, crew accommodation constraints, propulsion package, and safety considerations.
1.3.2 VESSEL CONCEPTS – DESIGN & EVALUATIONSeveral types of WT and foundation installation vessels currently operate in the offshore wind market. These in-clude lift-boats, jack-up barges, self-propelled installation vessels (SPIVs) and heavy-lift vessels (HLVs). Lift-boats, jack-up barges and SPIVs are collectively referred to as self-elevating vessels due to their characteristic feature of
26
Installation
Driving Cost Reductions in Offshore WindThe LEANWIND Project Final Publication
raising the entire hull above the waterline. SPIVs are also called Turbine Installation Vessels (TIVs) because they are used almost exclusively for these operations.
The primary characteristics for TIVs generally include:• principal dimensions;• operating conditions for jacking;• accommodation capacity and facilities;• leg length and jacking speed;• crane capacity and operating limits for lifting;• Dynamic Positioning (DP) system;• cargo area (main deck area and strength).
During the LEANWIND project, the various types of in-stallation vessels described above were reviewed and as-sessed using a set of criteria/design goals. The aim was to understand how each concept would achieve the ob-jective of improved and efficient vessel designs. Three concepts for an installation vessel were selected after detailed consideration of the design goals. The selection process was based on a qualitative method of listing goals for the vessels based on the challenges set by the indus-try, and assessing these for a number of vessel concepts. The operational features and requirements of the vessels and were evaluated for each concept based on time and cost. A greater weighting was given in the evaluation pro-cess to the operational features considered to be of great-er importance.
The design goals listed below were agreed during work-shops and consultation with OWT installation experts. These were used as the principal design goals when rank-ing and selecting the three vessel concepts to be taken further in the design process.
The main design goals [and associated weighting] are list-ed below:1. Increased accessibility / operational uptime in sites
further offshore such as UK Round 3 sites [30%]2. Ability to load, transport and install future larger
turbines or sub-assemblies [20%]3. Ability to load, transport and install future larger
foundations [30%]4. Ability to operate in deeper waters [5%]5. Incorporation of generic sea fastenings into vessel
design [10%]6. Use of modern equipment handling tools [5%]
The three preliminary installation vessel concepts that were selected using these design goals were then as-sessed to identify one final design concept which maxim-ises cost effectiveness and efficiency.
The FTIV (Foundation Transport and Installation Vessel) is floating type installation vessel and thus offers a larger depth range for the installation of wind farms. The ves-sel has less restrictions on stability while transiting due to the low centre of gravity compared with jack-up type platforms. However, the vessel has very large motions, especially at the point of hook load. There are also some concerns regarding the viability of maintaining high ac-cessibility with offshore lifts. These lifts will be of many hundreds of tonnes which may be problematic for a float-ing platform.
Furthermore, the current industry has little understand-ing and attention to exploring wind farms in deeper depths which would also indicate this concept as not desirable. It is also noted that floating type WTs designs are being considered as future for the deep water wind farm exploration.
The FTIJ (Foundation Transport and Installation Jack-up) and WTIJ (WT Transport and Installation Jack-up) are both jack-up type units. They are the preferred units of this type based on industry feedback for wind farm installa-tion activities in the offshore environment, especially for lifting operations.
The FTIJ is used for installation of foundations. For the LEANWIND 8MW turbine, both the mass (in excess of 1500 tonnes) and the dimensions of the largest jacket foundations limit the transport to 3-4 at one time. This restriction is further limited by the crane capabilities available within the current market: a crane lift capacity of more than 2000 tonnes is required to allow for dynamic factors during an offshore lift. The vessel design team not-ed that the design of the FTIJ concept would thus not be cost effective, nor would it add value to the operations of current and near future wind farm sites.
The WTIJ was identified as the concept with the most potential, given that the industry seeks to maximise the number of turbines per transit. The WTIJ design provides a novel solution which has the potential to a cost effec-tive solution for future wind farm installation vessels, and
27
Installation
Driving Cost Reductions in Offshore WindThe LEANWIND Project Final Publication
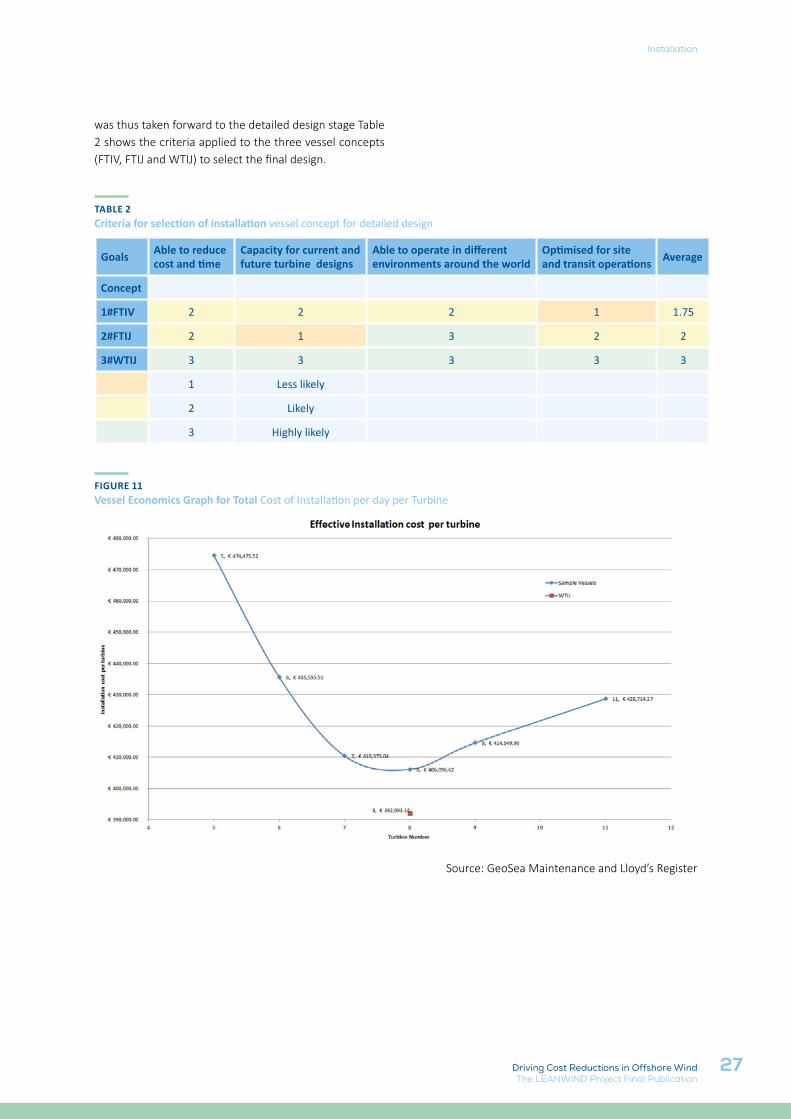
was thus taken forward to the detailed design stage Table 2 shows the criteria applied to the three vessel concepts (FTIV, FTIJ and WTIJ) to select the final design.
TABLE 2 Criteria for selection of installation vessel concept for detailed design
Goals Able to reduce cost and time
Capacity for current and future turbine designs
Able to operate in different environments around the world
Optimised for site and transit operations Average
Concept
1#FTIV 2 2 2 1 1.75
2#FTIJ 2 1 3 2 2
3#WTIJ 3 3 3 3 3
1 Less likely
2 Likely
3 Highly likely
FIGURE 11 Vessel Economics Graph for Total Cost of Installation per day per Turbine
Source: GeoSea Maintenance and Lloyd’s Register
28
Installation
Driving Cost Reductions in Offshore WindThe LEANWIND Project Final Publication
Figure 11 shows the optimisation of the installation cost per turbine for the WTIJ (Concept 3) in comparison to sample vessels using the vessel economics spreadsheet.
The effective installation cost per turbine shown below was obtained by estimating the cost for the installation of a sample wind farm with 100 WTs and comparing with the installation cost using vessels currently available within the industry. The total installation cost includes the char-ter cost of the installation vessel for the entire installation process which is linked to the build cost and the expected returns for the vessel.
The total installation cost has been adjusted and effec-tive installation costs are shown. This takes into account the difference in the sample wind farm’s completion and start time based on the number of turbines carried in each transit. The time required for installation has been estimated based on the actual time for transit and installation along with appropriate factors to account for weather constraints taken as Weather Down Turn (WDT) time.
The dip in the graph, shown in Figure 11 is for the WTIJ vessel concept with 8 turbines as cargo and is primarily related to the cost of build for the unit which is a function of the vessel lightweight. The estimate for the lightweight of the unit is typically optimised for the actual LEANWIND design/concept WTIJ selected. It is important that during the final structural design that the lightweight of the unit is maintained within the range of initial estimations used through the optimisation process.
The WTIJ has many advantages compared to the other two concepts. Specifically, the WTIJ concept can be per-fectly optimised to carry larger WTs i.e., 8 and 10 MW which are the expected sizes of future OWTs. The WTIJ can also carry the optimum number of turbines in one transit i.e., 8x8MW according to Figure 11, which will sig-nificantly reduce costs. In addition, the vessel can operate in most of the wind farm sites identified by the industry for future extension, without significant restrictions on operations due to the environmental parameters.
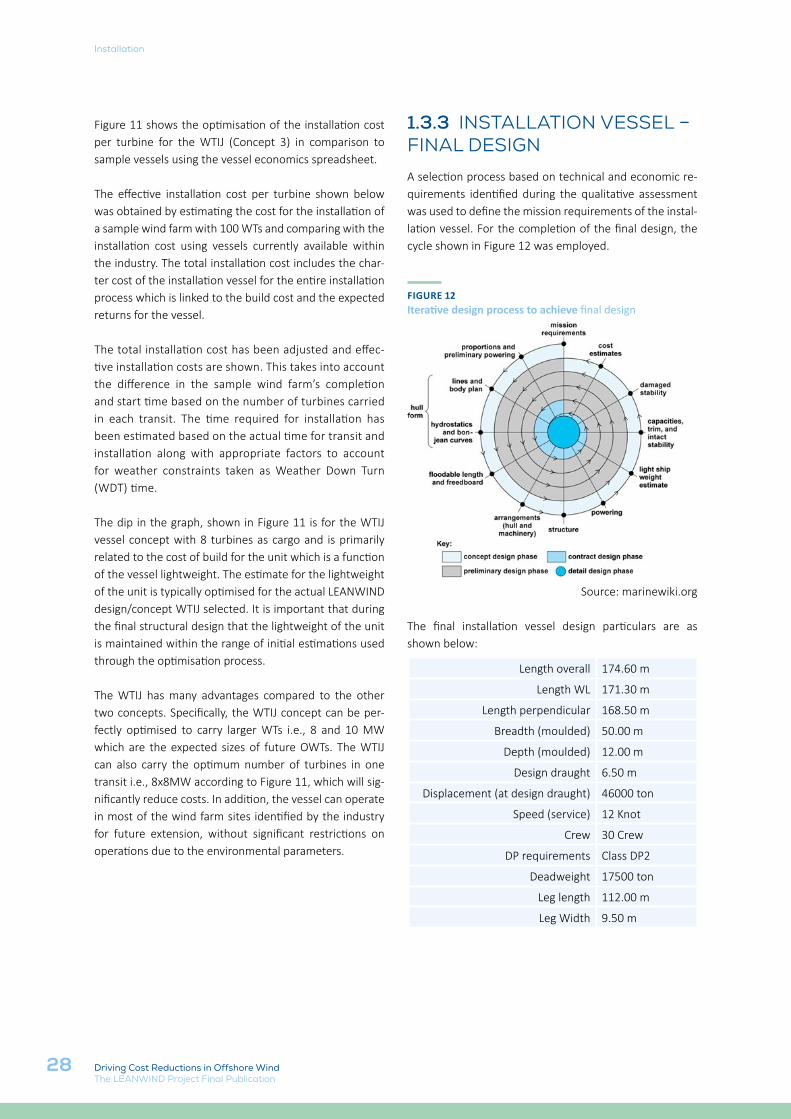
1.3.3 INSTALLATION VESSEL – FINAL DESIGNA selection process based on technical and economic re-quirements identified during the qualitative assessment was used to define the mission requirements of the instal-lation vessel. For the completion of the final design, the cycle shown in Figure 12 was employed.
FIGURE 12 Iterative design process to achieve final design
Source: marinewiki.org
The final installation vessel design particulars are as shown below:
Length overall 174.60 m
Length WL 171.30 m
Length perpendicular 168.50 m
Breadth (moulded) 50.00 m
Depth (moulded) 12.00 m
Design draught 6.50 m
Displacement (at design draught) 46000 ton
Speed (service) 12 Knot
Crew 30 Crew
DP requirements Class DP2
Deadweight 17500 ton
Leg length 112.00 m
Leg Width 9.50 m
29
Installation
Driving Cost Reductions in Offshore WindThe LEANWIND Project Final Publication
The following highlights key features of the vessel:• pure LNG propulsion system (first and only concept);• capable of operating in all regions of ECA;• capable of carrying and mounting 8 pieces of 8MW
(or 7 pieces of 10MW) wind turbines (for 10MW subject to design features);
• capable of installing 32 wind turbines with 4 visits without refuelling;
• capable of installing wind turbines with 1500-ton main crane or to install both wind turbines and monopile foundations (4 pcs) with 2000-ton main crane;
• capable of operating under higher wind speed conditions via high wind boom lock system for installation of suspended weights;
• environmental Regularity Number = (99, 99, 98, 98, 84) for dynamic positioning operations with existing propulsion and thruster system;
• 6000 m2 free main deck area optimized for fast installation;
• 70-person capacity (crew + technicians).
The design is based on Lloyd’s Register Rules for offshore units and IMO, MODU Code 2009.
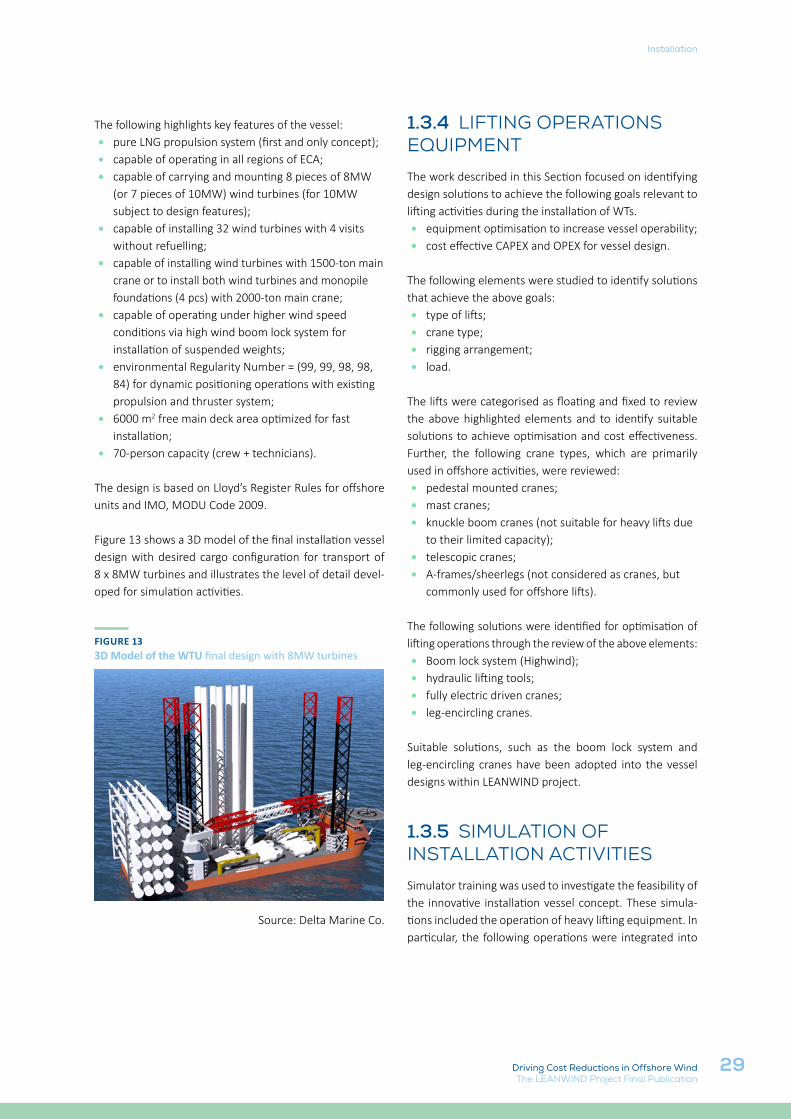
Figure 13 shows a 3D model of the final installation vessel design with desired cargo configuration for transport of 8 x 8MW turbines and illustrates the level of detail devel-oped for simulation activities.
FIGURE 13 3D Model of the WTU final design with 8MW turbines
Source: Delta Marine Co.
1.3.4 LIFTING OPERATIONS EQUIPMENTThe work described in this Section focused on identifying design solutions to achieve the following goals relevant to lifting activities during the installation of WTs.• equipment optimisation to increase vessel operability;• cost effective CAPEX and OPEX for vessel design.
The following elements were studied to identify solutions that achieve the above goals:• type of lifts;• crane type;• rigging arrangement;• load.
The lifts were categorised as floating and fixed to review the above highlighted elements and to identify suitable solutions to achieve optimisation and cost effectiveness. Further, the following crane types, which are primarily used in offshore activities, were reviewed:• pedestal mounted cranes;• mast cranes;• knuckle boom cranes (not suitable for heavy lifts due
to their limited capacity);• telescopic cranes;• A-frames/sheerlegs (not considered as cranes, but
commonly used for offshore lifts).
The following solutions were identified for optimisation of lifting operations through the review of the above elements:• Boom lock system (Highwind);• hydraulic lifting tools;• fully electric driven cranes;• leg-encircling cranes.
Suitable solutions, such as the boom lock system and leg-encircling cranes have been adopted into the vessel designs within LEANWIND project.
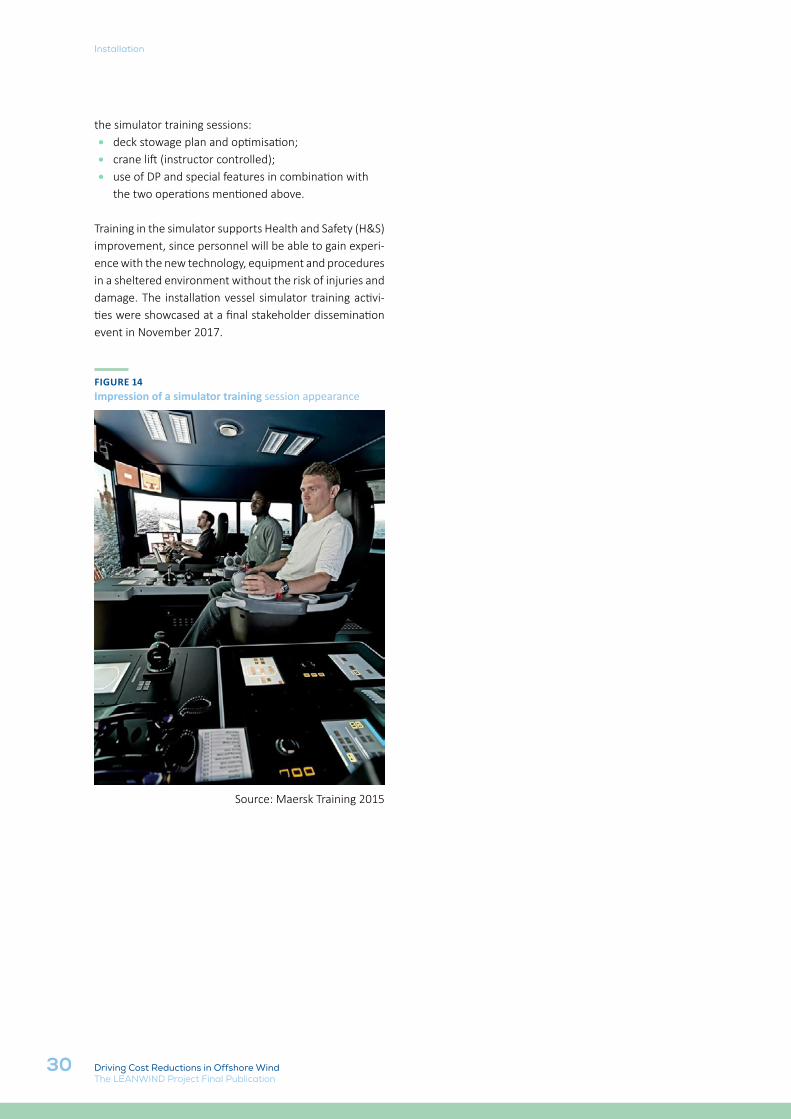
1.3.5 SIMULATION OF INSTALLATION ACTIVITIES Simulator training was used to investigate the feasibility of the innovative installation vessel concept. These simula-tions included the operation of heavy lifting equipment. In particular, the following operations were integrated into
30
Installation
Driving Cost Reductions in Offshore WindThe LEANWIND Project Final Publication
the simulator training sessions:• deck stowage plan and optimisation;• crane lift (instructor controlled);• use of DP and special features in combination with
the two operations mentioned above.
Training in the simulator supports Health and Safety (H&S) improvement, since personnel will be able to gain experi-ence with the new technology, equipment and procedures in a sheltered environment without the risk of injuries and damage. The installation vessel simulator training activi-ties were showcased at a final stakeholder dissemination event in November 2017.
FIGURE 14Impression of a simulator training session appearance
Source: Maersk Training 2015
31Driving Cost Reductions in Offshore WindThe LEANWIND Project Final Publication
2.
2.1 OFFSHORE WIND O&M - CHALLENGES & SOLUTIONS This Section outlines the main challenges for O&M of OWFs and highlights the LEANWIND solutions developed to address them. The following key areas are covered:• Technical integrity• Operational integrity
TECHNICAL INTEGRITY
The technical integrity of an OWF can to a large extent be assessed through the use of condition monitoring. A major challenge today is how Condition Monitoring data is systemised and coupled to relevant models that may support the continuous improvement processes inher-ent in maintenance strategies. Automation of data cap-ture should be expanded to cover potentially all activities related to inspection, surveillance and monitoring. The use of automation, robotics and autonomous units will help address the necessary reduction in manned inter-ventions, directly influencing the LCOE for offshore wind. Manned interventions should be confined to heavy main-tenance work.
In addition to information from Condition Monitoring, information from inspections can also be important to assess the technical integrity. Compared to Condition Monitoring, which typically provides indirect information on the deterioration/damage level of the components, inspections can provide direct information with less un-certainty. Since the costs of inspections are generally larg-er than the costs of Condition Monitoring, a cost-benefit or risk-based approach is needed for cost-optimal deci-sion-making.
A number of LEANWIND innovations aim to reduce the impact of these challenges and the need for O&M ac-tivities. Considering the design of the actual turbine, a turbine controller for a semi-submersible platform was developed which presents a modification to the turbine control system to reduce loading on the system. It thus has the potential to reduce the occurrence of failures and extend turbine lifetime. Additionally, RAMS methodolo-gies and reliability based design tools were developed to ensure that turbine reliability is a key focus of the design stage thus reducing O&M costs once operational.
With regard to Condition Monitoring and the use of au-tomation a remote presence prototype, turbine failure diagnosis and degradation models were developed in
OPERATION & MAINTENANCE
32
Operation & Maintenance
Driving Cost Reductions in Offshore WindThe LEANWIND Project Final Publication
the LEANWIND project. These concepts focus on predict-ing turbine failure and identifying the root cause, allowing pre-planning of O&M activities which ultimately reduces costs. In the case where it is identified that the root cause of a failure is non-critical, it may be possible to intervene from shore, or plan O&M activities into the existing ser-vice schedule.
OPERATIONAL INTEGRITY
Operational integrity relates to the challenges of keeping the WTs operational, but which are not directly related to the technical integrity of the WT. For example, a logistics strategy providing the necessary accessibility for a suc-cessful maintenance strategy, is crucial for the operational integrity of the wind farm. Efficient logistics strategies be-come increasingly important as wind farms are developed further from shore and in harsher wave climates.
To face these challenges, an O&M strategy model has been developed in LEANWIND to assess and improve dif-ferent strategies for a given location. This has been inte-grated into the financial model described in Section 3.2.2. It can be used in conjunction with the risk based O&M model and the dynamic scheduling model to identify a cost optimised O&M strategy for a given wind farm, port and vessel fleet. Risk-based approaches for planning of O&M activities provide a consistent approach for optimal decision-making. The dynamic scheduling model aims to facilitate evaluation of short-term O&M planning prob-lems, e.g. vessel routing, which arise during the actual operation of a wind farm.
Challenges the LEANWIND O&M models address include:• the improvement in availability due to improved
condition monitoring systems (CMS) or novel concepts such as remote presence;
• the effect of weather conditions on the maintenance work to be performed by technicians;
• the effect of improved scheduling, grouping and routing on the overall operation of the wind farm;
• the interaction between the strategy for spare parts and the strategy for vessel logistics;
• the best strategies for chartering heavy-lift vessels.
As well as improved strategies, further cost savings can be realised through the use of innovative O&M service vessels and improved access methods. These have been
examined in LEANWIND and the resulting configuration provides a wider operational window, and the ability to transfer larger crews quickly and safely. These outputs have the potential to provide tangible cost savings in the O&M phase of an OWF life-cycle.
It is important for operational integrity that maintenance providers acquire a culture that cultivates the ability to change and adapt throughout the life of the installation. Concepts such as the People-Technology-Organisation (PTO) from the oil & gas industry should be explored with the aim of exploiting the value of increased collaboration both within individual companies as well as between sup-pliers and operators. Such collaboration is crucial to bring-ing down the LCOE of offshore wind energy.
2.2 OPERATION AND MAINTENANCE STRATEGIESThis Section further describes the LEANWIND innovations developed to improve O&M strategies. Three tools for O&M optimization are presented, followed by methods for providing input to reliability based design and dete-rioration modelling. Condition Monitoring and remote presence are described, as well as O&M access solutions. Finally, four case studies are discussed to illustrate the in-tegration of the developed solutions.
2.2.1 STRATEGY OPTIMISATION
LEANWIND has developed several tools with the objective of optimizing the O&M of OWFs. Optimization of O&M implies finding an optimal maintenance effort considering direct O&M costs and wind farm availability. This optimization must be seen from a life-cycle perspective and should contribute to minimizing the LCOE of the wind farm project. Thus, the problem of optimizing O&M is very complex and multi-facet-ed, and the tools developed address different aspects of the overall problem and use a variety of approaches. The overall problem involves both strategic decision problems relating to long-term planning and tactical and operational decision problems with shorter planning horizons.
The following decision support tools have been developed to address this problem and will be described below:
33
Operation & Maintenance
Driving Cost Reductions in Offshore WindThe LEANWIND Project Final Publication
• the O&M strategy model: a simulation tool for strategic decision support, in particular for optimizing maintenance logistics;
• the risk-based model: a framework using Bayesian networks and simulation techniques to provide strategic decision support relating to the times and methods for repairs, inspections, and Condition Monitoring;
• dynamic routing and scheduling framework: a set of optimisation models for operational and tactical decision support relating to vessel logistics.
O&M STRATEGY MODEL
The LEANWIND O&M strategy model is a strategic deci-sion support tool designed for aiding stakeholders in se-lecting the optimal maintenance and logistics strategies for OWFs. It simulates the maintenance activities and re-lated logistics of OWFs over a given number of years, us-ing a discrete-event Monte Carlo simulation approach to
16 Sperstad, I. B.; McAuliffe, F. D.; Kolstad, M.; Sjømark, S., (2016). Investigating key decision problems to optimise the operation and main-tenance strategy of OWFs, Energy Procedia, vol. 94, pp. 261-268.
17 Ibid.
estimate key performance parameters, such as wind farm availability and O&M costs. Further details of the model methodology are outlined in Section 3.2.2.
The use of the O&M strategy model has been demonstrat-ed in three case studies with relevant decision problems for an OWF owner/operator:
1. Timing of jack-up vessel charter periods for pre-determined heavy maintenance campaigns;
2. Selecting the size and composition of the Crew Transfer Vessel (CTV) fleet;
3. Timing of annual service (predetermined preventive maintenance) campaigns.
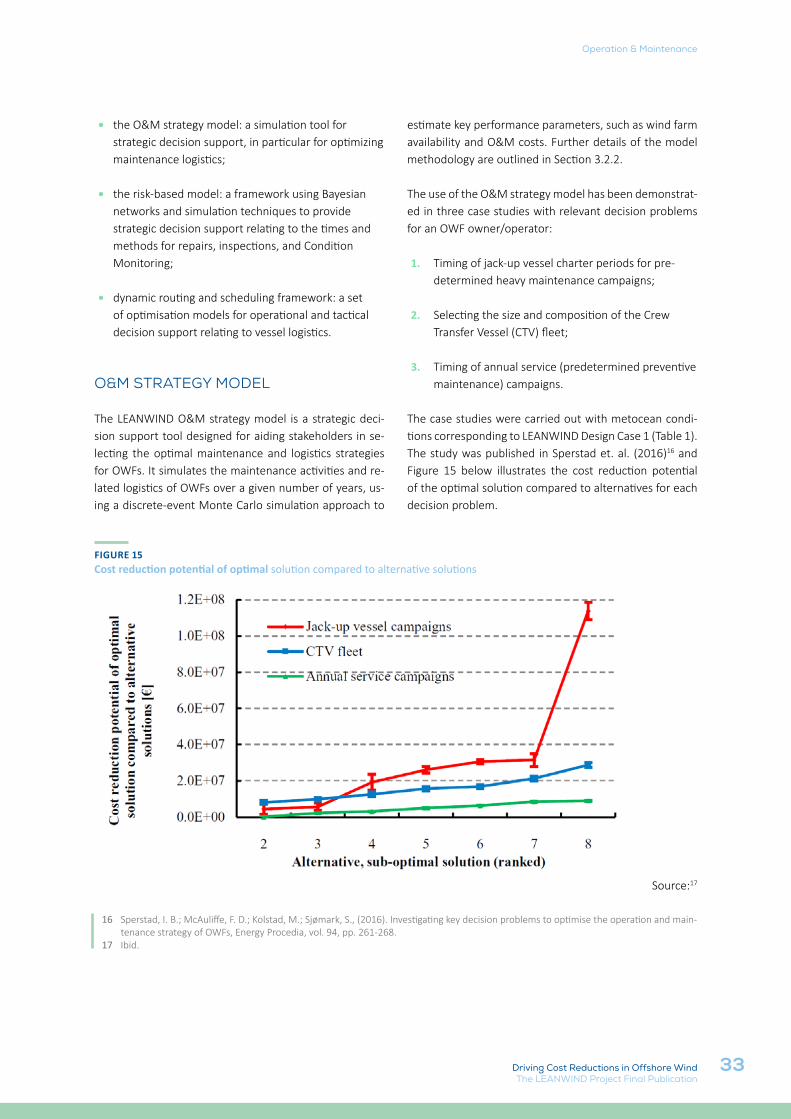
The case studies were carried out with metocean condi-tions corresponding to LEANWIND Design Case 1 (Table 1). The study was published in Sperstad et. al. (2016)16 and Figure 15 below illustrates the cost reduction potential of the optimal solution compared to alternatives for each decision problem.
FIGURE 15Cost reduction potential of optimal solution compared to alternative solutions
Source:17
34
Operation & Maintenance
Driving Cost Reductions in Offshore WindThe LEANWIND Project Final Publication
The results from the case studies substantiate that op-timising the jack-up charter strategy and CTV fleet com-position both offer substantial economic potential for the wind farm owner/operator. The findings for jack-up vessel charter periods (decision problem 1) indicate that pre-chartering jack-up vessels for a set of campaign peri-ods is a competitive strategy when compared to the con-ventional "fix-on-failure" strategy of chartering jack-up vessels as soon as the need arises.
Using a Monte Carlo simulation approach provides insight into the risks and uncertainties associated with choosing a strategy. For instance, the selection of charter periods for jack-up vessel campaigns is associated with much larger variability than selection of the other decision problems considered. This implies a lower certainty for a wind farm operator that the expected best solution actually turns out to be the most profitable for that particular wind farm over the years it is operational, and hence jack-up vessel campaigns carry a higher risk.
The O&M Strategy model is a high-level model that cap-tures several aspects of the O&M of the wind farm, and "system effects" such as the interactions between different maintenance tasks, logistics and weather conditions. As such it can also identify the risk of selecting sub-optimal strategies if solving each decision problem in isolation in-stead of viewing different decision problems as a whole. For instance, it was shown how choosing less costly CTVs in isolation would seem like an optimal solution to decision problem 2. However, considered simultaneously with the timing of annual services (decision problem 3), it was found that with more expensive and robust vessels, one could concentrate the annual service campaign in the summer months where the expected downtime losses are lowest.
The model also forms the basis of the OPEX module of the LEANWIND full life-cycle cost model (see Section 3.2.2) and thus contributes to validating (by evaluating the costs and benefits) other innovations developed in the LEAN-WIND project.
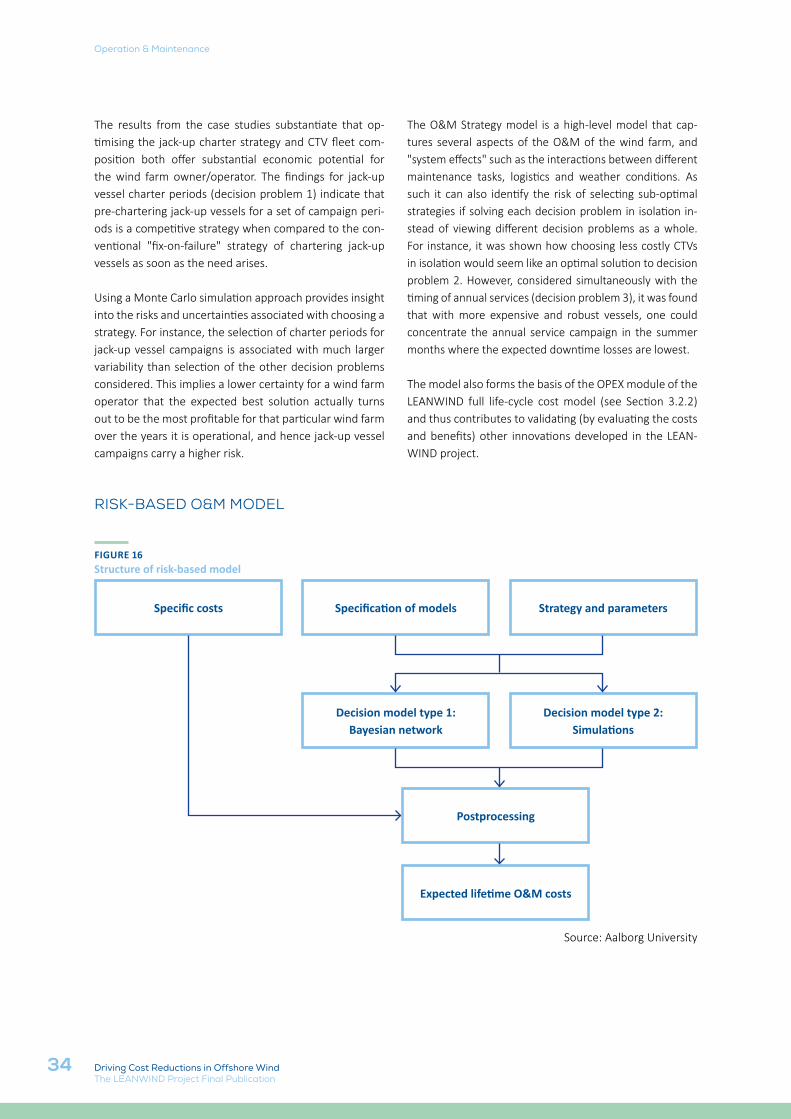
RISK-BASED O&M MODEL
FIGURE 16 Structure of risk-based model
Specific costs Specification of models Strategy and parameters
Decision model type 1: Bayesian network
Decision model type 2: Simulations
Postprocessing
Expected lifetime O&M costs
Source: Aalborg University
35
Operation & Maintenance
Driving Cost Reductions in Offshore WindThe LEANWIND Project Final Publication
The risk-based O&M model can be used to optimise the timing and methods for repairs, inspections, and Condition Monitoring for deteriorating components, minimising the total expected O&M costs. The theoretical basis for the risk-based model is the Bayesian pre-posterior decision analysis. A computational framework has been developed which includes decision rules for modelling several types of preventive and corrective maintenance. Decision rules can be based on time or on inspection or Condition Monitoring outcomes (simple decision rules). Alternatively, decision rules can be based on a probability of failure estimate that considers all previously obtained observations and a dete-rioration model.
The core of the computational framework are two decision models used for estimating the frequency/probability of in-spection, repair, and failure in each time step. The decision models are based on probabilistic models for deterioration, inspections, Condition Monitoring, and repairs, for all can-didate decision rules and parameters. For simple decision rules, Bayesian networks are used directly to estimate the probabilities of inspection, repairs, and failures, and the re-sult is exact given the models. For decision rules using the probability of failure as the decision parameter, simulations are used to estimate probabilities, and Bayesian networks are used for decision-making within simulations.
To find the optimal decision rules and parameter values, the probabilities of inspections, repairs, and failures are combined with expected specific costs of inspections, re-pairs, and failures, including lost revenue. The influence of vessel and jack-up strategy can be included indirectly in the expected specific costs.
A case-study has been carried out applying the risk-based approach to blade maintenance. A Markov deterioration model was developed based on inspection data from a da-tabase. The specific costs of inspections, repairs, and fail-ures were found based on weather data and assumptions on durations and weather thresholds. The risk-based O&M model was then used to find the optimal inspection meth-od, optimal decision rules for inspections and repairs, and to estimate the value of Condition Monitoring. Without Con-dition Monitoring, simple decision rules with equidistant inspections resulted in lowest costs, when system effects regarding inspection costs were included. When Condition Monitoring was included, the advanced decision rules con-sidering all information was found to give the lowest costs.
DYNAMIC ROUTING AND SCHEDULING FRAMEWORK
The dynamic routing and scheduling framework is a set of optimisation models and solution algorithms for opti-mising the maintenance logistics at OWFs. The decision problems addressed by these models are related to the scheduling of maintenance activities and the routing of CTVs for carrying out these maintenance activities. Main-tenance activities include both corrective and preventive maintenance. The framework primarily considers opera-tional decision problems, with a planning horizon of 1–7 days, but also considers tactical decision problems with a planning horizon of approximately one month.
Dynamic routing and scheduling is dynamic in the sense that it considers the evolution over time of the informa-tion that is available to the decision maker. Turbine fail-ures prompting new corrective maintenance tasks, or unexpected changes in weather conditions, for example, may render the assumed optimal solutions sub-optimal.
Three otpimization models or frameworks are proposed:
• an optimisation model for routing and scheduling of preventive maintenance for multiple OWFs and multiple O&M bases. The first model is a mathematical model for selecting the optimum route configuration developed to minimise the total cost comprising travel costs and technician costs. It is intended for operational decision support and considers a 3–7 days planning horizon;
• a framework for dynamic routing and scheduling of preventive and corrective maintenance, integrating a tactical scheduling model and an operational routing and scheduling model. First the scheduling model generates a schedule for preventive maintenance over a planning horizon of approximately one month; this is then used as a starting point for a more detailed routing and scheduling model that is run for each day, considering both corrective and preventive maintenance. This approach is dynamic in the sense that the previous schedules from the tactical model are updated based on new information on a daily basis in the operational model;
• a stochastic vessel routing optimisation model for
36
Operation & Maintenance
Driving Cost Reductions in Offshore WindThe LEANWIND Project Final Publication
corrective and preventive maintenance. This model takes into account uncertainties in parameters such as the travel time of each vessel and the length of the weather windows allowing safe access to the turbines. The planning horizon is one day. It is dynamic in the sense that it provides proactive plans designed to be robust to uncertain conditions rather than reactive repair plans.
These models and solution algorithms form the theo-retical foundation for the development of advanced de-cision support tools for operational decision problems within offshore wind maintenance logistics. Ultimately, such tools can be used by OWF operators to decide which technicians and vessels should visit which turbines the fol-lowing day. Developing decision support tools based on the optimization methods presented here contribute to reducing the LCOE compared to the current practice for routing and scheduling.
2.2.2 RELIABILITY BASED DESIGN IMPLICATIONS
RELIABILITY-BASED TOOLS
In LEANWIND, reliability-based tools for WTs have been developed using advanced RAMS methodologies, existing software tools and suitable modelling approaches. Initially, based on reliability, availability, maintainability, and safe-ty (RAMS) methodologies, the WT’s critical components (considered as the most vulnerable and crucial parts that are critical to the life-cycle and the maintenance plan of a WT) were identified. Their failure/degradation models were then analysed and developed.
A WT located offshore has higher construction and O&M costs than its onshore counterpart due to the extreme and variable weather conditions and the size of the con-struction. With the construction of wind farms in remote areas, the need for an efficient tool to identify and then limit or avoid risk of failures has become very important. Furthermore, the ‘new’ technology implementation has resulted in lack of adequate field data related to many WT
18 LEANWIND Consortium, (2015). Optimised maintenance and logistic strategy models. Confidential report. Executive summary available at: http://www.leanwind.eu/wp-content/uploads/LEANWIND_D4.2_Executive-Summary.pdf
components. Therefore, the main challenge to overcome in the process of determining the WT critical components is this lack of data. Due to this challenge, the proposed analysis conceived multiple sources: a failure modes ef-fect analysis (FMEA) and a failure modes effect and crit-icality analysis (FMECA) analysis, as well as a literature survey, which aimed to prioritize primary and secondary systems and components of the WT.
An extensive study and analysis based on the FMECA ap-proach was performed, providing failure rates and down-time periods for existing wind farms, as well as a criticality ranking based on different sources. First, a classical statis-tical analysis was developed for the whole data set avail-able. Then, a raw trend analysis, based on nominal power classification (NPC), was performed in order to predict failure rates and downtimes for 5 MW and 8 MW WTs. Finally, in order to mitigate the inconsistencies from the trend analysis for 5 and 8 MW WTs, after comparison with the analysis results not considering NPC, further database refinement was performed as necessary. The presence of false (abnormal) data in the NPC database has made in-dispensable the use of engineering judgement and expe-rience in such situations to extract a coherent data subset. Thus, the analysis performed was based on RAMS meth-odology, using data from industrial project participants, literature and databases, to estimate availability for large WTs. The methodology applicability is illustrated by an ex-ample, focusing on large WTs with rated power 7-8 MW18.
The literature survey was conducted to check and im-prove the results of the RAMS methodology due to the aforementioned lack of data. The databases examined in the survey referred to a mixed population of offshore and onshore WTs of varying rated power outputs. The time span of each database varied accordingly. Also some provided extra variables and components that could be introduced into the model as constraints or parameters that would affect the final categorization of critical com-ponents of a WT. Based on the literature survey, a number of lists with critical components identification and critical-ity ratings were presented, which in part could be used as input to the O&M optimisation. On the whole, it became clear that different methodologies led to different ratings and categorisation of criticalities and components.
37
Operation & Maintenance
Driving Cost Reductions in Offshore WindThe LEANWIND Project Final Publication
In addition to the previous mentioned methodologies, a web-based tool with interactive characteristics was de-veloped for the early design phase of the WT based on multi-objective optimization and reliability modelling. The WT is modelled as a system of components, and can be used by a WT designer who wants to use reliability-based models and tools to optimize a WT (new or existing) com-bining different design options and O&M scenarios for time-based preventive maintenance for the entire life-cy-cle. The tool estimates the total unavailability considering the components as a series system, with the possibility to introduce redundancy using components in parallel con-figuration. The estimated unavailability considers down-times due to failures and maintenance, and can be trans-formed to lost revenue using data on wind speeds.
DETERIORATION/ DEGRADATION MODELLING
Based on the WT’s structure, its components may be cat-egorised as structural (e.g. blades, tower), mechanical (e.g. systems and sub-systems in the nacelle involved in the rotation) and electrical/electronic (items involved in the power generation mechanism and various compo-nents which contribute to control, operation, and remote monitoring). Structural components are generally subject to environmental wear, fatigue, corrosion, and structur-al degradation due to age. Mechanical components, al-though protected from external factors, are subject to failure due to extreme use, material degradation, fatigue, material failure, and insufficient lubrication. Electrical and electronic components are usually subject to stresses and material failure due to external and overload conditions. In reality, several degradation modes and mechanisms exist for various types of failures/damages in each item/component of the WT. Hence, to apply degradation mod-els, the following must be examined: • the specific model’s needs;• the required input data;• main difficulties presented;• challenges faced.
In addition, difficulties due to interaction between deg-radation modes, interaction between items of a compo-nent, interaction between components, assumptions and the priorities for the estimation of the degradation rate and their remaining useful life must be considered. These difficulties are mainly related to the limited first-hand ex-
perience and the lack of information from the wind pow-er market. Furthermore, it must be noted that modelling the failure and degradation procedures for the various components is a very demanding task depending on a comprehensive understanding of the conditions and limi-tations on wind farm sites, as well as previous experience in the industrial and wind power sector.
In the LEANWIND project two types of structural degra-dation models were described that are relevant to WT applications: i. physics based degradation/damage model
(deterministic and stochastic); ii. state-space/data-driven damage model.
In the case of mechanical and electrical components, both the physics-based and statistical/data-driven mod-elling approaches for degradation (fault diagnosis and RUL prognosis) of WTs were considered. The first is more demanding, requiring long experimental periods and the application of material physics and mathematics, whilst the second one requires adequate operating data and is more suitable to model the WT components. Therefore, a number of different approaches for fault detection and RUL estimation can be selected as best suited in each case. Artificial Neural Networks (ANN) may be preferable for gearbox RUL estimation, whereas electrical current signal analysis may give the best results for fault detec-tion. Similarly, the best results for prognostics in rotating machinery can be obtained using multiple sensors, digi-tal signal processing, and machine learning techniques. Finally, in the case of ball bearings, RUL estimation can be based on Support Vector Machine (SVM) and Dynamic Bayesian Networks (DBNs).
Specific models for the WT’s gearbox, rotating mecha-nisms, and bearings were analysed, various techniques for fault diagnosis (in data acquisition, data cleaning, data analysis and condition prediction) and RUL progno-sis were discussed, and a case-study related to the main bearing was developed – see Section 2.2.5. The degrada-tion models and their results can be used as modules and/or input to the O&M Strategy model.
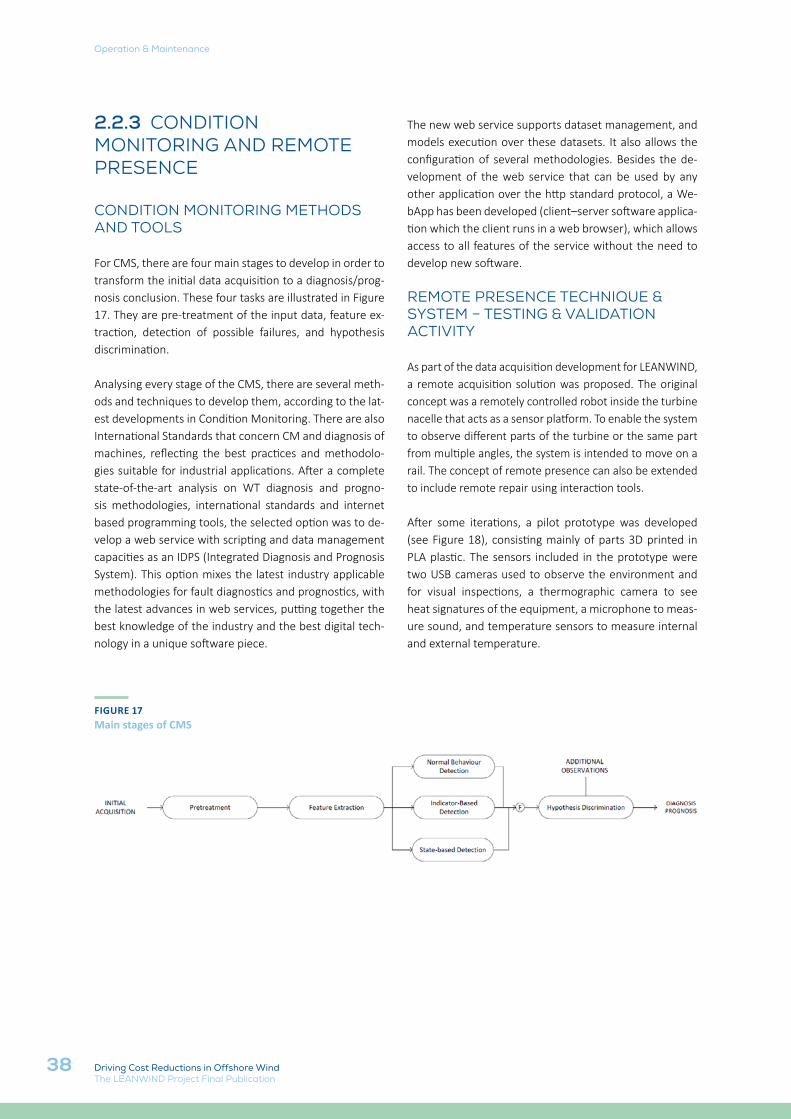
38
Operation & Maintenance
Driving Cost Reductions in Offshore WindThe LEANWIND Project Final Publication
2.2.3 CONDITION MONITORING AND REMOTE PRESENCE
CONDITION MONITORING METHODS AND TOOLS
For CMS, there are four main stages to develop in order to transform the initial data acquisition to a diagnosis/prog-nosis conclusion. These four tasks are illustrated in Figure 17. They are pre-treatment of the input data, feature ex-traction, detection of possible failures, and hypothesis discrimination.
Analysing every stage of the CMS, there are several meth-ods and techniques to develop them, according to the lat-est developments in Condition Monitoring. There are also International Standards that concern CM and diagnosis of machines, reflecting the best practices and methodolo-gies suitable for industrial applications. After a complete state-of-the-art analysis on WT diagnosis and progno-sis methodologies, international standards and internet based programming tools, the selected option was to de-velop a web service with scripting and data management capacities as an IDPS (Integrated Diagnosis and Prognosis System). This option mixes the latest industry applicable methodologies for fault diagnostics and prognostics, with the latest advances in web services, putting together the best knowledge of the industry and the best digital tech-nology in a unique software piece.
The new web service supports dataset management, and models execution over these datasets. It also allows the configuration of several methodologies. Besides the de-velopment of the web service that can be used by any other application over the http standard protocol, a We-bApp has been developed (client–server software applica-tion which the client runs in a web browser), which allows access to all features of the service without the need to develop new software.
REMOTE PRESENCE TECHNIQUE & SYSTEM – TESTING & VALIDATION ACTIVITY
As part of the data acquisition development for LEANWIND, a remote acquisition solution was proposed. The original concept was a remotely controlled robot inside the turbine nacelle that acts as a sensor platform. To enable the system to observe different parts of the turbine or the same part from multiple angles, the system is intended to move on a rail. The concept of remote presence can also be extended to include remote repair using interaction tools.
After some iterations, a pilot prototype was developed (see Figure 18), consisting mainly of parts 3D printed in PLA plastic. The sensors included in the prototype were two USB cameras used to observe the environment and for visual inspections, a thermographic camera to see heat signatures of the equipment, a microphone to meas-ure sound, and temperature sensors to measure internal and external temperature.
FIGURE 17 Main stages of CMS
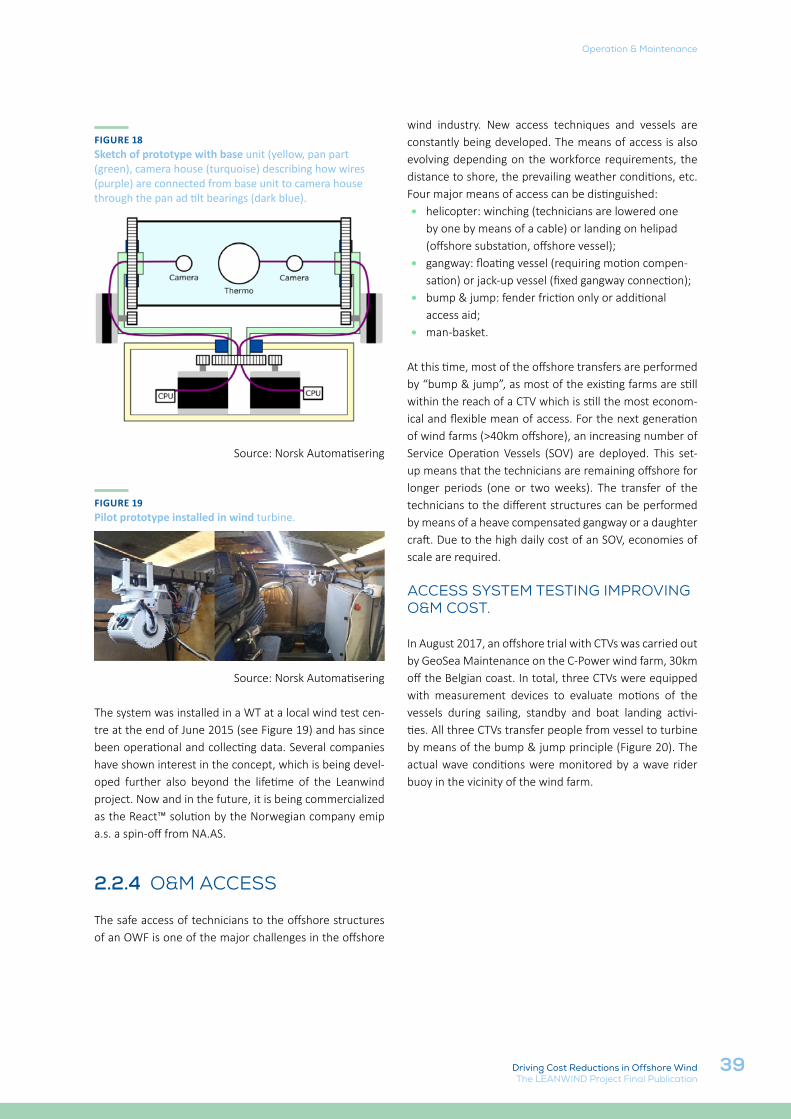
39
Operation & Maintenance
Driving Cost Reductions in Offshore WindThe LEANWIND Project Final Publication
FIGURE 18Sketch of prototype with base unit (yellow, pan part (green), camera house (turquoise) describing how wires (purple) are connected from base unit to camera house through the pan ad tilt bearings (dark blue).
Source: Norsk Automatisering
FIGURE 19Pilot prototype installed in wind turbine.
Source: Norsk Automatisering
The system was installed in a WT at a local wind test cen-tre at the end of June 2015 (see Figure 19) and has since been operational and collecting data. Several companies have shown interest in the concept, which is being devel-oped further also beyond the lifetime of the Leanwind project. Now and in the future, it is being commercialized as the React™ solution by the Norwegian company emip a.s. a spin-off from NA.AS.
2.2.4 O&M ACCESS
The safe access of technicians to the offshore structures of an OWF is one of the major challenges in the offshore
wind industry. New access techniques and vessels are constantly being developed. The means of access is also evolving depending on the workforce requirements, the distance to shore, the prevailing weather conditions, etc. Four major means of access can be distinguished: • helicopter: winching (technicians are lowered one
by one by means of a cable) or landing on helipad (offshore substation, offshore vessel);
• gangway: floating vessel (requiring motion compen-sation) or jack-up vessel (fixed gangway connection);
• bump & jump: fender friction only or additional access aid;
• man-basket.
At this time, most of the offshore transfers are performed by “bump & jump”, as most of the existing farms are still within the reach of a CTV which is still the most econom-ical and flexible mean of access. For the next generation of wind farms (>40km offshore), an increasing number of Service Operation Vessels (SOV) are deployed. This set-up means that the technicians are remaining offshore for longer periods (one or two weeks). The transfer of the technicians to the different structures can be performed by means of a heave compensated gangway or a daughter craft. Due to the high daily cost of an SOV, economies of scale are required.
ACCESS SYSTEM TESTING IMPROVING O&M COST.
In August 2017, an offshore trial with CTVs was carried out by GeoSea Maintenance on the C-Power wind farm, 30km off the Belgian coast. In total, three CTVs were equipped with measurement devices to evaluate motions of the vessels during sailing, standby and boat landing activi-ties. All three CTVs transfer people from vessel to turbine by means of the bump & jump principle (Figure 20). The actual wave conditions were monitored by a wave rider buoy in the vicinity of the wind farm.
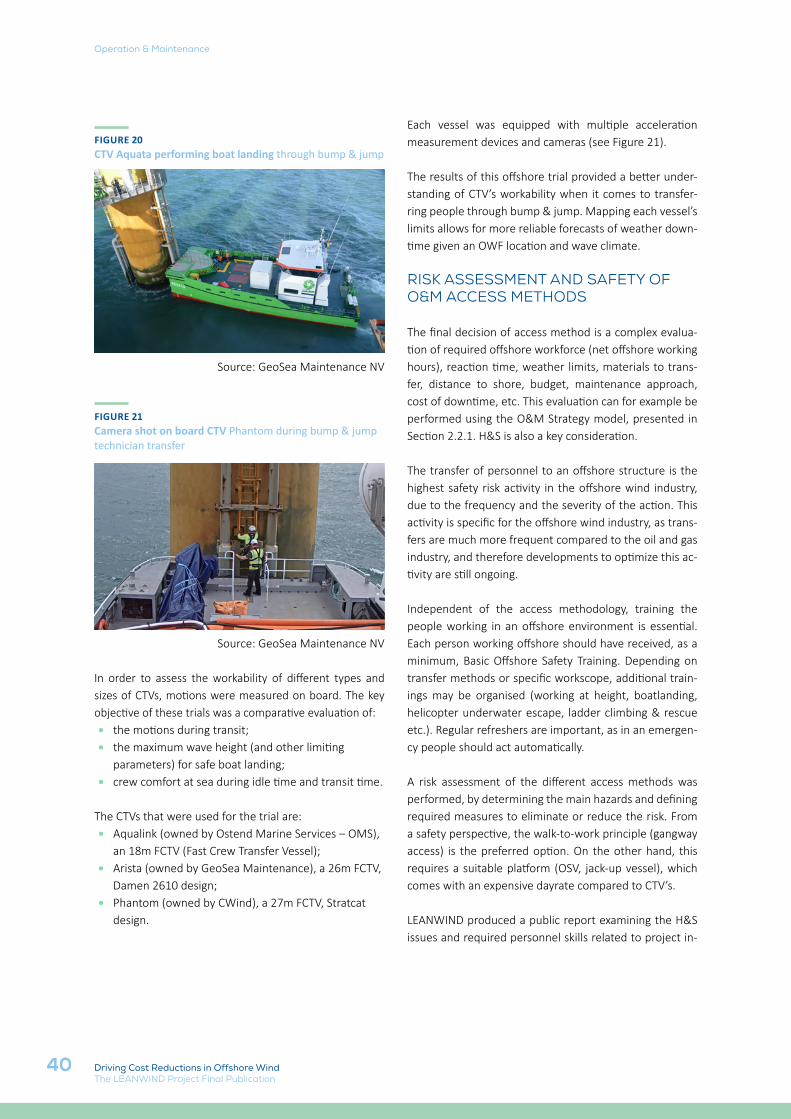
40
Operation & Maintenance
Driving Cost Reductions in Offshore WindThe LEANWIND Project Final Publication
FIGURE 20CTV Aquata performing boat landing through bump & jump
Source: GeoSea Maintenance NV
FIGURE 21Camera shot on board CTV Phantom during bump & jump technician transfer
Source: GeoSea Maintenance NV
In order to assess the workability of different types and sizes of CTVs, motions were measured on board. The key objective of these trials was a comparative evaluation of:• the motions during transit;• the maximum wave height (and other limiting
parameters) for safe boat landing;• crew comfort at sea during idle time and transit time.
The CTVs that were used for the trial are: • Aqualink (owned by Ostend Marine Services – OMS),
an 18m FCTV (Fast Crew Transfer Vessel);• Arista (owned by GeoSea Maintenance), a 26m FCTV,
Damen 2610 design;• Phantom (owned by CWind), a 27m FCTV, Stratcat
design.
Each vessel was equipped with multiple acceleration measurement devices and cameras (see Figure 21).
The results of this offshore trial provided a better under-standing of CTV’s workability when it comes to transfer-ring people through bump & jump. Mapping each vessel’s limits allows for more reliable forecasts of weather down-time given an OWF location and wave climate.
RISK ASSESSMENT AND SAFETY OF O&M ACCESS METHODS
The final decision of access method is a complex evalua-tion of required offshore workforce (net offshore working hours), reaction time, weather limits, materials to trans-fer, distance to shore, budget, maintenance approach, cost of downtime, etc. This evaluation can for example be performed using the O&M Strategy model, presented in Section 2.2.1. H&S is also a key consideration.
The transfer of personnel to an offshore structure is the highest safety risk activity in the offshore wind industry, due to the frequency and the severity of the action. This activity is specific for the offshore wind industry, as trans-fers are much more frequent compared to the oil and gas industry, and therefore developments to optimize this ac-tivity are still ongoing.
Independent of the access methodology, training the people working in an offshore environment is essential. Each person working offshore should have received, as a minimum, Basic Offshore Safety Training. Depending on transfer methods or specific workscope, additional train-ings may be organised (working at height, boatlanding, helicopter underwater escape, ladder climbing & rescue etc.). Regular refreshers are important, as in an emergen-cy people should act automatically.
A risk assessment of the different access methods was performed, by determining the main hazards and defining required measures to eliminate or reduce the risk. From a safety perspective, the walk-to-work principle (gangway access) is the preferred option. On the other hand, this requires a suitable platform (OSV, jack-up vessel), which comes with an expensive dayrate compared to CTV’s.
LEANWIND produced a public report examining the H&S issues and required personnel skills related to project in-
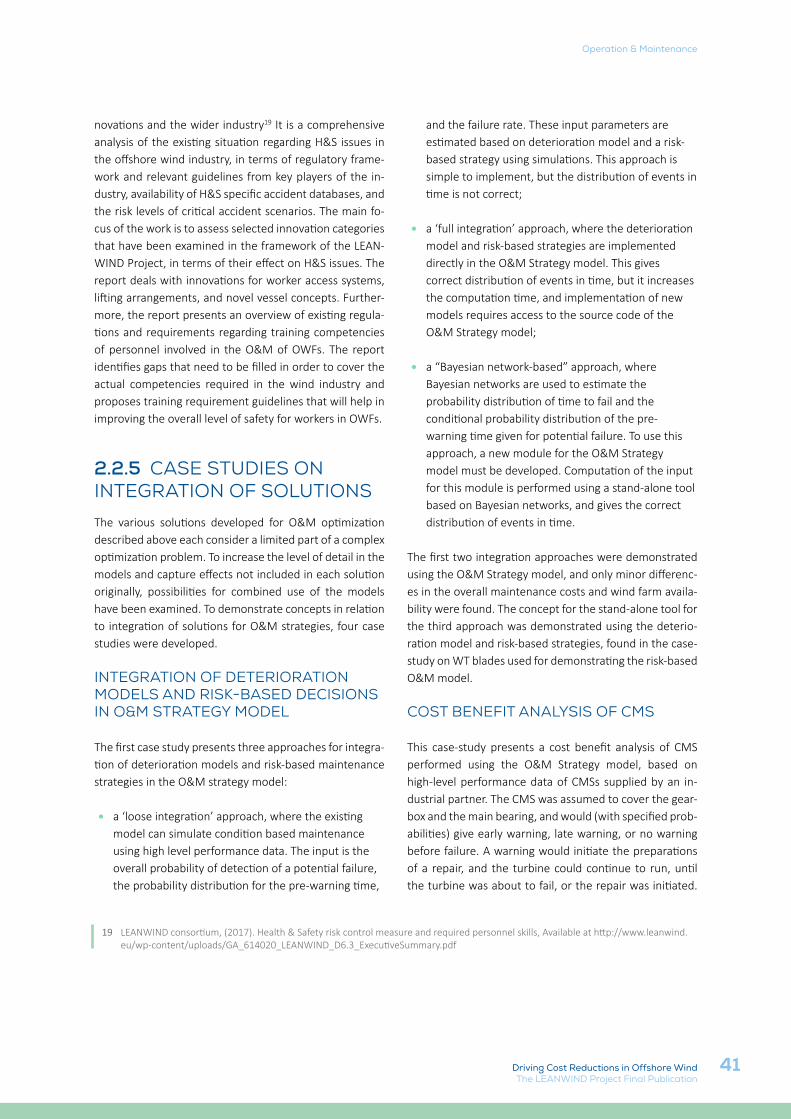
41
Operation & Maintenance
Driving Cost Reductions in Offshore WindThe LEANWIND Project Final Publication
novations and the wider industry19 It is a comprehensive analysis of the existing situation regarding H&S issues in the offshore wind industry, in terms of regulatory frame-work and relevant guidelines from key players of the in-dustry, availability of H&S specific accident databases, and the risk levels of critical accident scenarios. The main fo-cus of the work is to assess selected innovation categories that have been examined in the framework of the LEAN-WIND Project, in terms of their effect on H&S issues. The report deals with innovations for worker access systems, lifting arrangements, and novel vessel concepts. Further-more, the report presents an overview of existing regula-tions and requirements regarding training competencies of personnel involved in the O&M of OWFs. The report identifies gaps that need to be filled in order to cover the actual competencies required in the wind industry and proposes training requirement guidelines that will help in improving the overall level of safety for workers in OWFs.
2.2.5 CASE STUDIES ON INTEGRATION OF SOLUTIONSThe various solutions developed for O&M optimization described above each consider a limited part of a complex optimization problem. To increase the level of detail in the models and capture effects not included in each solution originally, possibilities for combined use of the models have been examined. To demonstrate concepts in relation to integration of solutions for O&M strategies, four case studies were developed.
INTEGRATION OF DETERIORATION MODELS AND RISK-BASED DECISIONS IN O&M STRATEGY MODEL
The first case study presents three approaches for integra-tion of deterioration models and risk-based maintenance strategies in the O&M strategy model:
• a ‘loose integration’ approach, where the existing model can simulate condition based maintenance using high level performance data. The input is the overall probability of detection of a potential failure, the probability distribution for the pre-warning time,
19 LEANWIND consortium, (2017). Health & Safety risk control measure and required personnel skills, Available at http://www.leanwind.eu/wp-content/uploads/GA_614020_LEANWIND_D6.3_ExecutiveSummary.pdf
and the failure rate. These input parameters are estimated based on deterioration model and a risk-based strategy using simulations. This approach is simple to implement, but the distribution of events in time is not correct;
• a ‘full integration’ approach, where the deterioration model and risk-based strategies are implemented directly in the O&M Strategy model. This gives correct distribution of events in time, but it increases the computation time, and implementation of new models requires access to the source code of the O&M Strategy model;
• a “Bayesian network-based” approach, where Bayesian networks are used to estimate the probability distribution of time to fail and the conditional probability distribution of the pre-warning time given for potential failure. To use this approach, a new module for the O&M Strategy model must be developed. Computation of the input for this module is performed using a stand-alone tool based on Bayesian networks, and gives the correct distribution of events in time.
The first two integration approaches were demonstrated using the O&M Strategy model, and only minor differenc-es in the overall maintenance costs and wind farm availa-bility were found. The concept for the stand-alone tool for the third approach was demonstrated using the deterio-ration model and risk-based strategies, found in the case-study on WT blades used for demonstrating the risk-based O&M model.
COST BENEFIT ANALYSIS OF CMS
This case-study presents a cost benefit analysis of CMS performed using the O&M Strategy model, based on high-level performance data of CMSs supplied by an in-dustrial partner. The CMS was assumed to cover the gear-box and the main bearing, and would (with specified prob-abilities) give early warning, late warning, or no warning before failure. A warning would initiate the preparations of a repair, and the turbine could continue to run, until the turbine was about to fail, or the repair was initiated.
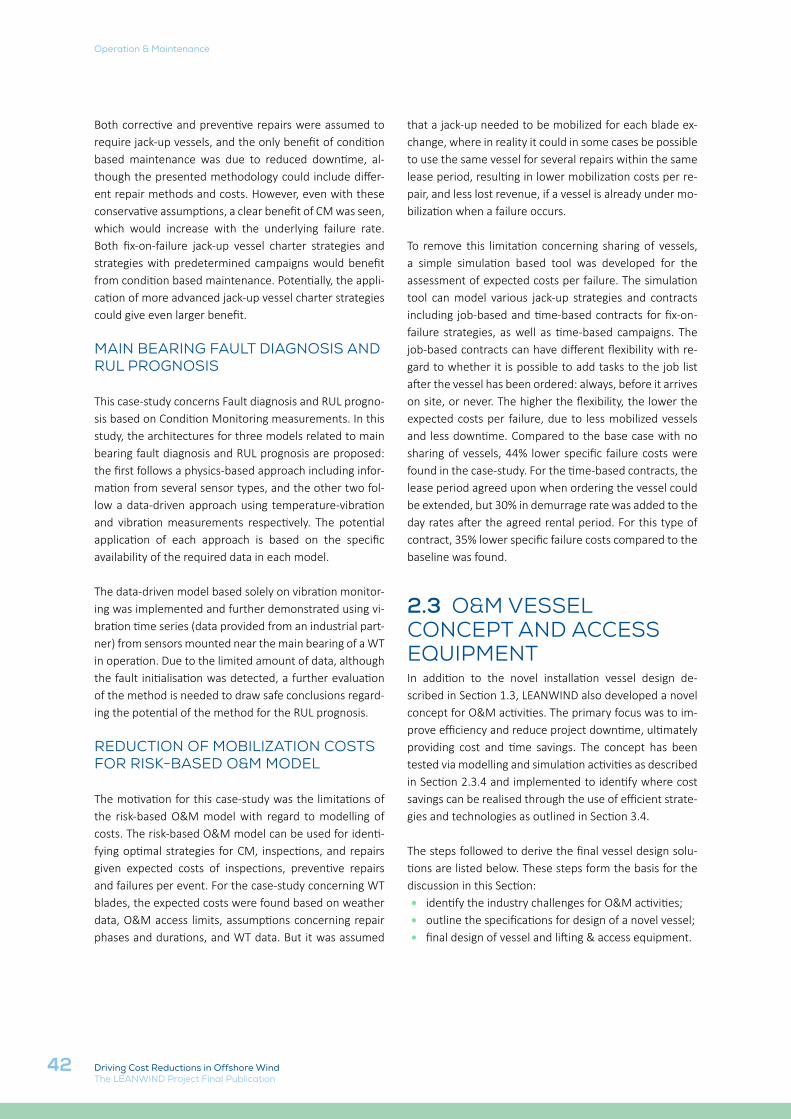
42
Operation & Maintenance
Driving Cost Reductions in Offshore WindThe LEANWIND Project Final Publication
Both corrective and preventive repairs were assumed to require jack-up vessels, and the only benefit of condition based maintenance was due to reduced downtime, al-though the presented methodology could include differ-ent repair methods and costs. However, even with these conservative assumptions, a clear benefit of CM was seen, which would increase with the underlying failure rate. Both fix-on-failure jack-up vessel charter strategies and strategies with predetermined campaigns would benefit from condition based maintenance. Potentially, the appli-cation of more advanced jack-up vessel charter strategies could give even larger benefit.
MAIN BEARING FAULT DIAGNOSIS AND RUL PROGNOSIS
This case-study concerns Fault diagnosis and RUL progno-sis based on Condition Monitoring measurements. In this study, the architectures for three models related to main bearing fault diagnosis and RUL prognosis are proposed: the first follows a physics-based approach including infor-mation from several sensor types, and the other two fol-low a data-driven approach using temperature-vibration and vibration measurements respectively. The potential application of each approach is based on the specific availability of the required data in each model.
The data-driven model based solely on vibration monitor-ing was implemented and further demonstrated using vi-bration time series (data provided from an industrial part-ner) from sensors mounted near the main bearing of a WT in operation. Due to the limited amount of data, although the fault initialisation was detected, a further evaluation of the method is needed to draw safe conclusions regard-ing the potential of the method for the RUL prognosis.
REDUCTION OF MOBILIZATION COSTS FOR RISK-BASED O&M MODEL
The motivation for this case-study was the limitations of the risk-based O&M model with regard to modelling of costs. The risk-based O&M model can be used for identi-fying optimal strategies for CM, inspections, and repairs given expected costs of inspections, preventive repairs and failures per event. For the case-study concerning WT blades, the expected costs were found based on weather data, O&M access limits, assumptions concerning repair phases and durations, and WT data. But it was assumed
that a jack-up needed to be mobilized for each blade ex-change, where in reality it could in some cases be possible to use the same vessel for several repairs within the same lease period, resulting in lower mobilization costs per re-pair, and less lost revenue, if a vessel is already under mo-bilization when a failure occurs.
To remove this limitation concerning sharing of vessels, a simple simulation based tool was developed for the assessment of expected costs per failure. The simulation tool can model various jack-up strategies and contracts including job-based and time-based contracts for fix-on-failure strategies, as well as time-based campaigns. The job-based contracts can have different flexibility with re-gard to whether it is possible to add tasks to the job list after the vessel has been ordered: always, before it arrives on site, or never. The higher the flexibility, the lower the expected costs per failure, due to less mobilized vessels and less downtime. Compared to the base case with no sharing of vessels, 44% lower specific failure costs were found in the case-study. For the time-based contracts, the lease period agreed upon when ordering the vessel could be extended, but 30% in demurrage rate was added to the day rates after the agreed rental period. For this type of contract, 35% lower specific failure costs compared to the baseline was found.
2.3 O&M VESSEL CONCEPT AND ACCESS EQUIPMENT In addition to the novel installation vessel design de-scribed in Section 1.3, LEANWIND also developed a novel concept for O&M activities. The primary focus was to im-prove efficiency and reduce project downtime, ultimately providing cost and time savings. The concept has been tested via modelling and simulation activities as described in Section 2.3.4 and implemented to identify where cost savings can be realised through the use of efficient strate-gies and technologies as outlined in Section 3.4.
The steps followed to derive the final vessel design solu-tions are listed below. These steps form the basis for the discussion in this Section:• identify the industry challenges for O&M activities;• outline the specifications for design of a novel vessel;• final design of vessel and lifting & access equipment.
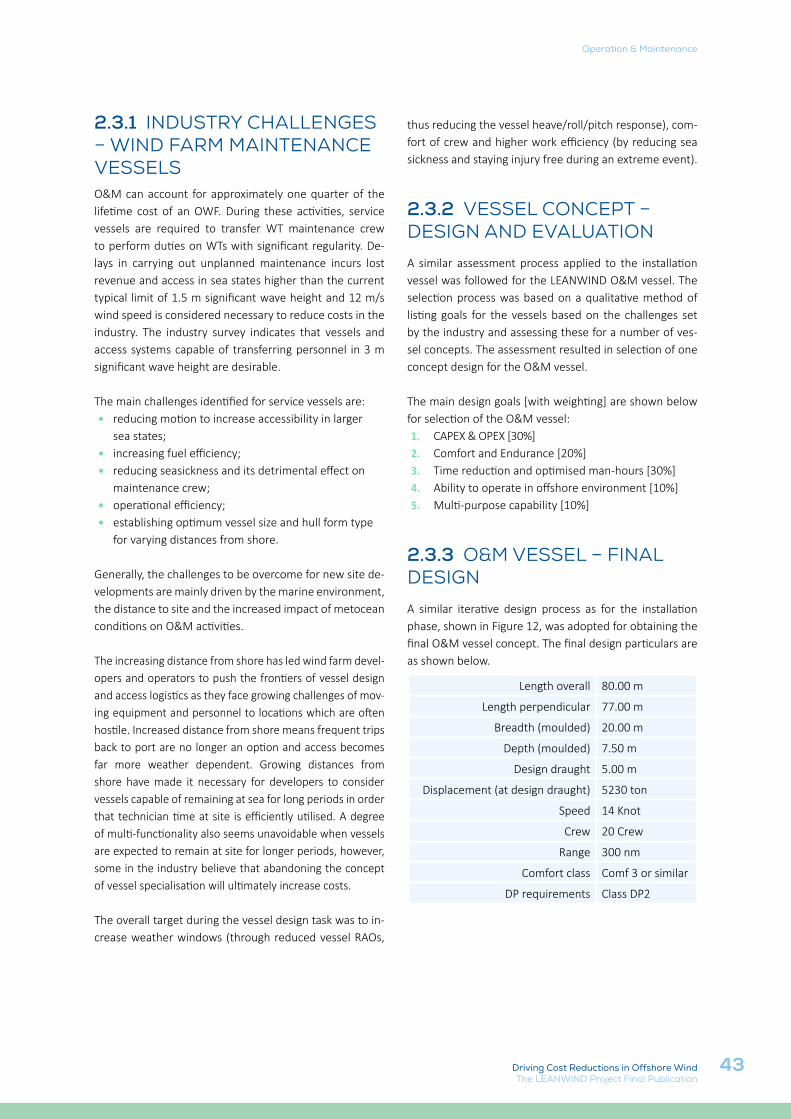
43
Operation & Maintenance
Driving Cost Reductions in Offshore WindThe LEANWIND Project Final Publication
2.3.1 INDUSTRY CHALLENGES – WIND FARM MAINTENANCE VESSELSO&M can account for approximately one quarter of the lifetime cost of an OWF. During these activities, service vessels are required to transfer WT maintenance crew to perform duties on WTs with significant regularity. De-lays in carrying out unplanned maintenance incurs lost revenue and access in sea states higher than the current typical limit of 1.5 m significant wave height and 12 m/s wind speed is considered necessary to reduce costs in the industry. The industry survey indicates that vessels and access systems capable of transferring personnel in 3 m significant wave height are desirable.
The main challenges identified for service vessels are:• reducing motion to increase accessibility in larger
sea states;• increasing fuel efficiency;• reducing seasickness and its detrimental effect on
maintenance crew;• operational efficiency;• establishing optimum vessel size and hull form type
for varying distances from shore.
Generally, the challenges to be overcome for new site de-velopments are mainly driven by the marine environment, the distance to site and the increased impact of metocean conditions on O&M activities.
The increasing distance from shore has led wind farm devel-opers and operators to push the frontiers of vessel design and access logistics as they face growing challenges of mov-ing equipment and personnel to locations which are often hostile. Increased distance from shore means frequent trips back to port are no longer an option and access becomes far more weather dependent. Growing distances from shore have made it necessary for developers to consider vessels capable of remaining at sea for long periods in order that technician time at site is efficiently utilised. A degree of multi-functionality also seems unavoidable when vessels are expected to remain at site for longer periods, however, some in the industry believe that abandoning the concept of vessel specialisation will ultimately increase costs.
The overall target during the vessel design task was to in-crease weather windows (through reduced vessel RAOs,
thus reducing the vessel heave/roll/pitch response), com-fort of crew and higher work efficiency (by reducing sea sickness and staying injury free during an extreme event).
2.3.2 VESSEL CONCEPT – DESIGN AND EVALUATIONA similar assessment process applied to the installation vessel was followed for the LEANWIND O&M vessel. The selection process was based on a qualitative method of listing goals for the vessels based on the challenges set by the industry and assessing these for a number of ves-sel concepts. The assessment resulted in selection of one concept design for the O&M vessel.
The main design goals [with weighting] are shown below for selection of the O&M vessel:1. CAPEX & OPEX [30%]2. Comfort and Endurance [20%]3. Time reduction and optimised man-hours [30%]4. Ability to operate in offshore environment [10%]5. Multi-purpose capability [10%]
2.3.3 O&M VESSEL – FINAL DESIGNA similar iterative design process as for the installation phase, shown in Figure 12, was adopted for obtaining the final O&M vessel concept. The final design particulars are as shown below.
Length overall 80.00 m
Length perpendicular 77.00 m
Breadth (moulded) 20.00 m
Depth (moulded) 7.50 m
Design draught 5.00 m
Displacement (at design draught) 5230 ton
Speed 14 Knot
Crew 20 Crew
Range 300 nm
Comfort class Comf 3 or similar
DP requirements Class DP2
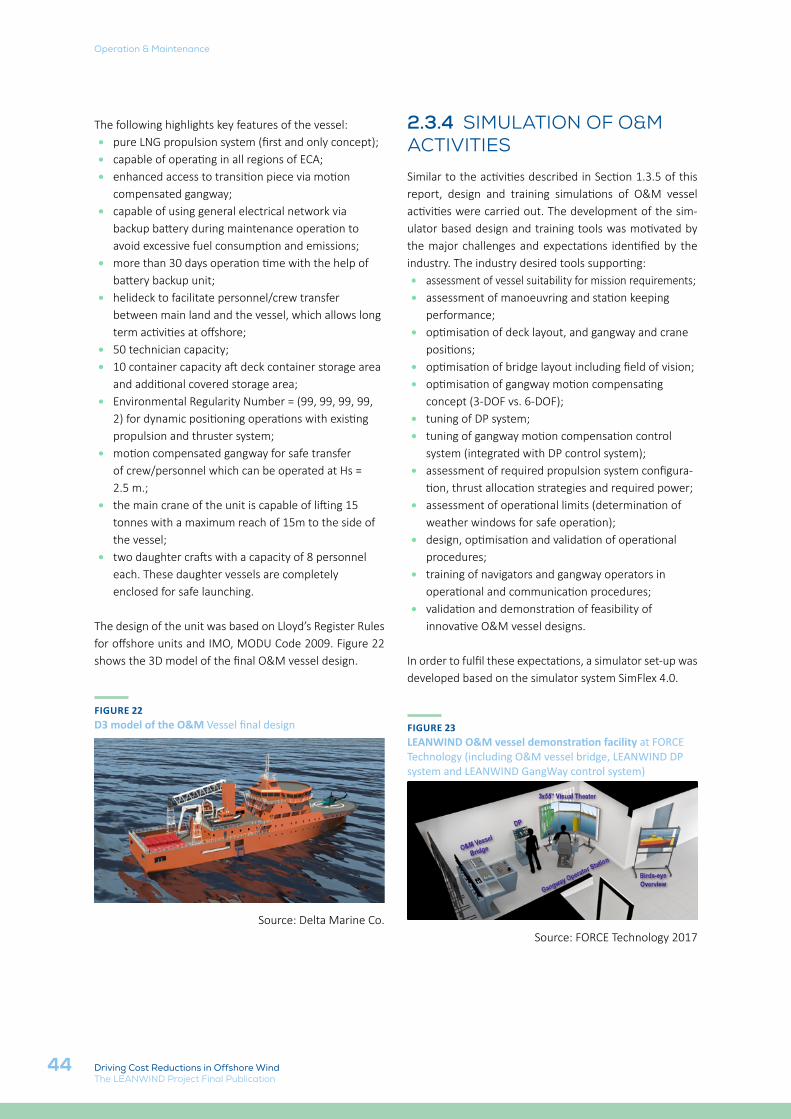
44
Operation & Maintenance
Driving Cost Reductions in Offshore WindThe LEANWIND Project Final Publication
The following highlights key features of the vessel:• pure LNG propulsion system (first and only concept);• capable of operating in all regions of ECA;• enhanced access to transition piece via motion
compensated gangway;• capable of using general electrical network via
backup battery during maintenance operation to avoid excessive fuel consumption and emissions;
• more than 30 days operation time with the help of battery backup unit;
• helideck to facilitate personnel/crew transfer between main land and the vessel, which allows long term activities at offshore;
• 50 technician capacity;• 10 container capacity aft deck container storage area
and additional covered storage area;• Environmental Regularity Number = (99, 99, 99, 99,
2) for dynamic positioning operations with existing propulsion and thruster system;
• motion compensated gangway for safe transfer of crew/personnel which can be operated at Hs = 2.5 m.;
• the main crane of the unit is capable of lifting 15 tonnes with a maximum reach of 15m to the side of the vessel;
• two daughter crafts with a capacity of 8 personnel each. These daughter vessels are completely enclosed for safe launching.
The design of the unit was based on Lloyd’s Register Rules for offshore units and IMO, MODU Code 2009. Figure 22 shows the 3D model of the final O&M vessel design.
FIGURE 22D3 model of the O&M Vessel final design
Source: Delta Marine Co.
2.3.4 SIMULATION OF O&M ACTIVITIES Similar to the activities described in Section 1.3.5 of this report, design and training simulations of O&M vessel activities were carried out. The development of the sim-ulator based design and training tools was motivated by the major challenges and expectations identified by the industry. The industry desired tools supporting:• assessment of vessel suitability for mission requirements;• assessment of manoeuvring and station keeping
performance;• optimisation of deck layout, and gangway and crane
positions;• optimisation of bridge layout including field of vision;• optimisation of gangway motion compensating
concept (3-DOF vs. 6-DOF);• tuning of DP system;• tuning of gangway motion compensation control
system (integrated with DP control system);• assessment of required propulsion system configura-
tion, thrust allocation strategies and required power;• assessment of operational limits (determination of
weather windows for safe operation);• design, optimisation and validation of operational
procedures;• training of navigators and gangway operators in
operational and communication procedures;• validation and demonstration of feasibility of
innovative O&M vessel designs.
In order to fulfil these expectations, a simulator set-up was developed based on the simulator system SimFlex 4.0.
FIGURE 23LEANWIND O&M vessel demonstration facility at FORCE Technology (including O&M vessel bridge, LEANWIND DP system and LEANWIND GangWay control system)
Source: FORCE Technology 2017
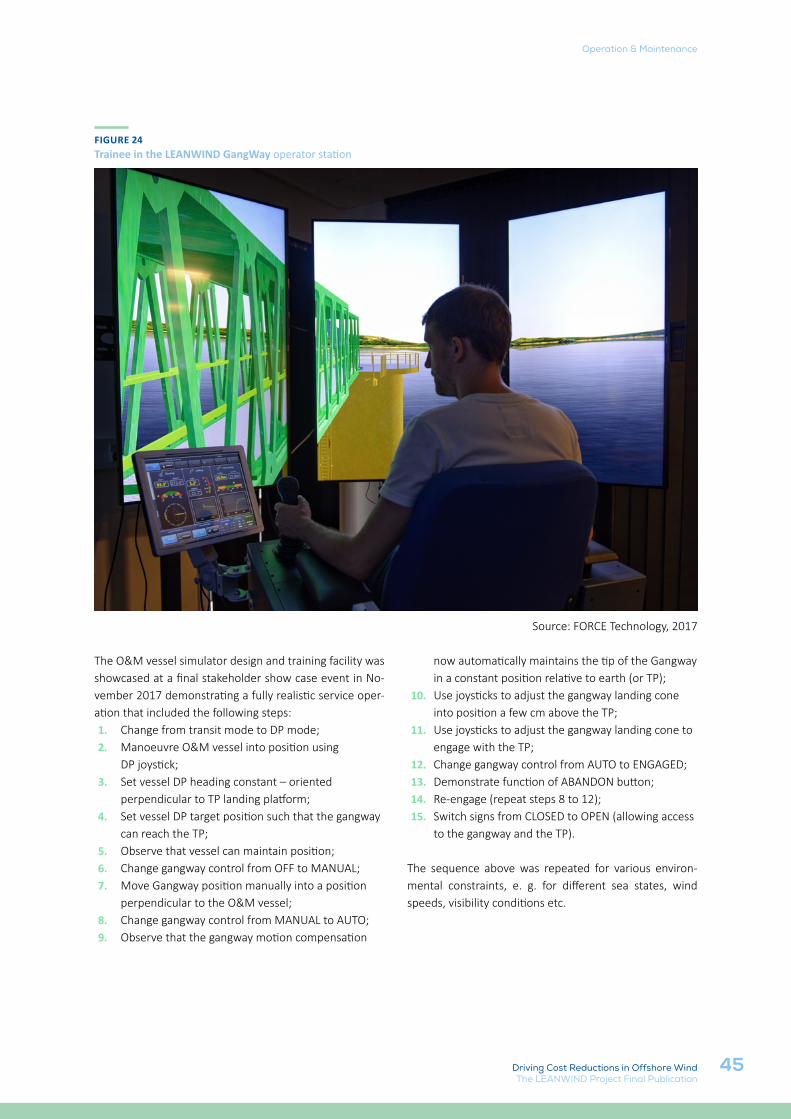
45
Operation & Maintenance
Driving Cost Reductions in Offshore WindThe LEANWIND Project Final Publication
FIGURE 24Trainee in the LEANWIND GangWay operator station
Source: FORCE Technology, 2017
The O&M vessel simulator design and training facility was showcased at a final stakeholder show case event in No-vember 2017 demonstrating a fully realistic service oper-ation that included the following steps:1. Change from transit mode to DP mode;2. Manoeuvre O&M vessel into position using
DP joystick;3. Set vessel DP heading constant – oriented
perpendicular to TP landing platform;4. Set vessel DP target position such that the gangway
can reach the TP;5. Observe that vessel can maintain position;6. Change gangway control from OFF to MANUAL;7. Move Gangway position manually into a position
perpendicular to the O&M vessel;8. Change gangway control from MANUAL to AUTO;9. Observe that the gangway motion compensation
now automatically maintains the tip of the Gangway in a constant position relative to earth (or TP);
10. Use joysticks to adjust the gangway landing cone into position a few cm above the TP;
11. Use joysticks to adjust the gangway landing cone to engage with the TP;
12. Change gangway control from AUTO to ENGAGED;13. Demonstrate function of ABANDON button;14. Re-engage (repeat steps 8 to 12);15. Switch signs from CLOSED to OPEN (allowing access
to the gangway and the TP).
The sequence above was repeated for various environ-mental constraints, e. g. for different sea states, wind speeds, visibility conditions etc.
46 Driving Cost Reductions in Offshore WindThe LEANWIND Project Final Publication
A core activity of LEANWIND has been developing a life-cycle financial cost model to:
• provide a state-of-the-art tool that can examine operations in detail and particularly from a financial perspective, helping reduce costs by fostering efficient decision-making at the Front End Engineering Design (FEED) project stage;
• improve existing and develop alternative strategies for installation, O&M and decommissioning at repre-sentative current, mid-term and future-term sites;
• consider the added value of project innovations e.g. novel substructure and vessel designs.
One of the key LEAN principles is to approach improve-ments from a whole system perspective and an optimised supply-chain is an important factor in decreasing the costs of offshore wind energy. BVG Associates estimate that im-proving the supply-chain could contribute to a 9% reduc-tion in LCOE.20 Therefore, LEANWIND has also developed a holistic set of supply-chain optimisation models to de-termine the best arrangements across the project phases.
20 G. Hundleby, (November 2016). The supply-chain’ s role in LCOE reduction.
This Section summarises the logistic and financial models, presenting how they can be effectively used independent-ly or as a combined set of tools to produce an efficient and cost-optimal plan for a specific site and wind farm scenario. It also highlights the benefits of the models to the various sets of potential end-users.
3.1 OFFSHORE WIND LOGISTICS CHALLENGES AND SOLUTIONS Typically, logistics planning activities are currently based on manual or basic numerical modelling. Ambitious plans to construct a large number of OWFs have created a need for decision support software to identify cost optimal solutions. For this reason, a substantial focus of LEAN-WIND was the area of Integrated Logistics. By defining the design constraints and functional requirements with-in a holistic framework, it is possible to optimise logistics through a set of innovative optimisation tools developed in the project. The following subsections summarise the challenges and LEANWIND logistics tools developed to address each stage of the supply-chain.
3.LOGISTICS & SUPPLY-CHAIN
47
Logistics & supply-chain
Driving Cost Reductions in Offshore WindThe LEANWIND Project Final Publication
3.1.1 PORT SELECTION & LAYOUT In the global sea trade environment, the most common role for a port is to support the delivery and shipment of cargo. However, with the emergence of offshore wind energy, this role has been extended and ports, alongside their traditional functions, now act as the onshore stag-ing base. This role is likely to increase in prevalence given Europe’s 2020 targets for delivering 40 GW of electricity through offshore wind power.
As the industry moves to larger WTs, ports will require big-ger lay-down areas and specialised heavy lift equipment. This poses unique technical challenges and requires effi-cient design of ports and infrastructure to streamline the unloading, storage, assembly and loading of components prior to offshore installation. It is important to carefully ar-range the layouts to minimise component transportation in order to reduce costs.
During LEANWIND, information was gathered to define the technical requirements of ports from several offshore wind energy stakeholders. This included ports already in-volved in the industry and ports under development with manufacturing facilities planned as part of the overall port capability. Discussions identified the most important criteria to support OWF logistics. Secondary sources and industry examples were examined to clarify each criterion and to investigate the implications on port design. Based on this process, the most critical technical requirements for a port to efficiently support offshore wind energy in-dustry are:
• availability of component manufacturing/assembly facilities in order to reduce the time, cost and risks associated with the transportation of large WT components;
• suitable layout arrangement to facilitate the accommodation of the components;
• ability to accommodate large installation vessels;
• availability of component handling facilities, including heavy cranes, lift on-lift off (Lo-Lo) and Roll on-Roll off (Ro-Ro) facilities, Self-propelled Modular Transporter (SPMT)s, Pontoons, etc. to help with the
swift manoeuvring of the components and efficient loading and unloading;
• location of the port and its distance from the wind farm, the component suppliers, and road networks which can influence the component transportation’s time and cost;
• security and H&S measures in the ports.
PORT SELECTION TOOL
An Analytical Hierarchy Process (AHP) based deci-sion-making model was proposed to aid stakeholders in selecting the most suitable base for an OWF at a particular phase of its life-cycle based on the following port suitabil-ity criteria group:
• port’s physical characteristics: Including the seabed suitability, quay length, port depth, quay load bearing capacity, and component handling capabilities;
• port’s connectivity: Including distance to wind farm and key component suppliers as well as the road networks and heliports;
• port layout: Including the storage area, component fabrication facility, components repair facilities and component recycling facilities.
This decision-making model has two applications. The first revealed the most important characteristics in the port for each phase of the OWF development. For the installation and decommissioning phases, the port’s physical charac-teristics were the determining factor for decision makers. The ports’ connectivity and layout come second and third in terms of importance. For the O&M phase, the model showed that the ports’ connectivity is the major decid-ing factor in selecting a port. The port’s physical charac-teristics and layout come second and third respectively. The second application of the model was to compare the suitability of a number of ports for a given wind farm us-ing the criteria group mentioned above. A suitability score was given to each and the port with the highest score is suggested as the most suitable option.
48
Logistics & supply-chain
Driving Cost Reductions in Offshore WindThe LEANWIND Project Final Publication
This model was applied to the LEANWIND Design Case site 1 (Table 1). This found that a trade-off is necessary between port costs and distance, when cost is a priority. Therefore, the most suitable port may not be the best op-tion for decision makers. In this way, the model serves as a managerial tool, tackling strategic challenges. The full study is available on the LEANWIND website and is among the first studies that has systematically assessed the port requirements for the offshore wind industry.21
This model was further developed to include a port lay-out optimisation model for the installation phase. Opti-mising port layout is not unique to the offshore wind in-dustry and the containerisation of cargo has immensely assisted port managers in maximising the use of available space for cargo handling. However, the size and variable dimensions of the WT components require a different ap-proach since:
a. unlike the container ports, where there are several equal areas i.e. zones, in which the containers are stacked, these areas may not be equal in an offshore wind port since the components vary significantly in their size; and
b. while the area in most container ports has a regular shape, this might not be the case as different usage areas need to be accommodated in ports for offshore wind, leading to irregularities.
As well as optimising for space, this model arranges com-ponents to minimise transportation distance between dif-ferent areas, thereby reducing costs. This tool was applied to the layout of the Port of Arderiser, a real-case potential offshore wind port in Scotland, UK.
3.1.2 PRIOR TO PORT
The term prior to port includes all activities that occur up to the parts arriving at the offshore wind support port. Present trends show that WT manufacturers, especially for bigger components such as blades and nacelle assem-bly, are considering building new manufacturing and as-sembly facilities in coastal locations with waterside access.
21 LEANWIND consortium, (2015). Ports suitability assessment for offshore wind development - Case studies report. Available at http://www.leanwind.eu/wp-content/uploads/GA_614020_LEANWIND_D5.3V3.pdf
This is due to the fact that transportation of the heavier and larger components on public road is impractical due to the increasing sizes and weights of these main turbine components. However, manufacturing of many large and heavy components, such as the forging or casting of parts, still rests with industry located far from shore. There-fore, on-land transportation still constitutes an important phase in the material flow process in the supply-chain and must be considered in project planning and execution. Logistic planning must be prepared to face transportation costs and challenges due to overland transport and pro-pose answers on how to reduce costs.
The following approach has been used to assess the prior to port phase in the LEANWIND project:
1. Analysis of current European resources: in order to understand the transportation requirements for the various components involved; data on the locations of component manufacturing sites, the transport networks and the potential ports were gathered together and presented in a form that will allow further interrogation for the analysis of costs and optimal pathways.
2. GIS data development: since the information concerned is a collection of spatial data, a GIS is the preferred solution for collating and visualisation. An open-source GIS software package called QGIS was chosen as the method for presenting the database of European resources, as it is widely available, simple to download and use, and has a configurable back-end through which bespoke tools could be created for the LEANWIND project.
The GIS tool includes the three key datasets mentioned: manufacturing locations for the various components of an OWF, the locations of suitable ports for deployment of OWTs and the main transportation networks that link these two sets of points.
Two additional tools have been developed using the GIS software to facilitate specific interactions with the data-base, namely the identification of ports with suitable in-frastructure for particular applications, and the plotting of
49
Logistics & supply-chain
Driving Cost Reductions in Offshore WindThe LEANWIND Project Final Publication
transport routes and extraction of information regarding travel distances.
Regarding ports, the attributes include: measurement parameters, such as depth, entrance width, (which refer to the specific physical measurements of the port itself) draft and beam (referring to the maximum dimensions of vessels); the availability of local transport facilities, such as distances to airports, helipads and the nearest major road links; the physical infrastructure at the port, such as number of cranes, quay length and capacity, storage and development potential; and finally comments on suita-bility for installation, O&M, handling of specific WT com-ponents and availability of facilities such as a dry dock, water and other services. All of these attributes can be independently queried via the QGIS software.
3. Analysis of the on-land transportation segments of the supply-chain along with the identification and the analysis of their limitations. Moreover, the opportunities that will help to increase the efficiency of the logistics operations, leading to a flexible and optimized supply-chain network, are also identified.
It has been found that on-land transportation restrictions are diverse from lack of harmonization of road transport regulations, even within Europe; to physical limitations due to infrastructure capacity; or physical obstacles and lack of suitable number or capacity of transport equip-ment. Heavy and oversized OWT components; along with the increasing sizes and weights of new turbine designs; and the increasing number of wind farms being con-structed simultaneously at European level, are stretching the road transport sector capacities. Therefore, a holis-tic approach is needed to remove wastage and improve efficiency and successfully face the new challenges and demand of the wind energy supply-chain. The LEANWIND logistics tools address this need.
ApplicationThe GIS tool has been applied to allow the selection of a suitable port for the industrial implementation of self-buoyant GBFs. The aim is to assess the existing in-
22 Akbari, Negar, Azadeh Attari, Lucy Cradden and Paul Doherty, (2015). A GIS-based approach for port selection and bottleneck identifica-tion for the deployment of Self-Buoyant Gravity Based Foundations, EWEA Paris conference.
23 LEANWIND consortium, (2016). Mathematical optimisation models and methods for transport systems. Confidential Report, Executive Summary available at http://www.leanwind.eu/wp-content/uploads/LEANWIND-D5-6-Exe-Summary-Final.pdf
frastructure and the improvements required. The study concludes that port depth, the availability of heavy load quays and large storage arrays could be bottlenecks to the manufacturing of these foundations.22 This study is also a key illustration of the importance of taking a whole sys-tem perspective to achieve cost-reductions and the inter-action required between technological developments and the associated logistics.
3.1.3 PORT TO SITE/SITE TO PORTFor the port to site leg of the offshore wind supply-chain, vessel resources were identified as the most expensive components both for the installation and O&M phase. This is a complex problem and beyond the human capac-ity to evaluate the number of possibilities in order to find the optimal cost efficient solution.
To reduce cost, innovative optimization-based decision support tools were developed for both the installation and O&M phases. A literature survey shows that only a few studies exist of the logistic challenges related to the maritime supply-chain for the installation phase. These mainly consider the installation scheduling problem but no studies were found that explicitly study the resource management problem. The LEANWIND project developed the Installation Vessel Optimizer (LIVO) for this purpose and Figure 25 illustrates the key inputs and outputs. A computational study illustrates how the model can be used to provide decision support with respect to which vessel resources and installation port that are preferred for LEANWIND Design Case 1 (Table 1).23
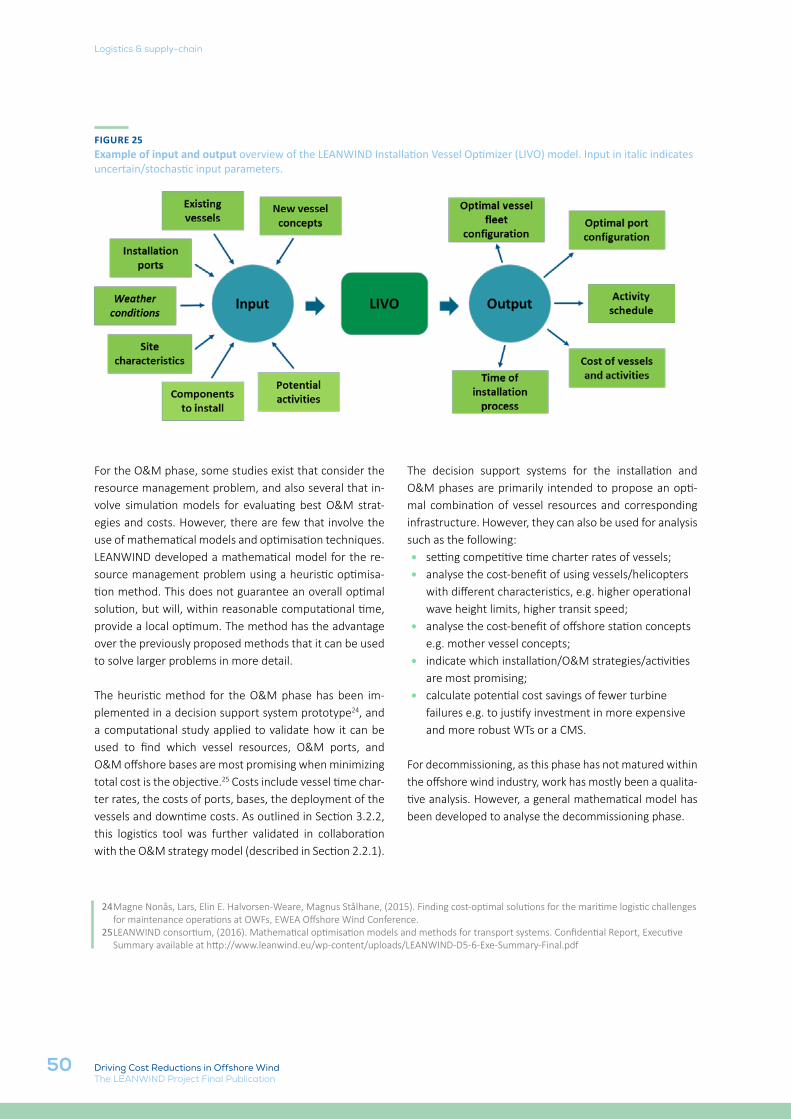
50
Logistics & supply-chain
Driving Cost Reductions in Offshore WindThe LEANWIND Project Final Publication
FIGURE 25 Example of input and output overview of the LEANWIND Installation Vessel Optimizer (LIVO) model. Input in italic indicates uncertain/stochastic input parameters.
24 Magne Nonås, Lars, Elin E. Halvorsen-Weare, Magnus Stålhane, (2015). Finding cost-optimal solutions for the maritime logistic challenges for maintenance operations at OWFs, EWEA Offshore Wind Conference.
25 LEANWIND consortium, (2016). Mathematical optimisation models and methods for transport systems. Confidential Report, Executive Summary available at http://www.leanwind.eu/wp-content/uploads/LEANWIND-D5-6-Exe-Summary-Final.pdf
For the O&M phase, some studies exist that consider the resource management problem, and also several that in-volve simulation models for evaluating best O&M strat-egies and costs. However, there are few that involve the use of mathematical models and optimisation techniques. LEANWIND developed a mathematical model for the re-source management problem using a heuristic optimisa-tion method. This does not guarantee an overall optimal solution, but will, within reasonable computational time, provide a local optimum. The method has the advantage over the previously proposed methods that it can be used to solve larger problems in more detail.
The heuristic method for the O&M phase has been im-plemented in a decision support system prototype24, and a computational study applied to validate how it can be used to find which vessel resources, O&M ports, and O&M offshore bases are most promising when minimizing total cost is the objective.25 Costs include vessel time char-ter rates, the costs of ports, bases, the deployment of the vessels and downtime costs. As outlined in Section 3.2.2, this logistics tool was further validated in collaboration with the O&M strategy model (described in Section 2.2.1).
The decision support systems for the installation and O&M phases are primarily intended to propose an opti-mal combination of vessel resources and corresponding infrastructure. However, they can also be used for analysis such as the following:• setting competitive time charter rates of vessels;• analyse the cost-benefit of using vessels/helicopters
with different characteristics, e.g. higher operational wave height limits, higher transit speed;
• analyse the cost-benefit of offshore station concepts e.g. mother vessel concepts;
• indicate which installation/O&M strategies/activities are most promising;
• calculate potential cost savings of fewer turbine failures e.g. to justify investment in more expensive and more robust WTs or a CMS.
For decommissioning, as this phase has not matured within the offshore wind industry, work has mostly been a qualita-tive analysis. However, a general mathematical model has been developed to analyse the decommissioning phase.
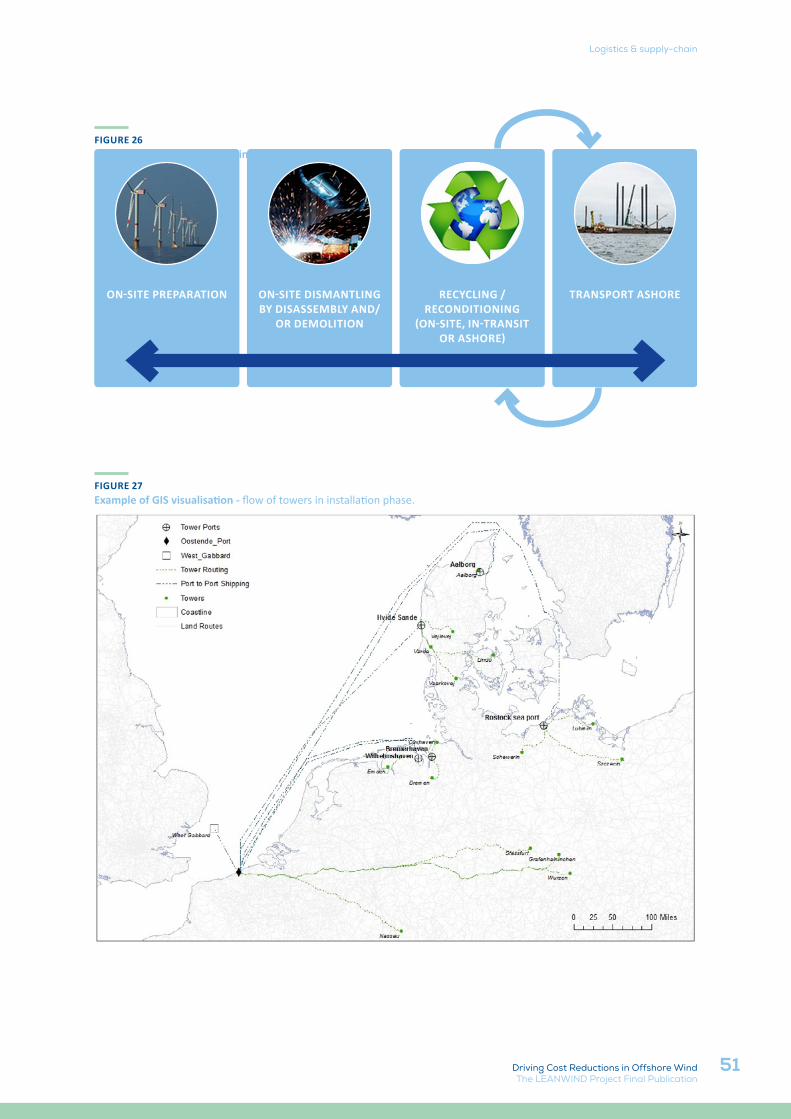
51
Logistics & supply-chain
Driving Cost Reductions in Offshore WindThe LEANWIND Project Final Publication
FIGURE 26 Decommissioning phase of wind farms
On-site Preparation
On-site Dismantling by
Disassembly and/or
Demolition
Recycling /Reconditioning
(on-site, in-transit or ashore)
Transport Ashore
ON-SITE PREPARATION
On-site Preparation
On-site Dismantling by
Disassembly and/or
Demolition
Recycling /Reconditioning
(on-site, in-transit or ashore)
Transport Ashore
ON-SITE DISMANTLING BY DISASSEMBLY AND/
OR DEMOLITION
On-site Preparation
On-site Dismantling by
Disassembly and/or
Demolition
Recycling /Reconditioning
(on-site, in-transit or ashore)
Transport Ashore
RECYCLING /RECONDITIONING
(ON-SITE, IN-TRANSIT OR ASHORE)
On-site Preparation
On-site Dismantling by
Disassembly and/or
Demolition
Recycling /Reconditioning
(on-site, in-transit or ashore)
Transport Ashore
TRANSPORT ASHORE
FIGURE 27 Example of GIS visualisation - flow of towers in installation phase.
52
Logistics & supply-chain
Driving Cost Reductions in Offshore WindThe LEANWIND Project Final Publication
3.1.4 HOLISTIC USE OF LOGISTIC MODELS & POTENTIAL END USERS The above described tools provide a holistic OWF sup-ply-chain framework, addressing the stages prior to port; at port; port to site; and site to port for installation, O&M and decommissioning activities. The aim is to support the development of a streamlined and lean supply-chain through all life-cycle phases.
The integrated framework has been tested on the LEAN-WIND Design Case site 1 (Table 1).26 The GIS interface captures the key supply-chain information and plays a key role in assisting the users to visualise the supply-chain solutions.
An example of the GIS visualisation is given by Figure 27, which represents part of the solution generated by the Prior-to-Port installation phase model regarding the op-timal transport of tower components from their manu-facturers by land and sea through to the Port of Ostend in Belgium. This port was suggested as the most suita-ble for this case-study by the Port selection installation phase model.
The following generic offshore wind stakeholders have been identified as potential users of the framework:
• Tier 1 Manufacturers: who could use the framework to guide their manufacturing location policy, guide their supply-chain configurations, and determine the benefits and drawbacks of using a single integrated supply-chain to serve multiple wind farms as opposed to multiple separate supply-chains.
• Operators: who could use the complete set of models to plan their supply-chains and provide estimates of logistics costs before embarking on a new wind farm venture. Alternatively, they could use the models from a single life phase or a single model to re-optimise part or all of their supply-chain when circumstances change during the life-cycle of the wind farm.
26 LEANWIND consortium, (2016). Holistic supply-chain optimisation model. Confidential Report, Executive Summary available at http://www.leanwind.eu/wp-content/uploads/GA614020_LEANWIND_D5.7_Executive_Summary.pdf
• Lower Tier supply-chain Companies: who could use one or more of the models to provide a specific solution to the wind farm activities that they are involved in.
• Port operators: who could use the models to determine and optimise their offering to the offshore wind industry, including the optimisation of their port layout.
• Governmental Authorities: who could use the framework to determine the likely shape and nature of the evolving offshore wind supply-chain in their jurisdiction and hence formulate their plans and policies accordingly.
• Other Maritime Stakeholders: who could use the framework to understand the predicted logistics activities associated with an OWF and hence make mitigation or enhancement plans accordingly.
3.2 FINANCIAL COST MODEL The ability to assess costs is key to identifying potential savings. A financial model has been developed in LEAN-WIND that can be used to assess a project costs and op-erations strategy; help identify potential areas for cost and time savings; and provide input in FEED stage deci-sion-making. A review of existing technology showed that there are no models that could be employed for these purposes in the detail and scope required for a whole-sys-tem and full life-cycle evaluation.
The financial model comprises a central input/output file (Excel) which links three independent modules (MATLAB) that simulate installation, O&M and decommissioning activities (Figure 28). These phase modules allow for a detailed assessment of strategies and technologies. They produce a project timeline as well as a comprehensive breakdown of CAPEX, OPEX and DECEX (decommission-ing) costs, which are used to determine key financial indi-cators including LCOE, Net Present Value (NPV) and Inter-nal Rate of Return (IRR).
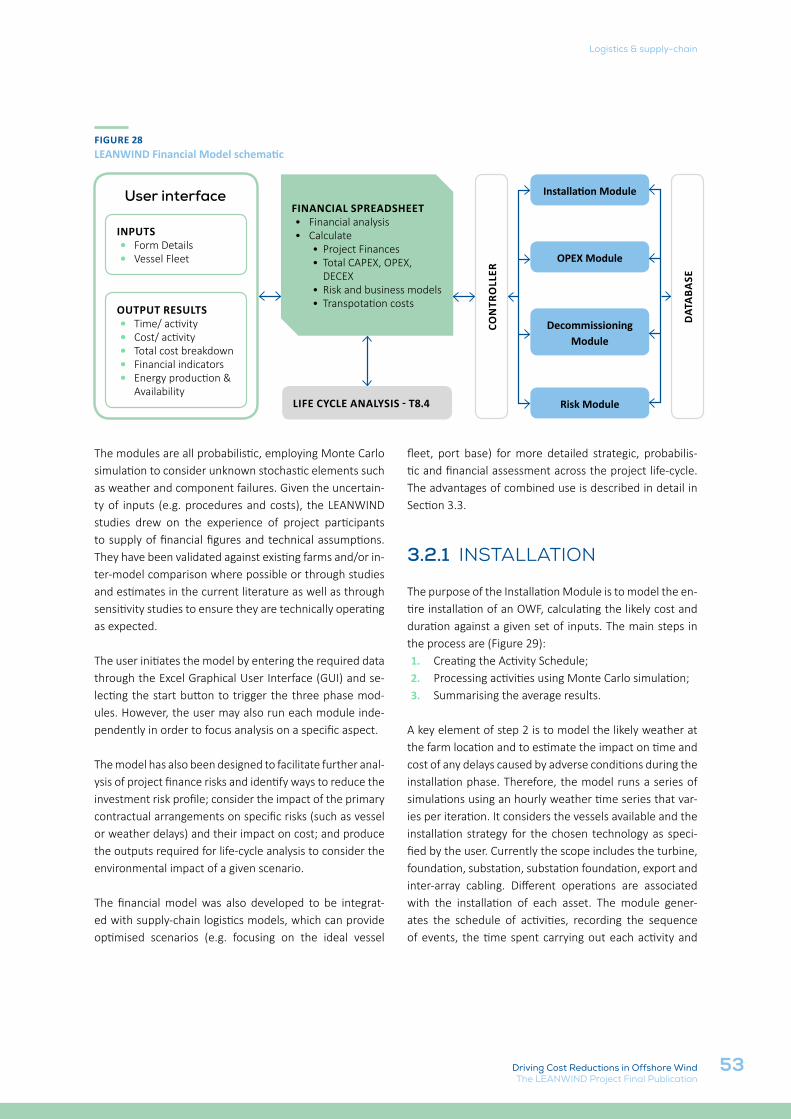
53
Logistics & supply-chain
Driving Cost Reductions in Offshore WindThe LEANWIND Project Final Publication
FIGURE 28 LEANWIND Financial Model schematic
User interface
INPUTS• Form Details• Vessel Fleet
OUTPUT RESULTS• Time/ activity• Cost/ activity• Total cost breakdown• Financial indicators• Energy production &
Availability
FINANCIAL SPREADSHEET• Financial analysis• Calculate
• Project Finances• Total CAPEX, OPEX,
DECEX• Risk and business models• Transpotation costs
LIFE CYCLE ANALYSIS - T8.4
CON
TRO
LLER
Installation Module
OPEX Module
Decommissioning Module
Risk Module
DAT
ABA
SE
The modules are all probabilistic, employing Monte Carlo simulation to consider unknown stochastic elements such as weather and component failures. Given the uncertain-ty of inputs (e.g. procedures and costs), the LEANWIND studies drew on the experience of project participants to supply of financial figures and technical assumptions. They have been validated against existing farms and/or in-ter-model comparison where possible or through studies and estimates in the current literature as well as through sensitivity studies to ensure they are technically operating as expected.
The user initiates the model by entering the required data through the Excel Graphical User Interface (GUI) and se-lecting the start button to trigger the three phase mod-ules. However, the user may also run each module inde-pendently in order to focus analysis on a specific aspect.
The model has also been designed to facilitate further anal-ysis of project finance risks and identify ways to reduce the investment risk profile; consider the impact of the primary contractual arrangements on specific risks (such as vessel or weather delays) and their impact on cost; and produce the outputs required for life-cycle analysis to consider the environmental impact of a given scenario.
The financial model was also developed to be integrat-ed with supply-chain logistics models, which can provide optimised scenarios (e.g. focusing on the ideal vessel
fleet, port base) for more detailed strategic, probabilis-tic and financial assessment across the project life-cycle. The advantages of combined use is described in detail in Section 3.3.
3.2.1 INSTALLATION
The purpose of the Installation Module is to model the en-tire installation of an OWF, calculating the likely cost and duration against a given set of inputs. The main steps in the process are (Figure 29): 1. Creating the Activity Schedule;2. Processing activities using Monte Carlo simulation;3. Summarising the average results.
A key element of step 2 is to model the likely weather at the farm location and to estimate the impact on time and cost of any delays caused by adverse conditions during the installation phase. Therefore, the model runs a series of simulations using an hourly weather time series that var-ies per iteration. It considers the vessels available and the installation strategy for the chosen technology as speci-fied by the user. Currently the scope includes the turbine, foundation, substation, substation foundation, export and inter-array cabling. Different operations are associated with the installation of each asset. The module gener-ates the schedule of activities, recording the sequence of events, the time spent carrying out each activity and
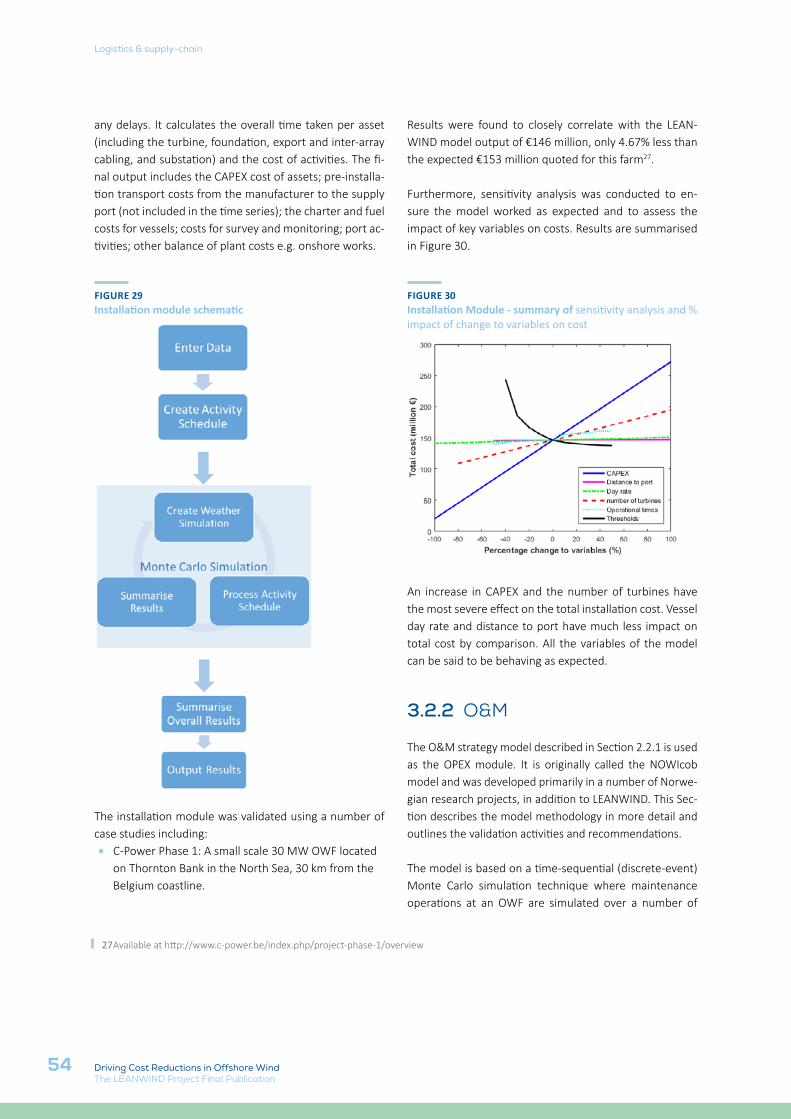
54
Logistics & supply-chain
Driving Cost Reductions in Offshore WindThe LEANWIND Project Final Publication
any delays. It calculates the overall time taken per asset (including the turbine, foundation, export and inter-array cabling, and substation) and the cost of activities. The fi-nal output includes the CAPEX cost of assets; pre-installa-tion transport costs from the manufacturer to the supply port (not included in the time series); the charter and fuel costs for vessels; costs for survey and monitoring; port ac-tivities; other balance of plant costs e.g. onshore works.
FIGURE 29 Installation module schematic
The installation module was validated using a number of case studies including:• C-Power Phase 1: A small scale 30 MW OWF located
on Thornton Bank in the North Sea, 30 km from the Belgium coastline.
27 Available at http://www.c-power.be/index.php/project-phase-1/overview
Results were found to closely correlate with the LEAN-WIND model output of €146 million, only 4.67% less than the expected €153 million quoted for this farm27.
Furthermore, sensitivity analysis was conducted to en-sure the model worked as expected and to assess the impact of key variables on costs. Results are summarised in Figure 30.
FIGURE 30 Installation Module - summary of sensitivity analysis and % impact of change to variables on cost
An increase in CAPEX and the number of turbines have the most severe effect on the total installation cost. Vessel day rate and distance to port have much less impact on total cost by comparison. All the variables of the model can be said to be behaving as expected.
3.2.2 O&M
The O&M strategy model described in Section 2.2.1 is used as the OPEX module. It is originally called the NOWIcob model and was developed primarily in a number of Norwe-gian research projects, in addition to LEANWIND. This Sec-tion describes the model methodology in more detail and outlines the validation activities and recommendations.
The model is based on a time-sequential (discrete-event) Monte Carlo simulation technique where maintenance operations at an OWF are simulated over a number of
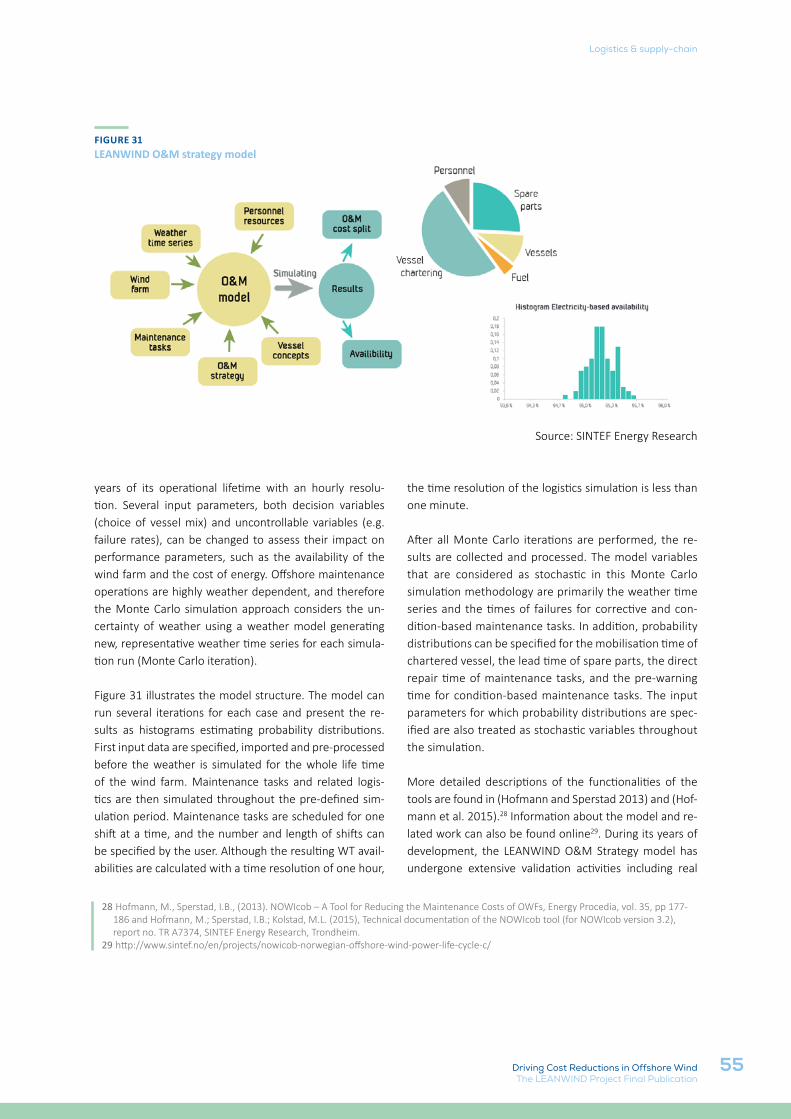
55
Logistics & supply-chain
Driving Cost Reductions in Offshore WindThe LEANWIND Project Final Publication
years of its operational lifetime with an hourly resolu-tion. Several input parameters, both decision variables (choice of vessel mix) and uncontrollable variables (e.g. failure rates), can be changed to assess their impact on performance parameters, such as the availability of the wind farm and the cost of energy. Offshore maintenance operations are highly weather dependent, and therefore the Monte Carlo simulation approach considers the un-certainty of weather using a weather model generating new, representative weather time series for each simula-tion run (Monte Carlo iteration).
Figure 31 illustrates the model structure. The model can run several iterations for each case and present the re-sults as histograms estimating probability distributions. First input data are specified, imported and pre-processed before the weather is simulated for the whole life time of the wind farm. Maintenance tasks and related logis-tics are then simulated throughout the pre-defined sim-ulation period. Maintenance tasks are scheduled for one shift at a time, and the number and length of shifts can be specified by the user. Although the resulting WT avail-abilities are calculated with a time resolution of one hour,
28 Hofmann, M., Sperstad, I.B., (2013). NOWIcob – A Tool for Reducing the Maintenance Costs of OWFs, Energy Procedia, vol. 35, pp 177-186 and Hofmann, M.; Sperstad, I.B.; Kolstad, M.L. (2015), Technical documentation of the NOWIcob tool (for NOWIcob version 3.2), report no. TR A7374, SINTEF Energy Research, Trondheim.
29 http://www.sintef.no/en/projects/nowicob-norwegian-offshore-wind-power-life-cycle-c/
the time resolution of the logistics simulation is less than one minute.
After all Monte Carlo iterations are performed, the re-sults are collected and processed. The model variables that are considered as stochastic in this Monte Carlo simulation methodology are primarily the weather time series and the times of failures for corrective and con-dition-based maintenance tasks. In addition, probability distributions can be specified for the mobilisation time of chartered vessel, the lead time of spare parts, the direct repair time of maintenance tasks, and the pre-warning time for condition-based maintenance tasks. The input parameters for which probability distributions are spec-ified are also treated as stochastic variables throughout the simulation.
More detailed descriptions of the functionalities of the tools are found in (Hofmann and Sperstad 2013) and (Hof-mann et al. 2015).28 Information about the model and re-lated work can also be found online29. During its years of development, the LEANWIND O&M Strategy model has undergone extensive validation activities including real
FIGURE 31LEANWIND O&M strategy model
Source: SINTEF Energy Research
56
Logistics & supply-chain
Driving Cost Reductions in Offshore WindThe LEANWIND Project Final Publication
wind farm projects in collaboration with industrial LEAN-WIND participants, both in separate industry projects and more specifically for validation purposes. Through these studies, the applicability and accuracy of the O&M Strat-egy model has been tested and improvements have been made accordingly. Industrial studies include a project with a Norwegian offshore wind developer for the investment decision of the Dudgeon offshore wind farm. Dedicated validation collaborations within the framework of LEAN-WIND include an activity undertaken together with the logistics O&M optimisation model (Section 3.1.3) com-paring an undisclosed offshore wind farm project with results from an industry-grade tool currently used by an LEANWIND industrial partner and its affiliate (offshore wind farm owners/developers).30 This collaboration of the logistics O&M optimisation and the strategy model demonstrates the benefits of integrated use described in Section 3.3. These LEANWIND models have also previ-ously been used together and benchmarked against other state-of-the-art O&M models.31
The key findings and conclusions of the validation activity were that the LEANWIND models and the industry-grade tool broadly agree on sensitivities but agree to a less ex-tent on the absolute values of the availability. Differenc-es in how the jack-up vessel charter strategy is modelled was identified as the likely reason behind the majority of the difference between the two models. None of the models were identified as having generally more reason-able modelling assumptions than the other. The impact of modelling travel times internally in the wind farm was moderate for that particular OWF project, but this mod-elling assumption is likely to be increasingly important for larger projects with larger distances within the wind farm. As models have different assumptions, strengths and weaknesses, it has proven useful to be able to use multiple models to assess the expected availability of an offshore wind farm project and understand sensitivities. Using multiple models may also increase the insight into uncertainties due to modelling assumptions and into the domain of validity of different models.
30 LEANWIND consortium, (2017). Case study validation of combined economic and logistics tools. Confidential Report, Executive Summary available at www.leanind.eu/results/
31 Sperstad, I. B.; Stålhane, M.; Dinwoodie, I.; Endrerud, O.-E. V.; Martin, R.; Warner, E., (2017). Testing the robustness of optimal access vessel fleet selection for operation and maintenance of offshore wind farms. Ocean Engineering, vol. 145, pp. 334–343. Available at http://www.sciencedirect.com/science/article/pii/S0029801817305280
32 News from Vattenfall, (2015). Without a trace, Retrieved 08/20/2017 from, http://news.vattenfall.com/en/article/without-trace.33 LEANWIND consortium, (2015). Ports suitability assessment for offshore wind development - Case studies report. Available at http://
www.leanwind.eu/wp-content/uploads/GA_614020_LEANWIND_D5.3V3.pdf34 Paper in preparation.
3.2.3 DECOMMISSIONING
Decommissioning is a relatively new practice, with no established method or procedure being reported in the literature. To date, Yttre Stengrund and Vindeby are the only farms to be decommissioned.32 An OWF has to be removed from the sea at the end of the lifetime. This is to ensure the safety of navigation and to protect the marine environment. Re-powering or upgrading may be under-taken to extend a farm lifetime, but this will still involve aspects of decommissioning. Decommissioning may also become necessary if the turbine is no longer functional due to damage, technical problems or withdrawal/expi-ry of the approval. While every farm will produce a de-commissioning plan at the consenting phase, regulations as well as the optimal methods and equipment available may change over the lifetime of a project. Therefore, this is an important area for research and an area for potential cost-savings. Given the lack of experience, no real data is available about the actual cost of decommissioning with a range of estimates available in the literature.
Currently, the industry agrees that decommissioning op-erations will be performed similarly to the installation ac-tivities, but in the reverse order as described in33. With this in mind, the LEANWIND project has focused on op-timising the efficiency of deploying OWTs and particular-ly their substructures as described in Section 1. Howev-er, this assumption does not consider potentially faster methods e.g. demolition when the turbine/foundation are not intended for re-use or that components may not be in suitable condition for reverse-engineering. It also does not consider other areas for potential optimisation such as examining the supply-chain and logistics during this phase. Therefore, further work has been done to as-sess the different decommissioning options and logistical requirements34. In addition, the decommissioning module of the financial model allows the user to consider a variety of strategies or dismantling a farm, either by reversing in-stallation or otherwise, and the associated impact on the overall project costs and timeline.
57
Logistics & supply-chain
Driving Cost Reductions in Offshore WindThe LEANWIND Project Final Publication
The module scope includes dismantling the turbine and foundation and considers the vessels, technicians and on-land transport available over an hourly time series and inputs for recycling and waste facility locations and ports. The model derives an estimation of decommission-ing costs, salvage revenue and the time taken to complete activities. The model structure is composed of: 1. An excel input file which:
a. contains the inputs required to define a decommissioning and post-decommissioning strategy for simulation;
b. pre-calculates salvage & re-sale revenues and re-conditioning & disposal costs based on the components, materials and respective post-decommissioning strategy defined by the user.
2. The main model is developed in MATLAB. This runs the scenario specified in the excel file over an hourly time series to determine the logistics costs of vessels, technicians and on-land transport.
3. Results are stored in an excel output file.
Given the lack of experience in this phase, the model also facilitates a simplified method to calculate a) DECEX (de-commissioning cost) as a percentage of CAPEX or installa-tion costs, and b) salvage revenue based on the estimated market value of the steel.
Validation of this model is difficult given the lack of ex-perience and is highly dependent on the method used to estimate costs in the current literature. However, the model was run using the installation module case-stud-ies for consistency. Costs were expected to fall within the range estimated by DNV GL of €200,000-€600,000/MW.35 Results for the C-Power OWF were €513,000 per MW. While at the upper limit of the estimated costs, this and other validation studies correlated well with the best pos-sible estimates for decommissioning cost in the industry at this point in time.
Sensitivity analysis ensured the model worked as ex-pected e.g. the costs increased/decreased as the cost of vessels increased/decreased respectively; increasing the number of vessels and technicians available reduced the time required to complete activities etc. Sensitivity analy-sis also highlighted areas for optimisation:
35 Chamberlain, K. (2016). Offshore Operators Act on Early Decommissioning, New Energy Update. Available at http://newenergyupdate.com/wind-energy-update/offshore-operators-act-early-decommissioning-data-limit-costs
• the cost of additional resources could outweigh time saved. Therefore, the optimal balance should be determined for a specific scenario;
• the impact of operational restrictions and durations is relative to the site location e.g. harsher conditions will increase the importance of optimising activities and perhaps investing in vessels with greater operational capabilities;
• feeder vessels will be less useful further from shore where they would require longer transit windows. Without feeder vessels, activities took longer but cost less. Therefore, the decision will depend on the priorities of the owner and the specific site;
• economies of scale were evident when increasing the farm size or the turbine capacity.
3.2.4 RISK & LIFE-CYCLE ANALYSIS (LCA) ASSESSMENTTo complement the LEANWIND financial model, a number of studies and tools were produced that propose novel business models for current and future industry needs; analyse risk; and assess the LCA of technologies assessed in the financial model.
BUSINESS MODELS AND RISK
Modern supply-chains face increased exposure to risks because of their complexity and globalisation due to the lack of visibility and control. The development of Decision Support Systems (DSS) can help companies in assessing their supply-chain risks and choosing suitable mitigation measures. Therefore, a two-stage supply-chain risk profile reduction support system was developed that determines not only strategies but also tactics, including contingency plans, with the aim of mitigating risks in the supply-chain. This DSS consisted of a decisions tree which evolved to include a matrix formulation, which extends the matrix formulation of the Bayes’ formula.
58
Logistics & supply-chain
Driving Cost Reductions in Offshore WindThe LEANWIND Project Final Publication
The DSS was applied to a real-world application of an off-shore-wind wind supply-chain and validations through this case application and a collection of expert judgements from a focus group. It showed that for a supply-chain characterised by a medium exposure to risks, supplying a 630 MW farm, the risk-profile-minimising strategy is En-gineering, Procurement and Construction (EPC), followed by multi-contracting and project alliance. Furthermore, the sensitivity analysis suggests that multi-contracting could be more effective than EPC for an OWF character-ised by low exposure to risks.
This DSS improves and extends previous DSS’s employing the supply-chain risk management process by:1. Proposing a method for estimating probabilities
from expert judgements;2. Considering the relationships among risks and
mitigation measures;3. Modelling the selection of mitigation measures
leading to the lowest supply-chain risk profile.
Future improvements to this DSS include an extension of the model based on real-option theory and the use of fuzzy numbers in the pairwise comparison matrices em-ployed for determining parameters from expert judge-ments. There are currently some problems concerning fuzzy-pairwise comparisons and these will need to be fully resolved before this strategy can be implemented.
This model was adapted to utilise Monte Carlo simula-tions and function with @Risk software, which can take the outputs of the LEANWIND Financial model and fur-ther analysis a project’s risk profile.
LIFE-CYCLE ASSESSMENT
A Life-Cycle Assessment (LCA) allows the environmental impacts and sustainability of any innovative construction process to be evaluated and compared to conventional technologies. An LCA tool has been developed as part of the financial model to calculate the environmental im-pacts of a project. This considers inputs from the various phase modules described in Sections 3.2.1-3.2.3 including but not limited to: distance travelled by each vessel; the time spent performing certain operations; the volumes and weight of the materials included in the primary pro-ject assets; and the whether the materials will be sent to recycling and salvage or as waste.
In addition to this tool, LEANWIND conducted an assess-ment of three of the substructure concepts. The results are described in Section 4.
3.3 INTEGRATED USE OF MODELS & POTENTIAL END-USERS The logistics and financial models can be used inde-pendently or in conjunction to provide input in the FEED stage decision-making. Working in isolation, both models have their own advantages. For example, the logistics models optimise and provide cost estimates of key as-pects of the on-land and offshore supply-chain including aspects not considered in the financial model (transport to port, warehouses and storage). However, they are es-sentially deterministic, considering one instance of a pro-ject scenario. They also do not include substantial detail given they must consider multiple combinations of input options in order to determine an optimal scenario. In con-trast, the financial model utilises Monte Carlo simulation to consider multiple iterations of a project life-cycle to take into account the uncertainty of weather, component failures and cost inputs etc. It can also include a larger level of detail and thereby assess the impact of strategic choices on cost and time efficiency.
Optimally, the logistic and financial models should be used consecutively as follows: • the logistics models determining several optimum
supply-chain configurations for all three phases of the life-cycle
• the logistics model outputs are then used as inputs for the financial model to determine the overall efficiency of the strategy through more detailed financial analysis.
By using these models in conjunction, the optimum sup-ply-chain strategy, technology and vessel selection can be determined to obtain the most economically viable and time effective solution, hence ensuring electricity is generated from the OWF at a competitive price. This re-duces wasted time analysing sub-optimal arrangements. Figure 32 demonstrates how the outputs of the logistics models can be used as inputs to inform the inputs of the financial model.
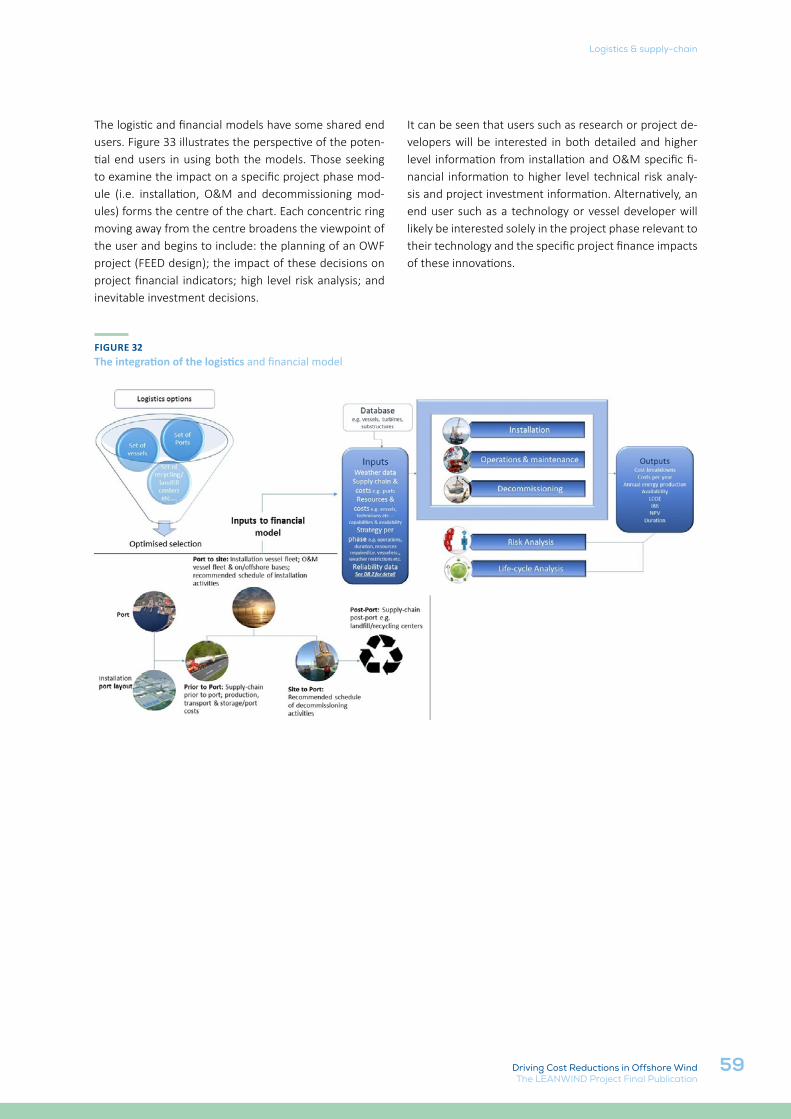
59
Logistics & supply-chain
Driving Cost Reductions in Offshore WindThe LEANWIND Project Final Publication
The logistic and financial models have some shared end users. Figure 33 illustrates the perspective of the poten-tial end users in using both the models. Those seeking to examine the impact on a specific project phase mod-ule (i.e. installation, O&M and decommissioning mod-ules) forms the centre of the chart. Each concentric ring moving away from the centre broadens the viewpoint of the user and begins to include: the planning of an OWF project (FEED design); the impact of these decisions on project financial indicators; high level risk analysis; and inevitable investment decisions.
It can be seen that users such as research or project de-velopers will be interested in both detailed and higher level information from installation and O&M specific fi-nancial information to higher level technical risk analy-sis and project investment information. Alternatively, an end user such as a technology or vessel developer will likely be interested solely in the project phase relevant to their technology and the specific project finance impacts of these innovations.
FIGURE 32The integration of the logistics and financial model
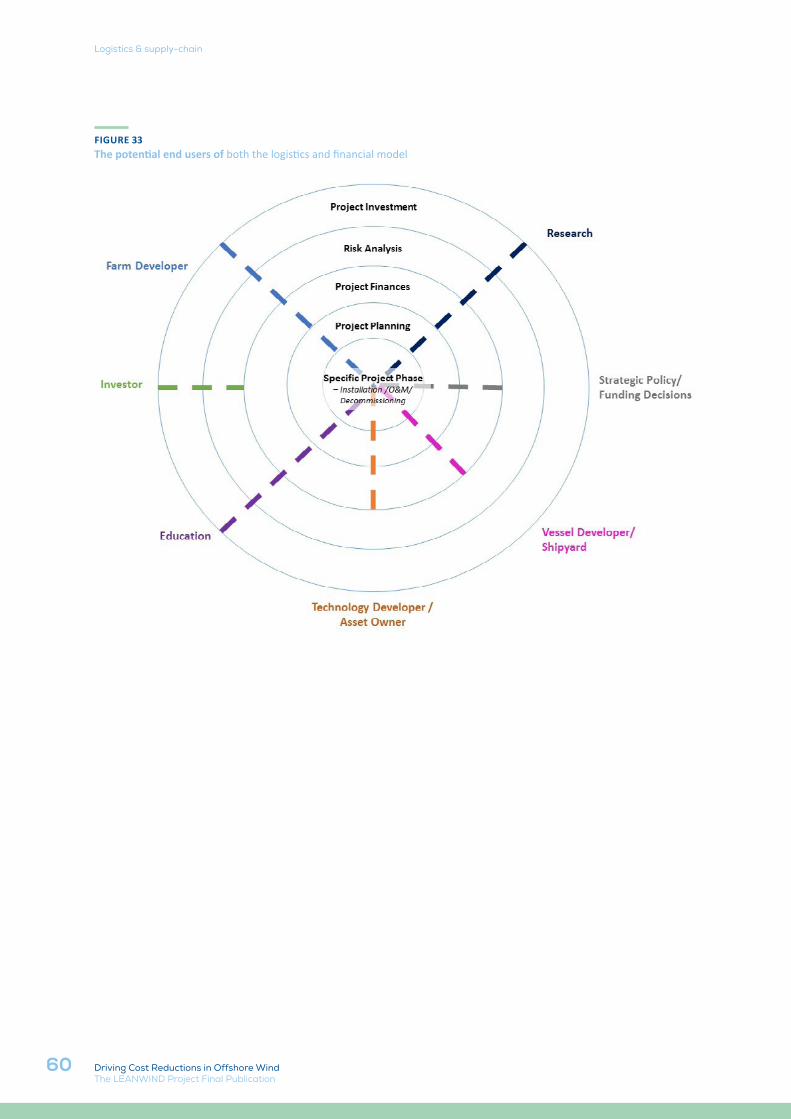
60
Logistics & supply-chain
Driving Cost Reductions in Offshore WindThe LEANWIND Project Final Publication
FIGURE 33The potential end users of both the logistics and financial model
61
Logistics & supply-chain
Driving Cost Reductions in Offshore WindThe LEANWIND Project Final Publication
3.4 APPLICATION AND RECOMMENDATIONSAs well as developing state-of-the-art tools, LEANWIND has applied the logistics and financial models to a number of case-studies to a) evaluate the LEANWIND project inno-vations and b) provide final recommendations for cost-re-ductions to the offshore wind industry.
Given the limitation of time and resources, LEANWIND se-lected a set number of scenarios to be run for the LEAN-WIND Design Cases (Table 1), which are representative of current and future OWF sites. Industry project partici-pants were consulted to determine the scenarios of most interest; for technical validation of the proposed studies; and to gather inputs. Information was also gathered from secondary sources to determine base case scenarios for comparison with the LEANWIND innovations for cost-ben-efit analysis.
These studies were not sufficiently complete for inclusion in this publication. However, the following summarises the work undertaken and a supplementary report outlin-ing the conclusions and recommendations is available on the LEANWIND website at www.leanwind.eu
To summarise the work undertaken, LEANWIND case-stud-ies evaluated three different foundations: the gravity base; the float out suction jacket; and the floating plat-form foundation. It should be noted that the foundations are site dependant and required the different conditions as indicted in the LEANWIND Design Cases (Table 1). Each foundation was compared to a “next best alternative” at the same site. The study also included the ESTEYCO Elisa GBF and telescopic turbine into the analysis for Site 1. Ta-ble 3 summarises the details of the scenarios simulated to evaluate LEANWIND foundation concepts and propose recommendations for cost reductions. The blue scenari-os represent LEANWIND innovations while the yellow are conventional foundations. The evaluation procedure:
• each of these 7 case studies were fed into the logistics model;
• for each case-study the top 2 or 3 results were taken from the logistics model and input the results (plus any other information required) into the financial model;
• ultimately the final time and financial solutions were compared for the conventional versus the LEANWIND solution.
The LEANWIND installation and O&M vessel concepts have also been evaluated using a similar method. In addition, the effects of the remote presence device on maintenance costs have been tested for a fixed and float-ing scenario.
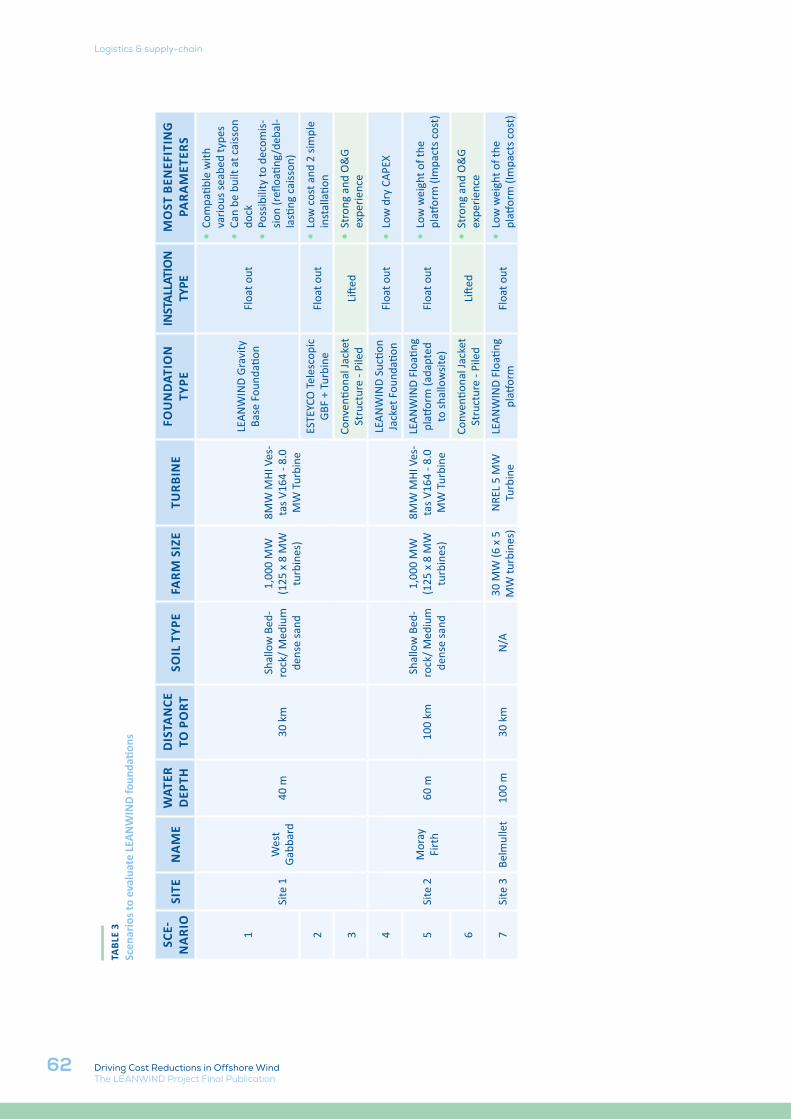
62
Logistics & supply-chain
Driving Cost Reductions in Offshore WindThe LEANWIND Project Final Publication
TABL
E 3
Scen
ario
s to
eval
uate
LEA
NW
IND
foun
datio
ns
SCE-
NA
RIO
SITE
NA
ME
WAT
ER
DEP
THD
ISTA
NCE
TO
PO
RTSO
IL T
YPE
FARM
SIZ
ETU
RBIN
EFO
UN
DAT
ION
TY
PEIN
STAL
LATI
ON
TYPE
MO
ST B
ENEF
ITIN
G
PARA
MET
ERS
1
Site
1W
est
Gab
bard
40 m
30 k
mSh
allo
w B
ed-
rock
/ M
ediu
m
dens
e sa
nd
1,00
0 M
W
(125
x 8
MW
tu
rbin
es)
8MW
MH
I Ves
-ta
s V1
64 -
8.0
MW
Tur
bine
LEA
NW
IND
Gra
vity
Ba
se F
ound
ation
Floa
t out
• Co
mpa
tible
with
va
riou
s se
abed
type
s•
Can
be b
uilt
at c
aiss
on
dock
• Po
ssib
ility
to d
ecom
is-
sion
(refl
oatin
g/de
bal-
lasti
ng c
aiss
on)
2ES
TEYC
O T
eles
copi
c G
BF +
Tur
bine
Floa
t out
• Lo
w c
ost a
nd 2
sim
ple
inst
alla
tion
3Co
nven
tiona
l Jac
ket
Stru
ctur
e - P
iled
Lift
ed•
Stro
ng a
nd O
&G
ex
peri
ence
4
Site
2M
oray
Fi
rth
60 m
100
kmSh
allo
w B
ed-
rock
/ M
ediu
m
dens
e sa
nd
1,00
0 M
W
(125
x 8
MW
tu
rbin
es)
8MW
MH
I Ves
-ta
s V1
64 -
8.0
MW
Tur
bine
LEA
NW
IND
Suc
tion
Jack
et F
ound
ation
Floa
t out
• Lo
w d
ry C
APE
X
5LE
AN
WIN
D F
loati
ng
platf
orm
(ada
pted
to
sha
llow
site
)Fl
oat o
ut•
Low
wei
ght o
f the
pl
atfor
m (I
mpa
cts
cost
)
6Co
nven
tiona
l Jac
ket
Stru
ctur
e - P
iled
Lift
ed•
Stro
ng a
nd O
&G
ex
peri
ence
7Si
te 3
Belm
ulle
t10
0 m
30 k
mN
/A30
MW
(6 x
5
MW
turb
ines
)N
REL
5 M
W
Turb
ine
LEA
NW
IND
Flo
ating
pl
atfor
mFl
oat o
ut•
Low
wei
ght o
f the
pl
atfor
m (I
mpa
cts
cost
)
63Driving Cost Reductions in Offshore WindThe LEANWIND Project Final Publication
MARKET ANALYSIS OF TECHNICAL IN-NOVATIONS
To facilitate uptake of project results, LEANWIND evaluat-ed the existing market impact and market creation poten-tial of technical innovations (substructures and vessels), as well as the possible non-technical impacts and viability of results in relation to policy, environmental, H&S etc. The output will help to streamline Research, Development and Planning (RD&P) activities by allowing assessment of the commercial potential of the technology. This will avoid time wasted in the development of non-viable concepts and will allow the potential of competing solutions to be compared on a more equitable basis.
Stakeholder surveys were conducted to gather informa-tion on the relative importance of various factors in stake-holders’ purchase decisions. These are important tools within the framework of the market assessment process to assess the economic and market potential of the tech-nical LEANWIND innovations. The ranking of attributes by the respondents of the surveys were matched against the rankings by the LEANWIND participants who worked on the innovative designs. Results confirmed the demand for larger installation vessels, which are able to handle larger components than current vessels available in the market,
and substructures which are able to support larger WTs and in deeper water than is currently feasible. The follow-ing are some of the notable results, that can be consid-ered in future developments as well as research activities:
• ‘green’ designs and environmentally friendly solutions are considered important for the installation vessel, but to a lesser extent for the foundations;
• H&S and workflow are considered important factors for both types of vessel. Comfort for crew and passengers is considered the most important factor for O&M vessels but less so for installation vessels;
• vessel operators prefer installation vessels suitable for transportation and installation of both foundations and turbines rather than installation vessels dedicated to turbines only.;
• the use of feeder barges/vessels for foundations and/or turbines is unpopular among vessel operators;
• reducing manufacturing costs of foundations is considered more important than reducing installation costs;
4.VIABILITY AND STRATEGY ROADMAP
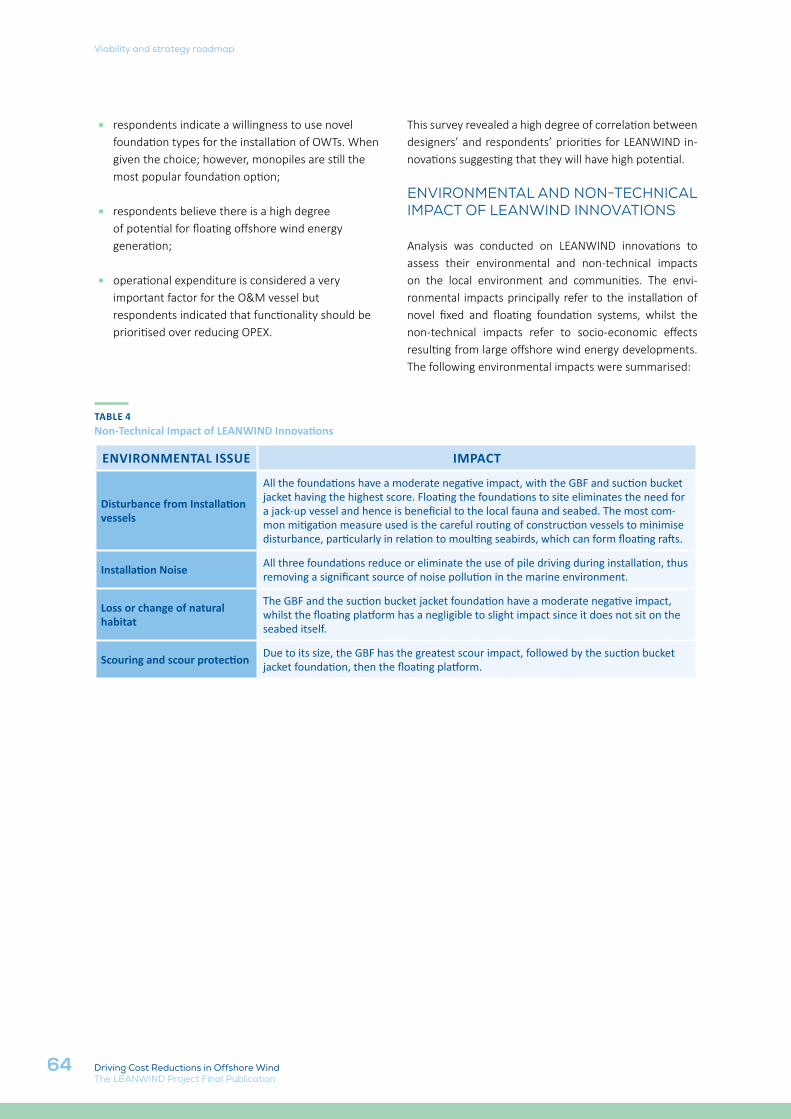
64
Viability and strategy roadmap
Driving Cost Reductions in Offshore WindThe LEANWIND Project Final Publication
• respondents indicate a willingness to use novel foundation types for the installation of OWTs. When given the choice; however, monopiles are still the most popular foundation option;
• respondents believe there is a high degree of potential for floating offshore wind energy generation;
• operational expenditure is considered a very important factor for the O&M vessel but respondents indicated that functionality should be prioritised over reducing OPEX.
This survey revealed a high degree of correlation between designers’ and respondents’ priorities for LEANWIND in-novations suggesting that they will have high potential.
ENVIRONMENTAL AND NON-TECHNICAL IMPACT OF LEANWIND INNOVATIONS
Analysis was conducted on LEANWIND innovations to assess their environmental and non-technical impacts on the local environment and communities. The envi-ronmental impacts principally refer to the installation of novel fixed and floating foundation systems, whilst the non-technical impacts refer to socio-economic effects resulting from large offshore wind energy developments. The following environmental impacts were summarised:
TABLE 4Non-Technical Impact of LEANWIND Innovations
ENVIRONMENTAL ISSUE IMPACT
Disturbance from Installation vessels
All the foundations have a moderate negative impact, with the GBF and suction bucket jacket having the highest score. Floating the foundations to site eliminates the need for a jack-up vessel and hence is beneficial to the local fauna and seabed. The most com-mon mitigation measure used is the careful routing of construction vessels to minimise disturbance, particularly in relation to moulting seabirds, which can form floating rafts.
Installation Noise All three foundations reduce or eliminate the use of pile driving during installation, thus removing a significant source of noise pollution in the marine environment.
Loss or change of natural habitat
The GBF and the suction bucket jacket foundation have a moderate negative impact, whilst the floating platform has a negligible to slight impact since it does not sit on the seabed itself.
Scouring and scour protection Due to its size, the GBF has the greatest scour impact, followed by the suction bucket jacket foundation, then the floating platform.
65
Viability and strategy roadmap
Driving Cost Reductions in Offshore WindThe LEANWIND Project Final Publication
An LCA was performed on the three LEANWIND steel foundations: the suction bucket floating jacket founda-tion, the floating GBF and the semi-submersible floating platform. In order to focus on the comparative impacts of the LEANWIND foundations, the impacts of the turbine itself have not been considered.
By examining the environmental impacts of these inno-vative foundation designs over their whole life-cycle, the ultimate goal is to demonstrate whether they perform better than other existing solutions. This process also as-sists with the detection of factors with potentially higher environmental impact to aid in refining future design it-erations and thus minimising the resulting environmental impact. The main impact categories studied were:• global warming potential (100 years);• acidification potential;• eutrophication;• photochemical oxidation;• abiotic depletion (plus fossil fuels);• human toxicity;• aquatic ecotoxicity (fresh water, marine and terrestrial);• cumulative energy demand.
The LCA found that the environmental impacts of the floating foundation are generally higher than for the other two foundations, due to the greater use of steel per unit of energy produced. However, it is important to note that there is much more flexibility over the choice of installa-tion location for this type of foundation.
The jacket foundation has lower impacts than the GBF in 62% of the impact categories studied, suggesting that it might be the better option from an environmental per-spective. The GBF performs worst in terms of the pho-tochemical oxidation/ozone creation potential, due to the high emissions of pollutants during operation of sea vessels for seabed preparation. The jacket foundation per-forms worst in terms of the ozone and abiotic depletion potentials, both due to the manufacturing processes or materials used for the manufacture of steel for the main structure and aluminium alloy for the sacrificial anodes. Therefore, encouraging vessel innovations to achieve better performance (e.g. in endurance, capacity, fuel con-sumption) and optimising the design of the jacket foun-dation for minimum steel and aluminium use are the two areas that provide the greatest potential for further de-creasing the environmental impact of these designs.
On the key impact of the global warming potential, it is found that both of the steel LEANWIND solutions perform well relative to their competitors (based on published studies). Only one other study on GBFs was identified and it found comparable results to the LEANWIND solution. In the case of the jacket foundation, its impacts are found to be considerably lower than those for a similar sized foun-dation for a similar water depth. This is probably due to the lower impacts of the floater/suction bucket design.
The analysis has also highlighted the key areas for poten-tially reducing the environmental impacts of these foun-dations, mainly by:• minimising the fuel consumption of sea vessels; • optimising the design of the steel foundations for
minimal use of steel; • reducing the length of floating foundation-mooring
lines or sharing mooring lines.
NON-TECHNICAL RECOMMENDATIONS
From the outset, LEANWIND conducted a comprehensive analysis of current challenges across the project life-cy-cle and potential solutions were produced as described in previous subsections. The project also examined the non-technical challenges to determine the business and policy landscape required for the successful implemen-tation of solutions. Considering the nontechnical issues as well as finding technical solutions can considerably increase the viability and potential industry up-take of project innovations. The recommendations proposed are summarised in Table 5.
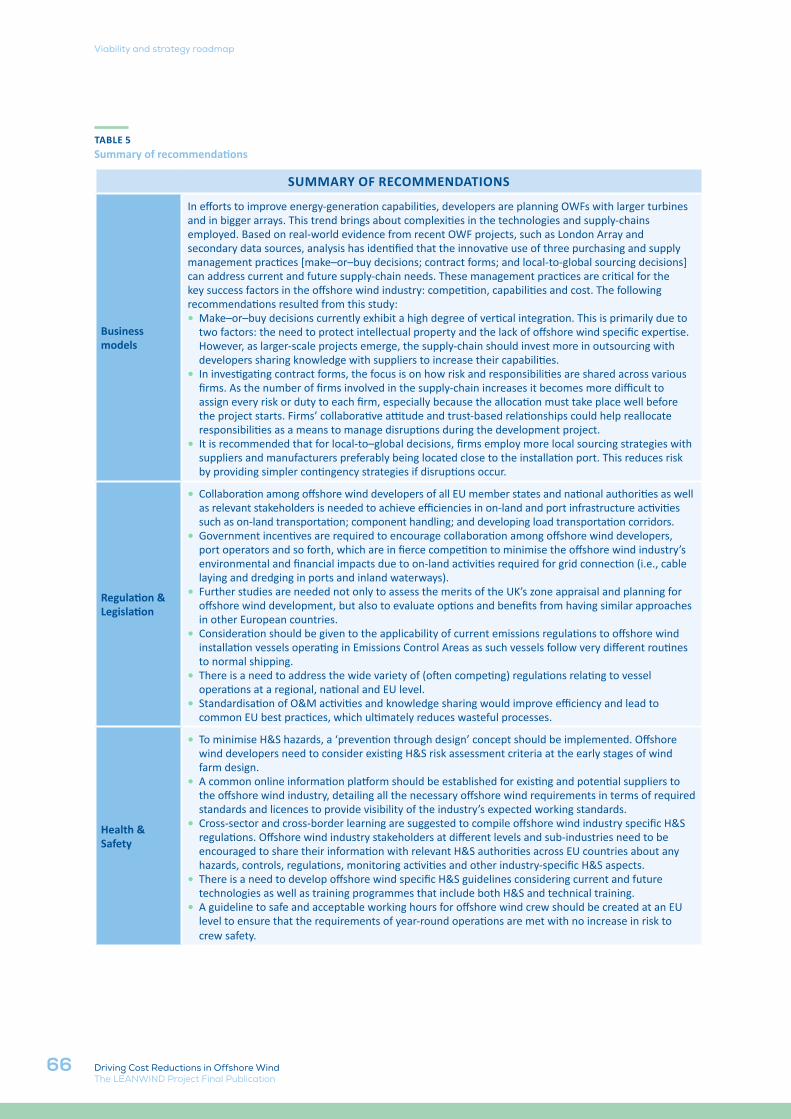
66
Viability and strategy roadmap
Driving Cost Reductions in Offshore WindThe LEANWIND Project Final Publication
TABLE 5Summary of recommendations
SUMMARY OF RECOMMENDATIONS
Business models
In efforts to improve energy-generation capabilities, developers are planning OWFs with larger turbinesand in bigger arrays. This trend brings about complexities in the technologies and supply-chainsemployed. Based on real-world evidence from recent OWF projects, such as London Array andsecondary data sources, analysis has identified that the innovative use of three purchasing and supplymanagement practices [make–or–buy decisions; contract forms; and local-to-global sourcing decisions]can address current and future supply-chain needs. These management practices are critical for thekey success factors in the offshore wind industry: competition, capabilities and cost. The followingrecommendations resulted from this study:• Make–or–buy decisions currently exhibit a high degree of vertical integration. This is primarily due to
two factors: the need to protect intellectual property and the lack of offshore wind specific expertise. However, as larger-scale projects emerge, the supply-chain should invest more in outsourcing with developers sharing knowledge with suppliers to increase their capabilities.
• In investigating contract forms, the focus is on how risk and responsibilities are shared across various firms. As the number of firms involved in the supply-chain increases it becomes more difficult to assign every risk or duty to each firm, especially because the allocation must take place well before the project starts. Firms’ collaborative attitude and trust-based relationships could help reallocate responsibilities as a means to manage disruptions during the development project.
• It is recommended that for local-to–global decisions, firms employ more local sourcing strategies with suppliers and manufacturers preferably being located close to the installation port. This reduces risk by providing simpler contingency strategies if disruptions occur.
Regulation & Legislation
• Collaboration among offshore wind developers of all EU member states and national authorities as well as relevant stakeholders is needed to achieve efficiencies in on-land and port infrastructure activities such as on-land transportation; component handling; and developing load transportation corridors.
• Government incentives are required to encourage collaboration among offshore wind developers, port operators and so forth, which are in fierce competition to minimise the offshore wind industry’s environmental and financial impacts due to on-land activities required for grid connection (i.e., cable laying and dredging in ports and inland waterways).
• Further studies are needed not only to assess the merits of the UK’s zone appraisal and planning for offshore wind development, but also to evaluate options and benefits from having similar approaches in other European countries.
• Consideration should be given to the applicability of current emissions regulations to offshore wind installation vessels operating in Emissions Control Areas as such vessels follow very different routines to normal shipping.
• There is a need to address the wide variety of (often competing) regulations relating to vessel operations at a regional, national and EU level.
• Standardisation of O&M activities and knowledge sharing would improve efficiency and lead to common EU best practices, which ultimately reduces wasteful processes.
Health & Safety
• To minimise H&S hazards, a ‘prevention through design’ concept should be implemented. Offshore wind developers need to consider existing H&S risk assessment criteria at the early stages of wind farm design.
• A common online information platform should be established for existing and potential suppliers to the offshore wind industry, detailing all the necessary offshore wind requirements in terms of required standards and licences to provide visibility of the industry’s expected working standards.
• Cross-sector and cross-border learning are suggested to compile offshore wind industry specific H&S regulations. Offshore wind industry stakeholders at different levels and sub-industries need to be encouraged to share their information with relevant H&S authorities across EU countries about any hazards, controls, regulations, monitoring activities and other industry-specific H&S aspects.
• There is a need to develop offshore wind specific H&S guidelines considering current and future technologies as well as training programmes that include both H&S and technical training.
• A guideline to safe and acceptable working hours for offshore wind crew should be created at an EU level to ensure that the requirements of year-round operations are met with no increase in risk to crew safety.
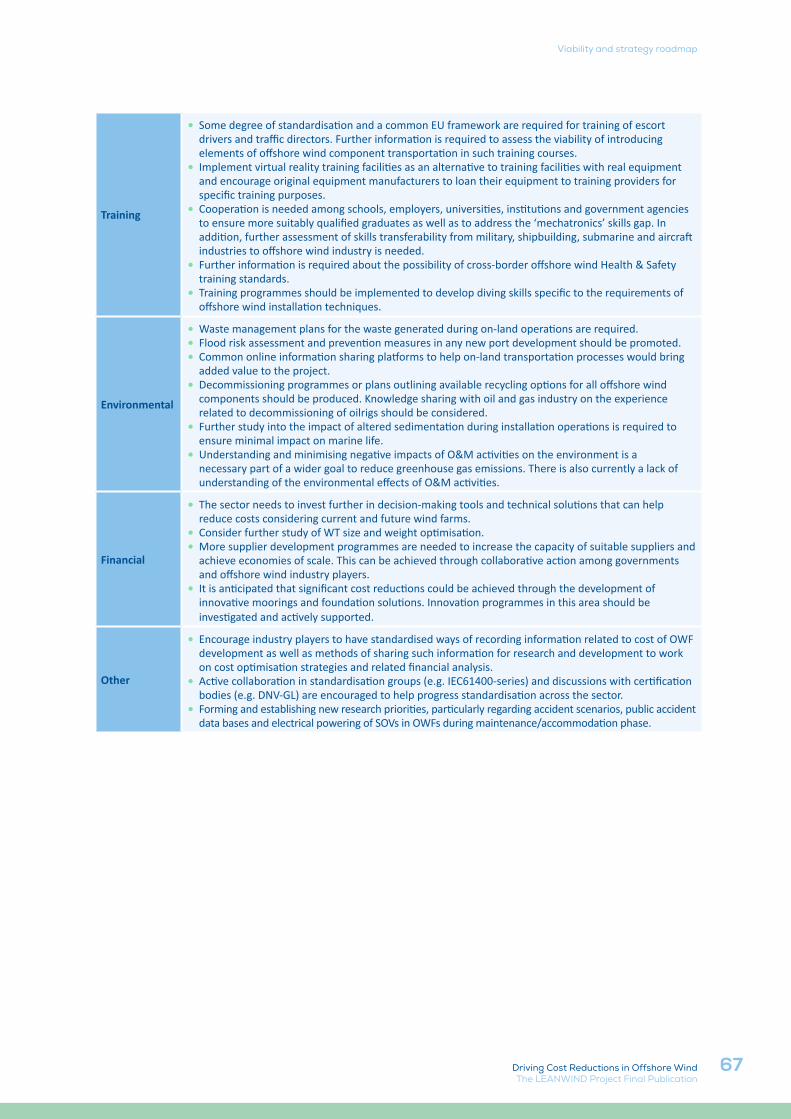
67
Viability and strategy roadmap
Driving Cost Reductions in Offshore WindThe LEANWIND Project Final Publication
Training
• Some degree of standardisation and a common EU framework are required for training of escort drivers and traffic directors. Further information is required to assess the viability of introducing elements of offshore wind component transportation in such training courses.
• Implement virtual reality training facilities as an alternative to training facilities with real equipment and encourage original equipment manufacturers to loan their equipment to training providers for specific training purposes.
• Cooperation is needed among schools, employers, universities, institutions and government agencies to ensure more suitably qualified graduates as well as to address the ‘mechatronics’ skills gap. In addition, further assessment of skills transferability from military, shipbuilding, submarine and aircraft industries to offshore wind industry is needed.
• Further information is required about the possibility of cross-border offshore wind Health & Safety training standards.
• Training programmes should be implemented to develop diving skills specific to the requirements of offshore wind installation techniques.
Environmental
• Waste management plans for the waste generated during on-land operations are required.• Flood risk assessment and prevention measures in any new port development should be promoted. • Common online information sharing platforms to help on-land transportation processes would bring
added value to the project. • Decommissioning programmes or plans outlining available recycling options for all offshore wind
components should be produced. Knowledge sharing with oil and gas industry on the experience related to decommissioning of oilrigs should be considered.
• Further study into the impact of altered sedimentation during installation operations is required to ensure minimal impact on marine life.
• Understanding and minimising negative impacts of O&M activities on the environment is a necessary part of a wider goal to reduce greenhouse gas emissions. There is also currently a lack of understanding of the environmental effects of O&M activities.
Financial
• The sector needs to invest further in decision-making tools and technical solutions that can help reduce costs considering current and future wind farms.
• Consider further study of WT size and weight optimisation. • More supplier development programmes are needed to increase the capacity of suitable suppliers and
achieve economies of scale. This can be achieved through collaborative action among governments and offshore wind industry players.
• It is anticipated that significant cost reductions could be achieved through the development of innovative moorings and foundation solutions. Innovation programmes in this area should be investigated and actively supported.
Other
• Encourage industry players to have standardised ways of recording information related to cost of OWF development as well as methods of sharing such information for research and development to work on cost optimisation strategies and related financial analysis.
• Active collaboration in standardisation groups (e.g. IEC61400-series) and discussions with certification bodies (e.g. DNV-GL) are encouraged to help progress standardisation across the sector.
• Forming and establishing new research priorities, particularly regarding accident scenarios, public accident data bases and electrical powering of SOVs in OWFs during maintenance/accommodation phase.
68 Driving Cost Reductions in Offshore WindThe LEANWIND Project Final Publication
DNV-GL’s 2014 cost-reduction manifesto asserts that the following three strategies could collectively contribute to a 25% drop in LCOE:
Do it right - focus on reducing risk and preventing mistakes Do it better – improve the efficiency of existing processes Do it differently – implement alterative and innovative ways of doing things36
This reflects the “LEAN” philosophy of the project, which sought to optimise or remove wasteful activities across the life-cycle; streamline flow between project stages; and enhance quality. LEANWIND has successfully provid-ed a large range of novel solutions that can improve exist-ing practices and set standards in order to help industry meet their LCOE aspirations and maintain cost reductions as the industry develops. This conclusion summarises the achievements of the project and how LEANWIND innova-tions will drive cost reductions in offshore wind.
36 DNV-GL. (2014). Offshore Wind - A Manifesto For Cost Reduction.
Offshore monopiles appear to dominate the wind farm sector at present, with many developers promoting their use for upcoming projects. Recognising the industry trend for larger diameter monopiles in deeper water, XL monopile studies through LEANWIND have committed significant research resources into developing optimum design methods (by modelling more realistic soil springs and suggesting more efficient use of Finite Element mod-elling) to reduce monopile sizes and save money on the cost of steel. The benefits of leaner and more efficient de-sign approaches are clear to the entire industry, leading to significant CAPEX cost reductions. Implementing these new design approaches on offshore wind projects could immensely reduce steel tonnage below the mudline. Over the next five years, as we strive for cost parity with con-ventional sources of energy, these optimised monopile design methods have a critical role to play.
Over the past four years, LEANWIND partners have been investigating Gravity Base Foundations (GBFs) and means of improving their efficiency. The focus of this research has been on the detailed design of novel concrete structures, including geotechnical, structural and hydrodynamic analysis. The output of this research has shown concrete
5.CONCLUSION
69
Conclusion
Driving Cost Reductions in Offshore WindThe LEANWIND Project Final Publication
gravity structures to be viable in specific site conditions. A suite of parametric studies has also been undertaken to define the optimum geometric configurations for buoyant gravity structures – this is particularly useful to assist in FEED stage engineering design. Research on geometrical optimisation of these structures has contributed to lower-ing material consumption by designing lighter yet equally stable foundations, which brings about savings in manu-facturing costs. Furthermore, Significant savings in trans-portation and installation costs resulting from elimination of expensive jack-up vessels by towing and ballasting grav-ity based foundations is one of the main industry impacts achieved in this study.
The concept of floating jackets has been researched as part of the LEANWIND foundation innovations. The inte-grated design of jacket foundation and suction buckets introduces cost-savings during the transportation and in-stallation phase due to the foundation being able to float. This saves costs by reducing dependency on heavy lift vessels.
Market analysis indicates that there is a high degree of potential for floating offshore wind energy generation. Given the interest in building wind farms in deeper water, more insight into the design principles of floating foun-dations will be instrumental in near future. LEANWIND’s development of a semi-submersible platform helps meet these demand of sites in depths above a hundred metres where limited foundation types are applicable. Extensive research efforts in scale testing, numerical modelling and optimisation of cable attachment and mooring configura-tion of the semi-submersible floating platform, has pro-vided better understanding of performance and design of this relatively innovative concept. This output is valuable to facilitate future risk-reduced testing of concepts.
The LEANWIND 8MW reference turbine provides a ref-erence turbine design for the R&D community so that technologies and methods can be meaningfully com-pared. The reference turbine has already been used in this manner within the LEANWIND project in the design of foundations, vessels, port layout and O&M strategy de-velopment.
The LEANWIND installation and O&M service vessel concepts address the market bottleneck for suitable and efficient vessels, providing purpose-built OWF concepts
that address industry specific requirements. Considering the growing need for clean energy and the growing size of WTs, the installation vessel design was optimized in terms of economy (size and number of turbines carried at once – 8*8MW turbines), environment (pure LNG propulsion system), and operation (ability to carry and install turbines via special propulsion and lifting systems and optimized deck arrangement). The vessel can also be optimised to carry 10MW turbines, future-proofing against industry advances and the associated logistical complexities and financial burdens. Furthermore, the vessel can operate in most of the wind farm sites identified by the industry for future extension without significant restrictions on opera-tions due to the environmental parameters.
The O&M vessel concept meets current and future chal-lenges as farms are located further from shore. It includes substantial personnel capacity and a helideck to allow the transfer of crew, facilitating long-term activities offshore. The vessel design also prioritised increasing weather win-dows through reduced vessel RAO’s; improving the com-fort of crew to foster higher work efficiency; and facilitat-ing safe crew transfer via a motion compensated gangway at wave heights of 2.5m Hs and safe launching for the two daughter crafts. In addition, the vessel design was opti-mized in terms of economy (backup battery to run during maintenance work to avoid both fuel consumption and emission from vessel) and environment (pure LNG pro-pulsion system). These aspects address many of the key industry requirements identified by the project market assessment.
LEANWIND O&M research has produced novel tools, methods, strategies and technologies all focused on making activities lean and efficient, ultimately helping to achieve and maintain the expected drop in LCOE. The O&M strategy model has produced a number of rec-ommended areas for strategic optimisation e.g. efficient chartering of jack-up vessels. It has also already been used by an industry player to validate their own tool and assess a real wind farm project under consideration. The dynam-ic scheduling model addresses the relatively new area of day-to-day planning tools specific to OWFs, promoting efficient scheduling of technicians, vessel routing etc. This was presented at the second LEANWIND stakehold-er showcase and developers have been approached by industry expressing interest in collaborating on its future improvement. The development of a risk-based frame-
70
Conclusion
Driving Cost Reductions in Offshore WindThe LEANWIND Project Final Publication
work for O&M as well as the RAMS methodology assess-ment, degradation modelling, CM software and the re-mote presence prototype allowed LEANWIND to illustrate the potential benefits of monitoring systems and adopting risk and reliability-centred approaches. These can reduce the need for costly offshore trips and minimise the im-pact of failures by facilitating maintenance before failure occurs. The project illustrated how these tools could be implemented in an integrated way to capture a level of detail unprecedented in existing tools and systems. This will facilitate optimal decision-making at both the plan-ning and operational stages.
The LEANWIND CM software itself presents a unique solution, mixing the latest methodologies of fault diag-nostic and prognostic recommended by international standards, with the latest advances in web services. The CEANI research group that developed this software have been working in this field in close contact with industry from 2006. They intend to further develop the software to include new pre-programmed software pieces and im-prove the user’s interface with Artificial Intelligence based advice. In parallel, CEANI expect to sign agreements with some end users, in order to validate the software using a broad variety of significant industrial test cases.
The field trials involving the gravity-based foundation for the PLOCAN platform; the remote presence prototype; and access system testing have provided vital lessons regarding installation and deployment methods; data ac-quisition via remote presence; and the workability of dif-ferent types and sizes of CTVs when using the bump-and-jump method of access. The direct industry involvement has facilitated immediate learning with regard to potential risks and cost-savings. The simulator tools will allow for the trialling of concepts and training of crew in a con-trolled environment before entering into the real world where cost and risk are far greater. The deck simulators were showcased using the LEANWIND vessel concepts and demonstrating a variety of operations in different sea-states to industry participants in November 2017. This il-lustrated the potential of using simulation to reduce risk and ultimately costs prior to deployment.
The project developed a holistic set of logistics models for decision support at all phases of the supply-chain across a project life-cycle. They are all innovative and state-of-the-art within offshore wind farm logistics planning and
are mainly optimization based. This means that they au-tomatically search through the extremely large solution space looking for the optimal solution. Thus, they enable the logistic planners to
• be more efficient in the planning process, spending time evaluating near-optimal solutions; and
• produce better and more reliable logistics solutions by validating expert planner's subjective opinions with an objective analytical/mathematical approach.
The model has been used in collaboration with the finan-cial model to assess the likely impact of the various pro-ject outputs. The logistics model developers have been in contact with several major industry actors with an inter-est in learning from these tools beyond the lifetime of the project. Currently a new tool is being developed (directly funded from one of these actors) and new research pro-jects initiatives (both national and EU funded) are under-way, which build upon the LEANWIND work.
The full life-cycle financial model is a probabilistic sim-ulation tool that has facilitated the assessment of pro-posed methods and technologies for realising cost saving in an offshore wind project. The model has also provided general recommendations for potential cost-savings at representative current and future sites. It is state-of-the-art as there is currently no other model that can pro-vide this level of detailed analysis across a project life-cycle. The model itself has the potential to accelerate and standardise the RD&P stage of a project and thus, ultimately result in cost reductions. The financial mod-el developers have also been contacted by a number of stakeholders for future collaborations using the model including some of the largest offshore wind develop-ers, offshore floating platform designs, shipping/vessel developers and wind industry representatives. Their requests included the analysis of a new vessel design for WT installation; a new WT platform and installation method; decommissioning analysis to aid in risk assess-ment for large portfolios of wind farms and installation analysis. This is in addition to industry participation in the validation of the modules of the financial model. The LEANWIND financial analysis of innovations also includ-ed analysis of the ELISA telescopic WT tower platform as another collaboration with industry.
71
Conclusion
Driving Cost Reductions in Offshore WindThe LEANWIND Project Final Publication
This ambitious project has considered improvements from a whole-system perspective and results are relevant for a wide range of stakeholders. At every stage, LEAN-WIND sought to ensure research is applicable to industry and undertook studies to assess results and facilitate mar-ket uptake as far as possible. It is expected that a num-ber of the project innovations, e.g. the remote presence device, will be further developed and reach the status of commercial products/solutions. Project modelling and testing, field trials and demonstrations have validated innovations and facilitated direct industry-led learning about potential cost savings and risk reduction. A number of projects and proposals will further develop the work of LEANWIND, and a substantial amount of interest has been expressed by industry in continuing to learn from project innovations e.g. the O&M, financial and logistics models. A wealth of knowledge has also been collated and dissem-inated via the LEANWIND project through public reports, side-events, three stakeholder workshops, conference presentations, posters, journal papers etc. This will pro-vide a bedrock of information for industry and researchers to build on.
This conclusion summarises how LEANWIND has produced state-of-the-art technologies and tools as well as recom-mendations that can provide costs reductions across the OWF life-cycle and supply-chain. The innovations seek to promote the use of lean principles, removing unnecessary and optimising required activities; enhancing quality and minimising risk; and offering alternative procedures and technologies. The novel solutions delivered by LEANWIND meet key industry needs and will support continued cost reductions, particularly for the more extreme sites of the future. This will help to guarantee the competitiveness of offshore wind and the EU’s leadership in this sector.
www.leanwind.eu