Embed Size (px)
Citation preview

Promotion Optimization Institute Spring 2013 Summit
Driving Business Insights and Resultsthrough DSR-Sourced Analytics
Speaker: Bob Hannah – Managing Director
Data Ventures, Inc.

Valuable (But Overwhelming) Data Streams For CPGs
Delivery DataSupply Chain
DataRetailer POS
Data(100s)
Retailer LoyaltyData
SyndicatedData Sources
Proprietary CPGShopper Data
DIFFICULTY TO MANAGE & UTILIZE ALL AVAILABLEINFORMATION
Consumer Data
1. Consistent and Robust DSR2. Consistent and Advanced Analytics
True Insights
Targeted In-Market Action
Improved Business Results
SolutionMust BeScalable
CPG Needs:
The Current Environment
2

Promotion Optimization Institute Spring 2013 Summit
DRIVING THE COLLABORATIVE AGENDA!
3
Spun out from the U.S. National Labs in LosAlamos, NM in 1994‒ Big Data processing with Massive Scale Pattern
Recognition Algorithms
Principal Clients (not full list)‒ The Global Coca-Cola System: DV has worked
together with Coke and Major Retailers in 36countries (to date)
‒ US and International Retailers• Supermarket, C&C and Convenience Retail

4
Analytic Possibilities @ Full Category/SKU Level Data Granularity
SignificantImprovements in
Targeted Marketing& Effectiveness
The Current Environment

First Steps On The Analytic Action PathValue Generation vs. Difficulty
5
RelativelyDifficult
RelativelyEasy
Ease/AbilityToImplement
Level 1 Level 2 Level 3 Level 4 Level 5
Starting Point:Shared CollaborativePlanning Vision ForThe Category
- Manufacturer- Retailer
Remove Inefficiencies:Out-of-ShelfAssortment OptimizationSpace Optimization
Revenue IncreaseWorking Capital Reduction
Store Segmentation
Even Better- OOS Reduction- Assortmt Opt’n- Space Optim’n
Improved TradePromotion Practices- “Effective Retail
Pricing” only- Utilize Brand &
Package Switching- TPM
Advanced Demand-Based ForecastingLinked to TPOOn Time, In FullImproved Merch
SchedulingSupply Chain
Efficiencies
PromotionDecomposition- Understanding
Time Shifting &Cannibalization(Self & Category)
Value Generation
CATEGORY/DAILY LEVEL DATA
POS OR T-LOG LEVEL DATA
POS OR LOYALTY CARD DATA
CATEGORY/DAILY LEVEL DATA
CATEGORY/DAILY LEVEL DATA

Utilizing Shopper Intelligence to Drive the Collaborative Agenda
6
Previous Discussion (November 2012) Shared real-world examples of two high-impact Shopper Analytics applications:
1. Shopper Behavior-based Assortment Optimization + Inventory Optimization
→ Reduced Out-of-Shelf conditions
→ Reduced Working Capital
→ Increased Sales growth
2. Promotion Decomposition
→ Understanding of True Promotion Incrementality
• Net of Time Shifting and Self/Category Cannibalization
→ Optimized Promotion planning

Today’s Discussion One updated real-world example, plus one new high-impact Shopper Analytics application
1. Shopper Behavior-based Assortment Optimization + Inventory Optimization
→ Reduced Out-of-Shelf conditions
→ Reduced Working Capital
→ Increased Sales growth
2. Pricing Strategy Change Impact
→ From “Extreme High-Low”
→ To “ED Very Low Price”
→ Incorporating Promotion Decomposition
Driving Business Insights and Results through DSR-Sourced Analytics
7
8
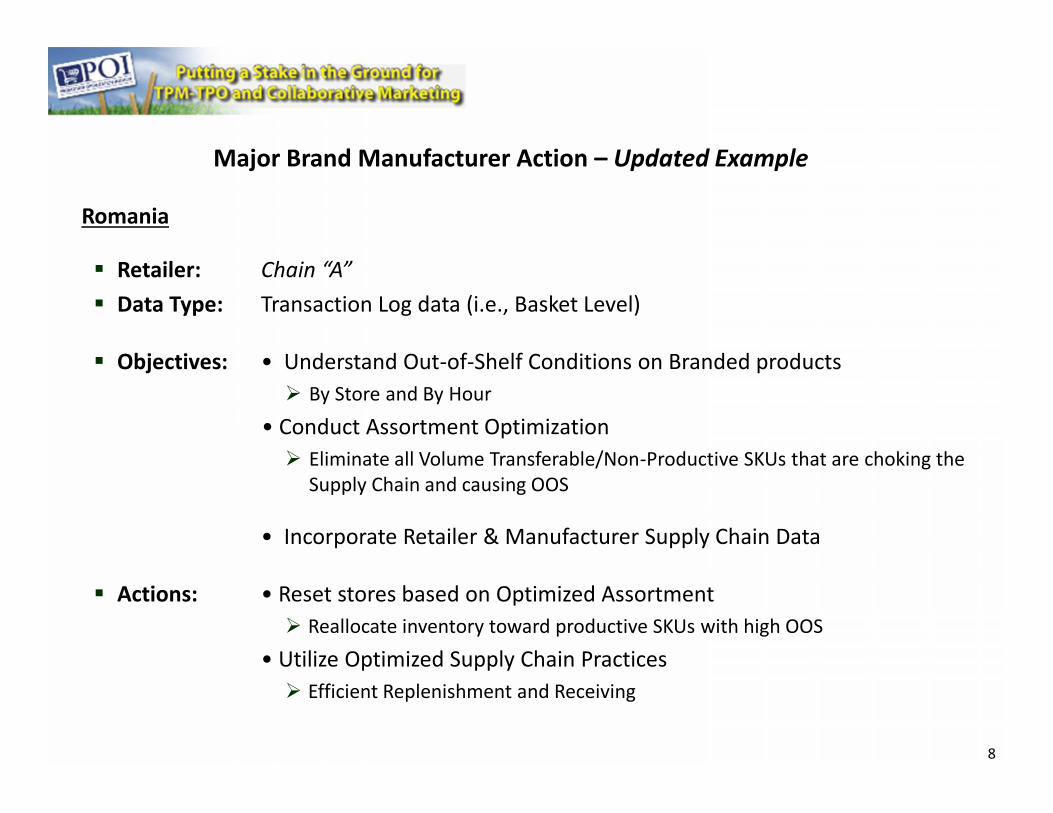
Romania
Retailer: Chain “A” Data Type: Transaction Log data (i.e., Basket Level)
Objectives: • Understand Out-of-Shelf Conditions on Branded products By Store and By Hour
• Conduct Assortment Optimization Eliminate all Volume Transferable/Non-Productive SKUs that are choking the
Supply Chain and causing OOS
• Incorporate Retailer & Manufacturer Supply Chain Data
Actions: • Reset stores based on Optimized Assortment Reallocate inventory toward productive SKUs with high OOS
• Utilize Optimized Supply Chain Practices Efficient Replenishment and Receiving
Major Brand Manufacturer Action – Updated Example

Romania: OOS Event Report – Details (by Store, by Item)
OOS-Duration
Average Duration (days) ofNon-Intraday OOS-Events: Days without Sales for Top Items
Check Supply Chain Issues
Average Duration(Hours) of IntradayOOS-Events:
Hour/Day Sun Mon Tue Wed Thu Fri Sat
50 % 0 % 0 % 0 % 0 % 0 % 0 %
61 % 1 % 1 % 1 % 1 % 1 % 1 %
71 % 2 % 2 % 2 % 2 % 2 % 3 %
83 % 3 % 3 % 4 % 3 % 3 % 4 %
94 % 5 % 5 % 5 % 5 % 5 % 4 %
107 % 7 % 6 % 7 % 7 % 8 % 7 %
111 0 % 8 % 9 % 1 0 % 9 % 8 % 8 %
121 2 % 9 % 1 0 % 1 1 % 1 1 % 1 0 % 1 0 %
131 2 % 1 0 % 1 1 % 1 1 % 1 1 % 1 1 % 1 0 %
141 2 % 1 1 % 1 1 % 1 1 % 1 1 % 1 1 % 1 1 %
151 1 % 1 0 % 9 % 9 % 9 % 1 0 % 1 1 %
168 % 7 % 7 % 8 % 8 % 8 % 8 %
176 % 8 % 7 % 7 % 7 % 7 % 8 %
186 % 7 % 6 % 5 % 6 % 6 % 5 %
193 % 5 % 5 % 4 % 4 % 5 % 4 %
203 % 4 % 3 % 3 % 3 % 3 % 3 %
212 % 2 % 2 % 2 % 2 % 2 % 2 %
220 % 1 % 1 % 0 % 1 % 0 % 1 %
Most OOS Eventsstart at particulartime of day
Check Inventory,Supply Chain andoptimizeMerchandisingHours towardsthese hours
Stage #1: T-Log data enabled understanding of Intra-Day OOS, plus OOS duration
Store #___, Product ___, Week ___
9

Romania Stage #2: Expanded OOS Analysis
With Manufacturer and Retailer collaboration, key Supply Chain data wasincorporated into the analysis, which enabled understanding into root causes: Due to Delivery/Supply Chain issues? Caused by in-store conditions (wrong SKUs, wrong space, etc)?
KPI’s to support the processFill Rate (%)
Fill Rate (%) - promo
On-time deliveries (%)
Lead time (days)
Stock availability (%)
Stock coverage (days)
Out of Shelf Rate (%) Data Ventures
False Inventory detection
Late Orders / Emergency Orders
Impact on Lost Sales is measured to support prioritization
10

Romania – Actionable Output Summary
1. Exception Reporting– Identify SKUs with highest OOS
2. Supply Chain Analyses– Identify Root Causes by Store
3. Assortment Optimization– Identify SKUs without “Shopper Rationale”
→ Redundant & Volume Transferable→ Clogging the Supply Chain Delist
‒ Reallocate inventory to Productive SKUs
4. Prioritized Action Plan
11

IMPROVEMENTInitial OOS
Country Channel Retailer # Stores OOS Rate Reduction Sales Increase
Romania C & C Metro 26 13.8% (8.5) pts / 3 yrs +5.7 pts per yearUSA Petro Pantry 75 4.8% (1.0) pt / 1 yr +2.7 ptsGermany Hyper real,- 90 15.7% (1.9) pts / 1 yr +4.7 ptsMexico Petro OXXO 20 10.4% (4.4) pts / 1 yr +9.9 ptsItaly Super Carrefour 20 18.3% (4.2) pts / 1 yr +5.7 pts
Romania: Exceptional Results – Updated The value of store clustering, assortment optimization, and demand-based out-of-stock analytics using shopper
data has been strong in this example, and proven in many other countries and trade channels around the world
Other Examples
12

13
USA Retailer: Chain “A” Product: Frozen Brand “Z” Data Type: Loyalty Card data (i.e., Household Level)
Situation: • Change in Pricing and promotion strategy from High-Low toED Very Low Price
Objectives: • Understand the impact of these strategy changes on: Sales and Units Effectiveness / Incrementality Household Franchise
Actions: • Monitor Sales results trends Household trends
Total HHs and Exclusive HHs• Utilize Promotion Decomposition True Incremental, net of Time Shifting and Cannibalization
Major Brand Manufacturer Action – Example

14
Across 2012, Brand “Z” employed 4 different Pricing and Promotion strategiesUSA Frozen Product Example
High-Low
Q1: Notworking well

15
Across 2012, Brand “Z” employed 4 different Pricing and Promotion strategiesUSA Frozen Product Example
High-Low
Q2: Slightlyworse
Reduced Everyday Price,Compressed High-Low

16
Across 2012, Brand “Z” employed 4 different Pricing and Promotion strategiesUSA Frozen Product Example
High-Low
Q3: $ Salesdecline
continues
Reduced Everyday Price,Compressed High-Low
Low Everyday WithLower Promotions

17
Across 2012, Brand “Z” employed 4 different Pricing and Promotion strategiesUSA Frozen Product Example
High-Low
Q4: Unitgrowth
returns, but$ declinesaccelerate
Reduced Everyday Price,Compressed High-Low
Low Everyday WithLower Promotions
Everyday VeryLow Price

18
The overall Frozen subcategory in which Brand “Z” competes also did not benefit duringthis time.
‒ Units increased in Q4,
‒ But the Retail Price was reduced so much that Retail Sales declined by (11.7%)• Possibly driving more shopper traffic to store but no benefit Brand Z or the subcategory• Selling more subcategory units, but possibly without Profit
USA Frozen Product Example
Q4: Samepattern also
for theSubcategory
1.3%
-0.5%
0.8%
-11.7%-11.8% -12.8%
1.9%
7.0%
14.9% 14.2%
-1.0%
-17.5%
2012 Q1 2012 Q2 2012 Q3 2012 Q4
Sales % Change Units % Change Average Retail % Change
CHAIN A – Frozen SubcategorySales Value and Unit Sales Percent Change versus Last Year

19
Promotion DecompositionAnalysis Approach Each product is evaluated using its own Shopper Purchase Behavior
– “Time Shifting – Post” will be based on one purchase cycle (3 weeks for the Subcategoryexample at this Retailer)

Question: When are promotions truly successful?
PROMOTED SUPPLIEROTHER
PRODUCT ---- TIME ---- SELF- ----PRODUCT
INCREMENTAL SHIFTING CANNIB’NCANNIB’N
– Supplier/CPG:
Positive Total Supplier Sales
– Retailer:
Positive Total Category Sales
Promotions usually fall into 3 possible “outcome classes”:1. “Win/Win” Both the Supplier and the Retailer have net positive results
2. “Win/Lose” Only the Supplier has net positive results
3. “Lose/Lose” Neither have net positive results
Sometimes “Lose/Win” can occur Usually linked to other promotions in the Category 20
Promotion Decomposition
=

Promotion Decomposition
‒ And in the ability to sustain the number of Brand “Z” Loyal HHs and Switchers
21
Sample of Summary Findings: As retail pricing on Brand “Z” moved toward Every Day Very Low Pricing, the promotions
became less and less effective‒ Both in the ability to generate “Truly Positive” results for both parties

PromotionDecomposition
Promotion Types:
Mfr Retailer
Win Win
Win Lose
Lose Lose
22
RelativelyDifficult
RelativelyEasy
Ease/AbilityToImplement
Level 1 Level 2 Level 3 Level 4 Level 5
Starting Point:Shared CollaborativePlanning Vision ForThe Category
- Manufacturer- Retailer
Remove InefficienciesOOS RevRed’n Incr
Pts Pts
Germany (1.9) +4.4
Romania (8.5) +5.7(3 yrs)
StoreSegmentation
OOS RevRed’n Incr
Pts PtsMexico (4.4) +9.9
Italy (4.2) +5.7
Advanced Demand-Based Forecasting
• 25+ pts increase inforecast accuracy
Improved TradePromotion Practices
Ex: Brazil Chain AMajor Brand 1.5L
Price Unit RevDisc Lift Lift(10%) 80% 61%
(15%) 84% 52%
(20%) 91% 52%
(35%) 191% 89%
Value Generation
First Steps On The Analytic Action PathProven Results

23
Bob Hannah Managing Director‒ Email: [email protected]
‒ Phone: +1.704.887.1007 Mobile: +1.704.965.3167
Thank You!
Advanced | Effective | Actionable | Proven Analytics™
AWARDS: FMI/GMA OUT-OF-SHELF BEST PRACTICE (WITH P&G) EUROPEAN ECR BEST PRACTICE
COCA-COLA / WALMART INTERNATIONAL CATEGORY CAPTAIN
COCA-COLA HELLENIC – BEST PRACTICE AWARD
COCA-COLA REFRESHMENTS – NEURAL NET/TPO