Embed Size (px)
Citation preview

Driven to Tiers: Evidence for a Two-Tiered System of Nursing Home Care
Jacqueline ZinnTemple University
Vincent MorBrown University
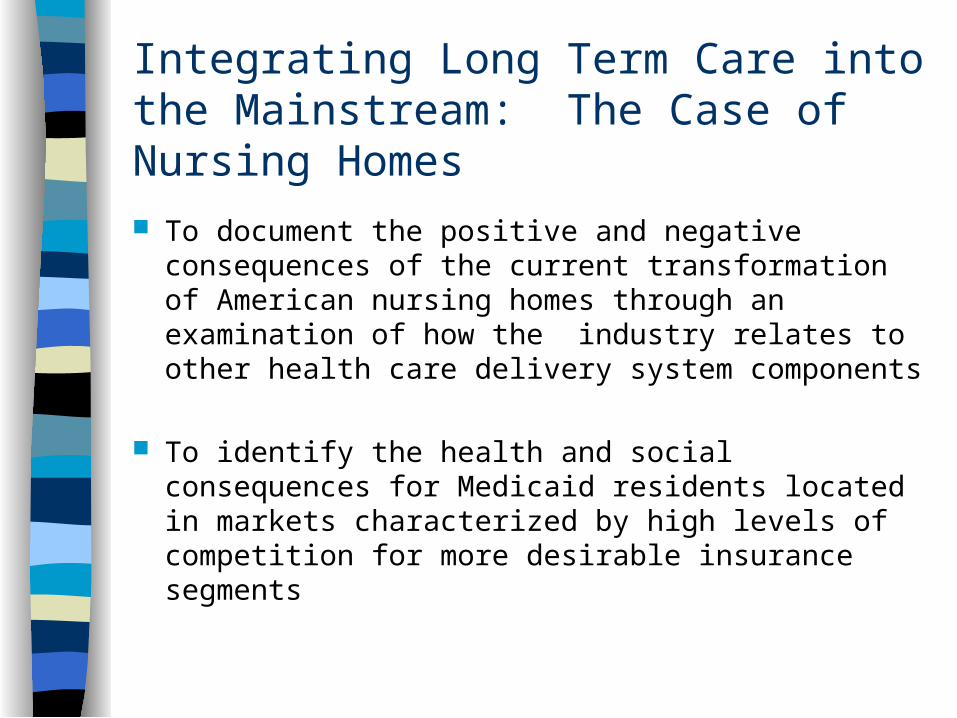
Integrating Long Term Care into the Mainstream: The Case of Nursing Homes
To document the positive and negative consequences of the current transformation of American nursing homes through an examination of how the industry relates to other health care delivery system components
To identify the health and social consequences for Medicaid residents located in markets characterized by high levels of competition for more desirable insurance segments
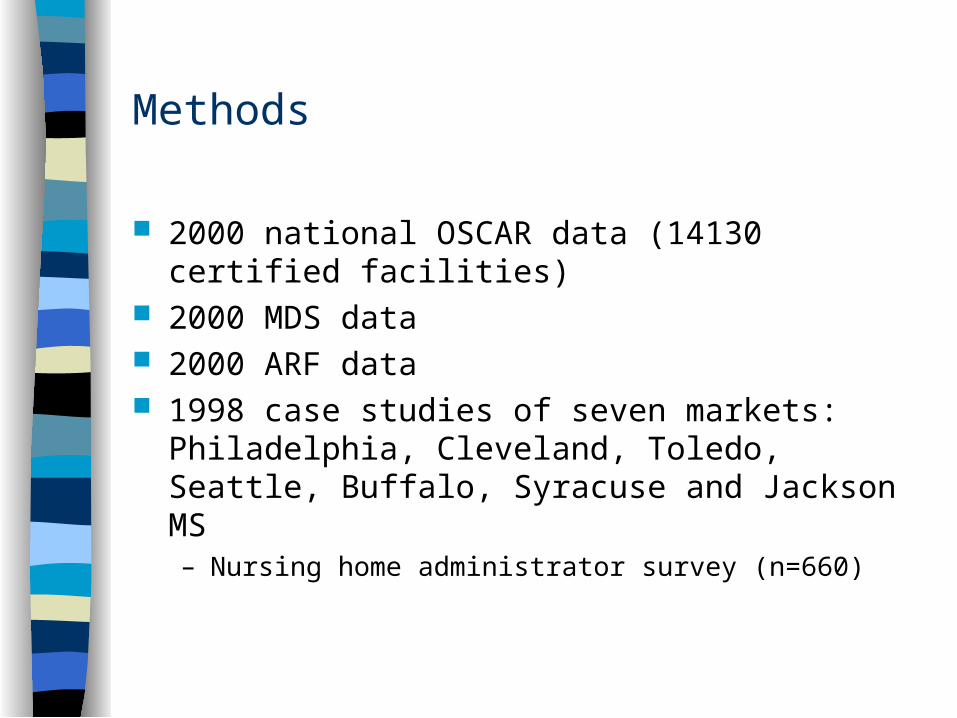
Methods
2000 national OSCAR data (14130 certified facilities) 2000 MDS data 2000 ARF data 1998 case studies of seven markets: Philadelphia,
Cleveland, Toledo, Seattle, Buffalo, Syracuse and Jackson MS– Nursing home administrator survey (n=660)
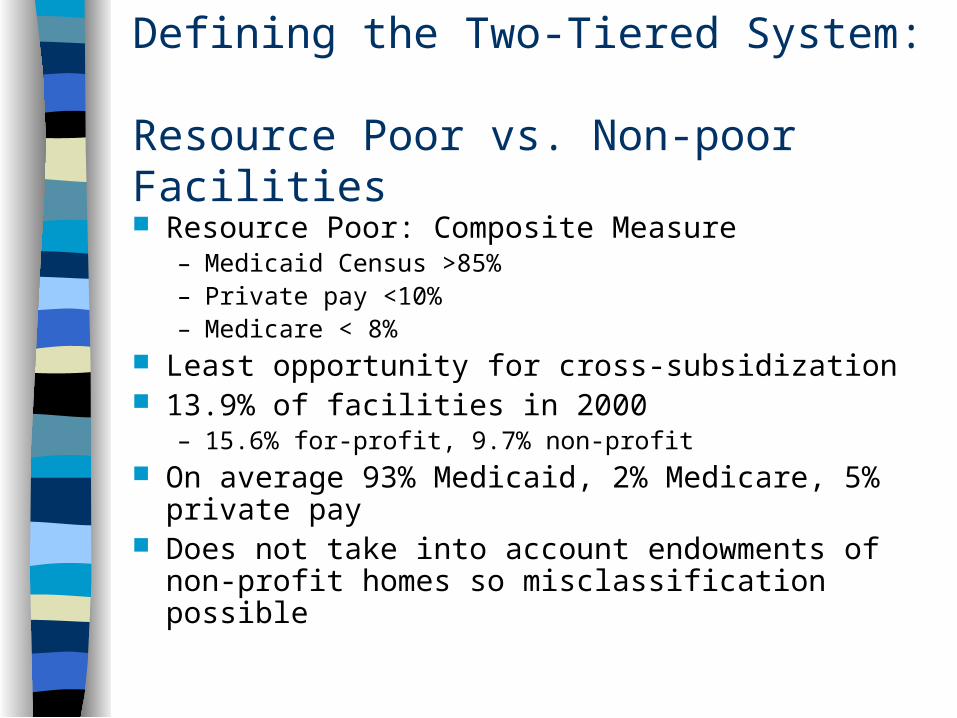
Defining the Two-Tiered System: Resource Poor vs. Non-poor Facilities
Resource Poor: Composite Measure– Medicaid Census >85%– Private pay <10%– Medicare < 8%
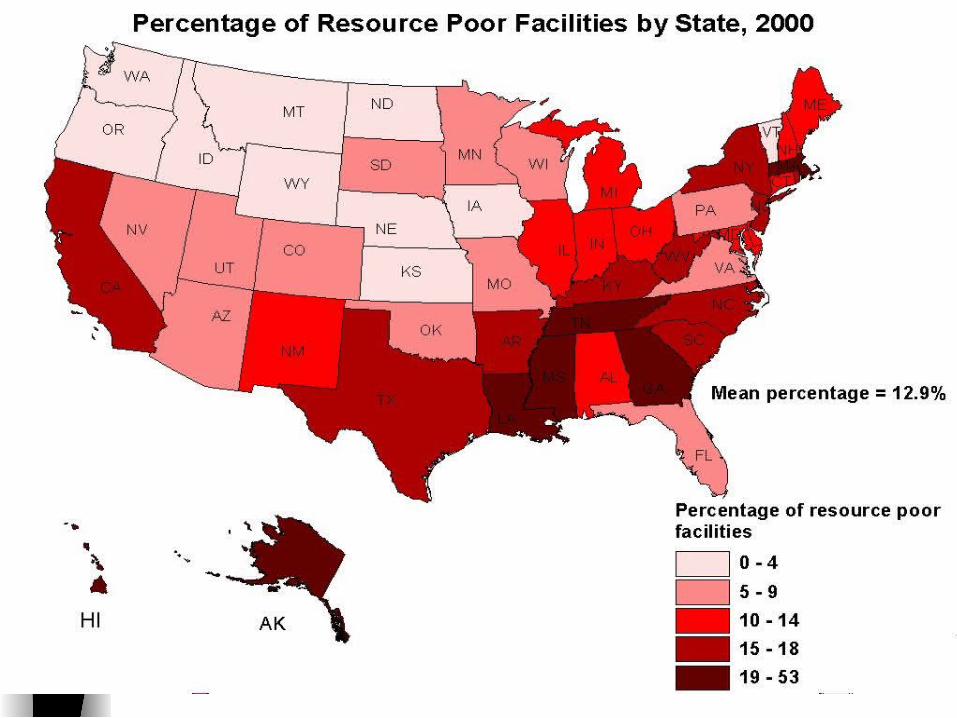
Least opportunity for cross-subsidization 13.9% of facilities in 2000
– 15.6% for-profit, 9.7% non-profit On average 93% Medicaid, 2% Medicare, 5% private
pay Does not take into account endowments of non-profit
homes so misclassification possible
Where are They?
Resource poor facilities are located in resource poor communities
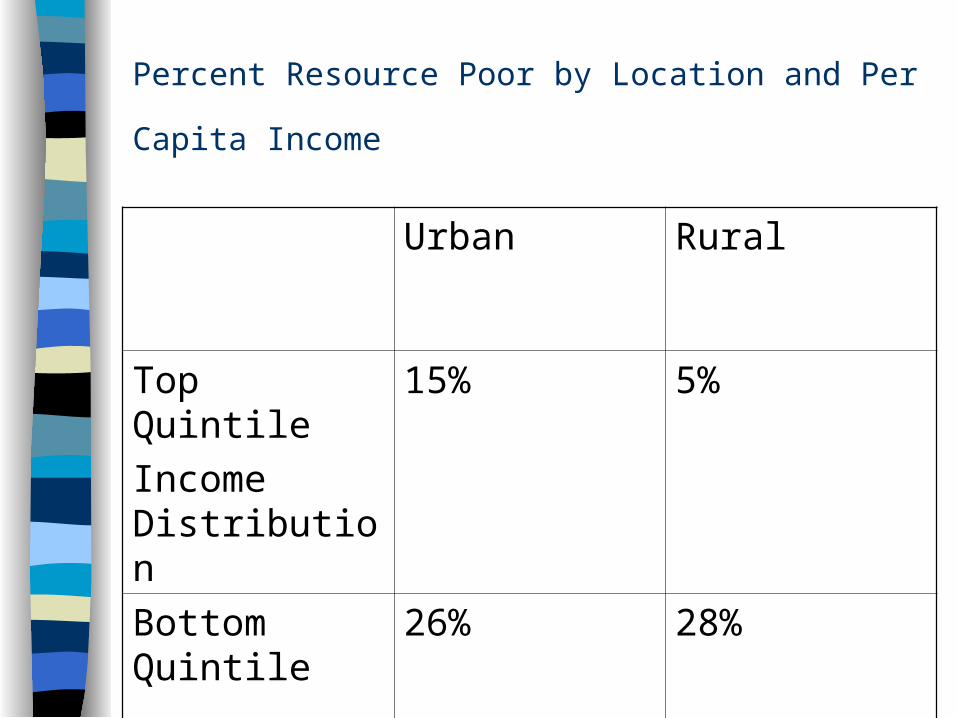
Percent Resource Poor by Location and Per Capita Income
Urban Rural
Top Quintile
Income Distribution
15% 5%
Bottom Quintile
26% 28%
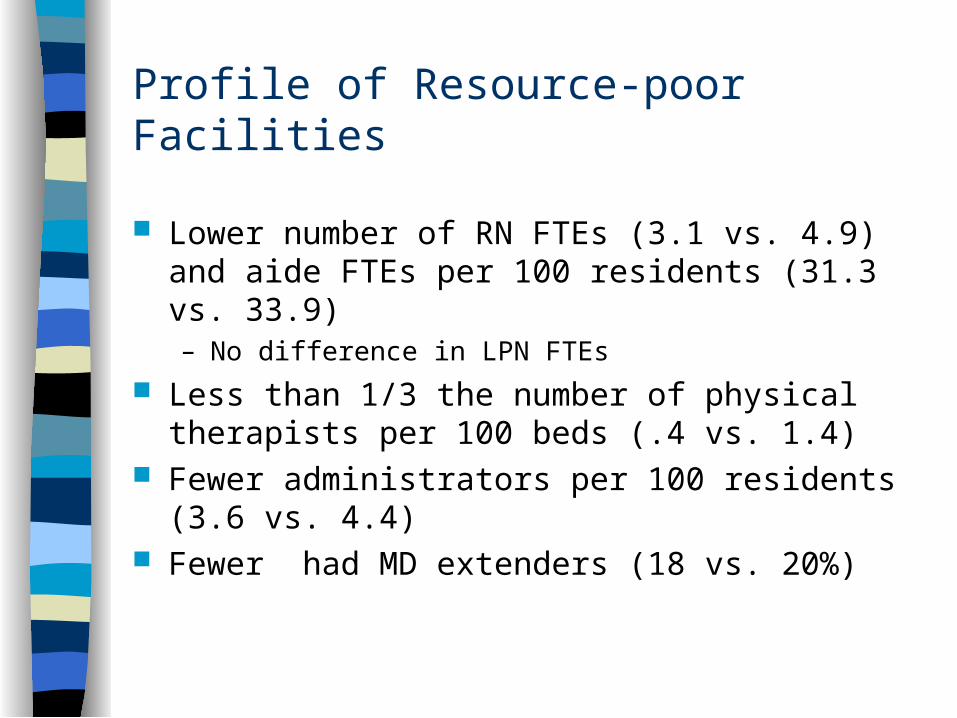
Profile of Resource-poor Facilities
Lower number of RN FTEs (3.1 vs. 4.9) and aide FTEs per 100 residents (31.3 vs. 33.9)– No difference in LPN FTEs
Less than 1/3 the number of physical therapists per 100 beds (.4 vs. 1.4)
Fewer administrators per 100 residents (3.6 vs. 4.4) Fewer had MD extenders (18 vs. 20%)
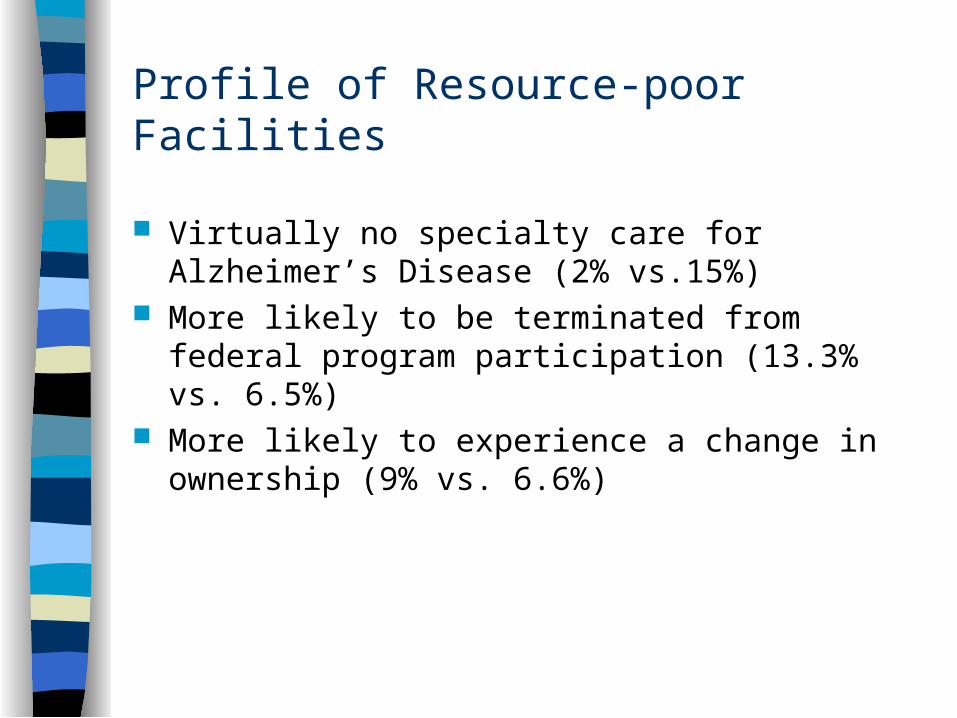
Profile of Resource-poor Facilities
Virtually no specialty care for Alzheimer’s Disease (2% vs.15%)
More likely to be terminated from federal program participation (13.3% vs. 6.5%)
More likely to experience a change in ownership (9% vs. 6.6%)

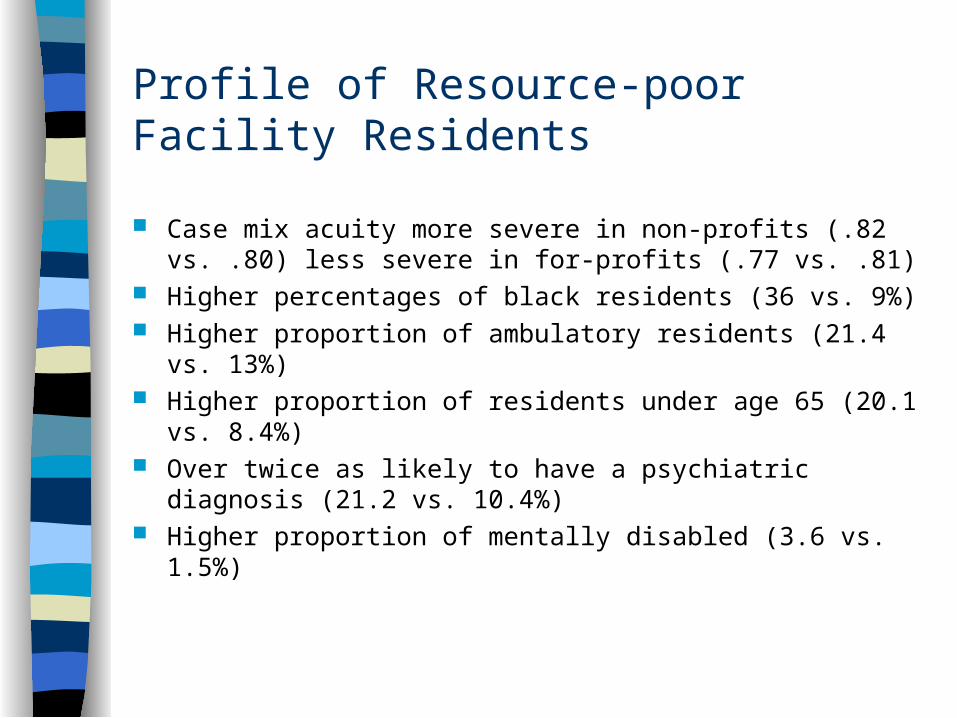
Profile of Resource-poor Facility Residents
Case mix acuity more severe in non-profits (.82 vs. .80) less severe in for-profits (.77 vs. .81)
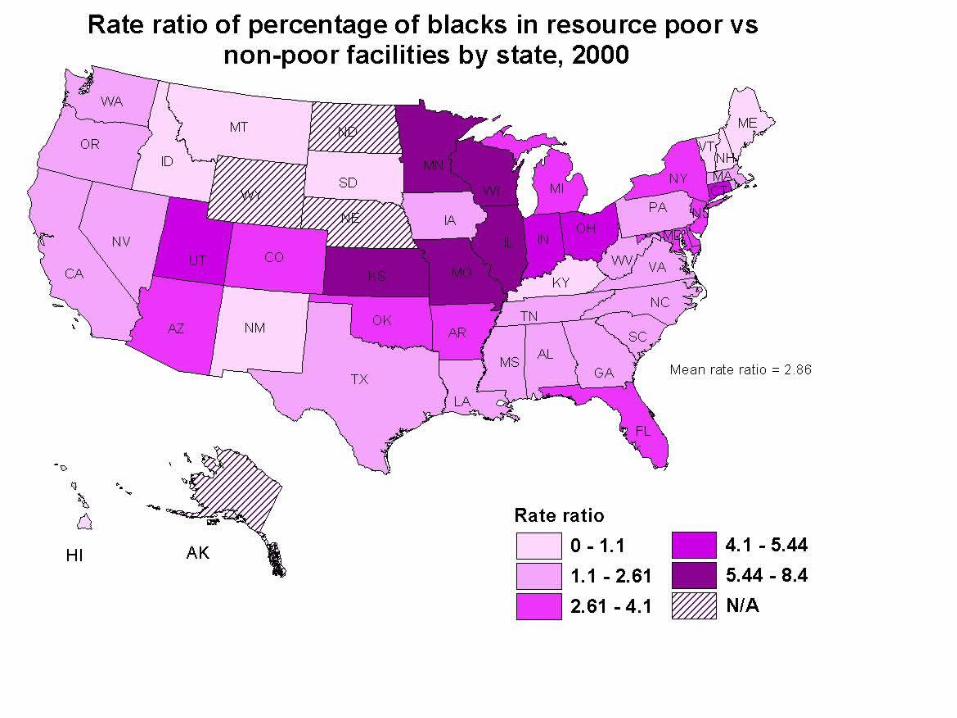
Higher percentages of black residents (36 vs. 9%) Higher proportion of ambulatory residents (21.4 vs. 13%) Higher proportion of residents under age 65 (20.1 vs. 8.4%) Over twice as likely to have a psychiatric diagnosis (21.2 vs.
10.4%) Higher proportion of mentally disabled (3.6 vs. 1.5%)
Profile of Resource-poor Facility Residents
Case mix acuity more severe in non-profits (.82 vs. .80) less severe in for-profits (.77 vs. .81)
Higher percentages of black residents (36 vs. 9%) Higher proportion of ambulatory residents (21.4 vs. 13%) Higher proportion of residents under age 65 (20.1 vs. 8.4%) Over twice as likely to have a psychiatric diagnosis (21.2 vs.
10.4%) Higher proportion of mentally disabled (3.6 vs. 1.5%)
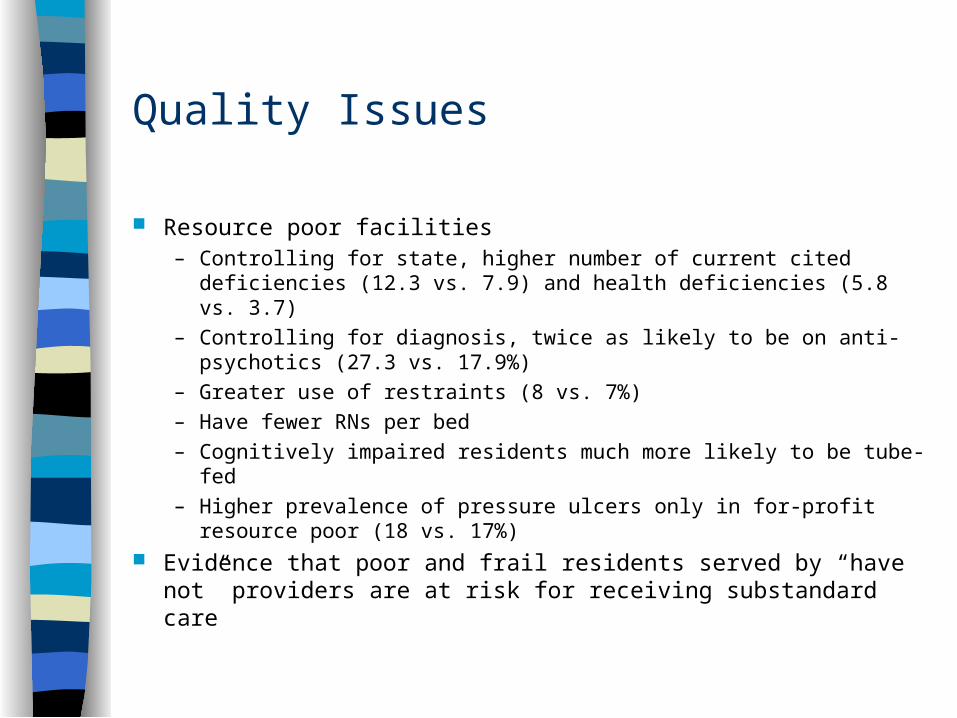
Quality Issues
Resource poor facilities– Controlling for state, higher number of current cited deficiencies
(12.3 vs. 7.9) and health deficiencies (5.8 vs. 3.7)
– Controlling for diagnosis, twice as likely to be on anti-psychotics (27.3 vs. 17.9%)
– Greater use of restraints (8 vs. 7%)
– Have fewer RNs per bed
– Cognitively impaired residents much more likely to be tube-fed
– Higher prevalence of pressure ulcers only in for-profit resource poor (18 vs. 17%)
Evidence that poor and frail residents served by “have not” providers are at risk for receiving substandard care
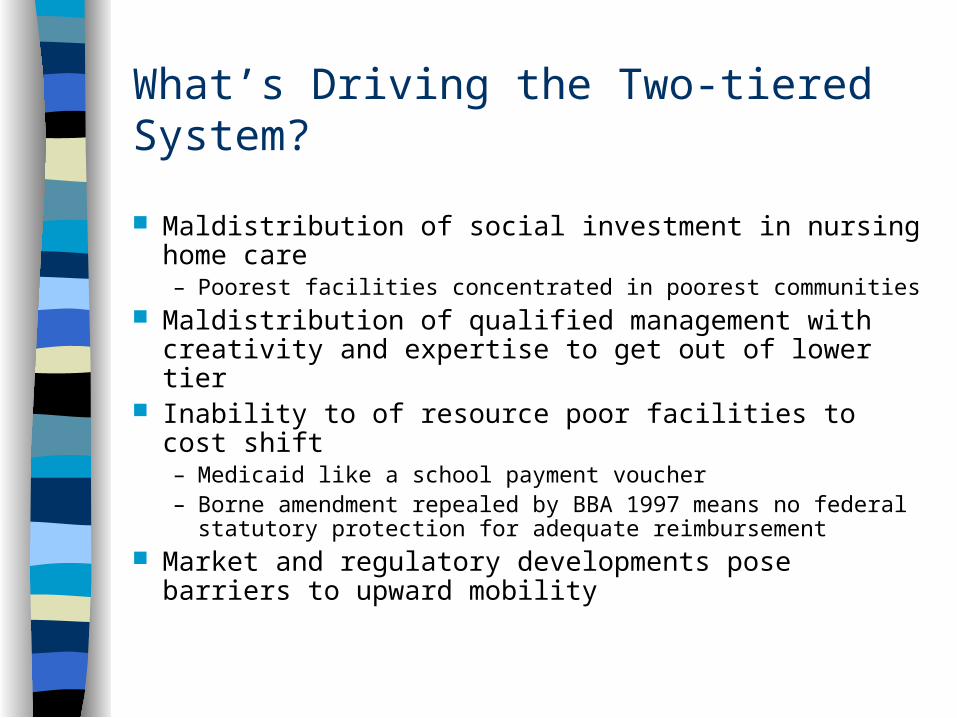
What’s Driving the Two-tiered System?
Maldistribution of social investment in nursing home care– Poorest facilities concentrated in poorest communities
Maldistribution of qualified management with creativity and expertise to get out of lower tier
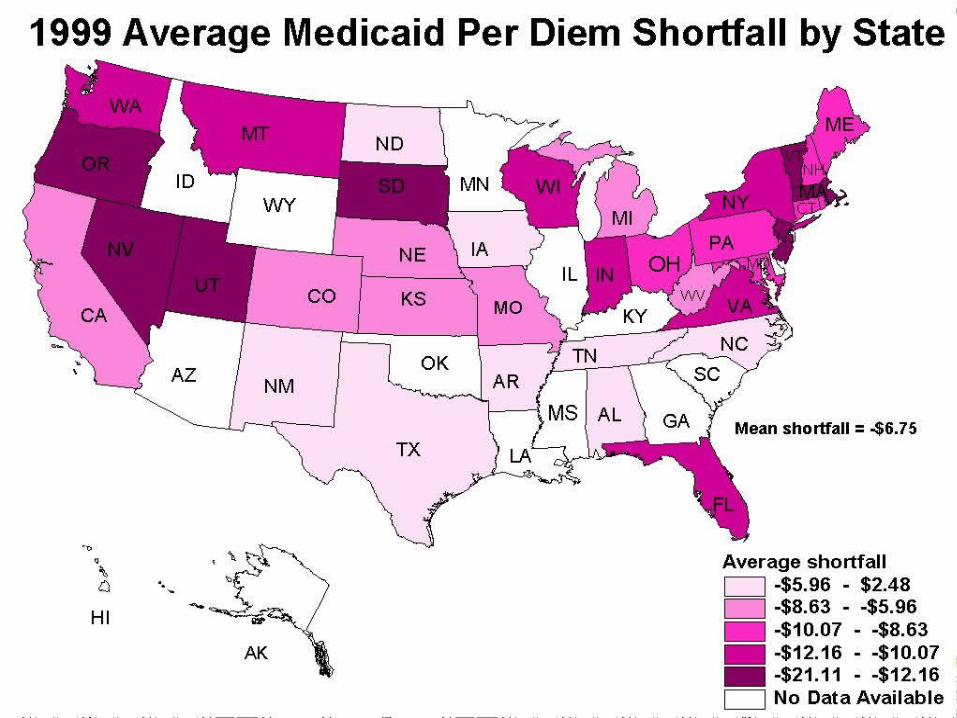
Inability to of resource poor facilities to cost shift– Medicaid like a school payment voucher– Borne amendment repealed by BBA 1997 means no federal
statutory protection for adequate reimbursement Market and regulatory developments pose barriers to
upward mobility

Reinforcing Mobility Barriers in the Two-tiered System: Increased Acuity
Initially prompted by DRG implementation, accelerated by growth of managed care
Proportion of facilities with more than 11% of residents requiring tube feeding:– 1991: 10%
– 1999: 23% Proportion of facilities providing IV therapy services
– 1991: 14%
– 1999: 35% Number of facilities with Medicare census >30% increased from
5.8% to 15% between 1987 and 1995
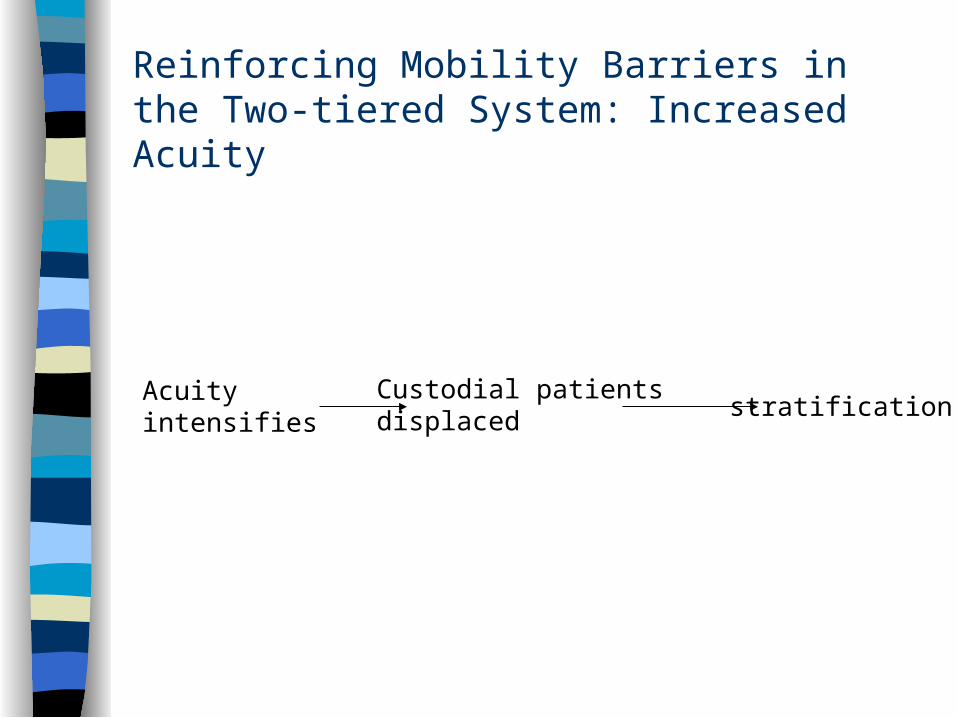
Reinforcing Mobility Barriers in the Two-tiered System: Increased Acuity
Acuityintensifies
Custodial patientsdisplaced stratification
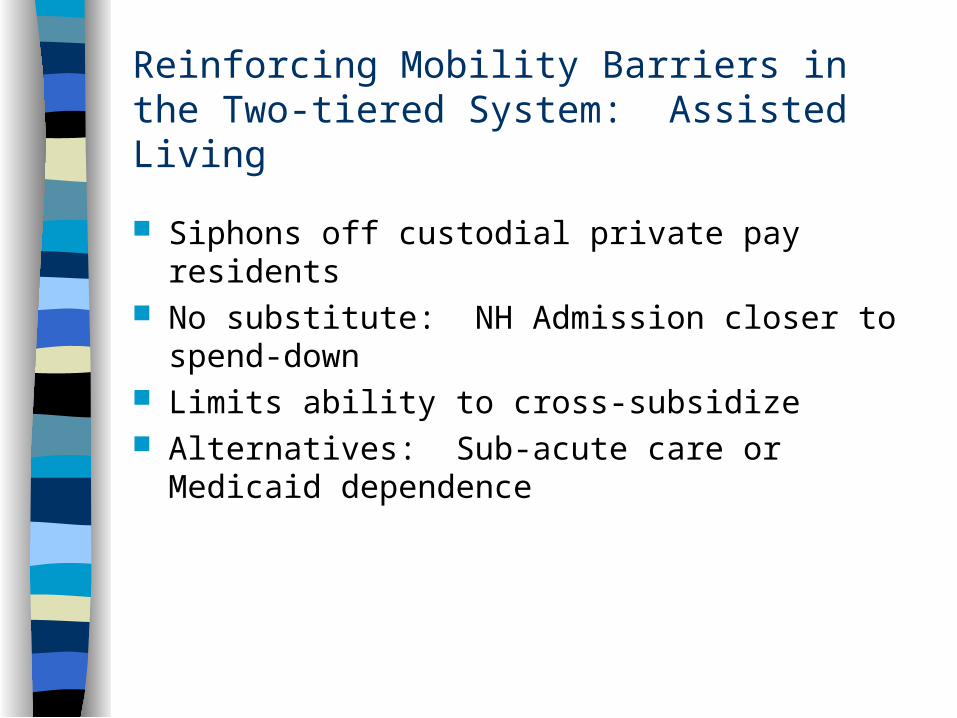
Reinforcing Mobility Barriers in the Two-tiered System: Assisted Living
Siphons off custodial private pay residents No substitute: NH Admission closer to spend-down Limits ability to cross-subsidize Alternatives: Sub-acute care or Medicaid
dependence
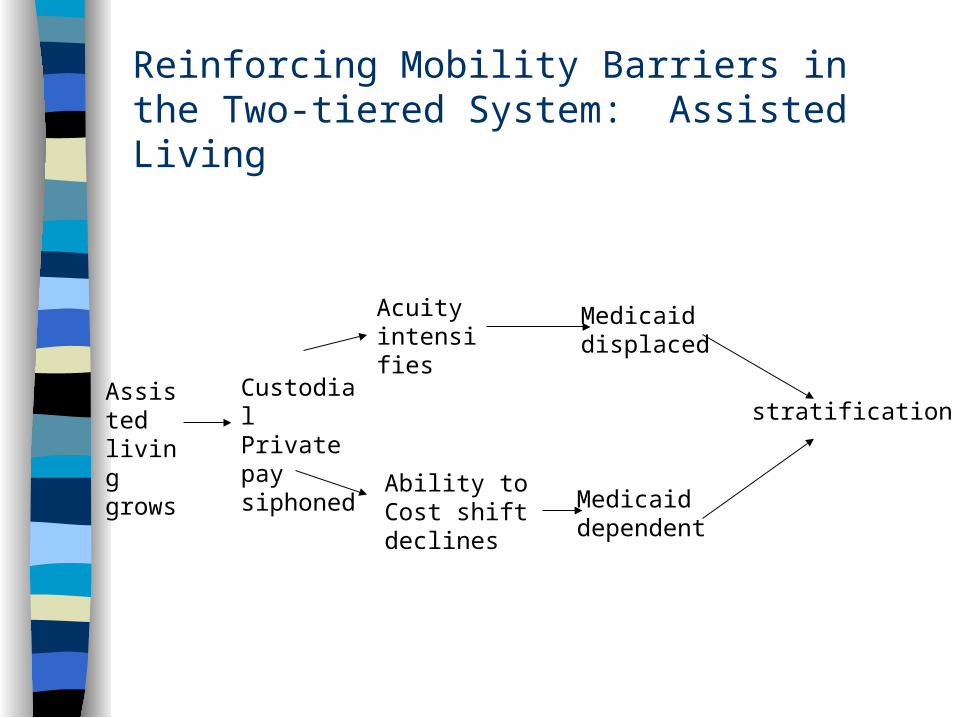
Reinforcing Mobility Barriers in the Two-tiered System: Assisted Living
Assisted livinggrows
CustodialPrivate paysiphoned
Acuityintensifies
Ability toCost shiftdeclines
Medicaiddisplaced
Medicaiddependent
stratification
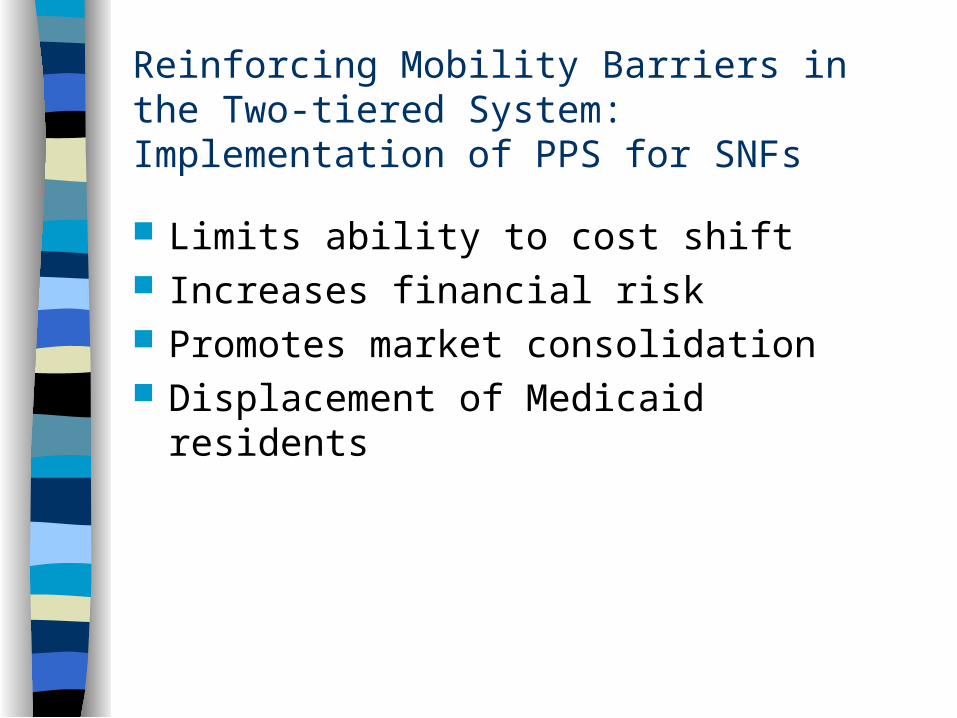
Reinforcing Mobility Barriers in the Two-tiered System: Implementation of PPS for SNFs
Limits ability to cost shift Increases financial risk Promotes market consolidation Displacement of Medicaid residents
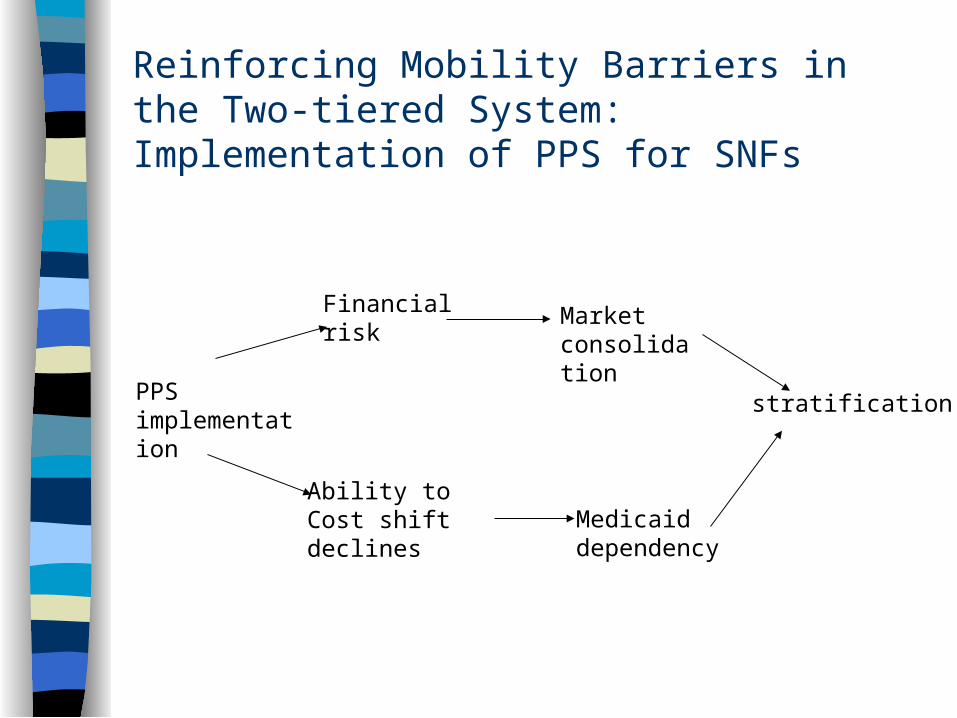
Reinforcing Mobility Barriers in the Two-tiered System: Implementation of PPS for SNFs
PPSimplementation
Financialrisk
Ability to Cost shiftdeclines
Marketconsolidation
Medicaiddependency
stratification
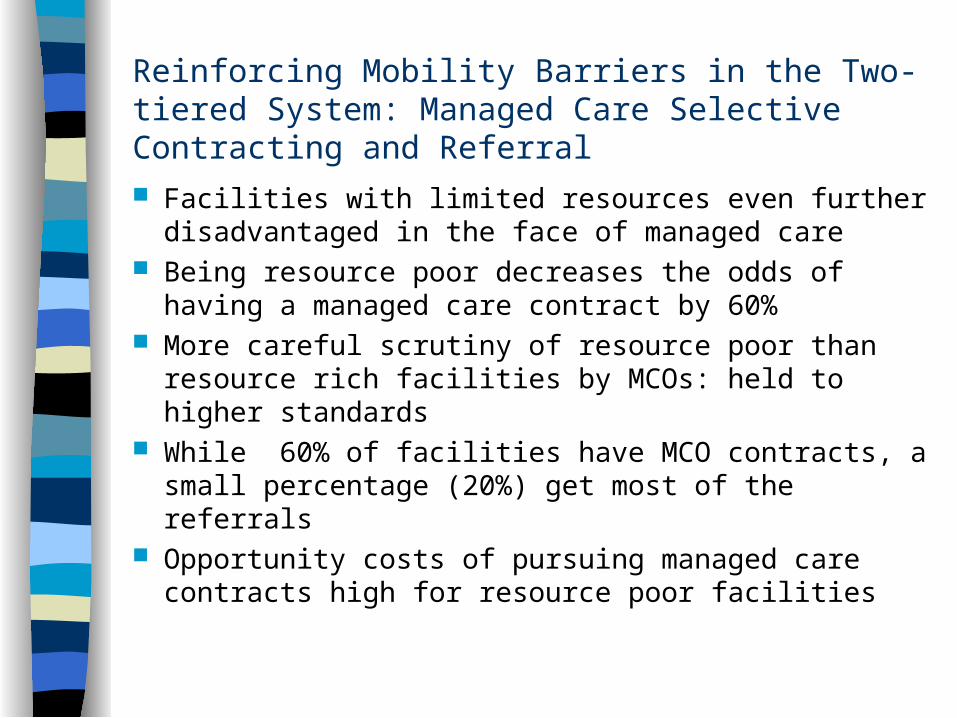
Reinforcing Mobility Barriers in the Two-tiered System: Managed Care Selective Contracting and Referral
Facilities with limited resources even further disadvantaged in the face of managed care
Being resource poor decreases the odds of having a managed care contract by 60%
More careful scrutiny of resource poor than resource rich facilities by MCOs: held to higher standards
While 60% of facilities have MCO contracts, a small percentage (20%) get most of the referrals
Opportunity costs of pursuing managed care contracts high for resource poor facilities
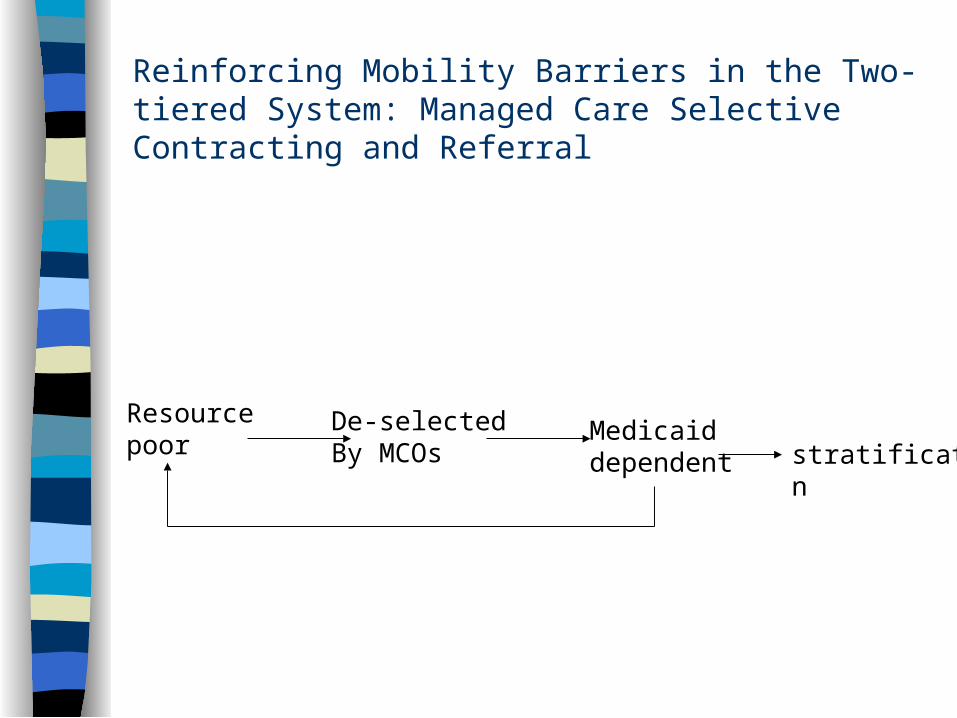
Reinforcing Mobility Barriers in the Two-tiered System: Managed Care Selective Contracting and Referral
Resource poor
De-selected By MCOs
Medicaiddependent stratification
Conclusions
To a greater or lesser degree all US communities facing a transformation of the nursing home sector
Residual pool increasingly relegated to serving higher concentrations of poorly reimbursed Medicaid residents
Low level of resources may compromise ability to provide high quality care
Why Not Let Them Fail?
More likely to be terminated from federal programs
CMS quality indicator reporting Access for minority elders, mentally ill and
challenged Closures effect the poorest communities Challenge:Design policies that enable
transformation without penalizing residents of homes unable to make the transition

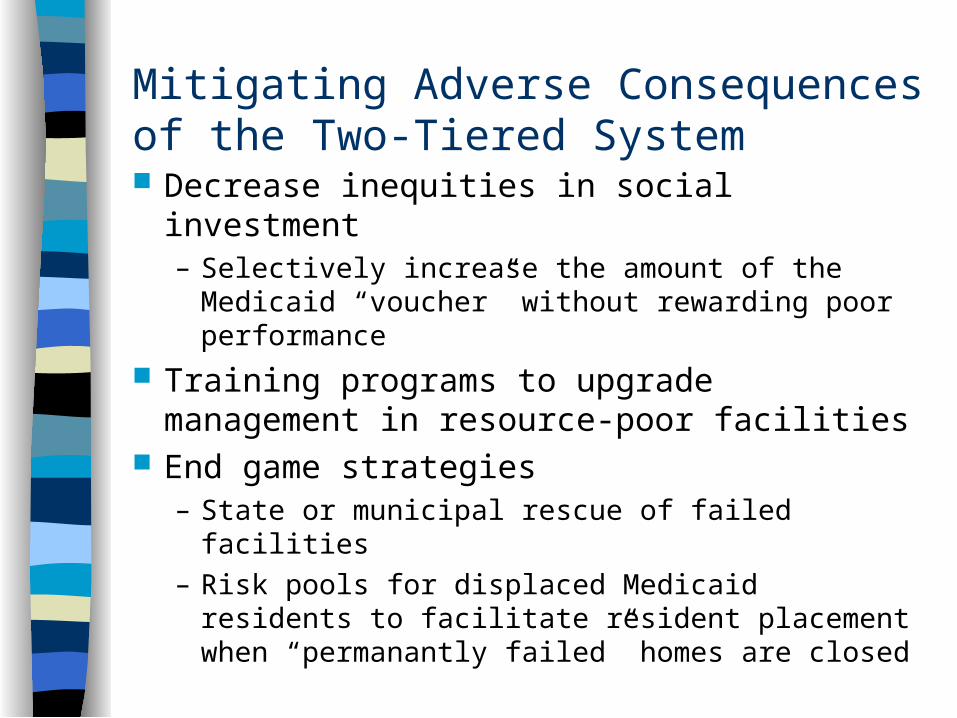
Mitigating Adverse Consequences of the Two-Tiered System Decrease inequities in social investment
– Selectively increase the amount of the Medicaid “voucher” without rewarding poor performance
Training programs to upgrade management in resource-poor facilities
End game strategies– State or municipal rescue of failed facilities– Risk pools for displaced Medicaid residents to
facilitate resident placement when “permanantly failed” homes are closed


![Sobre La Guerra [Zinn]](https://img.pdfslide.us/doc/110x75/577cc4101a28aba71198015c/sobre-la-guerra-zinn.jpg)