Embed Size (px)
Citation preview
Drive Smart
Bay Area Evaluation Report
July 2017
Submitted to:
Metropolitan Transportation
Commission
Submitted by:
Jeff Ang-Olson
Brenda Dix
James Choe
Amanda Tutera
Drive Smart Bay Area
2
Table of Contents
I. Executive Summary ........................................................................................................................ 4
1. Background ................................................................................................................................... 4
2. Program Development and Implementation ................................................................................. 5
3. Evaluation ..................................................................................................................................... 5
4. Recommendations ........................................................................................................................ 6
II. Background...................................................................................................................................... 7
1. Program Background .................................................................................................................... 7
2. Smart Driving Basics .................................................................................................................... 8
2.1 How Does Smart Driving Work? ......................................................................................... 8
2.2 Smart Driving Effectiveness .............................................................................................. 11
III. Program Development and Implementation .............................................................................. 12
1. Selection of Smart Driving In-vehicle Device ............................................................................. 12
1.1 Device Selection ............................................................................................................... 13
1.2 Setting Promotional Pricing .............................................................................................. 16
1.3 Program and Device Restrictions ..................................................................................... 16
2. Marketing Strategy Development ............................................................................................... 16
2.1 Campaign Goals ............................................................................................................... 17
2.2 Opportunities and Challenges .......................................................................................... 17
2.3 Target Market and Potential Audiences ........................................................................... 18
2.4 Program Identity ................................................................................................................ 20
2.5 Messaging ......................................................................................................................... 21
2.6 Campaign Materials and Strategies ................................................................................. 22
3. Marketing Strategy Implementation ............................................................................................ 24
3.1 Earned Media .................................................................................................................... 25
3.2 Paid Media ........................................................................................................................ 26
3.3 Social Media and Email .................................................................................................... 26
3.4 In-Person Events .............................................................................................................. 28
4. Website and Video Development ............................................................................................... 29
4.1 Content .............................................................................................................................. 31
4.2 Format ............................................................................................................................... 32
4.3 Video ................................................................................................................................. 33
5. Establishing Device Purchasing Options ................................................................................... 34
5.1 Online Fulfillment .............................................................................................................. 34
5.2 In-Store Fulfillment ............................................................................................................ 35
IV. Evaluation ...................................................................................................................................... 39
1. Audience Reach ......................................................................................................................... 39
2. Website Visits ............................................................................................................................. 41
2.1 Website Page Views ......................................................................................................... 41
2.2 Video Views and Watch Time ........................................................................................... 43
Drive Smart Bay Area
3
2.3 Educational Resources Accessed .................................................................................... 44
3. Device Purchasing ...................................................................................................................... 45
3.1 Automatic Program Webpage Analytics ........................................................................... 45
3.2 Automatic Device Sales .................................................................................................... 46
4. Greenhouse Gas Impacts ........................................................................................................... 47
4.1 Methodology ...................................................................................................................... 47
4.2 Findings ............................................................................................................................. 49
5. Summary of Impacts ................................................................................................................... 49
V. Recommendations ........................................................................................................................ 51
Appendices ......................................................................................................................................... 55
Appendix A ...................................................................................................................................... 56
Appendix B ...................................................................................................................................... 58
Drive Smart Bay Area
4
I. Executive Summary
1. Background
“Smart driving” refers to a set of strategies and techniques that maximize motor vehicle fuel
efficiency by improving driving habits and vehicle maintenance. A variety of research studies
suggest that drivers can use smart driving principles to reduce their fuel consumption and
associated greenhouse gas (GHG) emissions by up to18%. More recent and rigorous studies
have demonstrated average fuel economy savings of between 2% and 4%.
Smart driving techniques include:
Using smooth starts to minimize rapid acceleration
Driving at constant speed when possible
Anticipating traffic flows and coasting when possible
Observing speed limits and minimizing speeds over 65 mph
Minimizing unnecessary idling
Closing windows and sunroofs when driving over 40 miles per hour
Minimizing use of air conditioning and opening windows instead, if driving under 40 mph
Using cruise control when driving on the highway
Using trip chaining to reduce miles traveled and vehicle trips
Smart driving also encompasses vehicle maintenance techniques such as:
Maintaining proper tire pressure
Eliminating unnecessary weight in the vehicle
Removing roof-racks to improve vehicle aerodynamics
Conducting regularly scheduled vehicle maintenance
As part of efforts to meet per capita GHG emissions reduction targets set by the State of
California, the Metropolitan Transportation Commission (MTC) plans to promote smart driving
over the next 25 years. This effort will include implementing a smart driving education campaign
for the region’s drivers. The effort may include the use of in-vehicle devices, which can be more
effective at altering driver behavior than general tips or delayed online feedback because they
provide real time feedback (visually or through auditory cues) to discourage inefficient driving
habits.
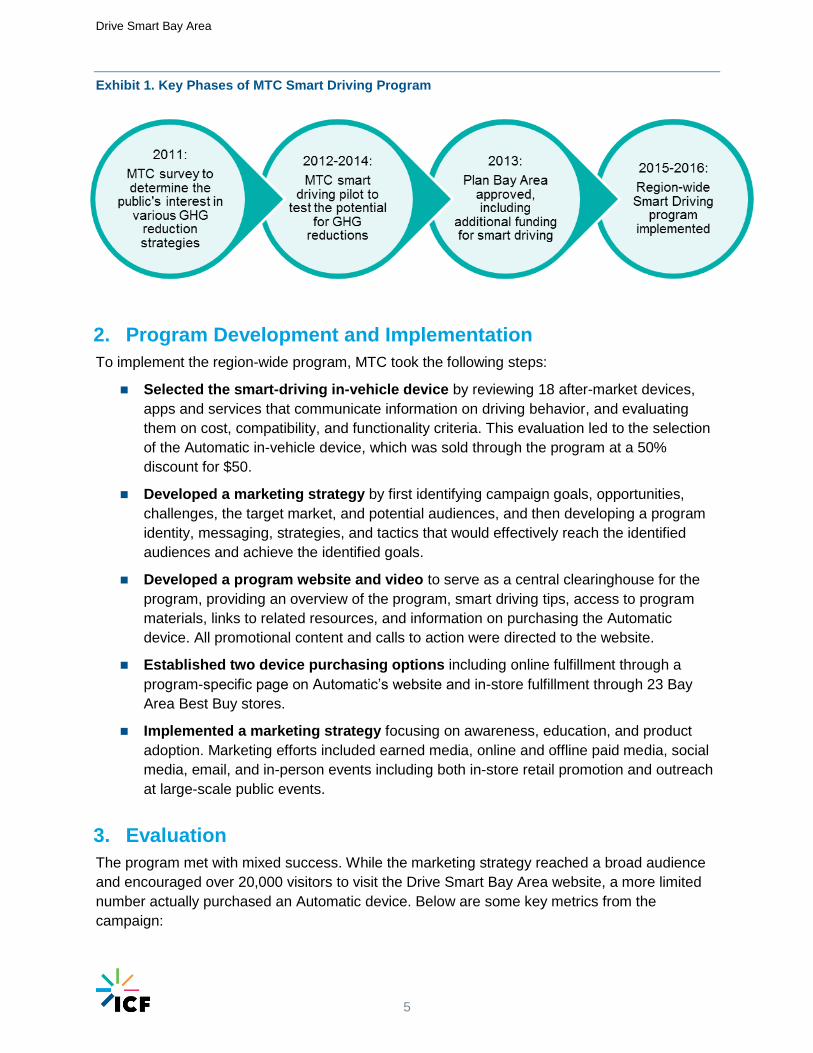
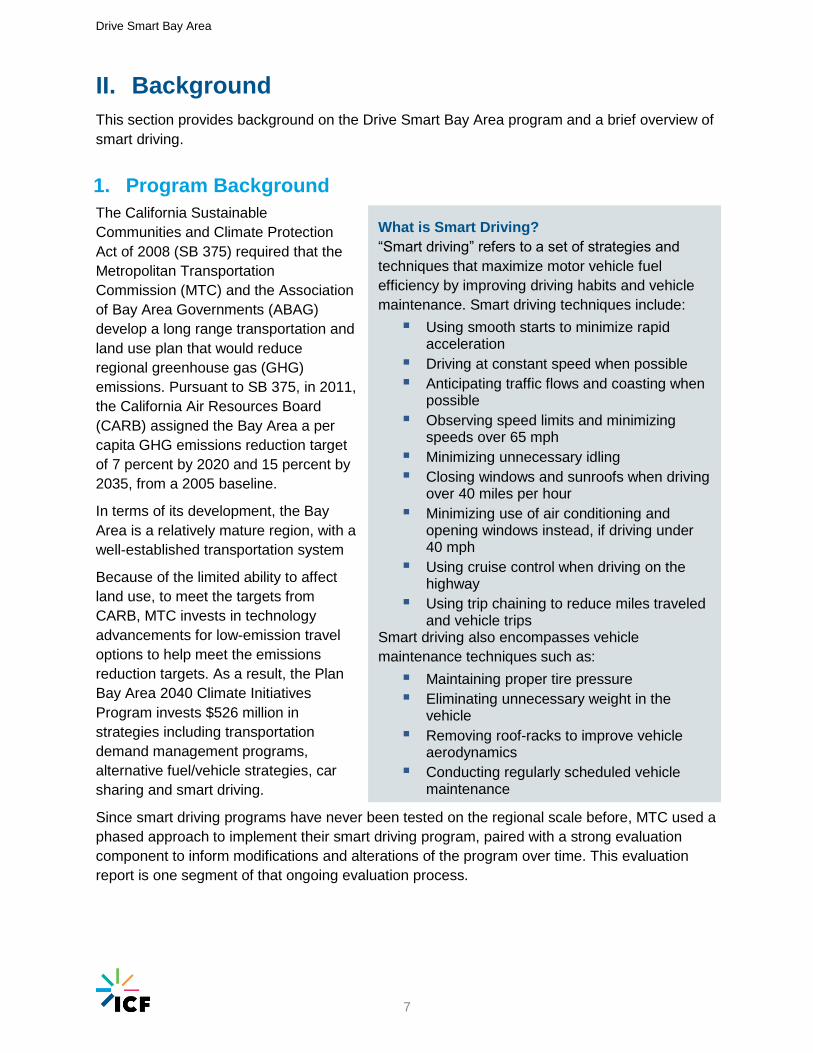
Since smart driving programs have never been tested on the regional scale before, MTC used a
phased approach to implement their smart driving program, named Drive Smart Bay Area, as
shown in Exhibit 1. They paired this phased approach with a strong evaluation component to
inform modifications and alterations of the program over time. This evaluation report is one
segment of that ongoing evaluation process.
Drive Smart Bay Area
5
Exhibit 1. Key Phases of MTC Smart Driving Program
2. Program Development and Implementation
To implement the region-wide program, MTC took the following steps:
Selected the smart-driving in-vehicle device by reviewing 18 after-market devices,
apps and services that communicate information on driving behavior, and evaluating
them on cost, compatibility, and functionality criteria. This evaluation led to the selection
of the Automatic in-vehicle device, which was sold through the program at a 50%
discount for $50.
Developed a marketing strategy by first identifying campaign goals, opportunities,
challenges, the target market, and potential audiences, and then developing a program
identity, messaging, strategies, and tactics that would effectively reach the identified
audiences and achieve the identified goals.
Developed a program website and video to serve as a central clearinghouse for the
program, providing an overview of the program, smart driving tips, access to program
materials, links to related resources, and information on purchasing the Automatic
device. All promotional content and calls to action were directed to the website.
Established two device purchasing options including online fulfillment through a
program-specific page on Automatic’s website and in-store fulfillment through 23 Bay
Area Best Buy stores.
Implemented a marketing strategy focusing on awareness, education, and product
adoption. Marketing efforts included earned media, online and offline paid media, social
media, email, and in-person events including both in-store retail promotion and outreach
at large-scale public events.
3. Evaluation
The program met with mixed success. While the marketing strategy reached a broad audience
and encouraged over 20,000 visitors to visit the Drive Smart Bay Area website, a more limited
number actually purchased an Automatic device. Below are some key metrics from the
campaign:
Drive Smart Bay Area
6
More than 10 million impressions through online and offline media.
22,246 unique page views for the Drive Smart Bay Area website over the course of the
campaign.
1,169 video views for the Drive Smart Bay Area animated video.
Approximately 1 in 10 site visitors viewed the animated video when it was required for
purchase.
125 document downloads of device-related and educational PDFs.
332 page views for the Automatic Program webpage.
150 devices sold at a discounted rate as part of the program. An additional 102 devices
were sold at full price in Bay Area Best Buy stores during the campaign.
73 tons of GHG emissions avoided over the 7 month campaign (estimated to be 124
tons if the program had run for one year) with almost all of the emissions reductions
stemming from the educational component of the campaign.
4. Recommendations
The program team encountered multiple barriers and challenges during program development
and implementation and have identified a number of recommendations and lessons learned to
address them. A few key recommendations are listed below:
Set realistic expectations for the program’s success by understanding the historical
conversion rate from webpage views to device purchases for the product you are
promoting. It may take many more media impressions than you think to sell your target
number of devices.
Balance educating the public about smart driving and promoting in-vehicle
devices by determining the desired budget split between the activities. While it would be
ideal to do both at once, it is not practical with small search ads or short radio reads.
Incorporate more direct marketing by fulfillment partners by reaching out directly to
their customer base, ensuring there is consistent messaging about product price across
all partner advertising, and minimizing the steps required for the customer to access the
promotional pricing.
Test consumer price sensitivity to determine the ideal price to maximize distribution
and use of the in-vehicle device.
Consider creative marketing and outreach ideas such as establishing a “Bay Area
Drive Smart Week,” working with new media partners who have a strong online and local
presence, creating themed infographics, and engaging local influencers to disseminate
messaging.
Drive Smart Bay Area
7
II. Background
This section provides background on the Drive Smart Bay Area program and a brief overview of
smart driving.
1. Program Background
The California Sustainable
Communities and Climate Protection
Act of 2008 (SB 375) required that the
Metropolitan Transportation
Commission (MTC) and the Association
of Bay Area Governments (ABAG)
develop a long range transportation and
land use plan that would reduce
regional greenhouse gas (GHG)
emissions. Pursuant to SB 375, in 2011,
the California Air Resources Board
(CARB) assigned the Bay Area a per
capita GHG emissions reduction target
of 7 percent by 2020 and 15 percent by
2035, from a 2005 baseline.
In terms of its development, the Bay
Area is a relatively mature region, with a
well-established transportation system
Because of the limited ability to affect
land use, to meet the targets from
CARB, MTC invests in technology
advancements for low-emission travel
options to help meet the emissions
reduction targets. As a result, the Plan
Bay Area 2040 Climate Initiatives
Program invests $526 million in
strategies including transportation
demand management programs,
alternative fuel/vehicle strategies, car
sharing and smart driving.
Since smart driving programs have never been tested on the regional scale before, MTC used a
phased approach to implement their smart driving program, paired with a strong evaluation
component to inform modifications and alterations of the program over time. This evaluation
report is one segment of that ongoing evaluation process.
What is Smart Driving?
“Smart driving” refers to a set of strategies and
techniques that maximize motor vehicle fuel
efficiency by improving driving habits and vehicle
maintenance. Smart driving techniques include:
Using smooth starts to minimize rapid acceleration
Driving at constant speed when possible
Anticipating traffic flows and coasting when possible
Observing speed limits and minimizing speeds over 65 mph
Minimizing unnecessary idling
Closing windows and sunroofs when driving over 40 miles per hour
Minimizing use of air conditioning and opening windows instead, if driving under 40 mph
Using cruise control when driving on the highway
Using trip chaining to reduce miles traveled and vehicle trips
Smart driving also encompasses vehicle
maintenance techniques such as:
Maintaining proper tire pressure
Eliminating unnecessary weight in the vehicle
Removing roof-racks to improve vehicle aerodynamics
Conducting regularly scheduled vehicle maintenance
Drive Smart Bay Area
8
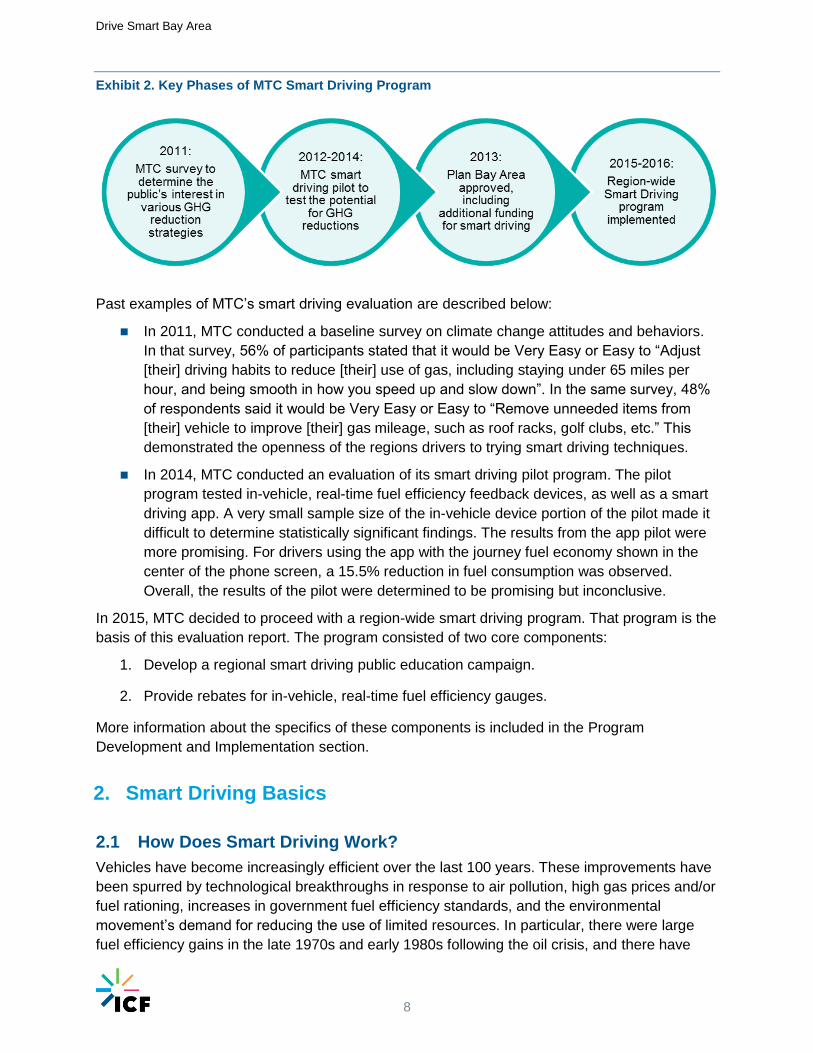
Exhibit 2. Key Phases of MTC Smart Driving Program
Past examples of MTC’s smart driving evaluation are described below:
In 2011, MTC conducted a baseline survey on climate change attitudes and behaviors.
In that survey, 56% of participants stated that it would be Very Easy or Easy to “Adjust
[their] driving habits to reduce [their] use of gas, including staying under 65 miles per
hour, and being smooth in how you speed up and slow down”. In the same survey, 48%
of respondents said it would be Very Easy or Easy to “Remove unneeded items from
[their] vehicle to improve [their] gas mileage, such as roof racks, golf clubs, etc.” This
demonstrated the openness of the regions drivers to trying smart driving techniques.
In 2014, MTC conducted an evaluation of its smart driving pilot program. The pilot
program tested in-vehicle, real-time fuel efficiency feedback devices, as well as a smart
driving app. A very small sample size of the in-vehicle device portion of the pilot made it
difficult to determine statistically significant findings. The results from the app pilot were
more promising. For drivers using the app with the journey fuel economy shown in the
center of the phone screen, a 15.5% reduction in fuel consumption was observed.
Overall, the results of the pilot were determined to be promising but inconclusive.
In 2015, MTC decided to proceed with a region-wide smart driving program. That program is the
basis of this evaluation report. The program consisted of two core components:
1. Develop a regional smart driving public education campaign.
2. Provide rebates for in-vehicle, real-time fuel efficiency gauges.
More information about the specifics of these components is included in the Program
Development and Implementation section.
2. Smart Driving Basics
2.1 How Does Smart Driving Work?
Vehicles have become increasingly efficient over the last 100 years. These improvements have
been spurred by technological breakthroughs in response to air pollution, high gas prices and/or
fuel rationing, increases in government fuel efficiency standards, and the environmental
movement’s demand for reducing the use of limited resources. In particular, there were large
fuel efficiency gains in the late 1970s and early 1980s following the oil crisis, and there have
Drive Smart Bay Area
9
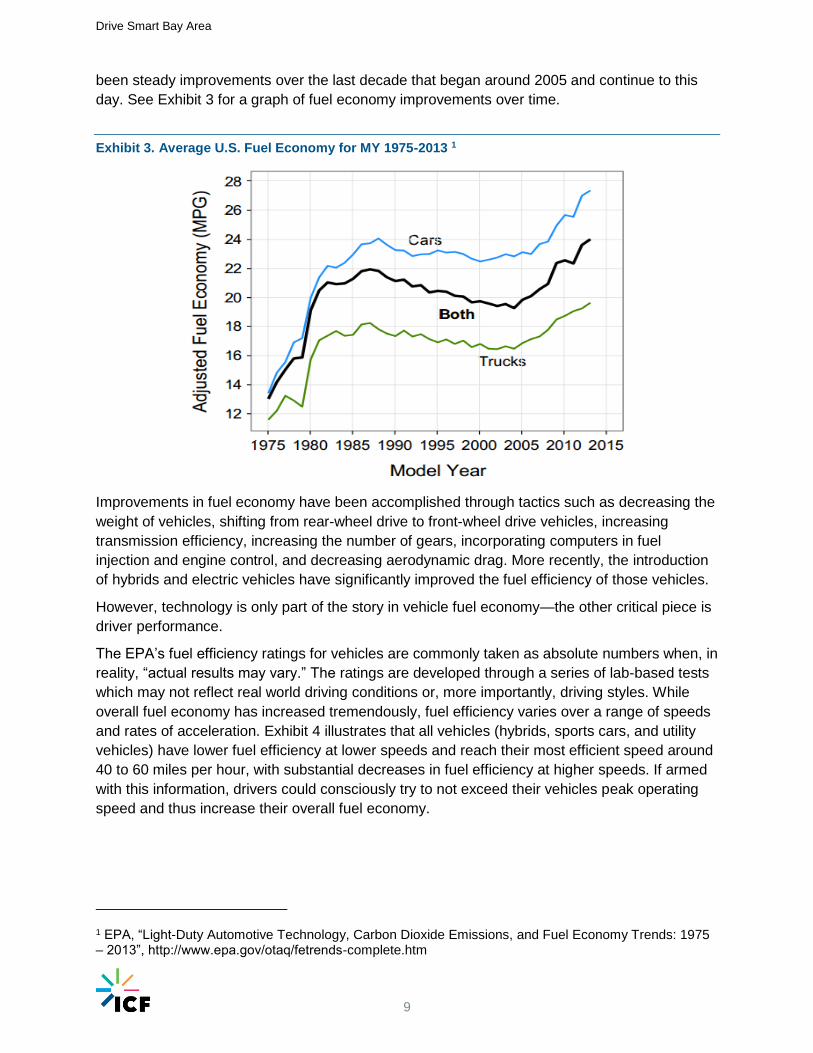
been steady improvements over the last decade that began around 2005 and continue to this
day. See Exhibit 3 for a graph of fuel economy improvements over time.
Exhibit 3. Average U.S. Fuel Economy for MY 1975-2013 1
Improvements in fuel economy have been accomplished through tactics such as decreasing the
weight of vehicles, shifting from rear-wheel drive to front-wheel drive vehicles, increasing
transmission efficiency, increasing the number of gears, incorporating computers in fuel
injection and engine control, and decreasing aerodynamic drag. More recently, the introduction
of hybrids and electric vehicles have significantly improved the fuel efficiency of those vehicles.
However, technology is only part of the story in vehicle fuel economy—the other critical piece is
driver performance.
The EPA’s fuel efficiency ratings for vehicles are commonly taken as absolute numbers when, in
reality, “actual results may vary.” The ratings are developed through a series of lab-based tests
which may not reflect real world driving conditions or, more importantly, driving styles. While
overall fuel economy has increased tremendously, fuel efficiency varies over a range of speeds
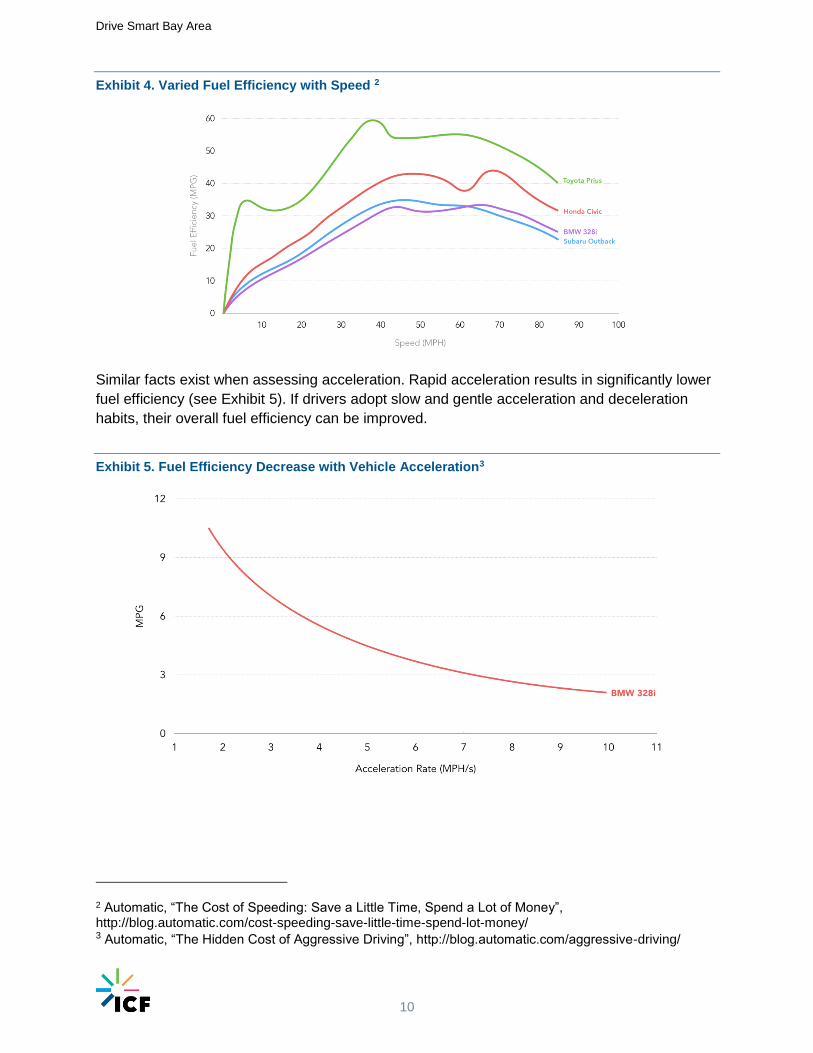
and rates of acceleration. Exhibit 4 illustrates that all vehicles (hybrids, sports cars, and utility
vehicles) have lower fuel efficiency at lower speeds and reach their most efficient speed around
40 to 60 miles per hour, with substantial decreases in fuel efficiency at higher speeds. If armed
with this information, drivers could consciously try to not exceed their vehicles peak operating
speed and thus increase their overall fuel economy.
1 EPA, “Light-Duty Automotive Technology, Carbon Dioxide Emissions, and Fuel Economy Trends: 1975 – 2013”, http://www.epa.gov/otaq/fetrends-complete.htm
Drive Smart Bay Area
10
Exhibit 4. Varied Fuel Efficiency with Speed 2
Similar facts exist when assessing acceleration. Rapid acceleration results in significantly lower
fuel efficiency (see Exhibit 5). If drivers adopt slow and gentle acceleration and deceleration
habits, their overall fuel efficiency can be improved.
Exhibit 5. Fuel Efficiency Decrease with Vehicle Acceleration3
2 Automatic, “The Cost of Speeding: Save a Little Time, Spend a Lot of Money”, http://blog.automatic.com/cost-speeding-save-little-time-spend-lot-money/ 3 Automatic, “The Hidden Cost of Aggressive Driving”, http://blog.automatic.com/aggressive-driving/
Drive Smart Bay Area
11
2.2 Smart Driving Effectiveness
In 2014, ICF prepared a Smart Driving White Paper for MTC, including a review of academic
literature, to identify the potential for fuel savings and GHG emissions reductions with smart
driving. The review concluded that drivers can reduce their fuel consumption and associated
GHG emissions through smart driving principles by up to 18% with more recent and rigorous
studies demonstrating average fuel economy savings of 2% to 4%.
In 2015, the National Center for Sustainable Transportation released a white paper, “Actual
Results May Vary”: A Behavioral Review of Eco-Driving for Policy Makers.4 The researchers
reviewed 40 smart driving studies and found that, on average, fuel efficiency was increased by
9%. However, the studies reviewed in this paper included a range of study structures, and
simply averaging the results may not provide the most useful or accurate prediction of the
potential for smart driving to reduce emissions.
4 Kurani, K., A. Sanguinetti, and H. Park. “Actual Results May Vary”: A Behavioral Review of Eco-Driving for Policy Makers. A White paper from the National Center for Sustainable Transportation. July 2015. Accessible at: http://ncst.ucdavis.edu/wp-content/uploads/2014/08/07-29-2015-NCSTEco-drivingWhite-Paper_FINAL.pdf
Drive Smart Bay Area
12
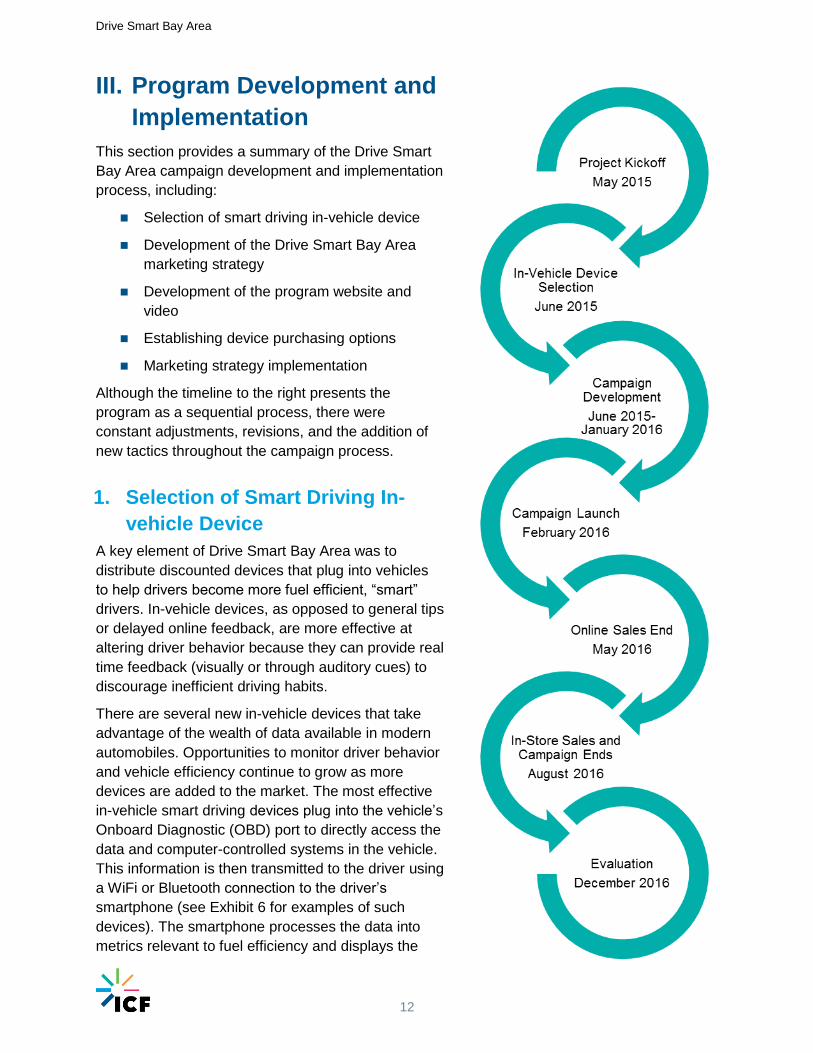
III. Program Development and
Implementation
This section provides a summary of the Drive Smart
Bay Area campaign development and implementation
process, including:
Selection of smart driving in-vehicle device
Development of the Drive Smart Bay Area
marketing strategy
Development of the program website and
video
Establishing device purchasing options
Marketing strategy implementation
Although the timeline to the right presents the
program as a sequential process, there were
constant adjustments, revisions, and the addition of
new tactics throughout the campaign process.
1. Selection of Smart Driving In-
vehicle Device
A key element of Drive Smart Bay Area was to
distribute discounted devices that plug into vehicles
to help drivers become more fuel efficient, “smart”
drivers. In-vehicle devices, as opposed to general tips
or delayed online feedback, are more effective at
altering driver behavior because they can provide real
time feedback (visually or through auditory cues) to
discourage inefficient driving habits.
There are several new in-vehicle devices that take
advantage of the wealth of data available in modern
automobiles. Opportunities to monitor driver behavior
and vehicle efficiency continue to grow as more
devices are added to the market. The most effective
in-vehicle smart driving devices plug into the vehicle’s
Onboard Diagnostic (OBD) port to directly access the
data and computer-controlled systems in the vehicle.
This information is then transmitted to the driver using
a WiFi or Bluetooth connection to the driver’s
smartphone (see Exhibit 6 for examples of such
devices). The smartphone processes the data into
metrics relevant to fuel efficiency and displays the
Drive Smart Bay Area
13
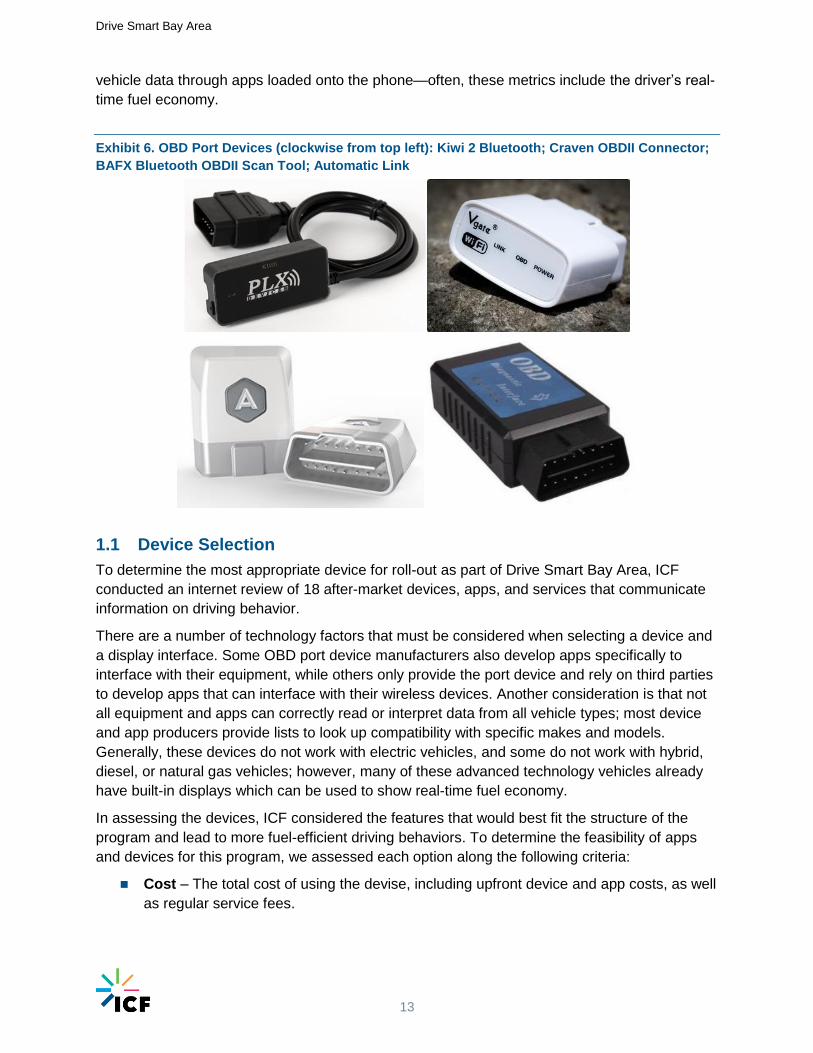
vehicle data through apps loaded onto the phone—often, these metrics include the driver’s real-
time fuel economy.
Exhibit 6. OBD Port Devices (clockwise from top left): Kiwi 2 Bluetooth; Craven OBDII Connector;
BAFX Bluetooth OBDII Scan Tool; Automatic Link
1.1 Device Selection
To determine the most appropriate device for roll-out as part of Drive Smart Bay Area, ICF
conducted an internet review of 18 after-market devices, apps, and services that communicate
information on driving behavior.
There are a number of technology factors that must be considered when selecting a device and
a display interface. Some OBD port device manufacturers also develop apps specifically to
interface with their equipment, while others only provide the port device and rely on third parties
to develop apps that can interface with their wireless devices. Another consideration is that not
all equipment and apps can correctly read or interpret data from all vehicle types; most device
and app producers provide lists to look up compatibility with specific makes and models.
Generally, these devices do not work with electric vehicles, and some do not work with hybrid,
diesel, or natural gas vehicles; however, many of these advanced technology vehicles already
have built-in displays which can be used to show real-time fuel economy.
In assessing the devices, ICF considered the features that would best fit the structure of the
program and lead to more fuel-efficient driving behaviors. To determine the feasibility of apps
and devices for this program, we assessed each option along the following criteria:
Cost – The total cost of using the devise, including upfront device and app costs, as well
as regular service fees.
Drive Smart Bay Area
14
Operating System – Compatibility of the device and app with both iOS (iPhone) and
Android operating systems. Because of the limited number of apps developed for
Windows phones, the Windows operating system was not considered.
Fuel-efficient Driving Feedback – Ability to provide real-time feedback focused on
improving fuel economy is preferred.
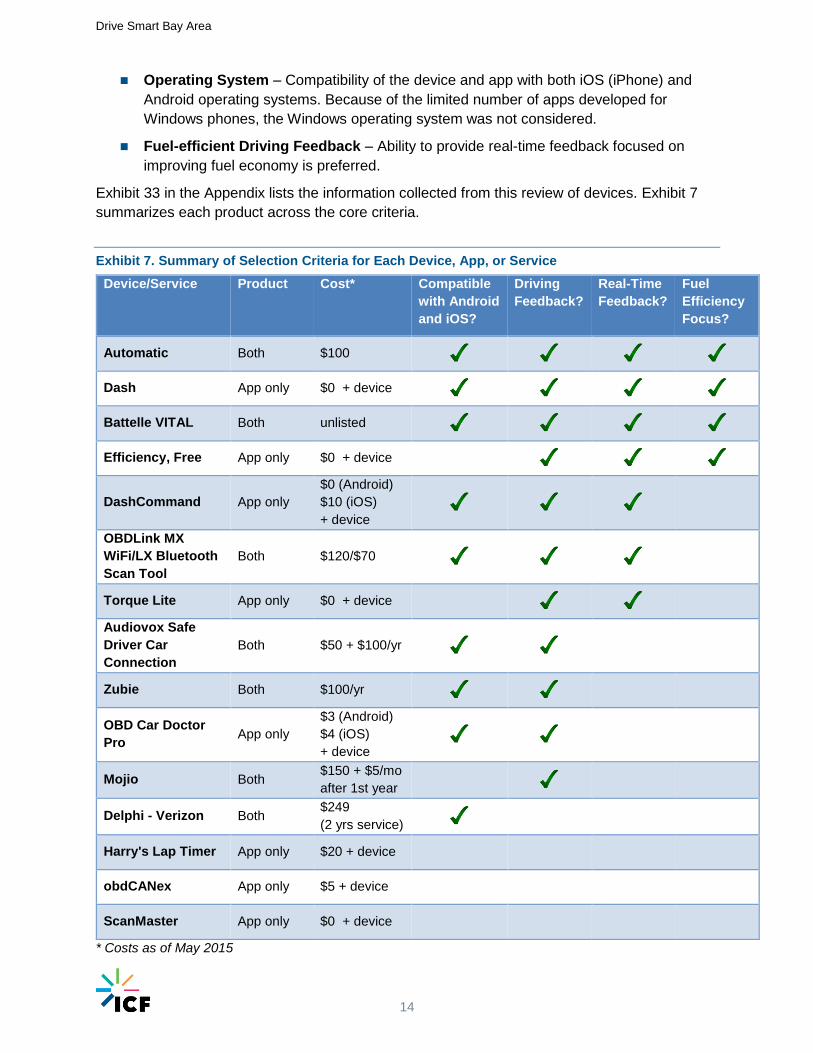
Exhibit 33 in the Appendix lists the information collected from this review of devices. Exhibit 7
summarizes each product across the core criteria.
Exhibit 7. Summary of Selection Criteria for Each Device, App, or Service
Device/Service Product Cost* Compatible
with Android
and iOS?
Driving
Feedback?
Real-Time
Feedback?
Fuel
Efficiency
Focus?
Automatic Both $100
Dash App only $0 + device
Battelle VITAL Both unlisted
Efficiency, Free App only $0 + device
DashCommand App only
$0 (Android)
$10 (iOS)
+ device
OBDLink MX
WiFi/LX Bluetooth
Scan Tool
Both $120/$70
Torque Lite App only $0 + device
Audiovox Safe
Driver Car
Connection
Both $50 + $100/yr
Zubie Both $100/yr
OBD Car Doctor
Pro App only
$3 (Android)
$4 (iOS)
+ device
Mojio Both $150 + $5/mo
after 1st year
Delphi - Verizon Both $249
(2 yrs service)
Harry's Lap Timer App only $20 + device
obdCANex App only $5 + device
ScanMaster App only $0 + device
* Costs as of May 2015
Drive Smart Bay Area
15
Based on the review, ICF recommended the following devices for the program:
Dash paired with a generic on-board diagnostic (OBD) port device
Automatic
Both Dash and Automatic had been present in the market for a couple of years and provided
customer support and continual software updates. Although the Battelle device met the
minimum qualifications, it was not recommended because it did not publish costs and seemed
to be geared toward fleet applications rather than individual consumers.
Dash received positive reviews for its user interface and comprehensive driver feedback.
However, Dash did require the separate purchase of a third party OBD device (note that this is
no longer the case). At the time of the review, Dash was only a phone app that could receive
and interpret information from the OBD reader. Although most OBD reader devices are
compatible with Dash, the developers provided links to select devices and specifically
recommended the OBDLink devices. Depending on the choice of devices, the cost of this option
may be lower than Automatic. However, devices would need to be tested with the app before
making the final selection.
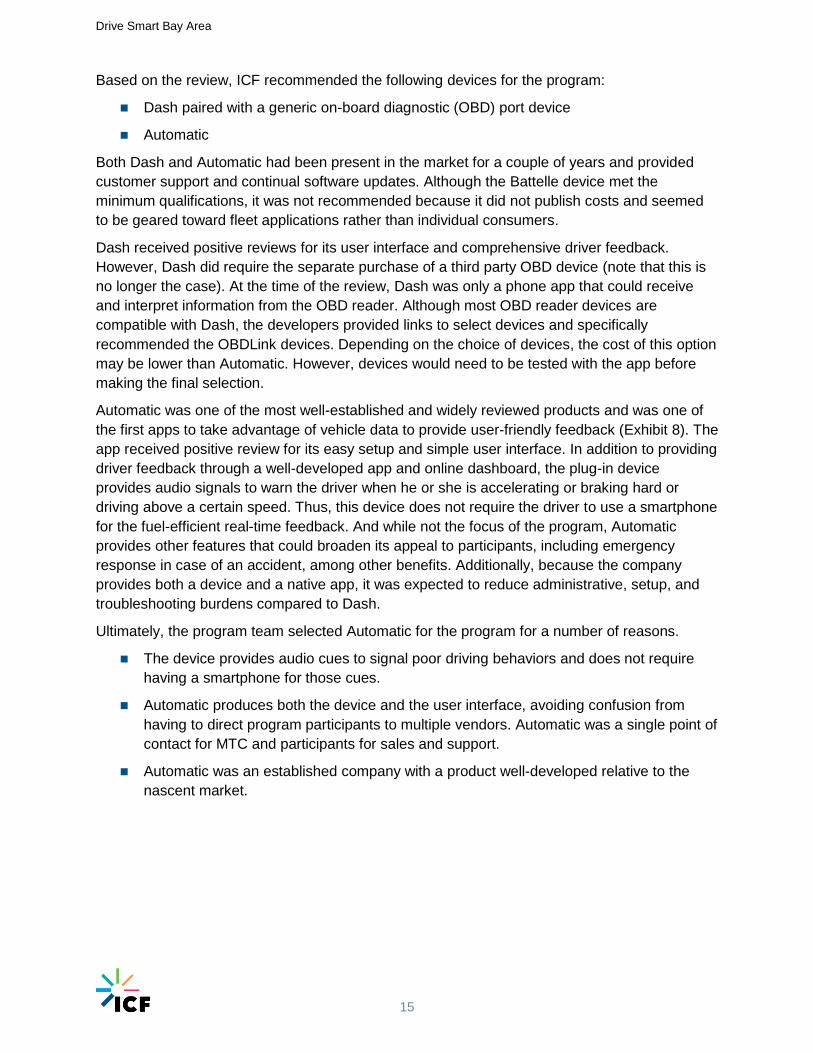
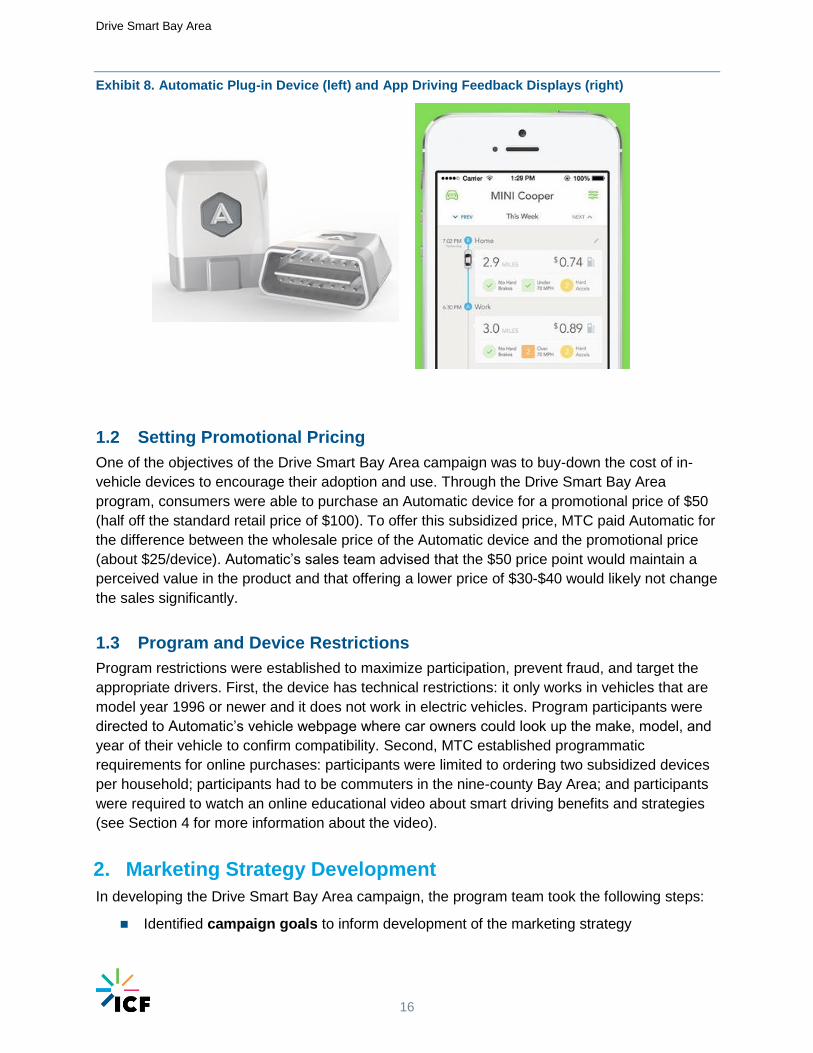
Automatic was one of the most well-established and widely reviewed products and was one of
the first apps to take advantage of vehicle data to provide user-friendly feedback (Exhibit 8). The
app received positive review for its easy setup and simple user interface. In addition to providing
driver feedback through a well-developed app and online dashboard, the plug-in device
provides audio signals to warn the driver when he or she is accelerating or braking hard or
driving above a certain speed. Thus, this device does not require the driver to use a smartphone
for the fuel-efficient real-time feedback. And while not the focus of the program, Automatic
provides other features that could broaden its appeal to participants, including emergency
response in case of an accident, among other benefits. Additionally, because the company
provides both a device and a native app, it was expected to reduce administrative, setup, and
troubleshooting burdens compared to Dash.
Ultimately, the program team selected Automatic for the program for a number of reasons.
The device provides audio cues to signal poor driving behaviors and does not require
having a smartphone for those cues.
Automatic produces both the device and the user interface, avoiding confusion from
having to direct program participants to multiple vendors. Automatic was a single point of
contact for MTC and participants for sales and support.
Automatic was an established company with a product well-developed relative to the
nascent market.
Drive Smart Bay Area
16
Exhibit 8. Automatic Plug-in Device (left) and App Driving Feedback Displays (right)
1.2 Setting Promotional Pricing
One of the objectives of the Drive Smart Bay Area campaign was to buy-down the cost of in-
vehicle devices to encourage their adoption and use. Through the Drive Smart Bay Area
program, consumers were able to purchase an Automatic device for a promotional price of $50
(half off the standard retail price of $100). To offer this subsidized price, MTC paid Automatic for
the difference between the wholesale price of the Automatic device and the promotional price
(about $25/device). Automatic’s sales team advised that the $50 price point would maintain a
perceived value in the product and that offering a lower price of $30-$40 would likely not change
the sales significantly.
1.3 Program and Device Restrictions
Program restrictions were established to maximize participation, prevent fraud, and target the
appropriate drivers. First, the device has technical restrictions: it only works in vehicles that are
model year 1996 or newer and it does not work in electric vehicles. Program participants were
directed to Automatic’s vehicle webpage where car owners could look up the make, model, and
year of their vehicle to confirm compatibility. Second, MTC established programmatic
requirements for online purchases: participants were limited to ordering two subsidized devices
per household; participants had to be commuters in the nine-county Bay Area; and participants
were required to watch an online educational video about smart driving benefits and strategies
(see Section 4 for more information about the video).
2. Marketing Strategy Development
In developing the Drive Smart Bay Area campaign, the program team took the following steps:
Identified campaign goals to inform development of the marketing strategy
Drive Smart Bay Area
17
Evaluated opportunities and challenges presented by the program
Defined the target market and potential audiences to tailor the campaign and increase
effectiveness
Developed a program identity relevant to all audiences
Crafted messaging that resonated with target audiences
Developed campaign materials and strategies to effectively disseminate messaging
The following subsections describe each of these marketing strategy development steps.
2.1 Campaign Goals
The Drive Smart Bay Area campaign had four main goals, as follows:
Messaging
Create accessible educational information about Smart Driving that is useful for both
those who purchase the device and those who do not
Branding
Establish a program identity to promote consistency in all marketing and public
communication materials
Device Distribution
Distribute up to 4,000 discounted Automatic devices
Programmatic
Have every device owner view the educational materials as a requirement before
receiving the rebate
These goals informed the development of the marketing strategy, described in the following
sections.
2.2 Opportunities and Challenges
The program team conducted a comprehensive evaluation of opportunities and challenges to
inform campaign development and implementation, ensure consistency, and avoid any potential
pitfalls. Early identification of these strengths and weaknesses enabled the program team to
assess the programmatic landscape and best leverage opportunities. These were considered
living lists and amended over the course of the program.
The evaluation identified the following opportunities and challenges:
Opportunities
MTC and 511, trusted sources for information by Bay Area residents
Access to established channels used by commuters (e.g., 511.org)
Relatively tech savvy population in the Bay Area
Large commuter volume
Drive Smart Bay Area
18
High regional cost of living that makes easy savings attractive
Financial discount for program device
New and interesting technology
Low barrier/simple behavior change
Challenges
Scale of target audience and area
Unknown adoption rates of proposed activities
Uncertainty surrounding new technology
Perceived privacy concerns with GPS device
Getting qualified and appropriate participants involved
Helping people through the awareness/purchase/rebate/install process
Keeping users engaged to complete recommended behaviors
Avoiding the appearance of product endorsement
Relatively low price of gas reducing incentive of fuel efficiency savings
2.3 Target Market and Potential Audiences
By defining the target market and potential audiences, the marketing team was able to tailor the
campaign and maximize the campaign effectiveness. The target market captures all potential
participants for the smart driving campaign, while the potential audiences reflect further
refinement of eligible participants as sub-groups for targeted marketing.
2.3.1 Target Market
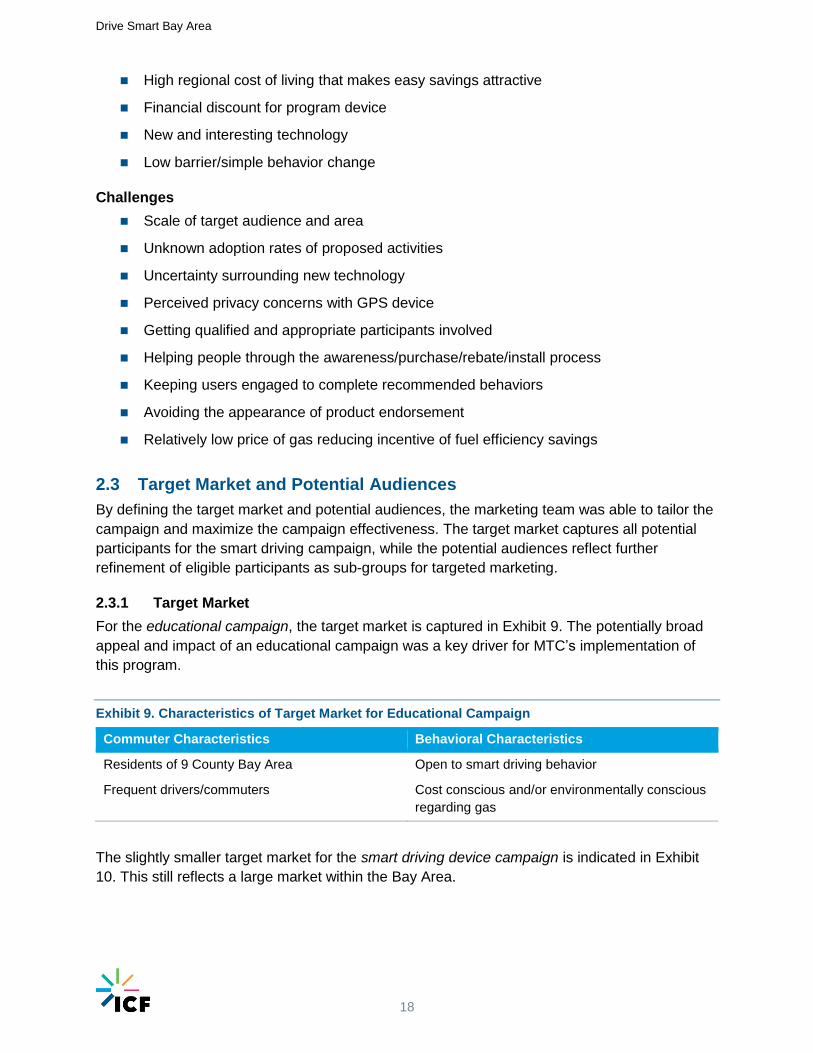
For the educational campaign, the target market is captured in Exhibit 9. The potentially broad
appeal and impact of an educational campaign was a key driver for MTC’s implementation of
this program.
Exhibit 9. Characteristics of Target Market for Educational Campaign
Commuter Characteristics Behavioral Characteristics
Residents of 9 County Bay Area Open to smart driving behavior
Frequent drivers/commuters Cost conscious and/or environmentally conscious
regarding gas
The slightly smaller target market for the smart driving device campaign is indicated in Exhibit
10. This still reflects a large market within the Bay Area.

Drive Smart Bay Area
19
Exhibit 10. Characteristics of Target Market for Device Element
Commuter Characteristics Behavioral Characteristics
Residents of 9-county Bay Area Open to smart driving behavior
Frequent drivers/commuters No undue privacy concerns
Owners of a 1996 or newer vehicle Reasonably tech savvy
Owners of smartphones Cost conscious regarding gas
Individuals able to fund remaining purchase price Feedback/data-oriented
2.3.2 Potential Audiences
To implement a targeted campaign, the program team developed the following set of potential
audiences based on a literature review, a review of existing data, and an understanding of the
program and Bay Area residents.
The majority of the campaign tactics focused on the primary audiences, which were the
subgroups predicted to be most likely to implement smart driving techniques and to be
interested in a smart driving device. The secondary audience was the broader public who may
not have been early adopters but were possibly interested. The tertiary audiences were part of
the earned media campaign and were targeted to gain public endorsements and increase the
conversation surrounding the campaign.
Primary Audiences
Super Commuters – There is a large and growing population moving to new
developments and more affordable homes that lack access to public transportation.
They commute anywhere from 45 minutes to 3 hours each way depending on traffic and
destination. They represent a high potential to participate, and should they participate,
could deliver high volume results.
Gadget Geeks – The Bay Area is one of the most technologically advanced regions in
the area. This consumer may not be financially motivated, but will be highly engaged
with the product and program. As an added benefit, many individuals in this category are
active on social media channels, often providing reviews and recommendations.
Comfortable but Cost Conscious – The high regional cost of living is an issue for
many residents, and while comfortable, these consumers like to save where they can.
This group uses Groupons, downloads Target’s coupon app, and takes pooled Uber and
Lyft rides. Still, they enjoy spending on luxury goods and usually have a newer car and
the latest model smartphone.
Secondary Audience
General Public – This includes those individuals who fall outside the high propensity
groups but are still within the program target market.
Drive Smart Bay Area
20
Tertiary Audiences
News media – This audience can increase visibility for the program and assist with
reaching audiences.
Elected officials/decision-makers – This group of stakeholders includes legislators,
county boards, advocacy groups, potential collaborators, and state and federal agencies
who can engage their constituencies if provided information and resources.
Internal groups – This includes internal MTC groups that may need to be informed or
play an active role.
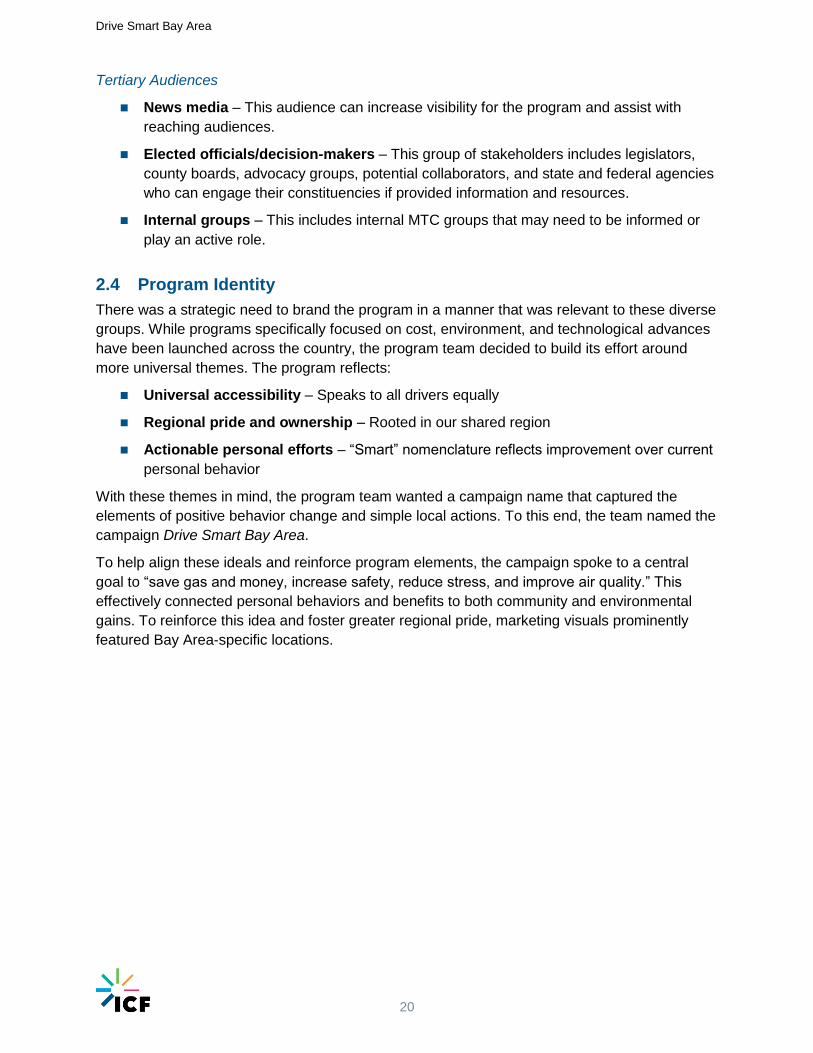
2.4 Program Identity
There was a strategic need to brand the program in a manner that was relevant to these diverse
groups. While programs specifically focused on cost, environment, and technological advances
have been launched across the country, the program team decided to build its effort around
more universal themes. The program reflects:
Universal accessibility – Speaks to all drivers equally
Regional pride and ownership – Rooted in our shared region
Actionable personal efforts – “Smart” nomenclature reflects improvement over current
personal behavior
With these themes in mind, the program team wanted a campaign name that captured the
elements of positive behavior change and simple local actions. To this end, the team named the
campaign Drive Smart Bay Area.
To help align these ideals and reinforce program elements, the campaign spoke to a central
goal to “save gas and money, increase safety, reduce stress, and improve air quality.” This
effectively connected personal behaviors and benefits to both community and environmental
gains. To reinforce this idea and foster greater regional pride, marketing visuals prominently
featured Bay Area-specific locations.
Drive Smart Bay Area
21
Exhibit 11. Sample Marketing Material Featuring Regional Landmark
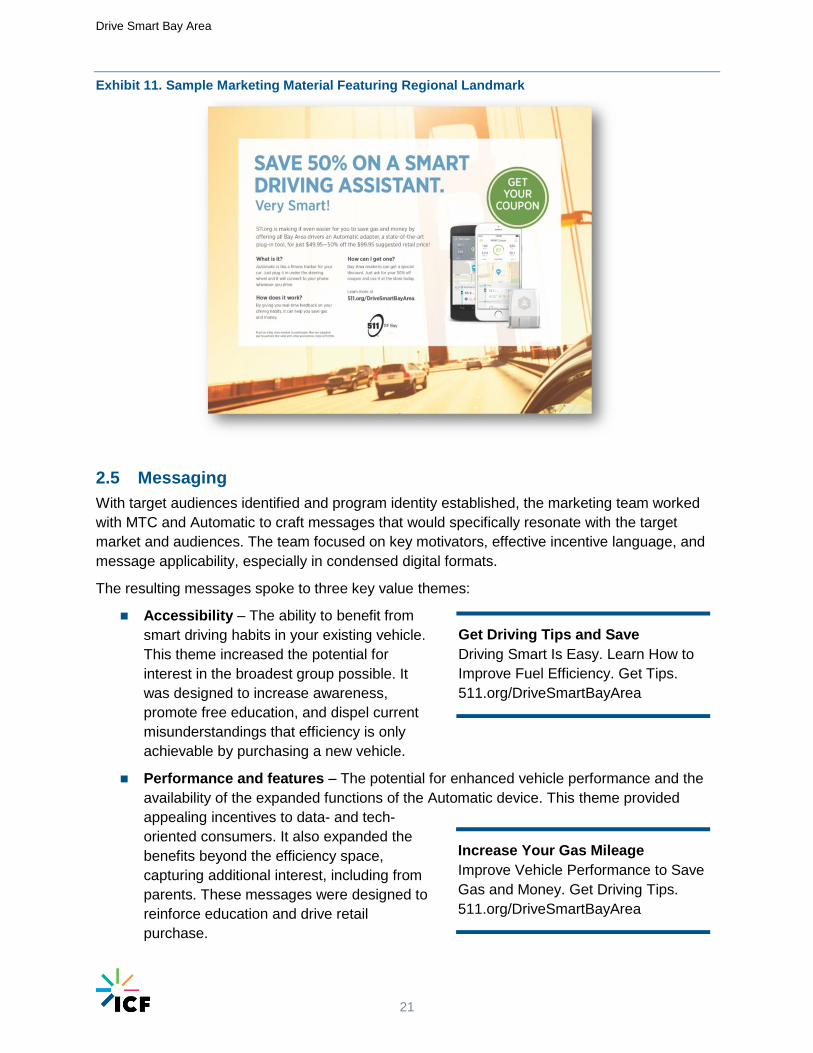
2.5 Messaging
With target audiences identified and program identity established, the marketing team worked
with MTC and Automatic to craft messages that would specifically resonate with the target
market and audiences. The team focused on key motivators, effective incentive language, and
message applicability, especially in condensed digital formats.
The resulting messages spoke to three key value themes:
Accessibility – The ability to benefit from
smart driving habits in your existing vehicle.
This theme increased the potential for
interest in the broadest group possible. It
was designed to increase awareness,
promote free education, and dispel current
misunderstandings that efficiency is only
achievable by purchasing a new vehicle.
Performance and features – The potential for enhanced vehicle performance and the
availability of the expanded functions of the Automatic device. This theme provided
appealing incentives to data- and tech-
oriented consumers. It also expanded the
benefits beyond the efficiency space,
capturing additional interest, including from
parents. These messages were designed to
reinforce education and drive retail
purchase.
Increase Your Gas Mileage
Improve Vehicle Performance to Save
Gas and Money. Get Driving Tips.
511.org/DriveSmartBayArea
Get Driving Tips and Save
Driving Smart Is Easy. Learn How to
Improve Fuel Efficiency. Get Tips.
511.org/DriveSmartBayArea
Drive Smart Bay Area
22
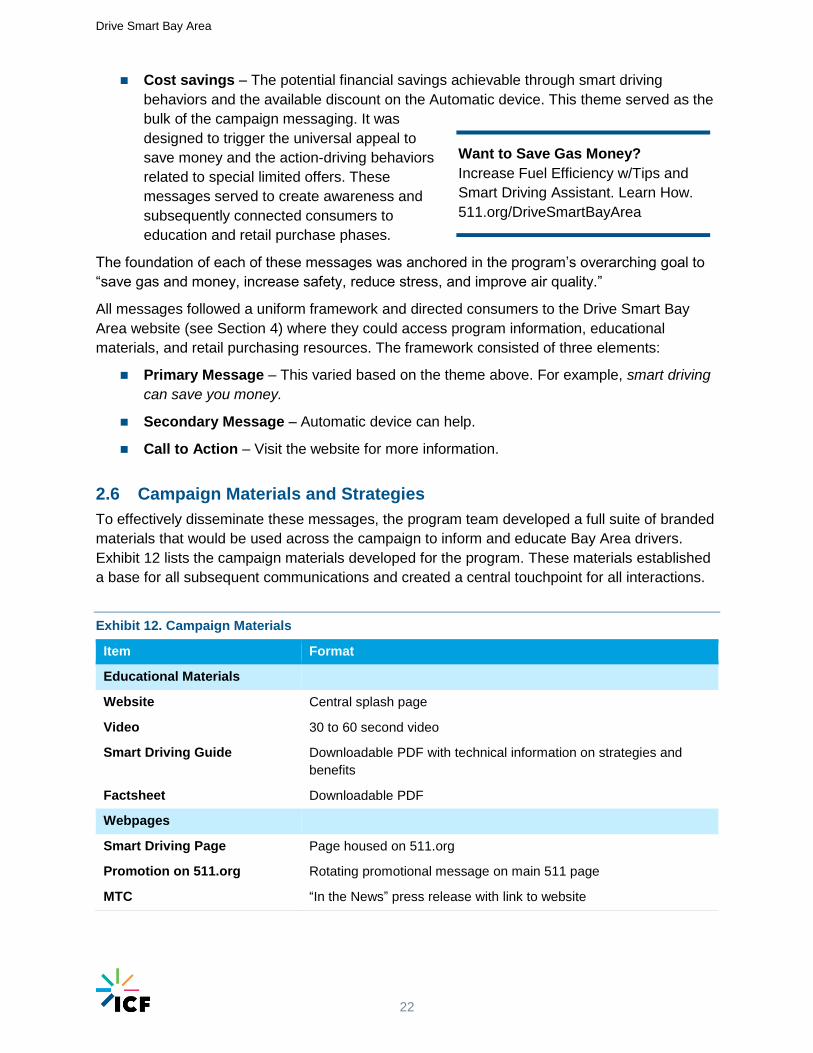
Cost savings – The potential financial savings achievable through smart driving
behaviors and the available discount on the Automatic device. This theme served as the
bulk of the campaign messaging. It was
designed to trigger the universal appeal to
save money and the action-driving behaviors
related to special limited offers. These
messages served to create awareness and
subsequently connected consumers to
education and retail purchase phases.
The foundation of each of these messages was anchored in the program’s overarching goal to
“save gas and money, increase safety, reduce stress, and improve air quality.”
All messages followed a uniform framework and directed consumers to the Drive Smart Bay
Area website (see Section 4) where they could access program information, educational
materials, and retail purchasing resources. The framework consisted of three elements:
Primary Message – This varied based on the theme above. For example, smart driving
can save you money.
Secondary Message – Automatic device can help.
Call to Action – Visit the website for more information.
2.6 Campaign Materials and Strategies
To effectively disseminate these messages, the program team developed a full suite of branded
materials that would be used across the campaign to inform and educate Bay Area drivers.
Exhibit 12 lists the campaign materials developed for the program. These materials established
a base for all subsequent communications and created a central touchpoint for all interactions.
Exhibit 12. Campaign Materials
Item Format
Educational Materials
Website Central splash page
Video 30 to 60 second video
Smart Driving Guide Downloadable PDF with technical information on strategies and
benefits
Factsheet Downloadable PDF
Webpages
Smart Driving Page Page housed on 511.org
Promotion on 511.org Rotating promotional message on main 511 page
MTC “In the News” press release with link to website
Want to Save Gas Money?
Increase Fuel Efficiency w/Tips and
Smart Driving Assistant. Learn How.
511.org/DriveSmartBayArea
Drive Smart Bay Area
23
In addition to the campaign assets, the program team developed central strategies to guide the
marketing approach. These included gaining publicity through earned media, and conducting
retail consumer outreach. The strategies and associated considerations are described below.
Over time, the program team defined the optimal mix of strategies and tactics by balancing
program preferences with time and budgetary constraints.
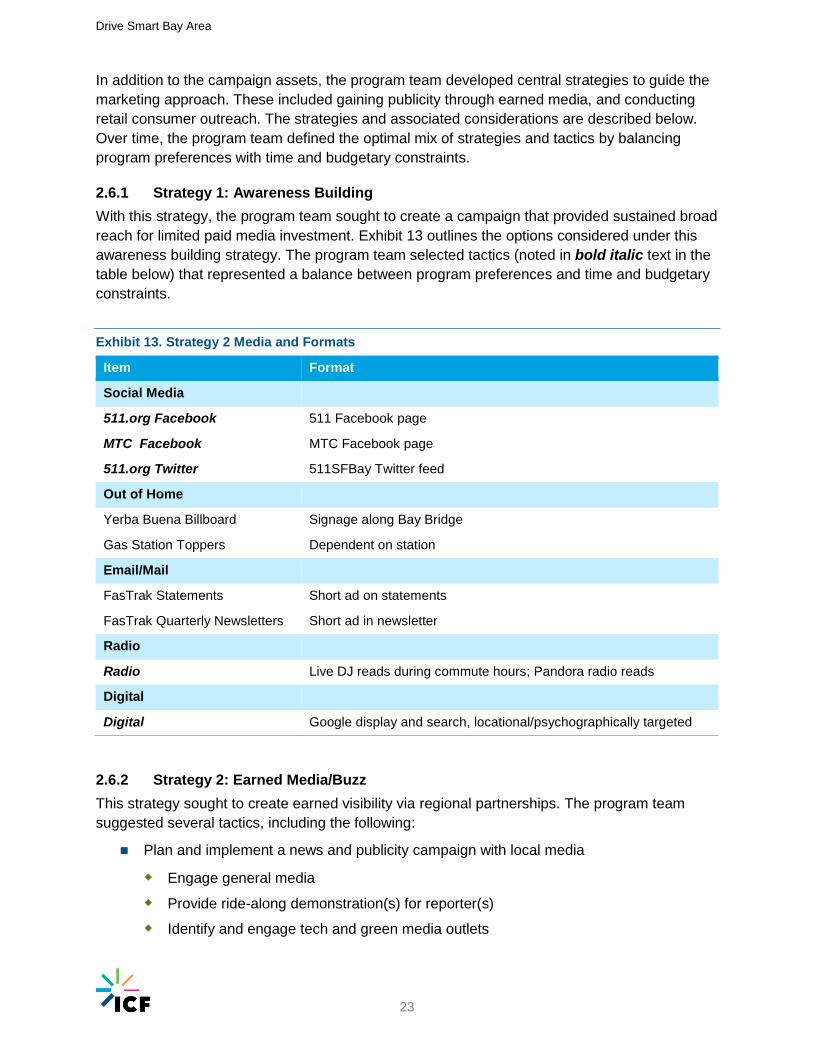
2.6.1 Strategy 1: Awareness Building
With this strategy, the program team sought to create a campaign that provided sustained broad
reach for limited paid media investment. Exhibit 13 outlines the options considered under this
awareness building strategy. The program team selected tactics (noted in bold italic text in the
table below) that represented a balance between program preferences and time and budgetary
constraints.
Exhibit 13. Strategy 2 Media and Formats
Item Format
Social Media
511.org Facebook 511 Facebook page
MTC Facebook MTC Facebook page
511.org Twitter 511SFBay Twitter feed
Out of Home
Yerba Buena Billboard Signage along Bay Bridge
Gas Station Toppers Dependent on station
Email/Mail
FasTrak Statements Short ad on statements
FasTrak Quarterly Newsletters Short ad in newsletter
Radio
Radio Live DJ reads during commute hours; Pandora radio reads
Digital
Digital Google display and search, locational/psychographically targeted
2.6.2 Strategy 2: Earned Media/Buzz
This strategy sought to create earned visibility via regional partnerships. The program team
suggested several tactics, including the following:
Plan and implement a news and publicity campaign with local media
Engage general media
Provide ride-along demonstration(s) for reporter(s)
Identify and engage tech and green media outlets
Drive Smart Bay Area
24
Engage bloggers
Leverage existing events
Alameda Express Lane opening
Community events/fairs/festivals in targeted areas (e.g., Brentwood)
Install point of purchase signage where device is in store
Leverage Automatic’s PR and marketing channels
Engage stakeholders to create program evangelists
Provide device samples and campaign resources to MTC staff, county transportation staff, and Bay Area AQMD
Encourage them to distribute samples and resources
Encourage them to mention the campaign on their social media channels
Develop high profile partnerships
Provide a set of devices to a visible group of heavy drivers (e.g., vanpool drivers, commuters) for a day or week and profile results with media
2.6.3 Strategy 3: Engagement
Initially, the program team considered gamification as a tactic under this strategy, but the
complexities and cost of developing an application were prohibitive. This was subsequently
replaced by program staff directly engaging with Bay Area commuters at retail outlets and local
events.
3. Marketing Strategy Implementation
Based on the strategy developed above, the program team implemented the marketing plan.
Exhibit 14 summarizes all of the elements of the campaign.
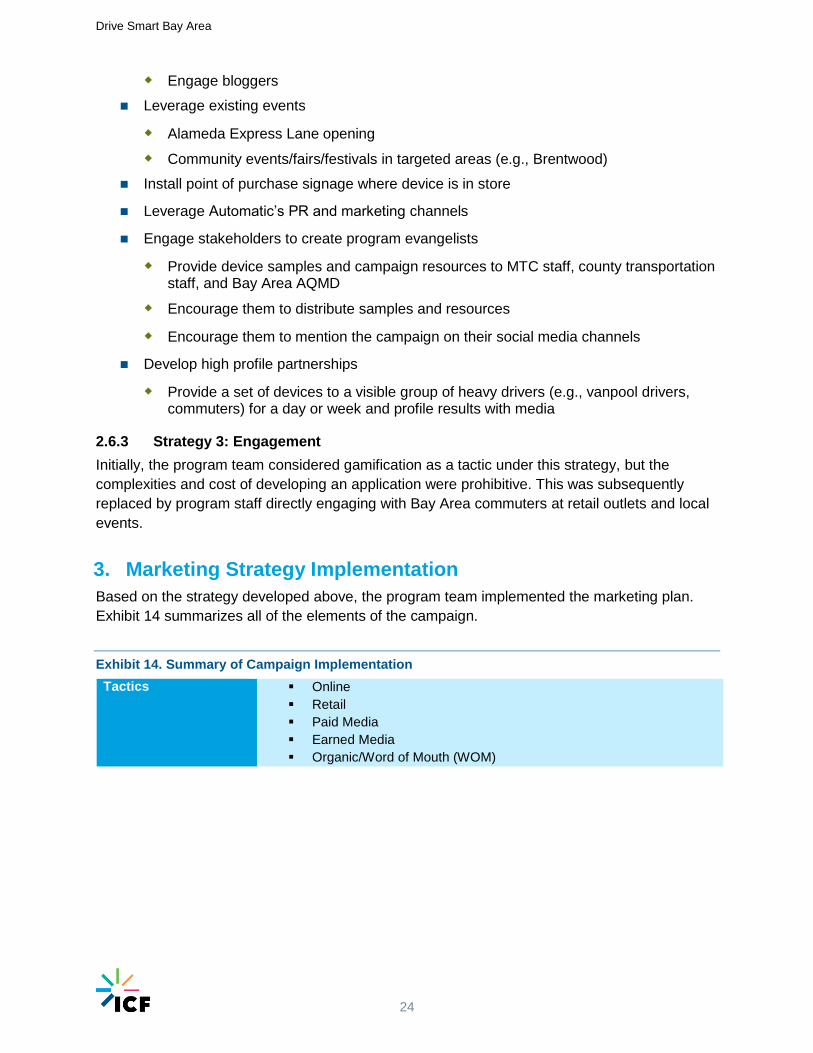
Exhibit 14. Summary of Campaign Implementation
Tactics Online
Retail
Paid Media
Earned Media
Organic/Word of Mouth (WOM)
Drive Smart Bay Area
25
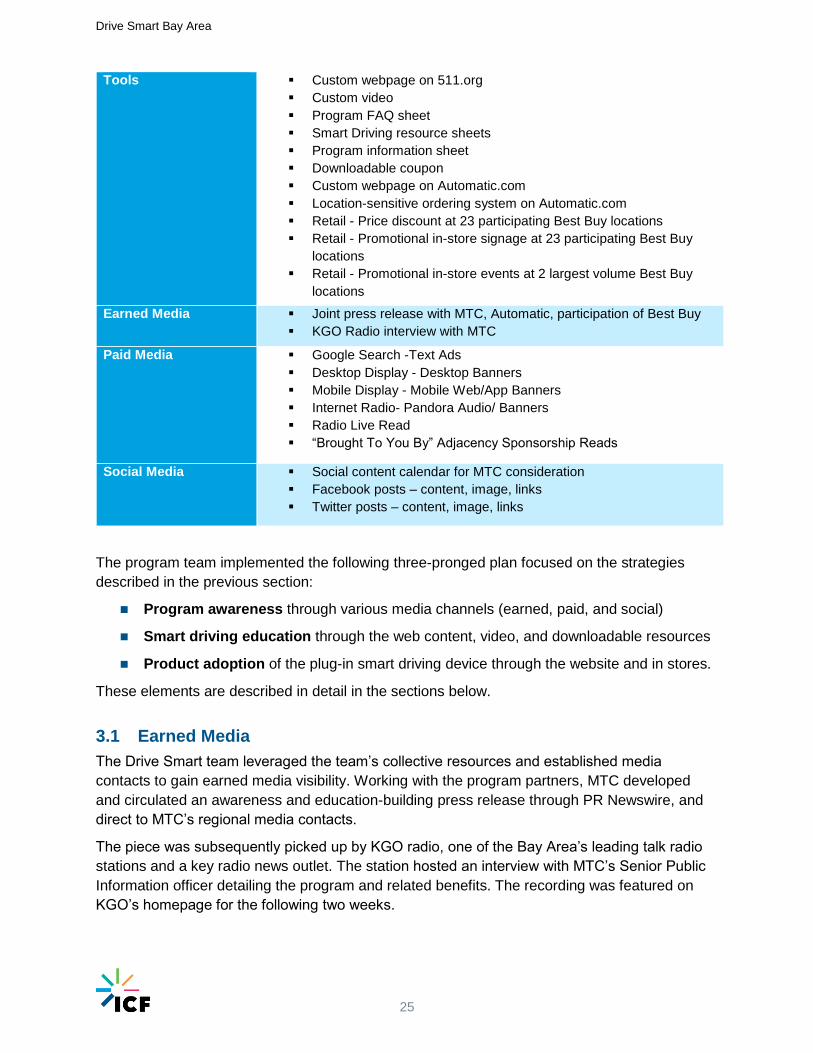
Tools Custom webpage on 511.org
Custom video
Program FAQ sheet
Smart Driving resource sheets
Program information sheet
Downloadable coupon
Custom webpage on Automatic.com
Location-sensitive ordering system on Automatic.com
Retail - Price discount at 23 participating Best Buy locations
Retail - Promotional in-store signage at 23 participating Best Buy
locations
Retail - Promotional in-store events at 2 largest volume Best Buy
locations
Earned Media Joint press release with MTC, Automatic, participation of Best Buy
KGO Radio interview with MTC
Paid Media Google Search -Text Ads
Desktop Display - Desktop Banners
Mobile Display - Mobile Web/App Banners
Internet Radio- Pandora Audio/ Banners
Radio Live Read
“Brought To You By” Adjacency Sponsorship Reads
Social Media Social content calendar for MTC consideration
Facebook posts – content, image, links
Twitter posts – content, image, links
The program team implemented the following three-pronged plan focused on the strategies
described in the previous section:
Program awareness through various media channels (earned, paid, and social)
Smart driving education through the web content, video, and downloadable resources
Product adoption of the plug-in smart driving device through the website and in stores.
These elements are described in detail in the sections below.
3.1 Earned Media
The Drive Smart team leveraged the team’s collective resources and established media
contacts to gain earned media visibility. Working with the program partners, MTC developed
and circulated an awareness and education-building press release through PR Newswire, and
direct to MTC’s regional media contacts.
The piece was subsequently picked up by KGO radio, one of the Bay Area’s leading talk radio
stations and a key radio news outlet. The station hosted an interview with MTC’s Senior Public
Information officer detailing the program and related benefits. The recording was featured on
KGO’s homepage for the following two weeks.
Drive Smart Bay Area
26
3.2 Paid Media
The program team used a mix of online and offline paid media channels.
3.2.1 Online Paid Media
The program team used four online channels for paid media: Google Search, Desktop Banners,
Mobile Banners, and Internet Radio. The messages were specifically targeted to adults in the
nine county Bay Area, and accessible via both web and mobile platforms. In all cases, clicking
an ad would bring the consumer to the Drive Smart landing page and related educational
materials. Samples of all ads can be seen Appendix B.
From January to August 2016, online channels produced 9,505,600 impressions for the Drive
Smart Program. An impression is defined as any interaction with a piece of content and an
audience member. For example, it is the number of times that an ad was displayed on a
webpage or the expected number of listeners to a particular radio ad spot.
3.2.2 Offline Paid Media
In addition, the program team used offline media to maximize reach to Bay Area commuters.
The program was highlighted by local radio DJ’s via live reads and traffic and weather update
sponsorships during peak drive time. This allowed the program to reach frequent/high mile
drivers, while concurrently leveraging trusted regional personalities.
From February to May 2016, offline media reached 1,139,562 listeners. See the Evaluation section for more details.
3.3 Social Media and Email
Social media and emails were used throughout the campaign to increase visibility and leverage
the contacts that MTC and Automatic have developed.
3.3.1 Social Media
MTC (through 511) ran a series of weekly Twitter and Facebook posts in the month of April,
which is National Car Care Month. Examples of the posts (without the associated graphics)
include:
April doesn’t just mean baseball. It’s National #CarCareMonth. Get your car ready for
warmer temps with a tune up and #DriveSmartBayArea
84% of cars tested last #CarCareMonth needed basic care – does yours? This April,
tune up and #DriveSmartBayArea
Get your #CarCareMonth rolling with properly inflated tires- and save nearly 10 ₵ per
gallon #DriveSmartBayArea
Don’t just care for your car for #CarCareMonth – make it smart. Get a connected car tool
for 50% off. Save MPG, read engine lights, + more.
Automatic also posted about Drive Smart Bay Area through a series of posts focused at the
beginning of the campaign and around Earth Day.
Drive Smart Bay Area
27
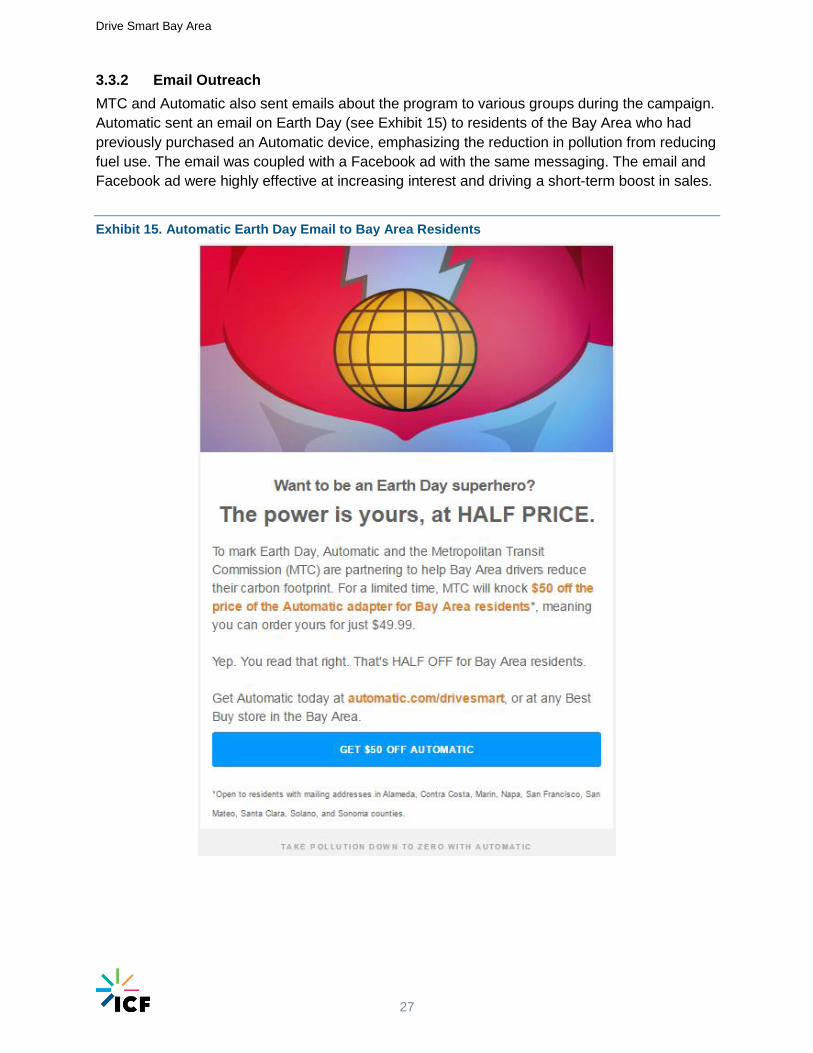
3.3.2 Email Outreach
MTC and Automatic also sent emails about the program to various groups during the campaign.
Automatic sent an email on Earth Day (see Exhibit 15) to residents of the Bay Area who had
previously purchased an Automatic device, emphasizing the reduction in pollution from reducing
fuel use. The email was coupled with a Facebook ad with the same messaging. The email and
Facebook ad were highly effective at increasing interest and driving a short-term boost in sales.
Exhibit 15. Automatic Earth Day Email to Bay Area Residents
Drive Smart Bay Area
28
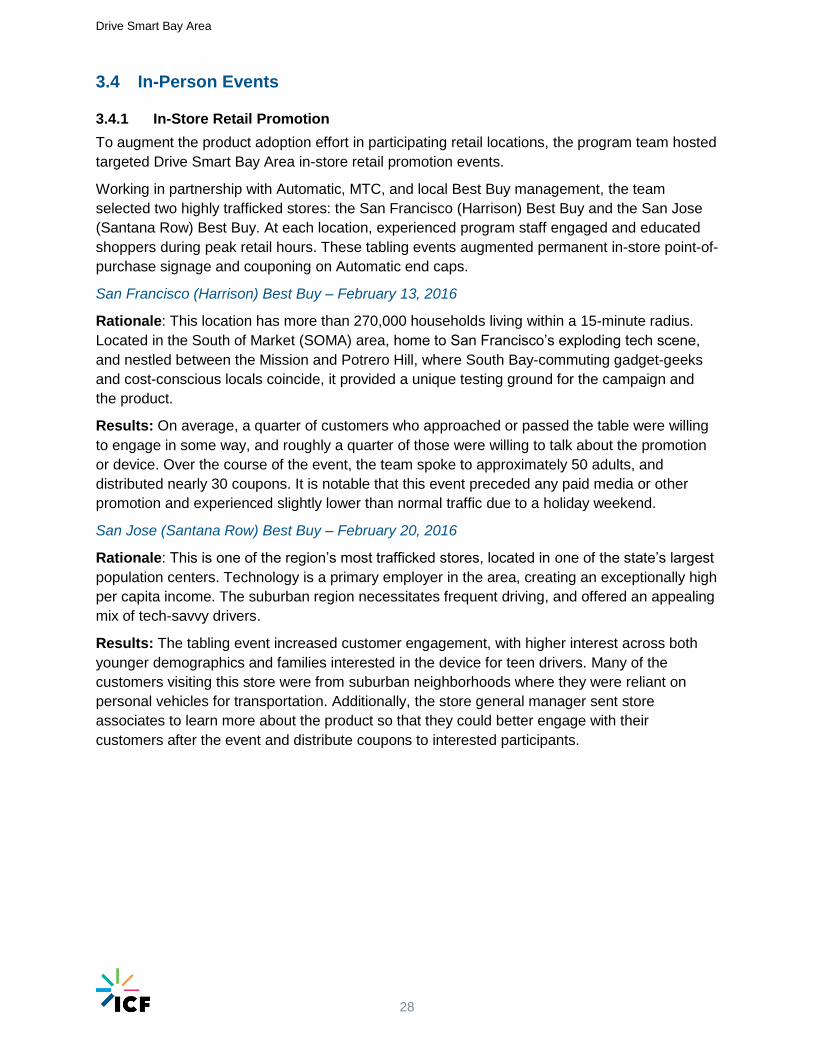
3.4 In-Person Events
3.4.1 In-Store Retail Promotion
To augment the product adoption effort in participating retail locations, the program team hosted
targeted Drive Smart Bay Area in-store retail promotion events.
Working in partnership with Automatic, MTC, and local Best Buy management, the team
selected two highly trafficked stores: the San Francisco (Harrison) Best Buy and the San Jose
(Santana Row) Best Buy. At each location, experienced program staff engaged and educated
shoppers during peak retail hours. These tabling events augmented permanent in-store point-of-
purchase signage and couponing on Automatic end caps.
San Francisco (Harrison) Best Buy – February 13, 2016
Rationale: This location has more than 270,000 households living within a 15-minute radius.
Located in the South of Market (SOMA) area, home to San Francisco’s exploding tech scene,
and nestled between the Mission and Potrero Hill, where South Bay-commuting gadget-geeks
and cost-conscious locals coincide, it provided a unique testing ground for the campaign and
the product.
Results: On average, a quarter of customers who approached or passed the table were willing
to engage in some way, and roughly a quarter of those were willing to talk about the promotion
or device. Over the course of the event, the team spoke to approximately 50 adults, and
distributed nearly 30 coupons. It is notable that this event preceded any paid media or other
promotion and experienced slightly lower than normal traffic due to a holiday weekend.
San Jose (Santana Row) Best Buy – February 20, 2016
Rationale: This is one of the region’s most trafficked stores, located in one of the state’s largest
population centers. Technology is a primary employer in the area, creating an exceptionally high
per capita income. The suburban region necessitates frequent driving, and offered an appealing
mix of tech-savvy drivers.
Results: The tabling event increased customer engagement, with higher interest across both
younger demographics and families interested in the device for teen drivers. Many of the
customers visiting this store were from suburban neighborhoods where they were reliant on
personal vehicles for transportation. Additionally, the store general manager sent store
associates to learn more about the product so that they could better engage with their
customers after the event and distribute coupons to interested participants.
Drive Smart Bay Area
29
Exhibit 16. In-Store Event at Best Buy San Francisco
3.4.2 Public Events
This same direct outreach and assistance was provided outside of the retail environment at
large scale public events. This included two efforts in partnership with MTC.
Earth Week – April 19, 2016
Workday, one of the largest employers in the Tri-Valley area, hosted an Earth Week event at
their offices in Pleasanton that focused on educating consumers about environmentally friendly
behaviors and everyday conservation practices. Drive Smart Bay Area program experts staffed
a booth, providing educational collateral and advise to event attendees and distributing several
program coupons to multiple event participants.
Experience Electric – April 2016
Experience Electric is a separate program administered by MTC, offering ride-and-drives at
events to allow participants to try out electric vehicles. The program coordinators displayed
Drive Smart Bay Area materials and distributed collateral at their booth at Home & Garden
Shows April 2-3 in Concord and April 16-17 in Fairfield.
4. Website and Video Development
As identified above, a central component of the Drive Smart Bay Area campaign was the
program website. A simple external splash page on 511.org (which is maintained by MTC)
centralized the smart driving recommendations, served as a central clearinghouse for the
program, provided a clear overview of the program, housed all documents, and offered links to
various partners and pages, including information on purchasing the Automatic device. All
promotional content and calls to action were directed to the website.
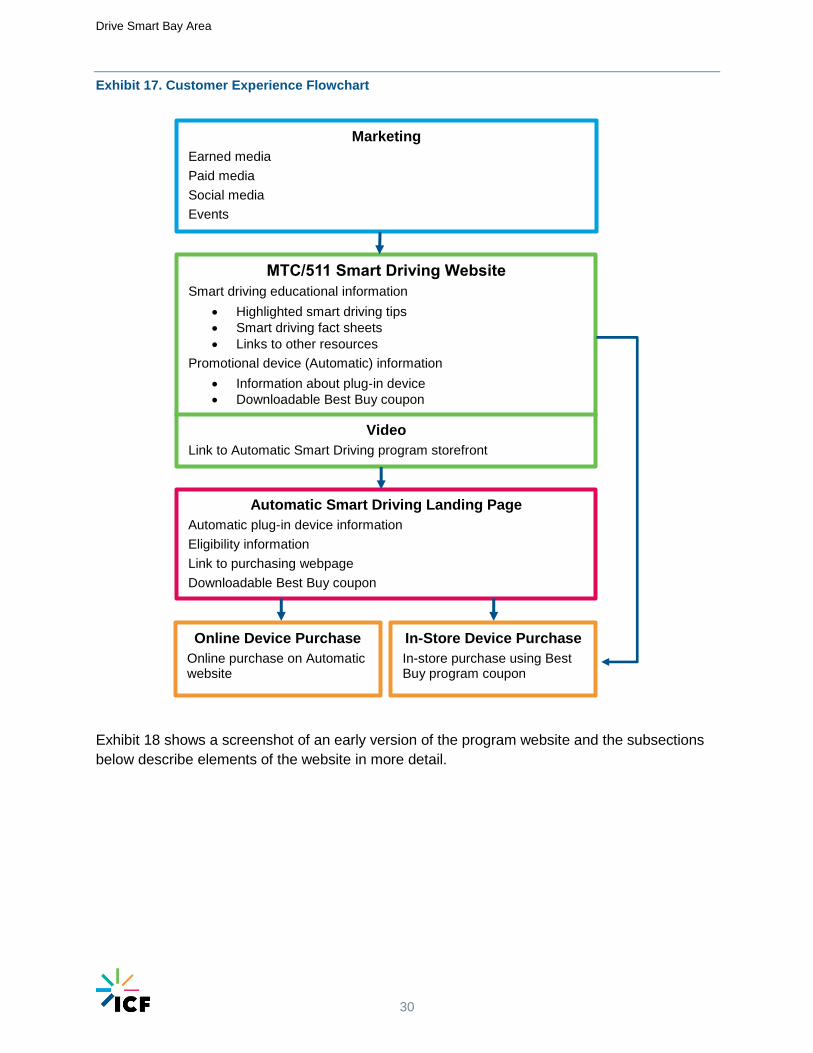
Exhibit 17 provides a graphical summary of how the various campaign elements were united
and the process that a customer would follow from marketing through smart driving action. As
shown, the MTC/511 website was the central hub for information dissemination.
Drive Smart Bay Area
30
Exhibit 17. Customer Experience Flowchart
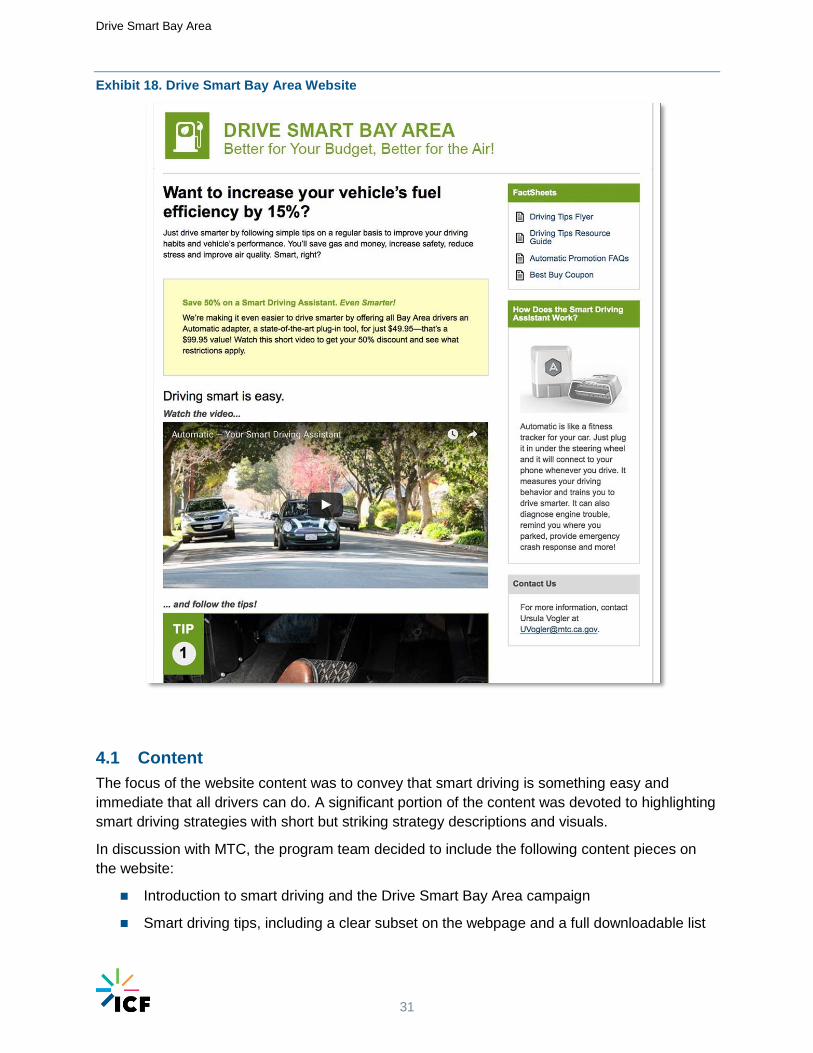
Exhibit 18 shows a screenshot of an early version of the program website and the subsections
below describe elements of the website in more detail.
Marketing
Earned media
Paid media
Social media
Events
MTC/511 Smart Driving Website
Smart driving educational information
Highlighted smart driving tips
Smart driving fact sheets
Links to other resources
Promotional device (Automatic) information
Information about plug-in device
Downloadable Best Buy coupon
Video
Link to Automatic Smart Driving program storefront
Automatic Smart Driving Landing Page
Automatic plug-in device information
Eligibility information
Link to purchasing webpage
Downloadable Best Buy coupon
Online Device Purchase
Online purchase on Automatic website
In-Store Device Purchase
In-store purchase using Best Buy program coupon
Drive Smart Bay Area
31
Exhibit 18. Drive Smart Bay Area Website
4.1 Content
The focus of the website content was to convey that smart driving is something easy and
immediate that all drivers can do. A significant portion of the content was devoted to highlighting
smart driving strategies with short but striking strategy descriptions and visuals.
In discussion with MTC, the program team decided to include the following content pieces on
the website:
Introduction to smart driving and the Drive Smart Bay Area campaign
Smart driving tips, including a clear subset on the webpage and a full downloadable list
Drive Smart Bay Area
32
An animated video providing smart driving information
Downloadable educational resources
Links to external smart driving resources
Information about Automatic and the discount
A link for purchasing the discounted Automatic
The website copy was edited and tweaked multiple times throughout the campaign to
encourage visitors to review the content and consider purchasing a plug-in device.
4.2 Format
The format of the webpage changed over time in response to an evolving understanding of
website visitors and their preferences.
At the outset, all content was designed to be on one page to maintain a simple webpage design.
Later, the format was updated to be optimized for smartphones. For example, in an early
iteration of the website, strategies and images were displayed in a rotating carousel screen.
When the website was updated for smartphone optimization, strategies and images were
stacked vertically for easy viewing on a mobile screen.
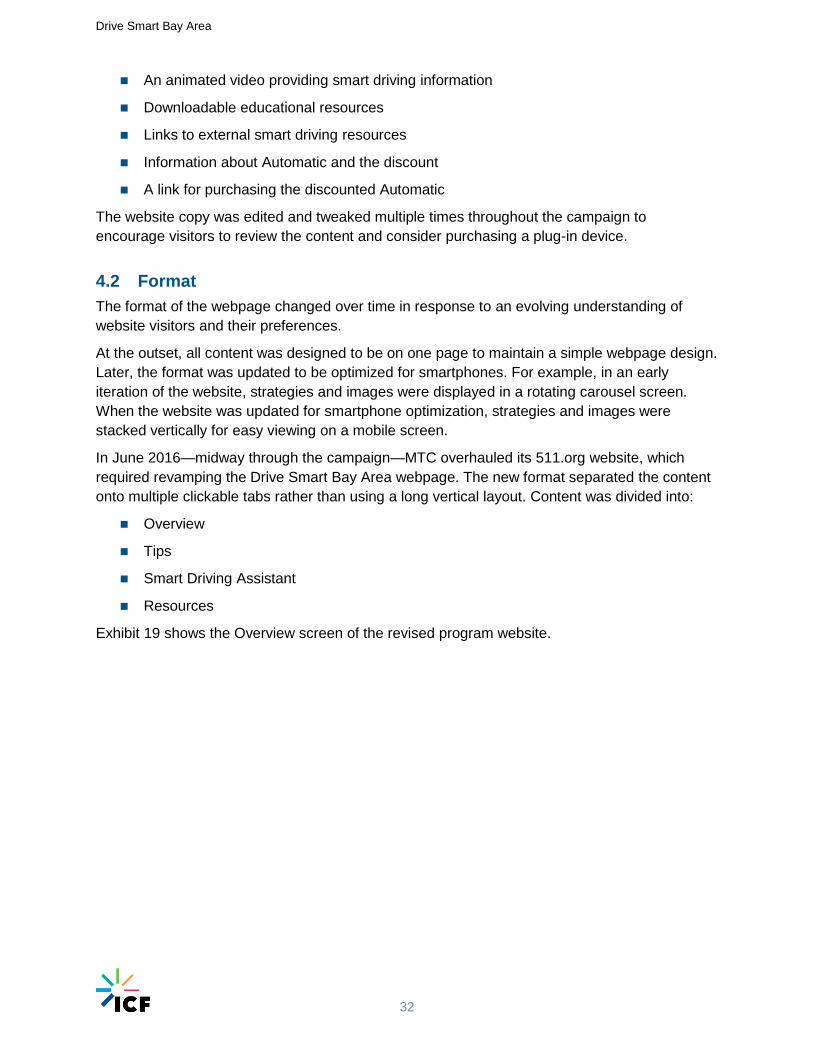
In June 2016—midway through the campaign—MTC overhauled its 511.org website, which
required revamping the Drive Smart Bay Area webpage. The new format separated the content
onto multiple clickable tabs rather than using a long vertical layout. Content was divided into:
Overview
Tips
Smart Driving Assistant
Resources
Exhibit 19 shows the Overview screen of the revised program website.
Drive Smart Bay Area
33
Exhibit 19. Drive Smart Bay Area Page on Revamped 511 website
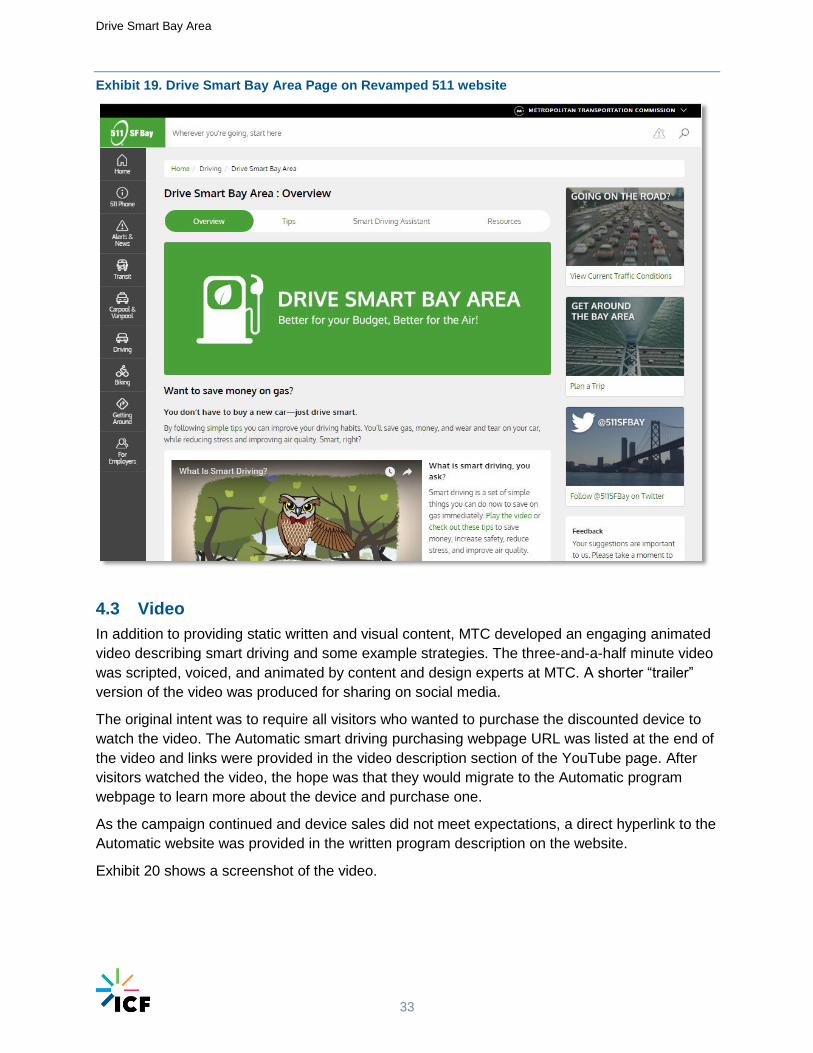
4.3 Video
In addition to providing static written and visual content, MTC developed an engaging animated
video describing smart driving and some example strategies. The three-and-a-half minute video
was scripted, voiced, and animated by content and design experts at MTC. A shorter “trailer”
version of the video was produced for sharing on social media.
The original intent was to require all visitors who wanted to purchase the discounted device to
watch the video. The Automatic smart driving purchasing webpage URL was listed at the end of
the video and links were provided in the video description section of the YouTube page. After
visitors watched the video, the hope was that they would migrate to the Automatic program
webpage to learn more about the device and purchase one.
As the campaign continued and device sales did not meet expectations, a direct hyperlink to the
Automatic website was provided in the written program description on the website.
Exhibit 20 shows a screenshot of the video.
Drive Smart Bay Area
34
Exhibit 20. Screenshot of Smart Driving Video
5. Establishing Device Purchasing Options
The program provided two
venues for obtaining the Drive
Smart Bay Area promotional
price on Automatic devices:
online fulfillment and purchase
in a Bay Area Best Buy store.
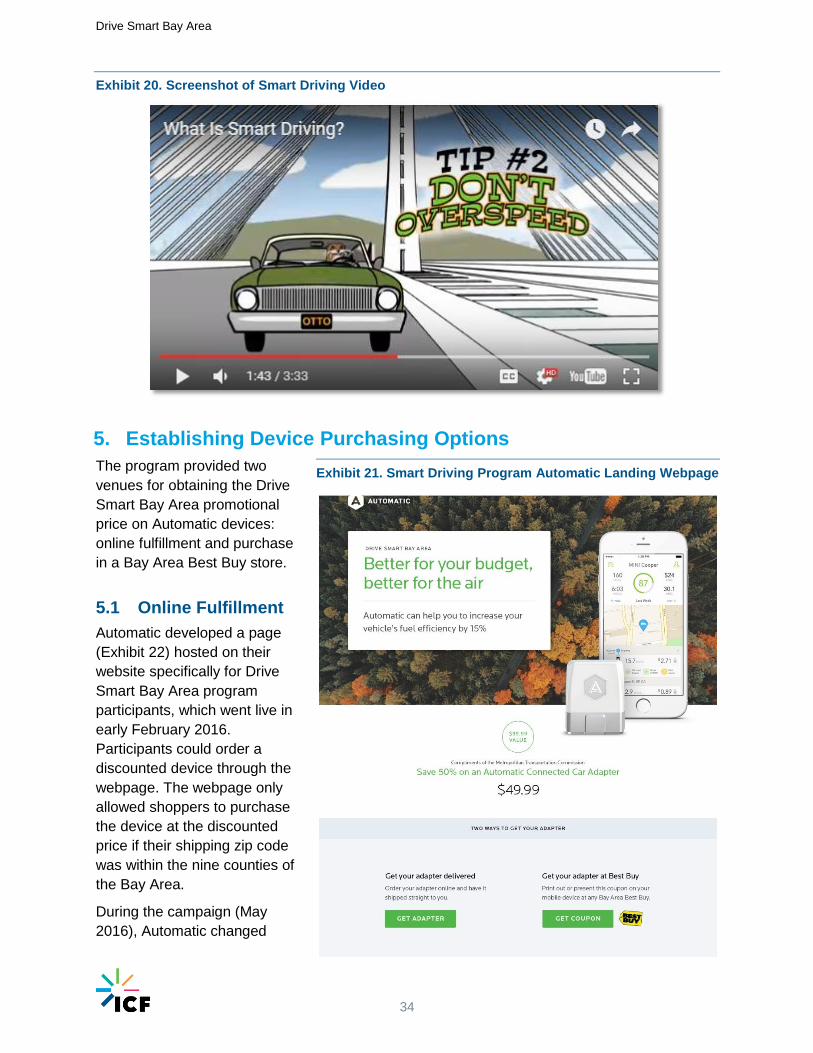
5.1 Online Fulfillment
Automatic developed a page
(Exhibit 22) hosted on their
website specifically for Drive
Smart Bay Area program
participants, which went live in
early February 2016.
Participants could order a
discounted device through the
webpage. The webpage only
allowed shoppers to purchase
the device at the discounted
price if their shipping zip code
was within the nine counties of
the Bay Area.
During the campaign (May
2016), Automatic changed
Exhibit 21. Smart Driving Program Automatic Landing Webpage
Drive Smart Bay Area
35
online purchasing vendors which affected the online shopping platform. As a result of this
change, Automatic was unable to sell devices through the program-specific webpage, which
eliminated the ability for consumers to take advantage of the discounted Drive Smart Bay Area
price online. To try to compensate for this change and provide a venue for online fulfillment,
Automatic reached out to Amazon.com to determine if they could offer the discount to
customers purchasing the device in the Bay Area, but Amazon was unable to confirm that they
could support “geofenced” purchases. Thus, after May 2016, participants could only purchase
the discounted devices through the Drive Smart Bay Area program in local Best Buy stores.
5.2 In-Store Fulfillment
As an alternative to purchasing a device online, Automatic worked with Best Buy to promote the
program and to make the Drive Smart Bay Area discount available in their 23 Bay Area stores.
Automatic devices were typically available in the automotive section of the Best Buy stores on
an Automatic aisle endcap display (Exhibit 22).
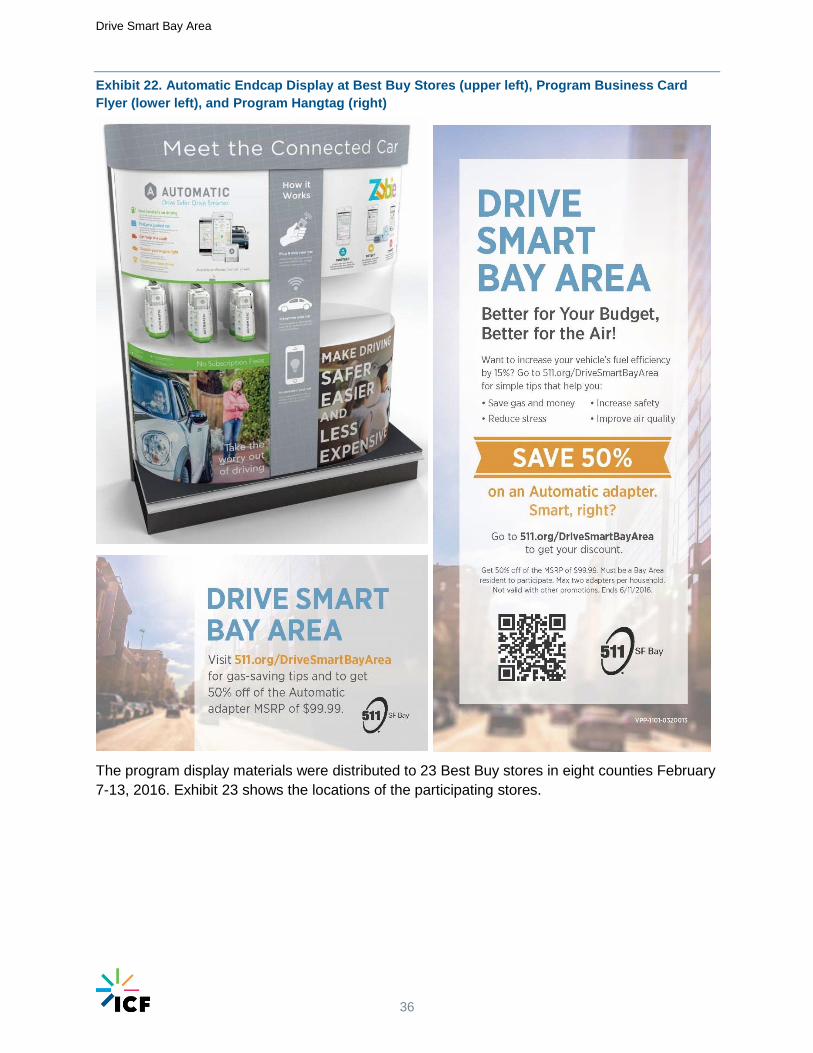
The program team developed two Drive Smart Bay Area displays to add to the endcaps:
Hangtag – 3.5” x 8.5” plastic display with a description of the program and promotion
hanging from display hooks
Business card flyer – 3.5” x 2” business card-size flyers for store customers to take, with
information on the program, a website listing, and a QR code linking directly to the
program website
Drive Smart Bay Area
36
Exhibit 22. Automatic Endcap Display at Best Buy Stores (upper left), Program Business Card
Flyer (lower left), and Program Hangtag (right)
The program display materials were distributed to 23 Best Buy stores in eight counties February
7-13, 2016. Exhibit 23 shows the locations of the participating stores.
Drive Smart Bay Area
37
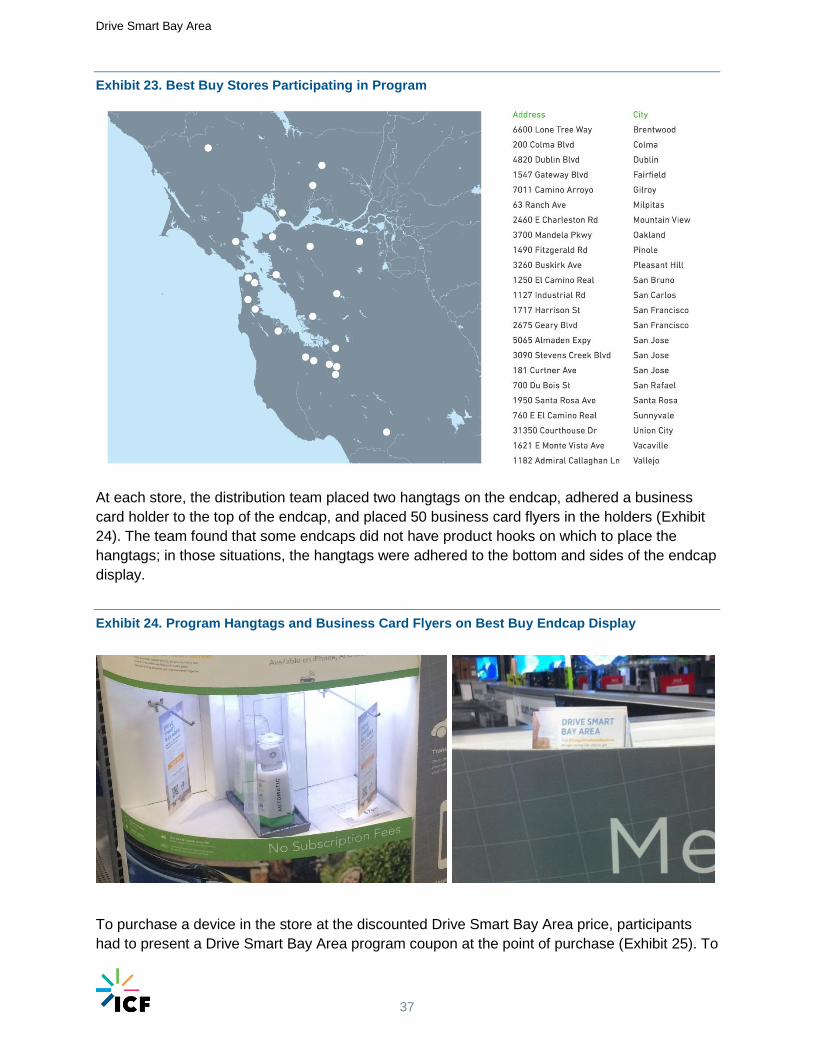
Exhibit 23. Best Buy Stores Participating in Program
At each store, the distribution team placed two hangtags on the endcap, adhered a business
card holder to the top of the endcap, and placed 50 business card flyers in the holders (Exhibit
24). The team found that some endcaps did not have product hooks on which to place the
hangtags; in those situations, the hangtags were adhered to the bottom and sides of the endcap
display.
Exhibit 24. Program Hangtags and Business Card Flyers on Best Buy Endcap Display
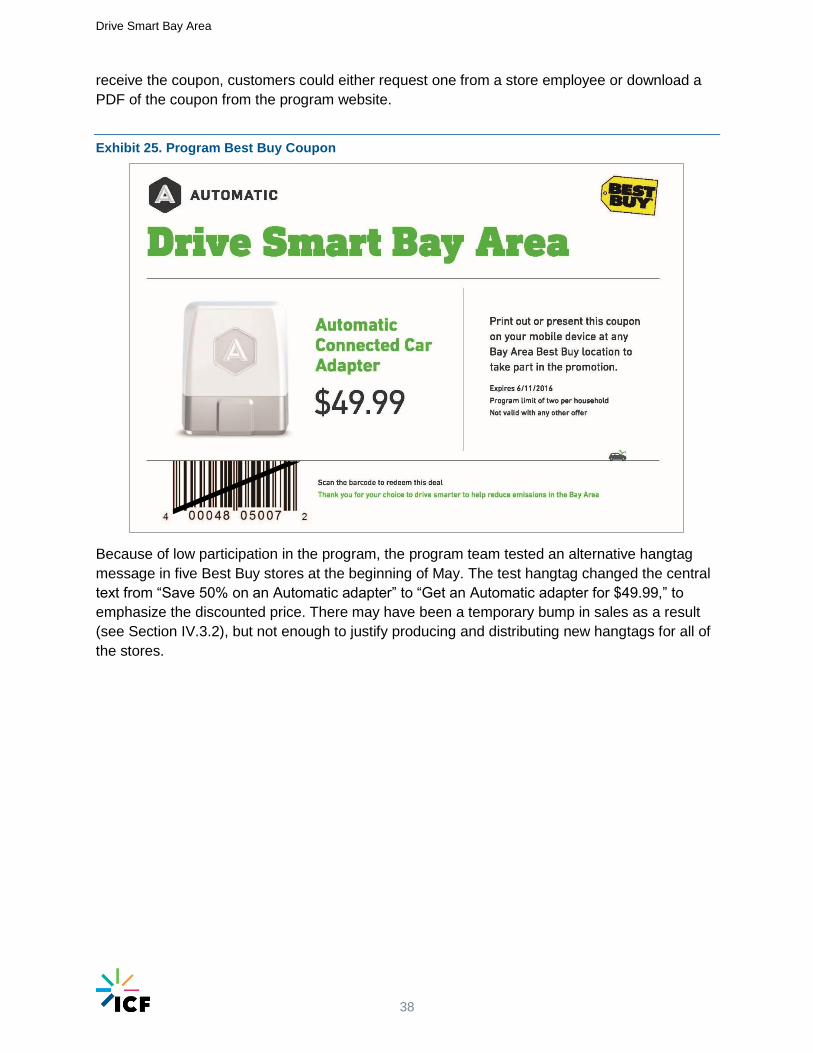
To purchase a device in the store at the discounted Drive Smart Bay Area price, participants
had to present a Drive Smart Bay Area program coupon at the point of purchase (Exhibit 25). To
Drive Smart Bay Area
38
receive the coupon, customers could either request one from a store employee or download a
PDF of the coupon from the program website.
Exhibit 25. Program Best Buy Coupon
Because of low participation in the program, the program team tested an alternative hangtag
message in five Best Buy stores at the beginning of May. The test hangtag changed the central
text from “Save 50% on an Automatic adapter” to “Get an Automatic adapter for $49.99,” to
emphasize the discounted price. There may have been a temporary bump in sales as a result
(see Section IV.3.2), but not enough to justify producing and distributing new hangtags for all of
the stores.
Drive Smart Bay Area
39
IV. Evaluation
The evaluation of the Drive Smart Bay Area program will help to inform future programs and
policies. Specifically, the evaluation seeks to understand:
1. What audience (how large/broad) was the campaign able to reach?
2. How effectively did the campaign encourage people to visit the Drive Smart Bay
Area website? This is measured by the conversion rate from audience reached to
people who visited the Drive Smart Bay Area website.
3. How effectively did the campaign encourage people to purchase smart driving
devices? This is measured by the conversion rate from people who visited the website
to people who purchased smart driving devices.
4. How much did the campaign reduce GHG emissions?
These questions are explored in the sections below.
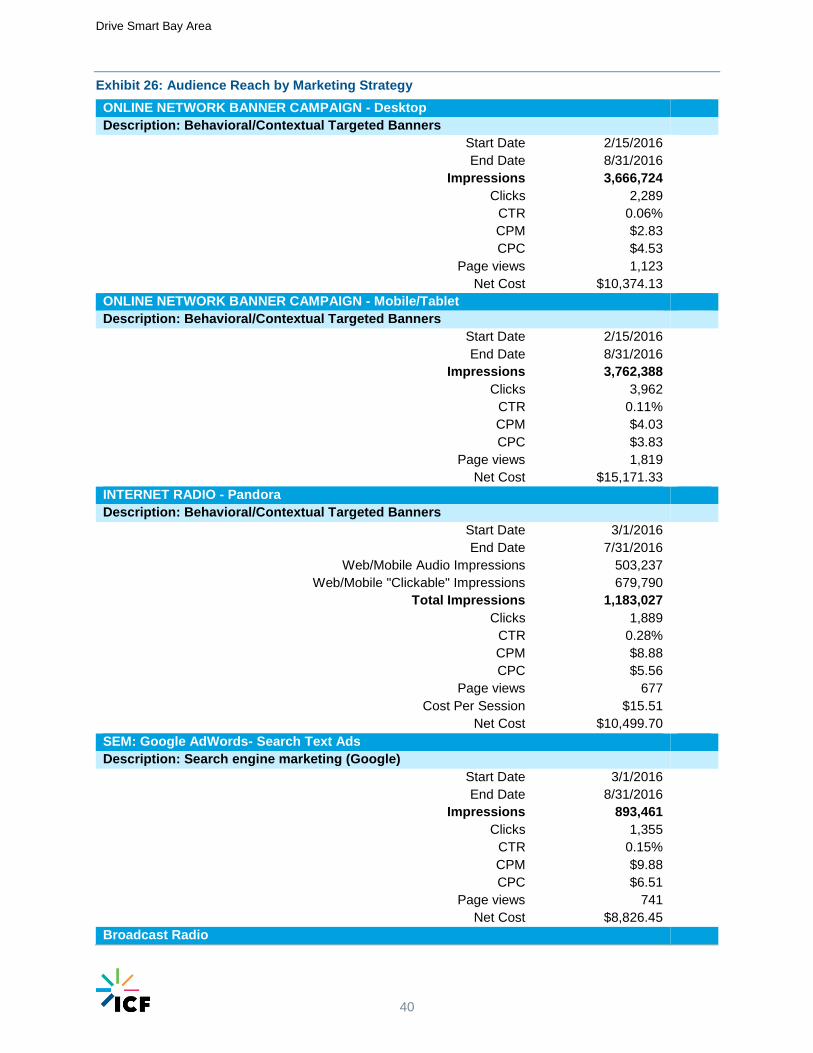
1. Audience Reach
In under seven months, the Drive Smart Program was able to make more than 10 million
regional impressions. Exhibit 26 provides a breakdown of the impressions by source and other
key metrics.
The majority of the impressions (7,429,112 impressions of 10,769,700) were made via banner
campaign ads on desktops and mobile phones/tablets. While these two marketing outlets
provided the lowest cost per impression (CPM is the cost per thousand impressions) and the
lowest cost-per-click, they did not produce the most effective click-through rate (CTR). The
Pandora radio ads produced the highest CTR with 0.28% of impressions resulting in a click-
through to the program website. The Google Ad Words campaign produced the poorest results
in terms of cost-per-impression and cost-per-click.
One difficulty with the Google Ad Words campaign was ensuring that the marketing dollars for
this campaign were not competing with preexisting marketing campaign dollars being spent by
Automatic. Since similar search terms and key phrases were being used for the two campaigns,
it is possible that this was driving up the bidding price for displaying banner ads and diluting the
message about the DSBA discount. In the future, it would be preferential to either invest more in
other mediums or to better coordinate campaigns so that Automatic’s Bay Area ads also alerted
the public about the DSBA discount.
Drive Smart Bay Area
40
Exhibit 26: Audience Reach by Marketing Strategy
ONLINE NETWORK BANNER CAMPAIGN - Desktop
Description: Behavioral/Contextual Targeted Banners
Start Date 2/15/2016
End Date 8/31/2016
Impressions 3,666,724
Clicks 2,289
CTR 0.06%
CPM $2.83
CPC $4.53
Page views 1,123
Net Cost $10,374.13
ONLINE NETWORK BANNER CAMPAIGN - Mobile/Tablet
Description: Behavioral/Contextual Targeted Banners
Start Date 2/15/2016
End Date 8/31/2016
Impressions 3,762,388
Clicks 3,962
CTR 0.11%
CPM $4.03
CPC $3.83
Page views 1,819
Net Cost $15,171.33
INTERNET RADIO - Pandora
Description: Behavioral/Contextual Targeted Banners
Start Date 3/1/2016
End Date 7/31/2016
Web/Mobile Audio Impressions 503,237
Web/Mobile "Clickable" Impressions 679,790
Total Impressions 1,183,027
Clicks 1,889
CTR 0.28%
CPM $8.88
CPC $5.56
Page views 677
Cost Per Session $15.51
Net Cost $10,499.70
SEM: Google AdWords- Search Text Ads
Description: Search engine marketing (Google)
Start Date 3/1/2016
End Date 8/31/2016
Impressions 893,461
Clicks 1,355
CTR 0.15%
CPM $9.88
CPC $6.51
Page views 741
Net Cost $8,826.45
Broadcast Radio
Drive Smart Bay Area
41
:10 and :15 Second Weather and Traffic Sponsorship
Start Date 3/1/2016
End Date 8/31/2016
Impressions 1,264,100
CPM $6.44
Net Cost $8,136.00
Campaign Summary
Start Date 2/15/2016
End Date 8/31/2016
Impressions 10,769,700
CPM $5.01
Net Cost $53,007.61
CTR: Click-through rate | CPM: Cost per thousand impressions | CPC: Cost-per-click
2. Website Visits
The website analytics associated with the Drive Smart Bay Area website on 511.org provide
insights on the effectiveness of various marketing strategies and demonstrate how many people
were exposed to smart driving educational information and resources.
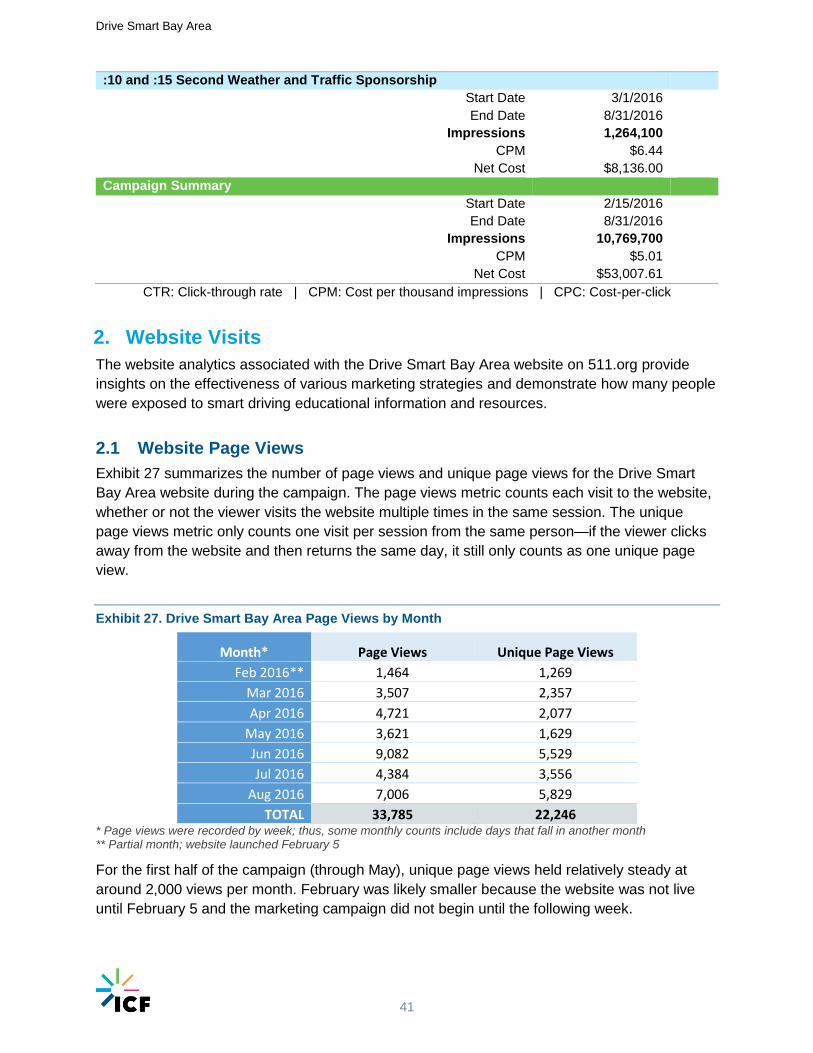
2.1 Website Page Views
Exhibit 27 summarizes the number of page views and unique page views for the Drive Smart
Bay Area website during the campaign. The page views metric counts each visit to the website,
whether or not the viewer visits the website multiple times in the same session. The unique
page views metric only counts one visit per session from the same person—if the viewer clicks
away from the website and then returns the same day, it still only counts as one unique page
view.
Exhibit 27. Drive Smart Bay Area Page Views by Month
Month* Page Views Unique Page Views
Feb 2016** 1,464 1,269
Mar 2016 3,507 2,357
Apr 2016 4,721 2,077
May 2016 3,621 1,629
Jun 2016 9,082 5,529
Jul 2016 4,384 3,556
Aug 2016 7,006 5,829
TOTAL 33,785 22,246 * Page views were recorded by week; thus, some monthly counts include days that fall in another month ** Partial month; website launched February 5
For the first half of the campaign (through May), unique page views held relatively steady at
around 2,000 views per month. February was likely smaller because the website was not live
until February 5 and the marketing campaign did not begin until the following week.
Drive Smart Bay Area
42
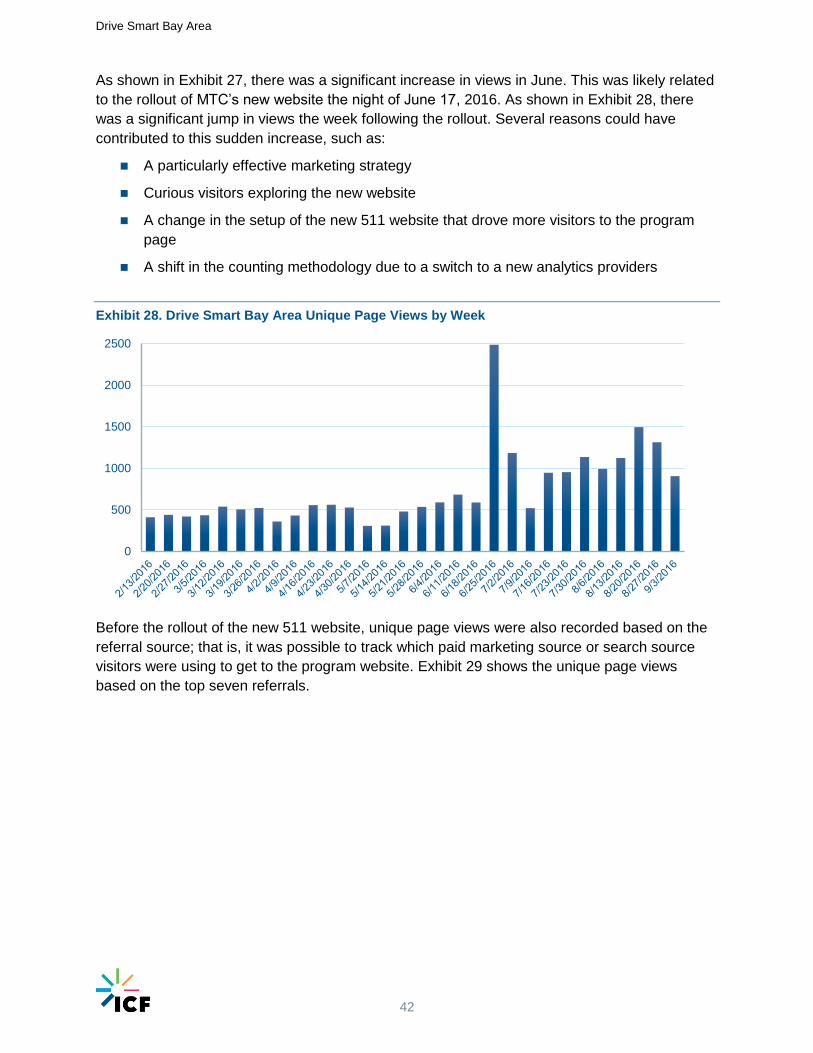
As shown in Exhibit 27, there was a significant increase in views in June. This was likely related
to the rollout of MTC’s new website the night of June 17, 2016. As shown in Exhibit 28, there
was a significant jump in views the week following the rollout. Several reasons could have
contributed to this sudden increase, such as:
A particularly effective marketing strategy
Curious visitors exploring the new website
A change in the setup of the new 511 website that drove more visitors to the program
page
A shift in the counting methodology due to a switch to a new analytics providers
Exhibit 28. Drive Smart Bay Area Unique Page Views by Week
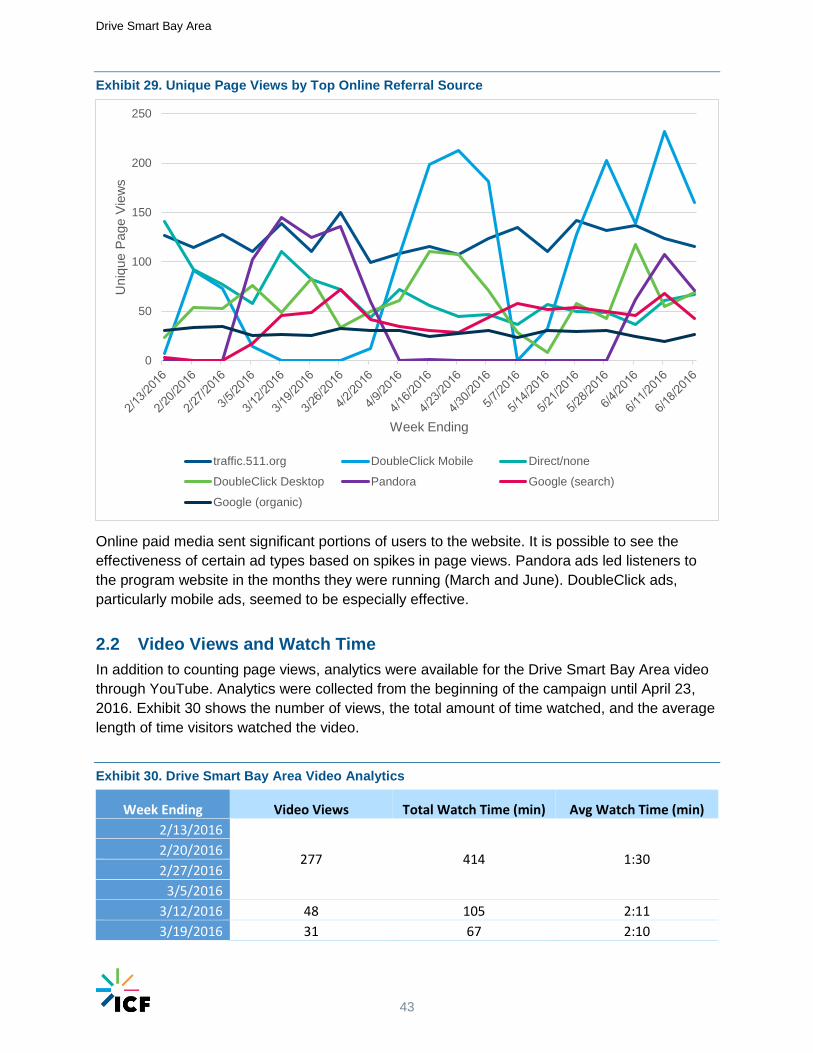
Before the rollout of the new 511 website, unique page views were also recorded based on the
referral source; that is, it was possible to track which paid marketing source or search source
visitors were using to get to the program website. Exhibit 29 shows the unique page views
based on the top seven referrals.
0
500
1000
1500
2000
2500
Drive Smart Bay Area
43
Exhibit 29. Unique Page Views by Top Online Referral Source
Online paid media sent significant portions of users to the website. It is possible to see the
effectiveness of certain ad types based on spikes in page views. Pandora ads led listeners to
the program website in the months they were running (March and June). DoubleClick ads,
particularly mobile ads, seemed to be especially effective.
2.2 Video Views and Watch Time
In addition to counting page views, analytics were available for the Drive Smart Bay Area video
through YouTube. Analytics were collected from the beginning of the campaign until April 23,
2016. Exhibit 30 shows the number of views, the total amount of time watched, and the average
length of time visitors watched the video.
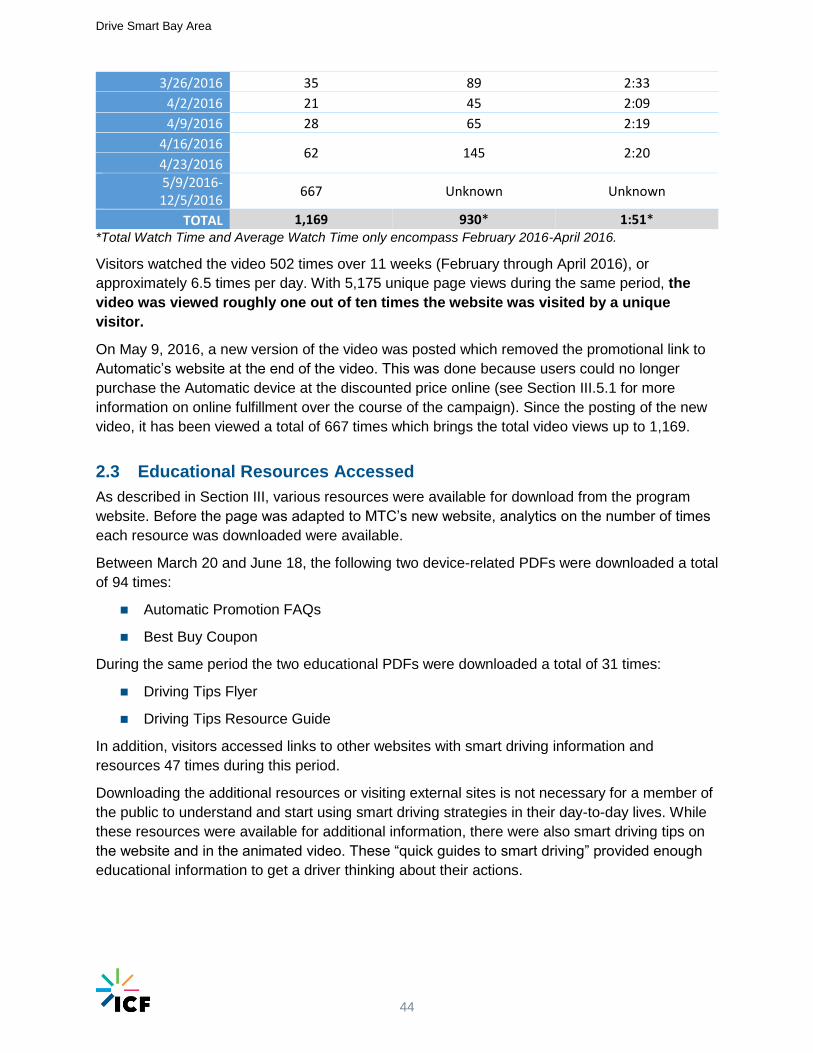
Exhibit 30. Drive Smart Bay Area Video Analytics
Week Ending Video Views Total Watch Time (min) Avg Watch Time (min)
2/13/2016
277 414 1:30 2/20/2016
2/27/2016
3/5/2016
3/12/2016 48 105 2:11
3/19/2016 31 67 2:10
0
50
100
150
200
250U
niq
ue P
age V
iew
s
Week Ending
traffic.511.org DoubleClick Mobile Direct/none
DoubleClick Desktop Pandora Google (search)
Google (organic)
Drive Smart Bay Area
44
3/26/2016 35 89 2:33
4/2/2016 21 45 2:09
4/9/2016 28 65 2:19
4/16/2016 62 145 2:20
4/23/2016 5/9/2016-12/5/2016
667 Unknown Unknown
TOTAL 1,169 930* 1:51* *Total Watch Time and Average Watch Time only encompass February 2016-April 2016.
Visitors watched the video 502 times over 11 weeks (February through April 2016), or
approximately 6.5 times per day. With 5,175 unique page views during the same period, the
video was viewed roughly one out of ten times the website was visited by a unique
visitor.
On May 9, 2016, a new version of the video was posted which removed the promotional link to
Automatic’s website at the end of the video. This was done because users could no longer
purchase the Automatic device at the discounted price online (see Section III.5.1 for more
information on online fulfillment over the course of the campaign). Since the posting of the new
video, it has been viewed a total of 667 times which brings the total video views up to 1,169.
2.3 Educational Resources Accessed
As described in Section III, various resources were available for download from the program
website. Before the page was adapted to MTC’s new website, analytics on the number of times
each resource was downloaded were available.
Between March 20 and June 18, the following two device-related PDFs were downloaded a total
of 94 times:
Automatic Promotion FAQs
Best Buy Coupon
During the same period the two educational PDFs were downloaded a total of 31 times:
Driving Tips Flyer
Driving Tips Resource Guide
In addition, visitors accessed links to other websites with smart driving information and
resources 47 times during this period.
Downloading the additional resources or visiting external sites is not necessary for a member of
the public to understand and start using smart driving strategies in their day-to-day lives. While
these resources were available for additional information, there were also smart driving tips on
the website and in the animated video. These “quick guides to smart driving” provided enough
educational information to get a driver thinking about their actions.
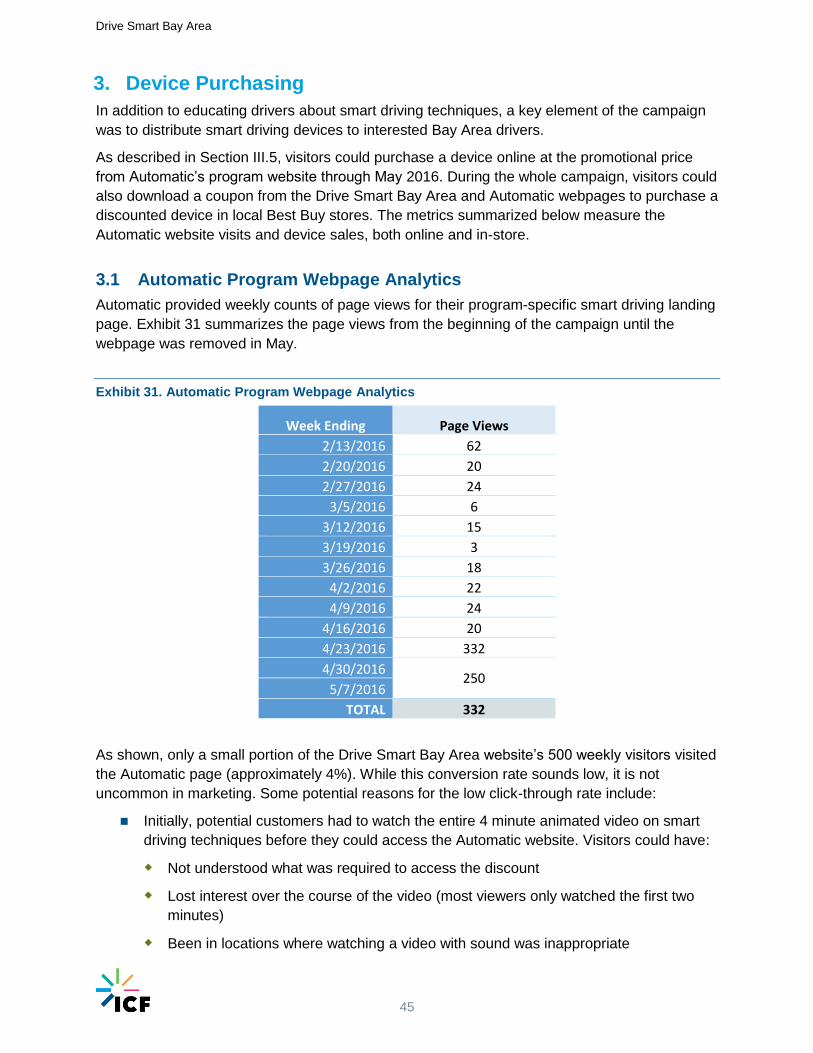
Drive Smart Bay Area
45
3. Device Purchasing
In addition to educating drivers about smart driving techniques, a key element of the campaign
was to distribute smart driving devices to interested Bay Area drivers.
As described in Section III.5, visitors could purchase a device online at the promotional price
from Automatic’s program website through May 2016. During the whole campaign, visitors could
also download a coupon from the Drive Smart Bay Area and Automatic webpages to purchase a
discounted device in local Best Buy stores. The metrics summarized below measure the
Automatic website visits and device sales, both online and in-store.
3.1 Automatic Program Webpage Analytics
Automatic provided weekly counts of page views for their program-specific smart driving landing
page. Exhibit 31 summarizes the page views from the beginning of the campaign until the
webpage was removed in May.
Exhibit 31. Automatic Program Webpage Analytics
Week Ending Page Views
2/13/2016 62
2/20/2016 20
2/27/2016 24
3/5/2016 6
3/12/2016 15
3/19/2016 3
3/26/2016 18
4/2/2016 22
4/9/2016 24
4/16/2016 20
4/23/2016 332
4/30/2016 250
5/7/2016
TOTAL 332
As shown, only a small portion of the Drive Smart Bay Area website’s 500 weekly visitors visited
the Automatic page (approximately 4%). While this conversion rate sounds low, it is not
uncommon in marketing. Some potential reasons for the low click-through rate include:
Initially, potential customers had to watch the entire 4 minute animated video on smart
driving techniques before they could access the Automatic website. Visitors could have:
Not understood what was required to access the discount
Lost interest over the course of the video (most viewers only watched the first two
minutes)
Been in locations where watching a video with sound was inappropriate
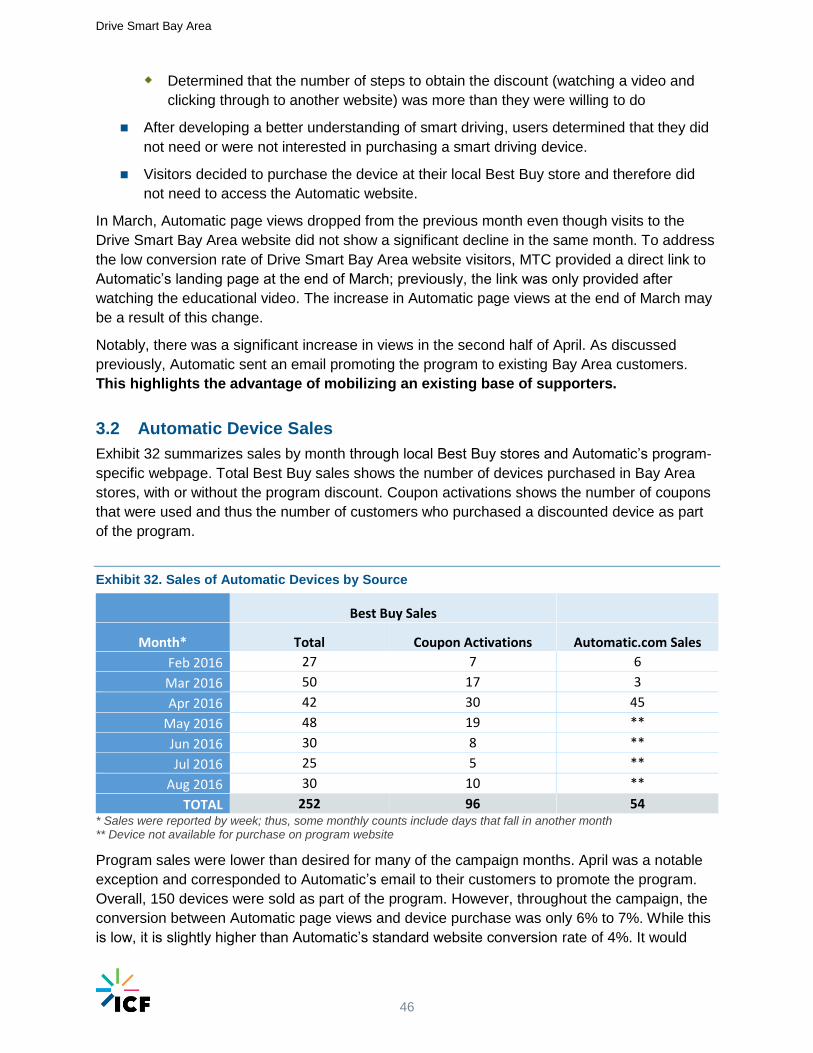
Drive Smart Bay Area
46
Determined that the number of steps to obtain the discount (watching a video and
clicking through to another website) was more than they were willing to do
After developing a better understanding of smart driving, users determined that they did
not need or were not interested in purchasing a smart driving device.
Visitors decided to purchase the device at their local Best Buy store and therefore did
not need to access the Automatic website.
In March, Automatic page views dropped from the previous month even though visits to the
Drive Smart Bay Area website did not show a significant decline in the same month. To address
the low conversion rate of Drive Smart Bay Area website visitors, MTC provided a direct link to
Automatic’s landing page at the end of March; previously, the link was only provided after
watching the educational video. The increase in Automatic page views at the end of March may
be a result of this change.
Notably, there was a significant increase in views in the second half of April. As discussed
previously, Automatic sent an email promoting the program to existing Bay Area customers.
This highlights the advantage of mobilizing an existing base of supporters.
3.2 Automatic Device Sales
Exhibit 32 summarizes sales by month through local Best Buy stores and Automatic’s program-
specific webpage. Total Best Buy sales shows the number of devices purchased in Bay Area
stores, with or without the program discount. Coupon activations shows the number of coupons
that were used and thus the number of customers who purchased a discounted device as part
of the program.
Exhibit 32. Sales of Automatic Devices by Source
Best Buy Sales
Month* Total Coupon Activations Automatic.com Sales
Feb 2016 27 7 6
Mar 2016 50 17 3
Apr 2016 42 30 45
May 2016 48 19 **
Jun 2016 30 8 **
Jul 2016 25 5 **
Aug 2016 30 10 **
TOTAL 252 96 54 * Sales were reported by week; thus, some monthly counts include days that fall in another month ** Device not available for purchase on program website
Program sales were lower than desired for many of the campaign months. April was a notable
exception and corresponded to Automatic’s email to their customers to promote the program.
Overall, 150 devices were sold as part of the program. However, throughout the campaign, the
conversion between Automatic page views and device purchase was only 6% to 7%. While this
is low, it is slightly higher than Automatic’s standard website conversion rate of 4%. It would
Drive Smart Bay Area
47
have been useful to understand how low this conversion rate typically was before developing
the campaign strategy in order to set expectations for the outcomes and narrow the focus of the
outreach.
During the campaign, the program team noticed that a large number of devices were being sold
without the program discount. In fact, less than half of the devices sold in Best Buy stores during
the campaign were purchased using the program discount, even though there were program
hangtags and flyers on the in-store displays and customers simply had to ask Best Buy
employees for a pre-printed coupon (see Section III.5.2 for more information on the displays).
Based on this issue, the program team tested out new language on the hangtags to highlight the
discounted price in five stores starting in May. There was a relatively high number of coupon
activations in May, but it is unclear whether that was a remnant of Automatic’s email blast or if
the new hangtags were more effective. Regardless, the uptick in activations did not extend
beyond May. It would have been preferential to have the discounted price listed on the actual
price tag of the device rather than just on the hangtag. This may have been a source of
confusion and the brightly colored discount tags are something that consumers are accustomed
to looking for when they are searching for deals.
4. Greenhouse Gas Impacts
As mentioned in the program overview, MTC implemented the Drive Smart Bay Area program to
help achieve the region’s GHG emissions reduction targets, as required by SB 375. To do that,
the design of the program focused on widespread distribution of smart driving tips and devices,
rather than on creating a program where GHG emissions reductions could be rigorously
analyzed. Therefore, the estimates of program GHG benefits rely on a series of assumptions.
4.1 Methodology
The Drive Smart Bay Area program uses the same GHG emissions reduction methodology as
the Plan Bay Area smart driving strategy. This sections provides an overview of the
methodology and assumptions.
4.1.1 Marketing Campaign
Although the marketing campaign recommended a full suite of smart driving behaviors, the
analysis assumes that residents adopt several core smart driving strategies. For the purposes of
this analysis, the strategies are grouped into the following three buckets:
1. Smoothly accelerate and decelerate, and stay at or below the speed limit.
2. At least once per week, link several trips together that you would normally make
separately, such as going shopping and to the post office.
3. Use trip planning applications that plan your trips to ensure that you use the shortest
routes and avoid traffic.
Drive Smart Bay Area
48
These activities are consistent with responses to the Baseline Climate Initiatives Survey that
MTC conducted in February 2011. As part of the survey, MTC asked Bay Area residents about
the ease of adoption of various emission reducing behaviors.5
In the survey, 55% of participants stated that it would be Very Easy or Easy to practice “smooth
acceleration and deceleration and staying at or below the speed limit.” The U.S. Department of
Energy reports on their website that rapid acceleration and deceleration, and speeding can lead
to fuel economy reductions from 5% on city streets to 33% on freeways.6 This analysis assumes
an average fuel economy reduction of 10% for this behavior.
In MTC’s Baseline Climate Initiatives Survey, 60% of participants stated that it would be Very
Easy or Easy to practice “at least once per week, link several trips together, such as going
shopping and to the post office, which you would normally make separately.” For purposes of
this analysis, that statement is interpreted to mean that due to the smart driving educational
campaign, the driver will link three shopping trips per week (effectively eliminating two trips for a
total reduction of 8.4 miles per week based on MTC’s travel model outputs).
In MTC’s Baseline Climate Initiatives Survey, 57% of participants stated that it would be Very
Easy or Easy to practice “Using trip planning applications that plan your trips to ensure that you
use the shortest routes and avoid traffic.” By avoiding congested routes and eliminating idling in
traffic, Plan Bay Area assumed that drivers can improve their fuel efficiency by 5%, which is on
the low end of research conducted by Facanha.7
The program team understands that not everyone who heard or saw the Drive Smart Bay Area
campaign would automatically adopt smart driving behaviors. The public needs to see or hear
an advertisement multiple times before recognizing the message and being able to practice the
requested behavior change. The team assumes that 12 views are needed before the resident
would internalize the message.8
After a message is internalized, the viewer must decide if this behavior is consistent with their
lifestyle and/or self-image. The team assumes that the same percentage of the population that
stated in the MTC Baseline Climate Initiatives Survey that the given behavior would be “easy” or
“very easy” to adopt could adopt the behavior after internalizing the campaign message. This
pool of residents who internalize the message and find the behavior easy to adopt are the
potential adopters.
Finally, to adopt the desired behavior, a resident must not only view the campaign and find the
behavior easy to adopt but also be motivated to make a change (assuming that they were not
practicing the desired behavior before viewing the campaign). This analysis assumes that 10%
5 MTC conducted a Baseline Climate Initiatives Survey in February 2011. It was a 15-minute random digit dial and cell phone sample of Bay Area driving age residents. It was offered in English, Mandarin, and Spanish and had an overall margin of error of ±3.5% 6 US Department of Energy, Office of Energy Efficiency and Renewable Energy, US Environmental Protection Agency, Model Year 2005 Fuel Efficiency Guide, DOE/EE-0302 7 Cristiano Facanha, “Effects of Congestion and Road Level of Service on Vehicle Fuel Economy”, Transportation Research Board’s 88th Annual Meeting, Paper 09-0268, Washington, D.C. National Academy of Science, 2009. 8 The estimated number of views needed for the target audience to engage with the message varies dramatically by the medium and quality of the creative, but 12 views is seen as relatively standard conversion rate by marketing firms such as RHDG and Wit Media.
Drive Smart Bay Area
49
of people who viewed the campaign and stated that the behavior adoption would be easy
actually adopt the behavior.
For this assessment, the team assumes that the smart driving behaviors will persist for one year
without additional reminders from a continued education campaign.
4.1.2 Automatic Devices
In Plan Bay Area, MTC used a National Renewable Energy Laboratory (NREL) theoretical study
to estimate the benefits of smart driving in-vehicle devices. Based on this study, MTC assumes
a 5.6% emissions reduction potential from the use of in-vehicle smart driving devices. The team
also assumes that residents will continue to use their device for four years.
4.2 Findings
Using the methodology and assumptions outline above, the Drive Smart Bay Area program is
estimated to have reduced GHG emissions by 73 tons over the seven months of the campaign.
Almost all of the emissions reductions can be credited to the educational components of the
campaign with minimal contributions from the in-vehicle devices. This is due to the low success
of device sales and the higher success with creating media impressions with the advertising.
If the campaign had run for a full year with similar tactics and outcomes, it is estimated that the
annual GHG emissions reductions would have been 124 tons.
The achieved levels of GHG emissions reductions falls significantly short of the approximately
1,400 tons of GHG emissions needed from Smart Driving in 2020 and 2035 to achieve the Plan
Bay Area program objectives. However, the Plan Bay Area program includes a total investment
level of $161 million in Smart Driving education and device distribution between 2013 and 2035.
By comparison, the current Drive Smart Bay Area program only ran for approximately seven
months (with online sales only available for three months) with a total cost of $266,000. From a
cost effectiveness perspective, Drive Smart Bay Area has thus far been more cost effective at
reducing GHG emissions than the overall Plan Bay Area smart driving program was projected to
be.
5. Summary of Impacts
In summary, Drive Smart Bay Area achieved the following metrics:
More than 10 million impressions through online and offline media.
22,246 unique page views for the Drive Smart Bay Area website over the course of the
campaign.
1,169 video views for the Drive Smart Bay Area animated video.
Approximately 1 in 10 site visitors viewed the animated video when it was required for
purchase.
125 document downloads of device-related and educational PDFs.
332 page views for the Automatic Program webpage.
Drive Smart Bay Area
50
150 devices sold at a discounted rate as part of the program. An additional 102 devices
were sold at full price in Bay Area Best Buy stores during the campaign.
73 tons of GHG emissions avoided over the 7 month campaign (estimated to be 124
tons if the program had run for one year) with almost all of the emissions reductions
stemming from the educational component of the campaign.
Drive Smart Bay Area
51
V. Recommendations
This section expands upon the lessons learned throughout the program and provides
recommendations for future smart driving programs. The program team encountered multiple
barriers and challenges during program development and implementation, and learned lessons
to address these challenges.
Set Realistic Expectations Selling a product is difficult. While getting hundreds of unique visitors to the program website
was significant and indicates that many drivers learned about fuel-efficient driving habits, only a
fraction of those visitors clicked through to Automatic’s website. During the latter part of the
campaign, the staff at Automatic explained that it can take millions of page views to translate
into hundreds of purchases. In fact, Automatic staff see only about a 4% conversion rate from
website hits to purchases. Without understanding this conversion rate from the beginning, the
Drive Smart Bay Area team began the program with unrealistic expectations about the number
of devices they would be able to distribute under the program.
Timing of Campaign Various factors affect the success of behavior change campaigns, including the timing of the
campaign. Sometimes seasons can affect a campaign’s success (e.g., summer vs. winter) or, in
this instance, the variable price of a necessary commodity (e.g., variable price of fuel). During
the course of the Drive Smart campaign, the price of gas hovered around $3 per gallon (low by
Bay Area standards) with little change in that price throughout the course of the campaign. This
could have impacted the low sales of the Automatic device and the lower viewing of the Drive
Smart video. Higher fuel prices may motivate drivers to look for alternatives to save money,
including using smart driving devices and practices. Thus, implementing a smart driving
campaign may be more successful if it can be timed with a higher price of fuel in the Bay Area.
Determine How to Educate the Public and Promote Devices Selling a new technology product while also educating about smart driving is even more difficult.
Since the general public is not familiar with connected vehicles and tools that plug into the OBD
port of a car, the marketing team had to develop materials to describe the device and educate
the public about the device, instead of focusing on the fuel-efficient driving tips. In general, there
was tension between using small online ads and short radio reads to educate the public about
smart driving strategies and promoting the Automatic device. Future campaigns striving to do
both would be well served by thinking through this tension and determining the resources to be
allocated towards educating the public versus promoting in-vehicle devices.
Incorporate More Direct Marketing from Fulfillment Partners Nearly all marketing of the device discount was implemented by the program team rather than
by Automatic or Best Buy. However, as was seen by the spike in discounted device sales from
Automatic’s Earth Day email blast, direct marketing from Automatic had a much larger impact
on sales than any broad marketing channels the program team used. While implementing
general marketing strategies such as Google ads are still recommended, it is advised to also
Drive Smart Bay Area
52
engage sales partners to use their existing channels to promote this type of program. For
example:
Automatic could market the program on their homepage, advertising the discounted
price for Bay Area residents and directing them to their purchasing options.
Best Buy could mark the discounted price directly on their sales tag to both attract
shoppers’ attention to the sale and to ensure that everyone understood the discounted
price. This also would ensure that Bay Area residents automatically received the
discount.
Automatic, Best Buy, and MTC could all advertise the discounted device price in the Bay
Area. This would ensure that consumers aren’t receiving mixed messages by seeing one
price in an Automatic advertisement and another price in an MTC sponsored
advertisement.
Minimize the Steps to Purchase a Discounted Device Initially, participants had to get to the program website, watch a four-minute animated video, and
then follow a link at the end of the video to reach Automatic’s program landing page before they
could purchase the discounted device. Website analytics showed that many visitors were
getting to the program website but not to the Automatic landing page, which may be due to the
multiple steps that were required for purchasing. This issue was exacerbated when online sales
were not possible and participants had to take the additional steps of downloading a coupon
and then going to a local Best Buy to purchase the device. Ideally, a participant would be
directed by marketing media to a single simple webpage where they could view the driving tips
and product information and purchase the device.
Test Consumer Price Sensitivity Consumers are price sensitive. Early in the campaign development, the Automatic device price
was set at the promotional price of $50, half off the retail price. This price was based on the
desire to ensure consumers still understood the value of the device (which may have been
diminished if the price was too low) and Automatic’s comfort level with offering discounts. It
would be useful to test the effectiveness of lowering the device price to drive up sales. It could
even be helpful to give the devices away for free and survey those who received them to
determine if and how they were being used. This information could be used to determine the
best price point for this type of program, which may be different than the price for the general
consumer market that Automatic pursues.
Consider Alternative Marketing Ideas Throughout the campaign, the program team developed additional marketing and outreach
ideas to address low device sales. These approaches focus on the value add that MTC could
bring to promoting smart driving education and device purchasing. This is distinct from the
original campaign strategy that employed the same marketing channels that Automatic was
already using to promote their device (e.g., Google Ad Words, banner ads). This duplication of
media may have oversaturated existing populations and potentially confused customers due to
inconsistent messaging about the product price. In the future, MTC or other public agencies
Drive Smart Bay Area
53
should focus on connecting with local residents through more on-the-ground or locally engaging
channels. These approaches represent a significant shift from the original efforts. New outreach
ideas include:
Bay Area Drive Smart Week – Declare the first week of summer to be the Bay Area’s
“Drive Smart Week” to generate awareness for driving smart and Automatic using both
digital and physical outreach. Engage with media and influencers with an associated
event such as a ride-and-drive to demonstrate the smart driving device and tips.
Quiz: Are You Really a Smart Driver? – Partner with a local outlet that has national
recognition such as Thrillist SF or SFist, to create a custom quiz that tests each person’s
knowledge of smart driving tactics. The quiz could engage media and consumers’
emotional side with a fun, yet informative way to learn about smart driving tips.
Infographics – Bring the benefits of smart driving with Automatic to life using themed
infographics to be used in outreach to consumers, businesses, and local media.
Examples of themed infographics include:
Consumer Savings Infographic: How quickly does an Automatic pay itself off? How
much money on average can a driver save per year when driving smart?
Lifestyle Infographic: Pull data from Automatic’s database to address pressing
“lifestyle” topics (e.g., on what Bay Area freeways or bridges are drivers being smart
or not?).
Drive Smart with Ayesha & Riley – Take Drive Smart Bay Area’s tips on the road with
the Bay’s most loveable mother-daughter duo, Ayesha and Riley Curry (or other local
celebrities/influencers). Riley could help Ayesha in sharing the smartest ways to drive
efficiently with the help of Automatic. Videos could be shared through Ayesha’s social
channels:
Instagram: 2.7M Followers
Twitter: 289K Followers
Facebook: 98K Likes
Gamification – Keep in touch with program participants by creating a competition for the
most improved or overall highest in-vehicle device drive score. This competition might
both encourage people to buy the device AND get consumers to really internalize the
smart driving tips.
Increase Social Media – Smart driving tips can be summarized in a short statement that
is easy to share via social media. MTC can take advantage of their existing social media
base by regularly tweeting or posting smart driving tips.
Advertise at Park & Rides and Casual Carpool – These Bay Area locations attract
commuters that are generally interested in saving money or reducing their environmental
footprint, making them key targets for smart driving tips and devices.
Use Existing Consumer Bases – When Automatic emailed previous Bay Area
purchasers, it drove the largest jump in sales. Ideally, other networks of potentially
interested consumers could be targeted. For example, MTC could better leverage their
connections with county level Congestion Management Agencies (CMAs), their

Drive Smart Bay Area
54
involvement with the Commuter Benefit Ordinance program, and/or their ride match
database to target more consumers.

Drive Smart Bay Area
55
Appendices
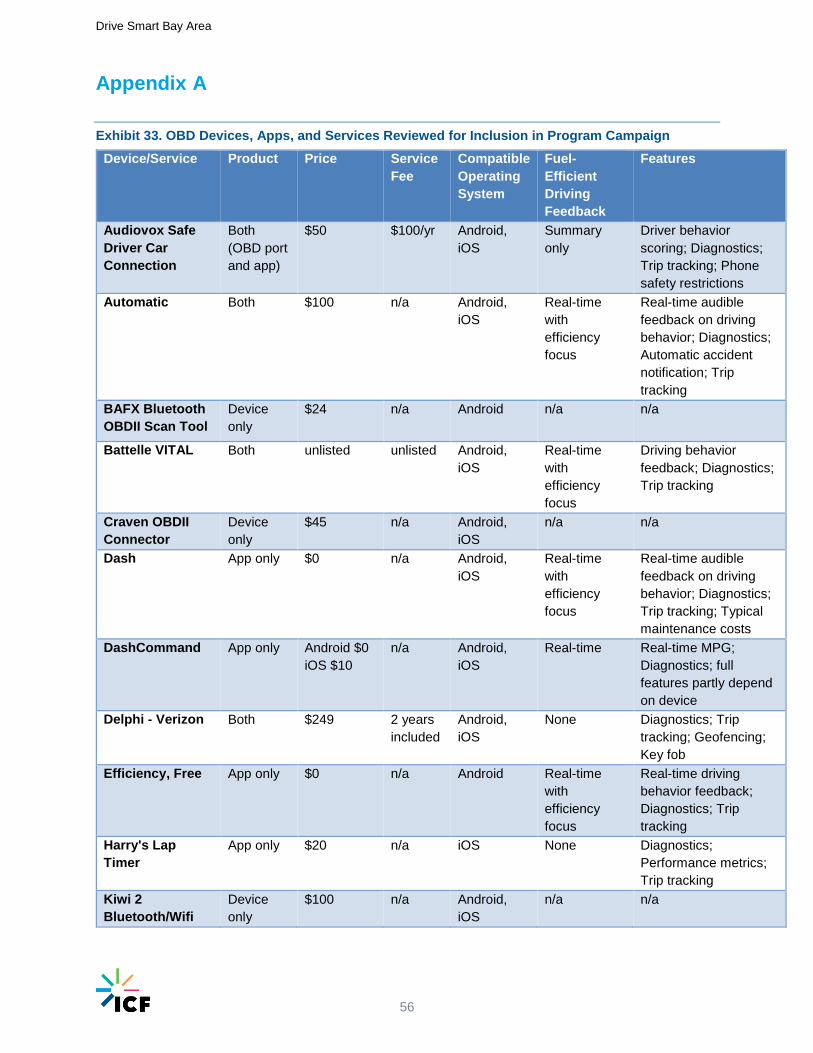
Drive Smart Bay Area
56
Appendix A
Exhibit 33. OBD Devices, Apps, and Services Reviewed for Inclusion in Program Campaign
Device/Service Product Price Service
Fee
Compatible
Operating
System
Fuel-
Efficient
Driving
Feedback
Features
Audiovox Safe
Driver Car
Connection
Both
(OBD port
and app)
$50 $100/yr Android,
iOS
Summary
only
Driver behavior
scoring; Diagnostics;
Trip tracking; Phone
safety restrictions
Automatic Both $100 n/a Android,
iOS
Real-time
with
efficiency
focus
Real-time audible
feedback on driving
behavior; Diagnostics;
Automatic accident
notification; Trip
tracking
BAFX Bluetooth
OBDII Scan Tool
Device
only
$24 n/a Android n/a n/a
Battelle VITAL Both unlisted unlisted Android,
iOS
Real-time
with
efficiency
focus
Driving behavior
feedback; Diagnostics;
Trip tracking
Craven OBDII
Connector
Device
only
$45 n/a Android,
iOS
n/a n/a
Dash App only $0 n/a Android,
iOS
Real-time
with
efficiency
focus
Real-time audible
feedback on driving
behavior; Diagnostics;
Trip tracking; Typical
maintenance costs
DashCommand App only Android $0
iOS $10
n/a Android,
iOS
Real-time Real-time MPG;
Diagnostics; full
features partly depend
on device
Delphi - Verizon Both $249 2 years
included
Android,
iOS
None Diagnostics; Trip
tracking; Geofencing;
Key fob
Efficiency, Free App only $0 n/a Android Real-time
with
efficiency
focus
Real-time driving
behavior feedback;
Diagnostics; Trip
tracking
Harry's Lap
Timer
App only $20 n/a iOS None Diagnostics;
Performance metrics;
Trip tracking
Kiwi 2
Bluetooth/Wifi
Device
only
$100 n/a Android,
iOS
n/a n/a
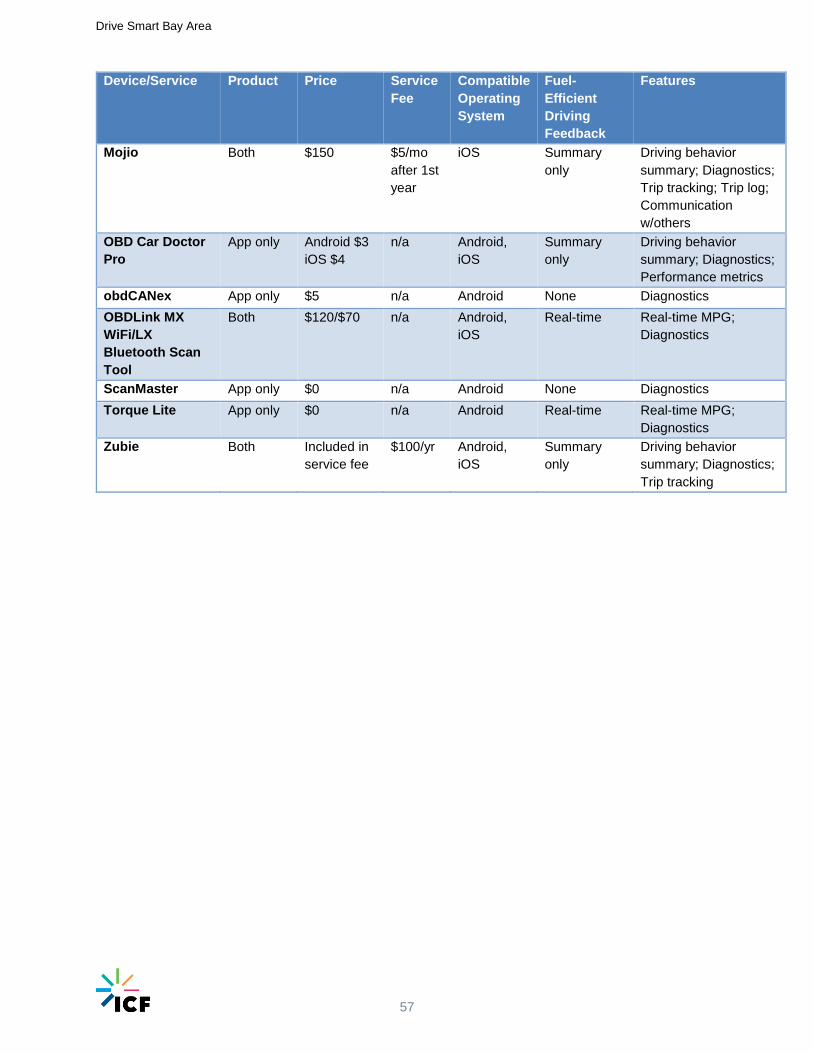
Drive Smart Bay Area
57
Device/Service Product Price Service
Fee
Compatible
Operating
System
Fuel-
Efficient
Driving
Feedback
Features
Mojio Both $150 $5/mo
after 1st
year
iOS Summary
only
Driving behavior
summary; Diagnostics;
Trip tracking; Trip log;
Communication
w/others
OBD Car Doctor
Pro
App only Android $3
iOS $4
n/a Android,
iOS
Summary
only
Driving behavior
summary; Diagnostics;
Performance metrics
obdCANex App only $5 n/a Android None Diagnostics
OBDLink MX
WiFi/LX
Bluetooth Scan
Tool
Both $120/$70 n/a Android,
iOS
Real-time Real-time MPG;
Diagnostics
ScanMaster App only $0 n/a Android None Diagnostics
Torque Lite App only $0 n/a Android Real-time Real-time MPG;
Diagnostics
Zubie Both Included in
service fee
$100/yr Android,
iOS
Summary
only
Driving behavior
summary; Diagnostics;
Trip tracking
Drive Smart Bay Area
58
Appendix B
[insert Marketing Materials PDF in final PDF version]