Embed Size (px)
Citation preview

Drive international growth and leverage innovation leadership
Berenberg and Goldman Sachs
German Corporate Conference
Munich, 19 September 2017

0/77/160
171/195/223
203/217/235
128/128/128
179/179/179
217/217/217
255/153/0
255/204/0
1
Table of Contents
Drive international growth and leverage innovation leadership
I Strategic Roadmap
II Our strategic priorities
III Market environment
IV Financial goals

0/77/160
171/195/223
203/217/235
128/128/128
179/179/179
217/217/217
255/153/0
255/204/0
2
SHW is present in all strategic markets
SHW production network
Sao Paulo Brazil
(SOP 2014)
Toronto Canada (SOP 2018)
Aalen-Wasseralfingen Germany
Bad Schussenried Germany
LongKou China
Kunshan China
(SOP 2016)
Neuhausen ob Eck Germany
Pumps &
Engine
Components
Brake Discs
Timişoara Romania (SOP 2017)
Tuttlingen-Ludwigstal Germany
Hermsdorf Germany
0/77/160
171/195/223
203/217/235
128/128/128
179/179/179
217/217/217
255/153/0
255/204/0
3
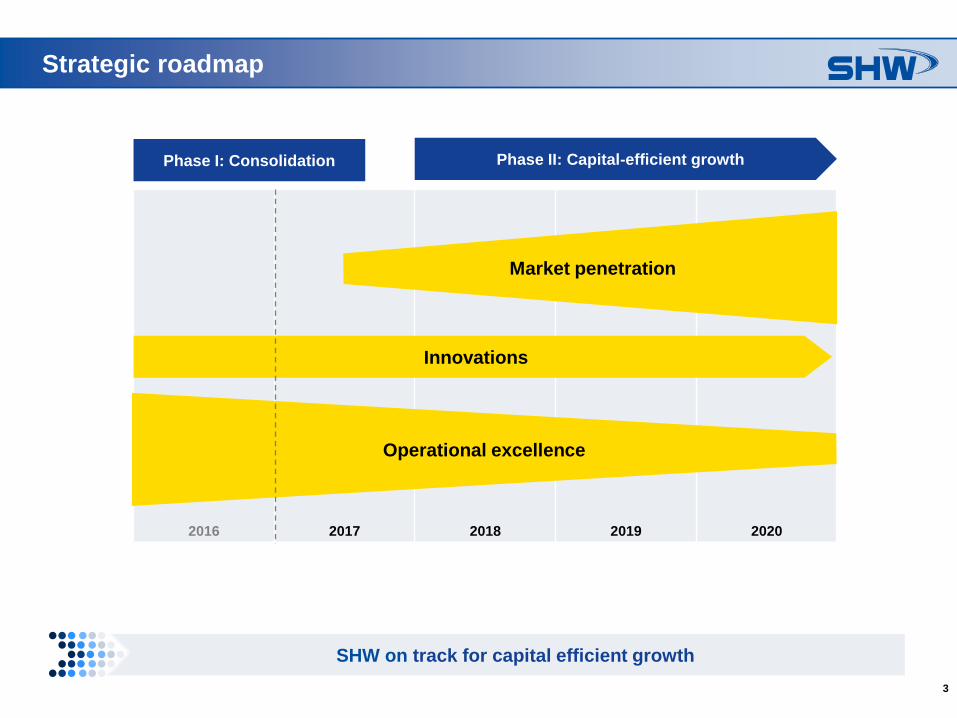
2016 2017 2018 2019
2020
Strategic roadmap
Operational excellence
Innovations
Market penetration
SHW on track for capital efficient growth
Phase I: Consolidation Phase II: Capital-efficient growth

0/77/160
171/195/223
203/217/235
128/128/128
179/179/179
217/217/217
255/153/0
255/204/0
4
China
NAFTA
Europe
2015 2016 2017 2018 2019 2020
Our strategic priorities – Enhance market penetration
SOP for North American OEM in Europe
Re-entry into the market SOP for North American OEM
Enhanced international presence catalyst for future growth
Pumps & Engine Components
Engine Transmission
2 SOPs for North American/Chinese JV
SOP for North American OEM
Brazil
First series contract (SOP 2014)
SOP for North American OEM
SOP for North American OEM in Europe
2 SOPs for Chinese OEM
SOP for European OEM
Preparation of operating business activities
SOP for North American OEM

0/77/160
171/195/223
203/217/235
128/128/128
179/179/179
217/217/217
255/153/0
255/204/0
5
SHW’s prototypes delivered to OEMs and Tier 1 suppliers
Optimised two stroke vane pump:
Weight reduction
Efficiency increase up to 85 per cent
CO2 emission reduction of up to 2g per km (NEDC) Two stroke
vane pump
Our strategic priorities – Leverage innovation leadership
SHW portfolio includes primary transmission oil pumps for vehicles powered by
combustion engines (incl. hybrids)
Scalable electric
power pack
transmission oil
pump
Electrical double stage oil pump combines two pumps in one solution
Offers two pressure stages:
High pressure stage enabling gear and clutch actuation
Low pressure stage serving as coolant and lube oil pump
Improvement in efficiency and weight reduction

0/77/160
171/195/223
203/217/235
128/128/128
179/179/179
217/217/217
255/153/0
255/204/0
6
Our strategic priorities – Leverage innovation leadership
SHW portfolio includes primary transmission oil pumps and composite brake discs
for battery electric vehicles
Electric vehicles require high performance brake discs
Product solution is a composite brake disc
with best comfort characteristics
and high braking performance
Platform strategy allows production synergies for these high end cast discs
Composite brake disc
for high performance
electric cars
Acquisition of know-how in the area of electronic control unit technology
Reinforcement of Tier 1 position
M&A
Electronic control units
Electrically driven
transmission oil
pumps for all
powertrain concepts
Transmission applications becoming increasingly important also in electric
cars
Product solution serves as primary transmission pump for cooling and
lubricating the electric powertrain
Controlled electric pump solution for needs-oriented oil supply
Ongoing dialogue with several manufacturers of e-axles and automatic /
hybrid transmissions

0/77/160
171/195/223
203/217/235
128/128/128
179/179/179
217/217/217
255/153/0
255/204/0
7
Our strategic priorities – Leverage innovation leadership
Acquisition optimises the degree of vertical integration in the electric pumps
business
Technology Expertise by Lust Hybrid Technik GmbH
Thick film CAD design
screen printing technology
laser trimming of printed
resistors
SMT down to 0201, CSP, BGA -
components
THT
ceramics, PCB and flex-rigid
printed board
Chip on Board screen printing / dispense bare
die attach
Au / Al wire bonding
heavy wire bonding & glob top
Process- und Final
inspection electrical test
traceability
SPC- & ERP recording
Services:
development, industrialization, production and
qualification of complex, miniaturized electronics
and micro-systems technology
Automotive
Insourcing of production,
logistics and quality processes
Industry
Development and
production of small and
high volume series
Medical & other
Product design
according to customer
requirements
Since 1992 - 90 employees - Sales: ~ € 10 million

0/77/160
171/195/223
203/217/235
128/128/128
179/179/179
217/217/217
255/153/0
255/204/0
8
The megatrends weight reduction, corrosion resistance and reduction of brake dust
are key drivers for the Brake Discs division
Our strategic priorities – Leverage innovation leadership
Standard
Casted ventilated
disc
Weight reduction, improved comfort + performance
High end casted
wave disc
Weight reduction
> 2 kg / disc
SHW Patent
Weight reduction
about 2 kg / disc
> SHW is innovation leader for lightweight brake disc in the automotive sector
> Composite brake discs with aluminium pot significantly contribute to weight reduction
> Reduction of unsprung masses improves driving performance

0/77/160
171/195/223
203/217/235
128/128/128
179/179/179
217/217/217
255/153/0
255/204/0
9
Our market environment – increasing demand for mobility solutions
SHW present in all strategic markets to benefit from increasing production volumes
Light vehicle production by region (m units)
+2.5%
2025
33.7
2020
30.2
2016
27.1
23.5
2020
22.7
2016
21.5
+1.0%
2025
China
South America
Europe
North America
+4.9%
2025
4.2
2020
3.3
2016
2.7
+0.5%
2025
18.7
2020
18.7
2016
17.8
Source: IHS - January 2017
Global light vehicle production
expected to increase on
average by 1.9 per cent to 110
m units until 2025
China: main growth driver
Europe: slight growth mainly
driven by recovery in Russia
North America: stable on
current level
South America: steady recovery
after severe market slump
0/77/160
171/195/223
203/217/235
128/128/128
179/179/179
217/217/217
255/153/0
255/204/0
10
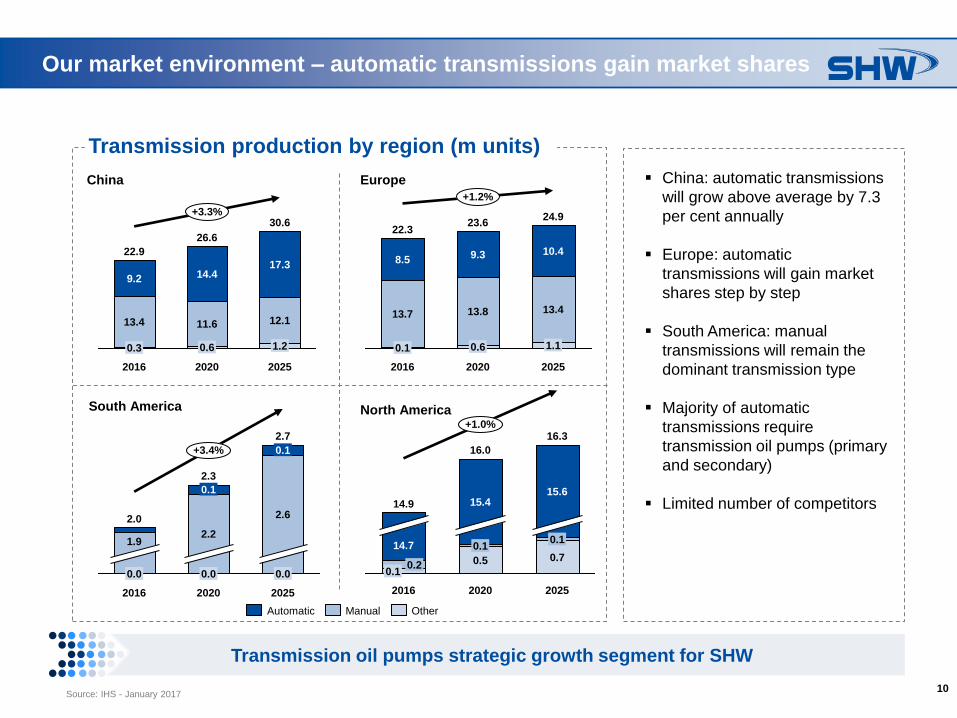
Our market environment – automatic transmissions gain market shares
Transmission oil pumps strategic growth segment for SHW
Transmission production by region (m units)
30.6
1.2
12.1
17.3
2020
26.6
0.6
11.6
14.4
2016
22.9
0.3
13.4
9.2
+3.3%
2025
0.6
13.8
9.3
2016
22.3
0.1
13.7
8.5
+1.2%
2025
24.9
1.1
13.4
10.4
2020
23.6
China
South America
Europe
North America
+3.4%
2025
2.7
0.0
2.6
0.1
2020
2.3
0.0
2.2
0.1
2016
2.0
0.0
1.9
+1.0%
2025
16.3
0.7
0.1
15.6
2020
16.0
0.5
0.1
15.4
2016
14.9
0.1 0.2
14.7
Manual Automatic Other
China: automatic transmissions
will grow above average by 7.3
per cent annually
Europe: automatic
transmissions will gain market
shares step by step
South America: manual
transmissions will remain the
dominant transmission type
Majority of automatic
transmissions require
transmission oil pumps (primary
and secondary)
Limited number of competitors
Source: IHS - January 2017

0/77/160
171/195/223
203/217/235
128/128/128
179/179/179
217/217/217
255/153/0
255/204/0
11
Our market environment – combustion engines dominate until 2025
Engine production by region (m units)
+2.7%
2025
34.2
1.4
30.4
2.4
2020
30.5
0.7
27.7
2.1
2016
27.0
24.9
1.8
11.2
+0.7%
2025
24.8
0.9
13.8
10.1
2020
24.3
0.5
13.0
10.9
2016
23.2
11.9
China
South America
Europe
North America
+5.5%
2025
3.4
3.2
2020
2.5
2.3
2016
2.1
2.0
+1.2%
2025
17.9
16.5
0.6
2020
17.3
16.0
0.7
2016
16.1
15.4
0.5
Other Electricity Gasoline (incl. hybrids) Diesel (incl. hybrids)
China: gasoline engines will
remain dominant engine type
Europe: gasoline engines will
gain market shares
North America: gasoline
engines will remain by far the
dominant engine type
Increasing hybridisation results
in a growing number of pumps
per car
Source: IHS – January 2017

0/77/160
171/195/223
203/217/235
128/128/128
179/179/179
217/217/217
255/153/0
255/204/0
12
Financial goals – Sales and EBITDA
Phase I: Consolidation Phase II: Capital-efficient growth
Sales
(€m)
EBITDA
(%)
650
300
550
500
600
450
463
406 400 – 420
560 – 590
620 – 650
2019 2020 2015 2016
9.4%
2018
10.7%
2017
10.0% – 11.0%
11.0% – 12.0%
11.5% – 12.5% 12.0% – 13.0%
470 – 495
SHW Europe SHW International
*Only for illustrative purposes
*

0/77/160
171/195/223
203/217/235
128/128/128
179/179/179
217/217/217
255/153/0
255/204/0
13
Financial goals – Investments and depreciation
Phase I: Consolidation Phase II: Capital-efficient growth
Investments
(€m)
Depreciation
(€m)
2524
29 – 32 27 – 30
29 – 32 33 – 36
2522
2020 2019 2018 2016 2017 2015
24 – 26 25 – 27 28 – 30 29 – 31

0/77/160
171/195/223
203/217/235
128/128/128
179/179/179
217/217/217
255/153/0
255/204/0
14
Financial goals – Miscellaneous
Capital structure
Sustainable and strong capital structure with a balance sheet equity ratio of at least 30 per cent to 40 per cent
Debt ratio Leverage potential to increase net debt / adj. EBITDA ratio to a maximum of 2.5
Liquidity High flexibility in terms of financial and strategic headroom: syndicated loan facilities plus additional baskets
Dividend policy
Results-oriented dividend policy with a pay-out ratio of 30 per cent to 40 per cent of the net income for the year taking into account the financing requirements of SHW

0/77/160
171/195/223
203/217/235
128/128/128
179/179/179
217/217/217
255/153/0
255/204/0
15
Your key takeaways
Pumps & Engine Components business segment well on track
Brake Discs business segment temporarily below target level
We reaffirm our full year guidance of Group sales of € 400m to € 420m and an
EBITDA-margin of 10 per cent to 11 per cent
Sound balance sheet safeguards strategic flexibility

0/77/160
171/195/223
203/217/235
128/128/128
179/179/179
217/217/217
255/153/0
255/204/0
16
Financial Calendar 2017
Dates Events
03.05.2017 Financial Report – January to March 2017
09.05.2017 Annual General Meeting – Heidenheim
28.07.2017 Financial Report – January to June 2017
30.08.2017 Commerzbank – Sector Conference, Frankfurt am Main
07.09.2017 Bankhaus Lampe – Small Cap Conference, Dusseldorf
13.09.2017 Deutsche Bank – IAA Cars 2017 Conference, Frankfurt am Main
19.09.2017 Berenberg and Goldman Sachs – German Corporate Conference, Munich
26.10.2017 Financial Report – January to September 2017
15.01.2018 Kepler Cheuvreux – German Corporate Conference, Frankfurt am Main
30.04.2018 Bankhaus Lampe – German Corporate Conference, Baden-Baden

0/77/160
171/195/223
203/217/235
128/128/128
179/179/179
217/217/217
255/153/0
255/204/0
17
Michael Schickling Head of Investor Relations & Corporate Communications
Telephone: +49 (0) 7361 502-462
E-Mail: [email protected]
Sandra Scherer Junior Manager Investor Relations & Corporate Communications
Telephone: +49 (0) 7361 502-469
E-Mail: [email protected]
Contact Investor Relations

0/77/160
171/195/223
203/217/235
128/128/128
179/179/179
217/217/217
255/153/0
255/204/0
18
Backup

0/77/160
171/195/223
203/217/235
128/128/128
179/179/179
217/217/217
255/153/0
255/204/0
19
Stable market environment in H1 2017
SHW well positioned to benefit from structural market changes and strong
demand for mobility solutions
Light vehicle production: + 2.6
per cent to 47.2 million units
with marked growth rate
differences
Gasoline engines gain further
market share; diesel engines
stable
Above-average growth rates for
automatic transmissions –
global production increased by
6.7 per cent to 27.7 million units
Light Vehicle Production (< 6 t) (m units)
Source: IHS, July 2017
Global Engine Production (m units)
Global Transmission Production (m units)
202.7 215.3
SHW Group Sales (€m)
9.8
Gasoline
37.1
Diesel
9.8
35.9
19.8
Automatic
27.7 26.0
Manual
19.1
1.5
South
America
1.3
North
America
9.0
China
12.8 12.5
9.1
Europe
11.6 11.4
H1 2016
H1 2017
0/77/160
171/195/223
203/217/235
128/128/128
179/179/179
217/217/217
255/153/0
255/204/0
20
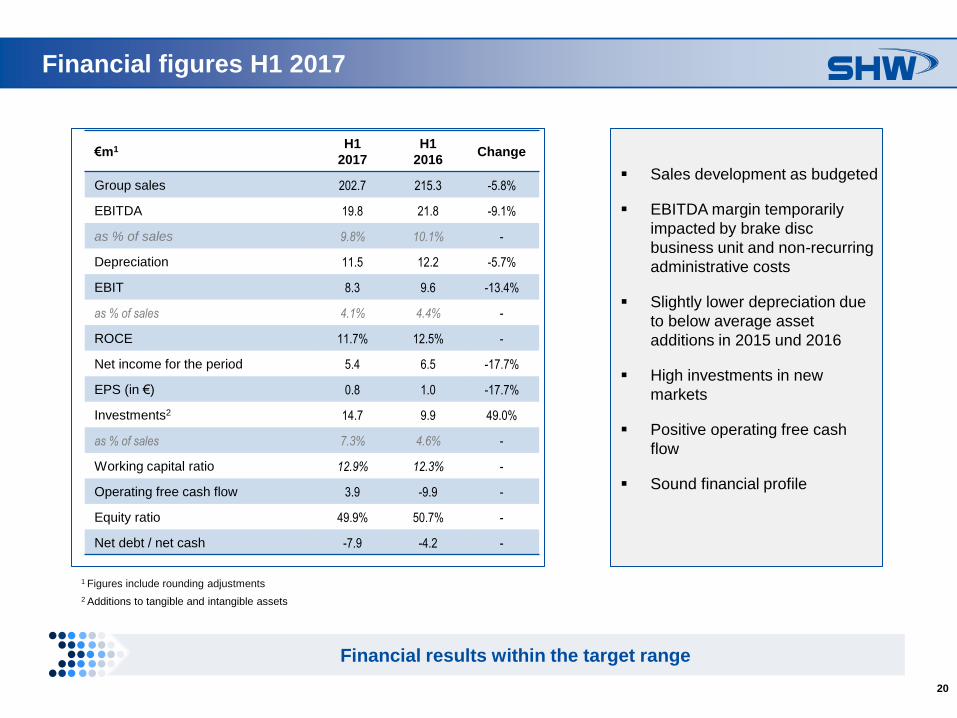
Sales development as budgeted
EBITDA margin temporarily
impacted by brake disc
business unit and non-recurring
administrative costs
Slightly lower depreciation due
to below average asset
additions in 2015 und 2016
High investments in new
markets
Positive operating free cash
flow
Sound financial profile
Financial figures H1 2017
Financial results within the target range
2 Additions to tangible and intangible assets
1 Figures include rounding adjustments
€m1 H1
2017
H1
2016 Change
Group sales 202.7 215.3 -5.8%
EBITDA 19.8 21.8 -9.1%
as % of sales 9.8% 10.1% -
Depreciation 11.5 12.2 -5.7%
EBIT 8.3 9.6 -13.4%
as % of sales 4.1% 4.4% -
ROCE 11.7% 12.5% -
Net income for the period 5.4 6.5 -17.7%
EPS (in €) 0.8 1.0 -17.7%
Investments2 14.7 9.9 49.0%
as % of sales 7.3% 4.6% -
Working capital ratio 12.9% 12.3% -
Operating free cash flow 3.9 -9.9 -
Equity ratio 49.9% 50.7% -
Net debt / net cash -7.9 -4.2 -

0/77/160
171/195/223
203/217/235
128/128/128
179/179/179
217/217/217
255/153/0
255/204/0
21
Group
Sales by quarter (€m)
EBITDA (€m)
Sales (€m)
215.3
-5.8%
H1 2017
202.7
H1 2016
98.4 93.6
Q3
97.0
Q2
108.7
Q1
104.3 106.6
Q4
-9.1%
H1 2017
19.8
H1 2016
21.8
Group sales influenced by:
the transition to the second
generation of an electrically
driven transmission oil pump
for the start-stop function
(Pumps and Engine
Components)
higher unit sales
(Brake Discs)
EBITDA below the previous
year’s level mainly triggered
by:
a lower earnings contribution
of the Brake Discs business
segment
non-recurring administrative
costs
EBITDA by quarter (€m)
Q4
9.6 11.1
Q3
10.7
Q2
11.0
Q1
10.1 10.8
10.1%
2017
2016
9.7% 10.1% 11.1% 11.8% 9.8%

0/77/160
171/195/223
203/217/235
128/128/128
179/179/179
217/217/217
255/153/0
255/204/0
22
Customer sales
International growth and diversified product range will lead to a
more balanced customer structure
Decline in sales mainly relates to
the transition to the second
generation of an electrically
driven transmission oil pump for
the start-stop function
Dependency on the VW group
expected to decrease by
internationalisation and
diversification towards
transmission oil pumps from
2018 onwards
Other 33.2
38.3
Brembo 4.4 4.3
Hilite 5.5 5.2
Ford 8.6
6.8
Thyssen
Krupp 9.0 9.9
BMW 19.6 20.3
Daimler 21.4
33.1
VW 59.1
56.5
Audi 15.3
Volvo Cars 14.8
17.4
18.5
Porsche 9.1
7.3
H1 2017
H1 2016

0/77/160
171/195/223
203/217/235
128/128/128
179/179/179
217/217/217
255/153/0
255/204/0
23
Business Segment: Pumps and Engine Components
Sales decline as budgeted by
8.9 per cent to € 155.4 million
Passenger Cars: -13 per cent
to € 123.1 million
Industry: +14 per cent to
€ 16.6 million
Powder Metallurgy: +10 per
cent € 15.6 million
EBITDA margin improved to
11.5 per cent due to positive
volume and product mix effects
and productivity improvements
Earnings development of
foreign subsidiaries overall
according to plan
Sales by quarter (€m)
EBITDA (€m)
Sales (€m)
Q4
85.9 80.6
Q1
84.7 74.7
Q2
74.8
Q3
72.1
H1 2016
170.6 155.4
H1 2017
-8.9%
EBITDA by quarter (€m)
9.5 9.4
Q1
9.2
Q2
8.4
Q3
10.3
Q4
8.5
11.1% 11.7% 10.9% 11.2% 14.3%
2016
2017
17.9 18.8
H1 2016 H1 2017
-4.7%
11.3%

0/77/160
171/195/223
203/217/235
128/128/128
179/179/179
217/217/217
255/153/0
255/204/0
24
Business Segment: Brake Discs
Temporary negative effects on EBITDA noticeably diminished in Q2
Total number of brake discs sold:
+ 8.4 per cent
Positive volume and product mix
effects as well as productivity
improvements contrasted with
higher purchase costs for coke
and the contractual delay in
adjusting material surcharges
Q4
21.5
Q3
22.1
Q2
24.0
Q1
23.7 20.7
23.7
6.0%
H1 2017
47.3
H1 2016
44.7
1.8
Q4
1.3
Q3
2.8
Q2
2.2
Q1
1.3 1.6
7.7% 5.5% 9.0% 12.7%
2017
2016
Sales by quarter (€m) Sales (€m)
EBITDA (€m) EBITDA by quarter (€m)
6.1%
H1 2016
3.8 3.1
-16.9%
H1 2017
7.7%

0/77/160
171/195/223
203/217/235
128/128/128
179/179/179
217/217/217
255/153/0
255/204/0
25
Net working capital ratio
Net working capital ratio target in a range of 11 per cent to 12 per cent
Net working capital reduced to
€ 50.6 million
Higher inventories due to:
a variety of projects in
progress (unfinished
products)
Lower trade receivables mainly
due to:
lower sales (adjusted figure:
-11.3 per cent)
Higher trade payables due to:
comparatively higher asset
additions
14.1%
12.0%
Q1/16 Q4/16
13.1%
Q3/15
12.3%
Q4/15
12.2% 12.9%
Q3/16 Q2/16
10.6%
Q1/ 17
11.7%
Q2/17
7.0%
Q2/15
11.0% 10.4%
Development of net working capital ratio
Medium-term target 11 per cent to 12 per cent

0/77/160
171/195/223
203/217/235
128/128/128
179/179/179
217/217/217
255/153/0
255/204/0
26
Investments and depreciation
Investments in property, plant and
equipment and intangible assets
at a total of € 14.7 million
Pumps & Engine Components:
mainly for new assembly lines in
Germany and China (total: €
11.6m)
Brake Discs: mainly for second
automated aluminium casting line
and machining lines (total: €
2.7m)
Slightly lower depreciation due to
below average asset additions in
2015 und 2016
Investments by quarter (€m)
Depreciation (€m) Depreciation by quarter (€m)
Investments (€m)
Q4
8.0
Q3
6.8
Q2
5.7 4.9
Q1
9.0
5.0
H1 2017
11.5
H1 2016
12.2
-5.7%
6.2
Q2
5.8
Q3
6.1 6.3
Q4 Q1
5.7 5.9
14.7
H1 2016 H1 2017
+49.0%
9.9
5.6%
4.7%
2017
2016
5.4% 5.8% 6.3%
4.5% 7.0% 8.4% 8.6%
6.7% 5.9%
5.8%
High level of investments in new markets

0/77/160
171/195/223
203/217/235
128/128/128
179/179/179
217/217/217
255/153/0
255/204/0
27
Operating cash flow significantly
improved mainly due to a
significant lower increase in
working capital
Total free cash flow influenced
by payment of second purchase
price instalment for joint venture
SHW Longji Brake Discs
Cash Flow
Strong focus on operating free cash flow
1 Figures include rounding adjustments
€m1 Q2
2017
Q2
2016
H1
2017
H1
2016
Cash flow from operating activities 7.9 1.4 18.5 -0.3
Cash flow from investing activities
- tangible and intangible assets -5.7 -4.7 -14.5 -9.7
Operating free cash flow 2.1 -3.3 3.9 -10.0
Cash flow from investing activities
- financial assets 0.0 0.0 -6.8 0.0
Total free cash flow 2.1 -3.3 -2.9 -10.0
Other (esp. dividend payment) -6.7 -6.5 -6.7 -6.6
Change in net cash -4.5 -9.8 -9.6 -16.5

0/77/160
171/195/223
203/217/235
128/128/128
179/179/179
217/217/217
255/153/0
255/204/0
28
Non-current assets increased
due to investments in tangible
assets
Current assets nearly
unchanged
Equity ratio at 49.9 per cent due
to above average increase of
balance sheet total
Net debt still significantly
below industry average
Sound financial profile
Sound balance sheet safeguards strategic flexibility
28.0
118.7
229.5
73.5
4.8 8.8
26.1
116.3
30.06.2016 30.06.17
237.8
72.5
10.6 8.0
Liabilities Assets
30.06.2016
229.5
1.2
95.2
133.0
30.06.2017
237.8
2.7
95.9
139.2
Cash
Current assets
Non-current assets
Other long-term liabilities
Bank debt
Other short-term liabilities Pensions
Equity

0/77/160
171/195/223
203/217/235
128/128/128
179/179/179
217/217/217
255/153/0
255/204/0
29
Disclaimer
No offer or investment recommendation
This document, which has been issued by SHW AG (the “Company” or “SHW”), does not constitute an offer to sell, or the solicitation of an offer to subscribe for or
buy, any shares in the Company, nor shall it or any part of it nor the fact of its distribution form the basis of, or be relied on in connection with, any contract or
investment decision in relation thereto.
The contents of this presentation are may not be reproduced, redistributed or passed on, directly or indirectly, to any other person or published, in whole or in part,
for any purpose. Neither the Company nor any other party is under any duty to update or inform you of any changes to such information. In particular, it should be
noted that financial information relating to the Company contained in this document has not been audited and in some cases is based on management information
and estimates.
This material is given in conjunction with an oral presentation and should not be taken out of context.
Certain market data and financial and other figures (including percentages) in this document were rounded in accordance with commercial principles. Figures
rounded may not in all cases add up to the stated totals or the statements made in the underlying sources. For the calculation of percentages used in the text, the
actual figures, rather than the commercially rounded figures, were used. Accordingly, in some cases, the percentages provided in the text may deviate from
percentages based on rounded figures.
Future Oriented Statements
Certain statements in this presentation are forward-looking statements. By their nature, forward-looking statements involve a number of risks, uncertainties and
assumptions that could cause actual results or events to differ materially from those expressed or implied by the forward‐looking statements. These risks,
uncertainties and assumptions could adversely affect the outcome and financial consequences of the plans and events described herein.
No obligation to update the information
The Company does not undertake any obligation to update or revise any forward-looking statements, whether as a result of new information, future events or
otherwise, except as otherwise required by applicable laws and regulations. You should not place undue reliance on forward-looking statements, which speak as
only of the date of this presentation. Statements contained in this presentation regarding past trends or events should not be taken as a representation that such
trends or events will continue in the future.