Embed Size (px)
Citation preview
DisclaimerStatements in this annual report concerning current plans, forecasts, strategies, beliefs, and other forward-looking information
related to Nippon Paper Group, Inc. and companies comprising its corporate group, other than those of historical fact, are forecasts of future business performance based on the judgments of management at Nippon Paper Group, Inc. and group companies in light of currently available information. Accordingly, please refrain from making investment decisions based solely on forecasts of business performance in this annual report. Actual business performance may differ significantly from these forecasts due to changes in a variety of factors.
Publisher Nippon Paper Group, Inc. http://www.np-g.com/e/Produced by No Limits, Inc.
©Nippon Paper Group, Inc. 2009This annual report may not be reproduced or copied in any form or manner whatsoever without the prior written consent of the copyright holder or as permitted by law.
Drivefor
Sustainable Growth
ANNUAL REPORT 2009Nippon Paper Group, Inc.
1
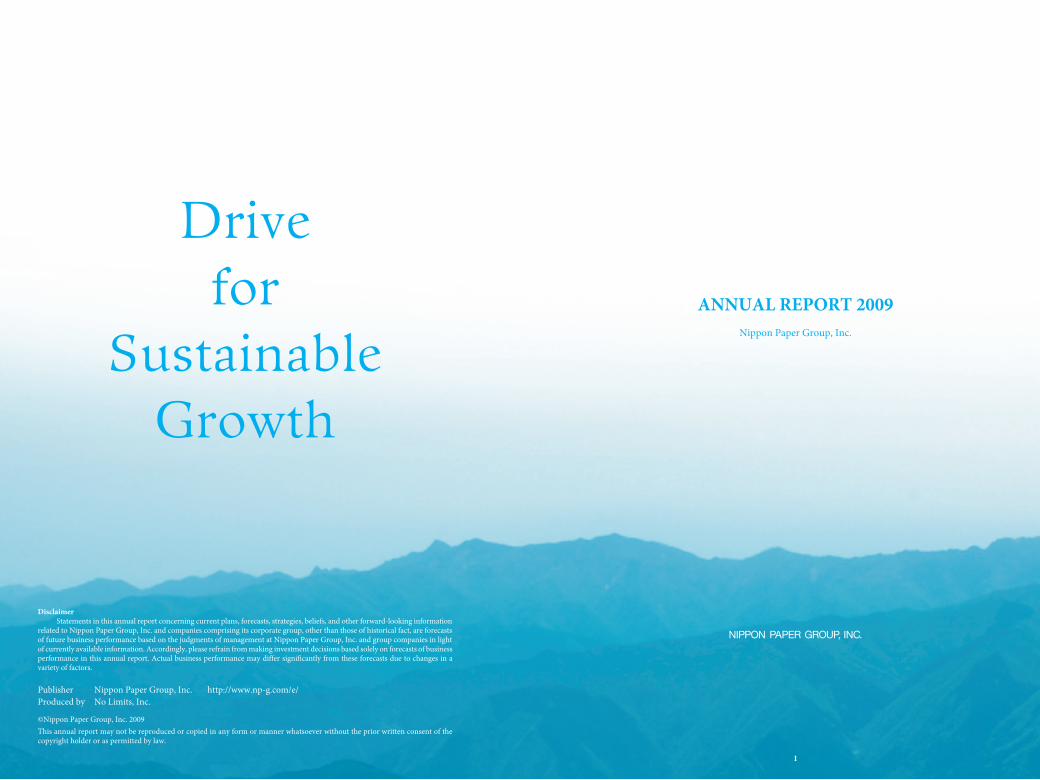
Be one of the top 5 pulp and paper groupsworldwide.
Group Vision
2 0 1 5
Goals of Nippon Paper Group for 2015
32
Consolidated net sales
Consolidated operating income
Consolidated operating income to net sales
Business portfolio
Market capitalization
Operating cash flow
¥1 trillion
¥150 billion
Domestic business to account for 70%
and overseas business for 30%
Pulp and paper business to account for 70%
and non-pulp and paper business for 30%
Expand business in
three major markets of Asia, North America, and Europe
¥1.5 — ¥2.0 trillion
Stable domestic operating income of
¥100 billion, plus operating income from overseas business
8%–10%
24568
10121416182022242628363738404142444648505860
112120
ContentsNippon Paper Group, Inc. Annual Report 2009
Group Vision 2015ContentsAt a Glance Consolidated Financial Highlights Pulp and Paper Industry Overview Paper Demand and Economic Cycle Profile Net Sales and Operating Income by Business Segment Pulp and Paper Segment Paper-Related Segment Housing and Construction Materials Segment Other SegmentMessage from the President To Our Shareholders Interview with the PresidentFeature 2009 Restructuring Production Australian Paper Acquisition News ReleasesMajor Subsidiary Profiles Nippon Paper Industries Co., Ltd. Nippon Daishowa Paperboard Co., Ltd. Nippon Paper Crecia Co., Ltd. Nippon Paper Papylia Co., Ltd.Corporate Governance and CSRBoard of Directors and Corporate AuditorsFinancial SectionGlobal NetworkInvestor Information
6 Consolidated Financial Highlights 8 Pulp and Paper Industry Overview 10 Paper Demand and Economic Cycle 12 Profile 14 Net Sales and Operating Income by Business Segment 16 Pulp and Paper Segment 18 Paper-Related Segment 20 Housing and Construction Materials Segment 22 Other Segment
At a Glance
54
30,000
20,000
10,000
0
-10,000
-20,000
-30,000
30,000
20,000
10,000
0
Net (loss) income and net (loss) income per share Interest-bearing debt and debt/equity ratio
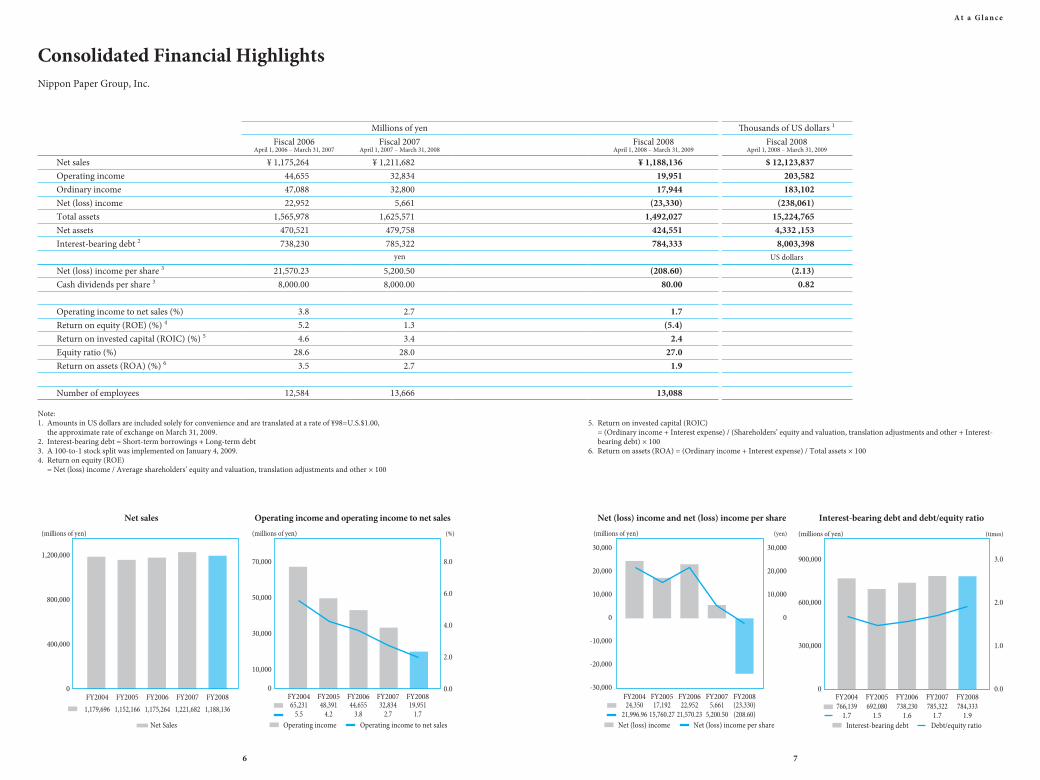
Millions of yen Thousands of US dollars 1
Fiscal 2006April 1, 2006 – March 31, 2007
Fiscal 2007April 1, 2007 – March 31, 2008
Fiscal 2008April 1, 2008 – March 31, 2009
Fiscal 2008April 1, 2008 – March 31, 2009
Net salesOperating incomeOrdinary incomeNet (loss) incomeTotal assetsNet assetsInterest-bearing debt 2
US dollars
Net (loss) income per share 3
Cash dividends per share 3
Operating income to net sales (%)Return on equity (ROE) (%) 4
Return on invested capital (ROIC) (%) 5
Equity ratio (%)Return on assets (ROA) (%) 6
Number of employees
Note: 1. Amounts in US dollars are included solely for convenience and are translated at a rate of ¥98=U.S.$1.00, the approximate rate of exchange on March 31, 2009.2. Interest-bearing debt = Short-term borrowings + Long-term debt3. A 100-to-1 stock split was implemented on January 4, 2009.4. Return on equity (ROE) = Net (loss) income / Average shareholders’ equity and valuation, translation adjustments and other × 100
5. Return on invested capital (ROIC) = (Ordinary income + Interest expense) / (Shareholders’ equity and valuation, translation adjustments and other + Interest-
bearing debt) × 1006. Return on assets (ROA) = (Ordinary income + Interest expense) / Total assets × 100
Net sales Operating income and operating income to net sales
Nippon Paper Group, Inc.
Consolidated Financial Highlights
¥ 1,211,68232,83432,800
5,6611,625,571
479,758785,322
yen
5,200.508,000.00
2.71.33.4
28.02.7
13,666
¥ 1,188,13619,95117,944
(23,330)1,492,027
424,551784,333
(208.60)80.00
1.7(5.4)
2.427.0
1.9
13,088
$ 12,123,837203,582183,102
(238,061)15,224,7654,332 ,1538,003,398
(2.13)0.82
¥ 1,175,264 44,655 47,088 22,952
1,565,978 470,521 738,230
21,570.23 8,000.00
3.8 5.2 4.6
28.6 3.5
12,584
6 7
A t a G l a n c e
A t a G l a n c e
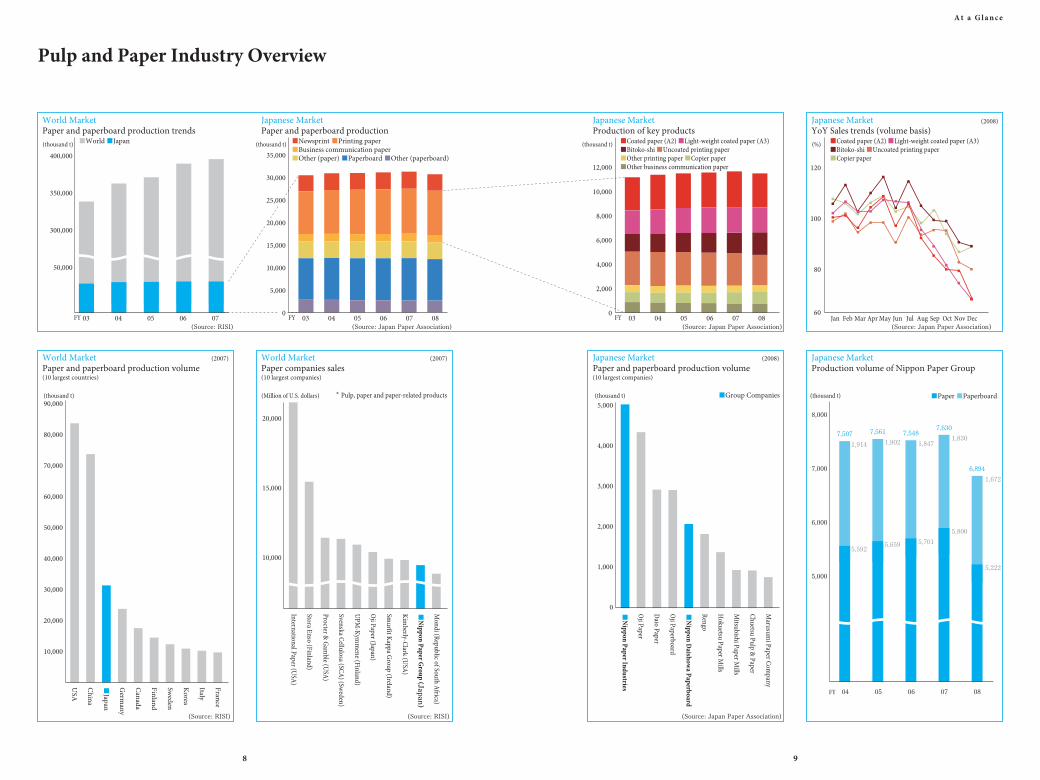
Pulp and Paper Industry Overview
8 9
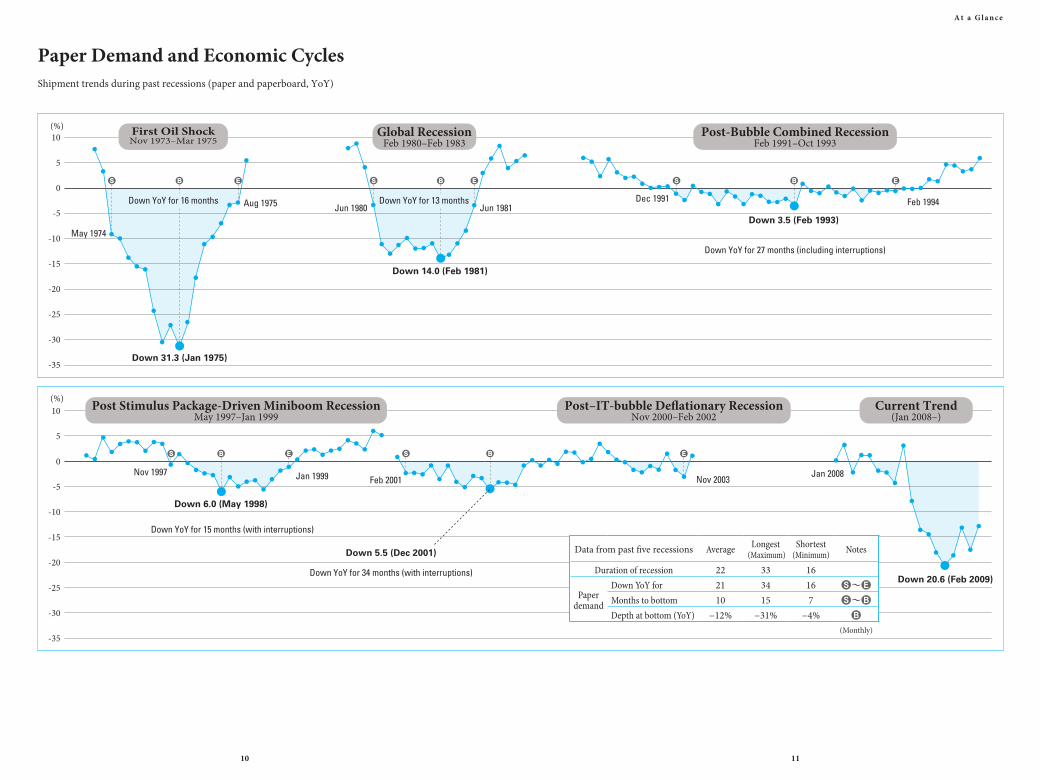
Data from past five recessions Average Longest (Maximum)
Shortest (Minimum) Notes
Duration of recession 22 33 16
Paper demand
Down YoY for 21 34 16 S〜EMonths to bottom 10 15 7 S〜BDepth at bottom (YoY) −12% −31% −4% B
(Monthly)
Shipment trends during past recessions (paper and paperboard, YoY)
Paper Demand and Economic Cycles
10 11
A t a G l a n c e
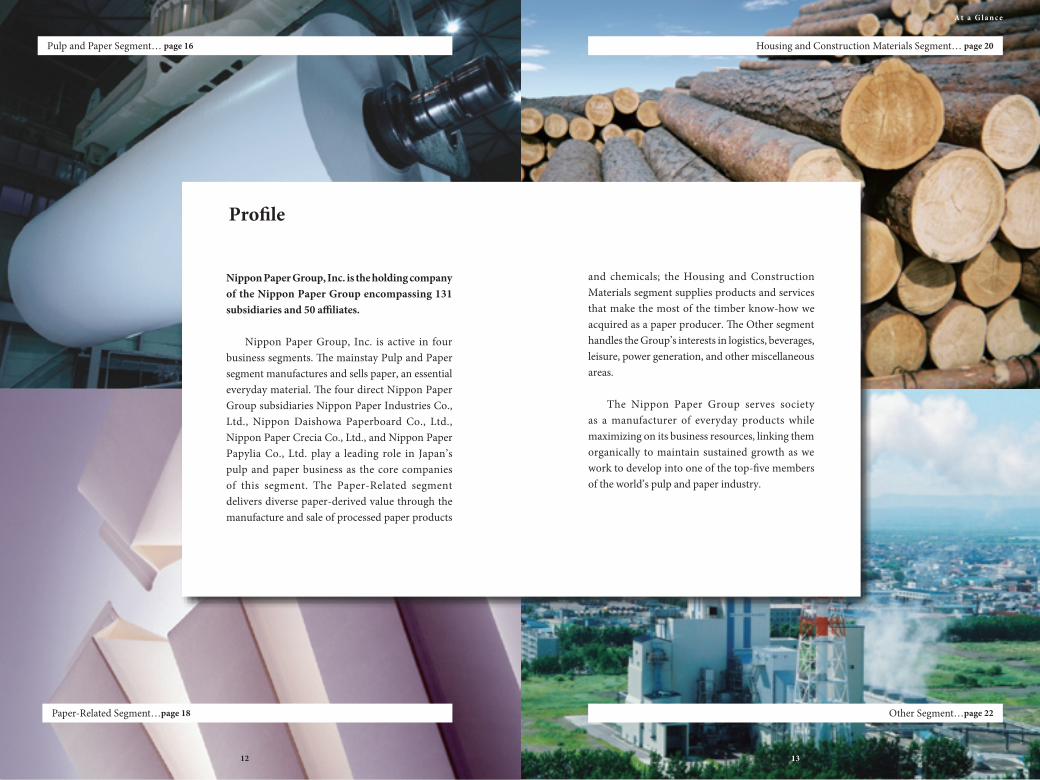
Nippon Paper Group, Inc. is the holding company of the Nippon Paper Group encompassing 131 subsidiaries and 50 affiliates.
Nippon Paper Group, Inc. is active in four business segments. The mainstay Pulp and Paper segment manufactures and sells paper, an essential everyday material. The four direct Nippon Paper Group subsidiaries Nippon Paper Industries Co., Ltd., Nippon Daishowa Paperboard Co., Ltd., Nippon Paper Crecia Co., Ltd., and Nippon Paper Papylia Co., Ltd. play a leading role in Japan’s pulp and paper business as the core companies of this segment. The Paper-Related segment delivers diverse paper-derived value through the manufacture and sale of processed paper products
and chemicals; the Housing and Construction Materials segment supplies products and services that make the most of the timber know-how we acquired as a paper producer. The Other segment handles the Group’s interests in logistics, beverages, leisure, power generation, and other miscellaneous areas.
The Nippon Paper Group serves society as a manufacturer of everyday products while maximizing on its business resources, linking them organically to maintain sustained growth as we work to develop into one of the top-five members of the world’s pulp and paper industry.
Housing and Construction Materials Segment… page 20
Other Segment…page 22
Pulp and Paper Segment… page 16
Paper-Related Segment…page 18
Profile
12 13
A t a G l a n c e
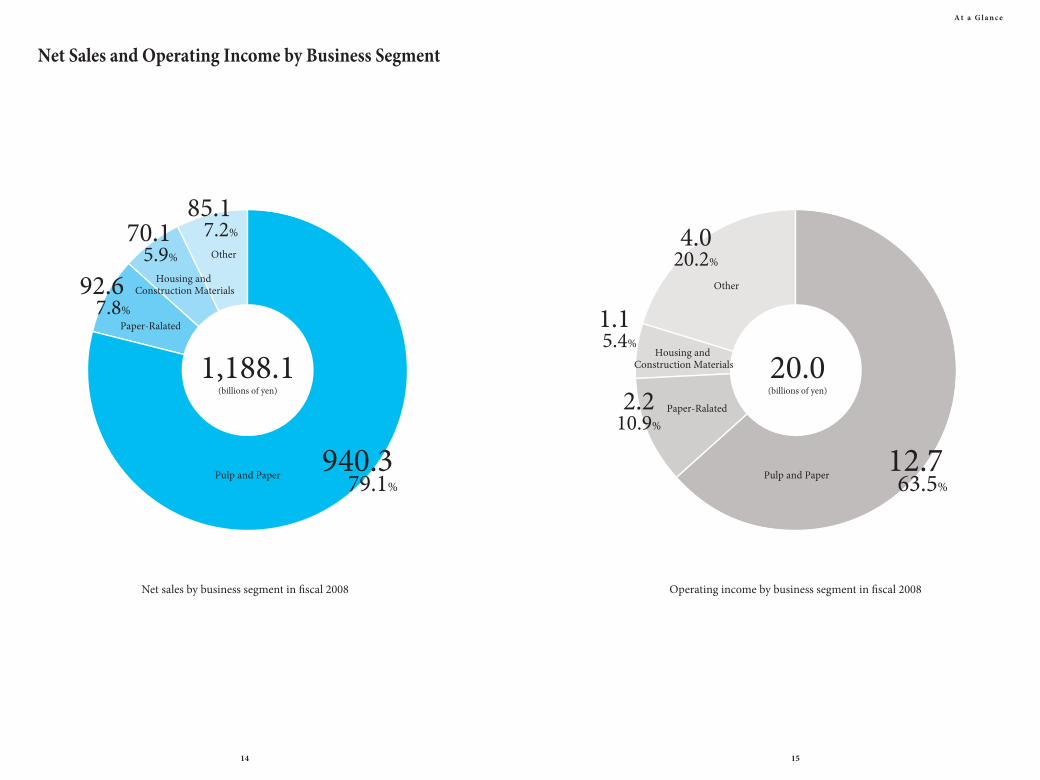
Operating income by business segment in fiscal 2008
Net Sales and Operating Income by Business Segment
Net sales by business segment in fiscal 2008
14 15
A t a G l a n c e
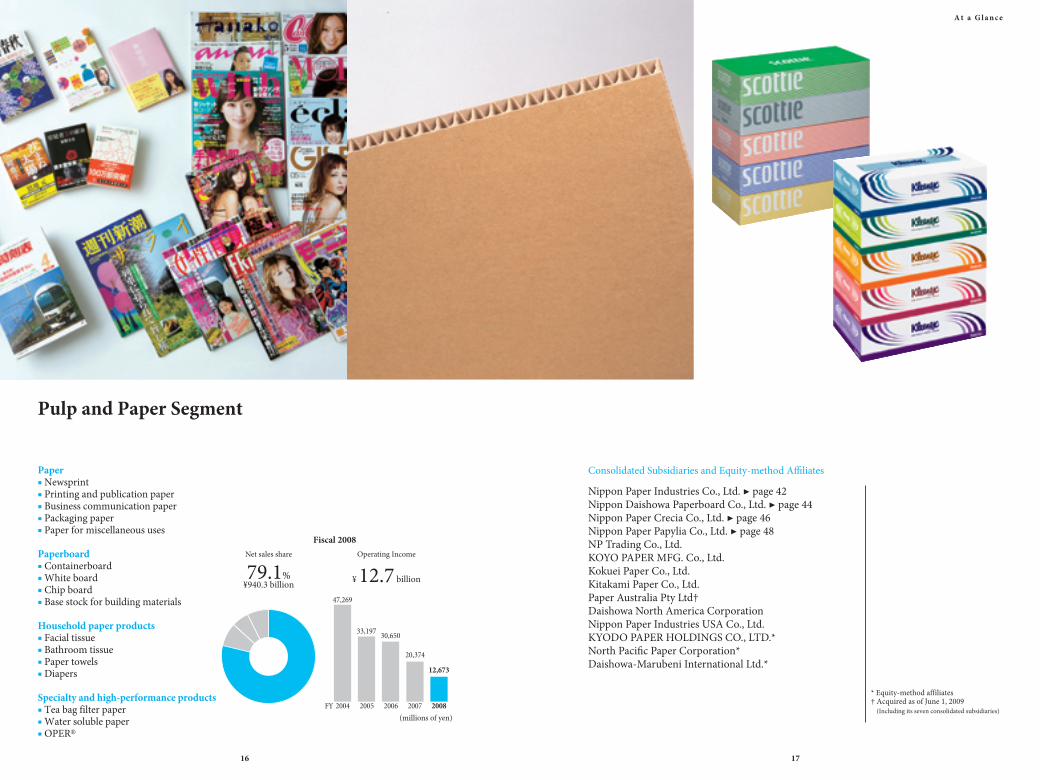
Paper■ Newsprint■ Printing and publication paper■ Business communication paper■ Packaging paper■ Paper for miscellaneous uses
Paperboard■ Containerboard■ White board■ Chip board■ Base stock for building materials
Household paper products■ Facial tissue■ Bathroom tissue■ Paper towels■ Diapers
Specialty and high-performance products■ Tea bag filter paper■ Water soluble paper■ OPER®
* Equity-method affiliates† Acquired as of June 1, 2009
(Including its seven consolidated subsidiaries)
Nippon Paper Industries Co., Ltd. ▶ page 42Nippon Daishowa Paperboard Co., Ltd. ▶ page 44Nippon Paper Crecia Co., Ltd. ▶ page 46Nippon Paper Papylia Co., Ltd. ▶ page 48NP Trading Co., Ltd.KOYO PAPER MFG. Co., Ltd.Kokuei Paper Co., Ltd.Kitakami Paper Co., Ltd.Paper Australia Pty Ltd†Daishowa North America CorporationNippon Paper Industries USA Co., Ltd.KYODO PAPER HOLDINGS CO., LTD.*North Pacific Paper Corporation*Daishowa-Marubeni International Ltd.*
Consolidated Subsidiaries and Equity-method Affiliates
Pulp and Paper Segment
¥ 12.7 billion79.1%¥940.3 billion
Net sales share Operating Income
Fiscal 2008
(millions of yen)
16 17
A t a G l a n c e
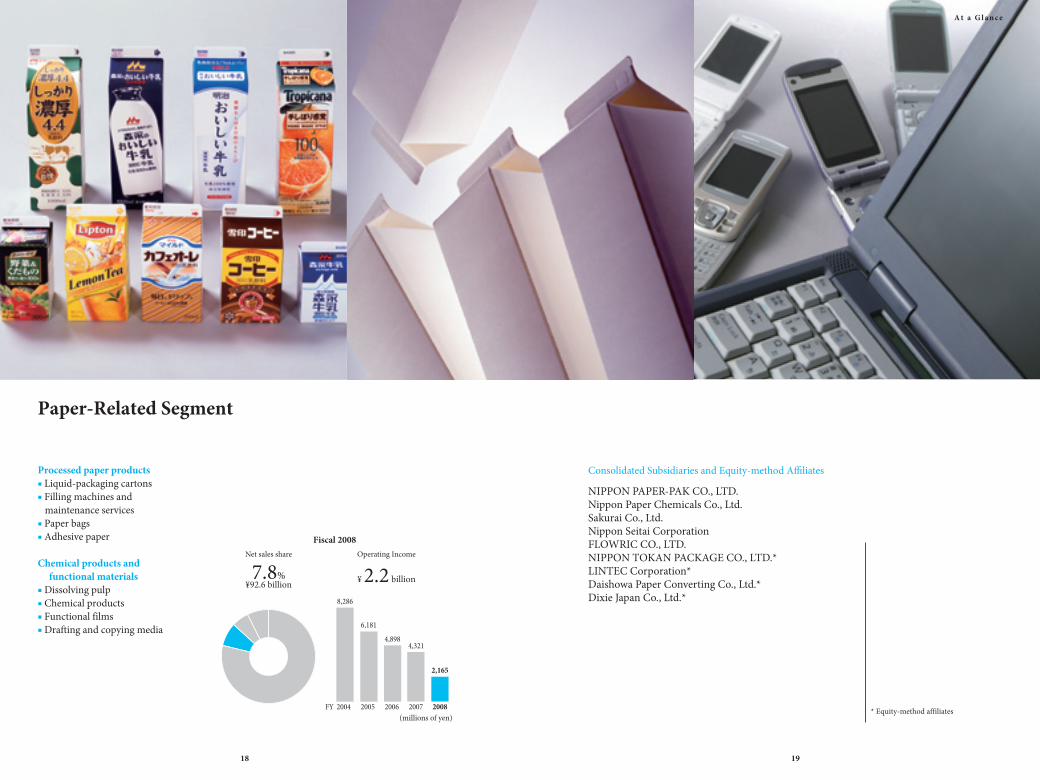
Paper-Related Segment
Processed paper products■ Liquid-packaging cartons■ Filling machines and maintenance services■ Paper bags■ Adhesive paper
Chemical products and functional materials■ Dissolving pulp■ Chemical products■ Functional films■ Drafting and copying media
* Equity-method affiliates
Consolidated Subsidiaries and Equity-method Affiliates
Net sales share Operating Income
¥ 2.2 billion7.8%¥92.6 billion
NIPPON PAPER-PAK CO., LTD.Nippon Paper Chemicals Co., Ltd.Sakurai Co., Ltd.Nippon Seitai CorporationFLOWRIC CO., LTD.NIPPON TOKAN PACKAGE CO., LTD.*LINTEC Corporation*Daishowa Paper Converting Co., Ltd.*Dixie Japan Co., Ltd.*
Fiscal 2008
(millions of yen)
18 19
A t a G l a n c e
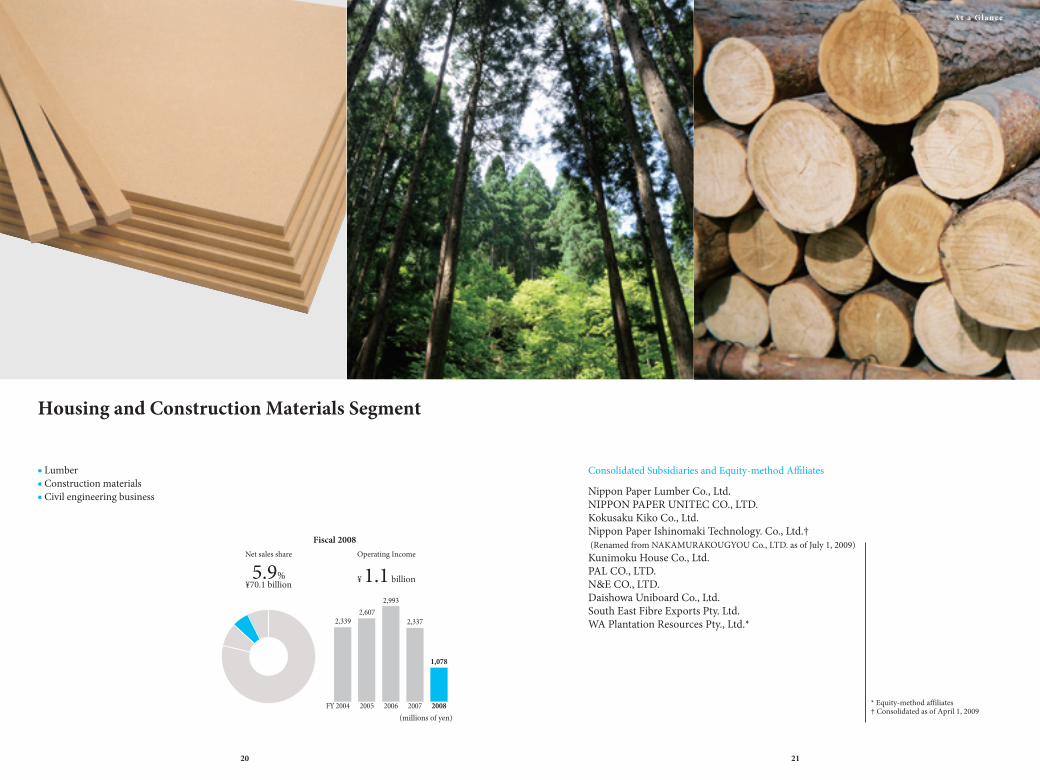
Housing and Construction Materials Segment
■ Lumber■ Construction materials■ Civil engineering business
Consolidated Subsidiaries and Equity-method Affiliates
Net sales share Operating Income
¥ 1.1 billion5.9%¥70.1 billion
Nippon Paper Lumber Co., Ltd.NIPPON PAPER UNITEC CO., LTD.Kokusaku Kiko Co., Ltd.Nippon Paper Ishinomaki Technology. Co., Ltd.† (Renamed from NAKAMURAKOUGYOU Co., LTD. as of July 1, 2009)Kunimoku House Co., Ltd.PAL CO., LTD.N&E CO., LTD.Daishowa Uniboard Co., Ltd.South East Fibre Exports Pty. Ltd.WA Plantation Resources Pty., Ltd.*
* Equity-method affiliates† Consolidated as of April 1, 2009
Fiscal 2008
(millions of yen)
20 21
A t a G l a n c e
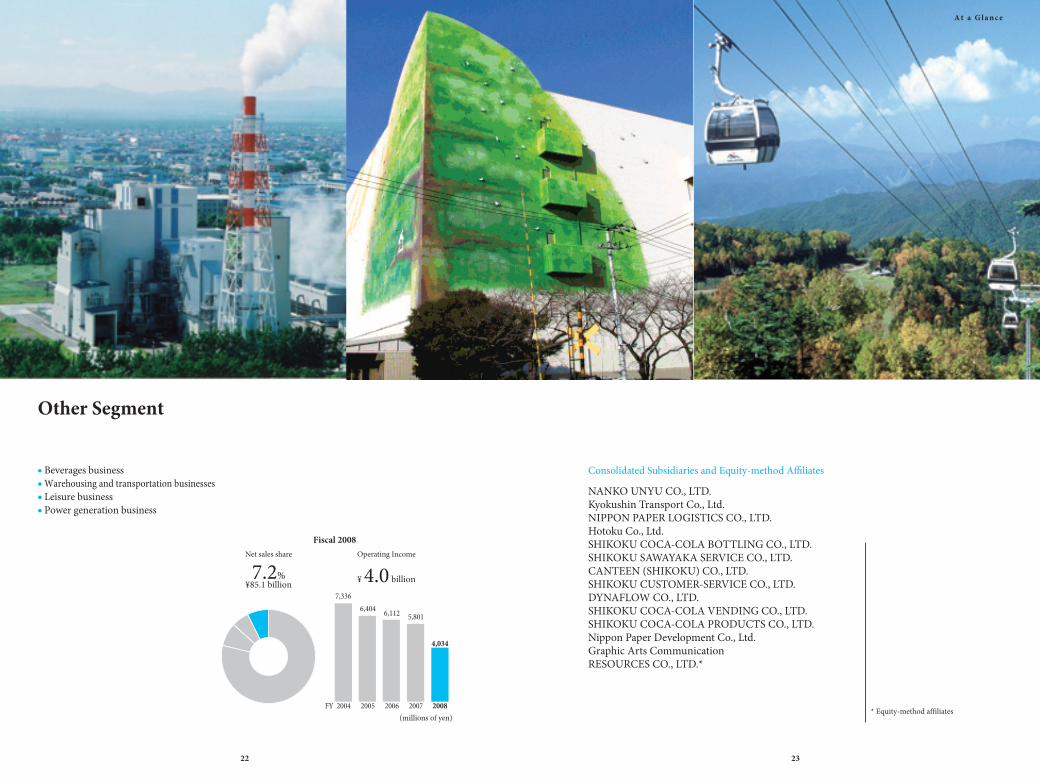
Other Segment
■ Beverages business■ Warehousing and transportation businesses■ Leisure business■ Power generation business
Net sales share Operating Income
¥ 4.0 billion7.2%¥85.1 billion
Consolidated Subsidiaries and Equity-method Affiliates
NANKO UNYU CO., LTD.Kyokushin Transport Co., Ltd.NIPPON PAPER LOGISTICS CO., LTD.Hotoku Co., Ltd.SHIKOKU COCA-COLA BOTTLING CO., LTD.SHIKOKU SAWAYAKA SERVICE CO., LTD.CANTEEN (SHIKOKU) CO., LTD.SHIKOKU CUSTOMER-SERVICE CO., LTD.DYNAFLOW CO., LTD.SHIKOKU COCA-COLA VENDING CO., LTD. SHIKOKU COCA-COLA PRODUCTS CO., LTD.Nippon Paper Development Co., Ltd.Graphic Arts CommunicationRESOURCES CO., LTD.*
* Equity-method affiliates
Fiscal 2008
(millions of yen)
22 23
A t a G l a n c e

26 To Our Shareholders 28 Interview with the President
Message from the President
2524

Yoshio HagaPresidentNippon Paper Group, Inc.
To Our Shareholders
Fiscal 2008, my first year as president of Nippon Paper Group, Inc., was indeed a year of turbulent change. As input prices continued to soar from the previous year, domestic demand contracted sharply in the worldwide recession triggered by the financial crisis that started in the U.S. in fall 2008, and still remains weak.
Nippon Paper recorded steep sales and profit declines amid these worsening operating conditions. Combined with impairment loss on facilities shut down to cut production capacity and book losses on investment securities, in fiscal 2008 Nippon Paper recorded the first final loss since fiscal 2001.
Under these circumstances, it is noteworthy for the company and the paper industry as a whole that price increases for printing paper went ahead for the second consecutive year, and we maintained prices despite the subsequent demand slump by making large production cuts.
Our second medium-term business plan, with the basic themes of strengthening our domestic business base and consolidating the foundations for overseas expansion, ended in fiscal 2008. Regrettably we were unable to achieve our earnings targets because of unprecedented cost inflation, but we made solid progress toward the realization of Group Vision 2015, including domestic production facility scrap-and-build projects, group business restructuring, business alliances with leading overseas companies, and acquisitions of overseas afforestation and other businesses.
We are in the final stages of formulating the third medium-term business plan that starts in fiscal 2009 and working out earnings and other numerical targets. Challenges in the third medium-term plan include accelerating expansion into overseas growth markets, revamping the domestic production system to fit the changing demand structure, and purchasing sustainable resources. We also intend to become a more fleet-footed group of companies and improve management efficiency.
Following the recommendations of the investigation committee reports on the violation of smoke emissions standards and the mislabeling of recycled fiber content in our paper products, we have taken steps to prevent the recurrence of misconduct that affected many people. We have also introduced, in addition to an internal audit, an outside audit system by a third-party organization to ensure that the preventive measures put in place are effective. We are committed to a high standard of compliance, since restoring the public’s trust in the Nippon Paper Group is one of our main management priorities.
Business conditions for the Nippon Paper Group remain opaque in fiscal 2009, but nonetheless we have become more confident in the direction set out in our Group Vision 2015. We are determined to take the necessary steps to become one of the world’s top five paper and pulp companies. On behalf of management I would like to thank group employees for their contribution so far, and ask that they continue to work together as a team.
The Nippon Paper Group’s drive for sustainable growth will continue, and we look forward to your continued support.
26
M e s s a g e f r o m t h e P r e s i d e n t
Interview with the President reversal of these trends would also bring about import declines. The paper market is among those moving into the era of border-free international competition, and we therefore consider a certain amount of cross-border paper inflow perfectly natural. We nevertheless think that imported paper will have difficulty in rising above a certain market share in Japan so long as it does not address a number of important topics—delivery networks; quality-related customer service work in product development and complaint response; and environmental issues including waste paper pulp content and forest certification. For Nippon Paper Group and other domestic paper makers, it will be critical to raise our international competitiveness while at the same time taking a long-term perspective that includes resource procurement and avoiding overreactions to temporary import fluctuations.
Q1: How would you characterize FY 2008 (April 1, 2008–March 31, 2009) results? In the first half, with raw-material and fuel prices rising rapidly, we managed to increase paper prices, continuing the trend from the previous year. We were also able to increase sales volume substantially. In the second half, however, the recession brought a rapid drop in demand, forcing us to cut production sharply. Both output and sales fell a great deal. Our ramp-up of alternative energy boilers helped lower costs, but both operating and ordinary income for the year fell. At the bottom line, we had a net loss for the first time in seven years due to extraordinary losses from production restructuring costs, unrealized losses on equity holdings, and fixed asset write-downs.
Fiscal 2008 ChangeResults (¥ billion) (YoY)Sales ¥1,188.1 –1.9%Operating income 20.0 –39.2%Ordinary income 17.9 –45.3%Net loss (23.3) -Sales volume (thousand tonne)Paper 5,240 –11.8%Paperboard 1,616 –8.7%
Q2: What is the outlook for domestic paper demand?
The Japan Paper Association forecasts an 8% year-on-year decline in domestic demand for calendar 2009. We expect at least a similar decline for FY 2009. We believe that paper demand will not return to its previous level, even if the economy recovers, so we need to restructure and optimize production to meet the demand shift.
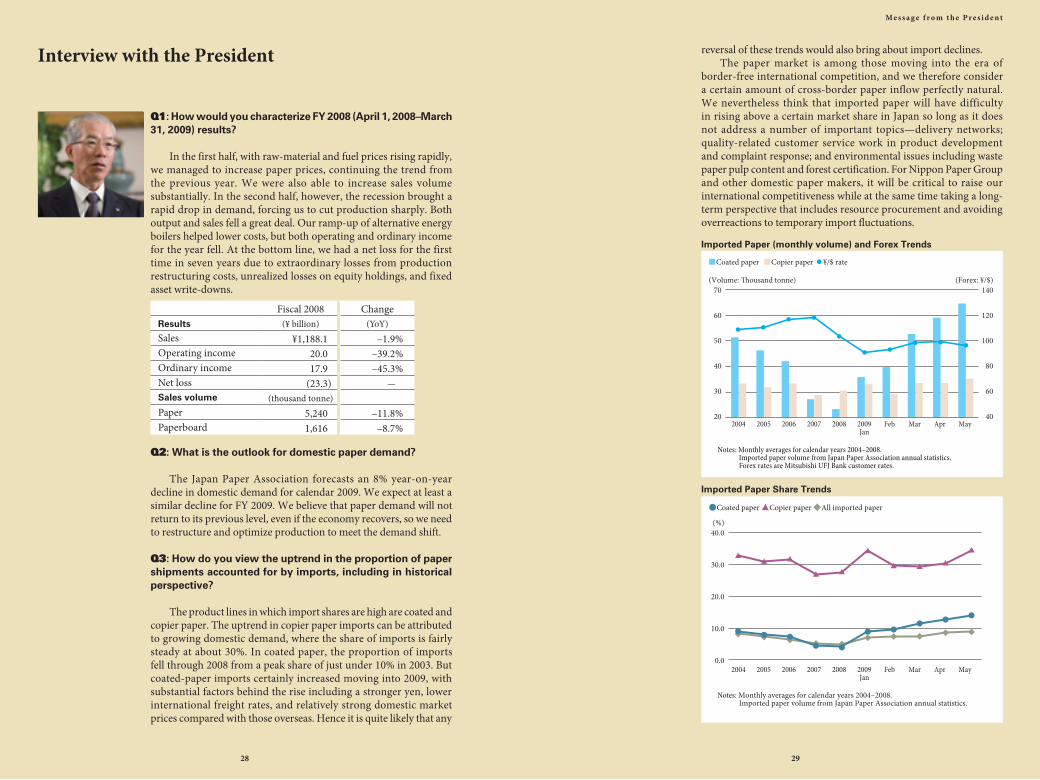
Q3: How do you view the uptrend in the proportion of paper shipments accounted for by imports, including in historical perspective?
The product lines in which import shares are high are coated and copier paper. The uptrend in copier paper imports can be attributed to growing domestic demand, where the share of imports is fairly steady at about 30%. In coated paper, the proportion of imports fell through 2008 from a peak share of just under 10% in 2003. But coated-paper imports certainly increased moving into 2009, with substantial factors behind the rise including a stronger yen, lower international freight rates, and relatively strong domestic market prices compared with those overseas. Hence it is quite likely that any
Imported Paper (monthly volume) and Forex Trends
Imported Paper Share Trends
28 29
M e s s a g e f r o m t h e P r e s i d e n t
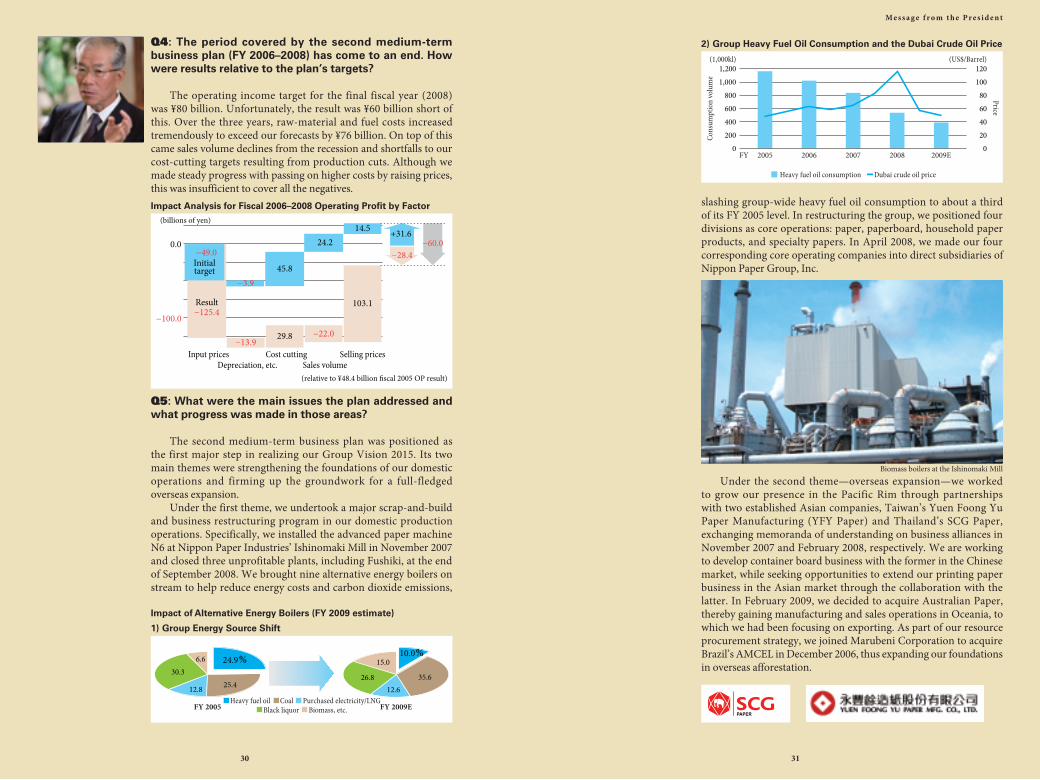
Q4: The period covered by the second medium-term business plan (FY 2006–2008) has come to an end. How were results relative to the plan’s targets?
The operating income target for the final fiscal year (2008) was ¥80 billion. Unfortunately, the result was ¥60 billion short of this. Over the three years, raw-material and fuel costs increased tremendously to exceed our forecasts by ¥76 billion. On top of this came sales volume declines from the recession and shortfalls to our cost-cutting targets resulting from production cuts. Although we made steady progress with passing on higher costs by raising prices, this was insufficient to cover all the negatives.
Q5: What were the main issues the plan addressed and what progress was made in those areas?
The second medium-term business plan was positioned as the first major step in realizing our Group Vision 2015. Its two main themes were strengthening the foundations of our domestic operations and firming up the groundwork for a full-fledged overseas expansion.
Under the first theme, we undertook a major scrap-and-build and business restructuring program in our domestic production operations. Specifically, we installed the advanced paper machine N6 at Nippon Paper Industries’ Ishinomaki Mill in November 2007 and closed three unprofitable plants, including Fushiki, at the end of September 2008. We brought nine alternative energy boilers on stream to help reduce energy costs and carbon dioxide emissions,
slashing group-wide heavy fuel oil consumption to about a third of its FY 2005 level. In restructuring the group, we positioned four divisions as core operations: paper, paperboard, household paper products, and specialty papers. In April 2008, we made our four corresponding core operating companies into direct subsidiaries of Nippon Paper Group, Inc.
Under the second theme—overseas expansion—we worked to grow our presence in the Pacific Rim through partnerships with two established Asian companies, Taiwan’s Yuen Foong Yu Paper Manufacturing (YFY Paper) and Thailand’s SCG Paper, exchanging memoranda of understanding on business alliances in November 2007 and February 2008, respectively. We are working to develop container board business with the former in the Chinese market, while seeking opportunities to extend our printing paper business in the Asian market through the collaboration with the latter. In February 2009, we decided to acquire Australian Paper, thereby gaining manufacturing and sales operations in Oceania, to which we had been focusing on exporting. As part of our resource procurement strategy, we joined Marubeni Corporation to acquire Brazil’s AMCEL in December 2006, thus expanding our foundations in overseas afforestation.
2) Group Heavy Fuel Oil Consumption and the Dubai Crude Oil Price
1) Group Energy Source Shift
Impact of Alternative Energy Boilers (FY 2009 estimate)
Impact Analysis for Fiscal 2006–2008 Operating Profit by Factor
Biomass boilers at the Ishinomaki Mill
30 31
M e s s a g e f r o m t h e P r e s i d e n t
Q6: The alliance agreement with Rengo expired. Why did this not develop further? What about the alliance with Hokuetsu Paper Mills?
We had hoped the alliance with Rengo would be an ideal complement to our paperboard division, but Nippon Paper Group and Rengo did not develop a sufficiently shared view of the outlook for the pulp and paper industry predicated on global competition.
Our alliance with Hokuetsu Paper Mills began in 2007 with the OEM supply of light-weight coated paper, and expanded to technical cooperation and joint procurement, creating definite economic advantages. We plan to maintain this relationship.
Q7: With such dramatic changes in the business climate for the pulp and paper industry, will there be changes to Nippon Paper Group’s long-term vision?
The way we see it, the rapid shifts in the economic scene starting in 2008 simply accelerated the arrival of conditions that we were already anticipating in Group Vision 2015, in which we set out how our company should look in 2015. Relative to our initial outlook, the fall-off in domestic demand is pressing us to step up our overseas expansion plans. We have even more confidence now in our direction with Group Vision 2015 and plan to take the next steps toward achieving it in our third medium-term business plan.
Q8: What can we expect in that plan?
Normally, this is something we would discuss along with specific numerical targets, but the rapid shift in the economy starting in 2008 has made it very difficult to come up with any reliable forecasts for demand, costs, and other assumptions that underpin any such targets. What is clear, though, is the four main policies that will be at the heart of the third medium-term business plan.
The first of these is to promote the growth of our business in overseas markets. We are concerned that the current global recession is accelerating the pace of change in the domestic demand configuration for the pulp and paper industry. This makes it urgent for us to shift away from a domestic market focus and toward steady expansion in overseas markets where we anticipate growth. We are committed to cultivating the alliances with YFY Paper and SCG Paper, realizing synergies with recently acquired Australian Paper as early as possible, bolstering our existing overseas operations, and setting up new business sites.
The second is to further strengthen our domestic business foundations in order to convert to a business structure that will enable us to prevail in the market competition. We have to continue optimizing overall operation of our domestic production and as part of this, we will be shutting down 15 paper machines in FY 2009. With our survival in the industry at stake, we are enhancing our cost competitiveness and sales capabilities to build a corporate structure
that can secure stable earnings regardless of market conditions.The third is to press forward with our raw-materials procurement
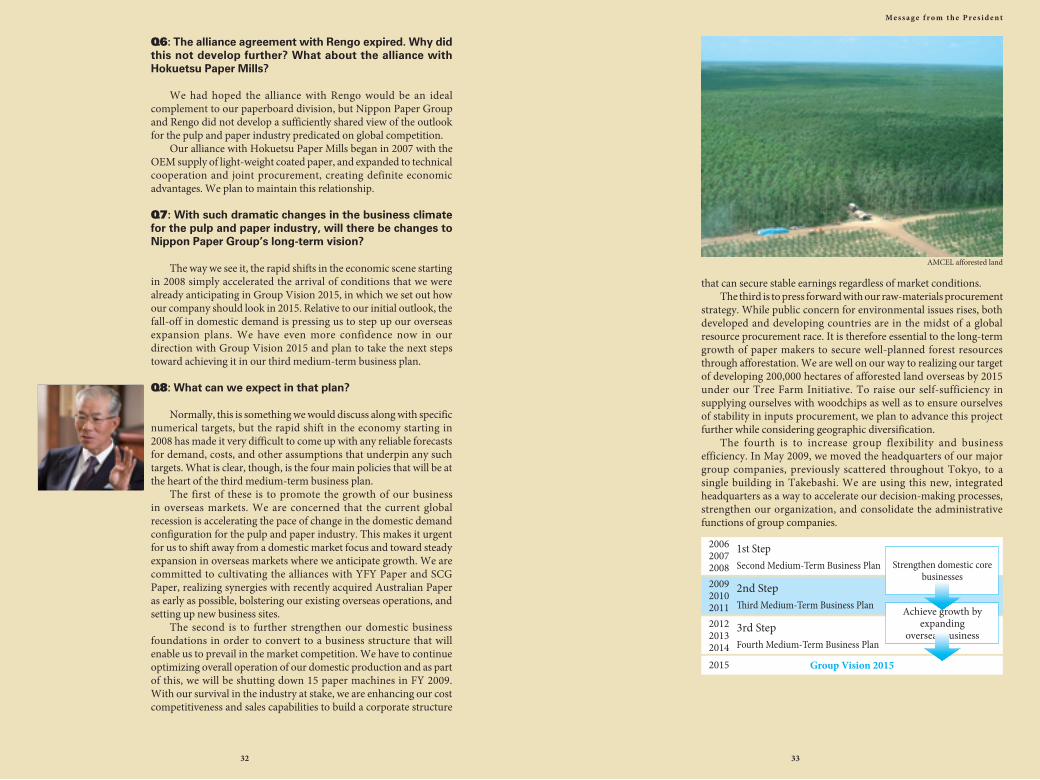
strategy. While public concern for environmental issues rises, both developed and developing countries are in the midst of a global resource procurement race. It is therefore essential to the long-term growth of paper makers to secure well-planned forest resources through afforestation. We are well on our way to realizing our target of developing 200,000 hectares of afforested land overseas by 2015 under our Tree Farm Initiative. To raise our self-sufficiency in supplying ourselves with woodchips as well as to ensure ourselves of stability in inputs procurement, we plan to advance this project further while considering geographic diversification.
The fourth is to increase group flexibility and business efficiency. In May 2009, we moved the headquarters of our major group companies, previously scattered throughout Tokyo, to a single building in Takebashi. We are using this new, integrated headquarters as a way to accelerate our decision-making processes, strengthen our organization, and consolidate the administrative functions of group companies.
AMCEL afforested land
1st StepSecond Medium-Term Business Plan
2006200720082009201020112012201320142015
2nd StepThird Medium-Term Business Plan
3rd StepFourth Medium-Term Business Plan
Group Vision 2015
Strengthen domestic core businesses
Achieve growth by expanding
overseas business
32 33
M e s s a g e f r o m t h e P r e s i d e n t
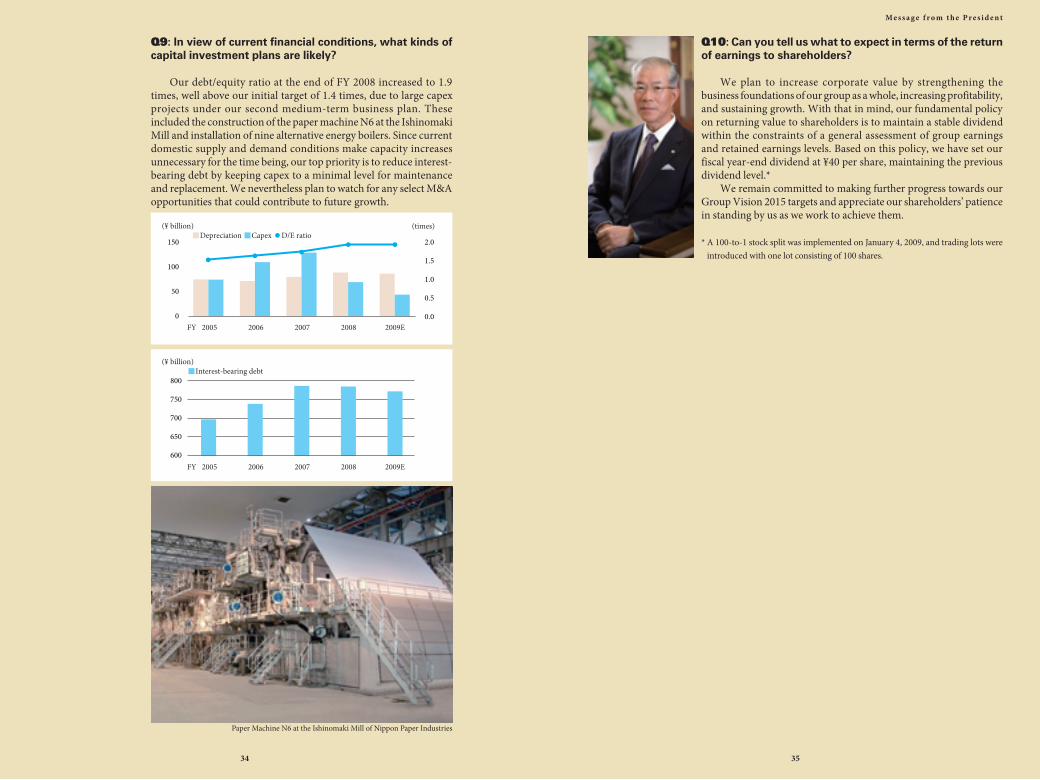
Q9: In view of current financial conditions, what kinds of capital investment plans are likely?
Our debt/equity ratio at the end of FY 2008 increased to 1.9 times, well above our initial target of 1.4 times, due to large capex projects under our second medium-term business plan. These included the construction of the paper machine N6 at the Ishinomaki Mill and installation of nine alternative energy boilers. Since current domestic supply and demand conditions make capacity increases unnecessary for the time being, our top priority is to reduce interest-bearing debt by keeping capex to a minimal level for maintenance and replacement. We nevertheless plan to watch for any select M&A opportunities that could contribute to future growth.
(times)
Q10: Can you tell us what to expect in terms of the return of earnings to shareholders?
We plan to increase corporate value by strengthening the business foundations of our group as a whole, increasing profitability, and sustaining growth. With that in mind, our fundamental policy on returning value to shareholders is to maintain a stable dividend within the constraints of a general assessment of group earnings and retained earnings levels. Based on this policy, we have set our fiscal year-end dividend at ¥40 per share, maintaining the previous dividend level.*
We remain committed to making further progress towards our Group Vision 2015 targets and appreciate our shareholders’ patience in standing by us as we work to achieve them.
* A 100-to-1 stock split was implemented on January 4, 2009, and trading lots were introduced with one lot consisting of 100 shares.
Paper Machine N6 at the Ishinomaki Mill of Nippon Paper Industries
34 35
M e s s a g e f r o m t h e P r e s i d e n t

Restructuring Production
Nippon Paper Group implemented large-scale production cuts to maintain our prices in the face of sharp demand declines in the domestic paper and paperboard markets stemming from the global recession that began in autumn 2008. While we expect the economy to recover, we believe domestic demand is unlikely to return to its former levels, due mainly to the shift away from printing entailed in structural factors such as population decline and the spread of information technology. We therefore decided to permanently shut down some of our paper machines after determining that eliminating emerging supply/demand gaps would require decisive action.
In the first half of fiscal 2009, Nippon Paper Group is shutting down 15 paper machines and coaters with combined annual capacity of 580,000 tonnes, and consolidating production to high-productivity machinery. We have also decided to further reduce annual capacity by 300,000 tonnes by shutting down paper machines during the annual maintenance period of boilers and pulp machines, for which we formerly would have kept running.
We estimate the domestic paper industry now carries about 20% in excess capacity. With our current measures, we are cutting our own papermaking capacity by about 13% (7% in paperboard), and we expect our average paper machine operating rate to improve to the 90% level for the second half of fiscal 2009. We plan to continue taking measures to improve group profitability, working to raise productivity and cut fixed costs at our mill.
Capacity Reduction PlansNippon Paper Group Paper Paperboard Total Coated paper Other paper Total (Thousand t)Before cuts Production capacity a 2,366 3,400 5,766 1,963 7,729Breakdown Machine shutdowns b 222 220 442 133 575 [Machines shut down] [6] [8] [14] [1] [15] Machine stoppages c 186 114 300 0 300 Total b+c=d 408 334 742 133 875After cuts Production capacity a−d 1,958 3,066 5,024 1,830 6,854 Fiscal 2009 plan 1,727 2,956 4,683 1,557 6,240 Fiscal 2009 plan / capacity after cuts (%) 88.2 96.4 93.2 85.1 91.0 Fiscal 2009 plan / capacity before cuts (%) 73.0 86.9 81.2 79.3 80.7
Pulp & Paper Industry Paper Paperboard Total (Thousand t)Before cuts Production capacity* a 20,595 13,531 34,126Breakdown Nippon Paper Group 742 133 875 Oji Paper 287 287 Daio Paper 180 180 Hokuetsu Paper 30 30 Rengo 168 168 Total b 1,239 301 1,540After cuts Production capacity a−b 19,356 13,230 32,586 Fiscal 2009 domestic demand* 17,071 11,185 28,256 Fiscal 2009 domestic demand/capacity after cuts (%) 88.2 84.5 86.7 Fiscal 2009 domestic demand/ capacity before cuts (%) 82.9 82.7 82.8
* Japan Paper Association
37 Restructuring Production 38 Australian Paper Acquisition
Feature 2009
3736
Fe a t u r e 2 0 0 9
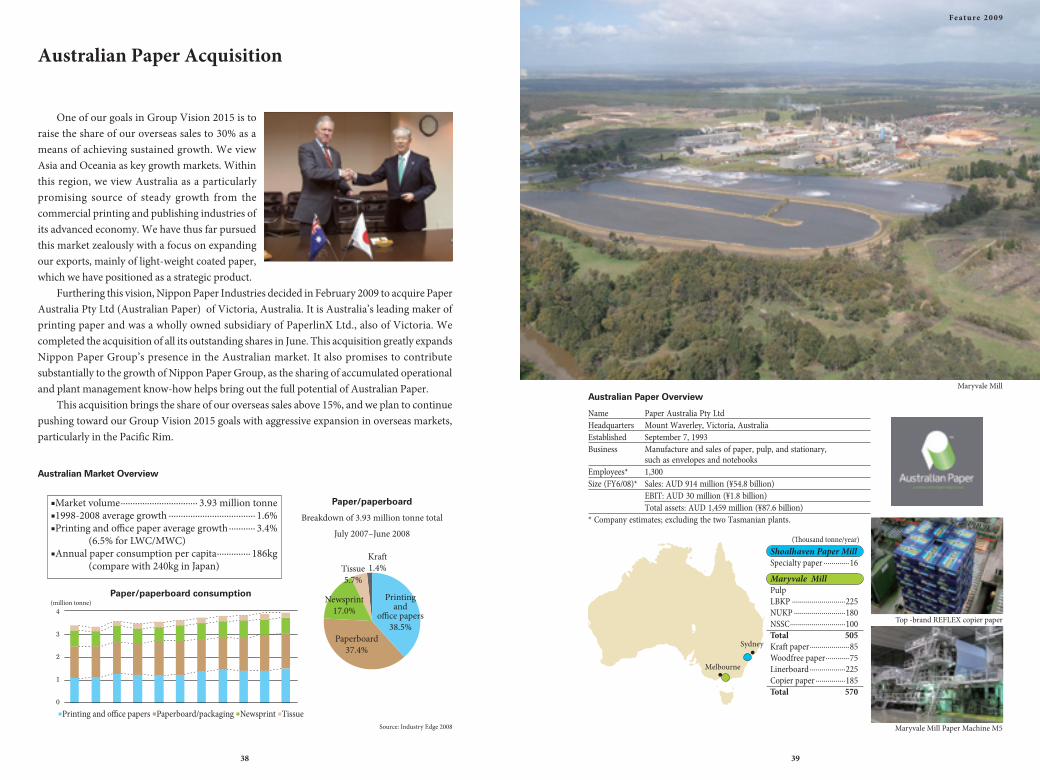
One of our goals in Group Vision 2015 is to raise the share of our overseas sales to 30% as a means of achieving sustained growth. We view Asia and Oceania as key growth markets. Within this region, we view Australia as a particularly promising source of steady growth from the commercial printing and publishing industries of its advanced economy. We have thus far pursued this market zealously with a focus on expanding our exports, mainly of light-weight coated paper, which we have positioned as a strategic product.
Furthering this vision, Nippon Paper Industries decided in February 2009 to acquire Paper Australia Pty Ltd (Australian Paper) of Victoria, Australia. It is Australia’s leading maker of printing paper and was a wholly owned subsidiary of PaperlinX Ltd., also of Victoria. We completed the acquisition of all its outstanding shares in June. This acquisition greatly expands Nippon Paper Group’s presence in the Australian market. It also promises to contribute substantially to the growth of Nippon Paper Group, as the sharing of accumulated operational and plant management know-how helps bring out the full potential of Australian Paper.
This acquisition brings the share of our overseas sales above 15%, and we plan to continue pushing toward our Group Vision 2015 goals with aggressive expansion in overseas markets, particularly in the Pacific Rim.
Australian Paper Acquisition
Maryvale Mill
Australian Market Overview
Source: Industry Edge 2008
Australian Paper Overview
Name Paper Australia Pty LtdHeadquarters Mount Waverley, Victoria, AustraliaEstablished September 7, 1993Business Manufacture and sales of paper, pulp, and stationary, such as envelopes and notebooksEmployees* 1,300Size (FY6/08)* Sales: AUD 914 million (¥54.8 billion) EBIT: AUD 30 million (¥1.8 billion) Total assets: AUD 1,459 million (¥87.6 billion)* Company estimates; excluding the two Tasmanian plants.
Top -brand REFLEX copier paper
Maryvale Mill Paper Machine M5
38 39
Fe a t u r e 2 0 0 9
News ReleasesThe following is a list of news items relevant to our feature article that were released between June 2008 and June 2009.
2008
June 27 Yoshio Haga assumes presidency of Nippon Paper Group, Inc. (NPG)September 2 Nippon Daishowa Paperboard shuts down Yoshinaga Mill paper machine N1 30 Fushiki Mill and Waki Works closed permanently, Komatsushima Mill pulls out of the paper businessOctober 28 Nippon Paper Industries (NPI) agrees to invest in the paperboard business of Taiwan-based Yuen Foong Yu Paper ManufacturingDecember 16 NPI applies for participation in trial implementation of a domestic integrated market for trading emission credits
2009
January 4 NPG implements a 100-to-1 stock split and minimum trading lots (100 shares/lot)February 18 NPG acquires forest certification for Brazilian and Australian afforestation and woodchip businessesMarch 2 Business alliance with Rengo and Sumitomo Corporation terminated 10 NPI develops efficient propagation of pollenless cedars using photoautotrophic culture technology 25 NPG shuts down 15 paper machines April 14 Nippon Paper Chemicals develops clear hard-coating film for next-generation LCD panels 20 Commencement of business at new headquarters office (NPG and its major group companies)June 1 NPI completes acquisition of all outstanding Australian Paper shares 15 NPG converts Shikoku Coca-Cola Bottling into a wholly owned subsidiary through share acquisition and share swap
* Visit our website at http://www.np-g.com/e/news/index.html to view full news releases.
42 PAPER — Nippon Paper Industries Co., Ltd. 44 PAPERBOARD — Nippon Daishowa Paperboard Co., Ltd. 46 HOUSEHOLD PAPER — Nippon Paper Crecia Co., Ltd. 48 SPECIALTY PAPER — Nippon Paper Papylia Co., Ltd.
Major Subsidiary Profiles
40 41

Nippon Paper Industries Co., Ltd.
Ishinomaki Paper Machine N6
product development capabilities needed to meet diverse customer needs.
Fiscal 2008 reviewIn fiscal 2008, our sales volume fell
considerably, particularly in coated paper, as demand dropped off in the second half. Despite our successes in rising prices, sales and earnings fell for the full year as large-scale production cuts resulted in an elevated fixed-cost burden.
Fiscal 2009 outlookThe economic outlook is unclear and
this makes it difficult to forecast paper demand. While raw materials and fuel prices are trending down overall, heavy fuel oil prices have turned upward, and there is no knowing what will come. To maintain earnings in this environment, we have decided to shut down 14 paper machines to raise our operating rates and implemented a set of emergency measures focusing on more than a ¥10 billion fixed-cost reduction.
Direction in medium-term business plan Nippon Paper Industries plans to take
further significant steps toward our long-term Group Vision 2015 goals with measures stated in our third medium-term business plan that starts in fiscal 2009. These include continued re-engineering and optimization of our domestic production and pushing ahead to achieve further growth in our overseas business through tie-ups and M&A deals.
Nippon Paper Industries Co., Ltd.Established August 1, 1949Paid-in Capital ¥ 104,873 millionWeb Site http://www.np-g.com/e/Representative President Yoshio HagaPrincipal Products Newsprint
Printing and publishing paperBusiness communication paperPackaging paperPaper for miscellaneous uses
Fiscal 2008 Net Sales ¥ 626.3 billion (including intra-group sales)
Business environmentThe paper industry was able to raise
prices in 2007 and 2008 as input prices climbed. However, the global recession led to a sharp drop in demand in the second half of fiscal 2008, forcing large production cuts and sales declines. With little prospect of a quick recovery in domestic demand, it is imperative to reduce production capacity to close supply-demand gap.
Company strengthsOur principle mills are in seafront areas,
giving us a strong competitive advantage in a domestic paper industry that is highly dependent on imports for its raw materials and fuel. Most of our products have captured the top domestic market share in their respective categories. As an industry leader, we boast a powerful brand, along with the top-class manufacturing technology and Yoshio Haga President
Business Communication Paper
Packaging Paper and Paper for Miscellaneous Uses
42 43
M a j o r S u b s i d i a r y P r o f i l e s
Nippon Daishowa Paperboard Co., Ltd.Established August 28, 1913Paid-in Capital ¥ 10,864 millionWeb Site http://www.nichidaiita.co.jpRepresentative President Hironori Iwase
Principal Products Containerboard (liner and corrugating medium)Cartonboard (folding boxes, cardstock, and pub-lishing and advertising materials)Other paperboard (gypsum board liner and paper core)
(applications)
Fiscal 2008 Net Sales ¥ 163.4 billion(including intra-group sales)Hironori Iwase President
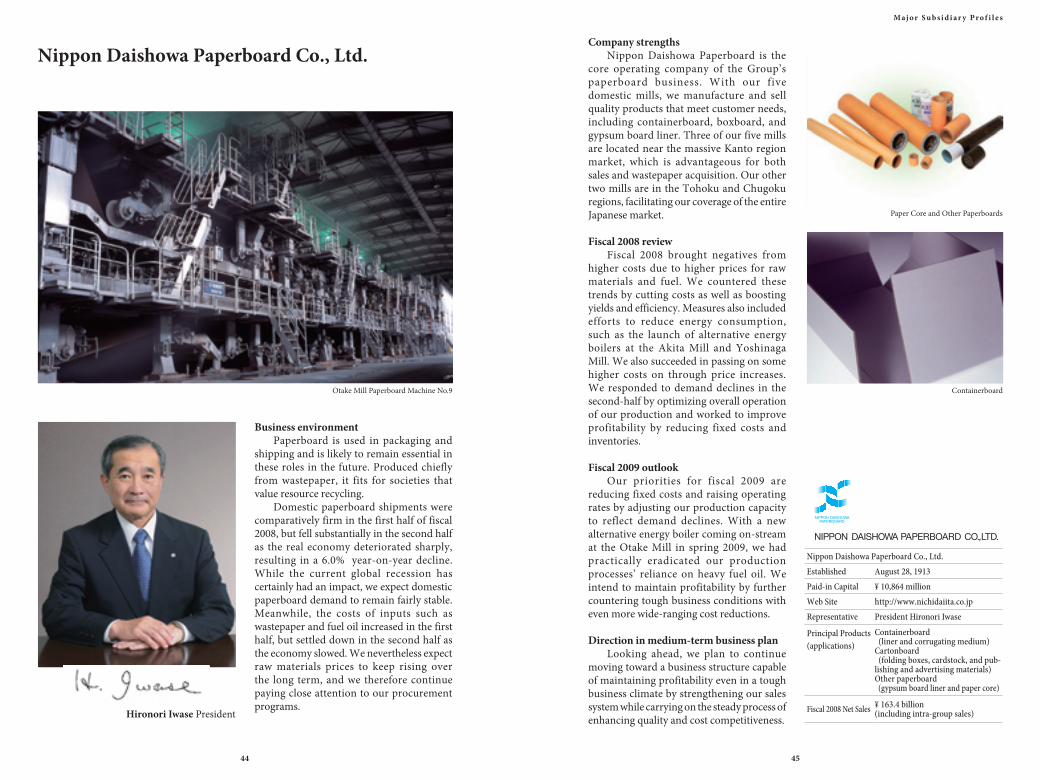
Company strengthsNippon Daishowa Paperboard is the
core operating company of the Group’s paperboard business. With our five domestic mills, we manufacture and sell quality products that meet customer needs, including containerboard, boxboard, and gypsum board liner. Three of our five mills are located near the massive Kanto region market, which is advantageous for both sales and wastepaper acquisition. Our other two mills are in the Tohoku and Chugoku regions, facilitating our coverage of the entire Japanese market.
Fiscal 2008 reviewFiscal 2008 brought negatives from
higher costs due to higher prices for raw materials and fuel. We countered these trends by cutting costs as well as boosting yields and efficiency. Measures also included efforts to reduce energy consumption, such as the launch of alternative energy boilers at the Akita Mill and Yoshinaga Mill. We also succeeded in passing on some higher costs on through price increases. We responded to demand declines in the second-half by optimizing overall operation of our production and worked to improve profitability by reducing fixed costs and inventories.
Fiscal 2009 outlookOur priorities for fiscal 2009 are
reducing fixed costs and raising operating rates by adjusting our production capacity to reflect demand declines. With a new alternative energy boiler coming on-stream at the Otake Mill in spring 2009, we had practically eradicated our production processes’ reliance on heavy fuel oil. We intend to maintain profitability by further countering tough business conditions with even more wide-ranging cost reductions.
Direction in medium-term business plan Looking ahead, we plan to continue
moving toward a business structure capable of maintaining profitability even in a tough business climate by strengthening our sales system while carrying on the steady process of enhancing quality and cost competitiveness.
Business environmentPaperboard is used in packaging and
shipping and is likely to remain essential in these roles in the future. Produced chiefly from wastepaper, it fits for societies that value resource recycling.
Domestic paperboard shipments were comparatively firm in the first half of fiscal 2008, but fell substantially in the second half as the real economy deteriorated sharply, resulting in a 6.0% year-on-year decline. While the current global recession has certainly had an impact, we expect domestic paperboard demand to remain fairly stable. Meanwhile, the costs of inputs such as wastepaper and fuel oil increased in the first half, but settled down in the second half as the economy slowed. We nevertheless expect raw materials prices to keep rising over the long term, and we therefore continue paying close attention to our procurement programs.
Otake Mill Paperboard Machine No.9
Paper Core and Other Paperboards
Containerboard
44 45
Nippon Daishowa Paperboard Co., Ltd.
M a j o r S u b s i d i a r y P r o f i l e s
Business environmentRising raw materials prices in the first
half of fiscal 2008 forced the household tissue industry, as it did other industries, to work to pass on higher costs by raising prices. The rapid changes in the second half of 2008 triggered by the shock of the Lehman Brothers bankruptcy then led to a deflationary tone as raw materials prices dropped sharply. Market prices fell back to their previous levels under strong pressure from retailers and the actions of our competitors. That low-priced private brands are making headway in the market amid weak consumption makes it all the more critical for us to enhance our brand value so consumers will accept our asking prices.
The global recession forced most other industries to cut shipments by volume in 2008, but the household tissue industry enjoyed stable demand and shipment volumes actually increased 0.4% year-on-year.
Nippon Paper Crecia Co., Ltd.Established April 2, 1963Paid-in Capital ¥ 3,067 millionWeb Site http://www.crecia.co.jpRepresentative President Kazuhiro SakaiPrincipal Products Facial tissue
Bathroom tissuePaper towelsPre-moistened wipesHealthcare productsIndustrial-use wipes
Fiscal 2008 Net Sales ¥ 63.1 billion(including intra-group sales)
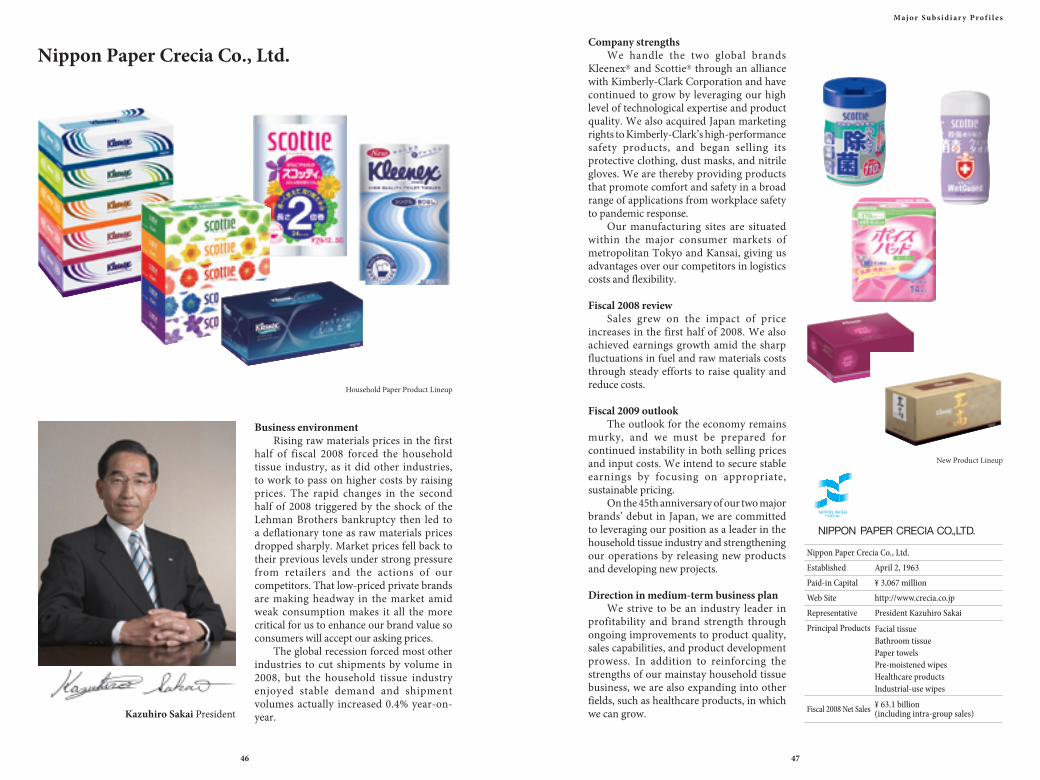
Company strengthsWe handle the two global brands
Kleenex® and Scottie® through an alliance with Kimberly-Clark Corporation and have continued to grow by leveraging our high level of technological expertise and product quality. We also acquired Japan marketing rights to Kimberly-Clark’s high-performance safety products, and began selling its protective clothing, dust masks, and nitrile gloves. We are thereby providing products that promote comfort and safety in a broad range of applications from workplace safety to pandemic response.
Our manufacturing sites are situated within the major consumer markets of metropolitan Tokyo and Kansai, giving us advantages over our competitors in logistics costs and flexibility.
Fiscal 2008 reviewSales grew on the impact of price
increases in the first half of 2008. We also achieved earnings growth amid the sharp fluctuations in fuel and raw materials costs through steady efforts to raise quality and reduce costs.
Fiscal 2009 outlookThe outlook for the economy remains
murky, and we must be prepared for continued instability in both selling prices and input costs. We intend to secure stable earnings by focusing on appropriate, sustainable pricing.
On the 45th anniversary of our two major brands’ debut in Japan, we are committed to leveraging our position as a leader in the household tissue industry and strengthening our operations by releasing new products and developing new projects.
Direction in medium-term business planWe strive to be an industry leader in
profitability and brand strength through ongoing improvements to product quality, sales capabilities, and product development prowess. In addition to reinforcing the strengths of our mainstay household tissue business, we are also expanding into other fields, such as healthcare products, in which we can grow.Kazuhiro Sakai President
Household Paper Product Lineup
New Product Lineup
46 47
Nippon Paper Crecia Co., Ltd.
M a j o r S u b s i d i a r y P r o f i l e s
Harada Mill
A Wide Range of High-Performance Products
Nippon Paper Papylia Co., Ltd.Established July 25, 1918Paid-in Capital ¥3,949 millionWeb Site http://www.papylia.com/Representative President Masahiro Murakami
Principal Products Paper Cigarette-related paper,Dictionary paper,High-grade book paperSpecialty paper (Tea bag filter paper)Function paper (Resin-laminated paper “OPER”, Water soluble paper)
(applications)
Fiscal 2008 Net Sales ¥ 24.1 billion(including intra-group sales)
Business environmentNippon Paper Papylia was formed in
April 2008 through the restructuring and merger of Mishima Paper, Nippon Daishowa Paperboard’s Kochi Mill, and Nippon Paper Industries’ synthetic paper business. We are now a core Nippon Paper Group company operating in the specialty paper field.
The fiscal 2008 business climate deteriorated rapidly from the second half, as the global recession led to sharp declines in demand for specialty papers from the automotive and consumer electronics industries. Demand for papers used in cigarettes (rolling paper and filter tipping paper) has been in a secular downtrend as smoking rates decline; however, this fiscal year saw transient demand growth in conjunction with the launch of the Taspo age-verification scheme.
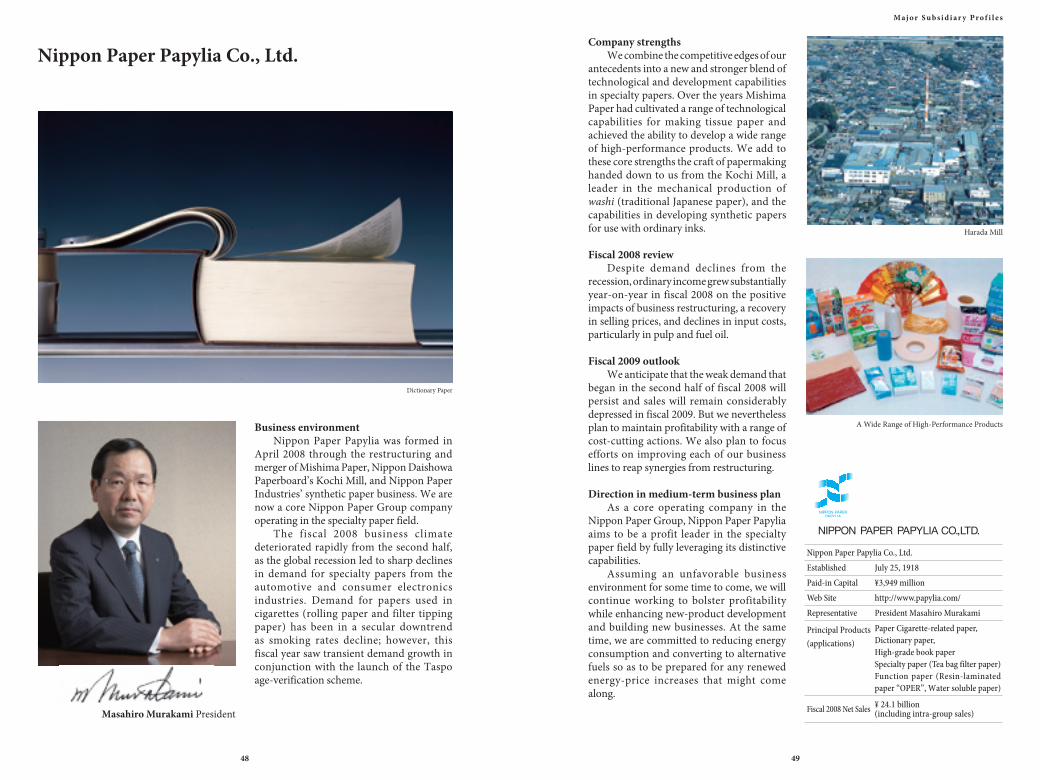
Company strengthsWe combine the competitive edges of our
antecedents into a new and stronger blend of technological and development capabilities in specialty papers. Over the years Mishima Paper had cultivated a range of technological capabilities for making tissue paper and achieved the ability to develop a wide range of high-performance products. We add to these core strengths the craft of papermaking handed down to us from the Kochi Mill, a leader in the mechanical production of washi (traditional Japanese paper), and the capabilities in developing synthetic papers for use with ordinary inks.
Fiscal 2008 reviewDespite demand declines from the
recession, ordinary income grew substantially year-on-year in fiscal 2008 on the positive impacts of business restructuring, a recovery in selling prices, and declines in input costs, particularly in pulp and fuel oil.
Fiscal 2009 outlookWe anticipate that the weak demand that
began in the second half of fiscal 2008 will persist and sales will remain considerably depressed in fiscal 2009. But we nevertheless plan to maintain profitability with a range of cost-cutting actions. We also plan to focus efforts on improving each of our business lines to reap synergies from restructuring.
Direction in medium-term business planAs a core operating company in the
Nippon Paper Group, Nippon Paper Papylia aims to be a profit leader in the specialty paper field by fully leveraging its distinctive capabilities.
Assuming an unfavorable business environment for some time to come, we will continue working to bolster profitability while enhancing new-product development and building new businesses. At the same time, we are committed to reducing energy consumption and converting to alternative fuels so as to be prepared for any renewed energy-price increases that might come along.
Masahiro Murakami President
Dictionary Paper
48 49
Nippon Paper Papylia Co., Ltd.
M a j o r S u b s i d i a r y P r o f i l e s
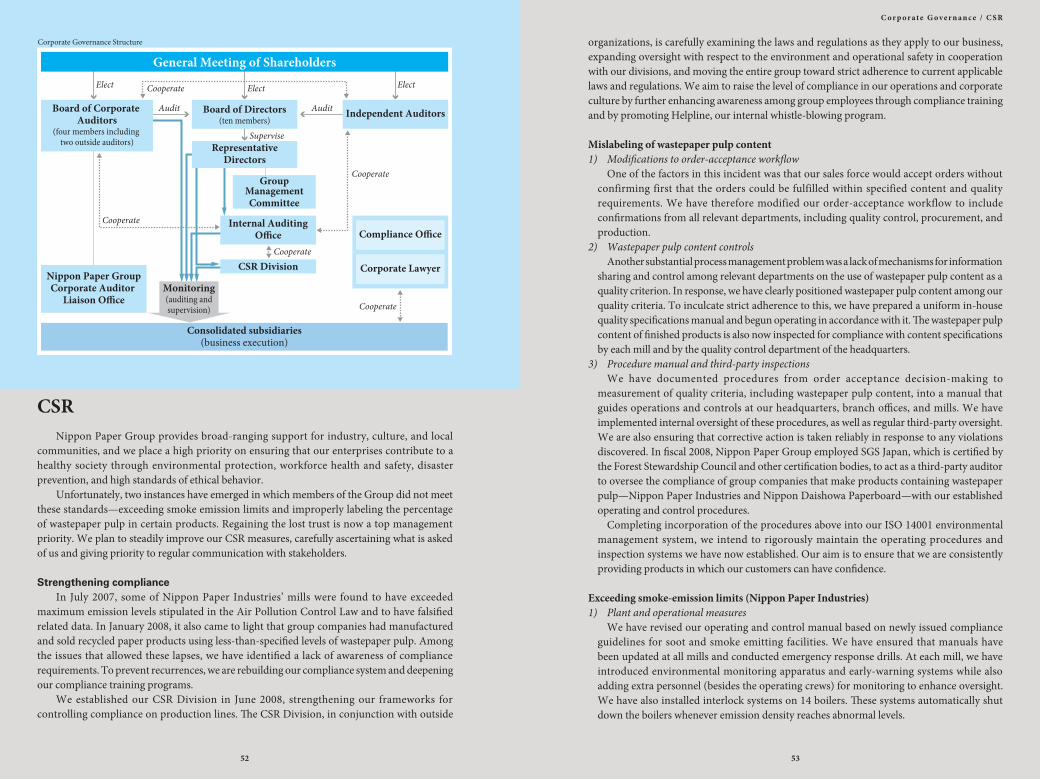
Nippon Paper Group (the Group) seeks fair and transparent management to maintain the confidence and fulfill the expectations of our various stakeholders. As the holding company for the Group, we at Nippon Paper Group, Inc. (the Company) believe our basic responsibilities in corporate governance are to supervise the activities of group companies and to remain accountable to stakeholders while working to increase enterprise value. Based on this approach, we have clearly defined organizations and roles to separate the management functions of the Company and the business execution functions of group companies. Our management of group companies is based on the principles of freedom, independence, and self-responsibility and we seek to limit our involvement in the execution of their businesses. At the same time, we
are primarily responsible for determining the business policies and strategies of the corporate group, pursuing growth strategies, and monitoring the business execution of group companies through auditing and supervision. In response to recent problems involving violations of emission standards and the amount of wastepaper pulp used in our recycled paper products, we established the CSR Division and are working to bolster group governance through checks and balances exercised by the Board of Corporate Auditors, Internal Auditing Office, and CSR Division. We also seek to use the relocation of main group companies to a new head office in May 2009 as an opportunity to speed up decision making processes, strengthen our organization, consolidate the head office functions of group companies, and raise our efficiency even further.
Board of Directors The Company’s Board of Directors comprises 10 internal directors as of March 31, 2009. It is responsible for determining the basic management policies of the Company and group companies, deciding on matters pertaining to laws and regulations, the articles of incorporation, and other important management issues, and monitoring the executive aspects of group companies.
Group Management Committee The Group Management Committee is subordinate to the Board of Directors and comprises all directors and standing corporate auditors. It is responsible for deliberating on the basic management policies and strategies of the Company and the overall group and on important matters related to the business execution of group companies.
Board of Corporate Auditors The Company established a Board of Corporate Auditors to monitor the Company’s management. Two of the four auditors comprising the board are outside auditors responsible for ensuring and strengthening the board’s monitoring and auditing functions from a third-party perspective.
Internal Auditing Office The Internal Auditing Office is responsible for internal auditing at the Company. Its audits ensure that the various management policies of group companies are consistent with the policy directives of the Company. Additionally, the Internal Control Group within the Internal Auditing Office runs and evaluates an internal control and reporting system according to the Financial Products Exchange Law, which has been applied since April 2008.
Corporate Governance
50 Corporate Governance / CSR 58 Directors and Corporate Auditors
Corporate Governance / CSR
Governance Structure
Basic Approach
5150
C o r p o r a t e G o v e r n a n c e / C S R
organizations, is carefully examining the laws and regulations as they apply to our business, expanding oversight with respect to the environment and operational safety in cooperation with our divisions, and moving the entire group toward strict adherence to current applicable laws and regulations. We aim to raise the level of compliance in our operations and corporate culture by further enhancing awareness among group employees through compliance training and by promoting Helpline, our internal whistle-blowing program.
Mislabeling of wastepaper pulp content1) Modifications to order-acceptance workflow
One of the factors in this incident was that our sales force would accept orders without confirming first that the orders could be fulfilled within specified content and quality requirements. We have therefore modified our order-acceptance workflow to include confirmations from all relevant departments, including quality control, procurement, and production.
2) Wastepaper pulp content controls Another substantial process management problem was a lack of mechanisms for information sharing and control among relevant departments on the use of wastepaper pulp content as a quality criterion. In response, we have clearly positioned wastepaper pulp content among our quality criteria. To inculcate strict adherence to this, we have prepared a uniform in-house quality specifications manual and begun operating in accordance with it. The wastepaper pulp content of finished products is also now inspected for compliance with content specifications by each mill and by the quality control department of the headquarters.
3) Procedure manual and third-party inspections We have documented procedures from order acceptance decision-making to measurement of quality criteria, including wastepaper pulp content, into a manual that guides operations and controls at our headquarters, branch offices, and mills. We have implemented internal oversight of these procedures, as well as regular third-party oversight. We are also ensuring that corrective action is taken reliably in response to any violations discovered. In fiscal 2008, Nippon Paper Group employed SGS Japan, which is certified by the Forest Stewardship Council and other certification bodies, to act as a third-party auditor to oversee the compliance of group companies that make products containing wastepaper pulp—Nippon Paper Industries and Nippon Daishowa Paperboard—with our established operating and control procedures. Completing incorporation of the procedures above into our ISO 14001 environmental management system, we intend to rigorously maintain the operating procedures and inspection systems we have now established. Our aim is to ensure that we are consistently providing products in which our customers can have confidence.
Exceeding smoke-emission limits (Nippon Paper Industries)1) Plant and operational measures
We have revised our operating and control manual based on newly issued compliance guidelines for soot and smoke emitting facilities. We have ensured that manuals have been updated at all mills and conducted emergency response drills. At each mill, we have introduced environmental monitoring apparatus and early-warning systems while also adding extra personnel (besides the operating crews) for monitoring to enhance oversight. We have also installed interlock systems on 14 boilers. These systems automatically shut down the boilers whenever emission density reaches abnormal levels.
CSR
Nippon Paper Group provides broad-ranging support for industry, culture, and local communities, and we place a high priority on ensuring that our enterprises contribute to a healthy society through environmental protection, workforce health and safety, disaster prevention, and high standards of ethical behavior. Unfortunately, two instances have emerged in which members of the Group did not meet these standards—exceeding smoke emission limits and improperly labeling the percentage of wastepaper pulp in certain products. Regaining the lost trust is now a top management priority. We plan to steadily improve our CSR measures, carefully ascertaining what is asked of us and giving priority to regular communication with stakeholders.
Strengthening compliance In July 2007, some of Nippon Paper Industries’ mills were found to have exceeded maximum emission levels stipulated in the Air Pollution Control Law and to have falsified related data. In January 2008, it also came to light that group companies had manufactured and sold recycled paper products using less-than-specified levels of wastepaper pulp. Among the issues that allowed these lapses, we have identified a lack of awareness of compliance requirements. To prevent recurrences, we are rebuilding our compliance system and deepening our compliance training programs. We established our CSR Division in June 2008, strengthening our frameworks for controlling compliance on production lines. The CSR Division, in conjunction with outside
Corporate Governance Structure
52 53
C o r p o r a t e G o v e r n a n c e / C S R
2) Control measures We have established environmental control teams at each mill with the aim of separating operation and control functions and deepening our environmental management capabilities. We have also introduced at the headquarters an environmental information management system, which enables hourly monitoring of the status of boilers at each mill 24 hours a day. Systems to prevent the falsification of daily report data have also been installed at all mills.
3) Thorough employee training We are taking numerous measures to improve employee awareness and participation, including compliance programs tailored to classified employee training, workshops and lectures on applicable laws and regulations at periodic meetings for power station staff, workplace meetings, and a Teian suggestion program that encourages employees to propose new ideas.
Priority environmental initiatives We established concrete group-wide environmental performance targets in our Green Action Plan 2010 (adopted March 2007, revised April 2008), which is based on the philosophy and fundamental policy stated in our Charter on the Environment (adopted March 2001, revised March 2007). We next report on progress in our priority environmental initiatives.
1. Helping counter global warming Amid concern about our impact on global warming, we have adopted three main approaches to reducing carbon dioxide emissions: reducing fossil fuel consumption by boosting energy efficiency, shifting to non-fossil energy sources, and fixing carbon through afforestation.1) Reducing fossil fuel consumption by boosting energy efficiency
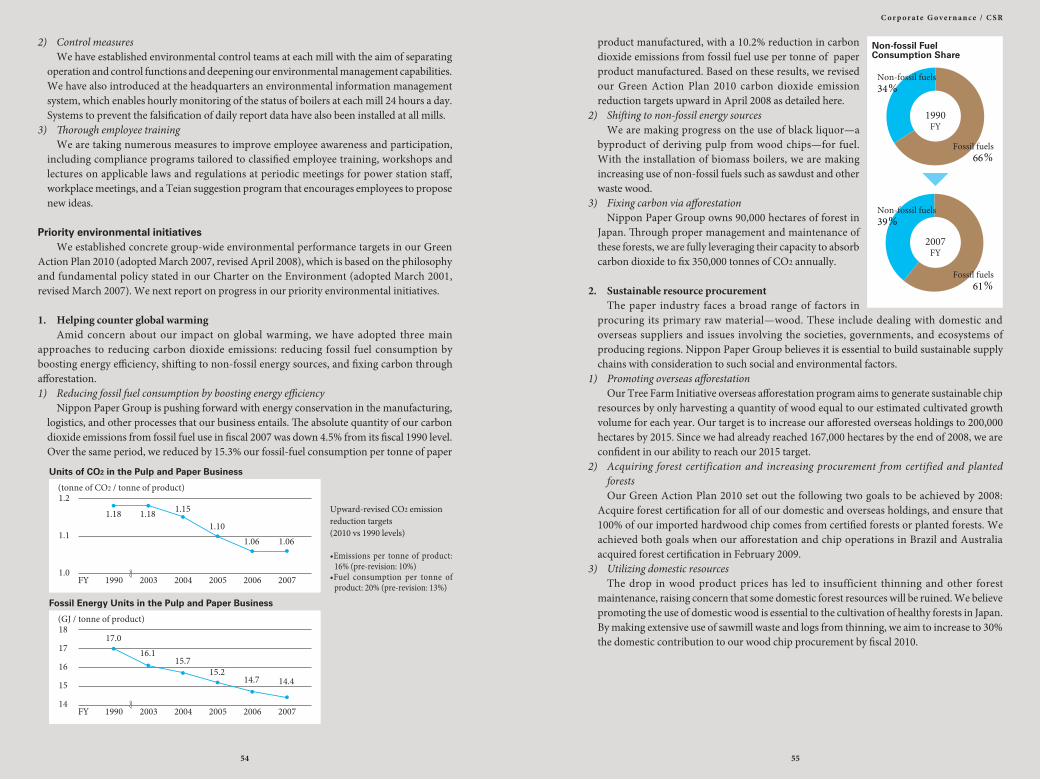
Nippon Paper Group is pushing forward with energy conservation in the manufacturing, logistics, and other processes that our business entails. The absolute quantity of our carbon dioxide emissions from fossil fuel use in fiscal 2007 was down 4.5% from its fiscal 1990 level. Over the same period, we reduced by 15.3% our fossil-fuel consumption per tonne of paper
product manufactured, with a 10.2% reduction in carbon dioxide emissions from fossil fuel use per tonne of paper product manufactured. Based on these results, we revised our Green Action Plan 2010 carbon dioxide emission reduction targets upward in April 2008 as detailed here.
2) Shifting to non-fossil energy sources We are making progress on the use of black liquor—a byproduct of deriving pulp from wood chips—for fuel. With the installation of biomass boilers, we are making increasing use of non-fossil fuels such as sawdust and other waste wood.
3) Fixing carbon via afforestation Nippon Paper Group owns 90,000 hectares of forest in Japan. Through proper management and maintenance of these forests, we are fully leveraging their capacity to absorb carbon dioxide to fix 350,000 tonnes of CO2 annually.
2. Sustainable resource procurement The paper industry faces a broad range of factors in procuring its primary raw material—wood. These include dealing with domestic and overseas suppliers and issues involving the societies, governments, and ecosystems of producing regions. Nippon Paper Group believes it is essential to build sustainable supply chains with consideration to such social and environmental factors.
1) Promoting overseas afforestation Our Tree Farm Initiative overseas afforestation program aims to generate sustainable chip resources by only harvesting a quantity of wood equal to our estimated cultivated growth volume for each year. Our target is to increase our afforested overseas holdings to 200,000 hectares by 2015. Since we had already reached 167,000 hectares by the end of 2008, we are confident in our ability to reach our 2015 target.
2) Acquiring forest certification and increasing procurement from certified and planted forests
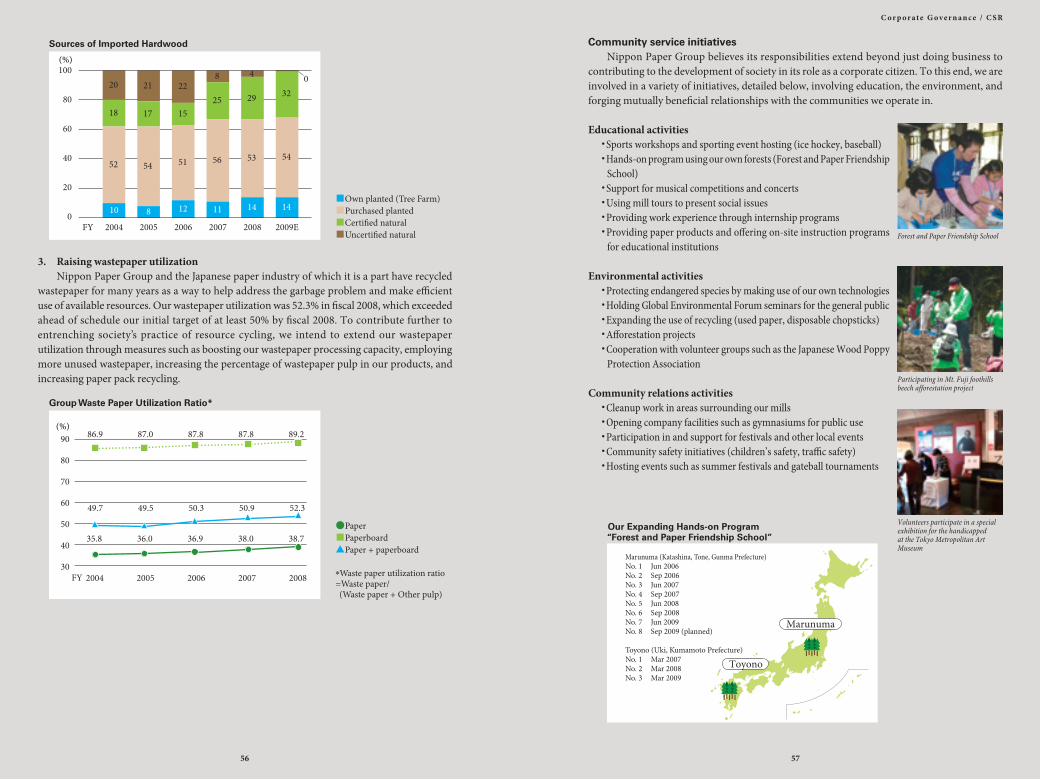
Our Green Action Plan 2010 set out the following two goals to be achieved by 2008: Acquire forest certification for all of our domestic and overseas holdings, and ensure that 100% of our imported hardwood chip comes from certified forests or planted forests. We achieved both goals when our afforestation and chip operations in Brazil and Australia acquired forest certification in February 2009.
3) Utilizing domestic resources The drop in wood product prices has led to insufficient thinning and other forest maintenance, raising concern that some domestic forest resources will be ruined. We believe promoting the use of domestic wood is essential to the cultivation of healthy forests in Japan. By making extensive use of sawmill waste and logs from thinning, we aim to increase to 30% the domestic contribution to our wood chip procurement by fiscal 2010.
Upward-revised CO2 emissionreduction targets(2010 vs 1990 levels)
•Emissions per tonne of product: 16% (pre-revision: 10%)
•Fuel consumption per tonne of product: 20% (pre-revision: 13%)
Fossil Energy Units in the Pulp and Paper Business
Units of CO2 in the Pulp and Paper Business
Non-fossil FuelConsumption Share
54 55
C o r p o r a t e G o v e r n a n c e / C S R
Community service initiatives Nippon Paper Group believes its responsibilities extend beyond just doing business to contributing to the development of society in its role as a corporate citizen. To this end, we are involved in a variety of initiatives, detailed below, involving education, the environment, and forging mutually beneficial relationships with the communities we operate in.
Educational activities ・Sports workshops and sporting event hosting (ice hockey, baseball) ・Hands-on program using our own forests (Forest and Paper Friendship
School) ・Support for musical competitions and concerts ・Using mill tours to present social issues ・Providing work experience through internship programs ・Providing paper products and offering on-site instruction programs
for educational institutions
Environmental activities ・Protecting endangered species by making use of our own technologies ・Holding Global Environmental Forum seminars for the general public ・Expanding the use of recycling (used paper, disposable chopsticks) ・Afforestation projects ・Cooperation with volunteer groups such as the Japanese Wood Poppy
Protection Association
Community relations activities ・Cleanup work in areas surrounding our mills ・Opening company facilities such as gymnasiums for public use ・Participation in and support for festivals and other local events ・Community safety initiatives (children’s safety, traffic safety) ・Hosting events such as summer festivals and gateball tournaments
Volunteers participate in a special exhibition for the handicapped at the Tokyo Metropolitan Art Museum
Participating in Mt. Fuji foothills beech afforestation project
Forest and Paper Friendship School
3. Raising wastepaper utilization Nippon Paper Group and the Japanese paper industry of which it is a part have recycled wastepaper for many years as a way to help address the garbage problem and make efficient use of available resources. Our wastepaper utilization was 52.3% in fiscal 2008, which exceeded ahead of schedule our initial target of at least 50% by fiscal 2008. To contribute further to entrenching society’s practice of resource cycling, we intend to extend our wastepaper utilization through measures such as boosting our wastepaper processing capacity, employing more unused wastepaper, increasing the percentage of wastepaper pulp in our products, and increasing paper pack recycling.
Our Expanding Hands-on Program“Forest and Paper Friendship School”
Marunuma (Katashina, Tone, Gunma Prefecture)No. 1 Jun 2006No. 2 Sep 2006No. 3 Jun 2007No. 4 Sep 2007No. 5 Jun 2008No. 6 Sep 2008No. 7 Jun 2009No. 8 Sep 2009 (planned)
Toyono (Uki, Kumamoto Prefecture)No. 1 Mar 2007No. 2 Mar 2008No. 3 Mar 2009
Sources of Imported Hardwood
■Own planted (Tree Farm)■Purchased planted■Certified natural■Uncertified natural
Group Waste Paper Utilization Ratio*
●Paper■Paperboard▲Paper + paperboard
*Waste paper utilization ratio=Waste paper/(Waste paper + Other pulp)
56 57
C o r p o r a t e G o v e r n a n c e / C S R
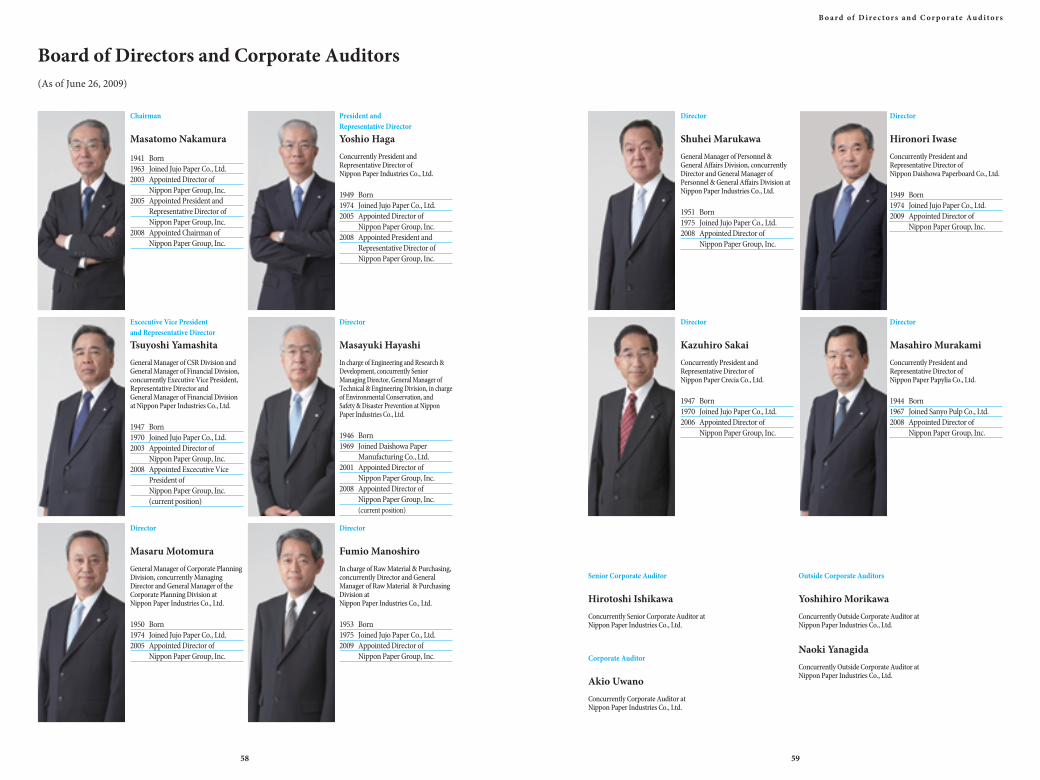
Board of Directors and Corporate Auditors (As of June 26, 2009)
Chairman
Masatomo Nakamura
1941 Born1963 Joined Jujo Paper Co., Ltd.2003 Appointed Director of Nippon Paper Group, Inc.2005 Appointed President and Representative Director of Nippon Paper Group, Inc.2008 Appointed Chairman of Nippon Paper Group, Inc.
President and Representative Director
Yoshio HagaConcurrently President and Representative Director of Nippon Paper Industries Co., Ltd.
1949 Born1974 Joined Jujo Paper Co., Ltd.2005 Appointed Director of Nippon Paper Group, Inc.2008 Appointed President and Representative Director of Nippon Paper Group, Inc.
Excecutive Vice Presidentand Representative Director
Tsuyoshi YamashitaGeneral Manager of CSR Division and General Manager of Financial Division, concurrently Executive Vice President, Representative Director andGeneral Manager of Financial Division at Nippon Paper Industries Co., Ltd.
1947 Born1970 Joined Jujo Paper Co., Ltd.2003 Appointed Director of Nippon Paper Group, Inc.2008 Appointed Excecutive Vice President of Nippon Paper Group, Inc. (current position)
Director
Masayuki HayashiIn charge of Engineering and Research & Development, concurrently Senior Managing Director, General Manager of Technical & Engineering Division, in charge of Environmental Conservation, and Safety & Disaster Prevention at Nippon Paper Industries Co., Ltd.
1946 Born1969 Joined Daishowa Paper Manufacturing Co., Ltd.2001 Appointed Director of Nippon Paper Group, Inc.2008 Appointed Director of Nippon Paper Group, Inc. (current position)
Director
Shuhei MarukawaGeneral Manager of Personnel & General Affairs Division, concurrently Director and General Manager of Personnel & General Affairs Division at Nippon Paper Industries Co., Ltd.
1951 Born1975 Joined Jujo Paper Co., Ltd.2008 Appointed Director of Nippon Paper Group, Inc.
Director
Hironori IwaseConcurrently President and Representative Director of Nippon Daishowa Paperboard Co., Ltd.
1949 Born1974 Joined Jujo Paper Co., Ltd.2009 Appointed Director of Nippon Paper Group, Inc.
Director
Kazuhiro SakaiConcurrently President and Representative Director of Nippon Paper Crecia Co., Ltd.
1947 Born1970 Joined Jujo Paper Co., Ltd.2006 Appointed Director of Nippon Paper Group, Inc.
Director
Masahiro MurakamiConcurrently President and Representative Director of Nippon Paper Papylia Co., Ltd.
1944 Born1967 Joined Sanyo Pulp Co., Ltd.2008 Appointed Director of Nippon Paper Group, Inc.
Director
Masaru MotomuraGeneral Manager of Corporate Planning Division, concurrently Managing Director and General Manager of the Corporate Planning Division at Nippon Paper Industries Co., Ltd.
1950 Born1974 Joined Jujo Paper Co., Ltd.2005 Appointed Director of Nippon Paper Group, Inc.
Director
Fumio ManoshiroIn charge of Raw Material & Purchasing, concurrently Director and General Manager of Raw Material & Purchasing Division atNippon Paper Industries Co., Ltd.
1953 Born1975 Joined Jujo Paper Co., Ltd.2009 Appointed Director of Nippon Paper Group, Inc.
Senior Corporate Auditor
Hirotoshi IshikawaConcurrently Senior Corporate Auditor at Nippon Paper Industries Co., Ltd.
Corporate Auditor
Akio UwanoConcurrently Corporate Auditor at Nippon Paper Industries Co., Ltd.
Outside Corporate Auditors
Yoshihiro MorikawaConcurrently Outside Corporate Auditor at Nippon Paper Industries Co., Ltd.
Naoki YanagidaConcurrently Outside Corporate Auditor at Nippon Paper Industries Co., Ltd.
58 59
B o a r d o f D i r e c t o r s a n d C o r p o r a t e Au d i t o r s
Financial Section
62 Consolidated Five-Year Summary 64 Consolidated Financial Review 74 Consolidated Balance Sheets 76 Consolidated Statements of Operations 77 Consolidated Statements of Changes in Net Assets 78 Consolidated Statements of Cash Flows 80 Notes to the Consolidated Financial Statements 111 Report of Independent Auditors
6160

Consolidated Five-Year SummaryMillions of yen Thousands of US dollars (Note)
FY2004April 1, 2004–March 31, 2005
FY2005April 1, 2005–March 31, 2006
FY2006April 1, 2006–March 31, 2007
FY2007April 1, 2007–March 31, 2008
FY2008April 1, 2008–March 31, 2009
FY2008April 1, 2008–March 31, 2009
Net sales ¥ 1,179,696 ¥ 1,152,166 ¥ 1,175,264 Cost of sales 914,384 920,819 948,852Operating income 65,231 48,391 44,655Ordinary income 62,801 49,403 47,088Net (loss) income 24,350 17,192 22,952Total assets 1,529,975 1,492,427 1,565,978Total current assets 443,177 412,657 456,620Property, plant and equipment, net 843,346 811,110 841,287Total investments and other assets 243,450 268,659 268,069Li abilities 1,063,453 1,029,787 1,095,456Net assets 466,521 462,639 470,521Interest-bearing debt 766,139 692,080 738,230Depreciation 74,971 70,106 67,049Capital investment 55,353 69,687 102,961Free cash flow 82,132 91,655 (31,668)
Per share data Yen U.S. dollars
Net (loss) income
Basic 21,996.96 15,760.27 21,570.23Diluted 21,107.50 15,123.82 —
Net assets 404,369.11 413,525.41 421,626.81Cash dividends 8,000.00 8,000.00 8,000.00
Ratios
Operating income to net sales (%) 5.5 4.2 3.8Net (loss) income to net sales (%) 2.1 1.5 2.0Return on equity (ROE) (%) 5.6 3.9 5.2Return on invested capital (ROIC) (%) 5.9 5.0 4.6Equity ratio (%) 28.9 29.5 28.6Return on assets (ROA) (%) 4.7 3.8 3.5Debt/equity ratio (times) 1.7 1.5 1.6Number of employees 13,774 12,798 12,584
Nippon Paper Group, Inc. and Consolidated Subsidiaries
Note: Amounts in US dollars are included solely for convenience and are translated at a rate of ¥ 98/$, the approximate rate of exchange on March 31, 2009.
• Interest-bearing debt = Short-term borrowings + Long-term debt• Free cash flow = Cash flows from operating activities + Cash flows from investing activities• Return on equity (ROE) = Net (loss) income / Average shareholders’ equity and valuation, translation adjustments and other × 100• Return on invested capital (ROIC) = (Ordinary income + Interest expense) / (Shareholders’ equity and valuation, translation adjustments and other + Interest-bearing debt) × 100• Return on assets (ROA) = (Ordinary income + Interest expense) / Total assets × 100• Debt / Equity ratio = (Interest-bearing debt – Cash and cash equivalents) / Shareholders’ equity and valuation, translation adjustments and other• We conducted a split of shares of common stock (a 100-to-1 split) effective as of January 4, 2009
62 63
F i n a n c i a l S e c t i o n
¥ 1,211,682969,466
32,83432,800
5,6611,625,571
485,822892,012247,736
1,145,812479,758785,322
74,791121,190(44,491)
5,200.50—
407,492.968,000.00
2.70.51.33.4
28.02.71.7
13,666
$ 12,123,8379,780,245
203,582183,102
(238,061)15,224,765
4,449,1948,693,0712,082,480
10,892,6024,332,1538,003,398
849,939662,653193,755
(2.13)—
36.750.82
¥ 1,188,136958,464
19,95117,944
(23,330)1,492,027
436,021851,921204,083
1,067,475424,551784,333
83,29464,94018,988
(208.60)—
3,601.7180.00
1.7(2.0)(5.4)2.4
27.01.91.9
13,088

Consolidated Financial ReviewNippon Paper Group, Inc. and Consolidated Subsidiaries
SummaryThe Japanese economy struggled in fiscal 2008, affected by the global economic downturn
prompted by the financial crisis. Corporate earnings fell sharply, capital investment decreased, and the employment environment worsened.
In the pulp and paper industry, paper production and shipments were down significantly from the previous fiscal year as a result of large production cutbacks in response to falling demand. The spiking of input prices during the first half of the fiscal year put downward pressure on earnings despite their return to more favorable levels in the year’s second half.
At Nippon Paper Group, we adapted to these circumstances by working hard to realize the benefits of large capital investment, reduce costs through cost improvements and reductions in overhead, and raise product prices. We were nevertheless unable to compensate for a sharp decline in sales volume started during second half of the year and the increases in raw-material prices.
We also booked several extraordinary losses, including production restructuring charges in response to rapidly falling demand, stock valuation losses, and fixed asset impairment losses.
Net Sales, Cost of Sales, Expenses, and ProfitsIn these circumstances, consolidated net sales declined by ¥23,545 million (1.9%) year-on-year
to ¥1,188,136 million in fiscal 2008.
Cost of sales was ¥958,464 million, accounting for 80.7% of sales. Selling, general and
administrative (SG&A) expenses came to ¥209,721 million, comprising 17.7% of sales. Operating
income fell 39.2% year-on-year to ¥19,951 million and the operating profit margin declined to 1.7%,
down 1.0 percentage points from fiscal 2007.
Other income and expenses came to a net expense of ¥41,844 million. The main income item
was a net gain from the sale of investment securities of ¥464 million, and the main expense items
were interest expenses of ¥10,970 million, business restructuring loss of ¥4,997 million, and loss on
impairment of fixed assets of ¥ 6,012 million, and losses from the reconfiguration of the production
structure of ¥10,820 million.
Loss before income taxes and minority interests in consolidated subsidiaries fell to ¥21,893
million, and net loss also fell to ¥23,330 million.
Net loss per share was ¥208.60, but in keeping with our basic policy of maintaining a stable
dividend to the extent possible, we paid out a dividend of ¥80 per share for fiscal 2008 (this factors in
the January 4, 2009 one-to-100 common stock split).
Review of OperationsPulp and Paper
Newsprint sales volume decreased on a decline in advertising. Volumes of non-newsprint paper grades were down for nearly all products, particularly coated paper, affected by lower demand for use in leaflets, catalogs, and other commercial printing.
Paperboard was hurt by falling demand caused by the rapid economic downturn as sales volumes for containerboard and other products decreased.
In household paper products, we increased market share, due partly to revamping lotion tissue, a high value-added product, but sales volumes decreased from the previous fiscal year.
Although the group cut costs and raised prices for paper, paperboard, and household paper products, sales declined 1.0% year-on-year to ¥940,297 million and operating profit fell 37.8% to ¥12,673 million on the negative impacts of raw-material and fuel price hikes and large-scale production cuts.
Paper-Related Sales volume of liquid packaging cartons decreased from the previous fiscal year due to a
shrinking market and intensifying competition. Chemical products, dissolving pulp, and functional
materials also faced a difficult business environment due to the recession, and volumes fell sharply
during the fiscal second half, resulting in a 9.3% year-on-year decline in sales to ¥92,647 million.
Operating profit fell 49.9% year-on-year to ¥2,165 million, despite cost-cutting measures and efforts
to pass on higher input and fuel costs through price increases.
Housing and Construction Materials Housing and construction materials had weak sales as a result of rapidly falling demand for
housing materials, lumber, and other products and growing uncertainty in the credit markets. Civil engineering continued to operate in a difficult business environment. Division sales fell 14.7% year-on-year to ¥70,064 million, as did operating profit by 53.9% to ¥1,078 million.
Other Beverages faced a more severe business environment as green tea sales slumped, growth for
mineral waters slowed, and competition for sales between companies persisted. The economic downturn also impacted the transport, leisure, and other businesses. Sales were up 10.1% year-on-year to ¥85,126 million, but operating profit fell 30.5% to ¥4,034 million.
64 65
F i n a n c i a l S e c t i o n

Financial PositionConsolidated total assets at the end of fiscal 2008 decreased ¥133,544 million to ¥1,492,027
million from ¥1,625,571 million at the end of fiscal 2007.
Current assets decreased ¥49,800 million year-on-year to ¥436,021 million. The main
contributing factor was receivable, which decreased from ¥276,937 million to ¥224,707 million.
Tangible fixed assets decreased ¥40,090 million to ¥851,921 million, mainly because of
depreciation and loss on impairment of fixed assets.
Investments and other assets declined by ¥43,652 million to ¥204,083 million chiefly on
declines in investment securities.
Current liabilities and fixed liabilities decreased by ¥78,337 million to ¥1,067,475 million.
■ Pulp and Paper Net sales and operating income ratio
■ Paper-Related Net sales and operating income ratio
■ Housing and Construction Materials
Net sales and operating income ratio
66 67
F i n a n c i a l S e c t i o n
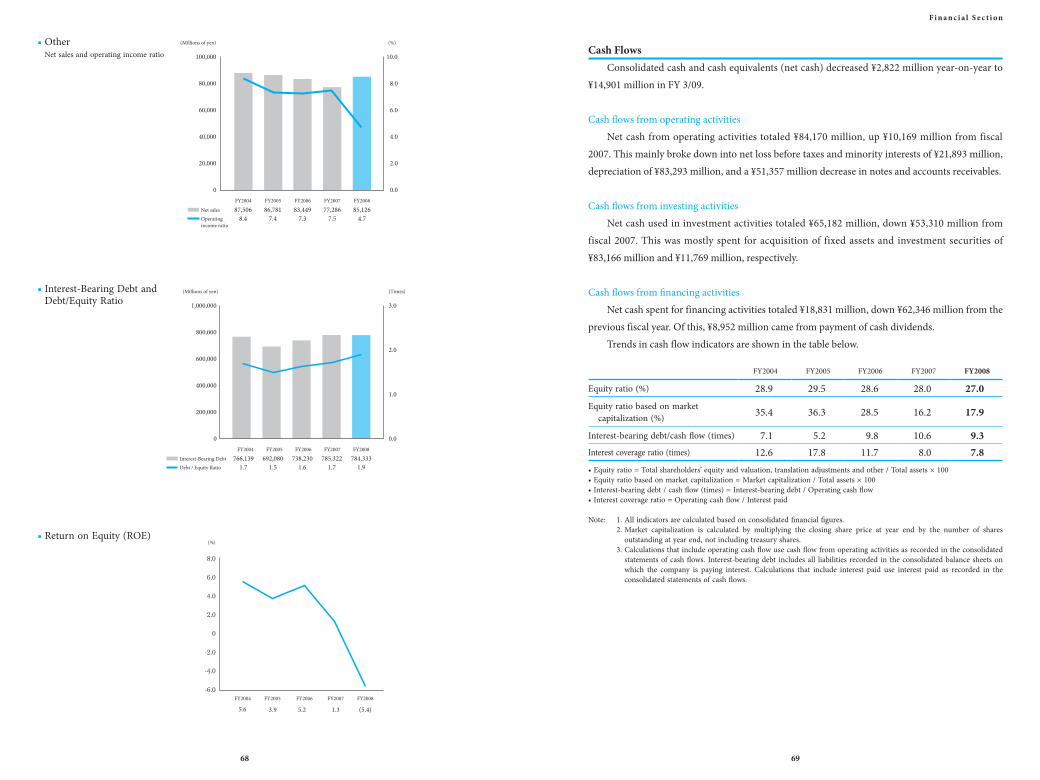
Cash FlowsConsolidated cash and cash equivalents (net cash) decreased ¥2,822 million year-on-year to
¥14,901 million in FY 3/09.
Cash flows from operating activitiesNet cash from operating activities totaled ¥84,170 million, up ¥10,169 million from fiscal
2007. This mainly broke down into net loss before taxes and minority interests of ¥21,893 million, depreciation of ¥83,293 million, and a ¥51,357 million decrease in notes and accounts receivables.
Cash flows from investing activitiesNet cash used in investment activities totaled ¥65,182 million, down ¥53,310 million from
fiscal 2007. This was mostly spent for acquisition of fixed assets and investment securities of ¥83,166 million and ¥11,769 million, respectively.
Cash flows from financing activitiesNet cash spent for financing activities totaled ¥18,831 million, down ¥62,346 million from the
previous fiscal year. Of this, ¥8,952 million came from payment of cash dividends.Trends in cash flow indicators are shown in the table below.
FY2004 FY2005 FY2006 FY2007 FY2008
Equity ratio (%) 28.9 29.5 28.6 28.0 27.0Eq uity ratio based on market
capitalization (%) 35.4 36.3 28.5 16.2 17.9
Interest-bearing debt/cash flow (times) 7.1 5.2 9.8 10.6 9.3Interest coverage ratio (times) 12.6 17.8 11.7 8.0 7.8• Equity ratio = Total shareholders’ equity and valuation, translation adjustments and other / Total assets × 100• Equity ratio based on market capitalization = Market capitalization / Total assets × 100• Interest-bearing debt / cash flow (times) = Interest-bearing debt / Operating cash flow• Interest coverage ratio = Operating cash flow / Interest paid Note: 1. All indicators are calculated based on consolidated financial figures. 2. Market capitalization is calculated by multiplying the closing share price at year end by the number of shares
outstanding at year end, not including treasury shares. 3. Calculations that include operating cash flow use cash flow from operating activities as recorded in the consolidated
statements of cash flows. Interest-bearing debt includes all liabilities recorded in the consolidated balance sheets on which the company is paying interest. Calculations that include interest paid use interest paid as recorded in the consolidated statements of cash flows.
■ Interest-Bearing Debt and Debt/Equity Ratio
■ Return on Equity (ROE)
■ Other Net sales and operating income ratio
68 69
F i n a n c i a l S e c t i o n
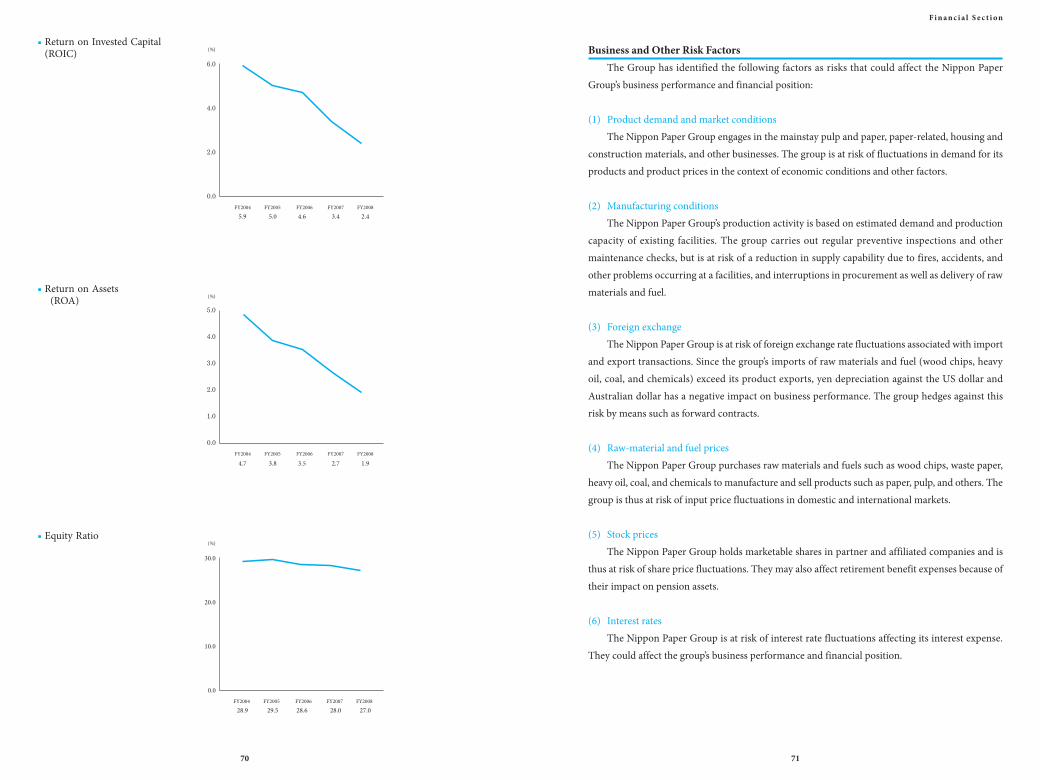
Business and Other Risk FactorsThe Group has identified the following factors as risks that could affect the Nippon Paper
Group’s business performance and financial position:
(1) Product demand and market conditions The Nippon Paper Group engages in the mainstay pulp and paper, paper-related, housing and construction materials, and other businesses. The group is at risk of fluctuations in demand for its products and product prices in the context of economic conditions and other factors.
(2) Manufacturing conditions The Nippon Paper Group’s production activity is based on estimated demand and production capacity of existing facilities. The group carries out regular preventive inspections and other maintenance checks, but is at risk of a reduction in supply capability due to fires, accidents, and other problems occurring at a facilities, and interruptions in procurement as well as delivery of raw materials and fuel.
(3) Foreign exchange The Nippon Paper Group is at risk of foreign exchange rate fluctuations associated with import
and export transactions. Since the group’s imports of raw materials and fuel (wood chips, heavy oil, coal, and chemicals) exceed its product exports, yen depreciation against the US dollar and Australian dollar has a negative impact on business performance. The group hedges against this risk by means such as forward contracts.
(4) Raw-material and fuel pricesThe Nippon Paper Group purchases raw materials and fuels such as wood chips, waste paper,
heavy oil, coal, and chemicals to manufacture and sell products such as paper, pulp, and others. The group is thus at risk of input price fluctuations in domestic and international markets.
(5) Stock pricesThe Nippon Paper Group holds marketable shares in partner and affiliated companies and is
thus at risk of share price fluctuations. They may also affect retirement benefit expenses because of their impact on pension assets.
(6) Interest rates The Nippon Paper Group is at risk of interest rate fluctuations affecting its interest expense.
They could affect the group’s business performance and financial position.
■ Return on Assets (ROA)
■ Equity Ratio
■ Return on Invested Capital (ROIC)
70 71
F i n a n c i a l S e c t i o n
(7) Overseas businessesThe Nippon Paper Group manufactures pulp and paper and operates forestry plantations and
other businesses overseas, mainly in North America, Scandinavia, China, and Australia. While the group takes utmost care to minimize overseas business risk, unforeseen circumstances in those locations may affect the group’s business performance and financial position.
(8) LitigationThe Nippon Paper Group takes utmost care to comply with laws and regulations in the course
of doing business, but is nonetheless at risk of litigation associated with criminal and civil law, antitrust law, product liability law, intellectual property rights, and environmental and labor issues.
(9) Fixed asset impairmentThe Nippon Paper Group owns fixed assets such as production facilities and land and is at risk
of a fall in the value of these assets.
(10) Natural disastersThe Nippon Paper Group is exposed to the risk of major natural disasters such as earthquakes
which, if they occur near its operation bases, may cause damage to facilities and cause it to incur restoration costs and opportunity loss.
(11) Credit RiskThe Nippon Paper Group takes care of the credit risk, but collection of claim cause from
aggravation of operating or bankruptcy of customers may affect the group’s business performance and financial position.
(12) Other risks associated with changes in business conditions, etc.The Nippon Paper Group is subject to the risk of changes in business and economic conditions
and other similar circumstances arising from contingencies, which may affect the group’s business performance and financial position.
72 73
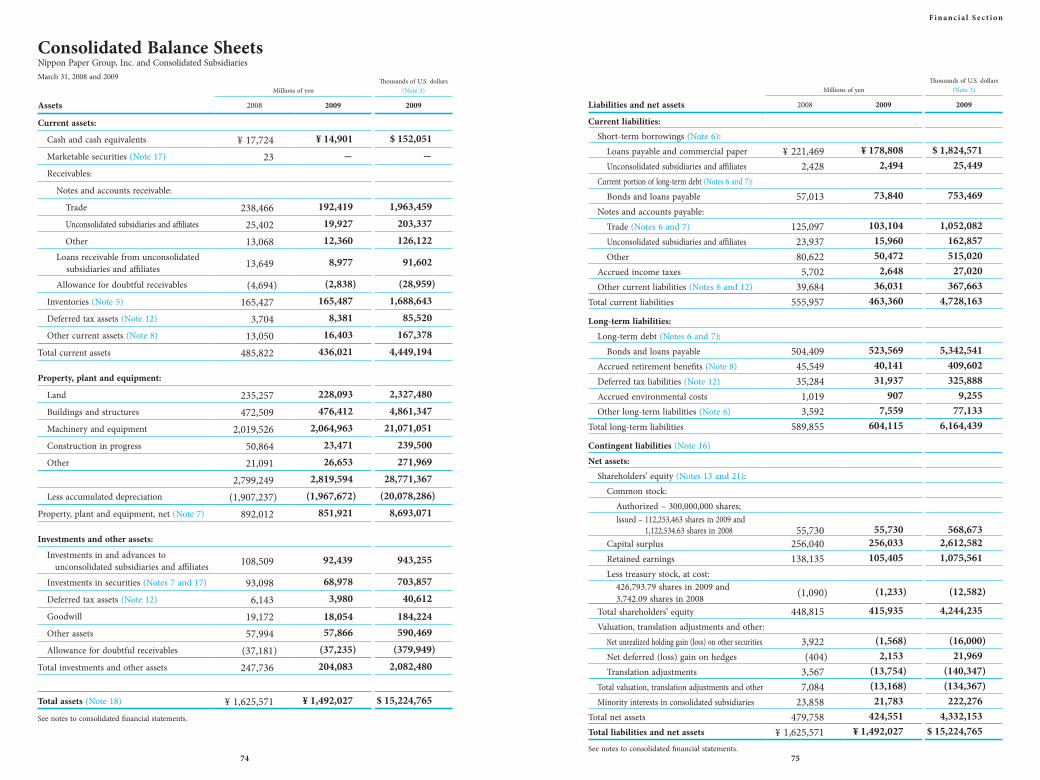
Consolidated Balance SheetsNippon Paper Group, Inc. and Consolidated Subsidiaries
Millions of yenThousands of U.S. dollars
(Note 3)
Assets 2008 2009 2009
Current assets:
Cash and cash equivalents
Marketable securities (Note 17)
Receivables:
Notes and accounts receivable:
Trade
Unconsolidated subsidiaries and affiliates
Other
Lo ans receivable from unconsolidated subsidiaries and affiliates
Allowance for doubtful receivables
Inventories (Note 5)
Deferred tax assets (Note 12)
Other current assets (Note 8)
Total current assets
Property, plant and equipment:
Land
Buildings and structures
Machinery and equipment
Construction in progress
Other
Less accumulated depreciation
Property, plant and equipment, net (Note 7)
Investments and other assets:
In vestments in and advances to unconsolidated subsidiaries and affiliates
Investments in securities (Notes 7 and 17)
Deferred tax assets (Note 12)
Goodwill
Other assets
Allowance for doubtful receivables
Total investments and other assets
Total assets (Note 18)
See notes to consolidated financial statements.
Millions of yenThousands of U.S. dollars
(Note 3)
Liabilities and net assets 2008 2009 2009
Current liabilities:Short-term borrowings (Note 6):
Loans payable and commercial paperUnconsolidated subsidiaries and affiliates
Current portion of long-term debt (Notes 6 and 7):Bonds and loans payable
Notes and accounts payable:Trade (Notes 6 and 7)Unconsolidated subsidiaries and affiliatesOther
Accrued income taxesOther current liabilities (Notes 6 and 12)
Total current liabilities
Long-term liabilities:
Long-term debt (Notes 6 and 7):Bonds and loans payable
Accrued retirement benefits (Note 8)Deferred tax liabilities (Note 12)Accrued environmental costsOther long-term liabilities (Note 6)
Total long-term liabilities
Contingent liabilities (Note 16)
Net assets:Shareholders’ equity (Notes 13 and 21):
Common stock:Authorized – 300,000,000 shares;Issued – 112,253,463 shares in 2009 and
1,122,534.63 shares in 2008Capital surplusRetained earningsLess treasury stock, at cost:
426,793.79 shares in 2009 and3,742.09 shares in 2008
Total shareholders’ equityValuation, translation adjustments and other:
Net unrealized holding gain (loss) on other securitiesNet deferred (loss) gain on hedgesTranslation adjustments
Total valuation, translation adjustments and otherMinority interests in consolidated subsidiaries
Total net assetsTotal liabilities and net assets
See notes to consolidated financial statements.
March 31, 2008 and 2009
74 75
F i n a n c i a l S e c t i o n
¥ 17,72423
238,46625,40213,068
13,649
(4,694)165,427
3,70413,050
485,822
235,257472,509
2,019,52650,86421,091
2,799,249(1,907,237)
892,012
108,509
93,0986,143
19,17257,994
(37,181)247,736
¥ 1,625,571
¥ 221,4692,428
57,013
125,09723,93780,622
5,70239,684
555,957
504,40945,54935,284
1,0193,592
589,855
55,730256,040138,135
(1,090)
448,815
3,922(404)
3,5677,084
23,858479,758
¥ 1,625,571
¥ 178,8082,494
73,840
103,10415,96050,472
2,64836,031
463,360
523,56940,14131,937
9077,559
604,115
55,730256,033105,405
(1,233)
415,935
(1,568)2,153
(13,754)(13,168)21,783
424,551¥ 1,492,027
$ 1,824,57125,449
753,469
1,052,082162,857515,020
27,020367,663
4,728,163
5,342,541409,602325,888
9,25577,133
6,164,439
568,6732,612,5821,075,561
(12,582)
4,244,235
(16,000)21,969
(140,347)(134,367)222,276
4,332,153$ 15,224,765
¥ 14,901-
192,41919,92712,360
8,977
(2,838)165,487
8,38116,403
436,021
228,093476,412
2,064,96323,47126,653
2,819,594(1,967,672)
851,921
92,439
68,9783,980
18,05457,866
(37,235)204,083
¥ 1,492,027
$ 152,051-
1,963,459203,337126,122
91,602
(28,959)1,688,643
85,520167,378
4,449,194
2,327,4804,861,347
21,071,051239,500271,969
28,771,367(20,078,286)
8,693,071
943,255
703,85740,612
184,224590,469
(379,949)2,082,480
$ 15,224,765
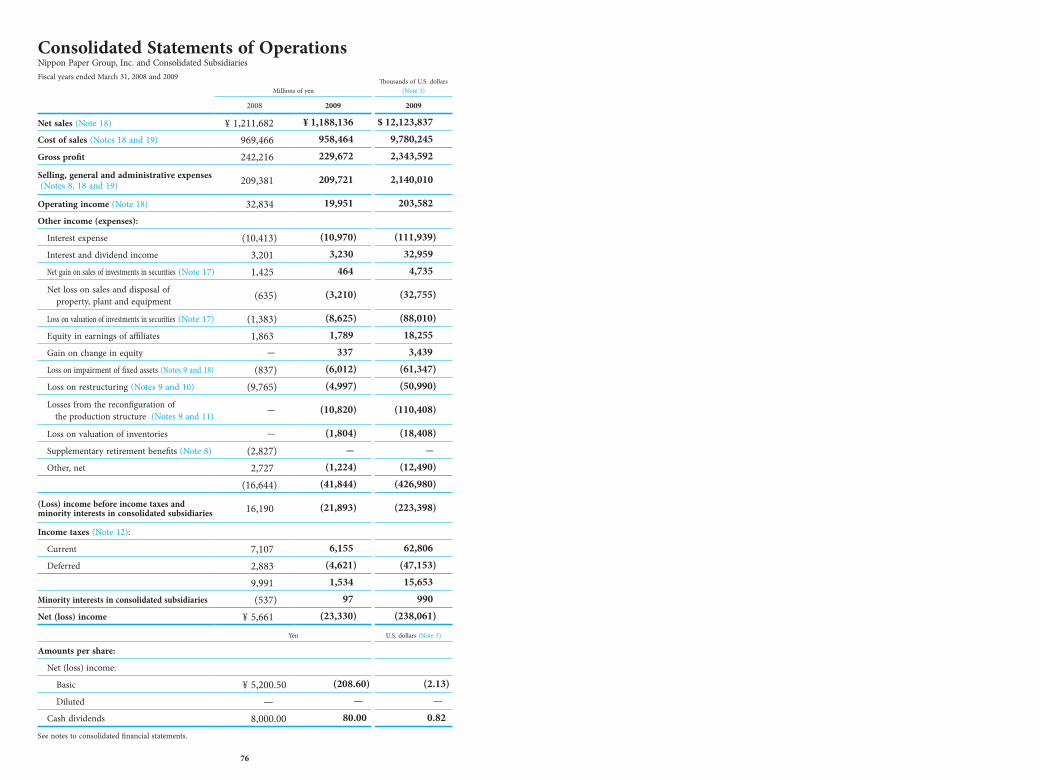
Millions of yenThousands of U.S. dollars
(Note 3)
2008 2009 2009
Net sales (Note 18)
Cost of sales (Notes 18 and 19)
Gross profit
Se lling, general and administrative expenses (Notes 8, 18 and 19)
Operating income (Note 18)
Other income (expenses):
Interest expense
Interest and dividend income
Net gain on sales of investments in securities (Note 17)
Net loss on sales and disposal of property, plant and equipment
Loss on valuation of investments in securities (Note 17)
Equity in earnings of affiliates
Gain on change in equity
Loss on impairment of fixed assets (Notes 9 and 18)
Loss on restructuring (Notes 9 and 10)
Losses from the reconfiguration of the production structure (Notes 9 and 11)
Loss on valuation of inventories
Supplementary retirement benefits (Note 8)
Other, net
(Loss) in come before income taxes and minority interests in consolidated subsidiaries
Income taxes (Note 12):
Current
Deferred
Minority interests in consolidated subsidiaries
Net (loss) income
Yen U.S. dollars (Note 3)
Amounts per share:
Net (loss) income:
Basic
Diluted
Cash dividends
See notes to consolidated financial statements.
Consolidated Statements of OperationsNippon Paper Group, Inc. and Consolidated Subsidiaries Fiscal years ended March 31, 2008 and 2009
76
¥ 1,211,682969,466242,216
209,381
32,834
(10,413)3,2011,425
(635)
(1,383)1,863
-
(837)(9,765)
-
-
(2,827)2,727
(16,644)
16,190
7,1072,8839,991(537)
¥ 5,661
¥ 5,200.50—
8,000.00
¥ 1,188,136958,464229,672
209,721
19,951
(10,970)3,230
464
(3,210)
(8,625)1,789
337(6,012)(4,997)
(10,820)
(1,804)-
(1,224)(41,844)
(21,893)
6,155(4,621)1,534
97(23,330)
(208.60)—
80.00
$ 12,123,8379,780,2452,343,592
2,140,010
203,582
(111,939)32,959
4,735
(32,755)
(88,010)18,255
3,439(61,347)(50,990)
(110,408)
(18,408)-
(12,490)(426,980)
(223,398)
62,806(47,153)15,653
990(238,061)
(2.13)—
0.82

Consolidated Statements of Changes in Net AssetsNippon Paper Group, Inc. and Consolidated Subsidiaries
Millions of yen
Shareholders’ equity
Number of shares of issued common stock
Common stock
Capital surplus
Retained earnings
Less treasury stock,at cost
Total shareholders’equity
Balance at March 31, 2007 1,105,235.63 ¥ 55,730 ¥ 252,442 ¥ 139,638 ¥ (18,366) ¥ 429,443Cash dividends paid — — — (8,675) — (8,675)Net income — — — 5,661 — 5,661Purchase of treasury stock — — — — (160) (160)Disposition of treasury stock — — (2,305) — 18,038 15,733Share exchange 17,299 — 5,903 — (602) 5,301Changes in the scope of consolidation — — — 727 — 727Changes in the scope of equity method affiliates — — — 783 — 783Changes in items other
than shareholders’ equity, net
— — — — — —
Balance at March 31, 2008 1,122,534.63 55,730 256,040 138,135 (1,090) 448,815
Cash dividends paid — — — (8,952) — (8,952)
Net loss — — — (23,330) — (23,330)
Purchase of treasury stock — — — — (160) (160)
Disposition of treasury stock — — (6) — 48 41Changes in the scope of consolidation — — — (446) — (446)Changes in the scope of equity method affiliates — — — — (30) (30)Changes in items other
than shareholders’ equity, net
— — — — — —
Increase due to share split 111,130,928.37 — — — — —
Balance at March 31, 2009 112,253,463.00 ¥ 55,730 ¥ 256,033 ¥ 105,405 ¥ (1,233) ¥ 415,935
Thousands of U.S. dollars (Note 3)
Shareholders’ equity
Common stock
Capital surplus
Retained earnings
Less treasury stock,at cost
Total shareholders’equity
Balance at March 31, 2008 $ 568,673 $ 2,612,653 $ 1,409,541 $ (11,122) $ 4,579,745
Cash dividends paid — — (91,347) — (91,347)
Net loss — — (238,061) — (238,061)
Purchase of treasury stock — — — (1,633) (1,633)
Disposition of treasury stock — (61) — 490 418 Changes in the scope of consolidation — — (4,551) — (4,551)Changes in the scope of equity method affiliates — — — (306) (306)Changes in items other
than shareholders’ equity, net
— — — — —
Balance at March 31, 2009 $ 568,673 $ 2,612,582 $ 1,075,561 $ (12,582) $ 4,244,235
See notes to consolidated financial statements.
Millions of yen
Valuation, translation adjustments and otherMinority interests
in consolidatedsubsidiaries
Totalnet assets
Net unrealized holding gain (loss) on other securities
Net deferred (loss) gain on hedges
Translation adjustments
Total valuation, translation
adjustments and other
¥ 16,174 ¥ 1,864 ¥ 1,081 ¥ 19,120 ¥ 21,956 ¥ 470,521
— — — — — (8,675)
— — — — — 5,661
— — — — — (160)
— — — — — 15,733
— — — — — 5,301
— — — — — 727
— — — — — 783
(12,252) (2,269) 2,486 (12,036) 1,901 (10,134)
3,922 (404) 3,567 7,084 23,858 479,758
— — — — — (8,952)
— — — — (23,330)
— — — — — (160)
— — — — — 41
— — — — — (446)
— — — — — (30)
(5,490) 2,558 (17,321) (20,253) (2,074) (22,327)
— — — — — —
¥ (1,568) ¥ 2,153 ¥ (13,754) ¥ (13,168) ¥ 21,783 ¥ 424,551
Thousands of U.S. dollars (Note 3)
Valuation, translation adjustments and otherMinority interests
in consolidatedsubsidiaries
Totalnet assets
Net unrealized holding gain (loss) on other securities
Net deferred (loss) gain on hedges
Translation adjustments
Total valuation, translation
adjustments and other
$ 40,020 $ (4,122) $ 36,398 $ 72,286 $ 243,449 $ 4,895,490
— — — — — (91,347)
— — — — — (238,061)
— — — — — (1,633)
— — — — — 418
— — — — — (4,551)
— — — — — (306)
(56,020) 26,102 (176,745) (206,663) (21,163) (227,827)
$ (16,000) $ 21,969 $ (140,347) $ (134,367) $ 222,276 $ 4,332,153
F i n a n c i a l S e c t i o n
77
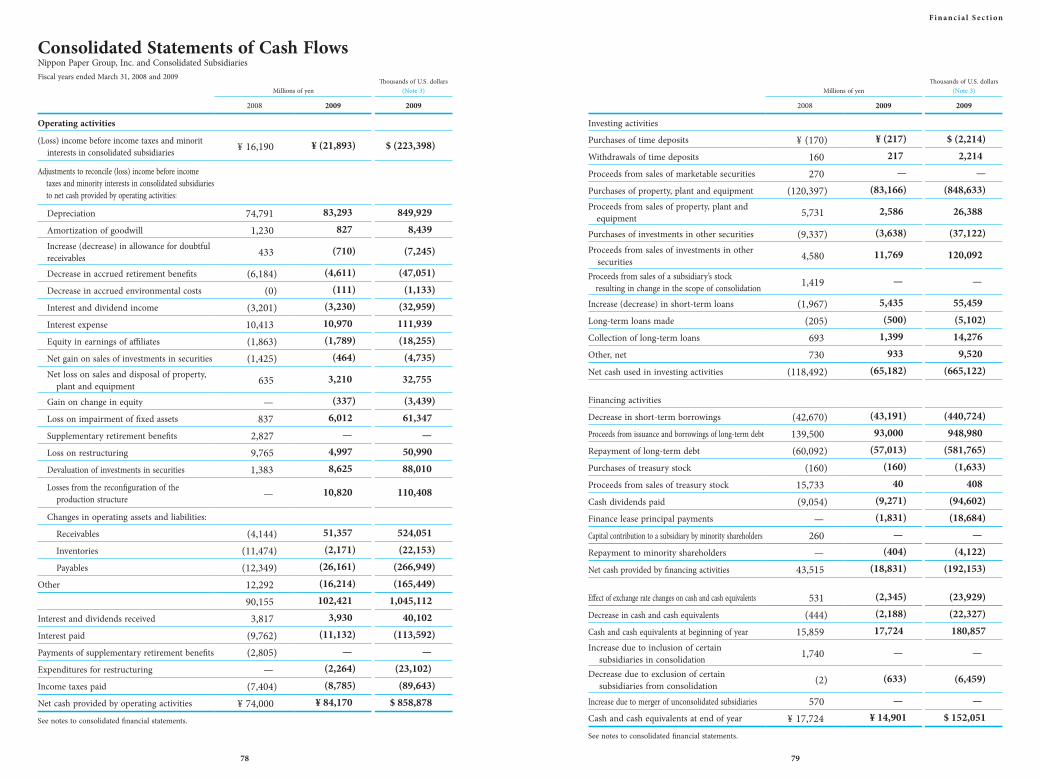
Millions of yenThousands of U.S. dollars
(Note 3)
2008 2009 2009
Operating activities
(Loss) in come before income taxes and minoritinterests in consolidated subsidiaries
Ad justments to reconcile (loss) income before income taxes and minority interests in consolidated subsidiaries to net cash provided by operating activities:
Depreciation
Amortization of goodwill
Increase (decrease) in allowance for doubtful receivables
Decrease in accrued retirement benefits
Decrease in accrued environmental costs
Interest and dividend income
Interest expense
Equity in earnings of affiliates
Net gain on sales of investments in securities
Net loss on sales and disposal of property, plant and equipment
Gain on change in equity
Loss on impairment of fixed assets
Supplementary retirement benefits
Loss on restructuring
Devaluation of investments in securities
Losses from the reconfiguration of the production structure
Changes in operating assets and liabilities:
Receivables
Inventories
Payables
Other
Interest and dividends received
Interest paid
Payments of supplementary retirement benefits
Expenditures for restructuring
Income taxes paid
Net cash provided by operating activities
See notes to consolidated financial statements.
Consolidated Statements of Cash FlowsNippon Paper Group, Inc. and Consolidated SubsidiariesFiscal years ended March 31, 2008 and 2009
78 79
F i n a n c i a l S e c t i o n
¥ 16,190
74,7911,230
433
(6,184)(0)
(3,201)10,413(1,863)(1,425)
635
—837
2,8279,7651,383
—
(4,144)(11,474)(12,349)12,29290,155
3,817(9,762)(2,805)
—(7,404)
¥ 74,000
$ (223,398)
849,9298,439
(7,245)
(47,051)(1,133)
(32,959)111,939(18,255)
(4,735)
32,755
(3,439)61,347
—50,99088,010
110,408
524,051(22,153)
(266,949)(165,449)
1,045,11240,102
(113,592)—
(23,102)(89,643)
$ 858,878
¥ (21,893)
83,293827
(710)
(4,611)(111)
(3,230)10,970(1,789)
(464)
3,210
(337)6,012
—4,9978,625
10,820
51,357(2,171)
(26,161)(16,214)102,421
3,930(11,132)
—(2,264)(8,785)
¥ 84,170
Millions of yenThousands of U.S. dollars
(Note 3)
2008 2009 2009
Investing activities
Purchases of time deposits
Withdrawals of time deposits
Proceeds from sales of marketable securities
Purchases of property, plant and equipment
Pr oceeds from sales of property, plant and equipment
Purchases of investments in other securities
Proceeds from sales of investments in other securities
Proceeds from sales of a subsidiary’s stock resulting in change in the scope of consolidation
Increase (decrease) in short-term loans
Long-term loans made
Collection of long-term loans
Other, net
Net cash used in investing activities
Financing activities
Decrease in short-term borrowings
Proceeds from issuance and borrowings of long-term debt
Repayment of long-term debt
Purchases of treasury stock
Proceeds from sales of treasury stock
Cash dividends paid
Finance lease principal payments
Capital contribution to a subsidiary by minority shareholders
Repayment to minority shareholders
Net cash provided by financing activities
Eff ect of exchange rate changes on cash and cash equivalents
Decrease in cash and cash equivalents
Cash and cash equivalents at beginning of year
Increase due to inclusion of certain subsidiaries in consolidationDe crease due to exclusion of certain subsidiaries from consolidation
In crease due to merger of unconsolidated subsidiaries
Cash and cash equivalents at end of year
See notes to consolidated financial statements.
¥ (170)160270
(120,397)
5,731
(9,337)
4,580
1,419
(1,967)(205)693730
(118,492)
(42,670)139,500(60,092)
(160)15,733(9,054)
—260
—43,515
531(444)
15,859
1,740
(2)
570 ¥ 17,724
$ (2,214)2,214
—(848,633)
26,388
(37,122)
120,092
—
55,459(5,102)14,276
9,520(665,122)
(440,724)948,980
(581,765)(1,633)
408(94,602)(18,684)
—(4,122)
(192,153)
(23,929)(22,327)180,857
—
(6,459)
—$ 152,051
¥ (217)217
—(83,166)
2,586
(3,638)
11,769
—
5,435(500)
1,399933
(65,182)
(43,191)93,000
(57,013)(160)
40(9,271)(1,831)
—(404)
(18,831)
(2,345)(2,188)17,724
—
(633)
—¥ 14,901

Notes to Consolidated Financial StatementsNippon Paper Group, Inc. and Consolidated Subsidiaries
1. Summary of Significant Accounting Policies(a) Basis of Preparation
The accompanying consolidated financial statements of Nippon Paper Group, Inc. (the
“Company”) and consolidated subsidiaries (collectively, the “Group”) are prepared on the basis of
accounting principles generally accepted in Japan, which are different in certain respects as to the
application and disclosure requirements of International Financial Reporting Standards, and are
compiled from the consolidated financial statements prepared by the Company as required by the
Financial Instruments and Exchange Law of Japan.
As permitted, amounts of less than one million yen have been omitted. As a result, the totals
shown in the accompanying consolidated financial statements (both in yen and U.S. dollars) do not
necessarily agree with the sums of the individual amounts.
(b) ConsolidationThe accompanying consolidated financial statements include the accounts of the Company and
all subsidiaries over which it exerts substantial control either through majority ownership of voting
stock and/or by other means. All significant intercompany balances and transactions have been
eliminated in consolidation.
Certain foreign subsidiaries are consolidated on the basis of fiscal periods ending December 31,
a closing date which differs from that of the Company; however, the necessary adjustments have been
made if the effect of the difference is deemed material.
Investments in equity method affiliates (companies over which the Company has the ability to
exercise significant influence) are stated at cost plus equity in their undistributed earnings or losses.
Consolidated net income (loss) includes the Company’s equity in the current net income or loss of
such companies after the elimination of unrealized intercompany profits.
Goodwill is amortized on a straight-line basis over five or twenty years.
(c) Cash and Cash EquivalentsCash and cash equivalents include all highly liquid investments, generally with original maturities
of three months or less, which are readily convertible to known amounts of cash and are so near
maturity that they represent only an insignificant risk of any changes in their value resulting from
interest-rate fluctuation.
(d) SecuritiesUnder the Japanese accounting standard for financial instruments, securities are classified into
three categories: trading, held-to-maturity or other securities, as follows:
(i) trading securities are carried at fair value although the Company and consolidated subsidiaries
had no such securities at either March 31, 2009 or 2008;
(ii) held-to-maturity securities are carried at cost and amortized by the straight-line method; and
(iii) marketable securities classified as other securities are carried at fair value with any changes in
unrealized holding gain or loss, net of the applicable income taxes, included directly in net assets.
Non-marketable securities classified as other securities are carried at cost. Costs of securities sold
are determined by the moving average method.
(e) InventoriesInventories are stated at the lower of cost, determined principally by the moving average method,
or net selling value. (The amount on the balance sheets is written down based on any decline in
profitability.)
(f) Allowance for Doubtful ReceivablesAllowance for doubtful receivables is provided for future bad debt losses at an amount estimated
based on past bad debt experience of normal receivables plus uncollectible amounts determined by
reference to the collectibility of individual receivables.
(g) Property, Plant and EquipmentProperty, plant and equipment are stated at cost. Depreciation is, in general, computed by the
declining-balance method over the estimated useful lives of the respective assets, except for new
buildings acquired after March 31, 1998 on which depreciation is calculated by the straight-line
method. Depreciation of assets leased under finance-leasing agreements (except those entailing
transfer of ownership) is calculated using the straight-line method assuming a residual value of zero
(or the guaranteed residual value when this is set by agreement) and a useful life equal to the term of
the lease. Significant renewals and betterments are capitalized at cost. Maintenance and repairs are
charged to income as incurred.
(h) Foreign Currency TranslationAll assets and liabilities denominated in foreign currencies other than those hedged by forward
foreign exchange contracts, etc. are translated into yen at the current rates. All revenues and expenses
associated with foreign currencies are translated at the rates of exchange prevailing when such
transactions were made. Translation gain or loss is credited or charged to income as incurred.
The balance sheet accounts of foreign consolidated subsidiaries and affiliates are translated into
yen at the rates of exchange in effect at their respective balance sheet dates, except for the components
of net assets (excluding minority interests) which are translated at their historical exchange rates.
March 31, 2009
80 81
F i n a n c i a l S e c t i o n
Revenue and expense accounts are translated at the average rate of exchange in effect during the fiscal
year. The resulting differences in translation are presented as translation adjustments and minority
interests in consolidated subsidiaries as components of net assets in the accompanying consolidated
financial statements.
(i) Retirement BenefitsAccrued retirement benefits for employees have been provided mainly at an amount calculated
based on the retirement benefit obligation less the fair value of the pension plan assets as of the balance
sheet dates, as adjusted for unrecognized actuarial gain or loss, and unrecognized prior service cost.
The retirement benefit obligation is attributed to each fiscal year by the straight-line method over the
estimated remaining years of service of the eligible employees.
Actuarial gain or loss is amortized commencing the year following the year in which the gain
or loss is recognized primarily by the straight-line method over periods (10 years through 15 years)
which are equal to or shorter than the average estimated remaining years of service of the eligible
employees.
Prior service cost is being amortized as incurred by the straight-line method over periods (5 years
through 15 years) which are equal to or shorter than the average estimated remaining years of service
of the eligible employees.
In addition, directors and statutory auditors of the Company and its consolidated subsidiaries
are customarily entitled to lump-sum payments under an unfunded retirement benefit plan. Accrued
retirement benefits for these officers are accounted for based on the rules of the Company and its
consolidated subsidiaries.
(j) Accrued Environmental CostsAccrued environmental costs are provided at an estimate of the amount required to dispose PCB
(polychlorinated biphenyl) waste under the Law Concerning Special Measures against PCB Waste.
(k) Research and Development CostsResearch and development costs are charged to income as incurred.
(l) DerivativesCertain consolidated subsidiaries have entered into various derivatives transactions in order to
manage certain risks arising from adverse fluctuation in foreign currency exchange rates and interest
rates. Deferral hedge accounting is adopted for derivatives which qualify as hedges, under which
unrealized gain or loss is principally deferred as an asset or a liability. Hedging instruments are
derivative transactions and hedged items are primarily forecast sales and purchases denominated in
foreign currencies, and receivables and payables denominated in foreign currencies.
Hedge effectiveness is not assessed if the substantial terms and conditions of the hedge
instruments and the hedged forecasted transactions are the same. Receivables and payables hedged by
qualified forward foreign exchange contracts are translated at their corresponding contract rates.
(m) Income TaxesThe Company and consolidated subsidiaries have adopted tax-effect accounting in accordance
with an accounting standard which requires recognition of income taxes by the liability method.
Under the liability method, deferred tax assets and liabilities are determined based on the differences
between the asset and liability amounts for financial reporting purposes and the corresponding
amounts for tax purposes, and are measured using the enacted tax rates and laws which will be in
effect when these differences are expected to be reversed.
(n) Appropriation of Retained EarningsUnder the Corporation Law of Japan (“the Law”), the appropriation of retained earnings with
respect to a given fiscal period made by resolution of the shareholders at an ordinary general meeting
held subsequent to the close of the fiscal period has not been reflected in the accounts for the fiscal
year ended March 31, 2009. See Notes 13 and 21.
(o) Amounts per ShareBasic net income (loss) per share is computed based on the net income available for distribution
to shareholders of common stock and the weighted-average number of shares of common stock
outstanding during the fiscal year.
Diluted earnings per share is not disclosed because there were no potentially dilutive securities
at March 31, 2009 and 2008.
Cash dividends per share represent the cash dividends declared as applicable to the respective
fiscal years.
2. Accounting Changes(a) Effective April 1, 2008, the Company and its consolidated domestic subsidiaries adopted the
Accounting Standards Board of Japan (ASBJ) Statement No.9, “Accounting Standard for
Measurement of Inventories,” released on July 5, 2006. In conjunction with the adoption of this
accounting standard, the Company and its consolidated domestic subsidiaries modified the
measurement method for valuing inventories.
As a result, operating income decreased by ¥2,328 million ($23,755 thousand) and loss before
income taxes and minority interests in consolidated subsidiaries increased by ¥4,132 million
($42,163 thousand) for the fiscal year ended March 31, 2009 as compared to the corresponding
amounts which would have been recorded under the previous method.
(b) Commencing in the fiscal year ended March 31, 2009, the Company adopted the Practical Issues
Task Force (“PITF”) No.18, “Practical Solution on Unification of Accounting Policies Applied to
Foreign Subsidiaries for Consolidated Financial Statements,” issued by the ASBJ on May 17, 2006,
and made necessary adjustments in preparing the consolidated financial statements.
The adoption of this standard did not have a material effect on the results of operations and
financial position for the fiscal year ended March 31, 2009.
82 83
F i n a n c i a l S e c t i o n

(c) Effective April 1, 2008, the Company and its consolidated domestic subsidiaries adopted ASBJ
Statement No.13 “Accounting Standard for Lease Transactions” and ASBJ Guidance No.16,
“Guidance on Accounting Standard for Lease Transactions”, as revised on March 30, 2007.
Prior to April 1, 2008, finance leases, other than those that transfer ownership of the assets to
the lessee at the end of the lease term, were accounted for as operating leases. Under the revised
accounting standards, these leased assets are accounted for as finance leases and depreciated/
amortized in accordance with the straight-line method over the periods of the leases, assuming
no residual value.
The adoption of these standards did not have a material effect on the results of operations
and financial position for the fiscal year ended March 31, 2009.
(d) Effective the fiscal year ended March 31, 2008, Nippon Paper Industries Co., Ltd., one of the
Company’s consolidated subsidiaries, has changed its method of accounting for depreciation of
its tangible fixed assets at the Ishinomaki mill, to the straight-line method from the declining-
balance method.
This change in method of accounting was made to ensure appropriate matching of cost with
revenue in connection with the setting up of PM N6, a state-of–the-art-papermaking line at the
Ishinomaki mill in November 2007. It was installed to build up a production system of Nippon
Paper Industries Co., Ltd. in view of competition in the Asian market. PM N6 commenced its
operations smoothly and it is estimated that the maintenance methods of the machine enable
the effect of the investment and its contribution to earnings to be equal in the long-term. In
addition, based on an assessment of machinery other than PM N6 at the Ishinomaki mill, it has
been confirmed that such other machinery will operate and contribute to earnings stably over
their respective estimated useful lives.
As a result, depreciation expense decreased by ¥3,789 million, operating income increased
by ¥3,212 million, and income before income taxes and minority interests in consolidated
subsidiaries increased by ¥3,240 million for the fiscal year ended March 31, 2008 as compared to
the corresponding amounts which would have been recorded under the previous method.
In line with the revision to the Corporation Tax Law of Japan, effective the year ended
March 31, 2008, domestic consolidated subsidiaries have changed their method of accounting
for depreciation of tangible fixed assets acquired on or after April 1, 2007 based on the revised
Corporation Tax Law.
As a result, depreciation expense increased by ¥857 million, operating income decreased
by ¥741 million, and income before income taxes and minority interests in consolidated
subsidiaries decreased by ¥755 million for the fiscal year ended March 31, 2008 as compared to
the corresponding amounts which would have been recorded under the previous method.
The impact on segment information is stated in the applicable sections.
(Additional information)
With respect to tangible fixed assets acquired on or before March 31, 2007, in line with
the revision to the Corporation Tax Law, effective the fiscal year ended March 31, 2008,
domestic consolidated subsidiaries depreciate the difference between the residual value and the
memorandum price over a period of five years by the straight-line method beginning the year
following the year in which the assets have been depreciated to their respective residual values
and include such depreciation in depreciation expense.
As a result, depreciation expense increased by ¥9,946 million, operating income decreased
by ¥9,244 million, and income before income taxes and minority interests in consolidated
subsidiaries decreased by ¥9,312 million for the fiscal year ended March 31, 2008 as compared to
the corresponding amounts which would have been recorded under the previous method.
3. U.S. Dollar AmountsAmounts in U.S. dollars are included solely for the convenience of the reader. The rate of
¥98=U.S.$1.00, the approximate rate of exchange in effect on March 31, 2009, has been used. This
translation should not be construed as a representation that yen have been, could have been, or could
in the future be, converted into U.S. dollars at the above or any other rate.
4. Business Combinations<Purchase method>(a) Outline of the business combination (fiscal year ended March 31, 2008)
(1) Name and business of acquired company
Mishima Paper Co., Ltd. Manufacture and sale of paper and specialty paper
(2) Reason for business combination
Increase corporate value as specialized producer of specialty paper
(3) Date of the business combination
February 1, 2008
(4) Legal form of business combination
Share exchange
(5) Name of the acquired company after the business combination
Mishima Paper Co., Ltd. (was renamed Nippon Paper Papylia Co., Ltd. on April 1, 2008)
(6) Percentage of share of voting rights the Company has acquired
100%
(b) The period of the results of operations of the acquired entity included in the consolidated
statement of operations
The consolidated statement of operations for the fiscal year ended March 31, 2008 does not
include the results of operations of Mishima Paper Co., Ltd. because the business combination was
accounted for assuming it was made on March 31, 2008.
84 85
F i n a n c i a l S e c t i o n

(c) Acquisition cost and breakdownMillions of yen
Common stock ¥ 6,067Expenses for acquisition 30Acquisition cost ¥ 6,097
(d) Share exchange ratio, its basis for determination, number of shares delivered and their values
(1) Type of shares and share exchange ratio
Common stock
1 share of Nippon Paper Group, Inc.: 0.00061 shares of Mishima Paper Co., Ltd.
(2) Basis for determination of share exchange ratio
To attain fairness and appropriateness in determining the share exchange ratio, Nippon Paper
Group, Inc. appointed Nikko Cordial Securities, Inc. as a third party appraiser, and Mishima
Paper Co., Ltd. appointed Deloitte Tohmatsu FAS as a third party appraiser, to calculate and
evaluate the share exchange ratio. Through negotiations and discussions between Nippon Paper
Group, Inc. and Mishima Paper Co., Ltd. by reference to the results of appraisals, the both parties
reached agreement and deemed the share exchange ratio stated above to be reasonable.
(3) Number of shares delivered and their value
Common stock 17,699 shares
(Newly-issued 17,299 shares, disposal of treasury stock: 400 shares)
(e) Amount of negative goodwill, reason for recognizing goodwill, amortization method and
amortization period
(1) Amount of negative goodwill
¥2,899 million
(2) Reason for recognizing negative goodwill
The acquisition cost of the acquired company was less than the fair value of its net assets as of
the date of the business combination. This difference was recognized as negative goodwill.
(3) Amortization method and period of goodwill
Straight-line method over a period of 5 years
(f) Assets and liabilities assumed on the date of the business combination and their main
components
Millions of yen
Assets ¥ 37,528Current assets 15,777Fixed assets 21,751
Liabilities 28,531Current liabilities 25,445Long-term liabilities 3,086
5. InventoriesInventories at March 31, 2009 and 2008 consisted of the following:
Millions of yen Thousands of U.S. dollars
March 31, March 31,
2008 2009 2009
Merchandise and finished products
Work in process
Raw materials and supplies
6. Short-Term Debt and Long-Term DebtAt March 31, 2009 and 2008, short-term debt consisted of the following:
Millions of yen Thousands of U.S. dollars
March 31, March 31,
2008 2009 2009
Loans from banks
Lo ans from unconsolidated subsidiaries and affiliates
Commercial paper
Others
Loans from banks were unsecured and generally represent 365-day notes. The weighted-average
interest rates of the short-term bank loans outstanding at March 31, 2009 and 2008 were 1.00% and
1.24%, respectively.
86 87
F i n a n c i a l S e c t i o n
¥ 91,86919,01354,544
¥ 165,427
¥ 178,969
2,428
42,500-
¥ 223,898
¥ 82,81319,50363,170
¥ 165,487
$ 845,031199,010644,592
$1,688,643
¥ 164,808
2,494
14,00012,413
¥ 193,716
$ 1,681,714
25,449
142,857126,663
$ 1,976,694

7. Pledged AssetsAssets pledged as collateral for notes and accounts payable – trade of ¥78 million ($796 thousand)
and ¥105 million, the current portion of long-term debt of ¥50 million ($510 thousand) and ¥3,192
million, and long-term debt of ¥5,602 million ($57,163 thousand) and ¥17,282 million at March 31,
2009 and 2008, respectively were as follows:
Millions of yen Thousands of U.S. dollars
March 31, March 31,
2008 2009 2009
Property, plant and equipment, at net book value
Investments in securities
8. Retirement Benefits(a) Certain consolidated subsidiaries have defined benefit pension plans, i.e., corporate pension
fund plans, Welfare Pension Fund Plans, tax-qualified pension plans and lump-sum payment
plans, covering substantially all employees who are entitled to lump-sum or annuity payments,
the amounts of which are determined by reference to their basic rates of pay, length of service,
and the conditions under which termination occurs.
Information on the multi-employer pension plans, contributions to which are reported as
retirement benefit expenses, is as follows:
(i) Funded status of pension plansFiscal years ended March 31, 2008
Pension fund management group for affiliated companies Others
Millions of yen Thousands of U.S. dollars Millions of yen Thousands of U.S. dollars
Plan assets ¥ 14,037 $ 145,235 ¥ 160,589 $ 1,638,663 Retirement benefit obligation 14,156 144,449 212,155 2,164,847 Net balance ¥ (119) $ (1,214) ¥ (51,565) $ (526,173)
Fiscal years ended March 31, 2007
Pension fund management group for affiliated companies Others
Millions of yen Millions of yen
Plan assets ¥ 16,052 ¥ 186,743 Retirement benefit obligation 13,024 217,406 Net balance ¥ 3,028 ¥ (30,662)
88 89
F i n a n c i a l S e c t i o n
Long-term debt at March 31, 2009 and 2008 is summarized as follows:
Millions of yen Thousands of U.S. dollars
March 31, March 31,
2008 2009 2009
Lo ans from banks, insurance companies and others at rates ranging from 3.381% to 0.810% due through 2034:
With collateral
Without collateral
0.81% unsecured corporate bonds in yen due 2010
0.91% unsecured corporate bonds in yen due 2008
0.89% unsecured corporate bonds in yen due 2009
1.1 0% unsecured corporate bonds in yen due 2012
1.79% unsecured corporate bonds in yen due 2011
1.97% unsecured corporate bonds in yen due 2017
1.96% unsecured corporate bonds in yen due 2017
0.73% unsecured corporate bonds in yen due 2008
Less current portion
Millions of yen Thousands of U.S. dollars
March 31, March 31,
2008 2009 2009
Lease obligations — ¥ 5,620 $ 57,347Less current portion — (1,698) (17,327)
— ¥ 3,922 $ 40,020
The maturities of long-term debt subsequent to March 31, 2009 are summarized as follows:Fiscal year ending March 31: Millions of yen Thousands of U.S. dollars
2010
2011
2012
2013
2014 and thereafter
¥ 20,474407,749
20,00020,00030,00020,00020,00013,00010,000
200561,423(57,013)
¥ 504,409
¥ 5,652 478,758
20,000—
30,00020,00020,00013,00010,000
—597,410(73,840)
¥ 523,569
$ 57,6734,885,286
204,082—
306,122204,082204,082132,653102,041
—6,096,020(753,469)
$ 5,342,541
¥ 75,538 57,61860,75159,371
349,750¥ 603,030
$ 770,796 587,939619,908605,827
3,568,878$ 6,153,367
¥ 433,373208
¥ 433,582
¥ 300,572-
¥ 300,572
$ 3,067,061-
$ 3,067,061
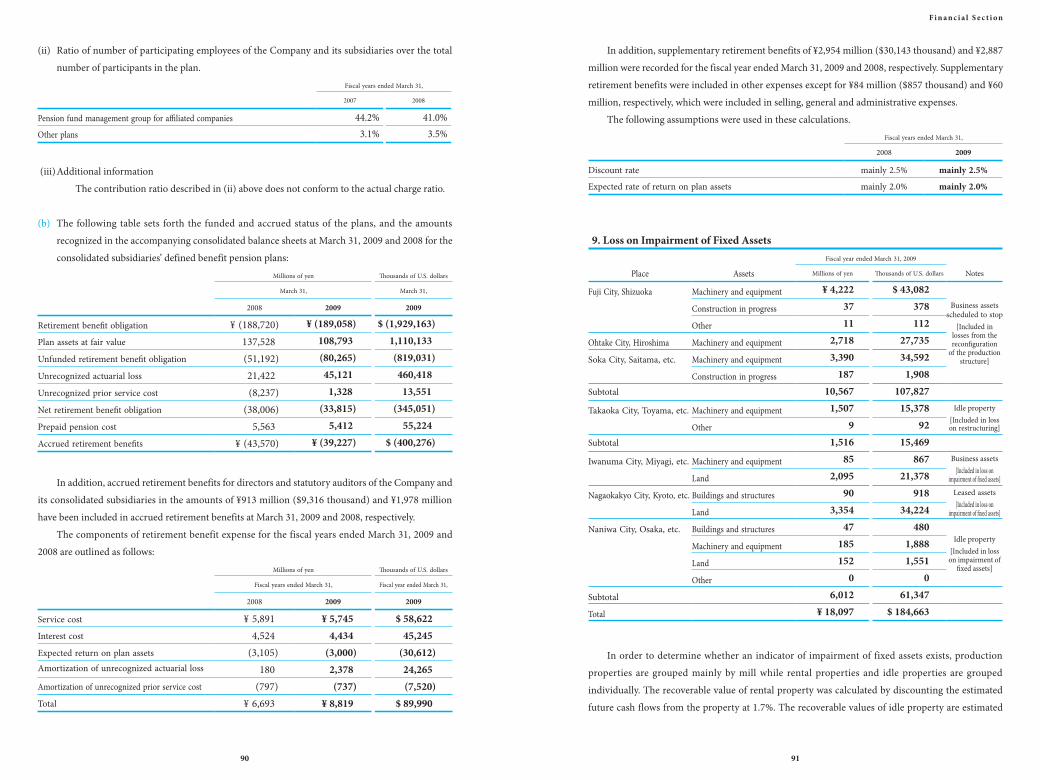
(ii) Ratio of number of participating employees of the Company and its subsidiaries over the total
number of participants in the plan.
Fiscal years ended March 31,
2007 2008
Pension fund management group for affiliated companies 44.2% 41.0%Other plans 3.1% 3.5%
(iii) Additional information
The contribution ratio described in (ii) above does not conform to the actual charge ratio.
(b) The following table sets forth the funded and accrued status of the plans, and the amounts
recognized in the accompanying consolidated balance sheets at March 31, 2009 and 2008 for the
consolidated subsidiaries’ defined benefit pension plans:
Millions of yen Thousands of U.S. dollars
March 31, March 31,
2008 2009 2009
Retirement benefit obligation
Plan assets at fair value
Unfunded retirement benefit obligation
Unrecognized actuarial loss
Unrecognized prior service cost
Net retirement benefit obligation
Prepaid pension cost
Accrued retirement benefits
In addition, accrued retirement benefits for directors and statutory auditors of the Company and
its consolidated subsidiaries in the amounts of ¥913 million ($9,316 thousand) and ¥1,978 million
have been included in accrued retirement benefits at March 31, 2009 and 2008, respectively.
The components of retirement benefit expense for the fiscal years ended March 31, 2009 and
2008 are outlined as follows:
Millions of yen Thousands of U.S. dollars
Fiscal years ended March 31, Fiscal year ended March 31,
2008 2009 2009
Service cost
Interest cost
Expected return on plan assets
Amortization of unrecognized actuarial loss
Amortization of unrecognized prior service cost
Total
In addition, supplementary retirement benefits of ¥2,954 million ($30,143 thousand) and ¥2,887
million were recorded for the fiscal year ended March 31, 2009 and 2008, respectively. Supplementary
retirement benefits were included in other expenses except for ¥84 million ($857 thousand) and ¥60
million, respectively, which were included in selling, general and administrative expenses.
The following assumptions were used in these calculations.
Fiscal years ended March 31,
2008 2009
Discount rate mainly 2.5% mainly 2.5%
Expected rate of return on plan assets mainly 2.0% mainly 2.0%
9. Loss on Impairment of Fixed AssetsFiscal year ended March 31, 2009
Place Assets Millions of yen Thousands of U.S. dollars Notes
Fuji City, Shizuoka Machinery and equipment ¥ 4,222 $ 43,082Business assets
scheduled to stop[Included in
losses from the reconfiguration
of the production structure]
Construction in progress 37 378
Other 11 112
Ohtake City, Hiroshima Machinery and equipment 2,718 27,735
Soka City, Saitama, etc. Machinery and equipment 3,390 34,592
Construction in progress 187 1,908
Subtotal 10,567 107,827
Takaoka City, Toyama, etc. Machinery and equipment 1,507 15,378 Idle property[Included in loss on restructuring]Other 9 92
Subtotal 1,516 15,469
Iwanuma City, Miyagi, etc. Machinery and equipment 85 867 Business assets[Included in loss on
impairment of fixed assets]Land 2,095 21,378
Nagaokakyo City, Kyoto, etc. Buildings and structures 90 918 Leased assets[Included in loss on
impairment of fixed assets]Land 3,354 34,224
Naniwa City, Osaka, etc. Buildings and structures 47 480Idle property
[Included in loss on impairment of
fixed assets]
Machinery and equipment 185 1,888
Land 152 1,551
Other 0 0
Subtotal 6,012 61,347
Total ¥ 18,097 $ 184,663
In order to determine whether an indicator of impairment of fixed assets exists, production
properties are grouped mainly by mill while rental properties and idle properties are grouped
individually. The recoverable value of rental property was calculated by discounting the estimated
future cash flows from the property at 1.7%. The recoverable values of idle property are estimated
90 91
F i n a n c i a l S e c t i o n
¥ (188,720)137,528(51,192)21,422(8,237)
(38,006)5,563
¥ (43,570)
¥ (189,058)108,793(80,265)45,121
1,328(33,815)
5,412¥ (39,227)
$ (1,929,163)1,110,133(819,031)460,418
13,551(345,051)
55,224$ (400,276)
¥ 5,8914,524
(3,105)180
(797)¥ 6,693
¥ 5,7454,434
(3,000)2,378(737)
¥ 8,819
$ 58,62245,245
(30,612)24,265(7,520)
$ 89,990
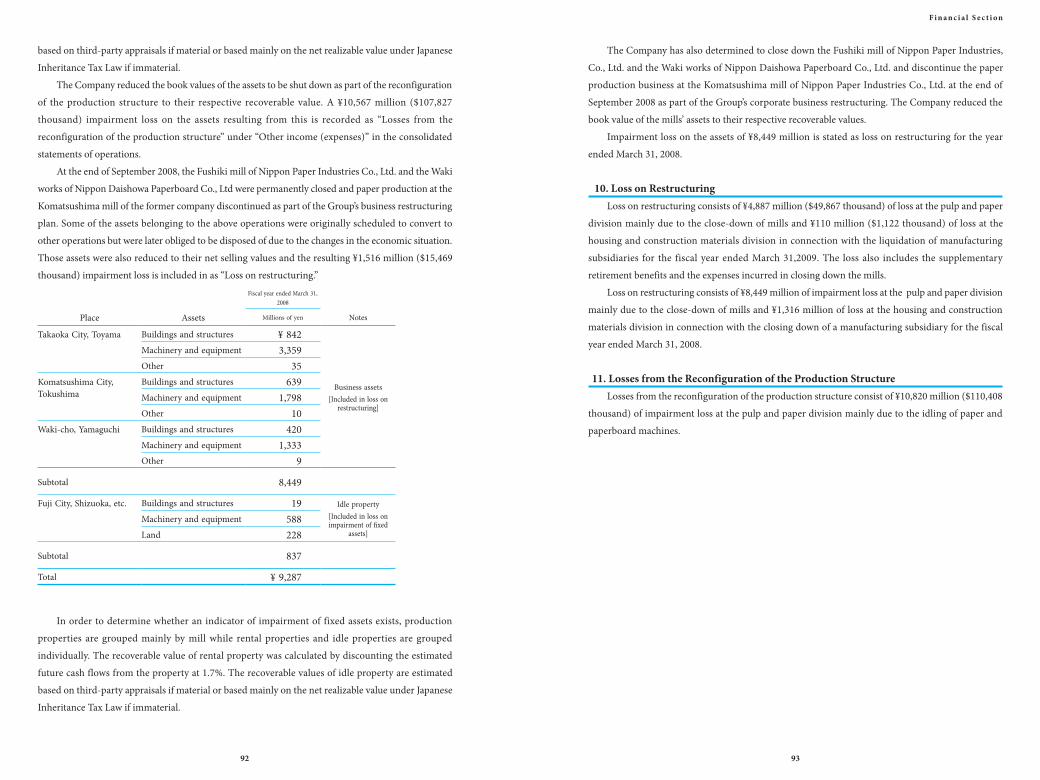
based on third-party appraisals if material or based mainly on the net realizable value under Japanese
Inheritance Tax Law if immaterial.
The Company reduced the book values of the assets to be shut down as part of the reconfiguration
of the production structure to their respective recoverable value. A ¥10,567 million ($107,827
thousand) impairment loss on the assets resulting from this is recorded as “Losses from the
reconfiguration of the production structure” under “Other income (expenses)” in the consolidated
statements of operations.
At the end of September 2008, the Fushiki mill of Nippon Paper Industries Co., Ltd. and the Waki
works of Nippon Daishowa Paperboard Co., Ltd were permanently closed and paper production at the
Komatsushima mill of the former company discontinued as part of the Group’s business restructuring
plan. Some of the assets belonging to the above operations were originally scheduled to convert to
other operations but were later obliged to be disposed of due to the changes in the economic situation.
Those assets were also reduced to their net selling values and the resulting ¥1,516 million ($15,469
thousand) impairment loss is included in as “Loss on restructuring.”
Fiscal year ended March 31,2008
Place Assets Millions of yen Notes
Takaoka City, Toyama Buildings and structures ¥ 842
Business assets[Included in loss on
restructuring]
Machinery and equipment 3,359Other 35
Komatsushima City, Tokushima
Buildings and structures 639Machinery and equipment 1,798Other 10
Waki-cho, Yamaguchi Buildings and structures 420Machinery and equipment 1,333Other 9
Subtotal 8,449
Fuji City, Shizuoka, etc. Buildings and structures 19 Idle property[Included in loss on impairment of fixed
assets]
Machinery and equipment 588Land 228
Subtotal 837
Total ¥ 9,287
In order to determine whether an indicator of impairment of fixed assets exists, production
properties are grouped mainly by mill while rental properties and idle properties are grouped
individually. The recoverable value of rental property was calculated by discounting the estimated
future cash flows from the property at 1.7%. The recoverable values of idle property are estimated
based on third-party appraisals if material or based mainly on the net realizable value under Japanese
Inheritance Tax Law if immaterial.
The Company has also determined to close down the Fushiki mill of Nippon Paper Industries,
Co., Ltd. and the Waki works of Nippon Daishowa Paperboard Co., Ltd. and discontinue the paper
production business at the Komatsushima mill of Nippon Paper Industries Co., Ltd. at the end of
September 2008 as part of the Group’s corporate business restructuring. The Company reduced the
book value of the mills’ assets to their respective recoverable values.
Impairment loss on the assets of ¥8,449 million is stated as loss on restructuring for the year
ended March 31, 2008.
10. Loss on RestructuringLoss on restructuring consists of ¥4,887 million ($49,867 thousand) of loss at the pulp and paper
division mainly due to the close-down of mills and ¥110 million ($1,122 thousand) of loss at the
housing and construction materials division in connection with the liquidation of manufacturing
subsidiaries for the fiscal year ended March 31,2009. The loss also includes the supplementary
retirement benefits and the expenses incurred in closing down the mills.
Loss on restructuring consists of ¥8,449 million of impairment loss at the pulp and paper division
mainly due to the close-down of mills and ¥1,316 million of loss at the housing and construction
materials division in connection with the closing down of a manufacturing subsidiary for the fiscal
year ended March 31, 2008.
11. Losses from the Reconfiguration of the Production StructureLosses from the reconfiguration of the production structure consist of ¥10,820 million ($110,408
thousand) of impairment loss at the pulp and paper division mainly due to the idling of paper and
paperboard machines.
92 93
F i n a n c i a l S e c t i o n
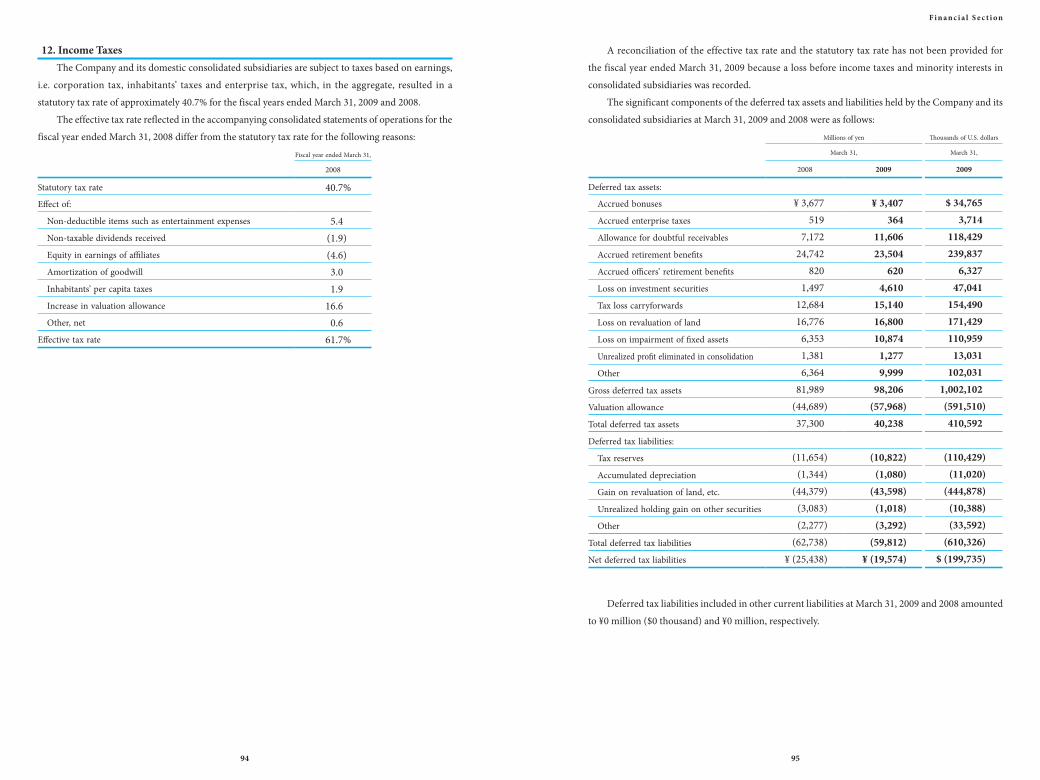
12. Income TaxesThe Company and its domestic consolidated subsidiaries are subject to taxes based on earnings,
i.e. corporation tax, inhabitants’ taxes and enterprise tax, which, in the aggregate, resulted in a
statutory tax rate of approximately 40.7% for the fiscal years ended March 31, 2009 and 2008.
The effective tax rate reflected in the accompanying consolidated statements of operations for the
fiscal year ended March 31, 2008 differ from the statutory tax rate for the following reasons:
Fiscal year ended March 31,
2008
Statutory tax rate 40.7%Effect of:
Non-deductible items such as entertainment expenses 5.4Non-taxable dividends received (1.9)Equity in earnings of affiliates (4.6)Amortization of goodwill 3.0Inhabitants’ per capita taxes 1.9Increase in valuation allowance 16.6Other, net 0.6
Effective tax rate 61.7%
A reconciliation of the effective tax rate and the statutory tax rate has not been provided for
the fiscal year ended March 31, 2009 because a loss before income taxes and minority interests in
consolidated subsidiaries was recorded.
The significant components of the deferred tax assets and liabilities held by the Company and its
consolidated subsidiaries at March 31, 2009 and 2008 were as follows:
Millions of yen Thousands of U.S. dollars
March 31, March 31,
2008 2009 2009
Deferred tax assets:
Accrued bonuses
Accrued enterprise taxes
Allowance for doubtful receivables
Accrued retirement benefits
Accrued officers’ retirement benefits
Loss on investment securities
Tax loss carryforwards
Loss on revaluation of land
Loss on impairment of fixed assets
Unrealized profit eliminated in consolidation
Other
Gross deferred tax assets
Valuation allowance
Total deferred tax assets
Deferred tax liabilities:
Tax reserves
Accumulated depreciation
Gain on revaluation of land, etc.
Unrealized holding gain on other securities
Other
Total deferred tax liabilities
Net deferred tax liabilities
Deferred tax liabilities included in other current liabilities at March 31, 2009 and 2008 amounted
to ¥0 million ($0 thousand) and ¥0 million, respectively.
¥ 3,407364
11,60623,504
6204,610
15,14016,80010,874
1,2779,999
98,206(57,968)40,238
(10,822)(1,080)
(43,598)(1,018)(3,292)
(59,812)¥ (19,574)
¥ 3,677519
7,17224,742
8201,497
12,68416,776
6,3531,3816,364
81,989(44,689)37,300
(11,654)(1,344)
(44,379)(3,083)(2,277)
(62,738)¥ (25,438)
$ 34,7653,714
118,429239,837
6,32747,041
154,490171,429110,959
13,031102,031
1,002,102(591,510)410,592
(110,429)(11,020)
(444,878)(10,388)(33,592)
(610,326)$ (199,735)
94 95
F i n a n c i a l S e c t i o n

13. Shareholders’ EquityThe Corporation Law of Japan provides that an amount equal to 10% of the amount to be
disbursed as distributions of capital surplus (other than the capital reserve) and retained earnings
(other than the legal reserve) be transferred to the capital reserve and the legal reserve, respectively,
until the sum of the capital reserve and the legal reserve equals 25% of the capital stock account. Such
distributions can be made at any time by resolution of the shareholders, or by the Board of Directors
if certain conditions are met.
The legal reserve amounting to ¥432 million ($4,408 thousand) and ¥432 million was included in
retained earnings at March 31, 2009 and 2008, respectively.
14. Supplemental Cash Flow Information(a) The following is a summary of the assets and liabilities of Haga Kamihan as of April 1, 2008
which was excluded from consolidation during the fiscal year ended March 31, 2009 upon merger
between Haga Kamihan and Kawachiya Paper Co., Ltd.
Millions of yen Thousands of U.S. dollars
2009 2009
Current assets ¥ 6,845 $ 69,847Non-current assets 783 7,990Total assets ¥ 7,629 $ 77,847
Current liabilities ¥ 7,439 $ 75,908Non-current liabilities 68 694Total liabilities ¥ 7,507 $ 76,602
(b) The following is a summary of the assets and liabilities of Asahikawa Grand Hotel Co., Ltd. as of
September 30, 2007 which was excluded from consolidation during the fiscal year ended March
31, 2008 upon the sale of its stock on September 26, 2007.
Millions of yen
September 30,
2007
Current assets ¥ 430Non-current assets 6,771Deferred assets 1Total assets ¥ 7,202Current liabilities ¥ 6,211Non-current liabilities 23Total liabilities ¥ 6,235Proceeds from sale of shares of the subsidiary ¥ 1,552Cash and cash equivalents held by the subsidiary (132)Net proceeds ¥ 1,419
(c) The following is a summary of the assets and liabilities of Mantsune Corporation as of September
30, 2007 which was included in consolidation during the fiscal year ended March 31, 2008 upon
its merger with NP Trading Co., Ltd. on October 1, 2007.
Millions of yen
September 30,
2007
Current assets ¥ 19,105Non-current assets 5,649Total assets ¥ 24,755Current liabilities ¥ 19,322Non-current liabilities 1,435Total liabilities ¥ 20,758
(d) The following is a summary of the assets and liabilities of Mishima Paper Co., Ltd. as of March
31, 2008 which was included in consolidation during the fiscal year ended March 31, 2008 upon
a share exchange conducted on February 1, 2008.
Millions of yen
March 31,
2008
Current assets ¥ 9,999Non-current assets 21,741Total assets ¥ 31,741Current liabilities ¥ 5,132Non-current liabilities 2,347Total liabilities ¥ 7,480
(e) Capital surplus for the fiscal year ended March 31, 2008 increased by ¥5,903 million as a result of
the share exchange.
March 31,
96 97
F i n a n c i a l S e c t i o n
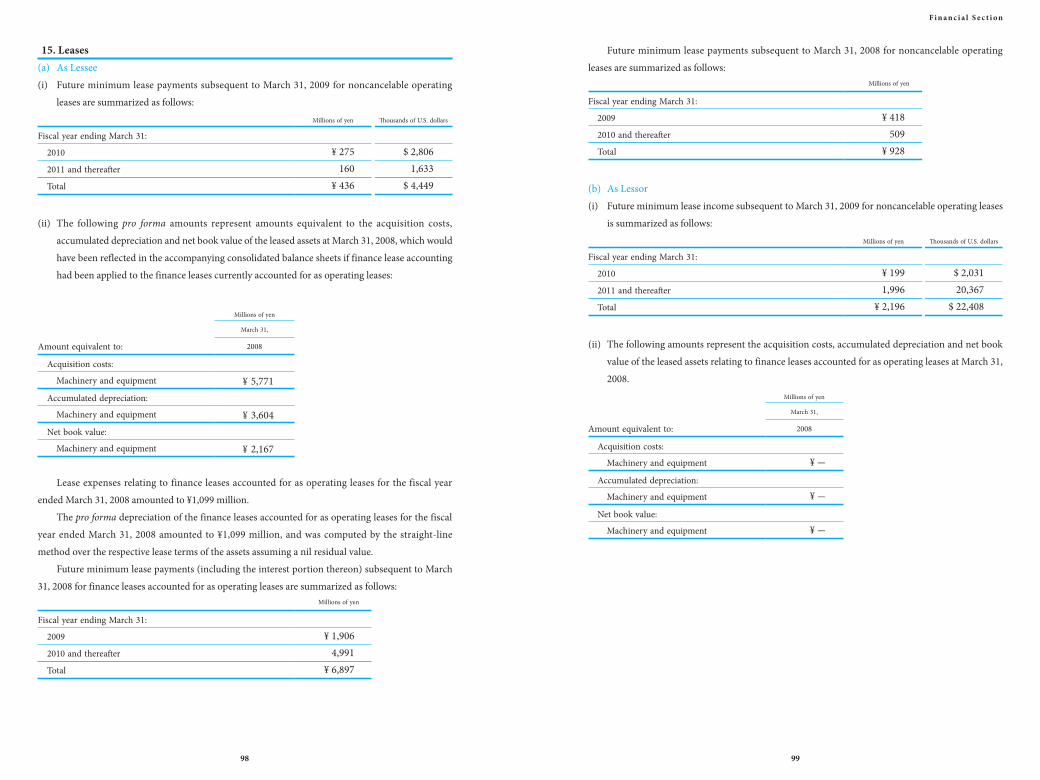
15. Leases(a) As Lessee(i) Future minimum lease payments subsequent to March 31, 2009 for noncancelable operating
leases are summarized as follows:
Millions of yen Thousands of U.S. dollars
Fiscal year ending March 31:
2010 ¥ 275 $ 2,8062011 and thereafter 160 1,633Total ¥ 436 $ 4,449
(ii) The following pro forma amounts represent amounts equivalent to the acquisition costs,
accumulated depreciation and net book value of the leased assets at March 31, 2008, which would
have been reflected in the accompanying consolidated balance sheets if finance lease accounting
had been applied to the finance leases currently accounted for as operating leases:
Millions of yen
March 31,
Amount equivalent to: 2008
Acquisition costs:
Machinery and equipment
Accumulated depreciation:
Machinery and equipment
Net book value:
Machinery and equipment
Lease expenses relating to finance leases accounted for as operating leases for the fiscal year
ended March 31, 2008 amounted to ¥1,099 million.
The pro forma depreciation of the finance leases accounted for as operating leases for the fiscal
year ended March 31, 2008 amounted to ¥1,099 million, and was computed by the straight-line
method over the respective lease terms of the assets assuming a nil residual value.
Future minimum lease payments (including the interest portion thereon) subsequent to March
31, 2008 for finance leases accounted for as operating leases are summarized as follows:Millions of yen
Fiscal year ending March 31:
2009 ¥ 1,9062010 and thereafter 4,991Total ¥ 6,897
Future minimum lease payments subsequent to March 31, 2008 for noncancelable operating
leases are summarized as follows:Millions of yen
Fiscal year ending March 31:
2009 ¥ 4182010 and thereafter 509Total ¥ 928
(b) As Lessor(i) Future minimum lease income subsequent to March 31, 2009 for noncancelable operating leases
is summarized as follows:
Millions of yen Thousands of U.S. dollars
Fiscal year ending March 31:
2010 ¥ 199 $ 2,0312011 and thereafter 1,996 20,367Total ¥ 2,196 $ 22,408
(ii) The following amounts represent the acquisition costs, accumulated depreciation and net book
value of the leased assets relating to finance leases accounted for as operating leases at March 31,
2008.
Millions of yen
March 31,
Amount equivalent to: 2008
Acquisition costs:
Machinery and equipment ¥ -
Accumulated depreciation:
Machinery and equipment ¥ -
Net book value:
Machinery and equipment ¥ -
¥ 5,771
¥ 3,604
¥ 2,167
98 99
F i n a n c i a l S e c t i o n
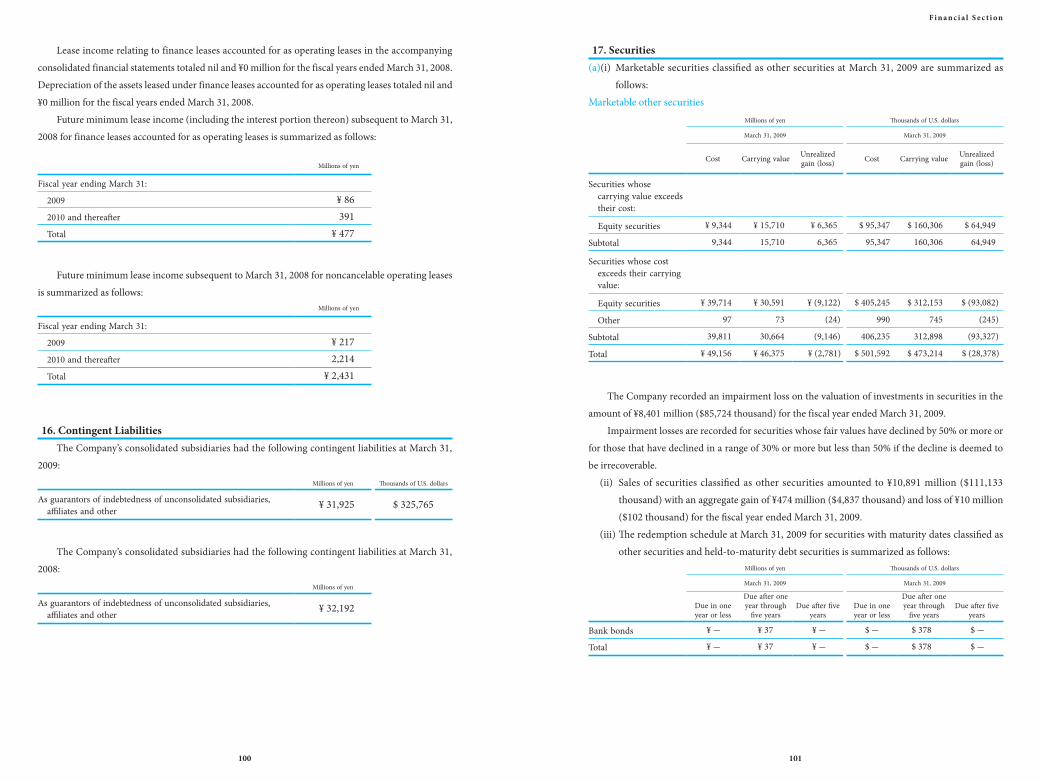
Lease income relating to finance leases accounted for as operating leases in the accompanying
consolidated financial statements totaled nil and ¥0 million for the fiscal years ended March 31, 2008.
Depreciation of the assets leased under finance leases accounted for as operating leases totaled nil and
¥0 million for the fiscal years ended March 31, 2008.
Future minimum lease income (including the interest portion thereon) subsequent to March 31,
2008 for finance leases accounted for as operating leases is summarized as follows:
Millions of yen
Fiscal year ending March 31:
2009 ¥ 862010 and thereafter 391Total ¥ 477
Future minimum lease income subsequent to March 31, 2008 for noncancelable operating leases
is summarized as follows:Millions of yen
Fiscal year ending March 31:
2009 ¥ 2172010 and thereafter 2,214Total ¥ 2,431
16. Contingent LiabilitiesThe Company’s consolidated subsidiaries had the following contingent liabilities at March 31,
2009:
Millions of yen Thousands of U.S. dollars
As guarantors of indebtedness of unconsolidated subsidiaries, affiliates and other
¥ 31,925 $ 325,765
The Company’s consolidated subsidiaries had the following contingent liabilities at March 31,
2008:
Millions of yen
As guarantors of indebtedness of unconsolidated subsidiaries, affiliates and other
¥ 32,192
17. Securities(a)(i) Marketable securities classified as other securities at March 31, 2009 are summarized as
follows:Marketable other securities
Millions of yen Thousands of U.S. dollars
March 31, 2009 March 31, 2009
Cost Carrying value Unrealizedgain (loss) Cost Carrying value Unrealized
gain (loss)
Securities whose carrying value exceeds their cost:
Equity securities ¥ 9,344 ¥ 15,710 ¥ 6,365 $ 95,347 $ 160,306 $ 64,949
Subtotal 9,344 15,710 6,365 95,347 160,306 64,949
Securities whose cost exceeds their carrying value:
Equity securities ¥ 39,714 ¥ 30,591 ¥ (9,122) $ 405,245 $ 312,153 $ (93,082)
Other 97 73 (24) 990 745 (245)
Subtotal 39,811 30,664 (9,146) 406,235 312,898 (93,327)
Total ¥ 49,156 ¥ 46,375 ¥ (2,781) $ 501,592 $ 473,214 $ (28,378)
The Company recorded an impairment loss on the valuation of investments in securities in the
amount of ¥8,401 million ($85,724 thousand) for the fiscal year ended March 31, 2009.
Impairment losses are recorded for securities whose fair values have declined by 50% or more or
for those that have declined in a range of 30% or more but less than 50% if the decline is deemed to
be irrecoverable.
(ii) Sales of securities classified as other securities amounted to ¥10,891 million ($111,133 thousand) with an aggregate gain of ¥474 million ($4,837 thousand) and loss of ¥10 million ($102 thousand) for the fiscal year ended March 31, 2009.
(iii) The redemption schedule at March 31, 2009 for securities with maturity dates classified as other securities and held-to-maturity debt securities is summarized as follows:
Millions of yen Thousands of U.S. dollars
March 31, 2009 March 31, 2009
Due in one year or less
Due after one year through
five yearsDue after five
yearsDue in one year or less
Due after one year through
five yearsDue after five
years
Bank bonds ¥ - ¥ 37 ¥ - $ - $ 378 $ -
Total ¥ - ¥ 37 ¥ - $ - $ 378 $ -
100 101
F i n a n c i a l S e c t i o n
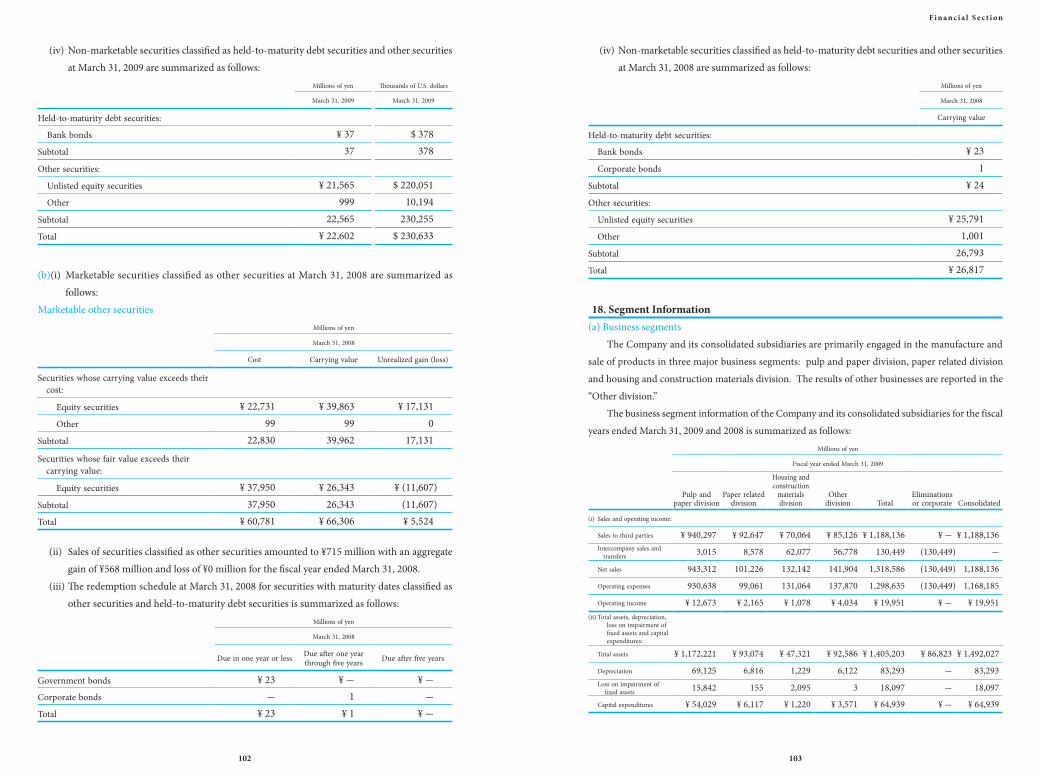
(iv) Non-marketable securities classified as held-to-maturity debt securities and other securities at March 31, 2009 are summarized as follows:
Millions of yen Thousands of U.S. dollars
March 31, 2009 March 31, 2009
Held-to-maturity debt securities:
Bank bonds ¥ 37 $ 378Subtotal 37 378
Other securities:
Unlisted equity securities ¥ 21,565 $ 220,051Other 999 10,194
Subtotal 22,565 230,255Total ¥ 22,602 $ 230,633
(b)(i) Marketable securities classified as other securities at March 31, 2008 are summarized as follows:
Marketable other securitiesMillions of yen
March 31, 2008
Cost Carrying value Unrealized gain (loss)
Se curities whose carrying value exceeds their cost:
Equity securities ¥ 22,731 ¥ 39,863 ¥ 17,131
Other 99 99 0Subtotal 22,830 39,962 17,131
Se curities whose fair value exceeds their carrying value:
Equity securities ¥ 37,950 ¥ 26,343 ¥ (11,607)
Subtotal 37,950 26,343 (11,607)Total ¥ 60,781 ¥ 66,306 ¥ 5,524
(ii) Sales of securities classified as other securities amounted to ¥715 million with an aggregate gain of ¥568 million and loss of ¥0 million for the fiscal year ended March 31, 2008.
(iii) The redemption schedule at March 31, 2008 for securities with maturity dates classified as other securities and held-to-maturity debt securities is summarized as follows:
Millions of yen
March 31, 2008
Due in one year or less Due after one year through five years Due after five years
Government bonds ¥ 23 ¥ - ¥ -Corporate bonds - 1 -Total ¥ 23 ¥ 1 ¥ -
(iv) Non-marketable securities classified as held-to-maturity debt securities and other securities at March 31, 2008 are summarized as follows:
Millions of yen
March 31, 2008
Carrying value
Held-to-maturity debt securities:
Bank bonds ¥ 23
Corporate bonds 1
Subtotal ¥ 24
Other securities:
Unlisted equity securities ¥ 25,791Other 1,001
Subtotal 26,793Total ¥ 26,817
18. Segment Information(a) Business segments
The Company and its consolidated subsidiaries are primarily engaged in the manufacture and
sale of products in three major business segments: pulp and paper division, paper related division
and housing and construction materials division. The results of other businesses are reported in the
“Other division.”
The business segment information of the Company and its consolidated subsidiaries for the fiscal
years ended March 31, 2009 and 2008 is summarized as follows:
Millions of yen
Fiscal year ended March 31, 2009
Pulp and paper division
Paper related division
Housing and construction
materials division
Other division Total
Eliminations or corporate Consolidated
(i) Sales and operating income:
Sales to third parties ¥ 940,297 ¥ 92,647 ¥ 70,064 ¥ 85,126 ¥ 1,188,136 ¥ - ¥ 1,188,136In tercompany sales and
transfers 3,015 8,578 62,077 56,778 130,449 (130,449) -
Net sales 943,312 101,226 132,142 141,904 1,318,586 (130,449) 1,188,136
Operating expenses 930,638 99,061 131,064 137,870 1,298,635 (130,449) 1,168,185
Operating income ¥ 12,673 ¥ 2,165 ¥ 1,078 ¥ 4,034 ¥ 19,951 ¥ - ¥ 19,951(ii) Total assets, depreciation,
loss on impairment of fixed assets and capital expenditures:
Total assets ¥ 1,172,221 ¥ 93,074 ¥ 47,321 ¥ 92,586 ¥ 1,405,203 ¥ 86,823 ¥ 1,492,027
Depreciation 69,125 6,816 1,229 6,122 83,293 - 83,293Lo ss on impairment of
fixed assets 15,842 155 2,095 3 18,097 - 18,097
Capital expenditures ¥ 54,029 ¥ 6,117 ¥ 1,220 ¥ 3,571 ¥ 64,939 ¥ - ¥ 64,939
102 103
F i n a n c i a l S e c t i o n
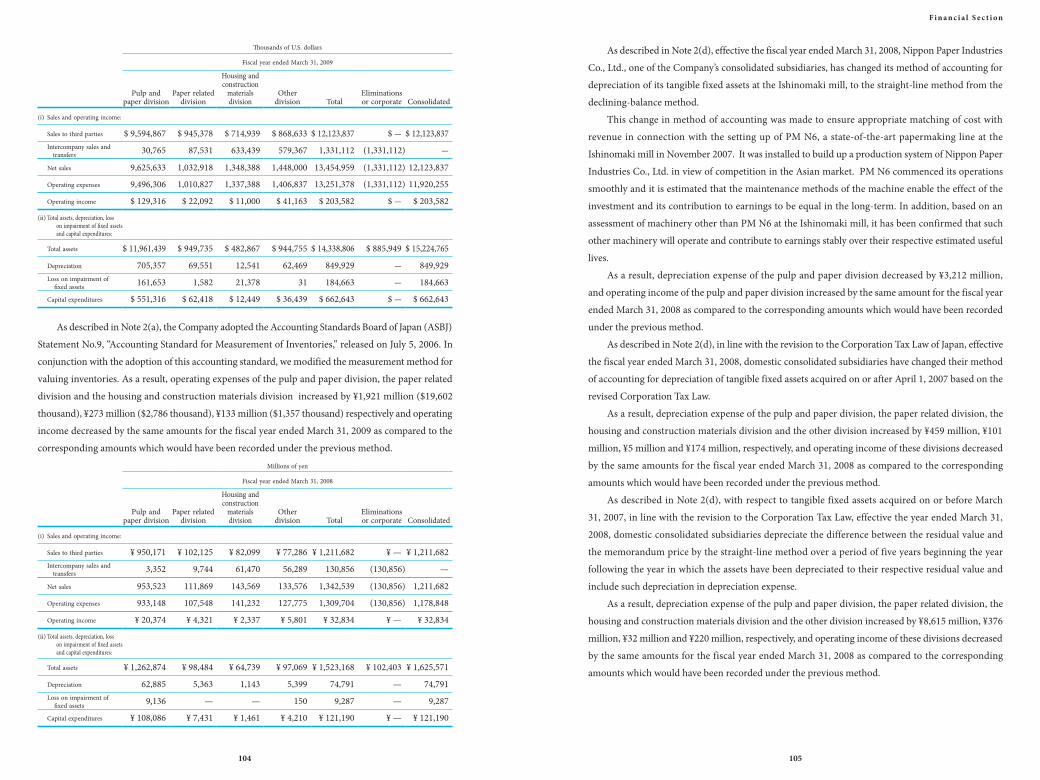
Thousands of U.S. dollars
Fiscal year ended March 31, 2009
Pulp and paper division
Paper related division
Housing and construction
materials division
Other division Total
Eliminations or corporate Consolidated
(i) Sales and operating income:
Sales to third parties $ 9,594,867 $ 945,378 $ 714,939 $ 868,633 $ 12,123,837 $ - $ 12,123,837In tercompany sales and
transfers 30,765 87,531 633,439 579,367 1,331,112 (1,331,112) -
Net sales 9,625,633 1,032,918 1,348,388 1,448,000 13,454,959 (1,331,112) 12,123,837
Operating expenses 9,496,306 1,010,827 1,337,388 1,406,837 13,251,378 (1,331,112) 11,920,255
Operating income $ 129,316 $ 22,092 $ 11,000 $ 41,163 $ 203,582 $ - $ 203,582
(ii) Total assets, depreciation, loss on impairment of fixed assets and capital expenditures:
Total assets $ 11,961,439 $ 949,735 $ 482,867 $ 944,755 $ 14,338,806 $ 885,949 $ 15,224,765
Depreciation 705,357 69,551 12,541 62,469 849,929 - 849,929Lo ss on impairment of
fixed assets 161,653 1,582 21,378 31 184,663 - 184,663
Capital expenditures $ 551,316 $ 62,418 $ 12,449 $ 36,439 $ 662,643 $ - $ 662,643
As described in Note 2(a), the Company adopted the Accounting Standards Board of Japan (ASBJ)
Statement No.9, “Accounting Standard for Measurement of Inventories,” released on July 5, 2006. In
conjunction with the adoption of this accounting standard, we modified the measurement method for
valuing inventories. As a result, operating expenses of the pulp and paper division, the paper related
division and the housing and construction materials division increased by ¥1,921 million ($19,602
thousand), ¥273 million ($2,786 thousand), ¥133 million ($1,357 thousand) respectively and operating
income decreased by the same amounts for the fiscal year ended March 31, 2009 as compared to the
corresponding amounts which would have been recorded under the previous method.
Millions of yen
Fiscal year ended March 31, 2008
Pulp and paper division
Paper related division
Housing and construction
materials division
Other division Total
Eliminations or corporate Consolidated
(i) Sales and operating income:
Sales to third parties ¥ 950,171 ¥ 102,125 ¥ 82,099 ¥ 77,286 ¥ 1,211,682 ¥ — ¥ 1,211,682In tercompany sales and
transfers 3,352 9,744 61,470 56,289 130,856 (130,856) —
Net sales 953,523 111,869 143,569 133,576 1,342,539 (130,856) 1,211,682
Operating expenses 933,148 107,548 141,232 127,775 1,309,704 (130,856) 1,178,848
Operating income ¥ 20,374 ¥ 4,321 ¥ 2,337 ¥ 5,801 ¥ 32,834 ¥ — ¥ 32,834
(ii) Total assets, depreciation, loss on impairment of fixed assets and capital expenditures:
Total assets ¥ 1,262,874 ¥ 98,484 ¥ 64,739 ¥ 97,069 ¥ 1,523,168 ¥ 102,403 ¥ 1,625,571
Depreciation 62,885 5,363 1,143 5,399 74,791 — 74,791Lo ss on impairment of
fixed assets 9,136 — — 150 9,287 — 9,287
Capital expenditures ¥ 108,086 ¥ 7,431 ¥ 1,461 ¥ 4,210 ¥ 121,190 ¥ — ¥ 121,190
As described in Note 2(d), effective the fiscal year ended March 31, 2008, Nippon Paper Industries
Co., Ltd., one of the Company’s consolidated subsidiaries, has changed its method of accounting for
depreciation of its tangible fixed assets at the Ishinomaki mill, to the straight-line method from the
declining-balance method.
This change in method of accounting was made to ensure appropriate matching of cost with
revenue in connection with the setting up of PM N6, a state-of-the-art papermaking line at the
Ishinomaki mill in November 2007. It was installed to build up a production system of Nippon Paper
Industries Co., Ltd. in view of competition in the Asian market. PM N6 commenced its operations
smoothly and it is estimated that the maintenance methods of the machine enable the effect of the
investment and its contribution to earnings to be equal in the long-term. In addition, based on an
assessment of machinery other than PM N6 at the Ishinomaki mill, it has been confirmed that such
other machinery will operate and contribute to earnings stably over their respective estimated useful
lives.
As a result, depreciation expense of the pulp and paper division decreased by ¥3,212 million,
and operating income of the pulp and paper division increased by the same amount for the fiscal year
ended March 31, 2008 as compared to the corresponding amounts which would have been recorded
under the previous method.
As described in Note 2(d), in line with the revision to the Corporation Tax Law of Japan, effective
the fiscal year ended March 31, 2008, domestic consolidated subsidiaries have changed their method
of accounting for depreciation of tangible fixed assets acquired on or after April 1, 2007 based on the
revised Corporation Tax Law.
As a result, depreciation expense of the pulp and paper division, the paper related division, the
housing and construction materials division and the other division increased by ¥459 million, ¥101
million, ¥5 million and ¥174 million, respectively, and operating income of these divisions decreased
by the same amounts for the fiscal year ended March 31, 2008 as compared to the corresponding
amounts which would have been recorded under the previous method.
As described in Note 2(d), with respect to tangible fixed assets acquired on or before March
31, 2007, in line with the revision to the Corporation Tax Law, effective the year ended March 31,
2008, domestic consolidated subsidiaries depreciate the difference between the residual value and
the memorandum price by the straight-line method over a period of five years beginning the year
following the year in which the assets have been depreciated to their respective residual value and
include such depreciation in depreciation expense.
As a result, depreciation expense of the pulp and paper division, the paper related division, the
housing and construction materials division and the other division increased by ¥8,615 million, ¥376
million, ¥32 million and ¥220 million, respectively, and operating income of these divisions decreased
by the same amounts for the fiscal year ended March 31, 2008 as compared to the corresponding
amounts which would have been recorded under the previous method.
104 105
F i n a n c i a l S e c t i o n

(b) Geographic segmentsSince sales recognized by companies located in Japan constituted 90% or more of consolidated
sales for the fiscal years ended March 31, 2009 and 2008, geographical segment information has not
been presented.
(c) Overseas salesSince overseas sales represented less than 10% of consolidated sales for the fiscal years ended
March 31, 2009 and 2008, no disclosure of overseas sales information has been presented.
19. Research and Development CostsIncluded in cost of sales and selling, general and administrative expenses were ¥6,500 million
($66,327 thousand) and ¥6,484 million of research and development costs for the fiscal years ended
March 31, 2009 and 2008, respectively.
20. Related Party Transactions(a) Related Party Transactions for the year ended March 31, 2009(i) Transactions of the Company with related parties: There is no related party transaction to be disclosed.(ii) Transactions of the Company’s consolidated subsidiaries with related parties:
Attribute Affiliated company (including its subsidiaries)
Name of related party Daishowa-Marubeni International Ltd.
Address British Columbia/Canada
Capital CAN$ 262,000 thousand
Nature of operations Manufacturing and selling pulp
Equity ownership percentage Directly 50.0%
Description of the business relationship Combination of offices of director
Nature of transactions Guarantee for debt
Transaction amount during the year ended March 31, 2009 ¥18,499 million ($ 188,765 thousand)
Accounts —
Balance at March 31, 2009 —
Note: Guarantee for bank loan, for which the Company’s consolidated subsidiary receives no guarantee fee.
(b) Information on the parent company and significant affiliate companies(i) Information on the parent company: None(ii) Financial statement of other significant affiliate companies: There is no financial statement to be disclosed.
(Additional Information) From the fiscal year ended March 31, 2009 the Company adopted the Accounting
Standard for Related Party Disclosures (ASBJ Statement No.11 on October 17, 2006) and the Guidance on Accounting Standard for Related Party Disclosures (ASBJ Guidance No.13 on October 17, 2006).
As a result, transactions between consolidated subsidiaries and affiliates are newly added to disclose.
21. Subsequent Events(a) The following appropriation of retained earnings of the Company, which has not been reflected
in the accompanying consolidated financial statements for the fiscal year ended March 31, 2009,
was approved at the annual general meeting of shareholders held on June 26, 2009:
Millions of yen Thousands of U.S. dollars
Year-end cash dividends
(¥40.00 (U.S.$0.41) per share) ¥ 4,487 $ 45,786¥ 4,487 $ 45,786
(b) Acquisition of shares in Paper Australia Pty LtdNippon Paper Industries Co., Ltd., a wholly owned subsidiary of the Company acquired all
outstanding shares in Paper Australia Pty Ltd (“AP”), headquartered in Victoria, Australia, on June 1,
2009. This fulfilled a February 16, 2009 acquisition agreement with PaperlinX Limited (“PPX”), also
headquartered in Victoria.
(1) Objective of acquisition To contribute, through expansion and growth of overseas operations, to the Company’s
“Group Vision 2015” goal of being one of the top five pulp and paper groups worldwide.
(2) Counterparty PaperlinX Limited
(3) Name, description, and size of acquired company Name: Paper Australia Pty Ltd
Business: Manufacture and sales of paper, pulp, and stationary, such as
envelopes and notebooks
Size (FY 2008 as of June 30) Sales: A$914 million
Total assets: A$1,459 million
(4) Acquisition date June 1, 2009
106 107
F i n a n c i a l S e c t i o n
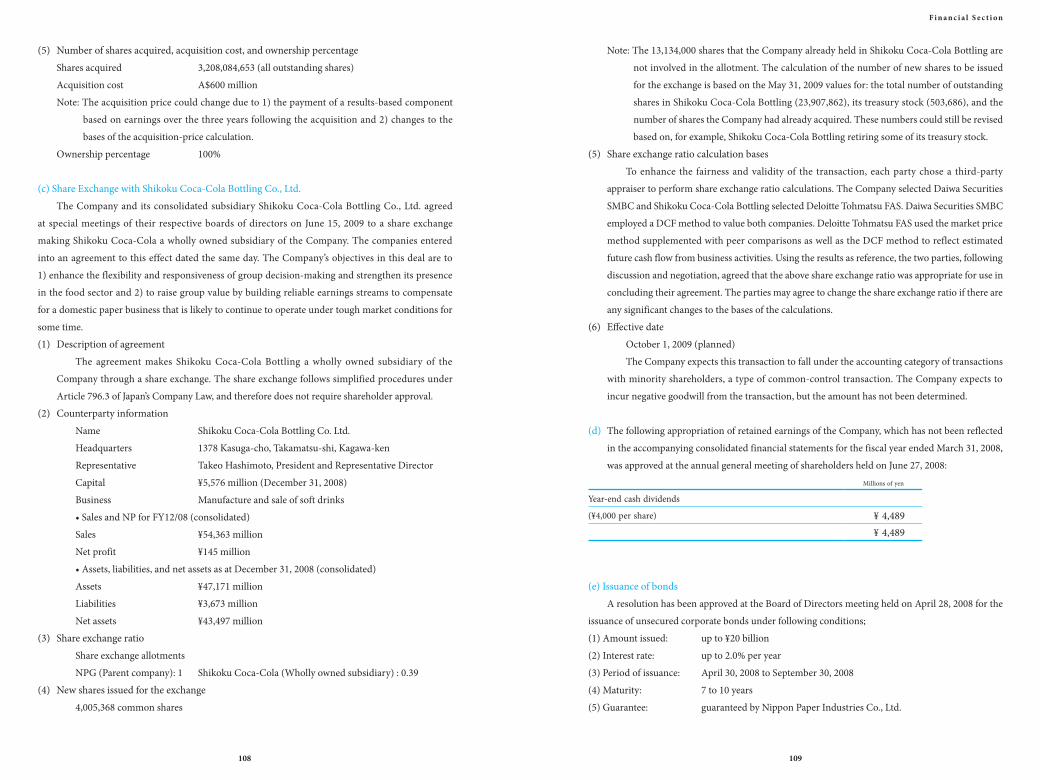
(5) Number of shares acquired, acquisition cost, and ownership percentageShares acquired 3,208,084,653 (all outstanding shares)
Acquisition cost A$600 million
Note: The acquisition price could change due to 1) the payment of a results-based component
based on earnings over the three years following the acquisition and 2) changes to the
bases of the acquisition-price calculation.
Ownership percentage 100%
(c) Share Exchange with Shikoku Coca-Cola Bottling Co., Ltd.The Company and its consolidated subsidiary Shikoku Coca-Cola Bottling Co., Ltd. agreed
at special meetings of their respective boards of directors on June 15, 2009 to a share exchange
making Shikoku Coca-Cola a wholly owned subsidiary of the Company. The companies entered
into an agreement to this effect dated the same day. The Company’s objectives in this deal are to
1) enhance the flexibility and responsiveness of group decision-making and strengthen its presence
in the food sector and 2) to raise group value by building reliable earnings streams to compensate
for a domestic paper business that is likely to continue to operate under tough market conditions for
some time.
(1) Description of agreementThe agreement makes Shikoku Coca-Cola Bottling a wholly owned subsidiary of the
Company through a share exchange. The share exchange follows simplified procedures under
Article 796.3 of Japan’s Company Law, and therefore does not require shareholder approval.
(2) Counterparty informationName Shikoku Coca-Cola Bottling Co. Ltd.
Headquarters 1378 Kasuga-cho, Takamatsu-shi, Kagawa-ken
Representative Takeo Hashimoto, President and Representative Director
Capital ¥5,576 million (December 31, 2008)
Business Manufacture and sale of soft drinks
• Sales and NP for FY12/08 (consolidated)
Sales ¥54,363 million
Net profit ¥145 million
• Assets, liabilities, and net assets as at December 31, 2008 (consolidated)
Assets ¥47,171 million
Liabilities ¥3,673 million
Net assets ¥43,497 million
(3) Share exchange ratioShare exchange allotments
NPG (Parent company): 1 Shikoku Coca-Cola (Wholly owned subsidiary) : 0.39
(4) New shares issued for the exchange4,005,368 common shares
Note: The 13,134,000 shares that the Company already held in Shikoku Coca-Cola Bottling are
not involved in the allotment. The calculation of the number of new shares to be issued
for the exchange is based on the May 31, 2009 values for: the total number of outstanding
shares in Shikoku Coca-Cola Bottling (23,907,862), its treasury stock (503,686), and the
number of shares the Company had already acquired. These numbers could still be revised
based on, for example, Shikoku Coca-Cola Bottling retiring some of its treasury stock.
(5) Share exchange ratio calculation basesTo enhance the fairness and validity of the transaction, each party chose a third-party
appraiser to perform share exchange ratio calculations. The Company selected Daiwa Securities
SMBC and Shikoku Coca-Cola Bottling selected Deloitte Tohmatsu FAS. Daiwa Securities SMBC
employed a DCF method to value both companies. Deloitte Tohmatsu FAS used the market price
method supplemented with peer comparisons as well as the DCF method to reflect estimated
future cash flow from business activities. Using the results as reference, the two parties, following
discussion and negotiation, agreed that the above share exchange ratio was appropriate for use in
concluding their agreement. The parties may agree to change the share exchange ratio if there are
any significant changes to the bases of the calculations.
(6) Effective dateOctober 1, 2009 (planned)
The Company expects this transaction to fall under the accounting category of transactions
with minority shareholders, a type of common-control transaction. The Company expects to
incur negative goodwill from the transaction, but the amount has not been determined.
(d) The following appropriation of retained earnings of the Company, which has not been reflected
in the accompanying consolidated financial statements for the fiscal year ended March 31, 2008,
was approved at the annual general meeting of shareholders held on June 27, 2008:
Millions of yen
Year-end cash dividends
(¥4,000 per share) ¥ 4,489¥ 4,489
(e) Issuance of bondsA resolution has been approved at the Board of Directors meeting held on April 28, 2008 for the
issuance of unsecured corporate bonds under following conditions;
(1) Amount issued: up to ¥20 billion
(2) Interest rate: up to 2.0% per year
(3) Period of issuance: April 30, 2008 to September 30, 2008
(4) Maturity: 7 to 10 years
(5) Guarantee: guaranteed by Nippon Paper Industries Co., Ltd.
108 109
F i n a n c i a l S e c t i o n

(f) Stock split and adoption of unit share systemThe Company’s Board of Directors approved a resolution for the implementation of a stock split
and the adoption of a unit share system at a meeting held on May 23, 2008.
(1) PurposeThe electronic share certificate system, which will go into effect in January 2009 once
the “Law for Partial Amendment of the Laws related to Transfer of Bonds, etc., to Streamline
Settlement with respect to Transactions of Stock, etc” (Law No. 88 of 2004) “(the Stock Settlement
Streamlining Law)” goes into effect, does not provide for fractional shares and, accordingly, the
Company has determined to implement a stock split and adopt a unit share system in order to
cease its fractional share system.
No substantive changes in investment units will take place in conjunction with this stock
split and adoption of the unit share system.
(2) Overview of the stock split and the unit share systemShares of common stocks will be split at a ratio of 100 shares for each share, and the
minimum investment unit will comprise of 100 shares of common stocks.
Record date: The date two days prior to the date on which the Stock Settlement
Streamlining Law goes into effect.
Effective date: The date immediately preceding the date on which the Stock
Settlement Streamlining Law goes into effect.
Report of Independent Auditors
The Board of DirectorsNippon Paper Group, Inc.
We have audited the accompanying consolidated balance sheets of Nippon Paper Group, Inc. and consolidated subsidiaries as of March 31, 2009 and 2008, and the related consolidated statements of operations, changes in net assets, and cash flows for the years then ended, all expressed in yen. These financial statements are the responsibility of the Company’s management. Our responsibility is to express an opinion on these financial statements based on our audits.
We conducted our audits in accordance with auditing standards generally accepted in Japan. Those standards require that we plan and perform the audit to obtain reasonable assurance about whether the financial statements are free of material misstatement. An audit includes examining, on a test basis, evidence supporting the amounts and disclosures in the financial statements. An audit also includes assessing the accounting principles used and significant estimates made by management, as well as evaluating the overall financial statement presentation. We believe that our audits provide a reasonable basis for our opinion.
In our opinion, the financial statements referred to above present fairly, in all material respects, the consolidated financial position of Nippon Paper Group, Inc. and consolidated subsidiaries at March 31, 2009 and 2008, and the consolidated results of their operations and their cash flows for the years then ended in conformity with accounting principles generally accepted in Japan.
Supplemental InformationAs described in Note 2(a), effective April 1, 2008, the Company and its consolidated domestic
subsidiaries adopted the Accounting Standard for Measurement of Inventories.As described in Note 21(b), Nippon Paper Industries Co., Ltd., a wholly owned subsidiary of the
Company acquired all the outstanding shares in Paper Australia Pty. Ltd. on June 1, 2009 under an acquisition agreement with PaperlinX Limited entered into on February 16, 2009.
As described in Note 21(c), the Company and its consolidated subsidiary Shikoku Coca-Cola Bottling Co., Ltd. agreed at special meetings of their respective boards of directors on June 15, 2009 to a share exchange making Shikoku Coca-Cola Bottling Co., Ltd. a wholly owned subsidiary of the Company.
As described in Note 2(d), effective the fiscal year ended March 31, 2008, a certain consolidated subsidiary has changed its method of accounting for depreciation of tangible fixed assets.
The U.S. dollar amounts in the accompanying consolidated financial statements with respect to the fiscal year ended March 31, 2009 are presented solely for convenience. Our audit also included the translation of yen amounts into U.S. dollar amounts and, in our opinion, such translation has been made on the basis described in Note 3.
June 26, 2009
110 111
F i n a n c i a l S e c t i o n

Global Network
114 Domestic Network116 Overseas Network
112 113
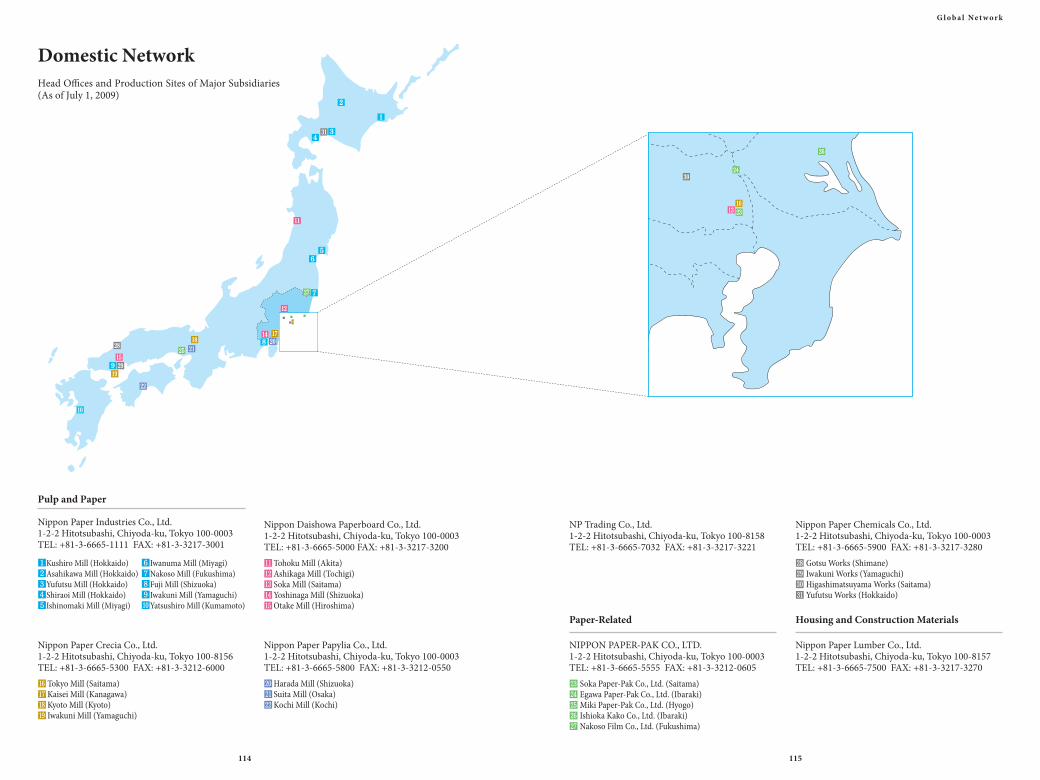
Pulp and Paper
Nippon Paper Industries Co., Ltd. 1-2-2 Hitotsubashi, Chiyoda-ku, Tokyo 100-0003TEL: +81-3-6665-1111 FAX: +81-3-3217-3001
NP Trading Co., Ltd.1-2-2 Hitotsubashi, Chiyoda-ku, Tokyo 100-8158TEL: +81-3-6665-7032 FAX: +81-3-3217-3221
1Kushiro Mill (Hokkaido)2Asahikawa Mill (Hokkaido)3Yufutsu Mill (Hokkaido)4Shiraoi Mill (Hokkaido)5Ishinomaki Mill (Miyagi)
6Iwanuma Mill (Miyagi)7Nakoso Mill (Fukushima)8Fuji Mill (Shizuoka)9Iwakuni Mill (Yamaguchi)�Yatsushiro Mill (Kumamoto)
Paper-Related
NIPPON PAPER-PAK CO., LTD.1-2-2 Hitotsubashi, Chiyoda-ku, Tokyo 100-0003TEL: +81-3-6665-5555 FAX: +81-3-3212-0605
Nippon Daishowa Paperboard Co., Ltd.1-2-2 Hitotsubashi, Chiyoda-ku, Tokyo 100-0003TEL: +81-3-6665-5000 FAX: +81-3-3217-3200�Tohoku Mill (Akita)�Ashikaga Mill (Tochigi)�Soka Mill (Saitama)�Yoshinaga Mill (Shizuoka)�Otake Mill (Hiroshima)
� Soka Paper-Pak Co., Ltd. (Saitama)� Egawa Paper-Pak Co., Ltd. (Ibaraki)� Miki Paper-Pak Co., Ltd. (Hyogo)� Ishioka Kako Co., Ltd. (Ibaraki)� Nakoso Film Co., Ltd. (Fukushima)
Nippon Paper Crecia Co., Ltd. 1-2-2 Hitotsubashi, Chiyoda-ku, Tokyo 100-8156TEL: +81-3-6665-5300 FAX: +81-3-3212-6000
Nippon Paper Chemicals Co., Ltd.1-2-2 Hitotsubashi, Chiyoda-ku, Tokyo 100-0003TEL: +81-3-6665-5900 FAX: +81-3-3217-3280
�Tokyo Mill (Saitama)�Kaisei Mill (Kanagawa)�Kyoto Mill (Kyoto)� Iwakuni Mill (Yamaguchi)
� Gotsu Works (Shimane)� Iwakuni Works (Yamaguchi)� Higashimatsuyama Works (Saitama)� Yufutsu Works (Hokkaido)
Nippon Paper Papylia Co., Ltd.1-2-2 Hitotsubashi, Chiyoda-ku, Tokyo 100-0003TEL: +81-3-6665-5800 FAX: +81-3-3212-0550
Housing and Construction Materials
Nippon Paper Lumber Co., Ltd.1-2-2 Hitotsubashi, Chiyoda-ku, Tokyo 100-8157TEL: +81-3-6665-7500 FAX: +81-3-3217-3270
�Harada Mill (Shizuoka)�Suita Mill (Osaka)�Kochi Mill (Kochi)
Head Offices and Production Sites of Major Subsidiaries (As of July 1, 2009)
Domestic Network
114 115
G l o b a l Ne t w o r k
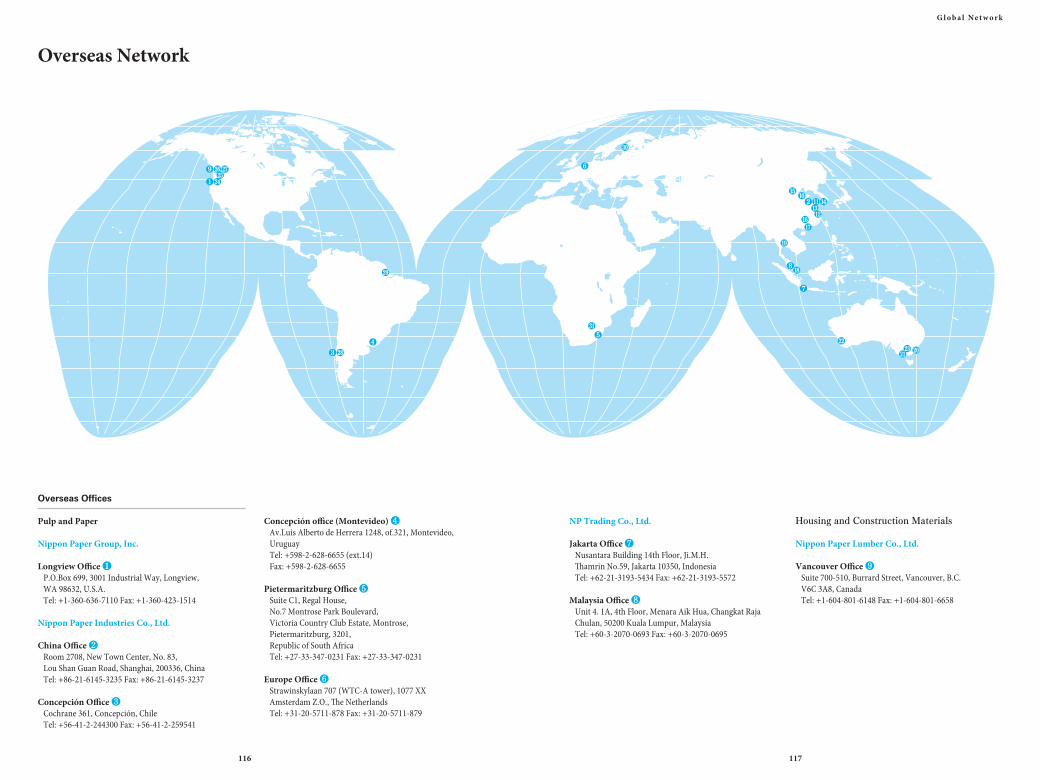
Overseas Offices
Pulp and Paper
Nippon Paper Group, Inc.
Longview Office ❶P.O.Box 699, 3001 Industrial Way, Longview, WA 98632, U.S.A.Tel: +1-360-636-7110 Fax: +1-360-423-1514
Nippon Paper Industries Co., Ltd.
China Office ❷Room 2708, New Town Center, No. 83, Lou Shan Guan Road, Shanghai, 200336, ChinaTel: +86-21-6145-3235 Fax: +86-21-6145-3237
Concepción Office ❸Cochrane 361, Concepción, ChileTel: +56-41-2-244300 Fax: +56-41-2-259541
Concepción office (Montevideo) ❹Av.Luis Alberto de Herrera 1248, of.321, Montevideo, UruguayTel: +598-2-628-6655 (ext.14)Fax: +598-2-628-6655
Pietermaritzburg Office ❺Suite C1, Regal House,No.7 Montrose Park Boulevard,Victoria Country Club Estate, Montrose,Pietermaritzburg, 3201, Republic of South AfricaTel: +27-33-347-0231 Fax: +27-33-347-0231
Europe Office ❻Strawinskylaan 707 (WTC-A tower), 1077 XX Amsterdam Z.O., The NetherlandsTel: +31-20-5711-878 Fax: +31-20-5711-879
Overseas Network
NP Trading Co., Ltd.
Jakarta Office ❼Nusantara Building 14th Floor, Ji.M.H. Thamrin No.59, Jakarta 10350, IndonesiaTel: +62-21-3193-5434 Fax: +62-21-3193-5572
Malaysia Office ❽Unit 4. 1A, 4th Floor, Menara Aik Hua, Changkat Raja Chulan, 50200 Kuala Lumpur, MalaysiaTel: +60-3-2070-0693 Fax: +60-3-2070-0695
Housing and Construction Materials
Nippon Paper Lumber Co., Ltd.
Vancouver Office ❾Suite 700-510, Burrard Street, Vancouver, B.C. V6C 3A8, CanadaTel: +1-604-801-6148 Fax: +1-604-801-6658
116 117
G l o b a l Ne t w o r k
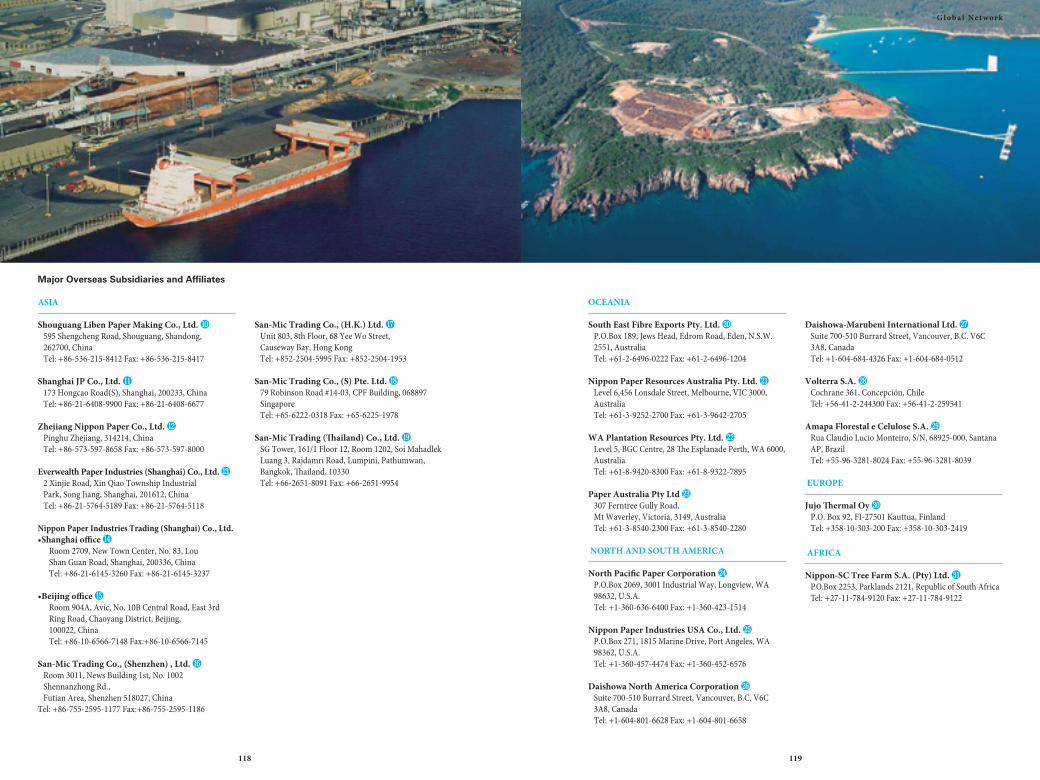
Major Overseas Subsidiaries and Affiliates
ASIA
Shouguang Liben Paper Making Co., Ltd. �595 Shengcheng Road, Shouguang, Shandong, 262700, ChinaTel: +86-536-215-8412 Fax: +86-536-215-8417
Shanghai JP Co., Ltd. �173 Hongcao Road(S), Shanghai, 200233, ChinaTel: +86-21-6408-9900 Fax: +86-21-6408-6677
Zhejiang Nippon Paper Co., Ltd. �Pinghu Zhejiang, 314214, ChinaTel: +86-573-597-8658 Fax: +86-573-597-8000
Everwealth Paper Industries (Shanghai) Co., Ltd. �2 Xinjie Road, Xin Qiao Township Industrial Park, Song Jiang, Shanghai, 201612, ChinaTel: +86-21-5764-5189 Fax: +86-21-5764-5118
Nippon Paper Industries Trading (Shanghai) Co., Ltd.•Shanghai office �
Room 2709, New Town Center, No. 83, Lou Shan Guan Road, Shanghai, 200336, ChinaTel: +86-21-6145-3260 Fax: +86-21-6145-3237
•Beijing office �Room 904A, Avic, No. 10B Central Road, East 3rd Ring Road, Chaoyang District, Beijing, 100022, ChinaTel: +86-10-6566-7148 Fax:+86-10-6566-7145
San-Mic Trading Co., (Shenzhen) , Ltd. �Room 3011, News Building 1st, No. 1002 Shennanzhong Rd.,Futian Area, Shenzhen 518027, China
Tel: +86-755-2595-1177 Fax:+86-755-2595-1186
San-Mic Trading Co., (H.K.) Ltd. �Unit 803, 8th Floor, 68 Yee Wo Street, Causeway Bay, Hong KongTel: +852-2504-5995 Fax: +852-2504-1953
San-Mic Trading Co., (S) Pte. Ltd. �79 Robinson Road #14-03, CPF Building, 068897 SingaporeTel: +65-6222-0318 Fax: +65-6225-1978
San-Mic Trading (Thailand) Co., Ltd. �SG Tower, 161/1 Floor 12, Room 1202, Soi Mahadlek Luang 3, Rajdamri Road, Lumpini, Pathumwan, Bangkok, Thailand, 10330Tel: +66-2651-8091 Fax: +66-2651-9954
OCEANIA
South East Fibre Exports Pty. Ltd. �P.O.Box 189, Jews Head, Edrom Road, Eden, N.S.W. 2551, AustraliaTel: +61-2-6496-0222 Fax: +61-2-6496-1204
Nippon Paper Resources Australia Pty. Ltd. �Level 6,456 Lonsdale Street, Melbourne, VIC 3000, AustraliaTel: +61-3-9252-2700 Fax: +61-3-9642-2705
WA Plantation Resources Pty. Ltd. �Level 5, BGC Centre, 28 The Esplanade Perth, WA 6000, AustraliaTel: +61-8-9420-8300 Fax: +61-8-9322-7895
Paper Australia Pty Ltd �307 Ferntree Gully Road,Mt Waverley, Victoria, 3149, AustraliaTel: +61-3-8540-2300 Fax: +61-3-8540-2280
NORTH AND SOUTH AMERICA
North Pacific Paper Corporation �P.O.Box 2069, 3001 Industrial Way, Longview, WA 98632, U.S.A.Tel: +1-360-636-6400 Fax: +1-360-423-1514
Nippon Paper Industries USA Co., Ltd. �P.O.Box 271, 1815 Marine Drive, Port Angeles, WA 98362, U.S.A.Tel: +1-360-457-4474 Fax: +1-360-452-6576
Daishowa North America Corporation �Suite 700-510 Burrard Street, Vancouver, B.C. V6C 3A8, CanadaTel: +1-604-801-6628 Fax: +1-604-801-6658
Daishowa-Marubeni International Ltd. �Suite 700-510 Burrard Street, Vancouver, B.C. V6C 3A8, CanadaTel: +1-604-684-4326 Fax: +1-604-684-0512
Volterra S.A. �Cochrane 361, Concepción, ChileTel: +56-41-2-244300 Fax: +56-41-2-259541
Amapa Florestal e Celulose S.A. �Rua Claudio Lucio Monteiro, S/N, 68925-000, Santana AP, BrazilTel: +55-96-3281-8024 Fax: +55-96-3281-8039
EUROPE
Jujo Thermal Oy �P.O. Box 92, FI-27501 Kauttua, FinlandTel: +358-10-303-200 Fax: +358-10-303-2419
AFRICA
Nippon-SC Tree Farm S.A. (Pty) Ltd. �P.O.Box 2253, Parklands 2121, Republic of South AfricaTel: +27-11-784-9120 Fax: +27-11-784-9122
118 119
G l o b a l Ne t w o r k
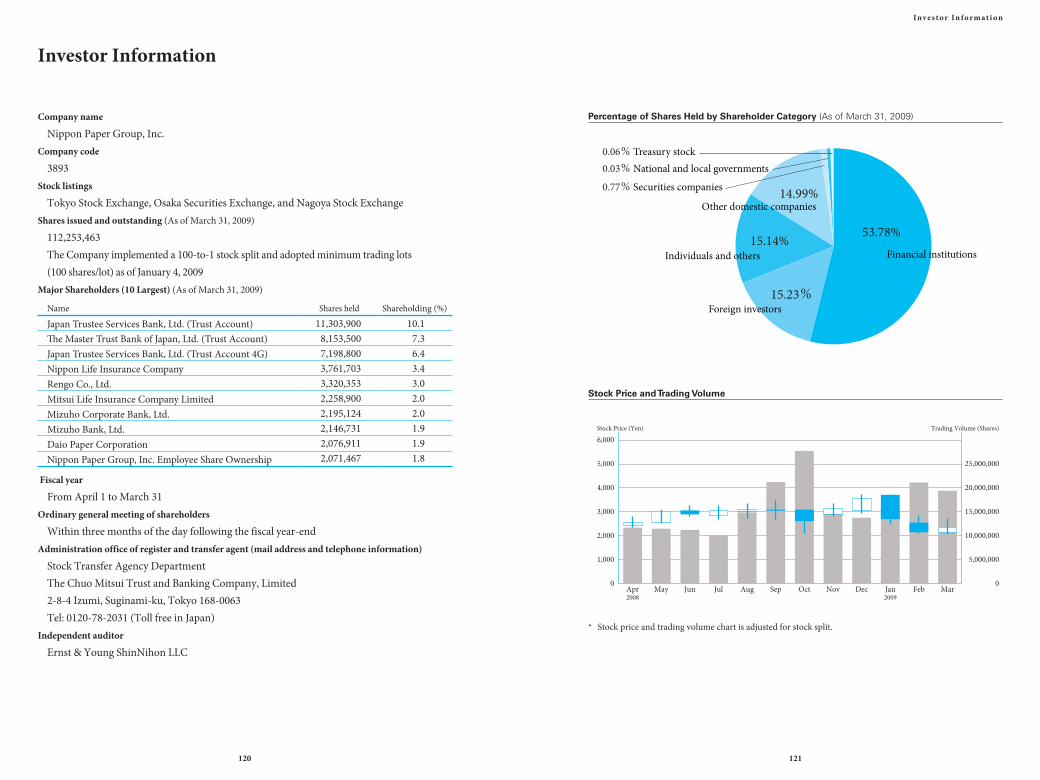
Company name
Nippon Paper Group, Inc.Company code
3893Stock listings
Tokyo Stock Exchange, Osaka Securities Exchange, and Nagoya Stock ExchangeShares issued and outstanding (As of March 31, 2009)
112,253,463The Company implemented a 100-to-1 stock split and adopted minimum trading lots (100 shares/lot) as of January 4, 2009
Major Shareholders (10 Largest) (As of March 31, 2009)
Fiscal year
From April 1 to March 31Ordinary general meeting of shareholders
Within three months of the day following the fiscal year-endAdministration office of register and transfer agent (mail address and telephone information)
Stock Transfer Agency DepartmentThe Chuo Mitsui Trust and Banking Company, Limited2-8-4 Izumi, Suginami-ku, Tokyo 168-0063Tel: 0120-78-2031 (Toll free in Japan)
Independent auditor
Ernst & Young ShinNihon LLC
I n v e s t o r I n f o r m a t i o n
Percentage of Shares Held by Shareholder Category (As of March 31, 2009)
Investor Information
Name Shares held Shareholding (%)
Japan Trustee Services Bank, Ltd. (Trust Account)The Master Trust Bank of Japan, Ltd. (Trust Account)Japan Trustee Services Bank, Ltd. (Trust Account 4G)Nippon Life Insurance CompanyRengo Co., Ltd.Mitsui Life Insurance Company LimitedMizuho Corporate Bank, Ltd.Mizuho Bank, Ltd.Daio Paper CorporationNippon Paper Group, Inc. Employee Share Ownership
Stock Price and Trading Volume
* Stock price and trading volume chart is adjusted for stock split.
11,303,9008,153,5007,198,8003,761,7033,320,3532,258,9002,195,1242,146,7312,076,9112,071,467
10.17.36.43.43.02.02.01.91.91.8
120 121
We hope the future activities of
Nippon Paper Group
will meet your expectations.
1-2-2 Hitotsubashi, Chiyoda-ku, Tokyo 100-0003, JAPANTel: +81-3-6665-1003 Fax: +81-3-3217-3003
IR MailNippon Paper Group’s press releases, financial releases and results, and other communications are available via email notices.Please subscribe on our E-mail Alerts Service page at our IR website:
URL: http://www.np-g.com/e/ir/
Sustainability ReportIssue 2009 will be published in October 2009.
InquiriesCSR Department
Tel: +81-3-6665-1015Fax: +81-3-3217-3009URL: http://www.np-g.com/e/csr/
Investor Relations Office
Investor Information
The new Nippon Paper Group headquarters building
Papers used in this report
Nippon Paper Industries Co., Ltd. Cover: U-Lite 157 g/m2
Text: N) Be-Seven 87 g/m2
Financial Section: Leaf Bulky White 60.2 g/m2
Nippon Paper Papylia Co., Ltd. Text: Oak GC Bright 56 g/m2
122