Embed Size (px)
Citation preview
The Science of the Total Environment 311(2003) 65–80
0048-9697/03/$ - see front matter� 2003 Elsevier Science B.V. All rights reserved.doi:10.1016/S0048-9697(03)00137-2
Drinking water quality in the Ethiopian section of the East AfricanRift Valley I—data and health aspects
Clemens Reimann *, Kjell Bjorvatn , Bjørn Frengstad , Zenebe Melaku ,a, b a c
Redda Tekle-Haimanot , Ulrich Siewersc d
Geological Survey of Norway, N-7491 Trondheim, Norwaya
Institute for Dental Research, University of Bergen, Arstadvei 17, N-5009 Bergen, Norwayb ˚Medical Faculty, Addis Ababa University, P.O. Box 1176, Addis Ababa, Ethiopiac
Federal Institute for Geosciences and Natural Resources, P.O. Box 510153, D-30631 Hannover, Germanyd
Abstract
Drinking water samples were collected throughout the Ethiopian part of the Rift Valley, separated into water drawnfrom deep wells(deeper than 60 m), shallow wells(-60 m deep), hot springs(T)36 8C), springs(T-32 8C) andrivers. A total of 138 samples were analysed for 70 parameters(Ag, Al, As, B, Ba, Be, Bi, Br, Ca, Cd, Ce, Cl, Co,Cr, Cs, Cu, Dy, Er, Eu, F, Fe, Ga, Gd, Ge, Hf, Hg, Ho, I, In, K, La, Li, Lu, Mg, Mn, Mo, Na, Nb, Nd, Ni, NO ,2
NO , Pb, Pr, Rb, Sb, Se, Si, Sm, Sn, SO , Sr, Ta, Tb, Te, Th, Ti, Tl, Tm, U, V, W, Y, Yb, Zn, Zr, temperature, pH,3 4
conductivity and alkalinity) with ion chromatography(anions), spectrometry(ICP-OES and ICP-MS, cations) andparameter-specific(e.g. titration) techniques. In terms of European water directives and WHO guidelines, 86% of allwells yield water that fails to pass the quality standards set for drinking water. The most problematic element isfluoride (F), for which 33% of all samples returned values above 1.5 mgyl and up to 11.6 mgyl. The incidence ofdental and skeletal fluorosis is well documented in the Rift Valley. Another problematic element may be uranium(U)—47% of all wells yield water with concentrations above the newly suggested WHO maximum acceptableconcentration(MAC) of 2 mgyl. Fortunately, only 7% of the collected samples are above the 10mgyl EU-MAC forAs in drinking water.� 2003 Elsevier Science B.V. All rights reserved.
Keywords: Drinking water quality; Ethiopia; East African Rift Valley; Multi element analyses; Fluorosis; Arsenic; Uranium
1. Introduction
Increasing population density, and scarcity andpollution of surface waters pose a serious problemfor drinking water supplies in Ethiopia. Further-more, drinking water may not be available wherethe people live, and—according to tradition—
*Corresponding author. Tel.:q47-73-904307; fax:q47-73-921620.
E-mail address: [email protected](C. Reimann).
women often have to walk for hours to get thedaily water ration for a family. Thus, the Ethiopiangovernment and international donor agencies haveoften sponsored drilling of groundwater wells. Theuse of groundwater is thus increasing sharply inEthiopia.It is often assumed that natural, uncontaminated
waters from deep(bedrock) wells are clean andhealthy(Banks et al., 1998b). This is usually truewith regards to bacteriological composition. The
66 C. Reimann et al. / The Science of the Total Environment 311 (2003) 65–80
inorganic chemical quality of these waters is,however, rarely adequately tested before the wellsare put into production. Due to variations in theregional geology and wateryrock interactions, highconcentrations of many chemical elements canoccur in such waters. During the last 5–10 yearsseveral studies have shown that wells in areas withparticular geological features yield water that doesnot meet established drinking water norms(e.g.Varsanyi et al., 1991; Bjorvatn et al., 1992, 1994;Edmunds and Trafford, 1993; Banks et al.,1995a,b, 1998a; Sæther et al., 1995; Reimann etal., 1996; Edmunds and Smedley, 1996; Smedleyet al., 1996; Williams et al., 1996; Morland et al.,1997, 1998; Midtgard et al., 1998; Misund et al.,˚1999; Frengstad et al., 2000) without any influencefrom anthropogenic contamination. These studiesalso document that quite a number of elements forwhich no drinking water guideline values(GL) ormaximum acceptable concentration limits(MAC)have been established can occur at unpleasantlyhigh levels in natural well waters(e.g. Be, Th,Tl). In Norway, F and radon(Rn) are the mostproblematic elements(see Frengstad et al., 2000)in terms of possible health effects. In Hungary,Bangladesh and India, arsenic represents one ofthe most drastic examples of unwanted naturalchemical ‘contamination’ of groundwater. Several100 000 people in these regions suffer skin cancerdue to high As concentrations in drinking waterfrom drilled wells (Chatterjee et al., 1995; Das etal., 1995; Smith et al., 2000; Smedley and Kinni-burgh, 2002).After many years of use of drinking water from
drilled wells in the Rift Valley, Ethiopia, dentaland skeletal fluorosis has become a serious medicalproblem(Tekle-Haimanot et al., 1987; Tekle-Hai-manot 1990; Kloos and Tekle-Haimanot, 1999).Fluorosis due to a high intake of fluoride fromdrinking waters has previously been reported fromseveral parts of the world, e.g. Algeria and Kenya(Tjook, 1983), China (Zhaoli et al., 1989), India(Handa, 1975; Teotia et al., 1981), Sri Lanka(Dissanayake, 1991) and even Norway(Bjorvatnet al., 1992). High values of F in well water fromthe Rift Valley were reported as early as 1953(Ockerse, 1953, Kenya).
A program to test drinking water from wellsfrom all over Ethiopia for fluoride concentrationis now under way. The Rift Valley is one of fewactive rifts on the Earth’s land area. Rocks in theRift Valley are mostly young volcanic rocks. Anabundance of thermal springs indicates the ongoingvolcanic activity in the area. Volcanic emanationsare often high in elements such as As, B, F andLi. Thus, it appeared advisable to have Rift Valleydrinking water quality—in addition to F—charac-terised for as many chemical elements as possible.As part of an Ethiopian-wide sampling program,additional drinking water samples from the RiftValley were collected for multi-element analysis.The first results are presented here.Concerning the chemical quality of drinking
water and health issues, most emphasis has beenplaced onexcessive amounts of various elements.It should be noted, however, that water-relatedhealth problems can also occur due to elementdeficiencies. This problem is not covered by pres-ent-day water regulations. Such deficiencies occurmost often in rural communities in developingcountries, where mainly locally produced waterand food are consumed. Deficiency-related healthproblems may result from low levels of elementssuch as F, I and Se in drinking water(F: Rajagopaland Tobin, 1991; I: Kelly and Sneddon, 1960; Se:Lag, 1984).˚The present paper reports analytical results for
65 chemical elements and five additional parame-ters in 138 drinking water samples from varioussources in the Rift Valley, Ethiopia. Althoughresults for all elements are given, the discussionin this paper is focussed on a selection of elementsthat may have direct health relevance. This paperis the first publication in a series on various hydro-geochemical aspects of Rift Valley water sources.It is focused on the presentation of data andcomparison of different drinking water sources(deep and shallow wells, springs, hot springs andriver water) in relation to health aspects.
2. The survey area
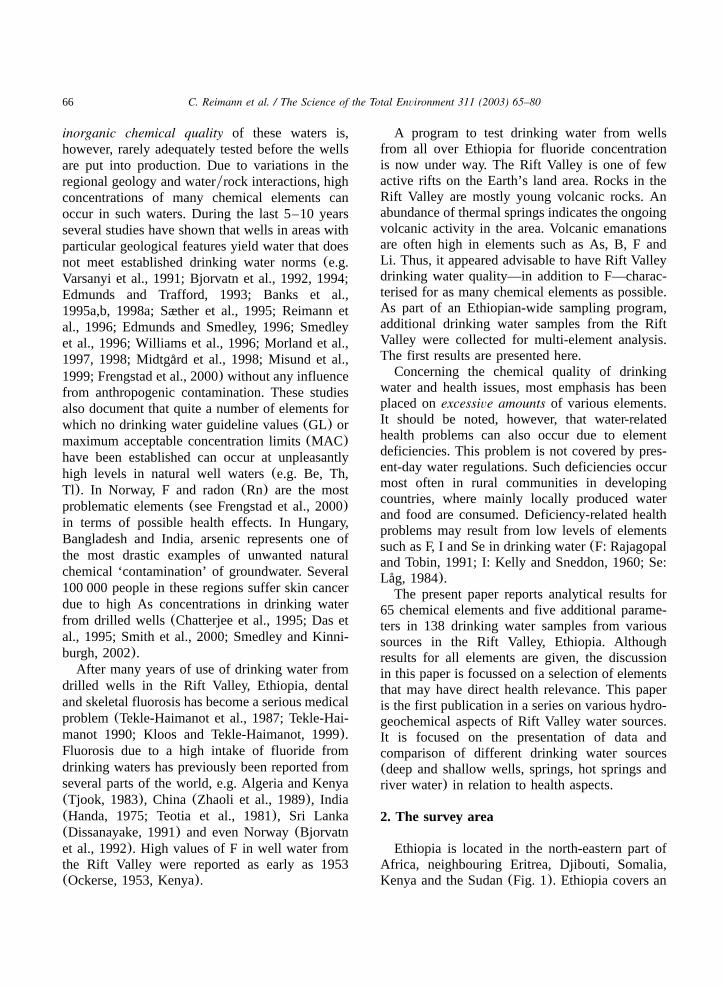
Ethiopia is located in the north-eastern part ofAfrica, neighbouring Eritrea, Djibouti, Somalia,Kenya and the Sudan(Fig. 1). Ethiopia covers an
67C. Reimann et al. / The Science of the Total Environment 311 (2003) 65–80
Fig. 1. Location of the sample sites in the Rift Valley, Ethiopia.
area of approximately 1 100 000 km , of which2
the Ethiopian part of the Rift Valley constitutesnearly 30%. The population is approximately60 000 000 people of which;3 000 000 live inthe capital, Addis Ababa.The Rift Valley is the longest rift on the Earth’s
land surface. It starts in the Middle East, in Jordanand terminates after approximately 6400 km nearBeira, on the coast of Mozambique(http:yywww.yourdotcomforafrica.com). The Rift Valleyowes its existence to a deep-seated, linear strike-slip fault marking the boundary between the Ara-bian and African Plates. It is thus a linear zone ofthinning and extension in the earth’s crust, locallyleading to development of new oceanic crust, e.g.in the Red Sea. The initial process leading to thedevelopment of the Rift Valley started approxi-
mately 50 000 000 years ago. The main tectonicactivity responsible for today’s appearance of theRift Valley, with its associated volcanoes andtectonically defined lakes, happened, however,more recently, just 2–7 000 000 years ago(Merlaet al., 1979). At the bottom of the Red Sea, theassociated heat flow creates hot pools of brine thatgive rise to the formation of copper, zinc, manga-nese and iron deposits.In Ethiopia the Rift Valley runs in a south-
westerly direction through the whole country(Fig.1). Active volcanoes are located on the DanakilPlain to the north. The main river in the area, theAwash, originates within the East African RiftValley and flows into the Afar Triangle, but neverreaches the Red Sea. Instead, the waters of theriver spread out and evaporate in the Danakil
68 C. Reimann et al. / The Science of the Total Environment 311 (2003) 65–80
Depression. Eight lakes mark the central part ofthe Ethiopian Rift Valley. Due to the high evapo-ration rates, the waters of these lakes are alkalineand are not suited for human consumption. Someare rich in fish, and all are the sites of a richanimal life, especially birds. The main near-surfacerock types in the Rift Valley are young volcanicrocks: ignimbrites, pumices, rhyolites, trachybas-alts and fissural basalts, as well as Tertiary plateaubasalts as the dominating rock unit. In addition,young Quaternary sediments, which can be allu-vial, elluvial, colluvial or lacustrine, occur(Merlaet al., 1979).Elevation and geographic location produce three
climatic zones. A cool zone occurs above 2400 m,where temperatures range from near 0 to 168C. Atemperate zone occurs at elevations of 1500–2400m, with temperatures from 16 to 308C. A hotzone follows below 1500 m, with both tropicaland arid conditions, and daytime temperaturesranging from 27 to 508C. The main rainy seasonlasts from mid-June to mid-September(longer inthe southern highlands). Intermittent showers fromFebruary to March usually precede it. The remain-der of the year is generally dry. The mean annualrainfall in the Rift Valley is 725 mm.
3. Sampling
Most samples reported here were taken fromdrinking water wells in small villages and settle-ments scattered throughout the Ethiopian part ofthe Rift Valley. The wells were subdivided into‘deep wells’ (Ns88, depthG60 m or reportedlydrilled in bedrock) and ‘shallow wells’ (Ns32,depth -60 m or reportedly drilled or dug insediments). The majority of deep wells thus drawwater from bedrock, while the majority of shallowwells draw water from sediments. At present, nobetter subdivision of these wells was possible. Toobtain a more complete picture of ‘drinking water’quality in the Rift Valley, a few additional samplesfrom springs(Ns7, T-32 8C), hot springs(Ns7, T)36 8C), and rivers(Ns5) were also col-lected and analysed(see Fig. 1).A training program for sampling was carried
out prior to regional sampling in the Rift Valley.It was decided to follow as closely as possible the
previously established standards in Norway(Rei-mann et al., 1996; Frengstad et al., 2000). A teamof two samplers collected all samples during theyear 2000. All necessary equipment was shippedfrom Norway or Germany to Ethiopia. Factory-new, unwashed 100-ml high-density polyethylene(HDPE) bottles were used for sampling. Differentbrands of plastic bottles had previously been thor-oughly checked for possible contamination(Rei-mann et al., 1999a). No risk of contaminationfrom such bottles was found for the parametersreported here, as long as the bottles are thoroughlyrinsed with water prior to sampling.In the field the bottles were rinsed three times
with running water and then filled to the top.Sampling took place directly at the tap or thewellhead. In order to collect fresh well water, thewater was left running for at least 5 min or untiltemperature and conductivity remained stable. Inmost cases, each of these wells supplies more than100 people with their daily drinking water. Thewater, therefore, never accumulates over longerperiods in the well. In contrast to Norway, temper-ature does not decrease while the water is running;on the contrary, the temperature may increase by1–2 8C.Because this study is supposed to reflect the
quality of the water ‘as drunk’, the samples werenot filtered. Reimann et al.(1999b) studied theinfluence of filtration on the chemistry of watersamples from bedrock wells. The study showedthat even unfiltered water samples satisfactorilyreflect general water chemistry, as long as themedium collected is drinking water(i.e. by defi-nition rather clean water, with low particulates)(Reimann et al., 1999b). This may not be true forriver water and water from very shallow wells insediments. However, it is rather easy to detectparticulate contamination problems in the waterchemistry, e.g. via high Al or rare-earth elementconcentrations.Two 100-ml bottles were collected at each site.
The first sample, which was intended for anionanalyses, was left unfiltered and unacidified. Theunfiltered water of the second sample was acidifiedwith 2 ml of concentrated nitric acid(Merck,Ultrapure). This second sample was used later forcation analysis. The acid was tested for its trace
69C. Reimann et al. / The Science of the Total Environment 311 (2003) 65–80
element content using the same analytical proce-dure as for the water samples. In the field, thesamples were stored in a cool box and in theevening transferred to a refrigerator, where theywere stored until shipment to the laboratory inGermany.Several parameters, such as pH, electrical con-
ductivity and temperature, were measured directlyin the field. Alkalinity was determined at thesample site using a Hach titrator. To document thesampling conditions, the sampling site and thegeneral landscape around the wells, a set of atleast three photographs was taken at each samplesite. A CD with these photos is available with theNGU Report(Reimann et al., 2002). If available,the well depth and the number of people receivingtheir drinking water from the various wells wererecorded. Possible contamination sources within aradius of approximately 100 m around the wellwere noted.
4. Analyses
All samples were shipped by courier to Bunde-sanstalt fur Geowissenschaften und Rohstoffe¨(BGR), Hannover, Germany, after completion ofthe field sampling campaign. In the laboratory, pH,electrical conductivity and alkalinity were deter-mined once more on the unacidified samples.These samples were used for anion analysis byion chromatography(Br, Cl, F, NO , NO and2 3
SO ). Furthermore, the major elements Ca, K, Mg4
and Na were determined on these samples byinductively coupled plasma-optical emission spec-trometry (ICP-OES) for quality control purposes.Note that only the values from the acidified sam-ples were used later on.The acidified samples were used for cation
analysis by ICP-OES(Al, B, Ba, Be, Ca, Cd, Co,Cr, Cu, Fe, K, Li, Mg, Mn, Na, Ni, Si, Sr, Ti, Vand Zn) and inductively coupled plasma-massspectrometry(ICP-MS) (Ag, Al, As, B, Ba, Be,Bi, Br, Ca, Cd, Ce, Co, Cr, Cs, Cu, Dy, Er, Eu,Fe, Ga, Gd, Ge, Hf, Hg, Ho, I, In, K, La, Li, Lu,Mg, Mn, Mo, Na, Nb, Nd, Ni, Pb, Pr, Rb, Sb, Sc,Se, Sm, Sn, Sr, Ta, Tb, Te, Th, Ti, Tl, Tm, U, V,W, Y, Yb, Zn and Zr).
4.1. Quality control
For quality control purposes, duplicate sampleswere taken in the field at a rate of 1 in 10. Thesewere treated as completely separate samples,receiving their own sample number. The duplicateswere thus not recognisable for the laboratory.Several blind samples were included to check forpossible contamination sources. At the laboratoryin Hannover, additional duplicates were preparedand analysed. The three international water stan-dards NIST-1640, NIST-1643d and NIST-SLRS-4,as well as several in-house standards, were ana-lysed on a routine basis over several months.Precision judged from the project duplicates is onaverage in the range of 10–14% for La, Fe, Ce,Cd and Sn. It is in the range of 5–10% for Pb,Se, Be, Ti, Y, Pr, Hf, Gd, Nd, Zr, Sb, Co, Cu andGa. Precision is on average better than 5% for allother elementsyparameters(Ag, Bi, electrical con-ductivity, Eu, Hg, Ho, In, Lu, NO , Ta, Tb, Te,2
Tm, SO , Cl, Ba, K, Si, W, Mg, Na, Ca, alkalinity,4
F, Dy, Sr, Cs, U, Li, Rb, Ge, B, V, Br, As, NO ,3
Er, Th, Mo, Yb, Ni, Tl, Cr, Sm, Al, I, Zn, Nb andMn). Detailed results for the quality control canbe found in Reimann et al.(2002). Results fromquality control and direct comparison of resultsfrom the different techniques were used in thefinal selection of the data used for this publication(Table 1).
5. Results
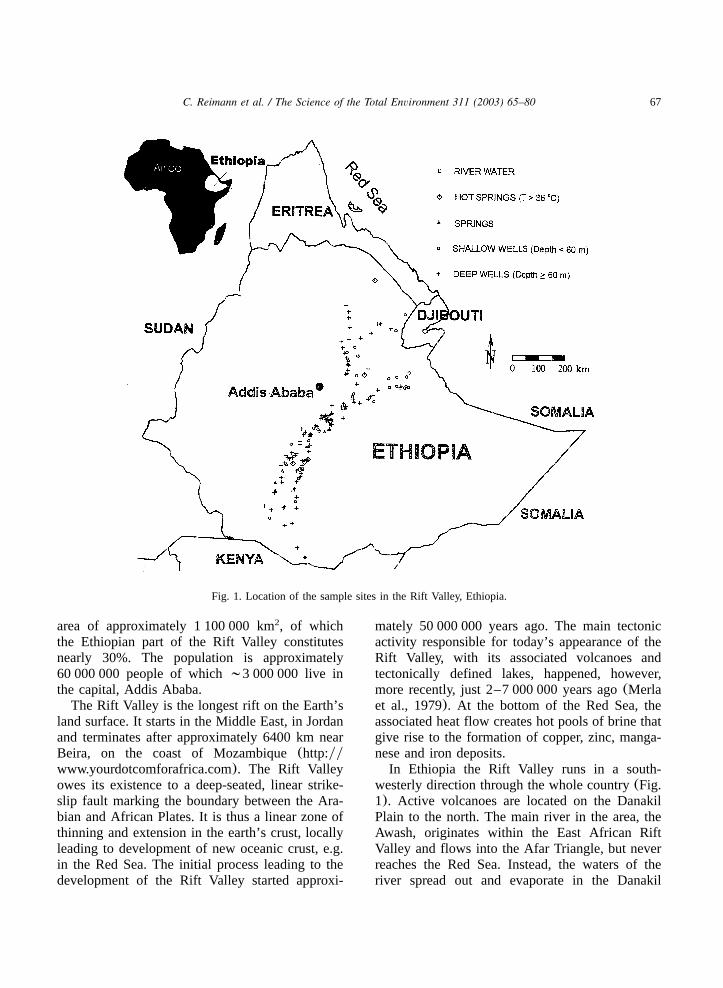
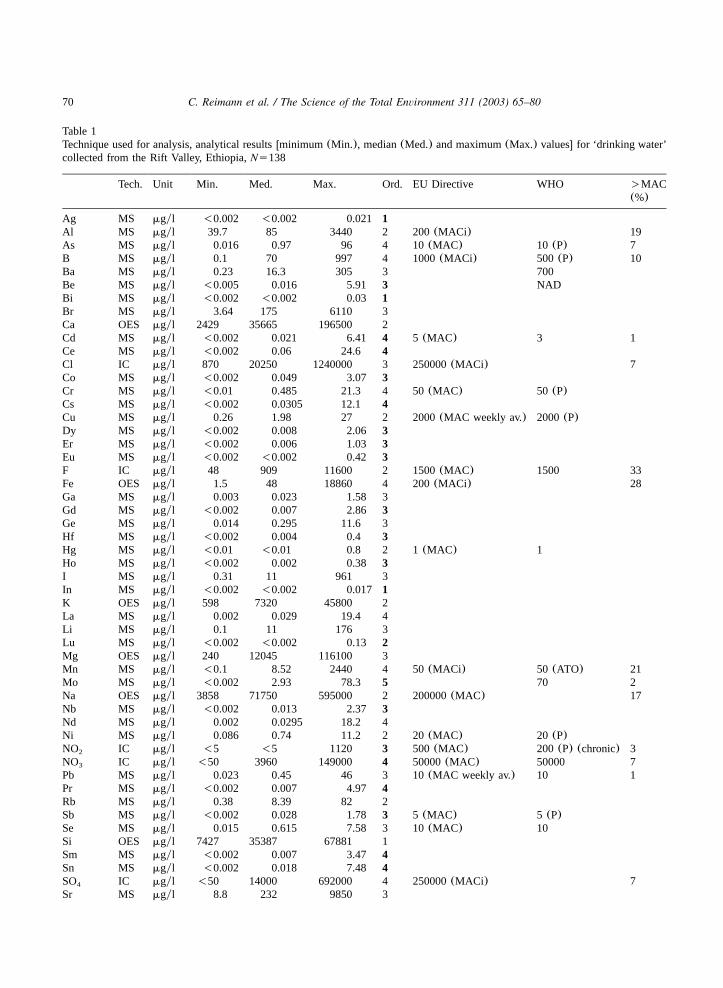
Table 1 summarises(median, minimum andmaximum) the analytical results for the Rift Valleydrinking water. It gives the analytical techniquesused for the different elementsyparameters andshows how many orders of magnitude the naturalconcentrations of the analysed elements cover inthis data set. It provides additional information onwater standards(European Union, 1998; WHO,1993, 1998) and shows the percentage of samplesabove maximum acceptable concentration limits.Observed natural concentration ranges cover
between one and five orders of magnitude. Formost elements the observed concentration rangecovers between three and four orders of magnitude.
70 C. Reimann et al. / The Science of the Total Environment 311 (2003) 65–80
Table 1Technique used for analysis, analytical resultswminimum (Min.), median(Med.) and maximum(Max.) valuesx for ‘drinking water’collected from the Rift Valley, Ethiopia,Ns138
Tech. Unit Min. Med. Max. Ord. EU Directive WHO )MAC(%)
Ag MS mgyl -0.002 -0.002 0.021 1Al MS mgyl 39.7 85 3440 2 200(MACi) 19As MS mgyl 0.016 0.97 96 4 10(MAC) 10 (P) 7B MS mgyl 0.1 70 997 4 1000(MACi) 500 (P) 10Ba MS mgyl 0.23 16.3 305 3 700Be MS mgyl -0.005 0.016 5.91 3 NADBi MS mgyl -0.002 -0.002 0.03 1Br MS mgyl 3.64 175 6110 3Ca OES mgyl 2429 35665 196500 2Cd MS mgyl -0.002 0.021 6.41 4 5 (MAC) 3 1Ce MS mgyl -0.002 0.06 24.6 4Cl IC mgyl 870 20250 1240000 3 250000(MACi) 7Co MS mgyl -0.002 0.049 3.07 3Cr MS mgyl -0.01 0.485 21.3 4 50(MAC) 50 (P)Cs MS mgyl -0.002 0.0305 12.1 4Cu MS mgyl 0.26 1.98 27 2 2000(MAC weekly av.) 2000(P)Dy MS mgyl -0.002 0.008 2.06 3Er MS mgyl -0.002 0.006 1.03 3Eu MS mgyl -0.002 -0.002 0.42 3F IC mgyl 48 909 11600 2 1500(MAC) 1500 33Fe OES mgyl 1.5 48 18860 4 200(MACi) 28Ga MS mgyl 0.003 0.023 1.58 3Gd MS mgyl -0.002 0.007 2.86 3Ge MS mgyl 0.014 0.295 11.6 3Hf MS mgyl -0.002 0.004 0.4 3Hg MS mgyl -0.01 -0.01 0.8 2 1(MAC) 1Ho MS mgyl -0.002 0.002 0.38 3I MS mgyl 0.31 11 961 3In MS mgyl -0.002 -0.002 0.017 1K OES mgyl 598 7320 45800 2La MS mgyl 0.002 0.029 19.4 4Li MS mgyl 0.1 11 176 3Lu MS mgyl -0.002 -0.002 0.13 2Mg OES mgyl 240 12045 116100 3Mn MS mgyl -0.1 8.52 2440 4 50(MACi) 50 (ATO) 21Mo MS mgyl -0.002 2.93 78.3 5 70 2Na OES mgyl 3858 71750 595000 2 200000(MAC) 17Nb MS mgyl -0.002 0.013 2.37 3Nd MS mgyl 0.002 0.0295 18.2 4Ni MS mgyl 0.086 0.74 11.2 2 20(MAC) 20 (P)NO2 IC mgyl -5 -5 1120 3 500 (MAC) 200 (P) (chronic) 3NO3 IC mgyl -50 3960 149000 4 50000(MAC) 50000 7Pb MS mgyl 0.023 0.45 46 3 10(MAC weekly av.) 10 1Pr MS mgyl -0.002 0.007 4.97 4Rb MS mgyl 0.38 8.39 82 2Sb MS mgyl -0.002 0.028 1.78 3 5 (MAC) 5 (P)Se MS mgyl 0.015 0.615 7.58 3 10(MAC) 10Si OES mgyl 7427 35387 67881 1Sm MS mgyl -0.002 0.007 3.47 4Sn MS mgyl -0.002 0.018 7.48 4SO4 IC mgyl -50 14000 692000 4 250000(MACi) 7Sr MS mgyl 8.8 232 9850 3
71C. Reimann et al. / The Science of the Total Environment 311 (2003) 65–80
Table 1(Continued)
Tech. Unit Min. Med. Max. Ord. EU Directive WHO )MAC(%)
Ta MS mgyl -0.002 0.002 0.054 2Tb MS mgyl -0.002 -0.002 0.41 3Te MS mgyl -0.005 -0.005 0.019 1Th MS mgyl -0.002 0.008 1.59 3Ti MS mgyl 0.3 4.74 264 3Tl MS mgyl -0.002 0.005 0.15 2Tm MS mgyl -0.002 -0.002 0.13 2U MS mgyl 0.005 1.84 48 4 2(P) (47)V MS mgyl 0.093 13.35 235 3W MS mgyl -0.002 0.011 3.81 4Y MS mgyl 0.003 0.068 10.3 4Yb MS mgyl -0.002 0.005 0.77 3Zn MS mgyl 1.1 44 5140 4Zr MS mgyl 0.009 0.11 25 3T 8C 15.6 28.5 67.3pH 5.2 7.1 8.6 )6.5,-9.5 13EC mSycm 52 719 3850 2500(MACi) 1Alkalinity mgyl 15 341 1070ToHa Calc. 8dH 0.4 7.6 51.6CaHa Calc. 8dH 0.7 15.6 49.1Solids Calc. mgyl 34 598 2401IB Calc. "% 0 0.85 2.6
Tech., technique used for analysis: MS, ICP-MS; OES, ICP-OES; IC, ion chromatography; Calc., calculated. Ord., orders ofmagnitude covered by the datawlog (MaxyMin)x—a value of half of the detection limit is used for calculation of those elementsfor which the minimum concentration was below the detection limit(values in bold in the Ord. column). MAC: maximum acceptableconcentration, European Union directive, chemical parameters. MACi: maximum acceptable concentration, European Union directive,indicator parameters.)MAC (%): percentage of samples exceeding the EU guidelines; where values are in brackets, there is noEU guideline, and the result represents the percentage of samples above the WHO guideline.T: temperature at time of sampling.EC: electrical conductivity. ToHa: total hardness(in degrees of German hardness). CaHa: carbonate hardness. Solids: sum ofdissolved ions. IB: ion balance, as a measure of analytical quality.(P): provisional guideline value.(ATO): value is appearance-,taste- or odour-related. NAD: no adequate data available to permit recommendation.
European Union(EU) maximum acceptableconcentration(MAC) levels are defined for only18 (19 if NO yNO are counted separately) out of2 3
the 65 analysed elements(and pH and electricalconductivity). Of these 18 elements, the followingsix did not show any values exceeding the MAC(Table 1): Cr, Cu, Hg, Ni, Sb and Se(EUstandard). For some elements only one of the twocited authorities suggest an action level(Al, Ba,Br, Cl, Fe, Mo, Na, SO , U). One of the largest4
differences in opinion between the authoritiesexists for U, for which the EU has not definedany MAC, the US EPA(2001) has recently set aMAC of 30 mgyl and WHO (1998) suggests aprovisional value of 2mgyl, based on toxicologicalconsiderations. In general, it is an interesting exer-cise to compare different versions of documents
defining MAC values, e.g. the old EU regulation,(European Union, 1980) with the recent regula-tions (European Union, 1998).If the compliance failures were added up, a
staggering 78% of all drinking water samples fromthe Rift Valley would fail to pass the current EUdrinking water directives. Fluorine is the elementwith the highest single percentage of failure: 33%of all samples are above 1.5 mgyl F. The maximumconcentration reported in this study is 11.6 mgylF.The EU has not set any MAC for uranium. Only
2% of the drinking waters fall above the US EPAMAC uranium concentrations. If, however, theWHO-suggested value of 2mgyl U is taken, 47%of all samples would fail and U would pose aneven bigger problem than F.
72 C. Reimann et al. / The Science of the Total Environment 311 (2003) 65–80
Adverse health effects of too high arsenic valuesin drinking water have recently received muchattention (e.g. Smith et al., 2000). Fortunately,only nine samples(6.5%) fall above the MAC of10 mgyl As. Arsenic is thus not a major problemin Rift Valley drinking water.High NO yNO concentrations in drinking2 3
waters point often towards contamination. Wellswith high NO yNO values should be checked for2 3
bacterial contamination. Nine samples(6.5%) fallabove the MAC for NO . Nitrogen species should3
be measured in an as short a time span aftersampling as possible. This was not viable in thisproject and the values reported must be treated aspreliminary.Given the quite different origin of the drinking
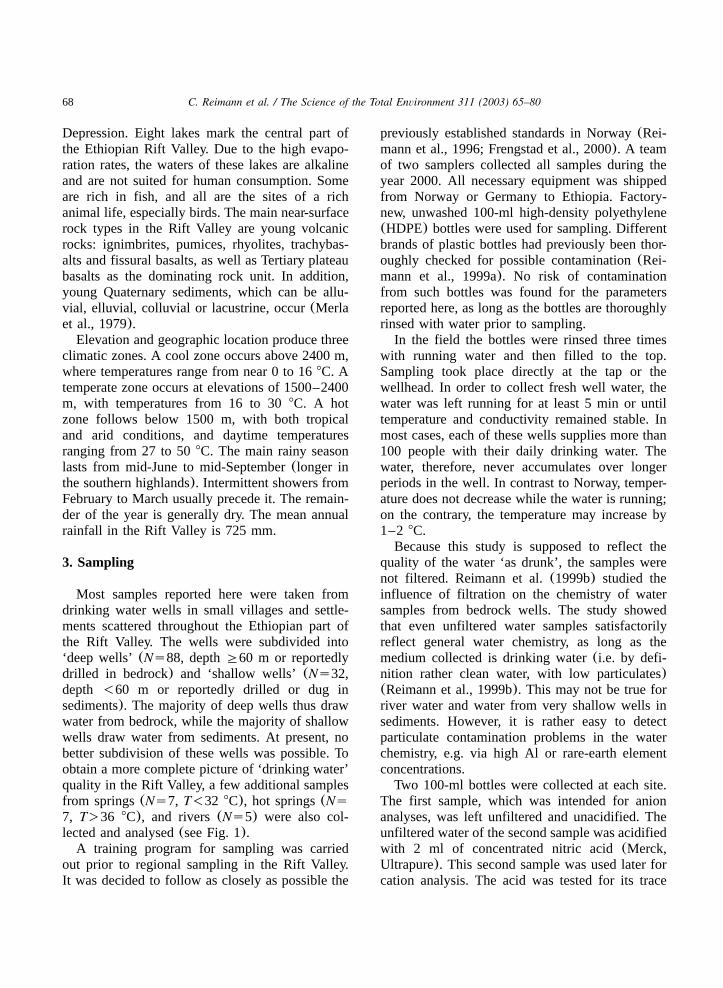
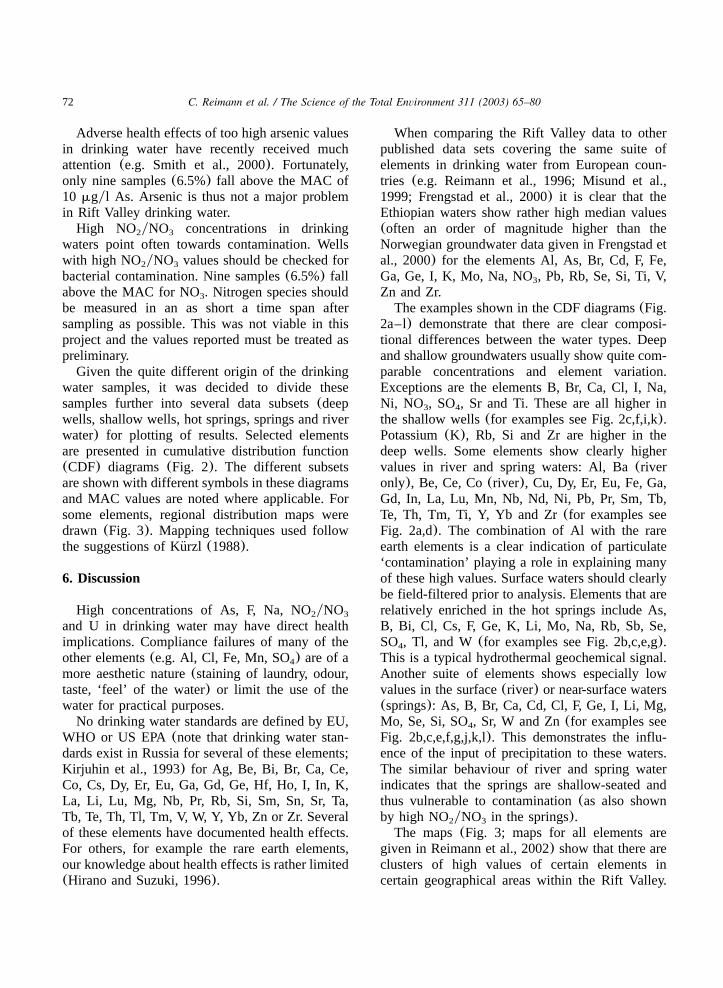
water samples, it was decided to divide thesesamples further into several data subsets(deepwells, shallow wells, hot springs, springs and riverwater) for plotting of results. Selected elementsare presented in cumulative distribution function(CDF) diagrams(Fig. 2). The different subsetsare shown with different symbols in these diagramsand MAC values are noted where applicable. Forsome elements, regional distribution maps weredrawn (Fig. 3). Mapping techniques used followthe suggestions of Kurzl(1988).¨
6. Discussion
High concentrations of As, F, Na, NOyNO2 3
and U in drinking water may have direct healthimplications. Compliance failures of many of theother elements(e.g. Al, Cl, Fe, Mn, SO) are of a4
more aesthetic nature(staining of laundry, odour,taste, ‘feel’ of the water) or limit the use of thewater for practical purposes.No drinking water standards are defined by EU,
WHO or US EPA(note that drinking water stan-dards exist in Russia for several of these elements;Kirjuhin et al., 1993) for Ag, Be, Bi, Br, Ca, Ce,Co, Cs, Dy, Er, Eu, Ga, Gd, Ge, Hf, Ho, I, In, K,La, Li, Lu, Mg, Nb, Pr, Rb, Si, Sm, Sn, Sr, Ta,Tb, Te, Th, Tl, Tm, V, W, Y, Yb, Zn or Zr. Severalof these elements have documented health effects.For others, for example the rare earth elements,our knowledge about health effects is rather limited(Hirano and Suzuki, 1996).
When comparing the Rift Valley data to otherpublished data sets covering the same suite ofelements in drinking water from European coun-tries (e.g. Reimann et al., 1996; Misund et al.,1999; Frengstad et al., 2000) it is clear that theEthiopian waters show rather high median values(often an order of magnitude higher than theNorwegian groundwater data given in Frengstad etal., 2000) for the elements Al, As, Br, Cd, F, Fe,Ga, Ge, I, K, Mo, Na, NO , Pb, Rb, Se, Si, Ti, V,3
Zn and Zr.The examples shown in the CDF diagrams(Fig.
2a–l) demonstrate that there are clear composi-tional differences between the water types. Deepand shallow groundwaters usually show quite com-parable concentrations and element variation.Exceptions are the elements B, Br, Ca, Cl, I, Na,Ni, NO , SO , Sr and Ti. These are all higher in3 4
the shallow wells(for examples see Fig. 2c,f,i,k).Potassium(K), Rb, Si and Zr are higher in thedeep wells. Some elements show clearly highervalues in river and spring waters: Al, Ba(riveronly), Be, Ce, Co(river), Cu, Dy, Er, Eu, Fe, Ga,Gd, In, La, Lu, Mn, Nb, Nd, Ni, Pb, Pr, Sm, Tb,Te, Th, Tm, Ti, Y, Yb and Zr(for examples seeFig. 2a,d). The combination of Al with the rareearth elements is a clear indication of particulate‘contamination’ playing a role in explaining manyof these high values. Surface waters should clearlybe field-filtered prior to analysis. Elements that arerelatively enriched in the hot springs include As,B, Bi, Cl, Cs, F, Ge, K, Li, Mo, Na, Rb, Sb, Se,SO , Tl, and W(for examples see Fig. 2b,c,e,g).4
This is a typical hydrothermal geochemical signal.Another suite of elements shows especially lowvalues in the surface(river) or near-surface waters(springs): As, B, Br, Ca, Cd, Cl, F, Ge, I, Li, Mg,Mo, Se, Si, SO , Sr, W and Zn(for examples see4
Fig. 2b,c,e,f,g,j,k,l). This demonstrates the influ-ence of the input of precipitation to these waters.The similar behaviour of river and spring waterindicates that the springs are shallow-seated andthus vulnerable to contamination(as also shownby high NO yNO in the springs).2 3
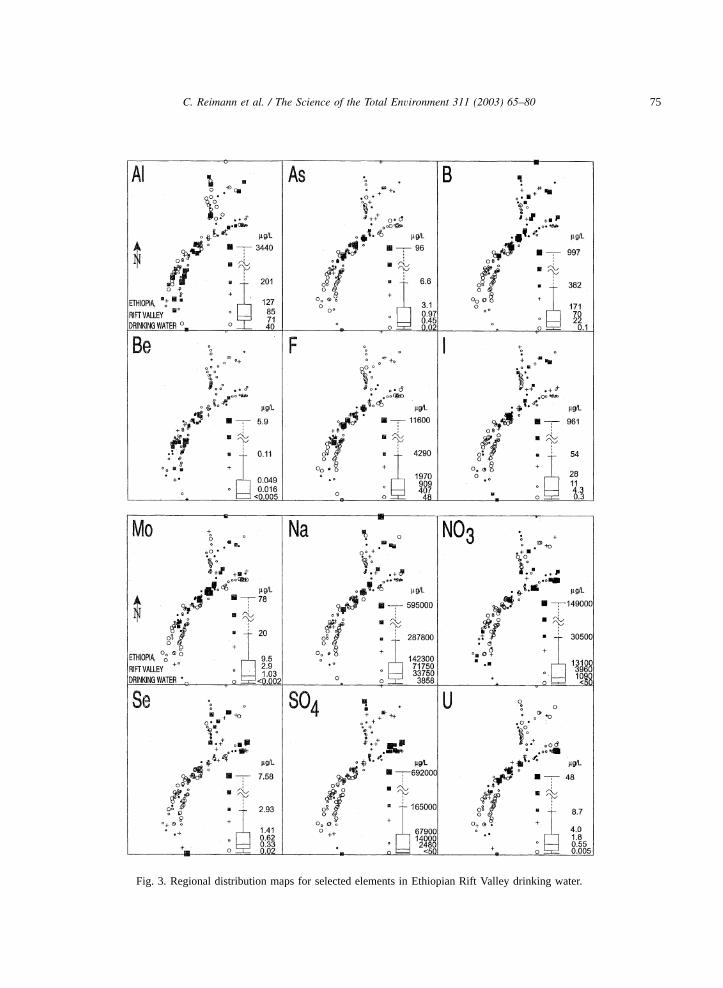
The maps(Fig. 3; maps for all elements aregiven in Reimann et al., 2002) show that there areclusters of high values of certain elements incertain geographical areas within the Rift Valley.
73C. Reimann et al. / The Science of the Total Environment 311 (2003) 65–80
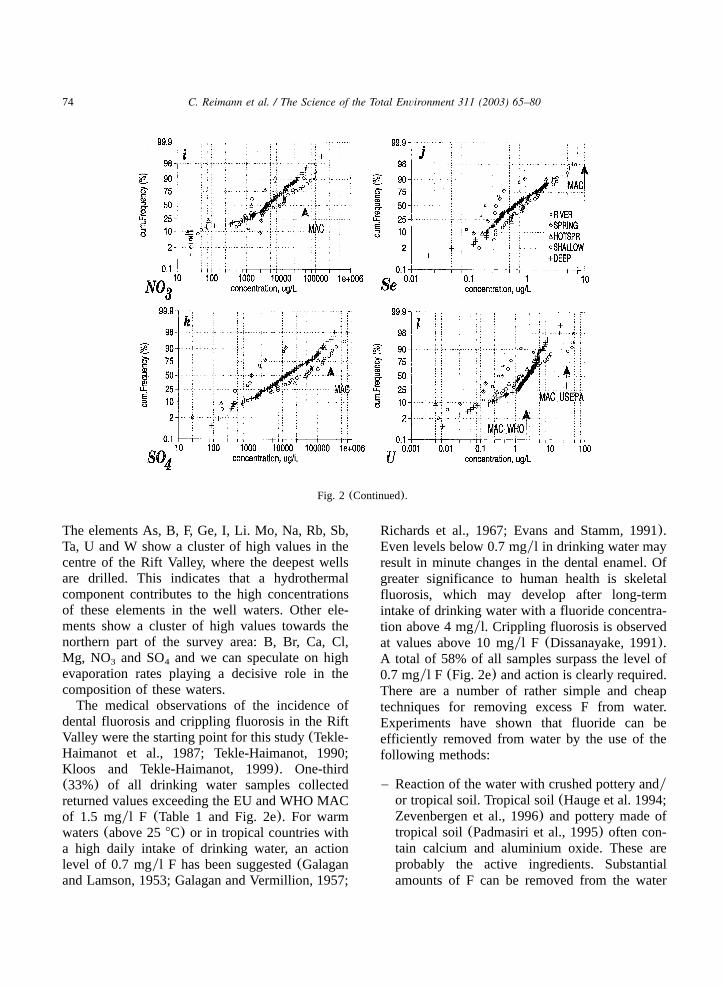
Fig. 2. CDF diagrams for selected elements. Different water types marked by different symbols; MAC values indicated whereapplicable.
74 C. Reimann et al. / The Science of the Total Environment 311 (2003) 65–80
Fig. 2 (Continued).
The elements As, B, F, Ge, I, Li. Mo, Na, Rb, Sb,Ta, U and W show a cluster of high values in thecentre of the Rift Valley, where the deepest wellsare drilled. This indicates that a hydrothermalcomponent contributes to the high concentrationsof these elements in the well waters. Other ele-ments show a cluster of high values towards thenorthern part of the survey area: B, Br, Ca, Cl,Mg, NO and SO and we can speculate on high3 4
evaporation rates playing a decisive role in thecomposition of these waters.The medical observations of the incidence of
dental fluorosis and crippling fluorosis in the RiftValley were the starting point for this study(Tekle-Haimanot et al., 1987; Tekle-Haimanot, 1990;Kloos and Tekle-Haimanot, 1999). One-third(33%) of all drinking water samples collectedreturned values exceeding the EU and WHO MACof 1.5 mgyl F (Table 1 and Fig. 2e). For warmwaters(above 258C) or in tropical countries witha high daily intake of drinking water, an actionlevel of 0.7 mgyl F has been suggested(Galaganand Lamson, 1953; Galagan and Vermillion, 1957;
Richards et al., 1967; Evans and Stamm, 1991).Even levels below 0.7 mgyl in drinking water mayresult in minute changes in the dental enamel. Ofgreater significance to human health is skeletalfluorosis, which may develop after long-termintake of drinking water with a fluoride concentra-tion above 4 mgyl. Crippling fluorosis is observedat values above 10 mgyl F (Dissanayake, 1991).A total of 58% of all samples surpass the level of0.7 mgyl F (Fig. 2e) and action is clearly required.There are a number of rather simple and cheaptechniques for removing excess F from water.Experiments have shown that fluoride can beefficiently removed from water by the use of thefollowing methods:
– Reaction of the water with crushed pottery andyor tropical soil. Tropical soil(Hauge et al. 1994;Zevenbergen et al., 1996) and pottery made oftropical soil(Padmasiri et al., 1995) often con-tain calcium and aluminium oxide. These areprobably the active ingredients. Substantialamounts of F can be removed from the water
75C. Reimann et al. / The Science of the Total Environment 311 (2003) 65–80
Fig. 3. Regional distribution maps for selected elements in Ethiopian Rift Valley drinking water.
76 C. Reimann et al. / The Science of the Total Environment 311 (2003) 65–80
after a retention time of some hours. To re-teachthe population to use pottery instead of plasticfor storing their drinking water might thus beadvantageous.
– Burned (fish) bones (Dunckley and Malthus,1961; Bhargava and Killedar, 1992; Killedarand Barghava, 1993), in which apatite is prob-ably the active ingredient.
– Treatment with mineral apatite, calcium phos-phate or aluminium phosphate(Qianjie andHanwen, 1992; Dieye et al., 1994).
– Water treatment with other aluminosilicate min-erals that adsorb fluoride or admit ion exchangereactions of fluoride against hydroxide. Kaolin-ite clays and crushed serpentinite are efficient(Jinadasa et al., 1991) and fly ash may also beefficient (Jinadasa et al., 1988; Chaturvedi etal., 1990).
As mentioned above, the geographical distribu-tion of the samples, with a cluster of all the highvalues in the centre of the Ethiopian part of theRift valley, suggests a hydrothermal origin forthese high F concentrations. It also suggests thatnearby water resources with more acceptable flu-orine concentrations may often exist. Fluoride isquite mobile under most geochemical conditions.In water, the stability field of fluorite(CaF ) limits2
the possible F concentrations; high F concentra-tions will thus mostly occur in low-Ca waters.Fluorine is one of the elements with a very narrowrange of ‘healthy’ concentrations in drinking water.However, because F is ubiquitous in nature, healtheffects due to actual fluoride deficiencies are hardto prove. As demonstrated by Dean et al.(1939),low-fluoride drinking water is—in caries-pronepopulations—associated with elevated incidence ofdental caries.At present we do not have sufficient data on the
occurrence of endemic diseases in the Rift Valleyto link these directly with the element concentra-tions observed in the drinking waters. Fortunately,no element other than F appears to occur at suchhigh concentrations that the health of the generalpopulation is directly threatened. Uranium, how-ever, poses an even greater problem than F if theWHO proposed MAC for U in drinking water istaken seriously(Fig. 2l). Reimann et al.(1996)
reported natural U concentrations spanning sixorders of magnitude in Norwegian bedrock ground-water(maximum concentration 2 mgyl). Uraniumin drinking water from bedrock wells is thus anelement that should certainly receive more atten-tion from health authorities. Removal of U fromdrinking water may require relatively expensivetechniques, such as reverse osmosis or distillation.Chatterjee et al.(1995) and Das et al.(1995)
have reported dramatic effects(skin cancer) dueto very high As concentrations in drinking waterin West Bengal. High As concentrations are oftenobserved in hydrothermal systems. This was oneof the reasons for initiating this project. Fortunatelyonly nine samples exceed the new MAC of 10mgyl As. The CDF diagram(Fig. 2b) suggeststhat hot springs are especially prone to high Asconcentrations. Human consumption from thesewaters should probably be banned. Boron, Be, F,Ge, K, Li, Mo and Na were all high in the hotspring waters, while iodine was at unusually lowconcentrations. More than 25% of all sampleswould fall above the MAC of 2mgyl that wasalso discussed when the MAC was recently low-ered from 50 to 10mgyl (Fig. 2b). Usually Aslevels in drinking water are much lower(-1 mgyl; Reimann and de Caritat, 1998). Most cases ofhigh values of As in water are related to theoccurrence of sulfide minerals such as arsenopyriteand pyrite. In aqueous systems, As is highlysoluble over a wide pHyEh range. Fe and Eh bothhave an influence on the concentration of Asobserved in groundwater(Matisoff et al., 1989;Varsanyi et al., 1991). In the Rift Valley the highAs values in the hot springs and the cluster ofhigh values in the centre of the Rift Valley bothpoint to a hydrothermal origin.Excessive levels of nitrate in drinking water
have caused serious illness and sometimes death.Nitrates and nitrites have the potential to cause thefollowing effects from a lifetime exposure at levelsabove the MAC: diuresis, increased starchy depos-its and haemorrhaging of the spleen(US EPA factsheet on nitrate). Excessive nitrate concentrationsin water are mainly related to pollution(withagriculture as the main source). It is thus nosurprise that higher values are observed in springsand shallow wells(Fig. 2i). High values of NO3
77C. Reimann et al. / The Science of the Total Environment 311 (2003) 65–80
in some of the Rift Valley wells demonstrate thatmore care is needed in well construction andsafeguarding of wellheads against contamination.This is much easier than treating contaminatedwaters. Wells returning high NO should be ana-3
lysed for bacterial contamination and field-checkedby a hydrogeologist for construction and protectionagainst pollution.Selenium, at trace levels, is essential in the
human and animal diet and its deficiency hasreceived much attention. It causes symptoms suchas muscular degeneration, impeded growth, fertil-ity disorders, anaemia and liver disease(Lag,˚1984). Keshan and Kaschin–Beck diseases, report-ed on a regional scale from China, are caused bySe deficiency. At ingested concentrations of 10mgyday and higher, gastro-intestinal ailments,skin-discoloration and tooth decay may occur(Tebbutt, 1983).The EU (and WHO) MAC for Se in drinking
water is 10mgyl. None of our samples exceededthis value(Fig. 2j). Selenium is again one of thoseelements for which a minimum guideline levelwould probably be of more importance that anupper MAC. Selenium behaves geochemicallyquite similarly to S. Its mobility is high under acidand oxidising conditions, very high under neutral–alkaline conditions and very low under reducingconditions. Naturally, Se occurs in trace amountsin many sulfidic ores. In elemental form Se isinsoluble and thus is non-toxic. It has a strongaffinity to organic matter. Concentrations observedin Rift Valley drinking water ranged from 0.015to 7.6mgyl (Table 1, Fig. 2j). Median Se valueswere lower in spring and river water than in thewells (Fig. 2j). Compared to Norwegian bedrockgroundwater(Frengstad et al., 2000), Se concen-trations in the Ethiopian drinking water are ratherhigh (median Norway: 0.20mgyl, median RiftValley: 0.62mgyl).There is no EU MAC for Mo; WHO, however,
has suggested a MAC value of 70mgyl. Threesamples exceed the WHO MAC, although themaximum concentration observed is still very closeto the MAC: 78.3 mgyl (Fig. 2g). Mo is anessential trace element. Its toxicity is species-dependent; it is, for example, more toxic to cowsand sheep(depending on the CuyMo ratio) than
to humans. High Mo values in forage can preventthe uptake of Cu and are known to cause severeproblems in animal husbandry(e.g. Webb, 1971).The mobility of Mo is very low under reducingconditions; under oxidising and acid conditions itis high and under neutral–alkaline conditions it isvery high. The fact that the hot springs show, onaverage, higher Mo values than springs, rivers andwells points towards a hydrothermal origin.Several of the elements that are not covered by
MAC values are deemed to have health effects. Ithas, for example, long been suspected that there isa causal link between water hardness(dissolvedCa and Mg) and cardiovascular disease(e.g. Gard-ner, 1976). It appears that there is a weak inverserelationship between drinking water hardness andcardiovascular disease mortality(COMA, 1994).This might actually warrant setting a lower Calimit (minimum acceptable concentration; MIC)for drinking water. For iodine(Fig. 2f), serioushealth effects of suboptimal(deficiency) as wellas of excess concentrations are well documented.Fuge and Johnson(1986) reviewed the geochem-istry of I. The main problem is probably I defi-ciency causing goitre and cretinism(Kelly andSneddon, 1960). This is an element for which alower as well as an upper concentration limitshould be defined. People with high blood pressureshould not consume water with a Na concentrationabove 1000 mgyl as their daily drinking water(compare Fig. 2h).Furthermore, there are a number of elements
that are rather toxic andyor carcinogenic for whichno MAC has been defined, probably often underthe assumption that ‘‘natural concentrations inwater must be very low’’(WHO, 1993; statementwith regard to Be). Table 1 shows that the naturalconcentrations of all elements analysed coverbetween one and five orders of magnitude, andsome surprisingly high concentrations for ‘rarities’can be found in natural drinking water. For manyof these elements, little is known about healtheffects at drinking water concentrations. Be(Fig.2d), Br, Th and Tl are probably four elements thathave received far too little attention and need morediscussion from a health perspective. From a Nor-wegian perspective, Rn(not reported here) is afurther element that can show dangerously high
78 C. Reimann et al. / The Science of the Total Environment 311 (2003) 65–80
concentrations in waters from bedrock wells(Banks et al., 1995b; Reimann et al., 1996; Mor-land et al., 1998).The chemical composition of some of the water
samples(e.g. high B; Fig. 2c) makes them unsuit-able for irrigation. This fact should also be consid-ered in the context of sustainable development ofthe natural resources in the Rift Valley.
7. Conclusions
In total, a staggering 78% of all samples fromthe Ethiopian Rift Valley would fail to pass thecurrent EU drinking water regulations. This num-ber increases to 86% if the WHO-proposed valuefor U is also used. At present the high F concen-trations pose the most serious health problem inthese drinking waters. Uranium might be consid-ered an even bigger problem at the WHO proposedMAC. Fortunately, As and many other harmfulelements show mostly acceptable concentrations.Although a high proportion of all wells do not
fulfil European drinking water guidelines, it shouldbe kept in mind that in most cases the well wateris preferable to polluted surface water. The pointis that the chemical composition of the water mustbe analysed so as to flag actions required forunwanted constituents. In many cases it is rathereasy and cheap to treat the water for inorganicchemical constituents once a problem isrecognised.It should be noted that the natural concentrations
of most of the elements analysed cover betweenthree and four orders of magnitude. Surprisinglyhigh natural concentrations are observed for anumber of elements for which no MAC valueshave been proposed(e.g. Be, Br, Co, Li, Nb, Si,Sr, Te, Th, Tl and V). These elements may warranta toxicological assessment. Be, Br, Th and Tl areprobably the four elements needing most urgentattention from a health perspective. It must alsobe noted that for a number of elements, deficiencymay be the more important health problem. Publicauthorities might be well advised to establish MICvalues for such elements(e.g. Ca, I, Se).This study demonstrates the necessity of docu-
menting natural element concentrations and varia-tion in drinking water resources on a regional
scale. This must be carried out for as manyelements as can be analysed with today’s tech-niques in different geological settings, to providefingerprints of the different types of water.
Acknowledgments
This study was supported by the Ethio-Norwe-gian collaborative project on ‘Fluoride and Fluo-rosis in Ethiopia’. The Norwegian Council ofUniversities Committee for Development Researchand Education(NUFU) financed the fluoride pro-ject through grant number 61-96 to the Universityof Bergen and Addis Ababa University. The Geo-logical Survey of Norway(NGU) provided Clem-ens Reimann with the time to travel to Ethiopiaand work with the data. Tor Erik Finne, NGU,helped with the map of Ethiopia. We are gratefulto Mr Tesfaye Tadesse and Birhanu Seleshi fortheir careful and professional field work. The BGRlaboratory team is thanked for years of enjoyablecooperation. Rognvald Boyd(NGU) is thankedfor English corrections and several importantcomments.
References
Banks D, Reimann C, Røyset O, Skarphagen H. Naturalconcentrations of major and trace elements in some Nor-wegian bedrock groundwaters. Appl Geochem 1995;10:1–16.
Banks D, Røyset O, Strand T, Skarphagen H. Radioelement(U,Th, Rn) concentrations in Norwegian bedrock ground-waters. Environ Geol 1995;25:165–180.
Banks D, Frengstad B, Midtgard AK, Krog JR, Strand T. The˚chemistry of Norwegian groundwaters: I. The distributionof radon, major and minor elements in 1604 crystallinebedrock groundwaters. Sci Total Environ 1998;222:71–91.
Banks D, Midtgard AK, Morland G, Reimann C, Strand T,˚Bjorvatn K, Siewers U. Is pure groundwater safe to drink?Natural ‘contamination’ of groundwater in Norway. GeolToday 1998;14(3):104–113.
Bhargava DS, Killedar DJ. Fluoride adsorption on fishbonecharcoal through a moving media adsorber. Water Res1992;26(6):781–788.
Bjorvatn K, Thorkildsen AH, Holteberg S. Sesongmessigevariasjoner i fluoridinholdet i sør og vestnorsk grunnvannwSeasonal variations of the fluoride content in south andwest Norwegian groundwatersx. Den norske tannlegeforen-ings tidende 1992;102:128–133. in Norwegian.
Bjorvatn K, Bardsen A, Thorkildsen AH, Sand K. Fluorid i˚˚norsk grunnvann—en ukjent helsefaktorwFluoride in Nor-
79C. Reimann et al. / The Science of the Total Environment 311 (2003) 65–80
wegian drinking water—an unknown health factorx. Vann1994;2:120–128. in Norwegian.
Chatterjee A, Das D, Mandal BK, Chowdhurry TR, SamantaG, Chakraborti D. Arsenic in groundwater in six districts ofWest Bengal, India: the biggest arsenic calamity in theworld. Part 1: arsenic species in drinking water and urineof affected people. Analyst 1995;120:643–650.
Chaturvedi AK, Yadava KP, Pathak KC, Singh VN. Defluori-dation of water by adsorption on fly ash. Water Air SoilPollut 1990;49:51–61.
COMA. Nutritional aspects of cardiovascular disease No 46.London: Committee on Medical Aspects of Food Policy,HMSO, 1994.
Das D, Chatterjee A, Mandal BK, Samanta G, Chakraborti D.Arsenic in groundwater in six districts of West Bengal,India: the biggest arsenic calamity in the world. Part 2:arsenic concentration in drinking water, hair, nails, urine,skin scale and liver tissue(biopsy) of the affected people.Analyst 1995;120:917–924.
Dean HT, Jay P, Arnold FA Jr, McClure FJ, Elvove E.Domestic water and dental caries, including certain epide-miological aspects of oralL. acidophilus. Public Health Rep1939;54:862–888.
Dieye A, Mar C, Rumeau M. Defluoridation of drinking watersupplies. Tribune de l’eau 1994;47(568):27–34.
Dissanayake CB. The fluoride problem in the groundwater ofSri Lanka—environmental management and health. Int JEnviron Stud 1991;38:137–156.
Dunckley GG, Malthus RS. Removal of fluoride from fluori-dated water containing 1 ppm fluoride. NZ J Sci1961;4:594–596.
Edmunds WM, Smedley PL. Groundwater geochemistry andhealth: an overview. In: Appleton JD, Fuge R, McCall GJH,editors. Environmental geochemistry and health. GeologicalSociety Special Publication 113 1996. p. 91–105.
Edmunds WM, Trafford JM. Beryllium in river baseflow,shallow groundwaters and major aquifers of the UK. ApplGeochem 1993;2(Suppl):223–233.
European Union. 80y778yEEC Council Directive of 15 July1980 relating to the quality of water intended for humanconsumption. Official Journal of the European Community1980. p. L229y11–L229y29.
European Union. Council Directive 98y83yEC of 3 November1998 on the quality of water intended for human consump-tion. Official Journal of the European Community 1998. p.L330y32–L330y54.
Evans RW, Stamm JW. Dental fluorosis following downwardadjustment of fluoride in drinking water. J Public HealthDent 1991;51:91–98.
Frengstad B, Midtgard AK, Banks D, Krog JR, Siewers U.˚The chemistry of Norwegian groundwaters. III. The distri-bution of trace elements in 476 crystalline bedrock ground-waters, as analysed by ICP-MS techniques. Sci TotalEnviron 2000;246:21–40.
Fuge R, Johnson CC. The geochemistry of iodine: a review.Environ Geochem Health 1986;8:31–54.
Galagan DJ, Lamson GG. Climate and endemic dental fluo-rosis. Public Health Rep 1953;68:497–508.
Galagan DJ, Vermillion JR. Determining optimum fluorideconcentrations. Public Health Rep 1957;72:91–493.
Gardner MJ. Soft water and heart disease. In: Lenthan J,Fletcher WW, editors. Environment and man. Glasgow:Blackie, 1976. p. 116–135.
Handa BK. Geochemistry and genesis of fluoride-containingground waters in India. Ground Water 1975;13:275–281.
Hauge S, Østerberg R, Bjorvatn K, Selvig KA. Defluoridationof drinking water with pottery: effect of firing temperature.J Dent Res 1994;102:329–333.
Hirano S, Suzuki KT. Exposure, metabolism, and toxicity ofrare earths and related compounds. Environ Health Perspec1996;104(Suppl 1):85–95.
Jinadasa KBPN, Weerasooriya SWR, Dissanayake CB. A rapidmethod for the defluoridation of fluoride-rich drinkingwaters at village level. Int J Environ Stud 1988;31y4:305–312.
Jinadasa KBPN, Dissanayake CB, Weerasooriya SVR. Use ofserpentinite in the defluoridation of fluoride-rich drinkingwater. Int J Environ Stud 1991;37:43–63.
Kelly FC, Sneddon WW. Endemic goitre. WHO MonographSeries No 44 1960.
Killedar DJ, Bhargava DS. Effects of stirring rate and temper-ature on fluoride removal by fishbone charcoal. Indian JEnviron Health 1993;35(2):81–87.
Kirjuhin VA, Korotkov AN, Shvarktsev SL. GidrogeohimijawHydrogeochemistryx. Moscow, Russia: Nedra Publications,1993. (383 pp). in Russian.
Kloos H, Tekle-Haimanot R. Distribution of fluoride andfluorosis in Ethiopia and prospects for control. Trop MedInt Health 1999;4:355–364.
Kurzl H. Exploratory data analysis: recent advances for the¨interpretation of geochemical data. J Geochem Expl1988;30:309–322.
Lag J. A comparison of selenium deficiency in Scandinavia˚and China. Ambio 1984;13:286–287.
Matisoff G, Khourey CJ, Hall JF, Varnes AW, Strain WH. Thenature and source of arsenic in northeastern Ohio ground-water. Groundwater 1989;20:446–456.
Merla G, Abbate E, Azzaroli A, Bruni P, Canuti P, FazzuoliM, Sagri M, Tacconi P. A geological map of Ethiopia andSomalia 1973 1:2 000 000 and comment with a map ofmajor landforms. Firenze, Italy: Consiglio nazionale dellerecherche, 1979. (95 pp, colour plates and two maps).´
Midtgard AK, Frengstad B, Banks D, Krog JR, Strand T,˚Siewers U. Drinking water from crystalline bedrock aqui-fers—not just H O. Min Soc Bull 1998;121:9–16.2
Misund A, Frengstad B, Siewers U, Reimann C. Naturalvariation of 66 elements in European mineral waters. SciTotal Environ 1999;243y244:21–41.
Morland G, Reimann C, Strand T, Skarphagen H, Banks D,Bjorvatn K, Hall GEM, Siewers U. The hydrogeochemistryof Norwegian bedrock groundwater-selected parameters(pH, F , Rn, U, Th, B, Na, Ca) in samples from Vestfoldy
and Hordaland, Norway. NGU Bull 1997;432:103–117.
80 C. Reimann et al. / The Science of the Total Environment 311 (2003) 65–80
Morland G, Strand T, Furuhaug L, Skarphagen H, Banks D.Radon concentrations in groundwater from Quaternary sed-imentary aquifers in relation to underlying bedrock geology.Ground Water 1998;36:143–146.
Ockerse T. Chronic endemic dental fluorosis in Kenya, EastAfrica. Br Dent J 1953;95:57–60.
Padmasiri JP, Fonseka WCSA, Liyanapatabendi T. Low-costfluoride removal by an upward-flow household filter. WaterSupply 1995;13:59–64.
Qianjie Z, Hanwen L. Aluminium phosphate for the defluori-nation of potable water. Environ Int 1992;18(2):307–331.
Rajagopal R, Tobin G. Fluoride in drinking water: a survey ofexpert opinions. Environ Geochem Health 1991;13:3–13.
Reimann C, de Caritat P. Chemical elements in the environ-ment—fact sheets for the geochemist and environmentalscientist. Berlin, Germany: Springer-Verlag, 1998. (398 pp).
Reimann C, Hall GEM, Siewers U, Bjorvatn K, Morland G,Skarphagen H, Strand T. Radon, fluoride and 62 elementsas determined by ICP-MS in 145 Norwegian hardrockgroundwaters. Sci Total Environ 1996;192:1–19.
Reimann C, Siewers U, Skarphagen H, Banks D. Does bottletype and acid washing influence trace element analyses byICP-MS on water samples? A test covering 62 elementsand four bottle types: high-density polyethene(HDPE),polypropene(PP), fluorinated ethene propene copolymer(FEP) and perfluoroalkoxy polymer(PFA). Sci Total Envi-ron 1999;239:111–130.
Reimann C, Siewers U, Skarphagen H, Banks D. Influence offiltration on concentrations of 62 elements analysed oncrystalline bedrock groundwater samples by ICP-MS. SciTotal Environ 1999;234:155–173.
Reimann C, Bjorvatn K, Tekle-Haimanot R, Melaku Z, SiewersU. Drinking water quality, Rift Valley, Ethiopia. NGU-Report 2002.033. 2002. (131 pp).
Richards LF, Westmoreland WW, Tashiro M, McKay CH,Mororison JT. Determining optimum fluoride levels forcommunity water supplies in relation to temperature. J AmDent Assoc 1967;74:389–397.
Sæther O, Reimann C, Hilmo BO, Taushani E. Chemicalcomposition of hard- and softrock groundwaters from centralNorway with special consideration of fluoride and Norwe-gian drinking water limits. Environ Geol 1995;26(3):147–156.
Smedley PL, Kinniburgh DG. A review of the source, behav-iour and distribution of arsenic in natural waters. ApplGeochem 2002;17(5):517–568.
Smedley PL, Edmunds WM, Pelig-Ba KB. Mobility of arsenicin groundwater in the Obuasi gold-mining area of Ghana:some implications for human health. In: Appleton JD, Fuge
R, McCall GJH, editors. Environmental geochemistry andhealth. Geological Society Special Publication 113 1996. p.163–181.
Smith AH, Lingas EO, Rahman M. Contamination of drinkingwater by arsenic in Bangladesh: a public health emergency.Bull WHO 2000;78(9):1093–1101.
Tebbutt THY. Relationship between natural water quality andhealth. Paris: UNESCO, 1983.
Tekle-Haimanot R. Neurological complication of endemicskeletal fluorosis with special emphasis on rediculo-myelo-pathy. Paraplegia 1990;28:244–251.
Tekle-Haimanot R, Fekadu A, Bushra B. Endemic fluorosis inthe Ethiopian Rift Valley. Trop Geogr Med 1987;39:209–217.
Teotia SPS, Teotia M, Singh RK. Hydro-geochemical aspectsof endemic skeletal fluorosis in India—an epidemiologicalstudy. Fluoride 1981;14:69–74.
Tjook TK. Defluoridation of water supplies. Waterlines1983;2:26–27.
US EPA. Consumer factsheet on: NitratesyNitrites, 2003, see:http:yywww.epa.govysafewaterydwhyc-iocynitrates.html.
US EPA. National primary drinking water regulations. EPA816-F-01-007United States Environmental Protection Agen-cy, 2001.
Varsanyi I, Fodre Z, Bartha A. Arsenic in drinking water andmortality in the Southern Great Plain, Hungary. EnvironGeochem Health 1991;13:14–22.
Webb JS. Regional geochemical reconnaissance in medicalgeography. In: Cannon HL, Hopps HC, editors. Environ-mental geochemistry and health. Geological Society ofAmerica Memoires, vol. 123 1971. p. 31–42.
WHO. Guidelines for drinking water quality. Geneva: WorldHealth Organisation, 1993.
WHO. Guidelines for drinking-water quality. Addendum tovol. 1. Recommendations, 2nd ed. Geneva: World HealthOrganisation, 1998. p. 10–11.
Williams M, Fordyce F, Paijiprapapon A, Charoenchaisri P.Arsenic contamination in surface drainage and groundwaterin part of the Southeast Asian tin belt, Nakhon Si ThamaratProvince, southern Thailand. Environ Geol 1996;27:16–33.
Zevenbergen C, van Reeuwijk LP, Frapporti G, Louws RJ,Schuiling R. A simple method for defluoridation of drinkingwater at village level by adsorption on Ando soil in Kenya.Sci Total Environ 1996;188:225–232.
Zhaoli S, Mi Z, Minggao T. The characteristics of fluoride ingroundwater of North China and the significance of fluorite-water interaction to fluoride transportation. Proceedings ofthe 6th International Symposium on Water–Rock Interac-tion, Malvern, UK. Rotterdam: Balkema, 1989. p. 801–804.


![Alemayehu Ayele Highway Research Team Leader Ethiopian ...ethiopianreview.com/pdf/001/Road research and development in Ethiopia.pdf · Microsoft PowerPoint - Ppt0000012.ppt [Read-Only]](https://img.pdfslide.us/doc/110x75/5ed7b968498700329150e458/alemayehu-ayele-highway-research-team-leader-ethiopian-research-and-development.jpg)