Embed Size (px)
Citation preview
Drinking Water Inspectorate | Nobel House, 17 Smith Square | London | SW1P 3JR | Tel: 0300 068 6400
www.dwi.gov.uk
Drinking water quality in EnglandThe position after 25 years of regulationJuly 2015A report by the Chief Inspector of Drinking Water
1
Drinking water quality in England:
the position after 25 years of regulation
2
Publ ished by
Dr ink ing W ater Inspectorate
Area 7e
9 Mi l lbank
c/o Nobel House
17 Smith Square
London
SW 1P 3JR
Tel: 0300 068 6400
Website: ht tp: / /www.dwi.gov.uk
© Crown Copyr ight 2015
ISBN: 978-1-905852-95-6
Copyr ight in the typographical arrangement and des ign rests wi th the Crown.
This publ icat ion (exc luding the logo) may be reproduced f ree of charge in any
format or medium provided that i t i s reproduced accurate ly and not used in a
misleading context . The mater ia l must be acknowledged as Crown copyr ight wi th
the t i t le and source of the publ icat ion spec if ied.
3
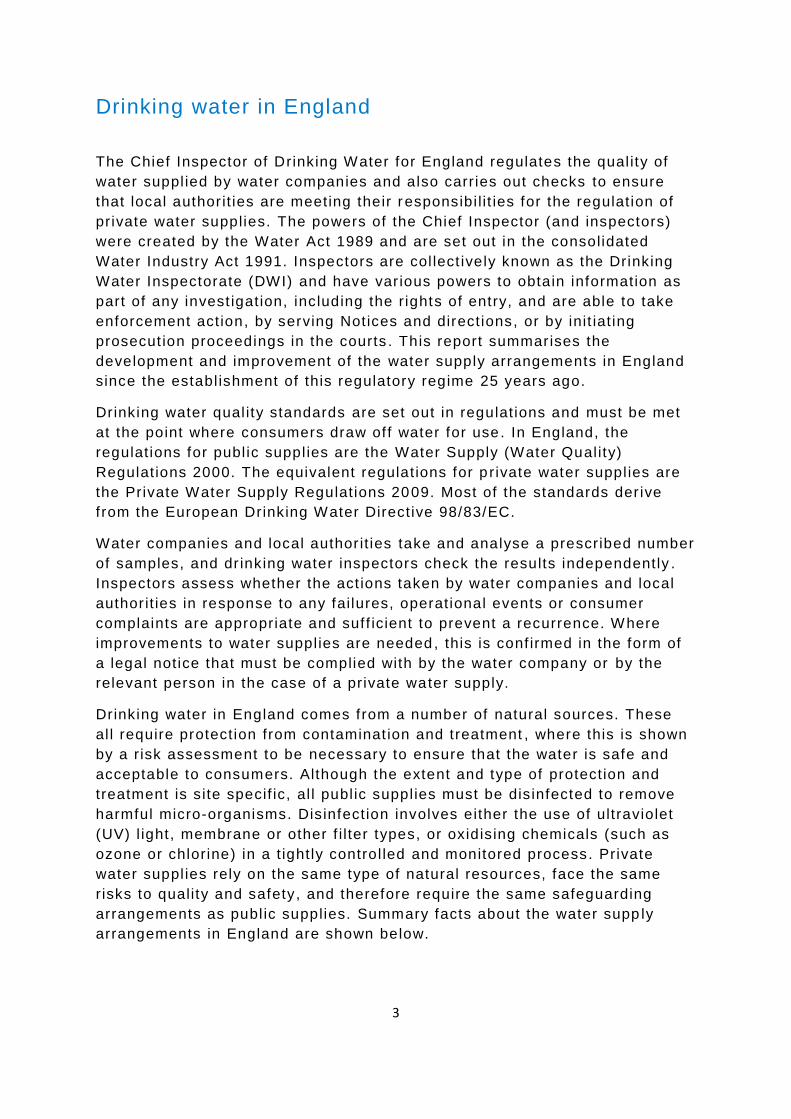
Drinking water in England
The Chief Inspector of Drinking Water for England regulates the qual ity of
water suppl ied by water companies and also carr ies out checks to ensure
that local author it ies are meeting their r esponsibi l i t ies for the regulat ion of
private water supplies. The powers of the Chief Inspector (and inspectors)
were created by the Water Act 1989 and are set out in the consolidated
Water Industry Act 1991. Inspectors are col lect ively known as the Drinking
Water Inspectorate (DWI) and have var ious powers to obtain information as
part of any invest igation, including the r ights of entry, and are able to take
enforcement act ion, by serving Notices and direct ions, or by init iat ing
prosecut ion proceedings in the courts . This report summarises the
development and improvement of the water supply arrangements in England
since the establ ishment of this regulatory regime 25 years ago.
Drinking water qual ity standards are set out in regulat ions and must be met
at the point where consumers draw of f water for use . In England, the
regulat ions for publ ic suppl ies are the Water Supply (Water Qual ity)
Regulat ions 2000. The equivalent regulat ions for p rivate water suppl ies are
the Private Water Supply Regulat ions 2009. Most of the standards der ive
f rom the European Drinking Water Direct ive 98/83/EC.
Water companies and local author it ies take and analyse a prescribed number
of samples, and dr inking water inspectors check the results independently .
Inspectors assess whether the act ions taken by water companies and local
author it ies in response to any failures, operational events or consumer
complaints are appropriate and suf f icient to prevent a recurrence. Where
improvements to water suppl ies are needed , this is conf irmed in the form of
a legal notice that must be complied with by the water company or by the
relevant person in the case of a private water supply.
Drinking water in England comes from a number of natural sources. These
al l require protect ion from contaminat ion and treatment , where this is shown
by a r isk assessment to be necessary to ensure that the water is safe and
acceptable to consumers. Although the extent and type of protect ion and
treatment is s ite specif ic, al l publ ic suppl ies must be dis infected to remove
harmful micro-organisms. Disinfect ion involves either the use of ultraviolet
(UV) l ight, membrane or other f i l ter types, or oxidis ing chemicals (such as
ozone or chlorine) in a t ight ly control led and monitored process. Private
water suppl ies rely on the same type of natural resources, face the same
risks to quality and safety, and therefore require the same safeguarding
arrangements as publ ic supplies. Summary facts about the water supp ly
arrangements in England are shown below.
4
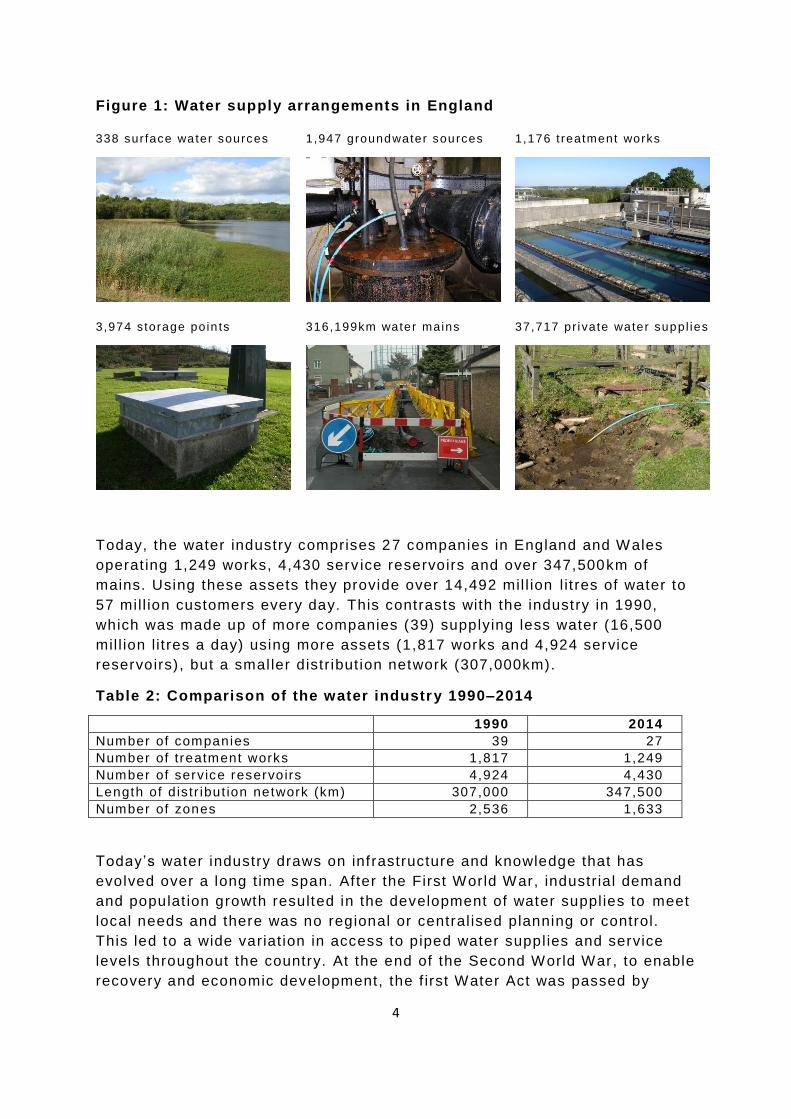
Figure 1: Water supply arrangements in England
338 sur face water sources 1,947 groundwater sources 1,176 t reatment works
3,974 s torage poin ts 316,199km water mains 37,717 pr i vate water suppl ies
Today, the water industry comprises 27 companies in England and Wales
operat ing 1,249 works, 4,430 serv ice reservoirs and over 347,500km of
mains. Using these assets they provide over 14,492 mil l ion l i t res of water to
57 mill ion customers every day. This contrasts with the industry in 1990,
which was made up of more companies (39) supplying less water (16,500
mil l ion l i t res a day) using more assets (1,817 works and 4,924 service
reservoirs) , but a smaller distr ibut ion network (307,000km).
Table 2: Comparison of the water industry 1990–2014
1990 2014
Number of companies 39 27
Number of treatment works 1,817 1,249
Number of service reservoirs 4,924 4,430
Length of d istr ibut ion network (km) 307,000 347,500
Number of zones 2,536 1,633
Today’s water industry draws on infrastructure and knowledge that has
evolved over a long t ime span. Af ter the First World War, industr ial demand
and populat ion growth resulted in the development of water suppl ies to meet
local needs and there was no regional or central ised planning or control.
This led to a wide variat ion in access to piped water suppl ies and service
levels throughout the country. At the end of the Second World War, to enable
recovery and economic development, the f irst Water Act was passed by
5
Parl iament in 1945. This created the basis of today’s water supply
management f ramework with the aim of improving access to piped water
suppl ies which at that t ime were est imated to serve 70% of the populat ion.
Fol lowing a drought in 1959 and f looding in 1963 , a more co-ordinated
approach to managing and conserving water resources based on abstract ion
l icences was introduced (Water Resources Act 1963) . However, throughout
the late 1960s there were continued problems with planning and demand
forecasting result ing in further reform. The Water Act 1973 created 10
regional water authorit ies (one in Wales) based on water catchment areas ,
with local author it ies represented at board level. These regional water
author it ies took over responsibi l i ty for water resource management and the
supply of water , and the col lect ion and treatment of sewage. Services were
funded through water charges with central government having overal l control
of performance, planning and the f inancing of long-term infrastructure
development. However, by the 1980s it was evident that the regional water
author it ies could not meet the environmental standards being demanded by
public opinion and embodied in new European legislat ion. This def icit was
part ial ly addressed by the Water Act 1983 which moved some control away
from government enabl ing access for capital to the f inancial markets .
However, this did not go far enough to ensure European environmental and
drinking water standards were brought into law or that there was adequate
investment plans to enable these to be met . Therefore, a further Water Act
was required in 1989, privat ising the regional water author it ies and creat ing
the comprehensive f ramework of privately owned water companies,
standards, regulat ions and independent regulators that comprise today’s
water industry.
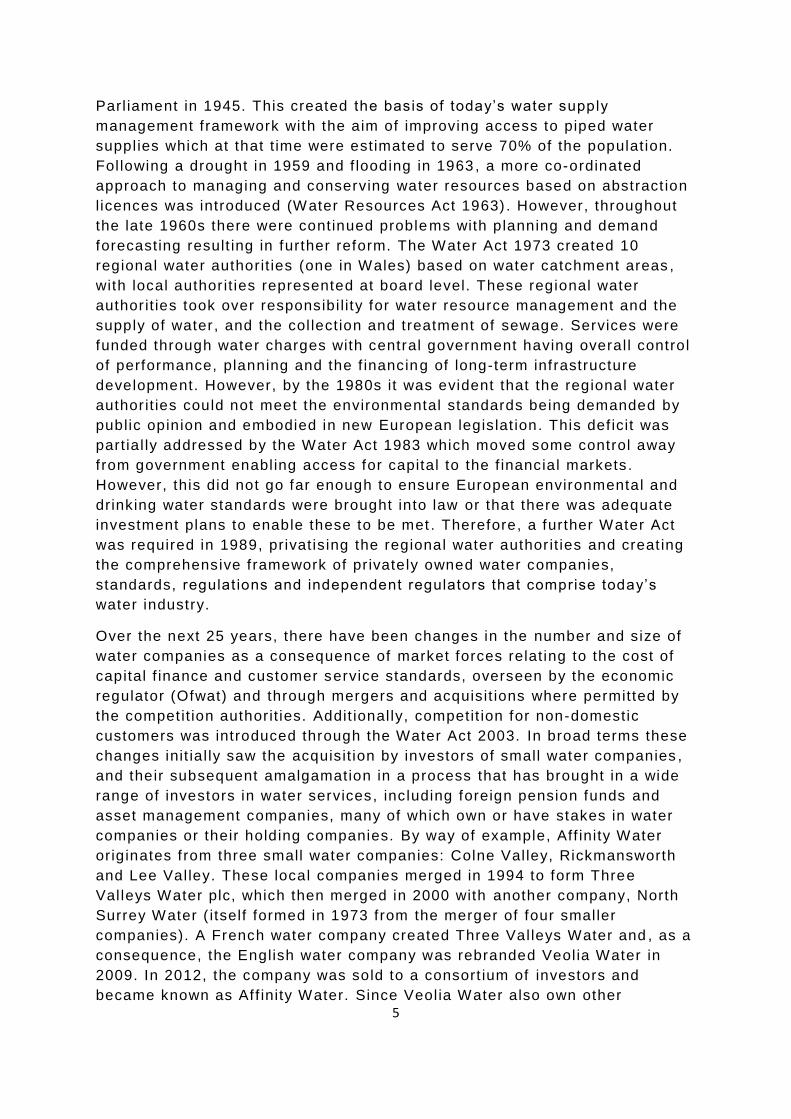
Over the next 25 years, there have been changes in the number and size of
water companies as a consequence of market forces relat ing to the cost of
capital f inance and customer service standards, overseen by the economic
regulator (Ofwat) and through mergers and acquisit ions where permitted by
the compet it ion authorit ies. Addit ional ly, competit ion for non-domestic
customers was introduced through the Water Act 2003. In broad terms these
changes init ia l ly saw the acquisit ion by investors of small water companies ,
and their subsequent amalgamation in a process that has brought in a wide
range of investors in water services, including foreign pension funds and
asset management companies, many of which own or have stakes in water
companies or their holding companies. By way of example, Aff inity Water
originates f rom three small water companies: Colne Val ley, Rickmansworth
and Lee Val ley. These local companies merged in 1994 to form Three
Val leys Water plc, which then merged in 2000 with another company, North
Surrey Water ( itself formed in 1973 from the merger of four smaller
companies). A French water company created Three Val leys Water and , as a
consequence, the English water company was rebranded Veol ia Water in
2009. In 2012, the company was sold to a consort ium of investors and
became known as Aff inity Water. Since Veol ia Water also own other
6
companies, such as the former Tendring Hundred Water company, this is
now also part of Aff inity Water ’s operational area.
A number of the companies, both past and present, operate assets and
provide cross border supplies where water resources ar is ing in one country
are used to provide water suppl ies to consumers in another. In 1990, just
one company, the Wrexham and East Denbighshire Water Company,
operated solely within Wales, whereas three companies (Chester Waterworks
Company, Severn Trent Water and Dŵr Cymru Welsh Water) operated in
both England and Wales. Today the Wrexham and East Denbighshire Water
Company and the Chester Waterworks Company have been merged into a
single company (Dee Val ley Water) which, l ike Severn Trent Water and Dŵr
Cymru Welsh Water, serve consumers in both England and Wales.
How good is drinking water at the tap in 2014 compared to 1990?
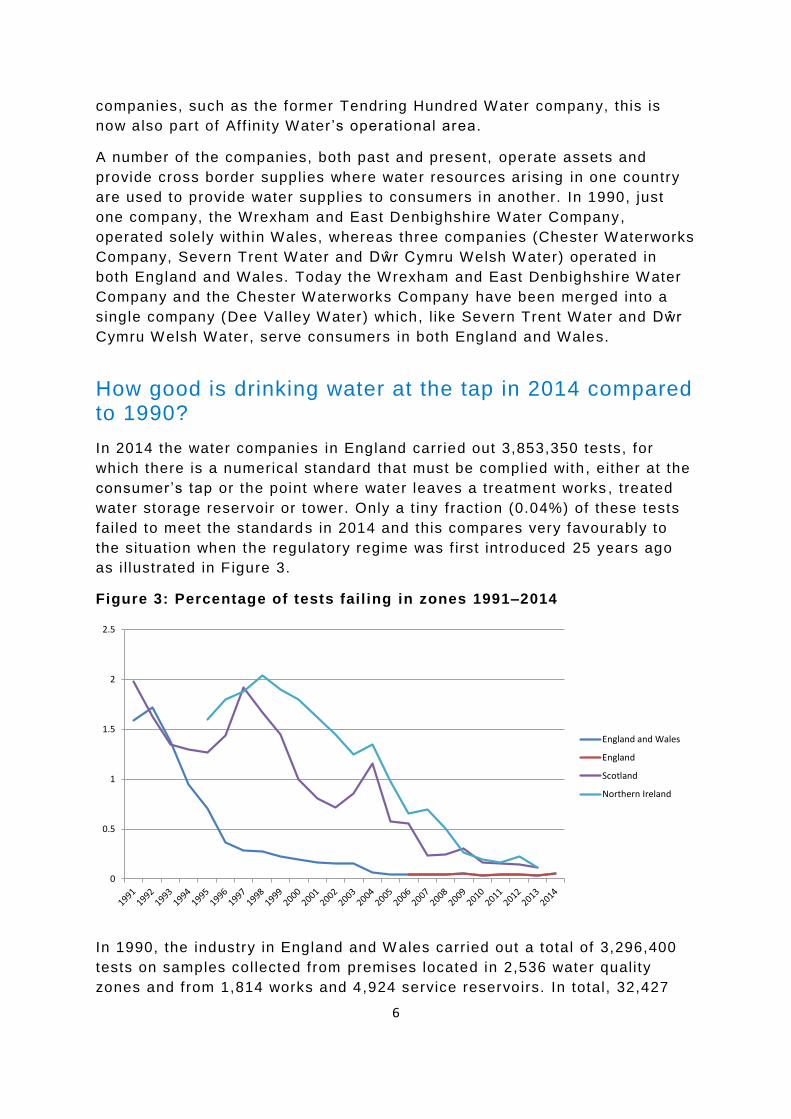
In 2014 the water companies in England carr ied out 3,853,350 tests, for
which there is a numerical standard that must be complied with , either at the
consumer’s tap or the point where water leaves a treatment works , treated
water storage reservoir or tower. Only a t iny f ract ion (0.04%) of these tests
failed to meet the standards in 2014 and this compares very favourably to
the situation when the regulatory regime was f irst introduced 25 years ago
as i l lustrated in F igure 3.
Figure 3: Percentage of tests fail ing in zones 1991–2014
0
0.5
1
1.5
2
2.5
England and Wales
England
Scotland
Northern Ireland
In 1990, the industry in England and W ales carr ied out a total of 3,296,400
tests on samples col lected f rom premises located in 2,536 water quality
zones and from 1,814 works and 4,924 service reservoirs. In total, 32,427
7
failed to comply with one of the standards and compliance with standards at
the start of the regulatory regime was therefore 99.00%. When consider ing
the need for enforcement the f irst Chief Inspector ’s Report, describing the
data f rom 1990, identif ied a number of key issues to be addressed as
follows:
Lead: in 1990, out of approximately 68,000 tests 3.1% (2,121) failed to meet
the standard of the t ime (50µg/l). Ful l compliance was achieved in 1,943 out
of the 2,536 zones. In the remaining 593 zones the failures were recognised
as being due to lead supply pipes connecting premises to the water company
main or plumbing inside the premises instal led pr ior to lead being banned in
the 1970s. The new regulat ions required companies to identify zones at r isk
and introduce water treatment. In 1990, a total of 35 companies entered into
legal ly-binding programmes to carry out surveys to assess the r isk . The f irst
annual report , showed that 562 zones had been identif ied as being at r isk
with 713 zones not at r isk. Since that t ime the standard for lead has been
t ightened and now stands at 10µg/l. Investment in r isk assessment, water
treatment and opportunist ic removal of lead supply pipes and plumbing over
25 years has reduced substant ial ly the number of sample failures. In 2014,
there were just 84 failures at the t ighter standard (10µg/l) with 70 of these
being conf irmed as due to customer owned pipes and plumbing in older
housing.
Discoloured water: when iron and manganese deposits accumulate in the
distr ibut ion network they can give r ise to consumer complaints when there is
a change in f low or pressure. In 1990, 2,226 (3%) out of 73,635 tests failed
the standard for iron (200µg/l) . These failures occurred in 751 (29.6%) water
supply zones and the companies est imated that 65,958km of old, unl ined
cast iron mains needed cleaning, l in ing or replacement in 2,358 zones.
Addit ional ly, there were 708 (1.2%) tests that f ailed the standard for
manganese (50µg/l) out of a total of 61,226 tests impact ing on 245 (9.7%)
water supply zones. In the f irst Asset Management Plan per iod (1990–1995)
the companies were required to renovate the highest r isk mains (14,100km)
in 1,146 zones. These long-term strategic distr ibut ion system programmes of
work continued for a further 10 to 20 years, alongside other investment in
water treatment necessary to remove natural ly occurring iron and
manganese in raw water sources. Driven by the Inspectorate’s assessment
of compliance data and discolourat ion events, including prosecutions where
water was suf f iciently discoloured as to cause consumers to reject it as unf it
for human consumption, there are now fewer failures in part due to 90
separate schemes addressing manganese and iron at works. Since
complet ion of the strategic investment program mes in 2010, iron failures
occur on average 122 t imes per year. The same trend is evident for
manganese where the number of failures now average 25 per year. In 2014,
there were just 120 iron failures and 27 manganese failures, many (59) were
due to a short-term, local network event dealt with by f lushing. Importantly
8
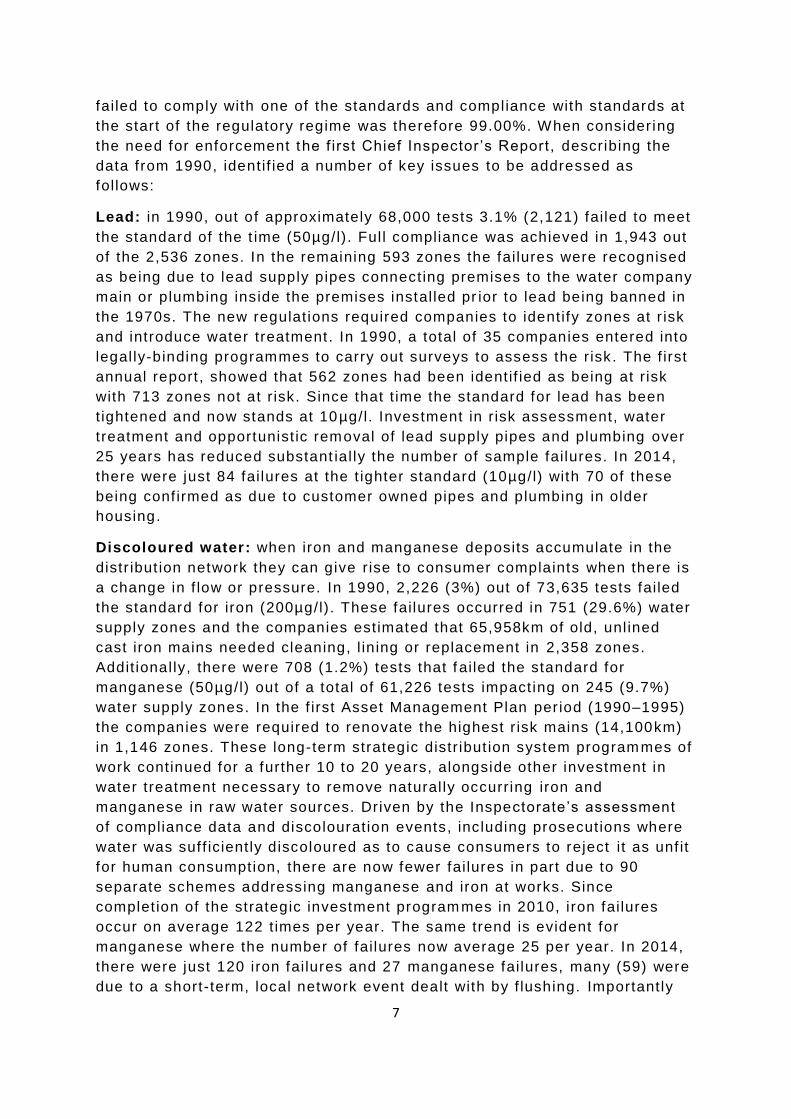
the consumer benef its of these improvements can be seen from the decl ine
in consumer reports of ‘dir ty tap water’ f rom 87,517 to 47,986 a year
between 2006 and 2014.
Figure 4: Consumer contacts to water companies reporting dirty water
0
10,000
20,000
30,000
40,000
50,000
60,000
70,000
80,000
90,000
100,000
2006 2007 2008 2009 2010 2011 2012 2013 2014
Hydrogen ion (pH): in 1990, eight companies reported 995 (2.5%) failures
of the pH standard out of around 41,000 tests. In most cases this was due to
the leaching of l ime from cement mortar - l ined mains. As a consequence of
long-term strategic investment to improve the distr ibut ion network this
problem has been largely eradicated, with pH exceedances reported at the
low average rate of 9 a year since 2004. Addit ionally, as a consequence of
improved water treatment , there are now far fewer failures due to acid water
(pH <6.5), a problem related to the nature of the upland surface water
sources in Wales and the North West of England. In 2014, there were only
six such failures, al l of which occurred in the Northern region.
Nitrate: in 1990, the number of water sources impacted adversely by nitrates
was 192 (11%) and water leaving treatment works 94 (5%) exhibited values
above the standard of 50 mg/l. Together these works suppl ied a populat ion
of around 5.3 mil l ion people l iving or working in 209 water supply zones. The
nitrate issue, related mainly to agricultural pract ices , had been growing in
England dur ing the 1980s (for example, an addit ional 38 works were
identif ied as being newly affected between 1989 to 1990), however, the
companies had taken early act ion to change or blend sources s o that water
leaving all but three of these works met the nitrate standard. Despite
changes in agricultural pract ice driven by environmental legislat ion, there is
9
no quick way to reverse the impact on groundwater and n itrate has continued
to impact dr inking water sources over the past 25 years and blending or
treatment is l ikely to be needed at 29 works in the near future.
Trihalomethanes (THMs): These substances may be formed when water is
dis infected with chlorine if the process is not t ight ly control led. In 1990, this
was somet imes the case as evidenced by the results of tests which sh owed
that out of a total of 18,000 there were 987 (5.3%) which fai led to meet the
standard for Total Trihalomethanes (100µg/l) and 83 water supply zones
exhibited a roll ing three-monthly average above 100µg/l. As a consequence
of enforcement by the Inspectorate, 24 water companies were required to
invest in enhanced water treatment and control . Since complet ion of these
programmes of work, failures of the standard have become rare (average of
just four failures a year since 2010). In 2014 , there were no fai lures of the
THM standard.
Water quality at treatment works
Treatment works vary considerably in size, but al l are sampled regular ly in
proport ion to the volume of water supplied .
Over the past 25 years the number and size of works operated by the
companies in England and Wales has changed markedly. In 1990, there were
1,817 works and this has decl ined to 1,243. The majority of the 574 works no
longer in use were abandoned in the f irst three AMP per iods (1990 –2005)
with, on average, 36 works being decommissioned each year. During the
same per iod the volume of water enter ing supply has increased (f rom 16,592
to 17,836Ml/d) and a comparison of f igures shows the main change in water
supply arrangements across the industry has been the closure of many small
treatment works. This trend of increased output f rom fewer works has come
about through greater knowledge of source water qual ity and expansion of
the distr ibut ion network enabl ing rat ional isat ion of assets and greater
connectivity. For example, in 2014, there were 119 inter-company transfers
of treated or raw water .
Al l water enter ing supply must be f ree f rom harmful micro -organisms and
companies are required to demonstrate that dis infect ion is effect ive at al l
t imes. Disinfect ion may be achieved by physic al methods (typical ly UV
irradiat ion or membrane f i l t rat ion) or by the appl icat ion of oxidis ing
chemicals (such as ozone or chlor ine). Treated water leaving a works is
tested regular ly for the indicator organisms, coliforms and E.col i . In 1990,
treatment works compliance for E.col i was only 99.86% (with 283 failures
recorded at 174 dif ferent treatment works). In 2007, the law was changed to
make it an offence if a water company fai l ed to adequately design, maintain
and operate ef fect ive treatment including disinfect ion. This strengthening of
10
the safety rules has driven up operat ing standards s o that in 2014,
compliance was very high at 99.99% with only three failures for E.col i at
three dif ferent treatment works.
Cryptosporidium is a microscopic parasite that can cause water -borne
i l lness. I f human sewage or animal faeces containing the parasite enter a
raw water source then this parasite, which is very resistant to tradit ional
methods of water treatment , may gain access to drinking water and pose a
serious r isk to consumers’ health. This r isk was f irst widely recognised as a
result of a large outbreak in Oxford and Swindon in 1989 1. There were other
smaller water-related outbreaks in the early 1990s, the most notable being in
Torbay, South Devon, in 1992 and 1995, along with others in the North West
of England and Yorkshire. To address this serious r isk to health, the
Government accepted the recommendations of an independent expert group 2
and the law was changed in 1999 to require water companies to identify al l
works at r isk by monitoring for the parasite and improv ing water treatment .
Fol lowing a further outbreak in North Wales in 2005, the law was further
t ightened by introducing a turbidity standard at works of 1NTU. In 2014,
test ing of raw water for Cryptosporidium ver if ied a potent ial r isk at 149 out of
a total of 376 abstract ion points serving 127 treatment works operated by 16
water companies. Despite good compliance with the turbidity standard of
1NTU (99.98% in 2014) there have been two further small water-related
outbreaks of human cryptospor idiosis (Northamptonshire 2008 and
Bournemouth 2013) due to site-specif ic fai lures in maintenance and
operat ional knowledge. This demonstrates the need for continuous r isk
assessment and a r igorous applicat ion of knowledge about this part icular ly
hazard.
.
1Cryptosporidium in Water Supplies. Report of the Group of Experts. Chairman: Sir John Badenoch. July 1990.
Department of Health/Department of the Environment. 2 Cryptosporidium in Water Supplies. Third Report of the Group of Experts. Chairman: Professor Ian Bouchier
November 1998. Department of the Environment, Transport and the Regions & Department of Health.
11
Water quality in distribution systems
The distr ibut ion system comprises the network of pipes del ivering water to
homes and businesses, as wel l as water towers and service reservoirs. In
2014, the distr ibut ion network in England comprised a total of 3,947
reservoirs and more than 316,000km of water mains, al l of which must be
operated and maintained in a hygienic manner that ensures water quality
does not deteriorate.
Water companies must sample each reservoir and tower weekly, and test for
E.col i and col iform bacteria. The col iform standard is for no more than 5% of
samples in a year to contain col iforms at any reservoir, however, the cause
of each failure must be invest igated and act ion taken to repair any def ects
identif ied with the integrity of these structures. In 2014, just 10 samples
contained E.col i and no storage points failed to meet the standard with 126
failures requir ing investigation. This compares favourably to the situation in
1990 when there were 509 E.col i failures and col iforms were detected at 371
reservoirs across England and Wales. This improvement in the
microbiological quali ty of stored treated water has been brought about
through improved maintenance, for example, over the 25-year period 11%
(494) of the reservoirs in use in 1990 have been decommissioned because
they were assessed as no longer f it for purpose or were no longer required.
Water companies must maintain the ir network of water mains so that they
remain clean and hygienic , and take act ion whenever a consumer reports
that water at the tap is not c lear and br ight in appearance , and free f rom any
object ionable taste and odour. The number of discolourat ion contacts f rom
consumers is important evidence used to plan programmes of mains
cleaning, rehabil itat ion or replacement , and to measure that these are
effect ive, In 2014, the industry average number of discolourat i on contacts
f rom consumers in England was 0.76 per 1,000 populat ion, down from 1.5
per 1,000 populat ion a decade ago.
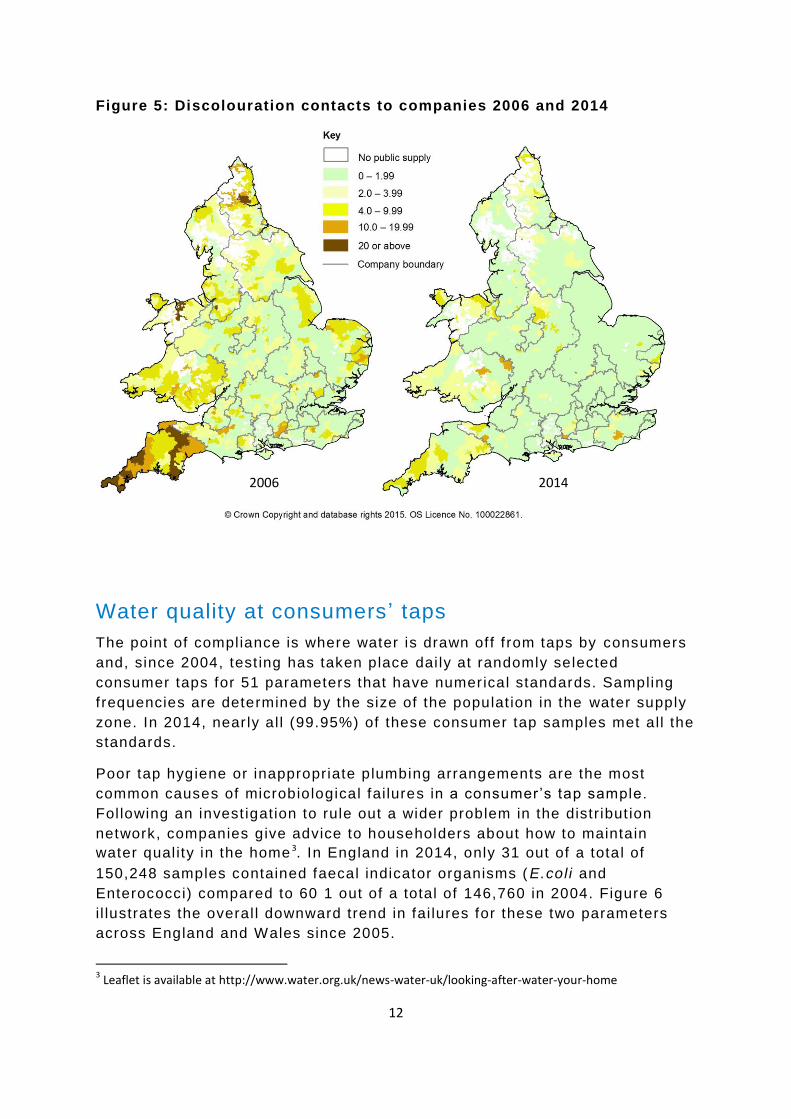
The progress in addressing discolourat ion and the associated reduction in
consumer contacts since 2006 is shown in Figure 5.
Discolourat ion contacts have histor ical ly been a problem in the north and
south-west of England. This is st i l l broadly the case today with the northern
region account ing for 34% of all discolourat ion contacts contrast ing with
London and the South East receiving only 13% of the industry total.
12
Figure 5: Discolouration contacts to companies 2006 and 2014
Water quality at consumers ’ taps
The point of compliance is where water is drawn of f f rom taps by consumers
and, since 2004, test ing has taken place dai ly at randomly selected
consumer taps for 51 parameters that have numerical standards. Sampling
f requencies are determined by the size of the populat ion in the water supply
zone. In 2014, near ly al l (99.95%) of these consumer tap samples met all the
standards.
Poor tap hygiene or inappropriate plumbing arrangements are the most
common causes of microbiological failures in a consumer’s tap sample.
Fol lowing an invest igation to rule out a wider problem in the distr ibut ion
network, companies give advice to householders about how to maintain
water qual ity in the home 3. In England in 2014, only 31 out of a tota l of
150,248 samples contained faecal indicator organisms ( E.col i and
Enterococci) compared to 60 1 out of a total of 146,760 in 2004. Figure 6
i l lustrates the overal l downward trend in fai lures for these two parameters
across England and Wales since 2005.
3 Leaflet is available at http://www.water.org.uk/news-water-uk/looking-after-water-your-home
2006 2014
13
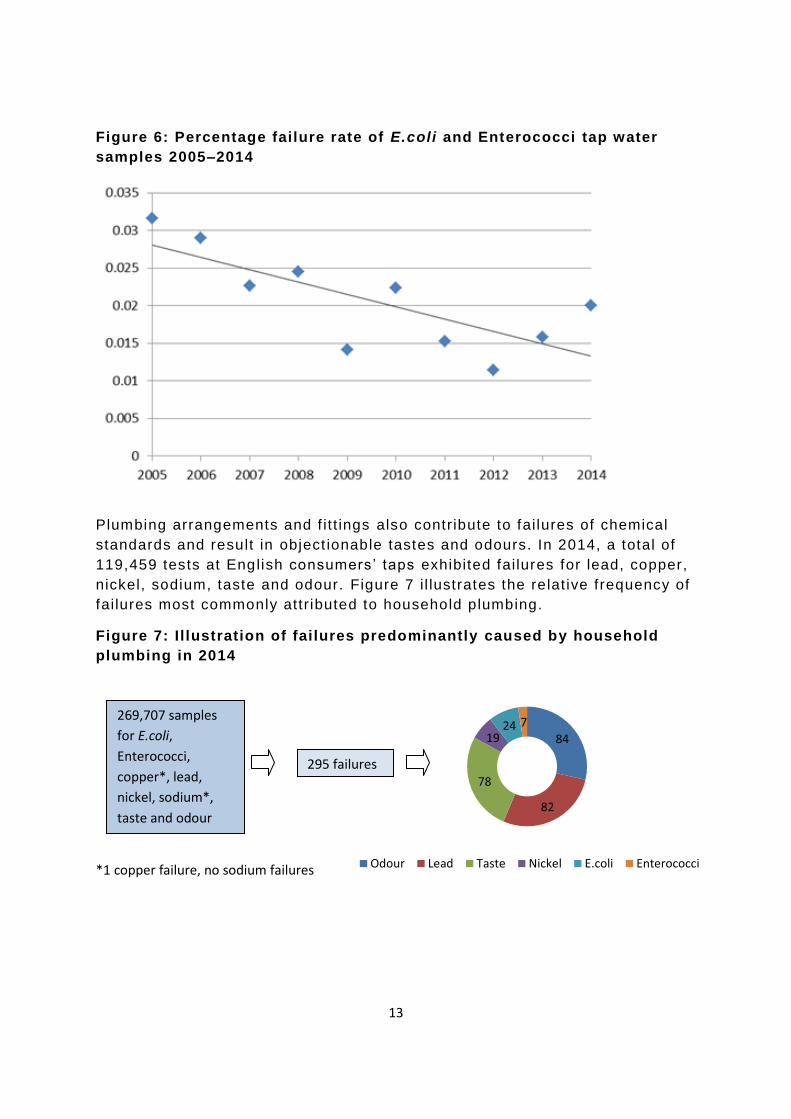
Figure 6: Percentage failure rate of E.coli and Enterococci tap water
samples 2005–2014
Plumbing arrangements and f it t ings also contr ibute to failures of chemical
standards and result in object ionable tastes and odours. In 2014, a total of
119,459 tests at English consumers’ taps exhibited failures for lead, copper,
nickel, sodium, taste and odour. Figure 7 i l lustrates the relat ive f requency of
failures most commonly attr ibuted to household plumbing.
Figure 7: I l lustration of failures predominantly caused by household
plumbing in 2014
*1 copper failure, no sodium failures
84
82
78
1924 7
Odour Lead Taste Nickel E.coli Enterococci
269,707 samples
for E.coli,
Enterococci,
copper*, lead,
nickel, sodium*,
taste and odour
295 failures
14
Events and incidents
Very occasional ly things happen that may have an adverse effect on water
quality or cause consumers concern therefore companies are required by law
to tell the Inspectorate about al l these events. In England in 2014, there
were 488 such events and 220 were r isk assessed as being s ignif icant or
serious requir ing an independent investigation by a dr inking water inspector .
Companies are required to act on recommendations made by the inspector to
prevent a recurrence. Legally enforceable Notices may be put in place to
ensure that a supply is improved. Except ionally, where there is evidence that
an offence was committed, the company may be prosecuted in court. Since
its formation the Inspectorate has successfully brought 75 cases (65 in
England and 10 in Wales) across the industry, the f irst being in 1995
(following an event in 1993). The majority of prosecut ions occurred dur ing
the f irst 15 years of the cur rent regulatory regime and improvements made
by the industry since mean that the Inspectorate has only found it necessary
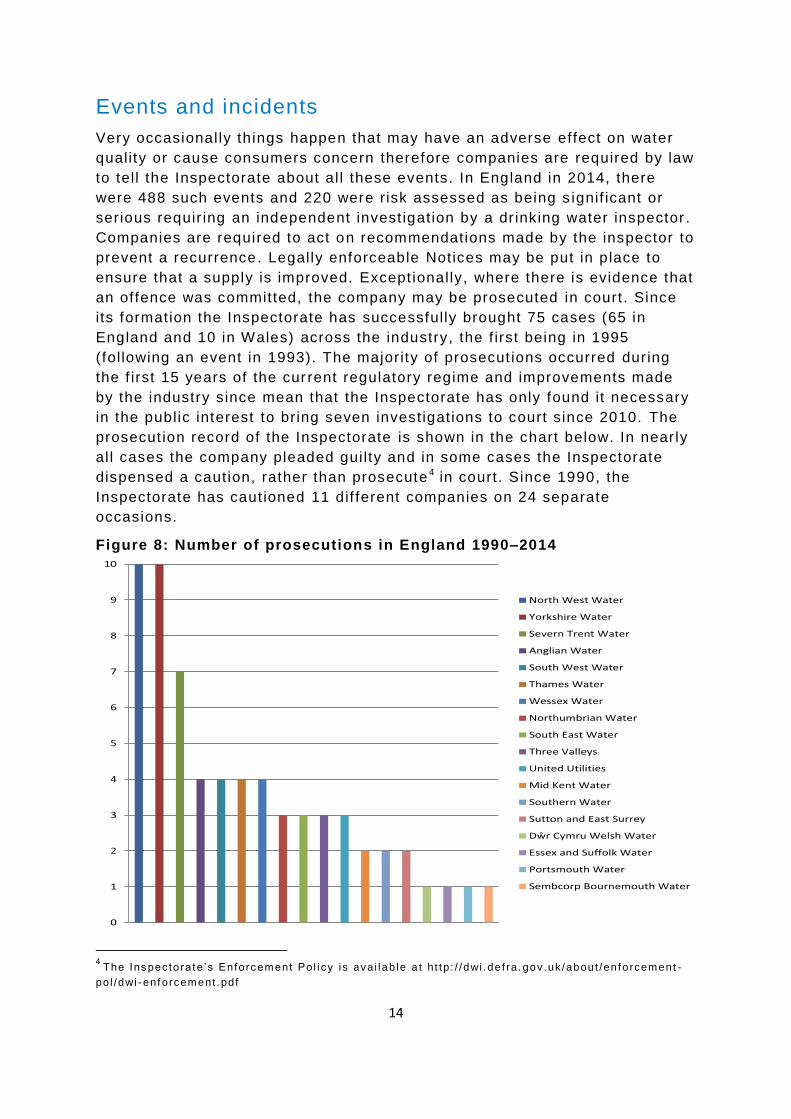
in the public interest to bring seven investigations to court since 2010. The
prosecut ion record of the Inspectorate is shown in the chart below. In near ly
al l cases the company pleaded gui lty and in some cases the Inspectorate
dispensed a caution, rather than prosecute 4 in court. Since 1990, the
Inspectorate has cautioned 11 dif ferent companies on 24 separate
occasions.
Figure 8: Number of prosecutions in England 1990–2014
0
1
2
3
4
5
6
7
8
9
10
North West Water
Yorkshire Water
Severn Trent Water
Anglian Water
South West Water
Thames Water
Wessex Water
Northumbrian Water
South East Water
Three Valleys
United Utilities
Mid Kent Water
Southern Water
Sutton and East Surrey
Dŵr Cymru Welsh Water
Essex and Suffolk Water
Portsmouth Water
Sembcorp Bournemouth Water
4 The Inspec to ra te ’s Enforc ement Po l i cy i s ava i lab le a t h t tp : / /dwi .def ra . gov.uk /about /enforcement -
po l /dwi -enforcement .pdf
15
In 2014, there were just 12 ser ious events and most were short - l ived. These
events involved a range of issues including treatment failure (2),
microbiological contaminat ion or identif icat ion of Cryptospor idium in a supply
(4), chemical contaminat ion (3), issue of boi l water advice (1) and wide scale
f looding (2).
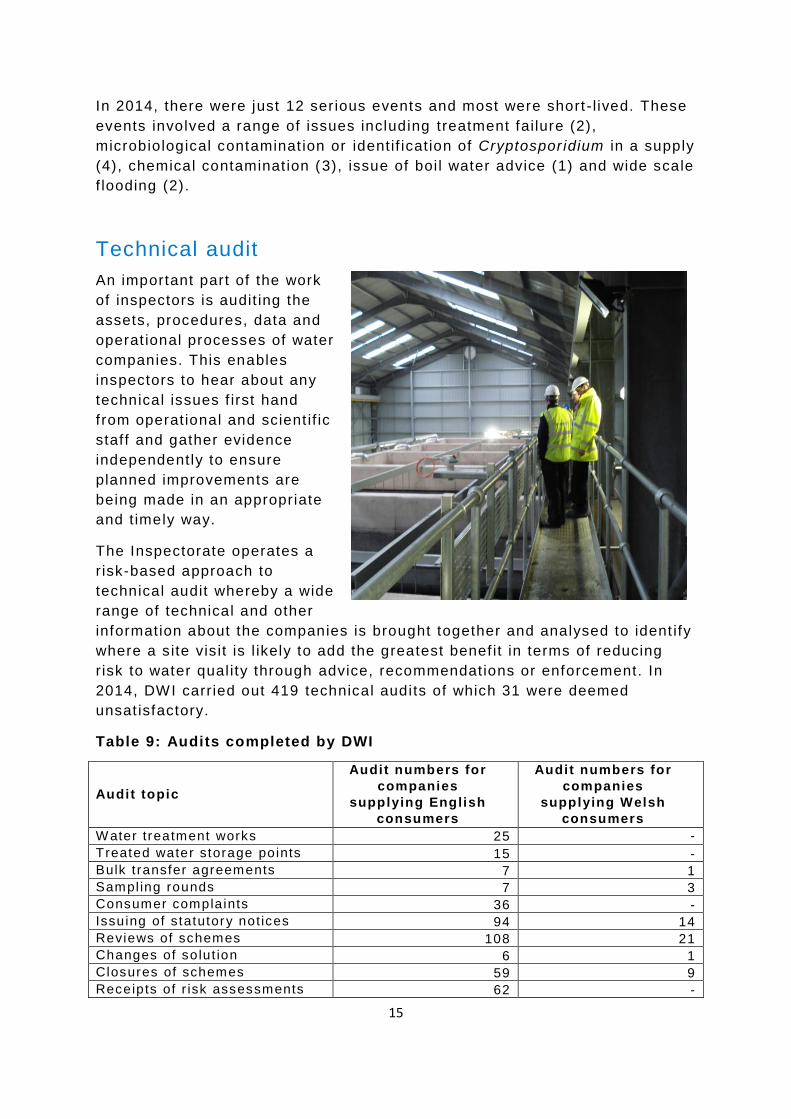
Technical audit
An important part of the work
of inspectors is audit ing the
assets, procedures, data and
operat ional processes of water
companies. This enables
inspectors to hear about any
technical issues f irst hand
from operational and scient if ic
staff and gather evidence
independently to ensure
planned improvements are
being made in an appropriate
and t imely way.
The Inspectorate operates a
r isk-based approach to
technical audit whereby a wide
range of technical and other
information about the companies is brought together and analysed to ident ify
where a site vis it is l ikely to add the greatest benef it in terms of reducing
r isk to water qual ity through advice, recommendations or enforcement. In
2014, DWI carr ied out 419 technical audits of which 31 were deemed
unsat isfactory.
Table 9: Audits completed by DWI
Audit topic
Audit numbers for
companies
supplying English
consumers
Audit numbers for
companies
supplying Welsh
consumers
Water treatment works 25 -
Treated water storage points 15 -
Bulk t ransfer agreements 7 1
Sampl ing rounds 7 3
Consumer complaints 36 -
Issuing of statutory not ices 94 14
Reviews of schemes 108 21
Changes of solut ion 6 1
Closures of schemes 59 9
Receipts of r isk assessments 62 -
16
Consumer contacts
Overal l in 2014 across England, there were 87,920 consumer contacts
relat ing to water quality equat ing to a contact rate of 1.6 per 1,000
populat ion. Over the decade there has been a 38% reduct ion in the number
of contacts of all types. In relat ion to consumer contacts about an
object ionable taste and odour , in 2014 these were relat ively few (21,881 in
total equat ing to a contact rate of 0.4 per 1,000 populat ion) and most related
to chlor ine. A small number of consumers object in principle to the use of
trace levels of chlorine to secure the hygienic condit ion of the distr ibut ion
network, and a few are part icular ly sensit ive, causing them to detect and
report minor var iat ions in the chlorine residual concentrat ion in tap water. In
2014, the number of such reports by consumers was relat ively low (0.2 per
1,000 populat ion) .
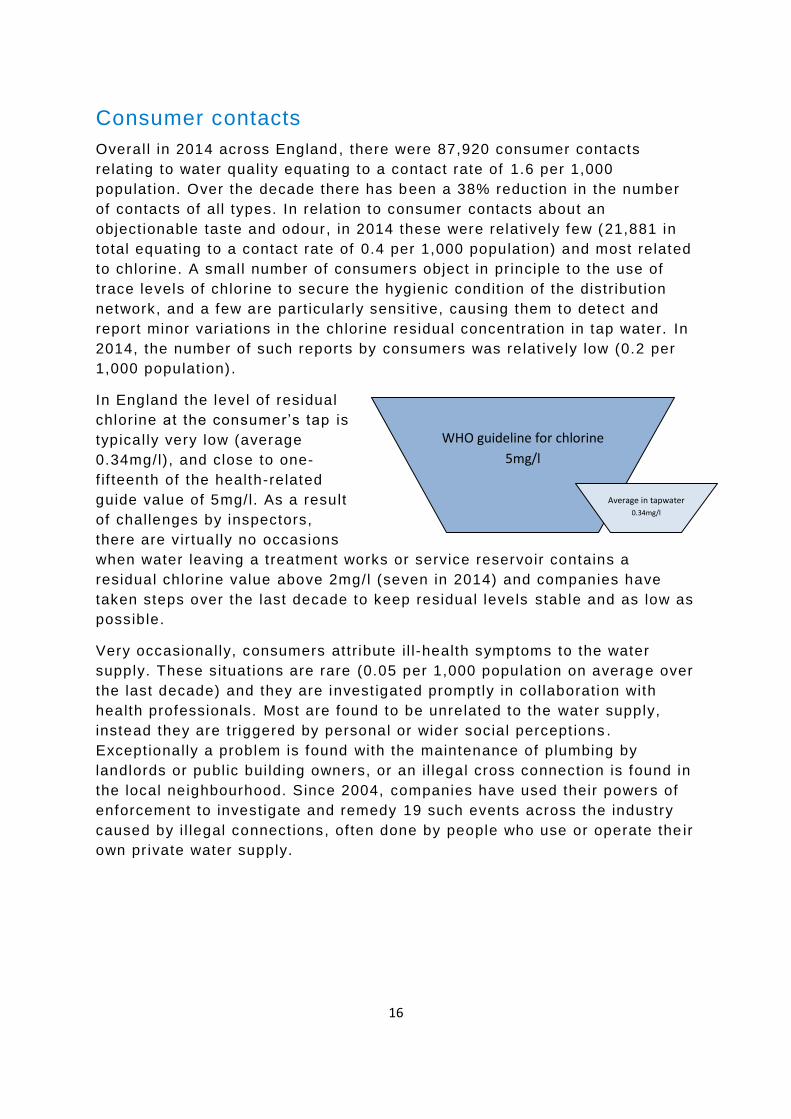
In England the level of residual
chlorine at the consumer’s tap is
typical ly very low (average
0.34mg/l), and close to one-
f if teenth of the health-related
guide value of 5mg/l. As a result
of challenges by inspectors,
there are virtually no occasions
when water leaving a treatment works or service reservoir contains a
residual chlor ine value above 2mg/l (seven in 2014) and companies have
taken steps over the last decade to keep residual levels stable and as low as
possible.
Very occasional ly, consumers attr ibute i l l-health symptoms to the water
supply. These situat ions are rare (0.05 per 1,000 populat ion on average over
the last decade) and they are invest igated promptly in col laboration with
health professionals. Most are found to be unrelated to the water supply,
instead they are tr iggered by personal or wider social percept ions .
Except ionally a problem is found with the maintenance of plumbing by
landlords or publ ic bui lding owners, or an i l legal cross connection is found in
the local neighbourhood. Since 2004, companies have used their powers of
enforcement to investigate and remedy 19 such events across the industry
caused by i l legal connect ions, of ten done by people who use or operate the ir
own pr ivate water supply.
WHO guideline for chlorine
5mg/l
Average in tapwater
0.34mg/l
17
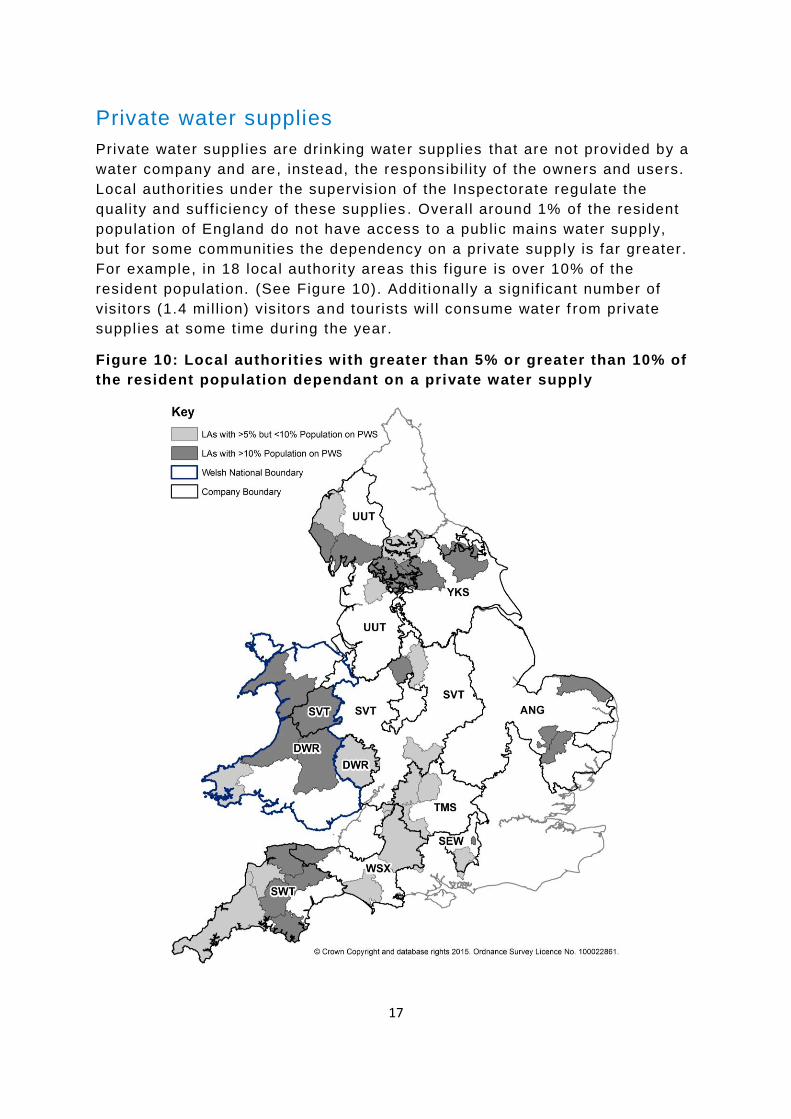
Private water supplies
Private water suppl ies are drinking water suppl ies that are not provided by a
water company and are, instead, the responsibi l i ty of the owners and users.
Local authorit ies under the supervis ion of the Inspectorate regulate the
quality and suf f iciency of these supplies . Overal l around 1% of the resident
populat ion of England do not have access to a public mains water supply,
but for some communit ies the dependency on a private supply is far greater.
For example, in 18 local author ity areas this f igure is over 10% of the
resident populat ion. (See Figure 10). Addit ional ly a signif icant number of
vis itors (1.4 mil l ion) vis itors and tourists wi l l consume water f rom private
suppl ies at some t ime during the year.
Figure 10: Local authorities with greater than 5% or greater than 10% of
the resident population dependant on a private water supply
18
The sources of private supplies are many and var ied, and a surpris ingly
large number of householders and businesses depend on them for their
water supply for drinking, cooking, food preparat ion and showering or
bathing or washing of hands. In 2014, there were 37,717 pr ivate supplies
known about in England and 5,840 of these either served 50 or more people
(used more than 10m3 of water a day) or were used in a commercial or publ ic
act ivity. However, the majority serve just a single domest ic property (25,231)
or a small number of households on a shared basis (6,474).
Environmental Health professionals in local author it ies must r isk assess and
sample these suppl ies. In England in 2014, 69% of the suppl ies used to
provide a service to the publ ic had a completed r isk assessment, with 143
local author it ies report ing that they had r isk assessed al l such suppl ies in
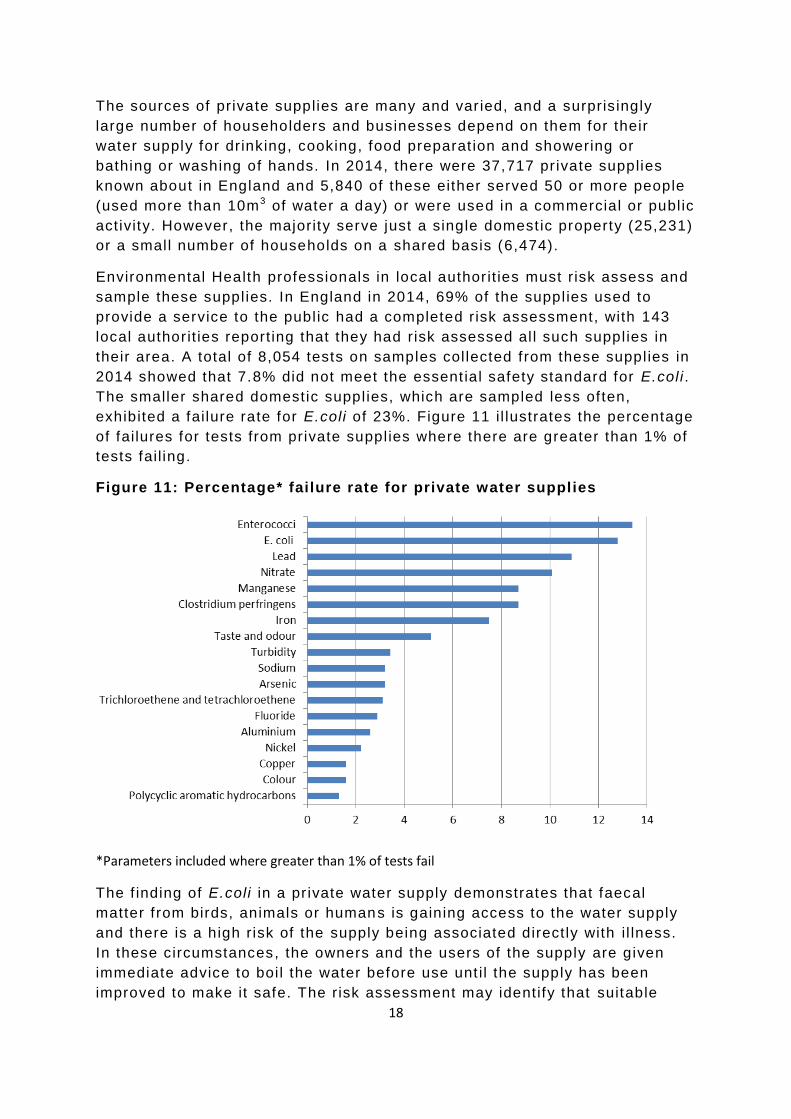
their area. A total of 8,054 tests on samples col lected f rom these suppl ies in
2014 showed that 7.8% did not meet the essent ial safety standard for E.col i .
The smaller shared domestic suppl ies, which are sampled less of ten,
exhibited a failure rate for E.coli of 23%. Figure 11 i l lustrates the percentage
of failures for tests from private suppl ies where there are greater than 1% of
tests fail ing.
Figure 11: Percentage* failure rate for private water supplies
*Parameters included where greater than 1% of tests fail
The f inding of E.coli in a pr ivate water supply demonstrates that faecal
matter f rom birds, animals or humans is gaining access to the water supply
and there is a high r isk of the supply being associated direct ly with i l lness.
In these circumstances, the owners and the users of the supply are given
immediate advice to boi l the water before use unt i l the supply has been
improved to make it safe. The r isk assessment may identify that suitable

19
treatment is in place, but it is not being correct ly operated or maintained and
the remedy is therefore straightforward. However, in many cases the water
source is not adequately protected , there is no treatment in place and the
owner and users do not understand the r isks or what they should be doing to
keep their supply safe. In these instances, the local author ity must require
the supply to be improved. Over the last f ive years, local authorit ies have
identif ied such situat ions (and required improvements to be made) on 1,454
occasions.
This evidence about the contaminat ion of many small private suppl ies is
compell ing and its open publ icat ion by the Inspectorate strengthens
considerably the case for regulatory intervention to mit igate this public
health r isk.

Drinking Water Inspectorate | Nobel House, 17 Smith Square | London | SW1P 3JR | Tel: 0300 068 6400
www.dwi.gov.uk
Drinking water quality in EnglandThe position after 25 years of regulationJuly 2015A report by the Chief Inspector of Drinking Water