Embed Size (px)
Citation preview
Drinking water quality and farming practices on dairy farms in the greater Mangaung Metro,
South Africa
By
Leana Esterhuizen
Submitted in partial fulfillment of the academic requirements for the degree of
Doctor Technologiae: Environmental Health in the Department of Life Sciences,
Central University of Technology, Free State.
Bloemfontein
December
2014
© Central University of Technology, Free State
Page | ii
PREFACE
The experimental work described in this thesis was carried out in the Department of Life Sciences
of the Faculty of Health and Environmental Sciences at the Central University of Technology,
Free State, under the supervision of Professor Annabel Fossey and the co-supervision of
Doctor Elsa Potgieter.
I hereby certify that this statement is correct, and as the candidate’s promoters we agree to the
submission of this thesis.
Professor Annabel Fossey
Promoter
Doctor Elsa Potgieter
Co-promoter
© Central University of Technology, Free State
Page | iii
DECLARATION
I, Leana Esterhuizen, declare that
(i) The research reported in this thesis, except where otherwise indicated, is my original
work.
(ii) This thesis has not been submitted for any degree or examination at any other university.
(iii) This thesis does not contain other persons’ data, pictures, graphs or other information,
unless specifically acknowledged as being sourced from other researchers.
(iv) This thesis does not contain other persons’ writing, unless specifically acknowledged as
being sourced from other researchers. Where other written sources have been quoted,
then:
(a) their words have been re-written but the general information attributed to them has
been referenced;
(b) where their exact words have been used, their writing has been placed inside
quotation marks, and referenced.
(v) Where I have reproduced a publication of which I am an author, co-author or editor, I
have indicated in detail which part of the publication was actually written by myself alone
and have fully referenced such publications.
(vi) This thesis does not contain text, graphics or tables copied from the internet, unless
specifically acknowledged, and the source being detailed in the thesis and in the reference
sections.
Signed:
© Central University of Technology, Free State
Page | iv
ACKNOWLEDGEMENTS
I wish to thank the following people and organisations for their contribution to this thesis:
• My promoter, Professor Annabel Fossey, thank you for great leadership and mentorship.
With you it is always less complicated.
• My co-promoter, Dr Elsa Potgieter, for being a friend and mentor and thank you for all those
mugs of coffee. Thank you for keeping me on the right track.
• The Department of Life Sciences at the Central University of Technology, Free Sate, for
support and use of the laboratory facilities and equipment.
• The Mangaung Metro Municipality, the environmental health practitioners for their assistance
in identifying the dairy farms and the Microbiological laboratory for their guidance and
support.
• The NRF for the Sabbatical grant that made my study leave possible and for funding the
research project through a Thutuka grant.
• My friends for their encouragement and understanding over the duration of my period of
study.
• Bev, my dear friend, I appreciate all your love and support.
• Thank you to my family. You all assisted in so many ways, thanks for all the meals, support,
editing and assisting with the girls.
• To Christine and Ezeth, I love you both my angels, thank you for trying to understand my
work and hectic schedule.
• Johnny, I am grateful for the support and motivation received from you.
© Central University of Technology, Free State
Page | v
Table of Contents
PREFACE ................................................................................................................................ ii
DECLARATION ........................................................................................................................ iii
ACKNOWLEDGEMENTS ........................................................................................................ iv
LIST OF FIGURES ................................................................................................................... ix
LIST OF TABLES ..................................................................................................................... x
LIST OF ABBREVIATIONS ...................................................................................................... xii
ABSTRACT .............................................................................................................................. xiv
Chapter 1 Introduction
1.1 Introduction ................................................................................................ 1
1.2 Aims and objectives ................................................................................... 3
1.3 Structure of thesis ..................................................................................... 4
Chapter 2 Literature Review
2.1 Introduction ................................................................................................. 6
2.2 Dairy farming in South Africa .................................................................... 7
2.3 Factorsinfluencingdairyproduction ....................................................... 9
2.3.1 Environmental hygiene .............................................................................................. 10
2.3.2 Dairy waste ................................................................................................................. 11
2.3.3 Water quality ............................................................................................................... 12
2.3.4 Herd health ................................................................................................................. 13
2.3.5 Dairy farm infrastructure and management ............................................................. 13
© Central University of Technology, Free State
Page | vi
2.4 Groundwater as resource .......................................................................... 14
2.4.1 Composition and pollution ........................................................................................ 15
2.5 Drinking water quality ................................................................................ 18
2.5.1 South African drinking water legislation and standards ......................................... 20
2.5.2 Drinking water quality parameters ............................................................................ 21
2.6 Dairy standards .......................................................................................... 23
2.6.1 Infrastructure .............................................................................................................. 25
2.6.2 Water quality ............................................................................................................... 26
2.6.3 Dairy herd health ........................................................................................................ 26
2.7 Water quality management ........................................................................ 27
2.7.1 Integrated water resource management ................................................................... 27
2.7.2 BlueandGreenDropcertification ............................................................................ 28
2.7.3 Water quality index .................................................................................................... 28
2.8 Water quality and health effects ................................................................ 30
2.8.1 Chemical effects ......................................................................................................... 30
2.8.2 Microbiological effects .............................................................................................. 32
Chapter 3 Materials and Methods
3.1 Study area ................................................................................................... 35
3.2 Study design ............................................................................................... 36
3.3 Location of sampling sites ........................................................................ 37
3.4 Methods ...................................................................................................... 40
3.4.1 On-site sample collection and measurements ......................................................... 40
3.4.2 Laboratory measurements ........................................................................................ 41
© Central University of Technology, Free State
Page | vii
Chapter 4 Groundwater Quality on Dairy Farms Sampled in 2009
4.1 Introduction ................................................................................................ 44
4.2 Article .......................................................................................................... 45
Chapter 5 Comparison of Groundwater Quality on Dairy Farms
Sampled in 2009 and 2013
5.1 Introduction ................................................................................................ 53
5.2 Methods ...................................................................................................... 53
5.3 Results ........................................................................................................ 53
5.3.1 Health and economic implications ............................................................................ 55
5.4 Discussion and conclusions ..................................................................... 58
Chapter 6 A Water Quality Index for Groundwater on Dairy Farms
6.1 Introduction ................................................................................................ 60
6.2 Methods ...................................................................................................... 61
6.3 Review of WQI ............................................................................................ 62
6.3.1 Weighted Arithmetic WQI (WA-WQI) ......................................................................... 62
6.3.2 Weighted WQI (W-WQI) .............................................................................................. 63
6.3.3 Canadian Council of Ministers of the Environment WQI (CCME-WQI) ................... 64
6.4 Critique of WQI ........................................................................................... 65
6.5 Assessment of WQI .................................................................................... 65
6.6 Application of selected WQI ...................................................................... 70
6.7 Conclusion .................................................................................................. 71
© Central University of Technology, Free State
Page | viii
Chapter 7 Farm Management Practices and Infrastructure
7.1 Introduction ................................................................................................ 72
7.2 Materials and methods ............................................................................... 73
7.2.1 Development of the data gathering tool ................................................................... 73
7.2.2 Data collection and analyses .................................................................................... 74
7.3 Results and discussion ............................................................................. 75
7.4 Conclusion .................................................................................................. 83
Chapter 8 Conclusion and Recommendations
8.1 Introduction ................................................................................................ 84
8.2 Nitrate pollution of groundwater ............................................................... 85
8.3 Microbiological pollution of groundwater ................................................ 86
8.4 Hardness of groundwater .......................................................................... 88
8.5 Water quality index .................................................................................... 89
8.6 Conclusion .................................................................................................. 89
BIBLIOGRAPHY
List of references ................................................................................................ 91
APPENDICES
Appendix A: Supplementary information to Chapter 4 ....................................................... 116
Appendix B: Supplementary information to Chapter 6 ....................................................... 138
Appendix C: Supplementary information to Chapter 7 ....................................................... 141
© Central University of Technology, Free State
Page | ix
List of Figures
Figure 2.1 Dominant geology of the Free State ..................................................................... 15
Figure 2.2 Average nitrogen levels greater than 10 mg/ l per sampling station ...................... 18
Figure 3.1 Study design ........................................................................................................ 36
Figure 3.2 Free State map indicating the general location of the 75 farms
sampled in 2009 ................................................................................................... 37
Figure 3.3 Map indicating the detailed positions of the farms with red dots ........................... 38
Figure 3.4 On-site measuring instruments:
(a) HACH 2100Q turbidity meter; (b) MARTINI MI 806 multi probe ...................... 41
Figure 4.1 Cumulative frequencies for the two major groups of bacterial contamination
(E. coli and coliform) and nitrates ......................................................................... 49
Figure 5.1 Distribution of measurements for total hardness .................................................. 56
Figure 5.2 Distribution of measurements for nitrate ............................................................... 56
Figure 5.3 Distribution of measurements for total coliforms ................................................... 57
Figure 5.4 Distribution of measurements for E. coli ............................................................... 57
Figure 6.1 Comparison of the WQI ratings of the different WQI ............................................. 69
Figure 7.1 Steps followed to develop the checklist ................................................................ 74
Figure 7.2 Effluent disposal:
(a) and (b) flooding of effluent;
(c) storing of effluent in dam; (d) storing of effluent in a pit ................................... 79
Figure 7.3 Borehole protection: (a) protected borehole head;
(b) borehole head not elevated and not protected from stagnant water ................ 80
© Central University of Technology, Free State
Page | x
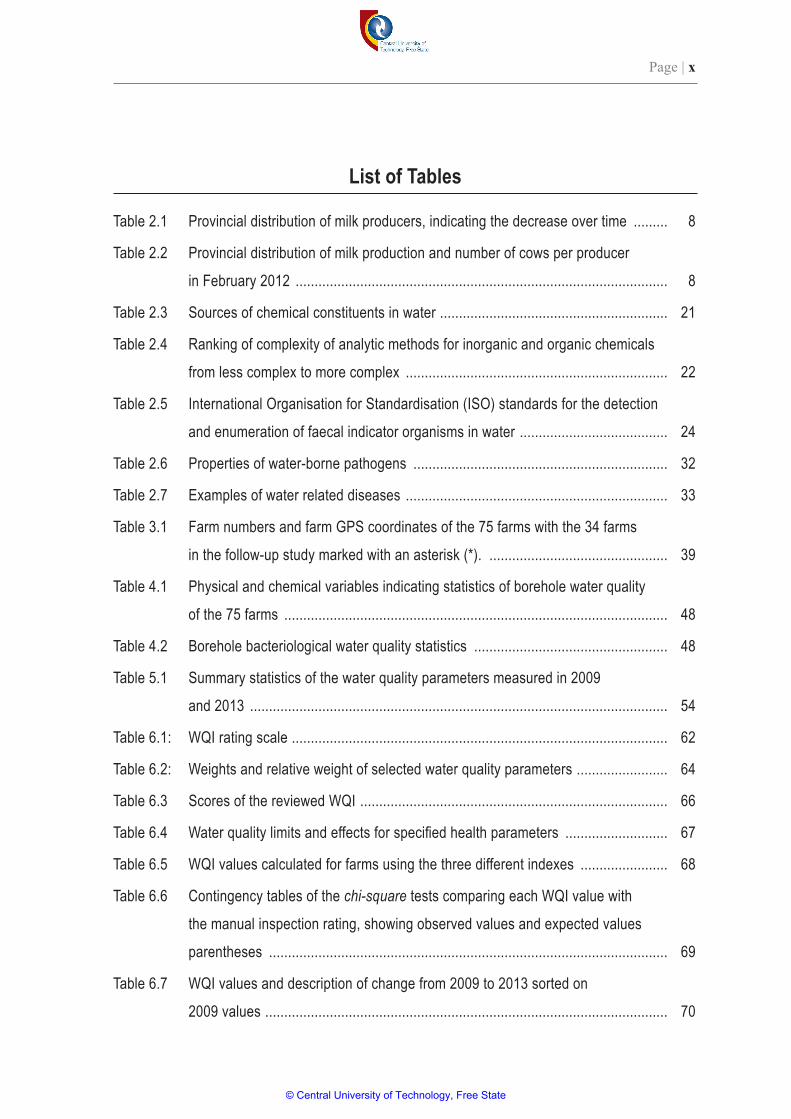
List of Tables
Table 2.1 Provincial distribution of milk producers, indicating the decrease over time ......... 8
Table 2.2 Provincial distribution of milk production and number of cows per producer
in February 2012 .................................................................................................. 8
Table 2.3 Sources of chemical constituents in water ............................................................ 21
Table 2.4 Ranking of complexity of analytic methods for inorganic and organic chemicals
from less complex to more complex ..................................................................... 22
Table 2.5 International Organisation for Standardisation (ISO) standards for the detection
and enumeration of faecal indicator organisms in water ....................................... 24
Table 2.6 Properties of water-borne pathogens ................................................................... 32
Table 2.7 Examples of water related diseases ..................................................................... 33
Table 3.1 Farm numbers and farm GPS coordinates of the 75 farms with the 34 farms
in the follow-up study marked with an asterisk (*). ............................................... 39
Table 4.1 Physical and chemical variables indicating statistics of borehole water quality
of the 75 farms ..................................................................................................... 48
Table 4.2 Borehole bacteriological water quality statistics ................................................... 48
Table 5.1 Summary statistics of the water quality parameters measured in 2009
and 2013 .............................................................................................................. 54
Table 6.1: WQI rating scale ................................................................................................... 62
Table 6.2: Weights and relative weight of selected water quality parameters ........................ 64
Table 6.3 Scores of the reviewed WQI ................................................................................. 66
Table 6.4 Water quality limits and effects for specified health parameters ........................... 67
Table 6.5 WQI values calculated for farms using the three different indexes ....................... 68
Table 6.6 Contingency tables of the chi-square tests comparing each WQI value with
the manual inspection rating, showing observed values and expected values
parentheses ......................................................................................................... 69
Table 6.7 WQI values and description of change from 2009 to 2013 sorted on
2009 values .......................................................................................................... 70
© Central University of Technology, Free State
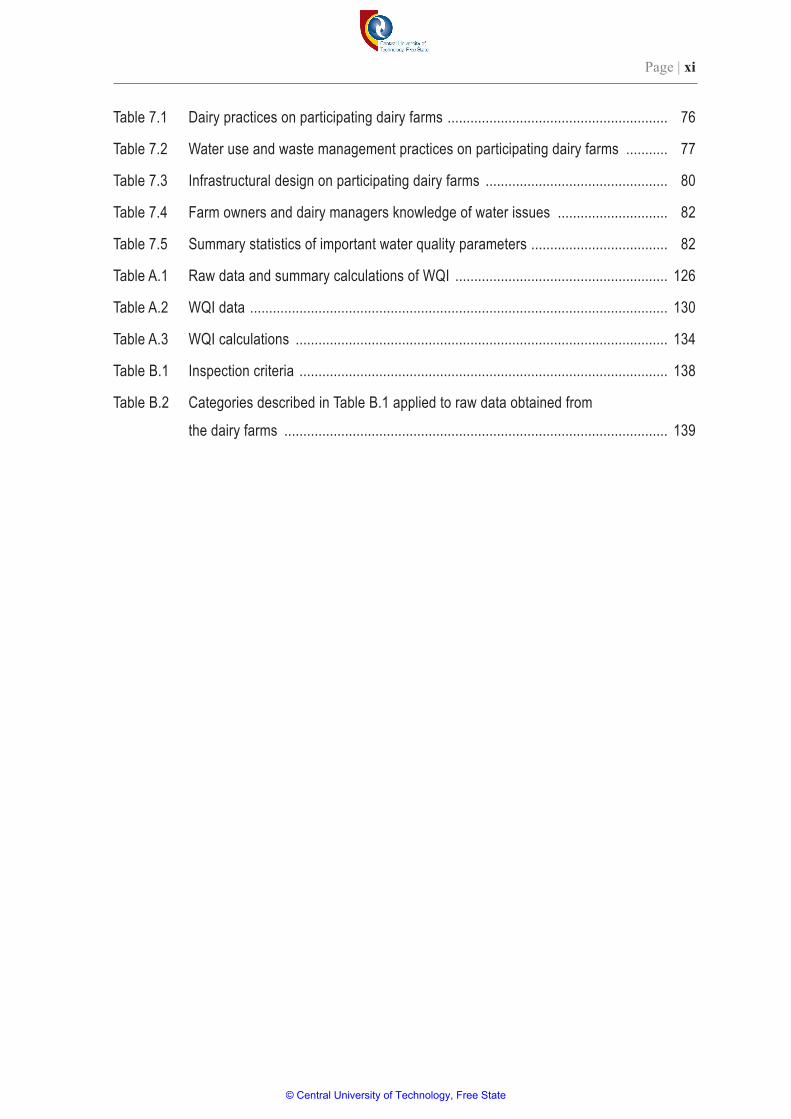
Page | xi
Table 7.1 Dairy practices on participating dairy farms .......................................................... 76
Table 7.2 Water use and waste management practices on participating dairy farms ........... 77
Table 7.3 Infrastructural design on participating dairy farms ................................................ 80
Table 7.4 Farm owners and dairy managers knowledge of water issues ............................. 82
Table 7.5 Summary statistics of important water quality parameters .................................... 82
Table A.1 Raw data and summary calculations of WQI ........................................................ 126
Table A.2 WQI data .............................................................................................................. 130
Table A.3 WQI calculations .................................................................................................. 134
Table B.1 Inspection criteria ................................................................................................. 138
Table B.2 Categories described in Table B.1 applied to raw data obtained from
the dairy farms ..................................................................................................... 139
© Central University of Technology, Free State
Page | xii
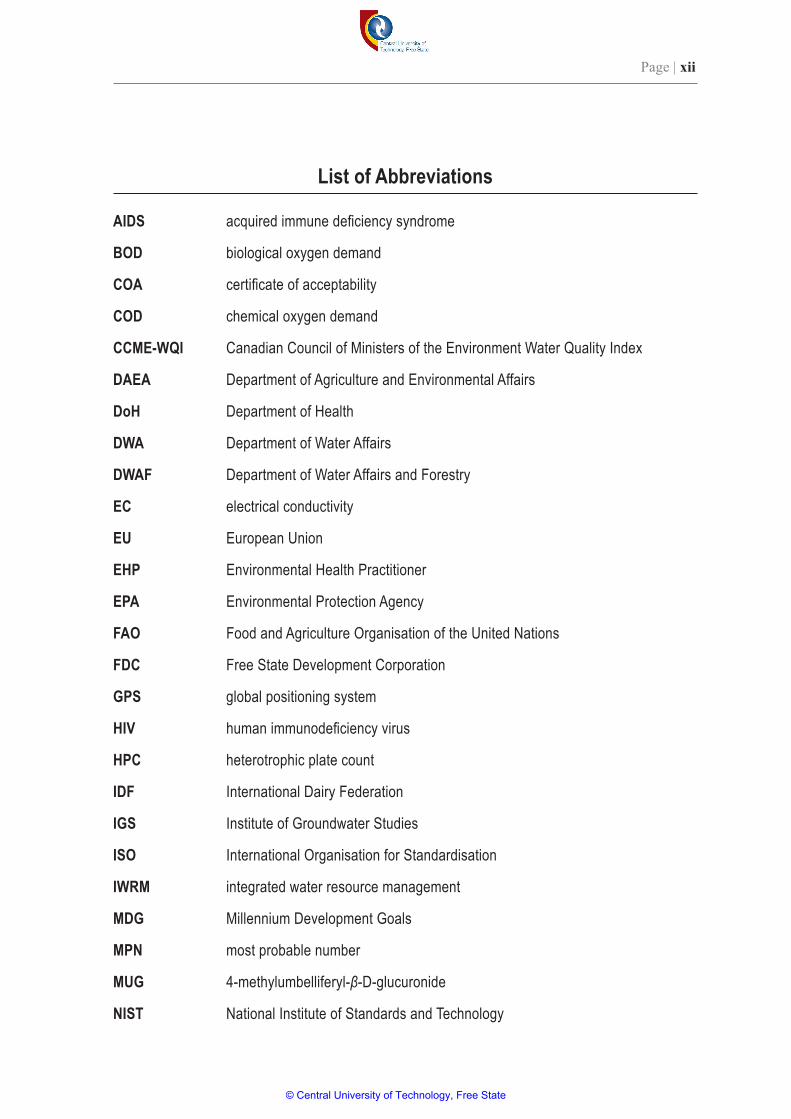
List of Abbreviations
AIDS acquired immune deficiency syndrome
BOD biological oxygen demand
COA certificate of acceptability
COD chemical oxygen demand
CCME-WQI Canadian Council of Ministers of the Environment Water Quality Index
DAEA Department of Agriculture and Environmental Affairs
DoH Department of Health
DWA Department of Water Affairs
DWAF Department of Water Affairs and Forestry
EC electrical conductivity
EU European Union
EHP Environmental Health Practitioner
EPA Environmental Protection Agency
FAO Food and Agriculture Organisation of the United Nations
FDC Free State Development Corporation
GPS global positioning system
HIV human immunodeficiency virus
HPC heterotrophic plate count
IDF International Dairy Federation
IGS Institute of Groundwater Studies
ISO International Organisation for Standardisation
IWRM integrated water resource management
MDG Millennium Development Goals
MPN most probable number
MUG 4-methylumbelliferyl-β-D-glucuronide
NIST National Institute of Standards and Technology
© Central University of Technology, Free State
Page | xiii
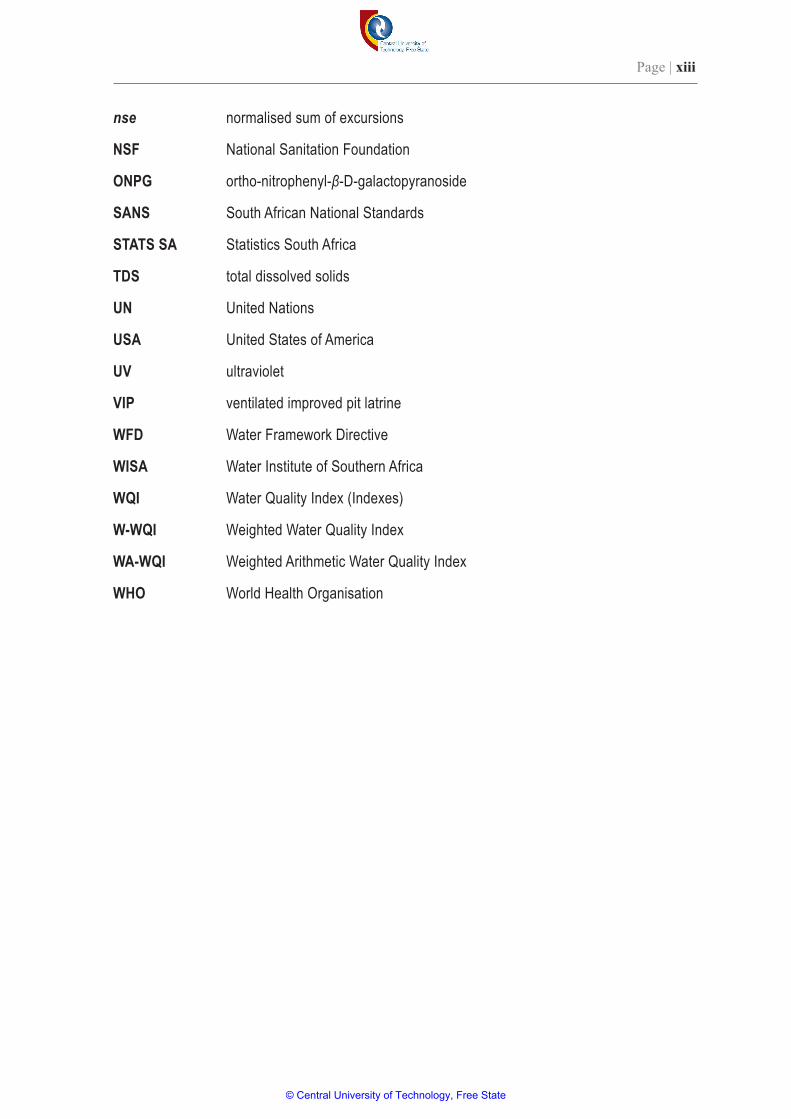
nse normalised sum of excursions
NSF National Sanitation Foundation
ONPG ortho-nitrophenyl-β-D-galactopyranoside
SANS South African National Standards
STATS SA Statistics South Africa
TDS total dissolved solids
UN United Nations
USA United States of America
UV ultraviolet
VIP ventilated improved pit latrine
WFD Water Framework Directive
WISA Water Institute of Southern Africa
WQI Water Quality Index (Indexes)
W-WQI Weighted Water Quality Index
WA-WQI Weighted Arithmetic Water Quality Index
WHO World Health Organisation
© Central University of Technology, Free State
Page | xiv
Abstract
Dairy farms produce large volumes of animal waste comprising of manure, urine and dairy wash
water. In South Africa, dairy waste is usually discharged onto pastures and land by irrigation or
flooding which has been known to pollute groundwater with faecally derived microorganisms and
nitrates. This study was undertaken to assess groundwater quality on dairy farms in the greater
Mangaung area of the Free State. Secondly, the minor aim was to investigate factors that may
influence groundwater quality on the farms. These included farming management practices, dairy
farm infrastructure and dairy farm waste disposal. Groundwater quality data was collected on
75 dairy farms in 2009. A follow-up study was undertaken in 2013, however, because many farms
had ceased production, only 34 farms were included in this round.
The groundwater quality data of the 75 farms assessed in 2009 revealed that many farms were
compliant with the South African National Standard for Drinking Water. However, 49% of the farms
exceeded the limit for nitrates, 60% for total coliforms and 29% for Escherichia coli. When the data
gathered on the 34 farms in 2013 were compared to the same farms’ data of 2009, it was found
that 45% of the farms in 2009 and 57% in 2013 demonstrated hardness levels that could pose a
risk to sensitive consumer groups, such as infants, the aged and the immune compromised. The
groundwater on many farms tested as hard or very hard, while the water on a few farms tested
extremely hard. Since water is used in all dairy cleaning operations, these levels of hard water
could add an additional cost to the running of a dairy by reducing the life span of equipment and
increasing the amount of soap used.
On 18.9% of the farms in 2009 and 5.6% in 2013, the counts of coliforms exceeded 1 000 per
100 m l groundwater, posing a serious health risk for all consumers. Groundwater with counts of 10
– 100 coliforms per 100 m l could result in clinical infections in consumers, but counts of 100 – 1 000
coliforms could cause infections, even with once-off consumption. In this study, three of the 2013
farms (8.8%) demonstrated counts of E. coli greater than 100 per 100 m l, posing a serious health
risk to the consumers. Counts in the region of 10 – 100 per 100 m l were observed in groundwater
of 17.6% of the 2009 farms and 29.4% on the 2013 farms. Therefore, consumers on these farms
are at risk of clinical infections. Furthermore, when such poor quality water is used in a dairy, the
quality of raw milk and products may be affected. Moreover, the number of farms that presented a
health risk increased from 41.2% in 2009 to 50.0% in 2013.
© Central University of Technology, Free State
Page | xv
One of the most effective ways to communicate water quality information is through the use of an
index which aggregates all water quality data into a single value. Through a review of literature,
three prominent water quality indexes were selected, evaluated and modified; the Canadian Council
of Ministers of the Environment (CCME-WQI), the Weighted (W-WQI) and the Weighted Arithmetic
(WA-WQI). Environmental health limits were assigned to eight selected water quality parameters
and Water Quality Index (WQI) values calculated using 2013 data. WQI values were categorised
into five classes ranging from excellent to unacceptable. When these results were compared with
a manual rating of the data, the versatile W-WQI provided the most accurate description of data.
The index was then applied to the 2009 and 2013 groundwater quality data of 34 farms. Results
revealed an improvement from 2009 to 2013, however, the change was not significant (p = 0.110).
Overall, the quality of groundwater on these dairy farms is poor and could pose a health risk to
consumers, farm animals and the quality of raw milk and products.
During 2013, management practices and infrastructural data were recorded on 34 dairy farms. All
farms in this study depend on untreated groundwater for domestic and dairy activities. More than
two thirds of the farms (85.3%) disposed of the dairy effluent by means of flooding or collection
in shallow soil dams, while only five farmers re-used dairy effluent as fertiliser. The results also
indicate that, although dairy farms vary in milk yield and size, they are designed and managed
to prevent obvious groundwater contamination by dairy effluent. Possible correlations between
farm management practices, infrastructure and the poor water quality revealed a weak negative
correlation between the number of cows on a farm and the coliform values in the groundwater
( R 2 = 0.0023). Also, no correlation existed between the number of cows on a farm and the E. coli
values or the number of cows and the nitrate values in the groundwater. These results suggested
that the link between groundwater pollution and farm management practices and infrastructure are
not clear and in need of further investigation.
This study supports the findings that groundwater is vulnerable to pollution. In particular, the
microbiological quality of the groundwater on the dairy farms was poor. The high levels of coliforms and
E. coli in the groundwater confirm faecal pollution that could be indicative of poor sanitary conditions.
This water contains high concentrations of microbial organisms and nitrates. Vulnerable groups on
the farms are therefore at risk of becoming ill. Furthermore, the use of poor quality groundwater in
dairy activities and other agricultural activities, such as the irrigation of crops, may further impact
produce quality and could ultimately impact the health of consumers.
© Central University of Technology, Free State
Chapter 1: Introduction Page | 1
Chapter 1 Introduction
1.1 Introduction
Water is an important resource for all living organisms. Currently, water resources are under
pressure (Bogardi et al., 2012). Climate change and the pollution of the environment are two major
factors affecting water resources and the quality of the water (Sivakumar, 2011). Other activities
impacting on water availability and quality include mining, industrial, recreational, domestic and
agricultural practices. In the agricultural sector water is central to many activities; from crop and
dairy production to animal husbandry, and is also used in domestic activities.
Water usage on dairy farms is twofold. Besides what is used by the cattle, water is used throughout
the milking process. The milking process involves the extraction of milk from cows and the storing
of it in bulk refrigerated tanks. Milk is then collected by milk buyers or transferred into smaller
containers for further processing for the market. After milking, dairy parlours and all its equipment
are thoroughly washed.
Dairy farm effluent, which refers to manure and urine deposited by cows during milking, is diluted
during washing down of a milking dairy floor (Williamson et al., 1998; Hooda et al., 2000). Animal
waste in dairy effluent is a major source of pollution through nutrient enrichment of streams and
groundwater, which may in turn, have a significant impact on the environment (Wilcock et al.,
1999; Ali et al., 2006; Atalay et al., 2008; Kay et al., 2008; Van der Schans et al., 2009). In South
Africa, dairy farm effluent is discharged onto pastures and land by irrigation or flooding (Strydom
et al., 1993) and has been proven to pollute groundwater (Tredoux et al., 2000). The direct impact
on groundwater quality from dairy waste and manure management operations is not well-known
nor studied. Due to the lack of data, there is not much guidance on the prevention of pollutant
leaching into groundwater and groundwater monitoring on dairy farms (Harter et al., 2002). As a
result, minimal guidance is available on how to effectively prevent groundwater leaching and how to
monitor groundwater quality within dairy farming operations.
Dairy effluent contains a high bacteriological load (Fenton et al., 2011). Dairy effluent is released
into the surrounding environment, either as a source of fertiliser or as a waste product. Faecally
derived pathogens in the enriched water, such as Escherichia coli, reduce the water quality, which
© Central University of Technology, Free State
Chapter 1: Introduction Page | 2
when used in a dairy parlour could reduce milk quality (Oliver et al., 2009b). Also, when bacterial
enriched water is consumed, it could impact human health.
Animal manures are known to contain pathogenic bacteria, viruses and parasites (Pell, 1997)
and pose a significant threat to human health through the consumption of water polluted by these
organisms (Skerrett and Holland, 2000; Oliver et al., 2009b). An Environmental Protection Agency
(EPA) report highlighted that the application of dairy waste onto the land is the main source of
microbial pathogens in groundwater (Fenton et al., 2011). Organisms found in polluted water
typically lead to gastrointestinal symptoms, such as nausea, diarrhoea and stomach cramps. The
most common organisms include non-typhoidal Salmonella, Giardia, Shigella, Campylobacter,
Microsporidium and Cryptosporidium (Lund and O’Brien, 2011).
The harmful effects of agricultural activities on groundwater (Gillingham and Thorrold, 2000; Dahiya
et al., 2007; Monaghan et al., 2009) are becoming more and more of a concern worldwide (Santhi
et al., 2006). Currently, manure handling and disposal practices in dairy enterprises are undergoing
critical revision in order to reduce their impact on groundwater quality (Goss and Richards, 2008).
The use of best management practices has been introduced in New Zealand and Australia (ARMC,
1999), while in the USA, the EPA developed the Agricultural Management Practices for Water
Quality Protection (EPA, 2003). In Europe, the Water Framework Directive was developed with
a specific section addressing water pollution from agricultural sources and how to protect water
resources from agricultural pollution (WFD, 2000).
The water quality used in a dairy operation in South Africa must meet a set of minimum standards
in order to comply with the conditions set out in Regulation R961 under the Foodstuffs, Cosmetics
and Disinfectants Act, No. 54 of 1972. Clean, safe water is a requirement to obtain the certificate
of acceptability (COA) under the Foodstuffs, Cosmetics and Disinfectants Act. The quality of water
used in a food premises and dairy operation must meet the required standard, as prescribed in
the South African National Standards 241 for Drinking Water Quality (SANS 241, 2011). Without
a COA, farmers are not permitted to sell milk to bulk buyers nor to operate a dairy other than for
private use.
Water used in urban settings is extensively monitored by public health officials to assure compliance
with the SANS 241 requirements (SANS 241, 2011). The development of the Blue Drop scoring
system in 2008 is to evaluate the water quality management of municipalities (DWAF, 2009a; DWAF,
2009b). The Blue Drop system is an incentive based programme, aiming to improve the water
© Central University of Technology, Free State
Chapter 1: Introduction Page | 3
quality management throughout South Africa (DWAF, 2009b). This system is based on compliance
to all water related legislation and regulations (National Water Act, No. 36 of 1998; Water Services
Act, No. 108 of 1997 and SANS 241, 2011) and enforces a sampling plan with a specified sampling
strategy. All municipalities and towns are scored biannually according to the criteria of the Blue
Drop system by trained assessors representing Department of Water Affairs and Sanitation.
In rural and farming communities of South Africa, groundwater is the main source of potable water.
These communities often have no other water source available (Van Tonder, 2009). In the Free
State, the majority of the dairy farms is not within the municipal water supply network and thus do
not have access to treated water. Instead, these farms utilise groundwater as their only drinking
water source, as well as for all dairy related activities. Currently, rural water supply is not included
in the Blue Drop municipal assessment and is thus not routinely monitored. Consequently, rural and
farming communities are consuming groundwater without knowledge of its quality, possible health
impacts and associated risk to milk products produced on dairy farms.
Long term impacts from dairy farming on groundwater quality are a concern because of the impact
it has on drinking water quality (Van der Schans et al., 2009). This study was conducted because
dairy farming was identified as a significant source of domestic groundwater contamination.
1.2 Aims and objectives
The main aim of this study was to assess groundwater quality on dairy farms in the greater
Mangaung area of the Free State. The secondary aim was to investigate factors that may influence
groundwater quality on dairy farms. These factors included dairy farming management practices,
dairy farm infrastructure and dairy farm waste disposal.
More specifically, the project was broken down into the following objectives:
• to select dairy farms in the greater Mangaung area;
• to determine borehole drinking water quality on the selected dairy farms;
• to determine dairy farm management practices;
• to determine dairy farm infrastructure;
• to develop and calculate water quality index (WQI) for the dairy farm groundwater sources;
and
• to derive appropriate recommendations to mitigate and control groundwater pollution.
© Central University of Technology, Free State
Chapter 1: Introduction Page | 4
1.3 Structure of thesis
This thesis comprises of eight chapters.
Chapter 1: IntroductionIn chapter 1 the research project, together with the rationale, is introduced. The aims and objectives
are also presented in this chapter.
Chapter 2: Literature ReviewIn chapter 2 a review of the literature pertaining to groundwater quality, with specific reference to
dairy farming, is presented.
Chapter 3: Materials and MethodsIn this chapter the study area is defined and the various methods are briefly described.
Chapter 4: Groundwater Quality on Dairy Farms Sampled in 2009In 2009, the groundwater of 75 dairy farms in the Free State was sampled. Groundwater quality
was assessed in terms of chemical, physical and microbiological parameters. The results of this
study are presented in Chapter 4 as they were published in the journal Water SA in 2012:
Esterhuizen L, Fossey A and Lues JFR. 2012. Dairy farm borehole water quality in the
greater Mangaung region of the Free State Province, South Africa. Water SA Vol. 38:
803-806.
Chapter 5: Comparison of Groundwater Quality on Dairy Farms Sampled in 2009 and 2013In 2013, the groundwater of the original 75 dairy farms was resampled. However, it was found that
only 34 of them were still in business. Groundwater quality of these 34 dairy farms was reassessed,
similar to the 2009 sampling season. During this sampling round, supplementary information of
farming management practices and infrastructure was also gathered. In chapter 5 a comparison
between the two sampling seasons is presented.
Chapter 6: A Water Quality Index for Groundwater on Dairy FarmsWater quality data comprises measurements of many parameters, making it difficult to interpret.
The development of a single value that incorporates all relevant parameters into an index facilitates
the understanding of the water quality. This chapter presents a water quality index that is suitable for
groundwater measurements. The index is demonstrated using the water quality data generated in this
study.
© Central University of Technology, Free State
Chapter 1: Introduction Page | 5
Chapter 7: Farm Management Practices and InfrastructureIn this chapter, the farm management practices and infrastructure data gathered for 34 dairy farms in
2013 are used in an attempt to explain the groundwater quality results from the dairy farms in this
study. This chapter sets out to link the groundwater quality to the farm management practices and
infrastructure.
Chapter 8: Conclusion and RecommendationsIn chapter 8 the findings of this study are highlighted and discussed. Potential future studies are
also presented.
© Central University of Technology, Free State
Chapter 2: Literature Review Page | 6
Chapter 2 Literature Review
2.1 Introduction
South Africa is a moderately dry country and is listed as one of the 20 most water-scarce countries
in the world (Levy, 2011). Mean annual precipitation is in the order of 450 mm (Claassen, 2010). In
South Africa, freshwater sources, surface water as well as groundwater, are under pressure because
of a growing population and expanding economy (Oberholster and Ashton, 2008). It is estimated
that by 2025, South Africa’s water demand will exceed its supply (Levy, 2011). Groundwater in
South Africa has not been fully developed, where only 6% of the estimated available groundwater
potential is currently being utilised. It is therefore reasonable to assume that in the near future,
groundwater will be used to supplement current water supplies in South Africa (Levy, 2011).
Groundwater is central to domestic, industrial, agricultural and mining water supply, and currently
contributes about 13% of the total water use in South Africa (Strydom, 2010). In many parts of
South Africa, groundwater is the sole water supply with, for example, as many as 68% of the towns
in the Free State are reliant on groundwater (Kotze et al., 2013). This is mostly attributable to
financial constraints experienced by rural local water service authorities to provide water from
other water sources (Rajkumar and Xu, 2011). The mean annual rural domestic and agricultural
groundwater use in South Africa in 2004 has been estimated as being 1 389 million cubic litres per
year (Strydom, 2010).
It is widely recognised that modern agriculture affects the wider environment, causing concern for
various reasons (Delfs et al., 2013). Increasing use of fertilisers, size of farms, intense production
practices, manure handling and disposal practices on animal farming operations, are currently
undergoing critical revision to reduce their impact on water quality (Harter et al., 2002). Intensive
agriculture is known to emit significant amounts of nutrients, particularly nitrogen and phosphorus,
faecal bacteria and sediment (Hooda et al., 2000; Monaghan et al., 2007).
Contaminated groundwater poses a risk to consumers (Böhlke, 2002). Although groundwater used
domestically is increasing worldwide, typically it is not treated to ensure the quality (Graham and
Polizzotto, 2013). Groundwater sources in the agricultural set-up are known to contain faecally
derived bacteria that cause disease and infections in sensitive groups, such as infants, the elderly
© Central University of Technology, Free State
Chapter 2: Literature Review Page | 7
and the immune compromised (DWAF et al., 1998; Dzwairo et al., 2006). Therefore, polluted water
is not only a health concern, but may also impact on economic development and social prosperity
(Vasanthavigar et al., 2010; Obilonu et al., 2013).
Groundwater is gaining importance in rural communities in the drier regions of South Africa, mostly
because of the growth in agricultural activities, industrial development and mining, which significantly
influence the quality of water (Adams et al., 2001). In the absence of appropriate sanitation
measures, untreated water used as drinking water, can act as a passive way of transporting
nutrients and harmful microorganisms into the body thereby posing a serious environmental and
health risk (Ayodele, 2012).
2.2 Dairy farming in South Africa
Dairy farming is a major role-player in the agricultural sector in South Africa, contributing to
economic development and sustainability of the country (DAFF, 2012). Farm configurations are
diverse, composed of small enterprises with a few milk producing cows to large industrialised
farms consisting of more than a thousand cows. When comparing the gross value of agricultural
production, dairy farming is the fourth largest in South Africa, after poultry, cattle and cattle products,
and maize production (Mkhabela and Mndeme, 2010). The South African dairy industry comprised
of more than 4 000 milk producers in 2010, employing 60 000 farm workers and providing a further
40 000 indirect jobs within the dairy value chain (Mkhabela and Mndeme, 2010).
Dairy farming in South Africa has shown a steady decrease in the number of active smaller dairy
farms since 2006, from 3 899 active producers to 2 083 in 2013 (Milk SA, 2013). This trend towards
smaller dairy cow herds has also been identified in other parts of the world, for example in Ireland
(Ruane et al., 2011). The high price of animal feed and the relatively low price for fresh milk have
been put forward as the major reasons for this trend. In the period from 2006 to 2013, the reduction
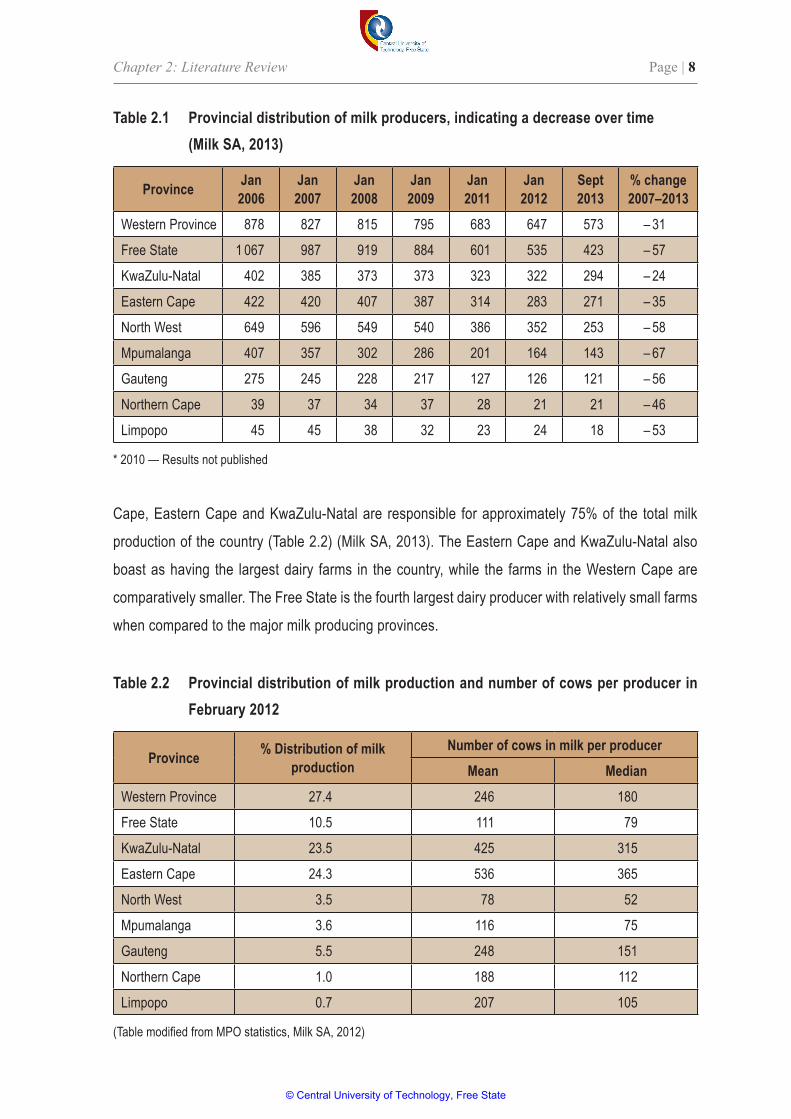
in the number of dairy farms in South Africa was 41.8% (Milk SA, 2013). Table 2.1 indicates the
provincial distribution of dairy farms for the period from 2006 to 2013 showing the reduction of dairy
farms in all provinces. In 2006, the Free State had the largest number of milk producers, followed by
the Western Cape. In 2011, however, the Western Cape had overtaken the Free State to become
the province with the largest number of producers. The province of Mpumalanga demonstrated the
highest drop in number of active dairy farms, followed by North West and Free State (Milk SA, 2013).
All provinces in South Africa produce milk. Approximately 200 million litres of milk are produced per
month, translating into 2 757 billion litres of milk per year (Milk SA, 2013). The provinces of Western
© Central University of Technology, Free State
Chapter 2: Literature Review Page | 8
Cape, Eastern Cape and KwaZulu-Natal are responsible for approximately 75% of the total milk
production of the country (Table 2.2) (Milk SA, 2013). The Eastern Cape and KwaZulu-Natal also
boast as having the largest dairy farms in the country, while the farms in the Western Cape are
comparatively smaller. The Free State is the fourth largest dairy producer with relatively small farms
when compared to the major milk producing provinces.
Table 2.1 Provincial distribution of milk producers, indicating a decrease over time (Milk SA, 2013)
Province Jan 2006
Jan 2007
Jan 2008
Jan 2009
Jan 2011
Jan 2012
Sept 2013
% change 2007–2013
Western Province 878 827 815 795 683 647 573 – 31
Free State 1 067 987 919 884 601 535 423 – 57
KwaZulu-Natal 402 385 373 373 323 322 294 – 24
Eastern Cape 422 420 407 387 314 283 271 – 35
North West 649 596 549 540 386 352 253 – 58
Mpumalanga 407 357 302 286 201 164 143 – 67
Gauteng 275 245 228 217 127 126 121 – 56
Northern Cape 39 37 34 37 28 21 21 – 46
Limpopo 45 45 38 32 23 24 18 – 53
* 2010 — Results not published
Table 2.2 Provincial distribution of milk production and number of cows per producer in February 2012
Province % Distribution of milk production
Number of cows in milk per producerMean Median
Western Province 27.4 246 180
Free State 10.5 111 79
KwaZulu-Natal 23.5 425 315
Eastern Cape 24.3 536 365
North West 3.5 78 52
Mpumalanga 3.6 116 75
Gauteng 5.5 248 151
Northern Cape 1.0 188 112
Limpopo 0.7 207 105
(Table modified from MPO statistics, Milk SA, 2012)
© Central University of Technology, Free State
Chapter 2: Literature Review Page | 9
Dairy farmers use a number of different dairy breeds. In South Africa, the major dairy breeds are
Holstein-Friesland, Jersey, Guernsey and Ayrshire, of which Holstein-Friesland is the most popular,
followed by Jersey (Gertenbach, 2005). Holstein-Friesland produces more milk per cow but Jerseys
produce milk higher in protein and butterfat (Esterhuizen, 2013 personal communication).
The Holstein-Friesland breed are large animals and could be considered as dual purpose as the
sale of cull cows can contribute to the income of the dairy enterprise (Gertenbach, 2005). The
distinguishing aspects of this breed are the high yields of milk and good temperament facilitating
ease of milking. Jerseys are the smallest breed, characterised by its leanness and very good udder
and are known for their suitable temperament for dairying. Jersey milk is rich, high in butterfat,
which influences the milk price of the producer as high butterfat content receives an incentive
(KZN DAEA, 2013). Ayrshires are bigger than Jerseys but smaller than Holstein-Friesland, and
also produce milk with higher butterfat than Holstein-Friesland breed (Gertenbach, 2005). Aspects
to consider in selection of dairy breeds include heat resistance, sensitivity to stockmanship and
their foraging ability. Jerseys are more resistant to heat than Holstein-Friesland. Ayrshire are good
foragers but more sensitive to poor stockmanship than the other two breeds (KZN DAEA, 2013).
The Free State province has the second most dairy farms in South Africa. However, the dairy
operations are relatively small, with the mean number of milk producing cows in the order of 100 per
producer (Milk SA, 2013). Over the period 2006 to 2013, the Free State demonstrated a reduction
of more than 50% in dairy production, declining from 1 067 in 2006 to 423 dairy farms in 2013 (Milk
SA, 2013). The percentage of lactating cows in the Free State dropped from 18% to approximately
10% per farm of the total number of lactating cows in the country (Milk SA, 2013).
Milk production in the Free State is based on self-produced forage and grain, fed with concentrates
in a mixed ration diet (Ndambi and Hemme, 2009). Few farms use pasteurisation and other
processes to treat the milk on the farm. The majority of the Free State farms sell milk to bulk
buyers, who process and distribute the products to retailers. Few dairy farms are located within
the municipal boundaries and serviced with treated municipal water, therefore, most farms utilise
mainly groundwater for all dairy operations, as well as for domestic use.
2.3 Factorsinfluencingdairyproduction
Food safety is a major challenge in the African region. Factors contributing to this challenge
include unsafe water, poor environmental hygiene, inadequate food-borne disease surveillance and
inability of small and medium scale producers to provide safe food (Belli et al., 2013). Milk and
© Central University of Technology, Free State
Chapter 2: Literature Review Page | 10
dairy products are considered as a high-risk category for food safety. Particular risk to food safety
on dairy farms include microbial contamination, poor control of herd health, inadequately trained
farmers and farm workers, and weaknesses in the processing chain (Belli et al., 2013).
2.3.1 Environmental hygiene
Poor hygienic practices in dairy productions can result in unsafe milk products. Through the
application of microbiological hygiene practices consumers are protected against pathogenic
agents. Milk has on many occasions been identified as a source of food-borne disease, even when
pasteurised milk has been used (Adesiyun et al., 1995; Altekruse et al., 1998; De Buyser et al.,
2001; Heuvelink et al., 2009). Four major areas are responsible for contamination of milk and dairy
products on dairy farms:
• udder hygiene;
• hygiene of milking environment;
• hygiene of the equipment; and
• herd health.
Milk is a nutritious medium for many microorganisms. In the absence of mastitis, milk is secreted free
of microorganisms. Milk quality is subjective to the microbial loading of the milk. Milk is sterile when
aseptically drawn but is contaminated after secretion and during the milk production and processing
operations (Gleeson et al., 2013). Milk is subjected to contamination from microorganisms moving
up the teat canal, referred to as udder commensals. These commensals are present in small
numbers and are mostly lactic acid bacteria (Frank and Hassan, 2003). Udders can also harbour
pathogenic microorganisms (e.g. streptococci, staphylococci, enteric bacteria), especially in the
case of clinical or subclinical mastitis (Belli et al., 2013). Milk can further be contaminated from the
udder skin and hide, emphasising the need for udder hygiene.
Microbial contamination of surface areas, milking equipment and bulk tanks in dairies is mostly
harmful and consequently affects milk and products (Salo et al., 2005; Nada et al., 2012). Microbial
contaminants commonly found on contact surfaces include enterobacteria, lactic acid bacteria,
micrococci, streptococci, pseudomonas, bacilli and fungi (Salo et al., 2006). Biofilm development
might occur in the dairy when hygiene procedures are inadequate (Austin and Bergeron, 1995).
Biofilms develop particularly in cooling systems, milk transfer lines, bulk tanks and other equipment,
on floors and in drains (Salo et al., 2005). Bulk tank contamination occurs through contamination
from the external surface of the udder and teats, milking equipment surfaces and from mastitis
organisms within the udder (Jayarao et al., 2004; Elmoslemany et al., 2010). Milk-borne pathogens
© Central University of Technology, Free State
Chapter 2: Literature Review Page | 11
occurring in bulk tanks include Campylobacter jejuni, Shiga toxin producing E. coli, Listeria
monocytogenes, Salmonella spp. and Yersinia enterocolitica (Jayarao et al., 2006). Microorganism
counts in bulk tank milk provide information on the hygienic conditions of the various steps in milk
production (Jayarao et al., 2004).
2.3.2 Dairy waste
The large volumes of solid waste and effluent generated by dairy farms present a serious
environmental and human problem. Dairy waste pollutes surface water and groundwater and
causes soil degradation (Sims et al., 2005; Barba-Gutiérrez et al., 2009; Bouma, 2011). The volume
of waste and effluent generated on a farm depends on factors, such as the frequency of milking and
the herd size (Healy et al., 2007). Dairy effluent comprises a diluted mixture of cattle faeces and
urine, milk spillages, detergent and disinfectant residues, as well as chemicals that may have been
dosed to the herd (Williamson et al., 1998; Hooda et al., 2000). Effluent is further characterised by:
• its high biological oxygen demand and chemical oxygen demand;
• high levels of dissolved or suspended solids, including fats, oils and grease; and
• nutrients, such as ammonia or minerals, phosphates and pathogens (Sarkar et al., 2006;
Rodríguez et al., 2012).
The physical, chemical and biological characteristics of dairy effluent are highly variable between
farms because of contrasting management of effluent, feed pads, wash down waters, chemicals,
age and size of dairy herd breed, and stock management (Houlbrooke, 2008).
The land application of animal manure is cited as a major source of pathogenic microorganisms
in surface water and groundwater systems (Jamieson et al., 2002). The application of dairy waste
on land may result in pollution of water sources and impact soil quality (Ruane et al., 2011). Soil
quality is defined as the capacity of a soil to function within an ecosystem, sustaining biological
productivity, maintaining environmental quality and promoting plant and animal health (Zalidis et al.,
2002). Excessive deposition of dairy waste may cause the alteration of soil properties and could
result in soil malfunction and eventually to soil degradation (Zalidis et al., 2002).
To protect the environment and increase sustainability, all waste products on a dairy farm must
be handled in a proper manner. The principles of waste management should be applied, namely
reduce, re-use, recycle and dispose of waste products in an environmental friendly manner. All
animal and human waste generated on the farm must be stored, managed and treated appropriately
to reduce the risk of environmental pollution, such as pasture, feed and water contamination (SAI,
2009).
© Central University of Technology, Free State
Chapter 2: Literature Review Page | 12
2.3.3 Water quality
Dairy effluent disposal practices impact surface water and groundwater quality (Harter et al., 2002).
Dairy waste run-off pollutes streams and other surface water sources with sediment, nutrients,
such as phosphorus and nitrogen and faecally derived microorganisms (Pell, 1997). Dairy waste
ponds are point sources of groundwater pollution, contaminating groundwater with chemicals and
microorganisms (Baram et al., 2014). Particularly in South Africa, groundwater is at risk of being
contaminated since land and pasture application of dairy waste is the common disposal method
employed by most dairy farmers (Strydom et al., 1993). The land application of animal manure
is cited as a major source of pathogenic microorganisms in surface and groundwater systems
(Jamieson et al., 2002). Dairy waste can create a number of pollution problems, including the loss of
phosphates and nitrates in run-off, as well as the subsurface leaching of nitrates and faecal material
into soil and groundwater (Ruane et al., 2011).
Raw milk is consumed on most dairy farms in South Africa and is also used for the production of
homemade dairy produce. Washing with high quality water is essential to reduce the microbial
contamination of raw milk (Rodríguez et al., 2012). When contaminated water is used for cleaning
purposes in the dairy, the quality of raw milk may become compromised (Oliver et al., 2005; DSA,
2013). The presence of E. coli in washing water has been identified as a risk factor associated with
poor quality raw milk (Perkins et al., 2009). High bacterial content of raw milk negatively impacts
raw products, as well as the products’ shelf-life (Millogo et al., 2010; Molineri et al., 2012). Thus,
raw milk with a high bacterial count increases the probability of contamination of raw dairy products,
which may pose a health risk to consumers, as well as impact on the pasteurisation process.
The domestic use of polluted water on dairy farms also poses a health risk to consumers and farm
animals. High concentrations of E. coli and faecal coliforms in drinking water affect human and
animal health and can cause gastrointestinal diseases (Pell, 1997). Animal health and weight gain
may be impaired by poor water quality through diseases transferred by water.
Groundwater used on many South African farms exhibits particularly high levels of hardness
(DWAF et al., 1998). Hard water generally poses no health risk for consumers, however, water that
is very hard or extremely hard could result in chronic health effects in sensitive groups, such as
the aged and immune compromised (DWAF et al., 1998). Furthermore, hard water causes scale
deposition, particularly in heating appliances on the farm. The use of hard water in dairies could
have a substantial economic impact because of an increased use of soap, electricity and appliance
maintenance (Rubenowitz-Lundin and Hiscock, 2005).
© Central University of Technology, Free State
Chapter 2: Literature Review Page | 13
2.3.4 Herd health
Nutritional management is the most important determinant of herd productivity (Roche, 2006). The
relationship between nutrition and productivity begins at birth. The feeding system must deliver the
necessary nutrients to each cow at the correct stage of lactation to maintain optimal productivity.
Cows need a variety of macro- and micro-nutrients to maintain healthy growth. If any nutrients are
lacking in the feed, there will be adverse consequences if essential nutrients cannot be provided by
other means (EFSA, 2009).
Maintaining a healthy herd is essential to produce high quality, safe milk and to ensure optimal
production and profitability. Unhealthy dairy cows produce milk that is lower in quality and less
wholesome. It is therefore vitally important for dairy farmers to maintain healthy herds, which
means reducing the prevalence of endemic diseases such as mastitis, Johne’s disease, bovine
viral diarrhoea and bovine tuberculosis (NFU, 2010). Mastitis is considered a disease that has
the greatest financial impact on a dairy enterprise (Spanua et al., 2011). Mastitis is defined as
inflammation of the mammary gland. It presents either as subclinical or clinical mastitis. Mastitis
results in an increase in the number of somatic cells in milk, which is used as an indicator of
udder health in the dairy herd. The symptoms of clinical mastitis are clearly visible. The causative
microorganisms of clinical mastitis are Streptococcus bacteria, including E. coli, Klebsiella spp.
and Pseudomonas spp., while microorganisms associated with subclinical mastitis include Staph.
aureus and Streptococcus agalactiae (Borneman and Ingham, 2014).
2.3.5 Dairy farm infrastructure and management
There is a wide range of infrastructural designs commonly used on dairy farms. Some of the factors
of importance determining the most suitable design include:
• herd health management;
• milk processing;
• waste collection and disposal;
• water quality; and
• hygiene systems (Baumgart-Getz et al., 2012).
Important physical factors to consider are:
• water sources and drainage;
• slope and topographic features of the area; and
• local meteorological conditions, such as wind patterns and rainfall data (Rogers, 2008).
© Central University of Technology, Free State
Chapter 2: Literature Review Page | 14
To prevent groundwater pollution, it is recommended that a dairy should not be constructed in areas
with a shallow water-table or in an area where there is a connection between the surface water and
groundwater sources. Any design tends to be a compromise between many factors, as no single
solution can be optimal for all farms (Andrews and Davison, 2002).
Milk produced on dairy farms can easily become contaminated from food spoilage bacteria due to
unhygienic conditions during the handling, storage, cooling and transport of milk. Contamination of
milk with bacteria can come from different sources, such as air, milking equipment storage, feeding,
soil, faeces and animal health (Bytyqi et al., 2013). Therefore, care should be taken to prevent the
contamination of raw milk. The structural design of a dairy should thus ensure the hygienic and safe
production of milk. The structural design of the milking parlour should provide for smoothly finished,
non-absorbing and corrosion-resistant material and must be free of any open seams and cracks and
should facilitate easy and effective cleaning (DSA, 2013). All equipment used in the dairy should be
adequately resistant to cleaning and disinfecting agents.
The quality of the animal housing plays an important role in animal health and performance. Attention
should be paid to the space allowances in lying areas, access routes, feeding and watering areas
and the overall ventilation (Bord Bia, 2013). Poor ventilation results in the build-up of toxic gases,
which may lead to serious health problems.
2.4 Groundwater as resource
Groundwater is the largest water supply source for domestic water use in the South African
Development Community (SADC) (Braune and Xu, 2008). Groundwater is a water resource,
particularly in rural areas of South Africa, the mining industry, and is also used to supplement
domestic water supply in urban areas. Groundwater contributes 13% of the total water consumption
in South Africa, with more than 300 towns and approximately 65% of the population dependent
upon groundwater for their water supply (Strydom, 2010). Groundwater, as a water source, has not
been well exploited because of a lack of reliable hydro-geological information, as well as negative
community perceptions and beliefs based on poor understanding of this resource (Colvin et al.,
2008; Knüppe, 2011; Du Toit et al., 2012).
Groundwater is part of the hydrological cycle. During rainfall, some of the water is absorbed by the
soil, which infiltrates deeply and accumulates in underground reservoirs known as aquifers (DWA,
2010). Between the soil surface and an aquifer is an unsaturated zone containing air and water. The
upper level of the unsaturated zone is called the water-table. Aquifers vary in diameter, from a few
© Central University of Technology, Free State
Chapter 2: Literature Review Page | 15
centimetres to hundreds of metres, below the soil surface and are determined by geological and
geo-hydrological factors. Groundwater occurs in fractures in the water-table (fractured aquifers)
as well as in aquifers where interconnected openings are filled with water (DWA, 2010). Hard rock
aquifers found inland contain groundwater in cavities that occur in the rock after the formation of the
rock and are known as secondary aquifers (DWA, 2010).
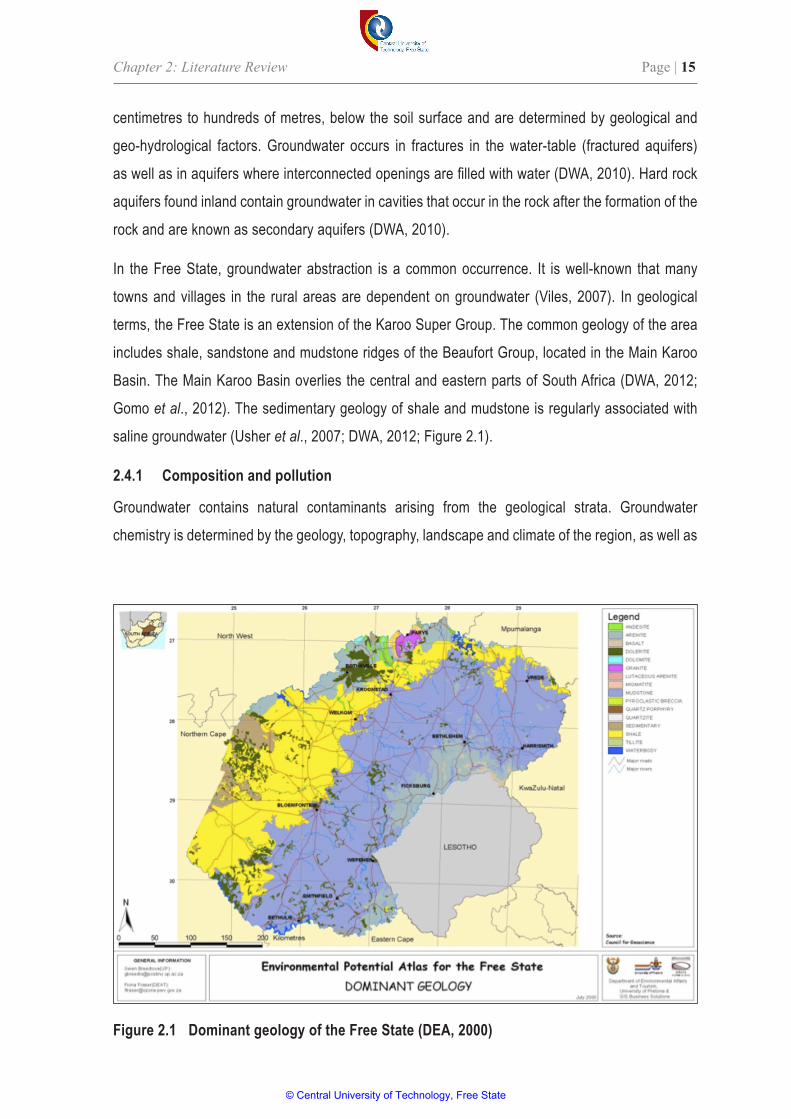
In the Free State, groundwater abstraction is a common occurrence. It is well-known that many
towns and villages in the rural areas are dependent on groundwater (Viles, 2007). In geological
terms, the Free State is an extension of the Karoo Super Group. The common geology of the area
includes shale, sandstone and mudstone ridges of the Beaufort Group, located in the Main Karoo
Basin. The Main Karoo Basin overlies the central and eastern parts of South Africa (DWA, 2012;
Gomo et al., 2012). The sedimentary geology of shale and mudstone is regularly associated with
saline groundwater (Usher et al., 2007; DWA, 2012; Figure 2.1).
2.4.1 Composition and pollution
Groundwater contains natural contaminants arising from the geological strata. Groundwater
chemistry is determined by the geology, topography, landscape and climate of the region, as well as
Figure 2.1 Dominant geology of the Free State (DEA, 2000)
© Central University of Technology, Free State
Chapter 2: Literature Review Page | 16
anthropogenic activities (Fawell and Nieuwenhuijsen, 2003; Seth et al., 2014). Since groundwater
occurs in association with geological materials containing soluble minerals, higher concentrations
of dissolved salts are normally expected in groundwater relative to surface water. The type and
concentration of salts depends on the geological environment and the source and movement
of the water. Groundwater flows through almost all rocks and sediments below the water-table,
at different speeds. The quality of groundwater is dependent upon the soluble products of rock
weathering, duration of water in contact with rocks, the amount of dissolved carbon dioxide and
also on the differences in the permeability and porosity of the rock formations (Seth et al., 2014).
These conditions influence groundwater quality resulting in elevated concentrations of inorganic
compounds, such as arsenic, fluoride and iron (MacDonald et al., 2012). The quality of groundwater
is further dependent on the quality of recharge water, precipitation and surface water (Vasanthavigar
et al., 2010). Resulting from the geology of the area, the chemistry of groundwater may give rise
to unacceptable chemical concentrations rendering the water unfit for human consumption, for
example, high sulphate in some parts of the weathered basement and mudstones and hardness in
limestone aquifers or sandstones cemented with carbonate material (MacDonald and Davies, 2000;
Mpenyana-Monyatsi and Momba, 2012).
Groundwater is also contaminated through anthropogenic activities, such as industrial chemical
spills, agriculture spills, waste products, mining activates, as well as waste and effluent from
intensive farming enterprises. Illegal dumping and improper disposal of industrial wastes lead to
an increase in contamination of groundwater (Fawell and Nieuwenhuijsen, 2003). Once polluted,
groundwater quality cannot be restored by preventing or stopping the pollution at the source
(Dave et al., 2012). Organic chemical pollution of groundwater derives from leachate, organic
compounds and chlorinated compounds, such as trihalomethans. Inorganic compounds impacting
on groundwater quality include substances resulting from water treatment processes and pesticides
or polluting products containing amounts of cadmium, barium, mercury, molybdenum and boron
(Al-Khatib and Arafat, 2009). Other sources impacting groundwater quality include wastewater
from treatment plants, abattoirs and industry; overuse of fertilisers and agricultural pesticides; and
improperly managed landfill sites (Al-Khatib and Arafat, 2009).
Pit latrines and septic tanks are also sources of groundwater contamination, especially when the site
selection is poor or when shallow pits are situated close to a borehole (Fawell and Nieuwenhuijsen,
2003). Other factors influencing groundwater contamination by pit latrines include the permeability
of the soil and depth of the water-table (Ahaneku and Adeoye, 2014). Soil also plays an important
© Central University of Technology, Free State
Chapter 2: Literature Review Page | 17
role in the prevention of groundwater contamination by pathogenic organisms. The soil type and
type of sanitation facility determine the effectiveness of the removal of pathogenic organisms by the
soil (Ahaneku and Adeoye, 2014).
Guidelines for the construction of pit latrines aim to protect groundwater. These include:
• to locate the borehole at an area that is topographically higher than the site of the pit latrines;
• to dig the borehole more than 15 m away from the pit latrine; as well as
• to ensure the pit bottom of the latrine is more than 2 m above the water-table (Ahaneku and
Adeoye, 2014).
Areas with shallow groundwater are more susceptible to pollution from pit latrines and septic tanks
than areas with a deeper water-table (Graham and Polizzotto, 2013). Environmental factors play
a role in governing groundwater pollution from latrines. Hydrogeological conditions are strong
predictors of the threat of nitrate contamination of groundwater.
Dairy farming, in particular, is known to affect groundwater quality through inappropriate dairy
waste disposal (Hudak, 2000). During the past two decades, various agricultural activities have
shown to have a negative effect on groundwater in South Africa (Böhlke, 2002). In particular, faecal
pathogenic microorganisms and nitrates are responsible for groundwater deterioration (Douagui
et al., 2012). Nitrate leaching stem from agricultural sources, such as dairy yards, dairy effluent,
waste ponds and fertiliser usage (Huebsch et al., 2013). Nitrate is regarded as the most widespread
contaminant of groundwater, since nitrate is both soluble and mobile; it is inclined to leach through
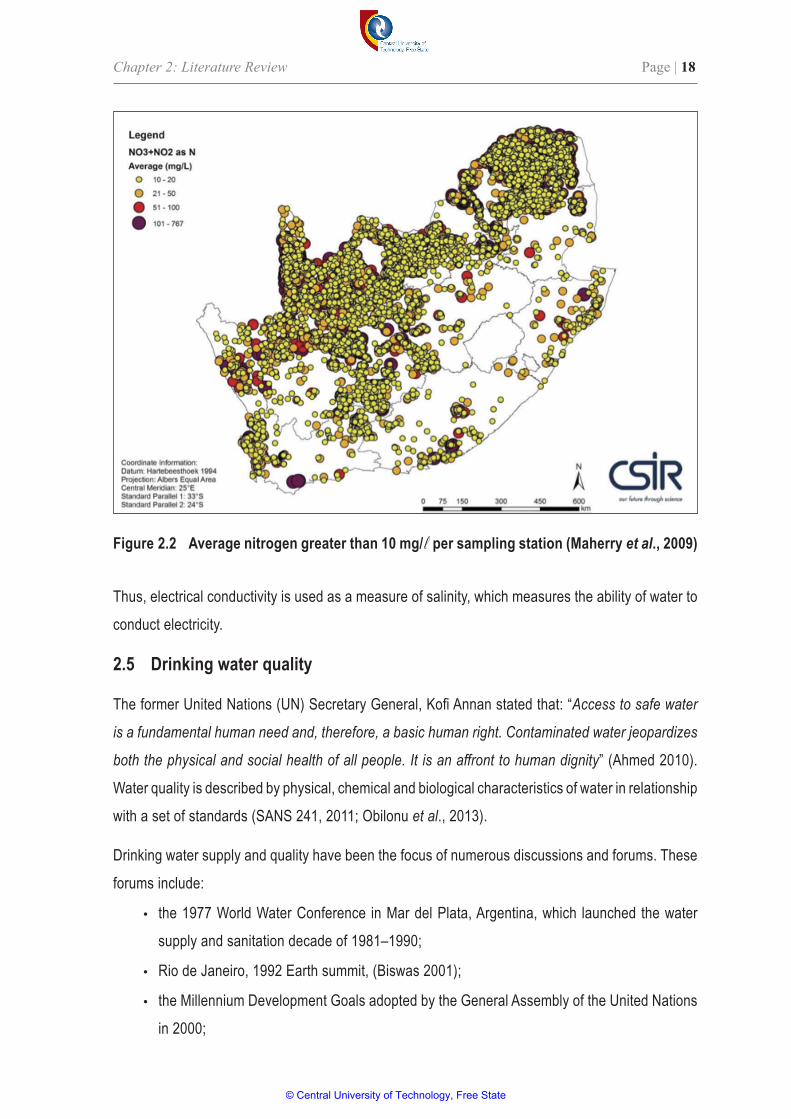
soils infiltrating groundwater (Nolan and Hitt, 2006). High nitrate levels are prevalent in groundwater
throughout South Africa (Maherry et al., 2009; Figure 2.2).
Microbial contaminants, such as faecal coliforms adenoviruses, rotaviruses, and enteroviruses,
have been identified in groundwater (Jamieson et al., 2002; De Oliveira et al., 2012). The presence
of faecal pathogens in groundwater suggests that microorganisms penetrate groundwater and
aquifers in rates of days and weeks, which is faster than recharging of groundwater (Taylor et al.,
2004). The vulnerability of groundwater to microbial contamination is important because of the
associated health risk, as the ingestion of low quantities (< 10 2 ) of microbial pathogens and viruses
may cause water-borne diseases (Taylor et al., 2004).
Changes in the physico-chemical parameters may have a major influence on biochemical reactions
that occur within the groundwater. The electrical conductivity is a good indication of the amount of
total dissolved salts in groundwater and indicates levels of salinity of the water (Usher et al., 2007).
© Central University of Technology, Free State
Chapter 2: Literature Review Page | 18
Thus, electrical conductivity is used as a measure of salinity, which measures the ability of water to
conduct electricity.
2.5 Drinking water quality
The former United Nations (UN) Secretary General, Kofi Annan stated that: “Access to safe water
is a fundamental human need and, therefore, a basic human right. Contaminated water jeopardizes
both the physical and social health of all people. It is an affront to human dignity” (Ahmed 2010).
Water quality is described by physical, chemical and biological characteristics of water in relationship
with a set of standards (SANS 241, 2011; Obilonu et al., 2013).
Drinking water supply and quality have been the focus of numerous discussions and forums. These
forums include:
• the 1977 World Water Conference in Mar del Plata, Argentina, which launched the water
supply and sanitation decade of 1981–1990;
• Rio de Janeiro, 1992 Earth summit, (Biswas 2001);
• the Millennium Development Goals adopted by the General Assembly of the United Nations
in 2000;
Figure 2.2 Average nitrogen greater than 10 mg/ l per sampling station (Maherry et al., 2009)
© Central University of Technology, Free State
Chapter 2: Literature Review Page | 19
• the Johannesburg World Summit for Sustainable Development in 2002 (Rahaman and
Varis, 2005); and
• the International Decade for Action, “Water for Life” from 2005 to 2015, declared by the UN
General Assembly (WHO, 2008).
Many of the challenges faced by civilisation in the current century are related to water, specifically
its quality and its quantity (Schwarzenbach et al., 2010). The importance of supplying safe drinking
water has led to the establishment of regulations or guiding documents for the monitoring of the
quality of water by different countries (Ongoley, 1999). These regulatory guidelines describe
reasonable minimum requirements of safe practice to protect consumers from water-borne diseases
(WHO, 2011).
The World Health Organisation (WHO) published the first and second editions of the Guidelines
for Drinking-Water Quality in 1984 and 1997 and recently updated them in 2008 (WHO, 2008).
These guidelines describe requirements to ensure drinking water safety, minimum procedures
and the intended use. They are intended for countries to develop their own standards, regulations
and mandatory limits (WHO, 2008). Consideration of these guidelines needs to be made in the
context of local or national environmental, social, economic and cultural conditions in a particular
country (WHO, 2008). They further describe guideline values and provide fact sheets on significant
microbiological and chemical hazards (WHO, 2008).
The provision of drinking water of safe and acceptable quality is secured in most countries by a
series of mandatory standards or advisory guidelines, using the WHO Guidelines for Drinking-
Water Quality as a reference (Roccaro et al., 2005; WHO, 2008). The Safe Drinking Water Act
of 1974 in the USA governs and regulates contaminants in drinking water. This act introduced
the implementation of water safety plans (Blackburn et al., 2002). In the USA, this act is used
in combination with the standards for drinking water quality set by the Environmental Protection
Agency (EPA), that is responsible for overseeing compliance with the standards (EPA, 1999). The
European Union countries have developed the EU Drinking Water Directive, 98/83/EC (EC, 1998).
This directive prescribes standards for the most common physical, chemical and microbiological
parameters that are used to determine water quality at point of use. The Drinking Water Standards
of Australia are subject to the Australian Drinking Water Guidelines of 1996, which were developed
by the National Health and Medical Research Council, together with the Agriculture and Resource
Management Council of Australia and New Zealand. These documents are used along with relevant
WHO’s 1993 guidelines (Stein, 2001). In Africa, Botswana implemented the National Conservation
© Central University of Technology, Free State
Chapter 2: Literature Review Page | 20
Strategy (1990) and the Water Master Plan of 1991 to safeguard natural water resources (UNDP,
2003). The Botswana Standards, which were developed by the Bureau of Botswana Standards,
describe the water quality standards and associated penalties for the breach of these standards.
Water Quality in South Africa is regulated by legislation, as well as the South African Drinking Water
Quality Guidelines (DWAF, 1996) and the South African National Standards for Drinking Water
(SANS 241, 2011).
2.5.1 South African drinking water legislation and standards
The South African Water Act was promulgated in 1998 (Act 36 of 1998) and recognises that water is
a resource that must be protected and managed. Government has a responsibility to provide water
but also to ensure that it is protected and effectively managed. The aim is:
• to achieve sustainable use where communities will have access to water in terms of quantity
as well as quality; and
• that there is provision for the day to day use of water, as well as for future needs.
The Act sets out to protect water quality by addressing pollution and to regulate bulk water
consumption by licensing water use. Water must be managed in an integrated way, which will allow
for delegation, in order to be more effective (National Water Act, 1998).
The Water Services Act, No. 108 of 1997 regulates the structure and the supply of drinking water
in the country (Water Services Act, 1997). The purpose of this act is to provide national norms,
standards and an institutional framework for the provision of water services (Water Services Act,
1997). This act addresses important issues such as:
• national standards and norms;
• the right of access to basic water supply and sanitation;
• a regulatory framework for water service institutions; and
• the collection and development of a national information system.
Various South African documents, specifically the Compulsory National Standards for the Quality
of Potable Water taken up in Regulation 5 of the Water Services Act of 2001, have resulted in the
development of the South African National Standards 241 for Drinking Water (SANS 241, 2006
and 2011). The SANS 241 (2006) was aligned with the WHO (2008) standards and was amended
in 2011, resulting in the publication of SANS 241: Part 1 and Part 2 (SANS 241, 2011). The SANS
241 (2011) is a conclusive reference of acceptable limits for drinking water quality parameters at
the point of delivery.
© Central University of Technology, Free State
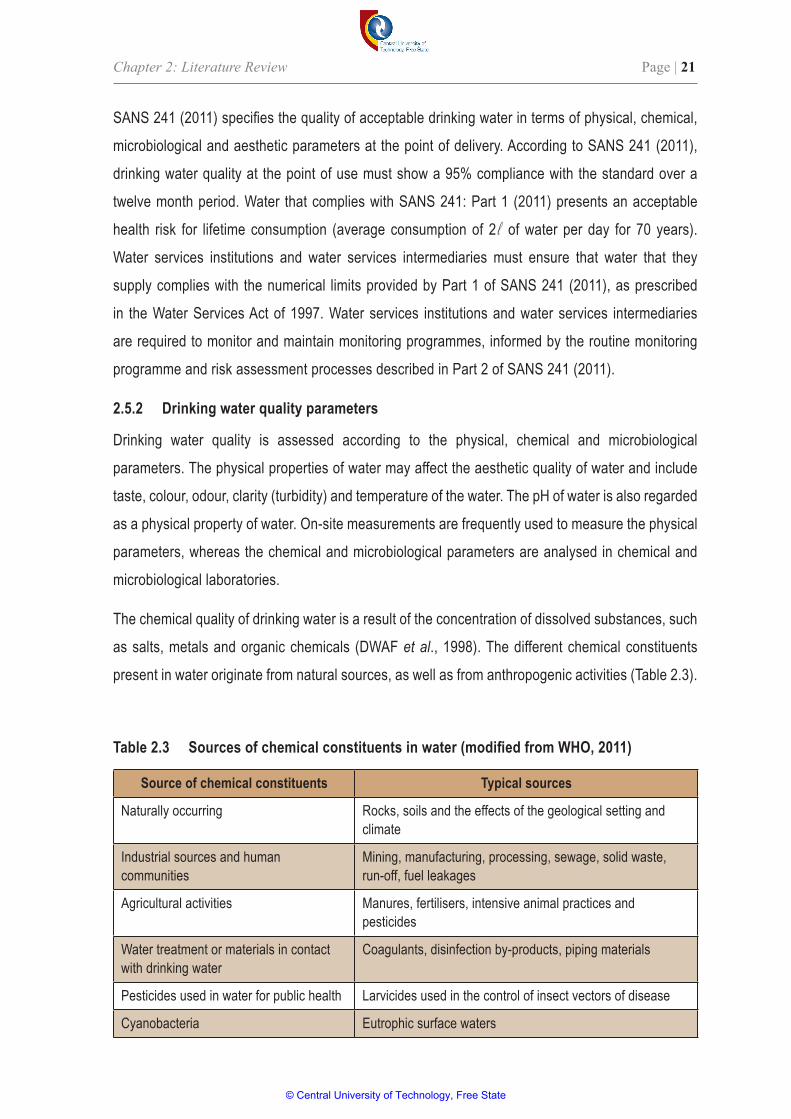
Chapter 2: Literature Review Page | 21
SANS 241 (2011) specifies the quality of acceptable drinking water in terms of physical, chemical,
microbiological and aesthetic parameters at the point of delivery. According to SANS 241 (2011),
drinking water quality at the point of use must show a 95% compliance with the standard over a
twelve month period. Water that complies with SANS 241: Part 1 (2011) presents an acceptable
health risk for lifetime consumption (average consumption of 2 l of water per day for 70 years).
Water services institutions and water services intermediaries must ensure that water that they
supply complies with the numerical limits provided by Part 1 of SANS 241 (2011), as prescribed
in the Water Services Act of 1997. Water services institutions and water services intermediaries
are required to monitor and maintain monitoring programmes, informed by the routine monitoring
programme and risk assessment processes described in Part 2 of SANS 241 (2011).
2.5.2 Drinking water quality parameters
Drinking water quality is assessed according to the physical, chemical and microbiological
parameters. The physical properties of water may affect the aesthetic quality of water and include
taste, colour, odour, clarity (turbidity) and temperature of the water. The pH of water is also regarded
as a physical property of water. On-site measurements are frequently used to measure the physical
parameters, whereas the chemical and microbiological parameters are analysed in chemical and
microbiological laboratories.
The chemical quality of drinking water is a result of the concentration of dissolved substances, such
as salts, metals and organic chemicals (DWAF et al., 1998). The different chemical constituents
present in water originate from natural sources, as well as from anthropogenic activities (Table 2.3).
Table2.3 Sourcesofchemicalconstituentsinwater(modifiedfromWHO,2011)
Source of chemical constituents Typical sources
Naturally occurring Rocks, soils and the effects of the geological setting and climate
Industrial sources and human communities
Mining, manufacturing, processing, sewage, solid waste, run-off, fuel leakages
Agricultural activities Manures, fertilisers, intensive animal practices and pesticides
Water treatment or materials in contact with drinking water
Coagulants, disinfection by-products, piping materials
Pesticides used in water for public health Larvicides used in the control of insect vectors of disease
Cyanobacteria Eutrophic surface waters
© Central University of Technology, Free State
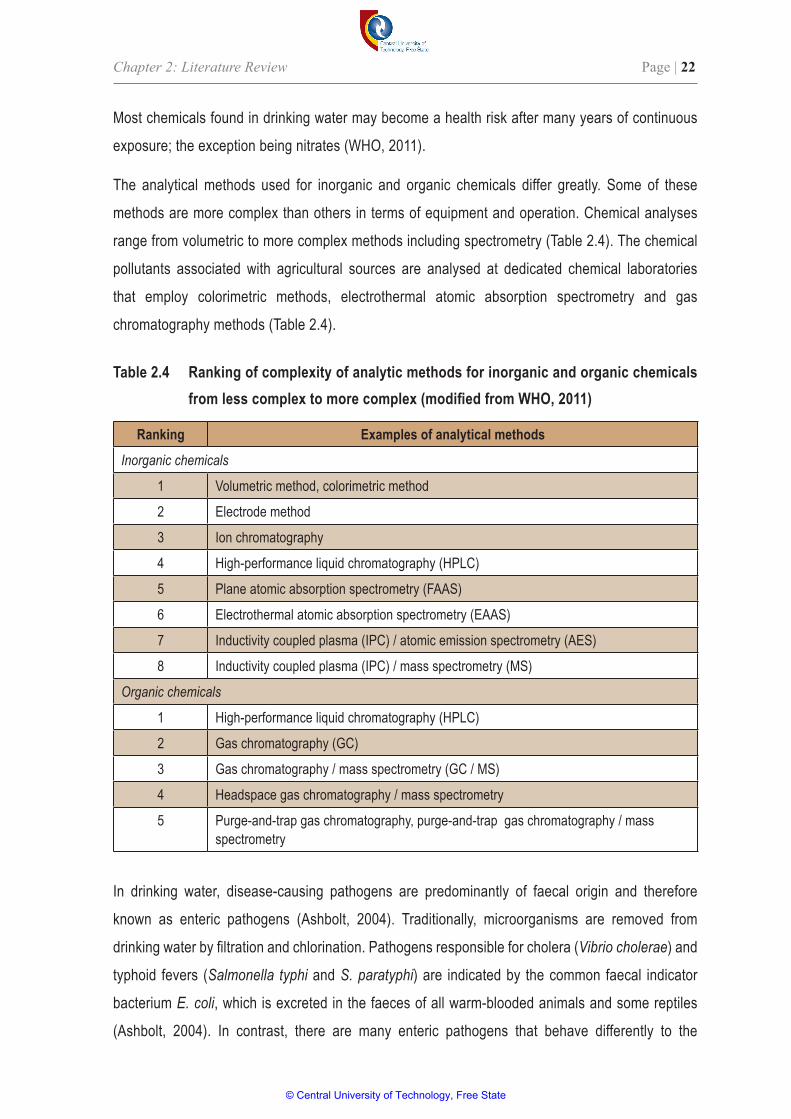
Chapter 2: Literature Review Page | 22
Most chemicals found in drinking water may become a health risk after many years of continuous
exposure; the exception being nitrates (WHO, 2011).
The analytical methods used for inorganic and organic chemicals differ greatly. Some of these
methods are more complex than others in terms of equipment and operation. Chemical analyses
range from volumetric to more complex methods including spectrometry (Table 2.4). The chemical
pollutants associated with agricultural sources are analysed at dedicated chemical laboratories
that employ colorimetric methods, electrothermal atomic absorption spectrometry and gas
chromatography methods (Table 2.4).
Table 2.4 Ranking of complexity of analytic methods for inorganic and organic chemicals fromlesscomplextomorecomplex(modifiedfromWHO,2011)
Ranking Examples of analytical methodsInorganic chemicals
1 Volumetric method, colorimetric method
2 Electrode method
3 Ion chromatography
4 High-performance liquid chromatography (HPLC)
5 Plane atomic absorption spectrometry (FAAS)
6 Electrothermal atomic absorption spectrometry (EAAS)
7 Inductivity coupled plasma (IPC) / atomic emission spectrometry (AES)
8 Inductivity coupled plasma (IPC) / mass spectrometry (MS)
Organic chemicals
1 High-performance liquid chromatography (HPLC)
2 Gas chromatography (GC)
3 Gas chromatography / mass spectrometry (GC / MS)
4 Headspace gas chromatography / mass spectrometry
5 Purge-and-trap gas chromatography, purge-and-trap gas chromatography / mass spectrometry
In drinking water, disease-causing pathogens are predominantly of faecal origin and therefore
known as enteric pathogens (Ashbolt, 2004). Traditionally, microorganisms are removed from
drinking water by filtration and chlorination. Pathogens responsible for cholera (Vibrio cholerae) and
typhoid fevers (Salmonella typhi and S. paratyphi) are indicated by the common faecal indicator
bacterium E. coli, which is excreted in the faeces of all warm-blooded animals and some reptiles
(Ashbolt, 2004). In contrast, there are many enteric pathogens that behave differently to the
© Central University of Technology, Free State
Chapter 2: Literature Review Page | 23
indicator microorganism E. coli with respect to their resistance to disinfectant chemicals and their
persistent occurrence in the environment. Chlorine-resistant microorganisms of concern include
oocysts of the resistant parasitic protozoa Cryptosporidium parvum and various enteric viruses
(Li et al., 2002). In the treatment of drinking water, it is imperative to match suitable indicators for
particular groups of pathogens (Ashbolt, 2004).
It is not practical and also very costly to test for the presence of all potentially water-borne pathogens.
Therefore, it is more practical to identify and use indicator organisms that represent these groups
of pathogens. Different indicator organisms will thus represent bacteria, viruses, protozoa and
helminths. The WHO proposes the following criteria for the selection of indicator organisms (WHO,
2011):
• water-borne transmission as a route of infection must be established;
• sufficient data should be available to enable a quantitative microbiological risk assessment;
• must occur in water;
• must persist in the environment;
• must be sensitive to removal or inactivation by treatment processes; and
• its infectivity, incidence and severity of disease known.
Different methods for pathogen detection measure different properties. Living microorganisms are
detected by methods based on infection or growth, such as culture methods, broth cultures or agar-
based bacterial media, whereas cell cultures are used for viruses and phages. Detection methods
of the physical presence of a pathogen or its components, irrespective if it is alive or infectious,
include microscopy, the presence of nucleic acids determined through amplification (for example,
applying the polymerase chain reaction) and immunological assays (for example, enzyme-linked
immunosorbent assays).
International methods have been established for the detection of microorganisms in drinking water.
Before the adoption of these methods by a country, it is recommended that they are tested under
local circumstances. Established methods, such as those of the International Organisation for
Standardisation (ISO), can be tested and modified for local use by a country (Table 2.5).
2.6 Dairy standards
South Africa and many countries in the world have established regulations or minimum requirements
for dairy production to ensure the safety of dairy products (CAC/RCP, 2004; NZFSA, 2009;
Regulation 961, 2012). The purpose for developing and implementing minimum standards is to
© Central University of Technology, Free State
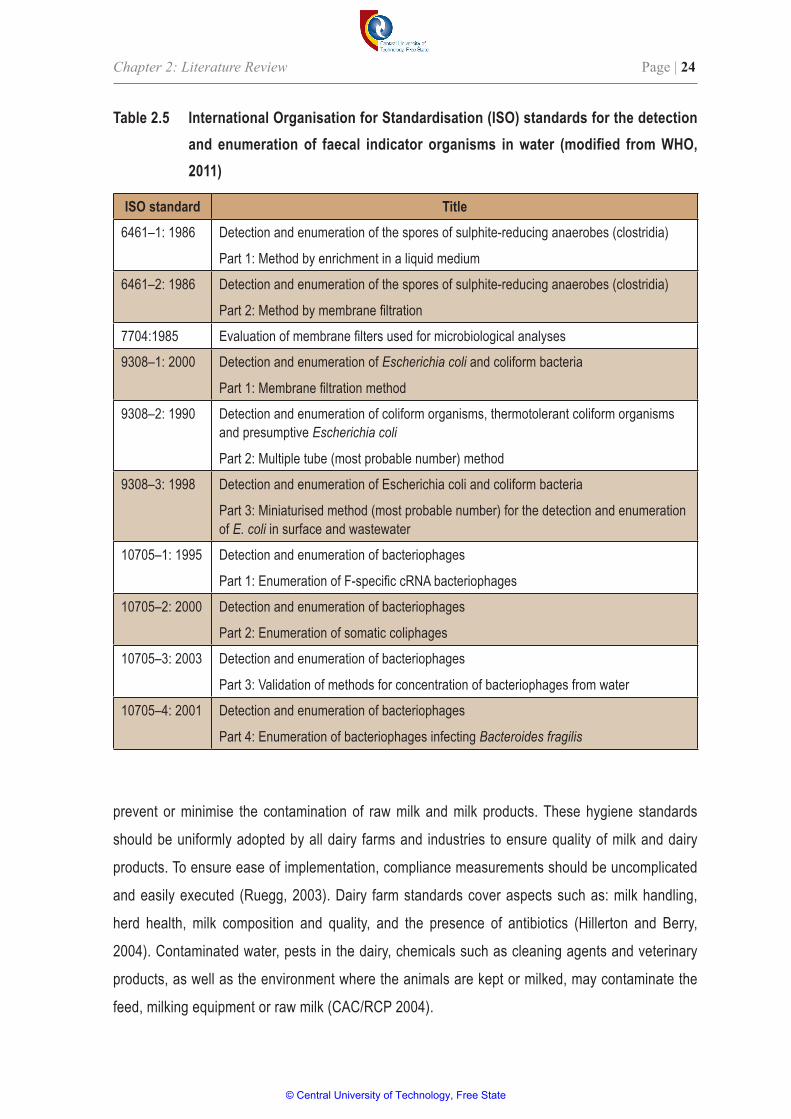
Chapter 2: Literature Review Page | 24
prevent or minimise the contamination of raw milk and milk products. These hygiene standards
should be uniformly adopted by all dairy farms and industries to ensure quality of milk and dairy
products. To ensure ease of implementation, compliance measurements should be uncomplicated
and easily executed (Ruegg, 2003). Dairy farm standards cover aspects such as: milk handling,
herd health, milk composition and quality, and the presence of antibiotics (Hillerton and Berry,
2004). Contaminated water, pests in the dairy, chemicals such as cleaning agents and veterinary
products, as well as the environment where the animals are kept or milked, may contaminate the
feed, milking equipment or raw milk (CAC/RCP 2004).
Table 2.5 International Organisation for Standardisation (ISO) standards for the detection and enumeration of faecal indicator organisms inwater (modified fromWHO,2011)
ISO standard Title6461–1: 1986 Detection and enumeration of the spores of sulphite-reducing anaerobes (clostridia)
Part 1: Method by enrichment in a liquid medium
6461–2: 1986 Detection and enumeration of the spores of sulphite-reducing anaerobes (clostridia)
Part 2: Method by membrane filtration
7704:1985 Evaluation of membrane filters used for microbiological analyses
9308–1: 2000 Detection and enumeration of Escherichia coli and coliform bacteria
Part 1: Membrane filtration method
9308–2: 1990 Detection and enumeration of coliform organisms, thermotolerant coliform organisms and presumptive Escherichia coli
Part 2: Multiple tube (most probable number) method
9308–3: 1998 Detection and enumeration of Escherichia coli and coliform bacteria
Part 3: Miniaturised method (most probable number) for the detection and enumeration of E. coli in surface and wastewater
10705–1: 1995 Detection and enumeration of bacteriophages
Part 1: Enumeration of F-specific cRNA bacteriophages
10705–2: 2000 Detection and enumeration of bacteriophages
Part 2: Enumeration of somatic coliphages
10705–3: 2003 Detection and enumeration of bacteriophages
Part 3: Validation of methods for concentration of bacteriophages from water
10705–4: 2001 Detection and enumeration of bacteriophages
Part 4: Enumeration of bacteriophages infecting Bacteroides fragilis
© Central University of Technology, Free State
Chapter 2: Literature Review Page | 25
Regulations Relating to Hygiene Requirements for Milking Sheds and Transport of Milk and Related
Matters (Regulation 961, 2012) prescribe that all dairy farmers in South Africa should obtain a
certificate of acceptability (COA) in order to supply raw milk to local consumers and bulk buyers.
Dairy hygiene and hygienic milking practices are prescribed in the requirements of the COA under
the headings:
• milking shed;
• milk containers and milking machine;
• handling of milk;
• health status of dairy stock;
• personnel hygiene; and
• milk handlers (Regulation 961, 2012).
Dairy farmers obtain a COA by firstly submitting an application to the local authority, after which
an environmental health practitioner (EHP) will inspect the dairy and issue a certificate, if the farm
complies with the requirements. Monitoring of compliance to the requirements of the COA is through
inspection and sampling by EHP.
2.6.1 Infrastructure
In South Africa, according to Regulation R961 (Regulation 961, 2012), dairy farmers are required to
have a dedicated dairy shed. Such a milking shed should consist of a milking parlour, a milk room,
a change room and a scullery (DSA, 2013). The walls and floors of the shed should be constructed
of material that is easily cleaned and the building is required to have a ceiling to limit dust and
rodents. Flooring should allow for efficient drainage and cleaning (Regulation 961, 2012). The milk
room should have a basin providing hot and cold water for cleaning equipment. A change room with
a shower for staff, a hand wash basin with hot and cold water, soap and disposable towels should
be supplied.
Specific guidelines have been developed for the protection of boreholes from pollution from
sanitation facilities. Therefore, when groundwater is used in a dairy, the borehole head must be
sealed to prevent contaminates entering the borehole and the area surrounding the borehole must
be sustained to reduce and prevent groundwater contamination. Water storage tanks must have a
cover to protect the water from contaminants entering the tank (Bord Bia, 2013).
Solid waste and effluent should be handled in such a manner to prevent contamination of raw
milk and the herd. Dairy cows should be kept away from areas where waste is stored to minimise
© Central University of Technology, Free State
Chapter 2: Literature Review Page | 26
exposure to harmful contaminants and faecal material. Storage facilities of waste should be designed
in such a manner as to prevent pest and rodent infestation (DSA, 2013). All waste generated in the
milking shed must be removed by means of a pipeline or a cement ditch (Regulation 961, 2012).
2.6.2 Water quality
Specific guidelines prescribe the cleaning of a dairy shed and equipment with water of a specific quality
and standard (SAI, 2009; Regulation 961, 2012; Bord Bia, 2013). According to Regulation R961
(Regulation 961, 2012), water used during the milking process must be of the same quality as
for human consumption; complying with the South African National Standards for Drinking Water
Quality (SANS 241, 2011), thus it must be free of harmful contaminants, such as faecal bacteria
and other pathogens. Furthermore, the milking equipment, bulk tank, milk transportation truck and
protective clothing of workers in a dairy must be cleaned and disinfected to ensure good hygiene
practices, as well as to prevent potential contamination of raw milk.
The equipment used in the dairy, as well as the effectiveness of the chemicals used in the dairy,
may deteriorate because of poor water quality (Corkal et al., 2004). Some of the equipment that
could be affected in the dairy includes the nozzles and the boilers and geysers that could clog up
because of the hardness of the water (Rubenowitz-Lundin and Hiscock, 2005).
2.6.3 Dairy herd health
According to Regulation R961 (Regulation 961, 2012), all aspects pertaining to herd health should
be recorded to allow traceability. To promote and maintain herd health, the regulation prescribes
that all dairy animals be distinctively marked and a complete medical record of each cow be kept.
All veterinary treatments and dates thereof, as well as the drugs used, should be recorded. Good
record-keeping will alert the herd manager or handlers on any action to be taken to maintain a
healthy herd, thereby ensuring the production of safe raw milk. The regulation (Regulation 961,
2012) also states that, before-milking continues, the fore-milk of a cow must be visually examined
to determine its health status, after which the fore-milk is discarded.
Milk should only be abstracted from animals in good health, ensuring the end product is safe
(CAC/RCP, 2004). Cows suffering from tuberculosis, mastitis or brucellosis must be kept separate
from the herd and the milk may not be used for human consumption (Regulation 961, 2012). It
is advised that milk producers follow a regular inspection routine of all animals in the dairy herd,
and these inspections should be increased during periods of calving and other vulnerable periods
(Bord Bia, 2013). Milk from unhealthy cows or animals treated with veterinary drugs should be
© Central University of Technology, Free State
Chapter 2: Literature Review Page | 27
properly discarded until the withdrawal period of the drugs has been achieved (CAC/RCP, 2004;
Regulation 961, 2012).
2.7 Water quality management
In 2000, the leaders of 189 member nations of the United Nations adopted the Millennium Declaration
at the Millennium Summit in New York. This declaration included a series of collective priorities for
poverty eradication, development and protecting the environment. This declaration resulted in the
formulation of eight Millennium Development Goals (MDG) supported by 18 targets (UN, 2000).
Target 10, which is part of the Environmental Sustainability goal, MDG no. 7, states that the world’s
population lacking access to safe drinking water and basic sanitation, will be reduced by half by
2015 (Schwarzenbach et al., 2010). Achieving this target may also positively impact child mortality,
major infectious diseases, maternal health, as well as quality of life of people in poor communities
(Hutton and Bartram, 2008). Between 1990 and 2010 more than two billion people gained access
to improved drinking water, and the proportion of people using improved water increased from 76%
in 1990 to 89% in 2010 (UN, 2013b). This progress is also true for South Africa with 90.8% of the
population with access to safe water in 2012 (STATS SA, 2013). Although target 10 has been met
ahead of time, there still is concern about the quality and safety of the water of a large number of
improved water sources (UN, 2013b).
2.7.1 Integrated water resource management
Freshwater must be acknowledged as a limited and valuable resource, crucial to the sustainability
of human life and the environment, but is also necessary for social and economic development.
Thus, the goal of integrated water resource management (IWRM) is to manage and control water
of a catchment, ensuring quality and quantity of water resources. It is the approach of IWRM to
holistically manage water resources and to promote an organised awareness of all resources
(Foster and Ait-Kadi, 2012). For IWRM to succeed, a multi-disciplinary approach should be followed
involving water users and policy makers in the planning process (Foster and Ait-Kadi, 2012).
IWRM is based on the principal of vulnerability and loss. Vulnerability represents the potential for
contamination or impact on the water resource caused by contamination hazards. Loss represents
the economic, environmental or health impact resulting from the contamination of a water resource
(Simpson et al., 2012). Therefore, municipalities need to implement water safety plans as part of
their IWRM in the provision of safe drinking water (WRC, 2010).
© Central University of Technology, Free State
Chapter 2: Literature Review Page | 28
2.7.2 BlueandGreenDropcertification
In South Africa, the Blue Drop and Green Drop certification programmes were developed to improve
water quality and water management. The Blue Drop and Green Drop certification programmes
are flagship innovations by the Department of Water Affairs and Forestry (DWAF, 2009a). During
2008 these programmes were introduced as incentive-based regulation systems. The Blue Drop
programme strives to improve the quality of municipal drinking water, while the Green Drop
programme aims to improve wastewater management (Molewa, 2011). Municipalities and water
service providers are scored according to set criteria. To obtain a Blue Drop, a score of 95% or
more must be obtained (DWAF, 2009b). These scoring criteria encompass the current South
African water legislation and the drinking water standard. By meeting the set criteria for a Blue Drop
grading, the water service providers and municipalities are complying with the current legislation
and meeting the drinking water quality standards.
Water used in urban settings is extensively monitored to assure compliance with the South African
National Drinking Water Quality (SANS 241, 2011). The recent development of the Blue Drop scoring
system to evaluate the water quality management of municipalities enforces a sampling plan with a
specified sampling strategy (DWAF, 2009b). The majority of farms and many rural communities in
South Africa do not have access to municipal water supply networks. Many of these communities
utilise groundwater as their only source of drinking water, which is typically untreated and is not
included in the municipal Blue Drop assessment (Graham and Polizzotto, 2013). Therefore, these
water sources are rarely monitored and seldom treated (Knüppe, 2011).
The Green Drop certification programme scores municipalities on their ability to manage and treat
wastewater. A Green Drop assessment focuses on the entire business of a municipal wastewater
service. The risk analysis specifically addresses the wastewater treatment function (DWA, 2011).
Poor wastewater treatment not only threatens the health of surrounding communities, but also the
receiving water systems that supply water to communities and ecosystems (Van Vuuren, 2014).
The success rate of Green Drop certification is currently less than that of the Blue Drop certification
(Munnik, 2013). This may be because of the infrastructural maintenance backlog and need to train
plant operators.
2.7.3 Water quality index
Water quality of any source is assessed using a variety of parameters, which include physical,
chemical and biological parameters. A problem with water quality assessments is the complexity
related to analysing and interpreting a large number of measured parameters together with their
© Central University of Technology, Free State
Chapter 2: Literature Review Page | 29
variability (Khan et al., 2005; Alobaidy et al., 2010; Zali et al., 2011). There is no single measurement
that can describe water quality (Nasirian, 2007; UNEP, 2007; Alobaidy et al., 2010). Thus, a water
quality index (WQI) uses all the data of a water quality assessment and reduces it into a single value
(Štambuk-Giljanović, 1999; Nasirian, 2007; González et al., 2012; Tyagi et al., 2013). A WQI is one
of the most effective methods to describe the quality of water. The use of a single value describing
water quality, facilitates the understanding of water quality issues by non-water professionals, policy
makers and the general public (Tyagi et al., 2013).
The first WQI was developed in the United States by Horton (1965) and applied in Europe since the
1970s, initially in the United Kingdom. It has also been used in Africa and Asia (Liou et al., 2004;
Saeedi et al., 2010). Since Horton (1965) proposed the first WQI, several arithmetical methods
to calculate an index have been developed. These methods include the aggregation of quality
assessment data to produce an overall quality index. Some of the major examples include:
• the weighted averaging methods of Brown et al. (1970) and Štambuk-Giljanović (1999);
• weighted geometric means (Dinius, 1987); and
• hybrid methods (Dojlido et al., 1994; Swamee and Tyagi, 2000).
These indexes define a unique rating curve for each parameter, by which its values are interpreted,
using a questionnaire, in terms of conceptual quality units, or some set of standards (Liou et al.,
2004).
An index is a number that is dimensionless, expressing the relative magnitude of the collective
water quality data. The WQI concept is based on the comparison of the water quality parameters
with respective regulatory standards (Khan et al., 2005). An index is developed following four
general steps (Boyacioglu, 2007).
• selection of the set of water quality parameters;
• development of sub indexes;
• weighting of the water quality parameters based on their relative importance; and
• the formulation of overall water quality index.
The Canadian water quality index is one of the few indexes that consider microbiological parameters
in combination with physical and chemical parameters (CCME, 2001).
Some of the advantages of a WQI include:
• easy to understand by non-water professional;
© Central University of Technology, Free State

Chapter 2: Literature Review Page | 30
• more emphasis on the status of water quality than on individual parameters; and
• an average of various parameters combining different measurements into a single value.
The main disadvantage of WQI is that some information of individual parameters and their
interactions may be masked. The choice of the WQI method is dependent on the water to be
assessed, which determines the number of parameters to be included in the calculation (Camejo
et al., 2013). A WQI has also been successfully applied to assess groundwater, particularly in India.
The WQI values of groundwater in Tumkur taluk were relatively high, mainly because of the high
incidence of iron, nitrate, total dissolved solids, hardness, fluorides, bicarbonate and manganese
(Ramakrishnaiah et al., 2009), while groundwater from the Kurmapalli Vagu basin was of poor
quality because of high fluoride values detected (Srinivas et al., 2011).
The use of a WQI as a management tool in water quality assessment is a recent introduction
(Muthulakshmi et al., 2013). Water managers and policy makers need precise and concise
information about water sources for decision making purposes, which are provided by a WQI (Darko
et al., 2013).
2.8 Water quality and health effects
The UN reaffirmed the importance of water to human health and wellbeing in the Human Right to
Water and Sanitation, which entitles everyone to ‘‘sufficient, safe, acceptable, physically accessible
and affordable water for personal and domestic uses’’ (UN, 2010). A step towards universal access
to safe water is enshrined in the Millennium Development Goals (MDGs) Target 7c, which aims “to
halve the proportion of the population without sustainable access to safe drinking water …’’ (UN,
2013a).
Water contamination is a major source of health problems, particularly in the developing world,
where drinking water quality is poorly managed and monitored (Ul-Haq et al., 2011). Exposure to
water-borne contaminants through ingestion of contaminated drinking water may pose a health
risk to particularly high-risk population groups, such as infants, the elderly, pregnant women and
immune compromised (Burkholder et al., 2007).
2.8.1 Chemical effects
Effects of agricultural activities and run-off increase the risk of nitrate pollution of surface water
and groundwater (Hooda et al., 2000). High levels of nitrate in drinking water, in excess of 10 mg/ l,
have been associated with a number of different health effects. There is an increased risk for
methaemoglobinaemia (blue baby syndrome) in infants under six months of age, when nitrate-rich
© Central University of Technology, Free State
Chapter 2: Literature Review Page | 31
water is used in the preparation of infant formula (Burkholder et al., 2007). Other health factors
associated with nitrate-rich water include diarrhoea and respiratory disease (Ward et al., 2005);
increased risk of hyperthyroidism (Burkholder et al., 2007); insulin-dependent diabetes (Kostraba
et al., 1992); and increased risks for adverse reproductive outcomes, including central nervous
system malformations (Arbuckle et al., 1988).
Heavy metal pollution of the natural environment is a worldwide problem because these metals are
indestructible and most of them have toxic effects on living organisms when they exceed acceptable
limits in water (Batayneh, 2012). Heavy metals cannot be degraded, biologically or chemically, and
thus may accumulate in water sources. Heavy metals in groundwater originate from the weathering
of soils and rocks and a variety of anthropogenic activities. Water pollution by heavy metals is very
prominent in areas of mining sites, although heavy metals of terrestrial origin could come from
industry and urban development and other human practices (Saunders et al., 2005; Riekert, 2007).
Arsenic is a naturally occurring element found in groundwater (Saunders et al., 2005; Riekert, 2007),
however, arsenic contamination also may result in industrial processes, such as metal refining and
timber treatment (WHO, 2012). The health effects as a result of the consumption of arsenic-rich
water include skin problems, such as colour changes, hard patches on the palms and soles and
skin cancer (Carr and Neary, 2008). Other diseases known to be caused by arsenic exposure are
cancers of the bladder, kidney and lung; and diseases of the blood vessels of the legs and feet;
and possibly also diabetes, high blood pressure and reproductive disorders (Abernathy et al., 2003;
WHO, 2008).
Excess lead in drinking water is a threat to the health of a population. Lead contamination of drinking
water may have deleterious effects on multiple organs, including the nervous, haematopoietic, renal,
endocrine and reproductive organs, especially in children (Ul-Haq et al., 2011). Lead exposure
could result in developmental damage to a foetus, while acute exposure can cause vomiting or
death (Palaniappan et al., 2010). Low-level ingestion of cadmium over a long period of time has
been associated with kidney damage and can cause bones to become fragile and break easily
(ATSDR, 2008). Copper, while also an essential mineral, in high concentrations can cause stomach
irritation, nausea, vomiting, and diarrhoea (ATSDR, 2004). Fluoride is also a natural mineral with
beneficial effects on teeth at low concentrations in drinking water, but excessive exposure to fluoride
in drinking water can give rise to a number of adverse effects, such as mild dental fluorosis and
crippling skeletal fluorosis, as the level and period of exposure increases (Fawell et al., 2006).
© Central University of Technology, Free State
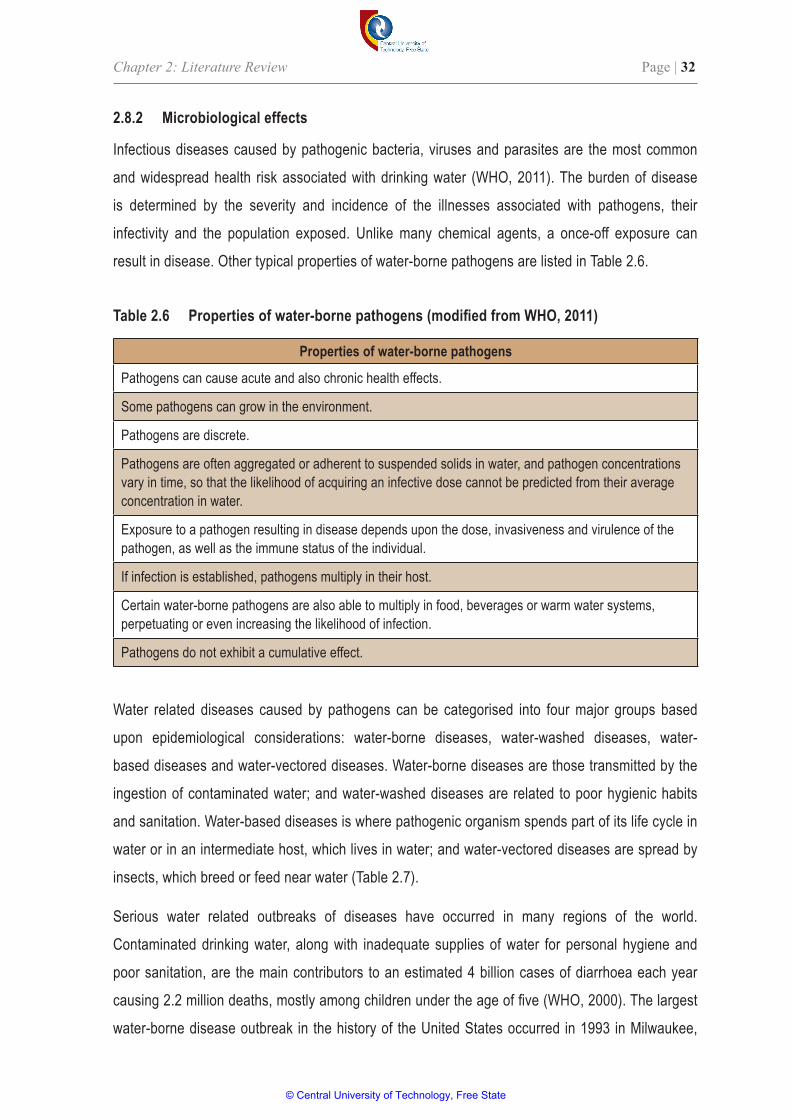
Chapter 2: Literature Review Page | 32
2.8.2 Microbiological effects
Infectious diseases caused by pathogenic bacteria, viruses and parasites are the most common
and widespread health risk associated with drinking water (WHO, 2011). The burden of disease
is determined by the severity and incidence of the illnesses associated with pathogens, their
infectivity and the population exposed. Unlike many chemical agents, a once-off exposure can
result in disease. Other typical properties of water-borne pathogens are listed in Table 2.6.
Table2.6 Propertiesofwater-bornepathogens(modifiedfromWHO,2011)
Properties of water-borne pathogens
Pathogens can cause acute and also chronic health effects.
Some pathogens can grow in the environment.
Pathogens are discrete.
Pathogens are often aggregated or adherent to suspended solids in water, and pathogen concentrations vary in time, so that the likelihood of acquiring an infective dose cannot be predicted from their average concentration in water.
Exposure to a pathogen resulting in disease depends upon the dose, invasiveness and virulence of the pathogen, as well as the immune status of the individual.
If infection is established, pathogens multiply in their host.
Certain water-borne pathogens are also able to multiply in food, beverages or warm water systems, perpetuating or even increasing the likelihood of infection.
Pathogens do not exhibit a cumulative effect.
Water related diseases caused by pathogens can be categorised into four major groups based
upon epidemiological considerations: water-borne diseases, water-washed diseases, water-
based diseases and water-vectored diseases. Water-borne diseases are those transmitted by the
ingestion of contaminated water; and water-washed diseases are related to poor hygienic habits
and sanitation. Water-based diseases is where pathogenic organism spends part of its life cycle in
water or in an intermediate host, which lives in water; and water-vectored diseases are spread by
insects, which breed or feed near water (Table 2.7).
Serious water related outbreaks of diseases have occurred in many regions of the world.
Contaminated drinking water, along with inadequate supplies of water for personal hygiene and
poor sanitation, are the main contributors to an estimated 4 billion cases of diarrhoea each year
causing 2.2 million deaths, mostly among children under the age of five (WHO, 2000). The largest
water-borne disease outbreak in the history of the United States occurred in 1993 in Milwaukee,
© Central University of Technology, Free State
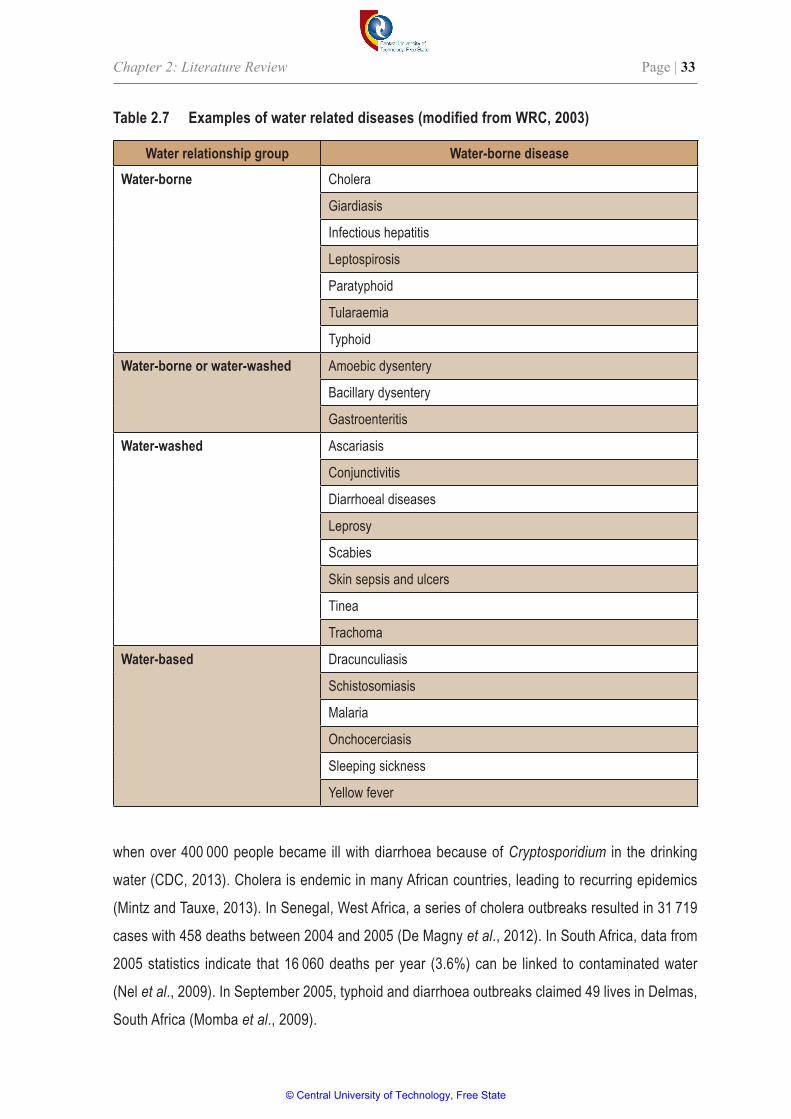
Chapter 2: Literature Review Page | 33
when over 400 000 people became ill with diarrhoea because of Cryptosporidium in the drinking
water (CDC, 2013). Cholera is endemic in many African countries, leading to recurring epidemics
(Mintz and Tauxe, 2013). In Senegal, West Africa, a series of cholera outbreaks resulted in 31 719
cases with 458 deaths between 2004 and 2005 (De Magny et al., 2012). In South Africa, data from
2005 statistics indicate that 16 060 deaths per year (3.6%) can be linked to contaminated water
(Nel et al., 2009). In September 2005, typhoid and diarrhoea outbreaks claimed 49 lives in Delmas,
South Africa (Momba et al., 2009).
Table2.7 Examplesofwaterrelateddiseases(modifiedfromWRC,2003)
Water relationship group Water-borne diseaseWater-borne Cholera
Giardiasis
Infectious hepatitis
Leptospirosis
Paratyphoid
Tularaemia
Typhoid
Water-borne or water-washed Amoebic dysentery
Bacillary dysentery
Gastroenteritis
Water-washed Ascariasis
Conjunctivitis
Diarrhoeal diseases
Leprosy
Scabies
Skin sepsis and ulcers
Tinea
Trachoma
Water-based Dracunculiasis
Schistosomiasis
Malaria
Onchocerciasis
Sleeping sickness
Yellow fever
© Central University of Technology, Free State
Chapter 2: Literature Review Page | 34
“Disinfection will remain the major technique of ensuring drinking water is free from water-
borne microorganisms, but it must be seen as part of a larger integrated approach to water
resource protection which will become increasingly difficult as global warming continues to
create uncertainties in our climate” (Gray, 2014).
© Central University of Technology, Free State
Chapter 3: Materials and Methods Page | 35
Chapter 3 Materials and Methods
3.1 Study area
The Free State is the third largest province in South Africa, with an area of approximately 129 825 km 2
(Gandure et al., 2013). The Free State province has an estimated population of 2.7 million and is
estimated to grow at an growth rate of approximately 0.23% (FDC, 2014). The Motheo district
municipality has the largest share of the province’s population (FDC, 2014). Farming dominates the
Free State’s landscape with 3.2 million hectares of cultivated land, natural veld and grazing land.
Agriculture can thus been seen as a key role-player in the province’s economy. Agricultural produce
includes, among others, maize, wheat, potatoes, sunflower, red meat, vegetables, cherries and
dairy (FDC, 2014). Industrial development, agricultural activities and population growth are driving
the increase water demand of the province (Woyessa et al., 2006).
The area is dry and has a typical Highveld climate with warm summers, low summer rainfall and
cold winters. The calculated mean annual rainfall for the region is 545 mm and, because of the
typical climatic conditions, the region is described as a semi-arid area (Akwensioge, 2012). High
intensity thunderstorms in the summer months promote run-off in this region (Woyessa et al., 2006).
The topography is diverse with lower altitudes in the southern and western parts and relatively high
altitudes in the northeast and eastern parts of the province (Mokhele and Walker, 2012).
The Free State is located within the Karoo Super Group with most of the province composed
of subdivided Ecca and Beaufort Groups. These groups are dominated by sedimentary rocks
including sandstone, shale and mudstone (DWA 2012). The Beaufort Group is mainly characterised
by sedimentary rocks deposited from the Middle Permian to the Middle Triassic Period. The
Reddersburg area consists of sandstone, shale and mudstone deposited during the middle stage
of the Beaufort Group, whilst the Dewetsdorp and Thaba 'Nchu areas consist of purple and green
shale, and sandstone deposited during the upper stage. Geology around Bloemfontein includes
sandstone, shale and mudstone of the lower stage of the Beaufort Group. An intensive array of
dolerite dykes and sills can be found in Reddersburg, Dewetsdorp and Thaba 'Nchu, as well as
the area to the northwest of Bloemfontein (DWA, 2012). During formation, extremely hot dolerite
intruded into the sedimentary host rock, resulting in a baked contact zone. These baked zones
are fractured and groundwater accumulates in these areas, making these zones the main target
© Central University of Technology, Free State
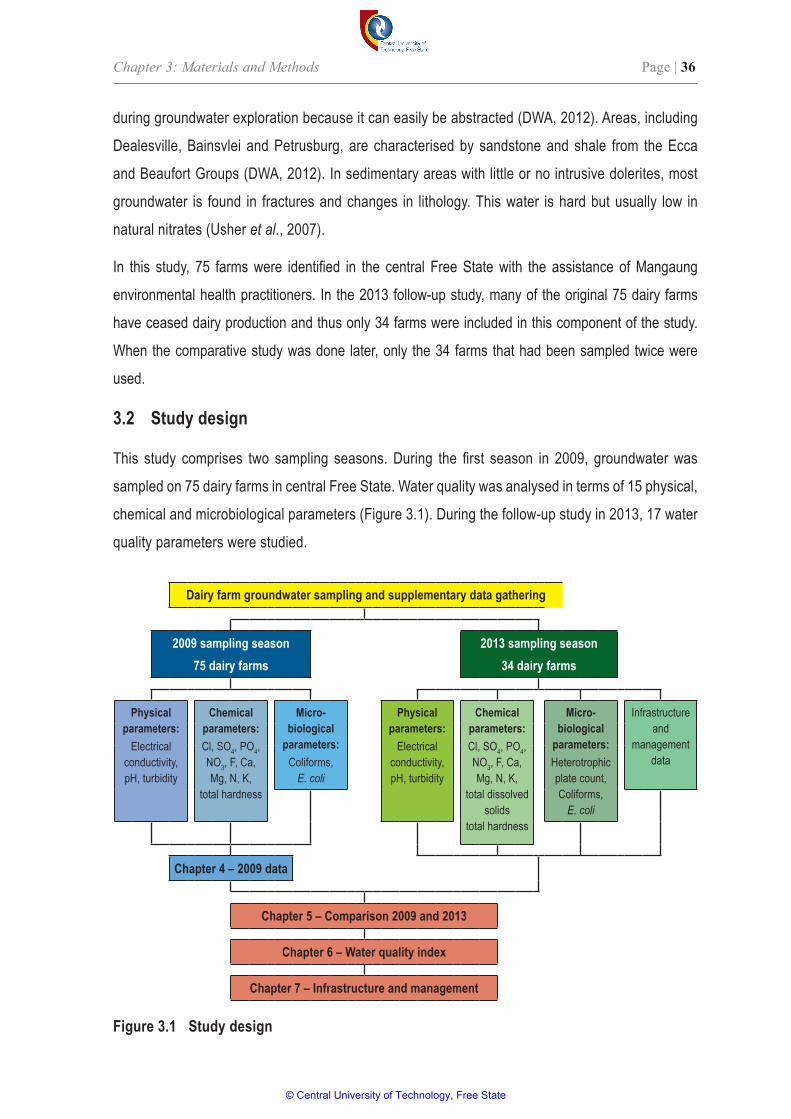
Chapter 3: Materials and Methods Page | 36
during groundwater exploration because it can easily be abstracted (DWA, 2012). Areas, including
Dealesville, Bainsvlei and Petrusburg, are characterised by sandstone and shale from the Ecca
and Beaufort Groups (DWA, 2012). In sedimentary areas with little or no intrusive dolerites, most
groundwater is found in fractures and changes in lithology. This water is hard but usually low in
natural nitrates (Usher et al., 2007).
In this study, 75 farms were identified in the central Free State with the assistance of Mangaung
environmental health practitioners. In the 2013 follow-up study, many of the original 75 dairy farms
have ceased dairy production and thus only 34 farms were included in this component of the study.
When the comparative study was done later, only the 34 farms that had been sampled twice were
used.
3.2 Study design
This study comprises two sampling seasons. During the first season in 2009, groundwater was
sampled on 75 dairy farms in central Free State. Water quality was analysed in terms of 15 physical,
chemical and microbiological parameters (Figure 3.1). During the follow-up study in 2013, 17 water
quality parameters were studied.
Dairy farm groundwater sampling and supplementary data gathering
2009 sampling season75 dairy farms
2013 sampling season34 dairy farms
Physical parameters:
Electrical conductivity,pH, turbidity
Chemical parameters:Cl, SO 4 , PO 4 , NO 3 , F, Ca, Mg, N, K,
total hardness
Micro-biological
parameters:Coliforms,
E. coli
Physical parameters:
Electrical conductivity,pH, turbidity
Chemical parameters:Cl, SO 4 , PO 4 , NO 3 , F, Ca, Mg, N, K,
total dissolved solids
total hardness
Micro-biological
parameters:Heterotrophic plate count, Coliforms,
E. coli
Infrastructure and
management data
Chapter 4 – 2009 data
Chapter 5 – Comparison 2009 and 2013
Chapter 6 – Water quality index
Chapter 7 – Infrastructure and management
Figure 3.1 Study design
© Central University of Technology, Free State
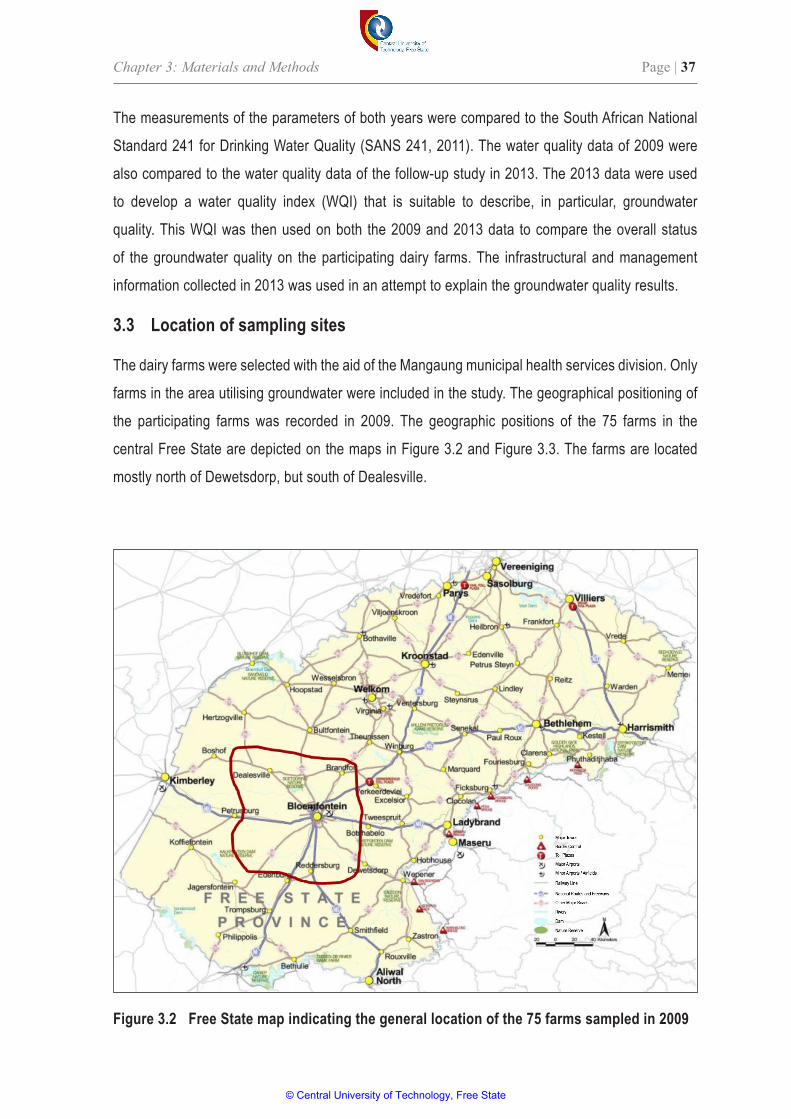
Chapter 3: Materials and Methods Page | 37
The measurements of the parameters of both years were compared to the South African National
Standard 241 for Drinking Water Quality (SANS 241, 2011). The water quality data of 2009 were
also compared to the water quality data of the follow-up study in 2013. The 2013 data were used
to develop a water quality index (WQI) that is suitable to describe, in particular, groundwater
quality. This WQI was then used on both the 2009 and 2013 data to compare the overall status
of the groundwater quality on the participating dairy farms. The infrastructural and management
information collected in 2013 was used in an attempt to explain the groundwater quality results.
3.3 Location of sampling sites
The dairy farms were selected with the aid of the Mangaung municipal health services division. Only
farms in the area utilising groundwater were included in the study. The geographical positioning of
the participating farms was recorded in 2009. The geographic positions of the 75 farms in the
central Free State are depicted on the maps in Figure 3.2 and Figure 3.3. The farms are located
mostly north of Dewetsdorp, but south of Dealesville.
Figure 3.2 Free State map indicating the general location of the 75 farms sampled in 2009
© Central University of Technology, Free State
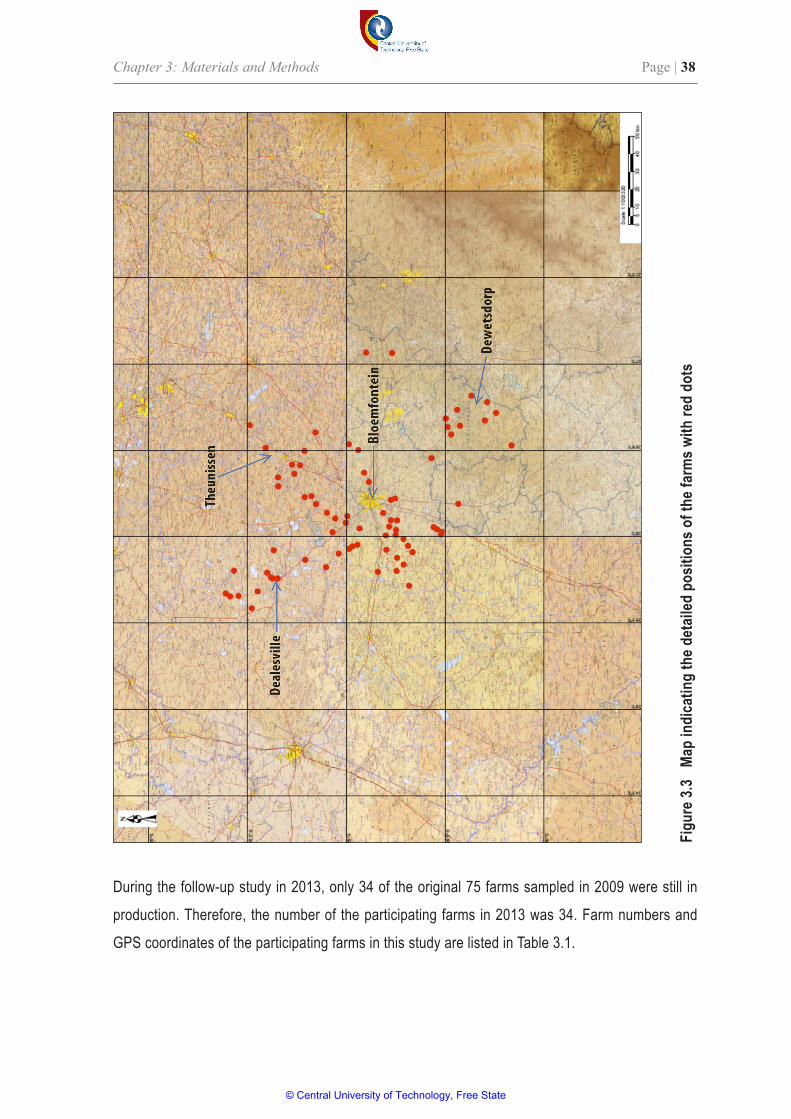
Chapter 3: Materials and Methods Page | 38
Figu
re 3.
3 Ma
p in
dica
ting
the d
etail
ed p
ositi
ons o
f the
farm
s with
red
dots
During the follow-up study in 2013, only 34 of the original 75 farms sampled in 2009 were still in
production. Therefore, the number of the participating farms in 2013 was 34. Farm numbers and
GPS coordinates of the participating farms in this study are listed in Table 3.1.
© Central University of Technology, Free State
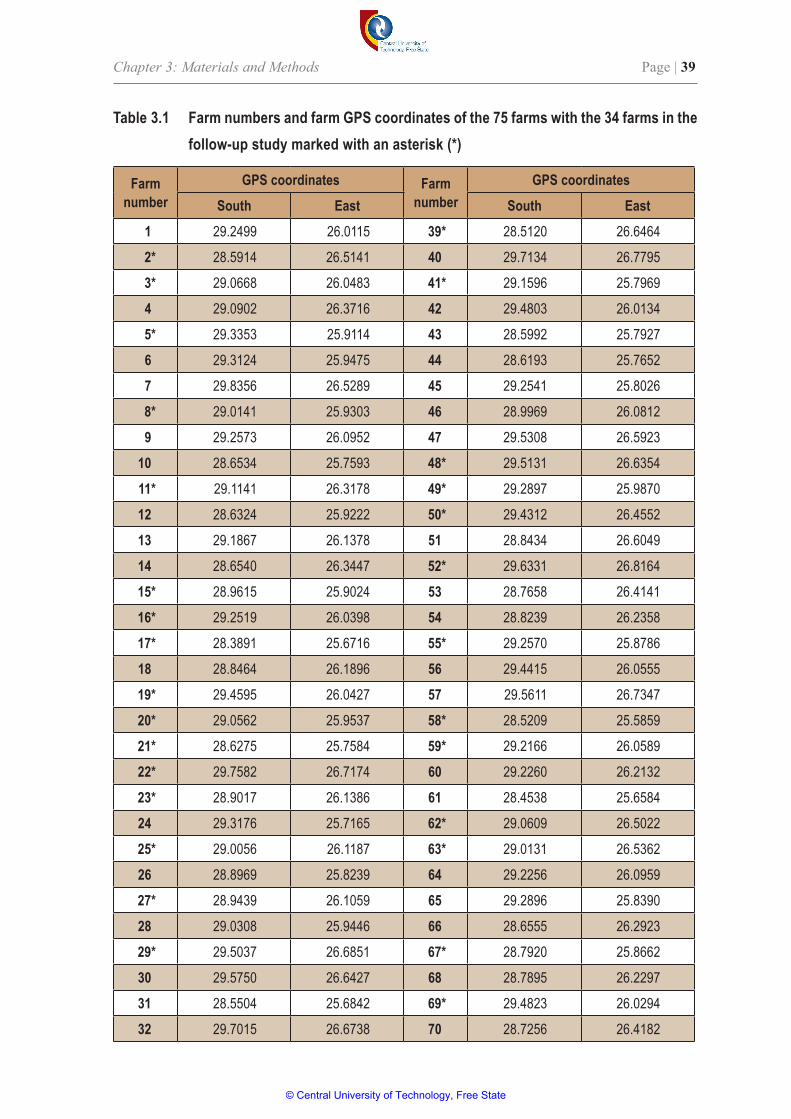
Chapter 3: Materials and Methods Page | 39
Table 3.1 Farm numbers and farm GPS coordinates of the 75 farms with the 34 farms in the follow-up study marked with an asterisk (*)
Farm number
GPS coordinates Farm number
GPS coordinatesSouth East South East
1 29.2499 26.0115 39* 28.5120 26.6464
2* 28.5914 26.5141 40 29.7134 26.7795
3* 29.0668 26.0483 41* 29.1596 25.7969
4 29.0902 26.3716 42 29.4803 26.0134
5* 29.3353 25.9114 43 28.5992 25.7927
6 29.3124 25.9475 44 28.6193 25.7652
7 29.8356 26.5289 45 29.2541 25.8026
8* 29.0141 25.9303 46 28.9969 26.0812
9 29.2573 26.0952 47 29.5308 26.5923
10 28.6534 25.7593 48* 29.5131 26.6354
11* 29.1141 26.3178 49* 29.2897 25.9870
12 28.6324 25.9222 50* 29.4312 26.4552
13 29.1867 26.1378 51 28.8434 26.6049
14 28.6540 26.3447 52* 29.6331 26.8164
15* 28.9615 25.9024 53 28.7658 26.4141
16* 29.2519 26.0398 54 28.8239 26.2358
17* 28.3891 25.6716 55* 29.2570 25.8786
18 28.8464 26.1896 56 29.4415 26.0555
19* 29.4595 26.0427 57 29.5611 26.7347
20* 29.0562 25.9537 58* 28.5209 25.5859
21* 28.6275 25.7584 59* 29.2166 26.0589
22* 29.7582 26.7174 60 29.2260 26.2132
23* 28.9017 26.1386 61 28.4538 25.6584
24 29.3176 25.7165 62* 29.0609 26.5022
25* 29.0056 26.1187 63* 29.0131 26.5362
26 28.8969 25.8239 64 29.2256 26.0959
27* 28.9439 26.1059 65 29.2896 25.8390
28 29.0308 25.9446 66 28.6555 26.2923
29* 29.5037 26.6851 67* 28.7920 25.8662
30 29.5750 26.6427 68 28.7895 26.2297
31 28.5504 25.6842 69* 29.4823 26.0294
32 29.7015 26.6738 70 28.7256 26.4182
© Central University of Technology, Free State
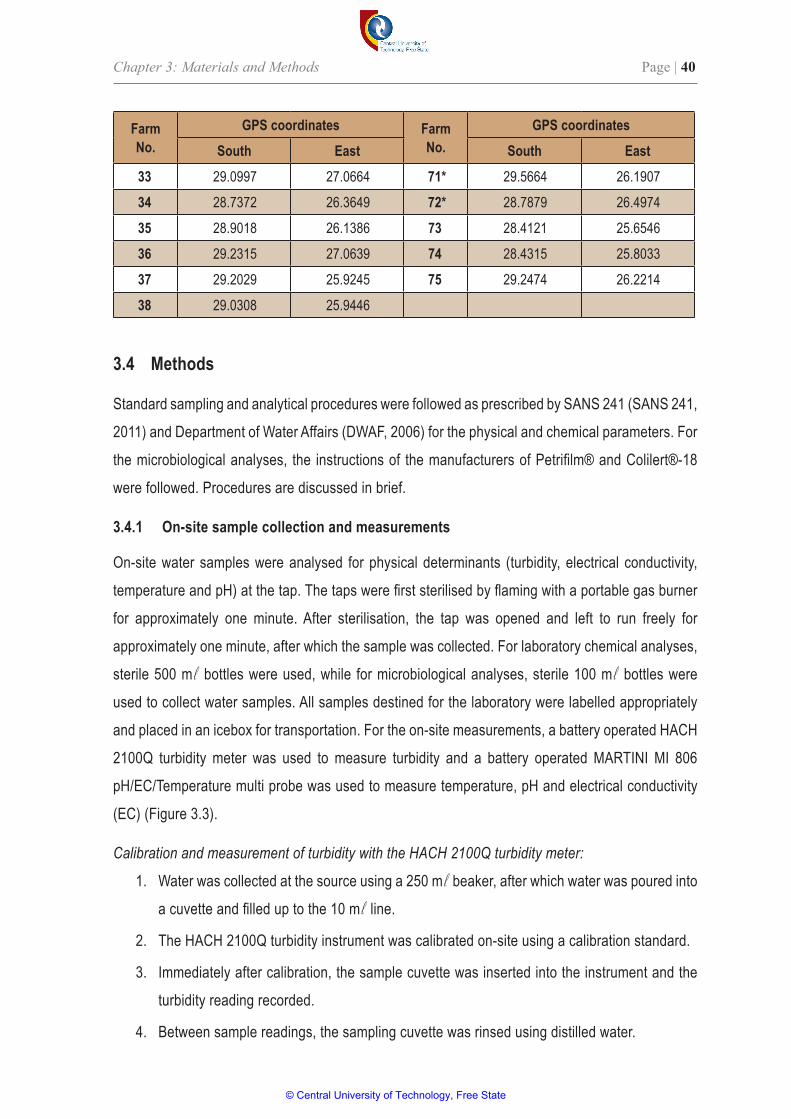
Chapter 3: Materials and Methods Page | 40
3.4 Methods
Standard sampling and analytical procedures were followed as prescribed by SANS 241 (SANS 241,
2011) and Department of Water Affairs (DWAF, 2006) for the physical and chemical parameters. For
the microbiological analyses, the instructions of the manufacturers of Petrifilm® and Colilert®-18
were followed. Procedures are discussed in brief.
3.4.1 On-site sample collection and measurements
On-site water samples were analysed for physical determinants (turbidity, electrical conductivity,
temperature and pH) at the tap. The taps were first sterilised by flaming with a portable gas burner
for approximately one minute. After sterilisation, the tap was opened and left to run freely for
approximately one minute, after which the sample was collected. For laboratory chemical analyses,
sterile 500 m l bottles were used, while for microbiological analyses, sterile 100 m l bottles were
used to collect water samples. All samples destined for the laboratory were labelled appropriately
and placed in an icebox for transportation. For the on-site measurements, a battery operated HACH
2100Q turbidity meter was used to measure turbidity and a battery operated MARTINI MI 806
pH/EC/Temperature multi probe was used to measure temperature, pH and electrical conductivity
(EC) (Figure 3.3).
Calibration and measurement of turbidity with the HACH 2100Q turbidity meter:
1. Water was collected at the source using a 250 m l beaker, after which water was poured into
a cuvette and filled up to the 10 m l line.
2. The HACH 2100Q turbidity instrument was calibrated on-site using a calibration standard.
3. Immediately after calibration, the sample cuvette was inserted into the instrument and the
turbidity reading recorded.
4. Between sample readings, the sampling cuvette was rinsed using distilled water.
Farm No.
GPS coordinates Farm No.
GPS coordinatesSouth East South East
33 29.0997 27.0664 71* 29.5664 26.1907
34 28.7372 26.3649 72* 28.7879 26.4974
35 28.9018 26.1386 73 28.4121 25.6546
36 29.2315 27.0639 74 28.4315 25.8033
37 29.2029 25.9245 75 29.2474 26.2214
38 29.0308 25.9446
© Central University of Technology, Free State
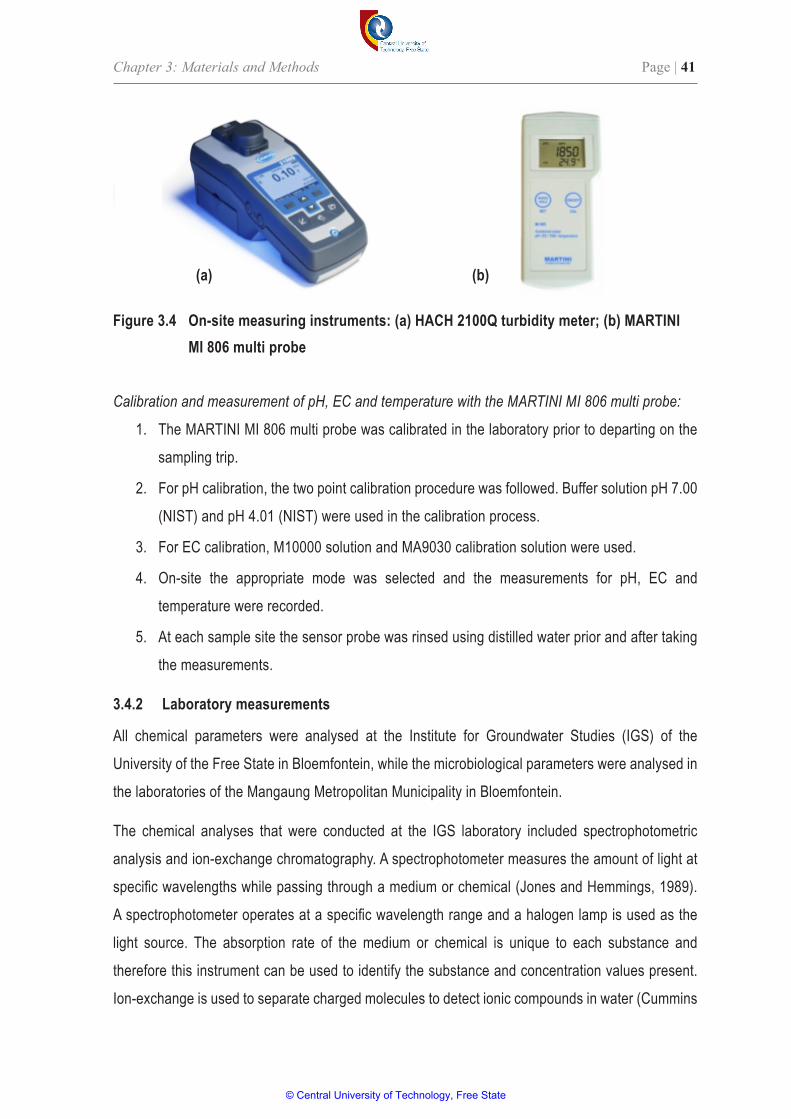
Chapter 3: Materials and Methods Page | 41
Calibration and measurement of pH, EC and temperature with the MARTINI MI 806 multi probe:
1. The MARTINI MI 806 multi probe was calibrated in the laboratory prior to departing on the
sampling trip.
2. For pH calibration, the two point calibration procedure was followed. Buffer solution pH 7.00
(NIST) and pH 4.01 (NIST) were used in the calibration process.
3. For EC calibration, M10000 solution and MA9030 calibration solution were used.
4. On-site the appropriate mode was selected and the measurements for pH, EC and
temperature were recorded.
5. At each sample site the sensor probe was rinsed using distilled water prior and after taking
the measurements.
3.4.2 Laboratory measurements
All chemical parameters were analysed at the Institute for Groundwater Studies (IGS) of the
University of the Free State in Bloemfontein, while the microbiological parameters were analysed in
the laboratories of the Mangaung Metropolitan Municipality in Bloemfontein.
The chemical analyses that were conducted at the IGS laboratory included spectrophotometric
analysis and ion-exchange chromatography. A spectrophotometer measures the amount of light at
specific wavelengths while passing through a medium or chemical (Jones and Hemmings, 1989).
A spectrophotometer operates at a specific wavelength range and a halogen lamp is used as the
light source. The absorption rate of the medium or chemical is unique to each substance and
therefore this instrument can be used to identify the substance and concentration values present.
Ion-exchange is used to separate charged molecules to detect ionic compounds in water (Cummins
(a) (b)
Figure 3.4 On-site measuring instruments: (a) HACH 2100Q turbidity meter; (b) MARTINI MI 806 multi probe
© Central University of Technology, Free State
Chapter 3: Materials and Methods Page | 42
et al., 2011). The IGS laboratory is not currently accredited but they do take part in proficiency
testing as part of their internal quality control.
Measurement of coliforms and E. coli using the IDEXX (Colilert18) Quanti-Tray™ method:
The IDEXX (Colilert18) Quanti-Tray™ method is a biotechnological detection approach, which
uses the multi-well most probable number (MPN) method. It incorporates a defined substrate
medium, which contains θ-nitrophenyl-β-D-galactopyranoside (ONPG) and 4-methylumbelliferyl-
β-D-glucuronide (MUG). After incubation at 37°C for 18 to 22 hours, coliform bacteria produce a
yellow colour due to the production of β-galactosidase and E. coli produces blue fluorescence as a
result of the action of β-glucuronidase under UV light (HPA, 2004). The MPN is calculated from the
number of positive wells.
1. A Colilert 18 medium was added to the 100 m l water sample, gently shaken then left to
stand for a few minutes allowing the medium to dissolve.
2. The 100 m l medium containing water sample was then poured into the Quanti-Tray®/2000,
sealed and incubated for 18 to 22 hours at 37°C.
3. After incubation, the number of yellow wells was counted and MPN tables used to quantify
coliforms.
4. After exposing the Quanti-Tray®/2000 to UV light, the blue fluorescent wells were counted
and MPN tables used to quantify E. coli.
Measurement of total aerobic count using the Petrifilm® method:
The Petrifilm® method is used to enumerate total aerobic bacteria. Each plate contains nutrients;
a coloured dye called triphenyl tetrazoliumchloride, which colours bacterial colonies red, and a
cold water soluble gelling agent (Petrifilm™, 1989). The indicator dye and built-in grid allows for
fast accurate identification of colonies within 48 hours. For each water sample, two aerobic plate
counts were performed using the Petrifilm Aerobic Count plate method. One plate was used on an
undiluted sample and the other on a 10 × dilution:
1. A Petrifilm Aerobic Count plate was placed on a flat surface.
2. The top film of the plate was lifted, after which a pipette was used to carefully dispense 1 m l
of sample onto the centre of the bottom film.
3. The top film was then placed onto the sample.
4. The sample was then distributed evenly with a spreader using a gentle downward pressure
and left undisturbed for approximately one minute to permit solidification of the gel.
© Central University of Technology, Free State
Chapter 3: Materials and Methods Page | 43
5. Plates were then incubated in a horizontal position at 37°C for 48 + 3 hour, after which all
red dots, regardless of size or intensity, were counted as colonies using a standard colony
counter.
© Central University of Technology, Free State
Chapter 4: Groundwater Quality 2009 Page | 44
Chapter 4 Groundwater Quality on Dairy Farms Sampled in 2009
4.1 Introduction
An adequate supply of safe drinking water is one of the critical prerequisites for a healthy life.
People’s lives and livelihoods depend on water. Water of good quality and quantity is paramount
to sustain life. The demand for clean water increases continuously with population growth. Many
areas of the world lack fresh, drinkable water essential to the survival of humankind. It has now
become evident that groundwater is one of the most valuable natural resources, which supports
human health, economic development and ecological diversity (Ahmed, 2010).
Groundwater is an essential water resource for rural communities, providing for domestic, agricultural
and industrial needs. It is estimated that groundwater provides 15% of all available water in South
Africa (Mpenyana-Monyatsi et al., 2012). Groundwater is defined as the water that percolates into
the ground and accumulates in both unconsolidated sediments and hard rock formations (aquifers)
(Harter et al., 2002). Most groundwater occurs in the folded zones of the African platform (Xu and
Usher, 2006). Groundwater sources include springs, wells and boreholes (Harter, 2001).
The lack of information on the groundwater quality in South Africa, as well as the geohydrological
information, is well documented (DWAF, 2000; Knüppe, 2011; Pietersen et al., 2012; Owen, 2011).
The situation in the Free State province is not different from the rest of the country (DWA, 2012).
The quality of groundwater on farms is infrequently sampled, which results in the usage being of an
unknown quality.
Globally, the dairy industry is expanding rapidly and the consequential impact on water quality has
only recently been identified and studied. Effects of liquid waste, nitrates and pathogens from dairy
activities on the environment and human health, have been investigated. These water constituents
have all indicated elevated levels and a possible health impact to consumers (Chomycia et al.,
2008). Dairy farming activities and waste have been identified as significant sources of domestic
groundwater contamination (Van der Schans et al., 2009).
Dairy farms are inspected by environmental health practitioners (EHP) during health and hygiene
inspections. Water samples from dairy farms are occasionally sampled for microbiological analyses
© Central University of Technology, Free State
Chapter 4: Groundwater Quality 2009 Page | 45
by the EHP or the milk buyer. The sampling schedule is annually or as permitted by a particular
municipal budget. Poor record-keeping, lack of data and infrequent sampling leaves the farming
community, especially the infants, elderly and immune compromised, vulnerable to potential health
impacts from poor water quality.
The data collected during 2009 was used to describe the quality of groundwater on 75 dairy farms.
An article composed of this work was published in 2012 by Esterhuizen et al., (2012). “Dairy farm
borehole water quality in the greater Mangaung region of the Free State, South Africa”. Water SA.
Vol 38 (5): 803-806. A copy of this article is presented in this chapter. These data were also used
to produce a peer reviewed conference paper that was delivered at the WISA 2012 conference in
Cape Town by Esterhuizen et al., 2012: “Pollution index for dairy farm borehole water quality in the
Free State, South Africa”. This conference paper is included as Appendix A.
4.2 Article
Abstract
Most dairy farm effluent is discharged onto pastures and land by irrigation and poses a risk on
enriching groundwater, including borehole drinking water. Nitrate, coliforms and Escherichia coli
(E. coli), in particular, may cause disease in humans and animals when drinking contaminated
water. The aim of this study was to obtain an understanding of the status of borehole drinking water
quality, including physical, chemical and microbiological properties, on 75 dairy farms in the greater
Mangaung region of the Free State, South Africa. Borehole drinking water samples were collected
during autumn and spring of 2009 and the physical, chemical and microbiological parameters
analysed and compared to the required standards of South African National Standards 241 of 2006.
Most farms were compliant; however for combined nitrate and nitrite,N, 37 of the farms exceeded
the prescribed limit. Similarly, for total coliforms, 45 and for E. coli, 22 of the farms exceeded the
acceptable limit. Nine of the farm boreholes were contaminated by N and E. coli. On one farm,
the bacteriological parameters and four of the chemical parameters exceeded limits. Two farms
presented similar chemical data, except for the E. coli being compliant. These data suggest further
studies into water and waste management on dairy farms in the Mangaung region of the Free State.
Keywords: water quality; borehole drinking water; water standards; E. coli; coliforms; nitrate
Introduction
Dairy farming is a major contributor in the agricultural sector of South Africa, making a significant
contribution to the economic development and sustainability of the country. Farm configurations
© Central University of Technology, Free State
Chapter 4: Groundwater Quality 2009 Page | 46
are diverse; from small enterprises with a few milk producing cows to large industrialised farms
consisting of more than a thousand cows.
All dairy enterprises utilise water for all the steps of the dairy industry, including cleaning,
sanitisation, heating, cooling and floor washing. Dairy wastewater, or dairy effluent, is characterised
by physical, chemical and microbiological parameters (Danalewich et al., 1998). In particular, it is
known to have high biochemical and chemical oxygen demand; high levels of total dissolved solids,
including fats, oils and grease; and nutrients, such as ammonia phosphates. As such, it must be
treated (stabilised) appropriately before being discharged into the aquatic environment or re-used
by disposal to land.
Faecally derived pathogens, such as the Escherichia coli (E. coli) strain O157:H7, can impact water
quality and also human health, especially when the water is consumed without prior treatment
(Oliver et al., 2009). It is well-known that surface run-off from land during excessive periods of
rainfall or discharge from dairy farms, can pollute groundwater drinking water sources and have a
significant adverse environmental impact on receiving surface waters (Atalay et al., 2008; Kay et al.,
2008; Van der Schans et al., 2009). The harmful effect of agricultural activities on groundwater
and surface water (Monaghan et al., 2009) is becoming more of a concern worldwide (Santhi et
al., 2006). For example, elevated concentrations of ammoniacal nitrogen and phosphate found in
receiving watercourses from farm effluent, are harmful to both farm animals and the indigenous
wildlife, if used as drinking water sources and the aquatic micro- and macro-fauna within such
water bodies. Equally of concern is the potential for groundwater sources to become contaminated,
such as water is consumed as drinking water often without any further treatment. Therefore, it is
important that farm effluent is adequately treated and stabilised before being allowed to discharge
into water or disposed of onto land (Wilcock et al., 1999).
South Africa is a water-scarce country and the central region, which includes the Free State, is an
arid area. In the Mangaung area of the Free State, surface water is limited to a few seasonal streams
and the low flowing Modder River. The majority of dairy farms in this area are not close to any surface
water sources and utilise groundwater (borehole water) for all dairy activities and for drinking water.
Groundwater is the main source of potable water for the majority of rural and farming communities in
South Africa. These communities often have no other available water source (Van Tonder, 2009). A
study on the handling practices of dairy effluent in South Africa by Strydom et al. (1993) showed that
most farm effluent was discharged onto pastures and land by irrigation. With the increasing growth
of the dairy industry, together with the risk posed by dairy effluent, there is no doubt that measures to
© Central University of Technology, Free State
Chapter 4: Groundwater Quality 2009 Page | 47
protect groundwater sources should be instituted. However, information about the impact of the dairy
effluent on groundwater is limited (Harter et al., 2002), particularly so in South Africa.
The aim of this study was to obtain an understanding of the status of borehole drinking water quality,
including physical, chemical and microbiological properties, on 75 dairy farms in the Mangaung
region of the Free State, South Africa.
Materials and Methods
One borehole water sample was collected from 75 farms in the greater Mangaung region during
autumn and spring of 2009. This central region of the Free State covers a surface area of 6 263 km 2
and hosts approximately 850 000 people. Samples were collected using the prescribed sampling
methods of the Department of Water Affairs (DWAF, 2006), and standard sampling and analytical
procedures as prescribed by South African National Standards (SANS) 241 of 2006. Fourteen
parameters were analysed, namely, pH, electrical conductivity, total hardness ( CaCO 3 ), chloride (Cl),
sulphate ( SO 4 ), phosphate ( PO 4 ), combined nitrate and nitrate (N O 3 ), fluoride (F), calcium (Ca),
magnesium (Mg), sodium (Na), potassium (K), E. coli and total coliforms.
Summary statistics were calculated for the different parameters and correlations established
between N and E. coli concentrations, N O 3 and coliform bacteria, as well as between coliform and
E. coli concentrations. A water quality index (WQI) was calculated for each borehole to summarise
the borehole water quality data. The WQI formula was devised by the Canadian Council of Ministers
of the Environment (Saffran et al., 2001). The WQI were used to rank the boreholes according to
excellent (values 95 – 100), good (values 80 – 94), fair (values 65 – 79), marginal (values 45 – 64)
and poor (values 0 – 44).
Results
Generally, the physical and chemical properties of the borehole water of the 75 farms were within
the prescribed SANS 241 (2006) limits, except for NO 3 (Table 4.1). The 10 mg/ l limit for N was
exceeded by 49.3% of the farm boreholes, also demonstrated by the mean value, as well as the
median value, being greater than the SANS 241 (2006) limit. When the N concentrations were
compared to WHO (2008) standards, only two farms exceeded the limit of 50 mg/ l with values of
65.05 and 68.00.
Boreholes on 22 farms (29.3%) were found to be contaminated with E. coli, while more than half
(60%) of the boreholes exceeded the prescribed SANS 241 (2006) and WHO (2008) limits for total
coliform bacteria (<10 cfu/100 m l) and E. coli (0 cfu/100 m l), collectively (Table 4.2).
© Central University of Technology, Free State
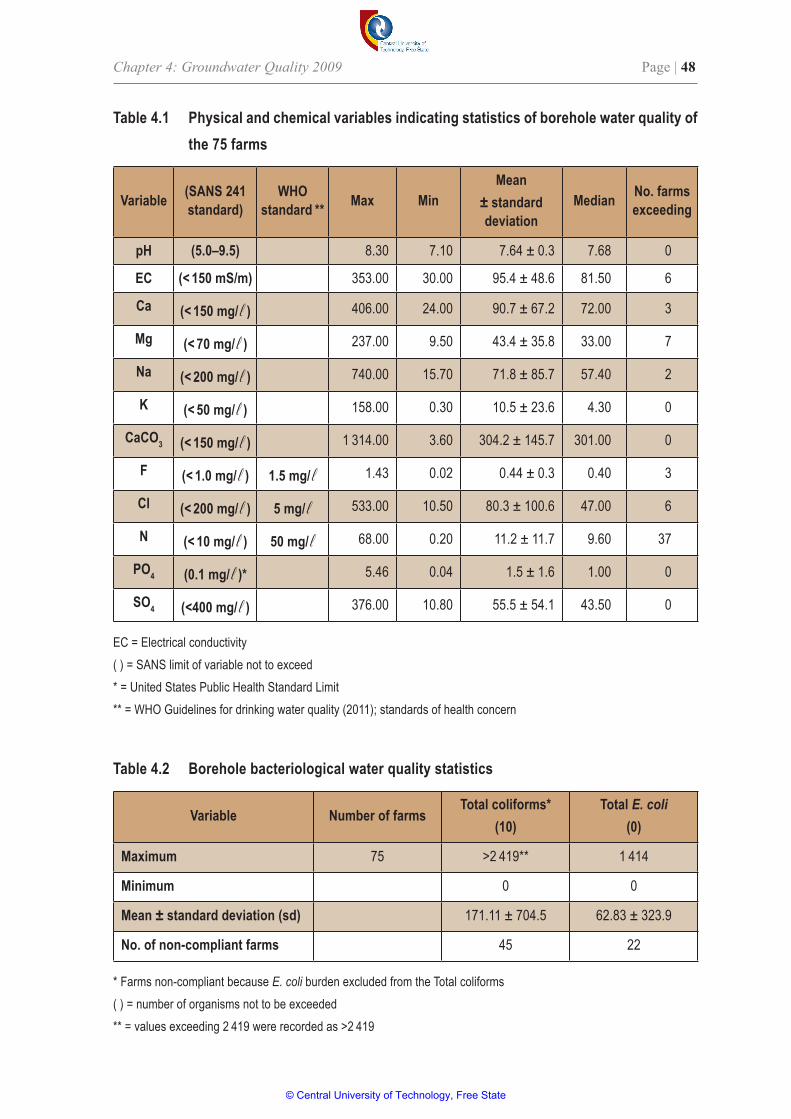
Chapter 4: Groundwater Quality 2009 Page | 48
Table 4.1 Physical and chemical variables indicating statistics of borehole water quality of the 75 farms
Variable (SANS 241 standard)
WHO standard ** Max Min
Mean± standard deviation
Median No. farms exceeding
pH (5.0–9.5) 8.30 7.10 7.64 ± 0.3 7.68 0
EC (< 150 mS/m) 353.00 30.00 95.4 ± 48.6 81.50 6
Ca (< 150 mg/ l ) 406.00 24.00 90.7 ± 67.2 72.00 3
Mg (< 70 mg/ l ) 237.00 9.50 43.4 ± 35.8 33.00 7
Na (< 200 mg/ l ) 740.00 15.70 71.8 ± 85.7 57.40 2
K (< 50 mg/ l ) 158.00 0.30 10.5 ± 23.6 4.30 0
CaC O 3 (< 150 mg/ l ) 1 314.00 3.60 304.2 ± 145.7 301.00 0
F (< 1.0 mg/ l ) 1.5 mg/ l 1.43 0.02 0.44 ± 0.3 0.40 3
Cl (< 200 mg/ l ) 5 mg/ l 533.00 10.50 80.3 ± 100.6 47.00 6
N (< 10 mg/ l ) 50 mg/ l 68.00 0.20 11.2 ± 11.7 9.60 37
PO 4 (0.1 mg/ l )* 5.46 0.04 1.5 ± 1.6 1.00 0
SO 4 (<400 mg/ l ) 376.00 10.80 55.5 ± 54.1 43.50 0
EC = Electrical conductivity( ) = SANS limit of variable not to exceed* = United States Public Health Standard Limit** = WHO Guidelines for drinking water quality (2011); standards of health concern
Table 4.2 Borehole bacteriological water quality statistics
Variable Number of farmsTotal coliforms*
(10)Total E. coli
(0)
Maximum 75 >2 419** 1 414
Minimum 0 0
Mean ± standard deviation (sd) 171.11 ± 704.5 62.83 ± 323.9
No. of non-compliant farms 45 22
* Farms non-compliant because E. coli burden excluded from the Total coliforms( ) = number of organisms not to be exceeded** = values exceeding 2 419 were recorded as >2 419
© Central University of Technology, Free State
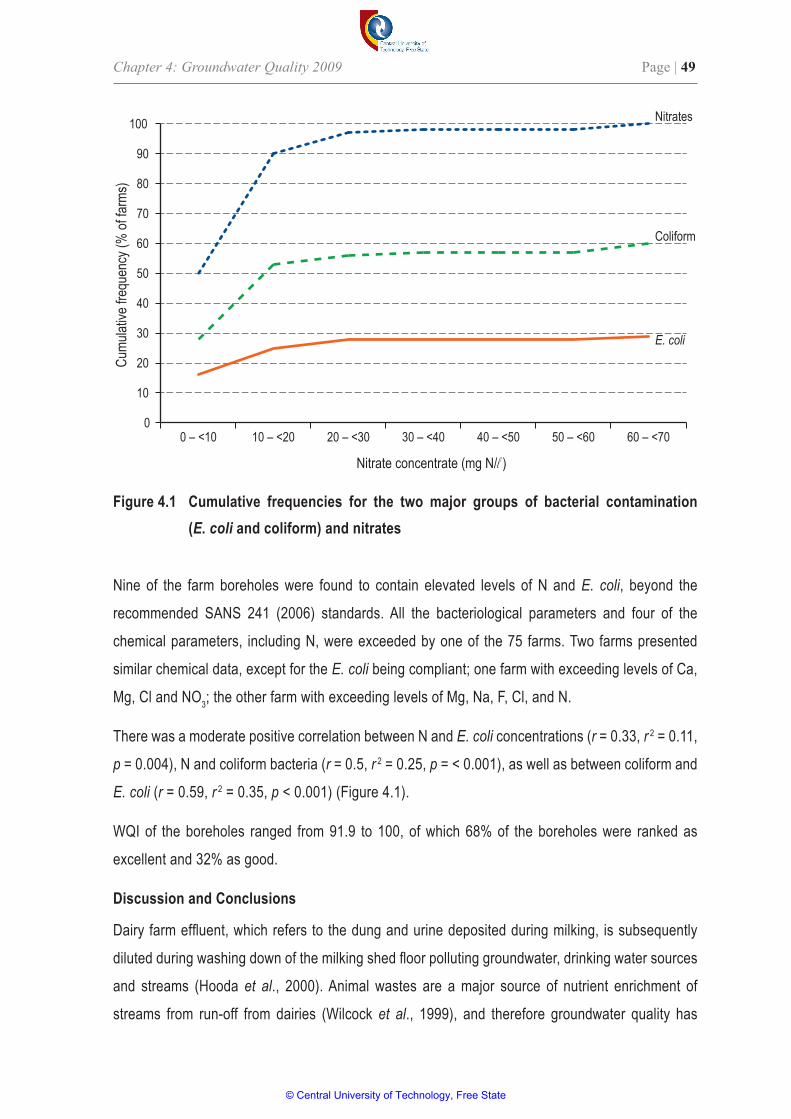
Chapter 4: Groundwater Quality 2009 Page | 49
Nine of the farm boreholes were found to contain elevated levels of N and E. coli, beyond the
recommended SANS 241 (2006) standards. All the bacteriological parameters and four of the
chemical parameters, including N, were exceeded by one of the 75 farms. Two farms presented
similar chemical data, except for the E. coli being compliant; one farm with exceeding levels of Ca,
Mg, Cl and N O 3 ; the other farm with exceeding levels of Mg, Na, F, Cl, and N.
There was a moderate positive correlation between N and E. coli concentrations (r = 0.33, r 2 = 0.11,
p = 0.004), N and coliform bacteria (r = 0.5, r 2 = 0.25, p = < 0.001), as well as between coliform and
E. coli (r = 0.59, r 2 = 0.35, p < 0.001) (Figure 4.1).
WQI of the boreholes ranged from 91.9 to 100, of which 68% of the boreholes were ranked as
excellent and 32% as good.
Discussion and Conclusions
Dairy farm effluent, which refers to the dung and urine deposited during milking, is subsequently
diluted during washing down of the milking shed floor polluting groundwater, drinking water sources
and streams (Hooda et al., 2000). Animal wastes are a major source of nutrient enrichment of
streams from run-off from dairies (Wilcock et al., 1999), and therefore groundwater quality has
Figure 4.1 Cumulative frequencies for the two major groups of bacterial contamination (E. coli and coliform) and nitrates
0
10
20
30
40
50
60
70
80
90
100Cu
mulat
ive fr
eque
ncy (
% of
farm
s)
0 – <10 10 – <20 20 – <30 30 – <40 40 – <50 50 – <60 60 – <70
Nitrate concentrate (mg N/ l )
Nitrates
Coliform
E. coli
© Central University of Technology, Free State
Chapter 4: Groundwater Quality 2009 Page | 50
become a major concern, particularly because of salt and nitrate leaching, often demonstrated
by heavy agricultural activities (Mohammad and Kaluarachchi, 2004). Therefore, manure handling
and disposal practices in dairy enterprises are currently undergoing critical revision to reduce their
impact on groundwater quality (Goss and Richards, 2008).
As dairy farming is a contributor of anthropogenic nitrogen worldwide, it was not surprising that
some of these dairy farms displayed high N levels in the borehole drinking water. In this study, the
enrichment of groundwater maybe attributed mostly to animal waste and run-off from the dairies.
On some of the farms the NO 3 levels were exceptionally high, up to seven times greater than
the specified health limit. These high toxic levels of nitrate are of concern for the expression of
methaemoglobinaemia (“blue baby syndrome”) in infants less than 6 months of age (Ward et al.,
2005). Acute toxicity has been documented at concentrations of >50 mg/ l (Spalding and Exner,
1993) but methaemoglobinaemia has never been recorded at levels lower than 6 mg/ l (Kempster
et al., 1997).
Although the WQI of all the farms were greater than 91, categorising the farms as either being
excellent or good, it should be noted that nearly 30% of the farm boreholes displayed non-
compliance to the national standard (SANS) 241 of 2006 for E. coli. E. coli numbers of six of the
boreholes were between 10 and 100 organisms per 100 m l, which can be considered as being
high-risk, whereas five of the boreholes were above 100 organisms per 100 m l, posing a severely
high-risk to the users. Since these boreholes are the sole drinking water sources on these farms,
humans and animals are therefore at risk for contracting gastrointestinal diseases (Pell, 1997).
The contaminated water could further contribute to the decrease of the quality of dairy products and
other farming produce (Jones, 1999; Schneider et al., 2010). It can therefore be concluded that this
baseline study strongly suggests that further studies should be undertaken to provide insights into
water and wastewater management strategies on dairy farms in the Mangaung region.
Acknowledgements
The authors wish to thank Mr. Barns (Manager, Environmental Health) from the Mangaung
Metropolitan for making the water quality data available for the study.
References
Atalay A, Pao S, James M, Whitehead B and Allen A. 2008. Drinking water assessment at underserved
farms in Virginia’s coastal plain. Journal of Environmental Monitoring and Restoration. 4: 53-64.
© Central University of Technology, Free State
Chapter 4: Groundwater Quality 2009 Page | 51
Danalewich JR, Papagiannis TG, Belyea MRL, Tumbleson ME and Raskin L. 1998. Characterization
of dairy waste streams,current treatment practices, and potential for biological nutrient removal.
Water Research. 32(12): 3555-3568.
DWAF (Department of Water Affairs and Forestry). 2006. Minimum requirements for sampling
drinking water systems: A user-friendly summary guide. Ver. 1. Pretoria.
Goss M and Richards C. 2008. Development of a risk-based index for source water protection
planning, which supports the reduction of pathogens from agricultural activity entering water
resources. Journal of Environmental Management. 87: 623-632.
Harter T, Davis H, Mathews MC and Meyer RD. 2002. Shallow groundwater quality on dairy farms
with irrigated forage crops. Journal of Contaminant Hydrology. 55: 287-315.
Hooda PS, Edwards UAC, Anderson HA and Miller A. 2000. A review of water quality concerns in
livestock farming areas. Science of the Total Environment. 250: 143-167.
Jones DL. 1999. Potential health risks associated with the persistence of Escherichia coli 0157 in
agricultural environments. Soil Use and Management. 15(2): 78-83.
Kay D, Crowther J, Fewtrell L, Francis AC, Hopkins M, Kay C, McDonald AT, Stapleton CM,
Watkins J, Wilkinson J and Wyer MD. 2008. Quantification and control of microbial pollution from
agriculture: a new policy challenge? Environmental Science and Policy. 2: 171-184.
Kempster Pl, Van Vliet HR and Kuhn A. 1997. The need for guidelines to bridge the gap between
ideal drinking-water quality and that quality which is practically available and acceptable.
Water SA. 23(2): 163-167.
Mohammad NA and Kaluarachchi JJ. 2004. Assessment and management of long-term nitrate
pollution of ground water in agriculture-dominated watersheds. Journal of Hydrology. 295: 225-
245.
Monaghan RM, Carey PL, Wilcock RJ, Drewry JJ, Houlbrooke DJ, Quinn JM and Thorrold BS.
2009. Linkages between land management activities and stream water quality in a border dyke-
irrigated pastoral catchment. Agriculture, Ecosystems and Environment. 129: 201-211.
Oliver DM, Fish RD, Hodgson CJ, Heathwaite AL, Chadwick DR and Winter M. 2009. A cross-
disciplinary toolkit to assess the risk of faecal indicator loss from grassland farm systems to
surface waters. Agriculture, Ecosystems and Environment. 129: 401-412.
Pell AN. 1997. Manure and Microbes: Public and Animal Health Problem? Journal of Dairy Science.
80(10): 2673-2681.
© Central University of Technology, Free State
Chapter 4: Groundwater Quality 2009 Page | 52
Saffran K, Cash K and Hallard K. 2001. Canadian water quality guidelines for the protection of
aquatic life. Water Quality Index 1.0 User’s Manual. Canadian Environment Quality Guidelines.
Winnipeg. Canadian Council of Ministers of the Environment.
SANS 241 (South African Bureau of Standards). 2006. South African National Standard, Drinking
Water Standard. Pretoria. SABS. (SANS 241-2006).
Santhi C, Srinivasan R, Arnold JG and Williams JR. 2006. A modelling approach to evaluate the
impacts of water quality management plans implemented in a watershed in Texas. Environmental
Modelling and Software. 21: 1141-1157.
Schneider KR, Goodrich-Schneider R and Archer DL. 2010. Food safety on the farm: Good
agricultural practices – Water (revised). FSHN 06-02. Gainesville. University of Florida.
Spalding RF and Exner ME. 1993. Occurrence of Nitrate in Groundwater – A Review. Journal of
Environment Quality. 22: 392-402.
Strydom JP, Mostert JF and Britz TJ. 1993. Effluent production and disposal in the South African
dairy industry: A postal survey. Water SA. 19(3): 253-258.
Van der Schans ML, Harter T, Leijnse A, Mathews MC and Meyer RD. 2009. Characterizing
sources of nitrate leaching from an irrigated dairy farm in Merced County, California. Journal of
Contaminant Hydrology. 110(1): 9-21.
Van Tonder, G. 2009. Groundwater management under the new Water Act in South Africa.
Hydrogeology Journal. 7: 421-422.
Ward MH, De Kok TM, Levallois P, Brender J, Gulis G, Nolan BT and Van Derslice J. 2005.
Workgroup report: Drinking-water nitrate and health – recent findings and research needs.
Environmental Health Perspective. 113: 1607-1614.
WHO (World Health Organization). 2008. Guidelines for Drinking-water Quality. 3 rd Ed. Volume 1,
Geneva. World Health Organization.
Wilcock RJ, Nagels JW, Rodda HJE, O’Conner MB, Thorrold BS and Barnett JW. 1999. Water
quality of a lowland stream in a New Zealand dairy farming catchment. New Zealand Journal of
Marine and Freshwater Research. 33: 683-696.
© Central University of Technology, Free State
Chapter 5: Comparison of Groundwater Quality Page | 53
Chapter 5 Comparison of Groundwater Quality on Dairy Farms
Sampled in 2009 and 2013
5.1 Introduction
Due to the invisible nature of groundwater, this resource can easily be neglected or poorly
managed. Changes in groundwater quality transpire over time and not as rapidly as in surface
water (DWAF, 2000). To restore groundwater quality is challenging and very expensive. It has
been reported that groundwater resources are poorly managed because of a lack of information
regarding pollutants and information about the occurrence of groundwater pollution (DWAF, 2000).
The quality of groundwater reflects inputs from the atmosphere, soil and water rock reactions as
well as pollutant sources such as agriculture, domestic and industrial wastes (Odonkor and Addo,
2013). It has been stated that groundwater quality is currently deteriorating at a fast rate, mostly
because of anthropogenic pollution, including septic tanks, landfill leachates, domestic sewage,
waste produced in agricultural activities and from agricultural run-off (Odonkor and Addo, 2013).
This pollution is mostly attributed to nutrient, chemical and pathogen loadings into groundwater as
a result of point source and non-point source activities (EPA, 2003).
5.2 Methods
Of the 75 dairy farms sampled in 2009, 34 were still in production in the follow-up study in 2013.
Therefore, to compare the groundwater quality data of the dairy farms, the 2009 data of the
34 productive dairy farms together with their 2013 data, were used in this comparison. The data of
fifteen groundwater quality parameters were used, namely, electrical conductivity (EC), pH, total
hardness, chloride (Cl), sulphate (S O 4 ), phosphate (P O 4 ), nitrate (N O 3 ), fluoride (F), calcium (Ca),
magnesium (Mg), sodium (Na), potassium (K), heterotrophic plate count (HPC), total coliforms and
Escherichia coli. The TDS values, that were estimated by multiplying EC by the factor of 6.5, were
included as the sixteenth parameter (DWAF et al., 1998). A t-test was used to determine if any
significant change in groundwater quality occurred over time.
5.3 Results
Of the sixteen water quality parameters that were assessed, four parameters in 2009 and six in
2013 exhibited 100% compliance with the standard (Table 5.1). The three parameters, namely,
© Central University of Technology, Free State
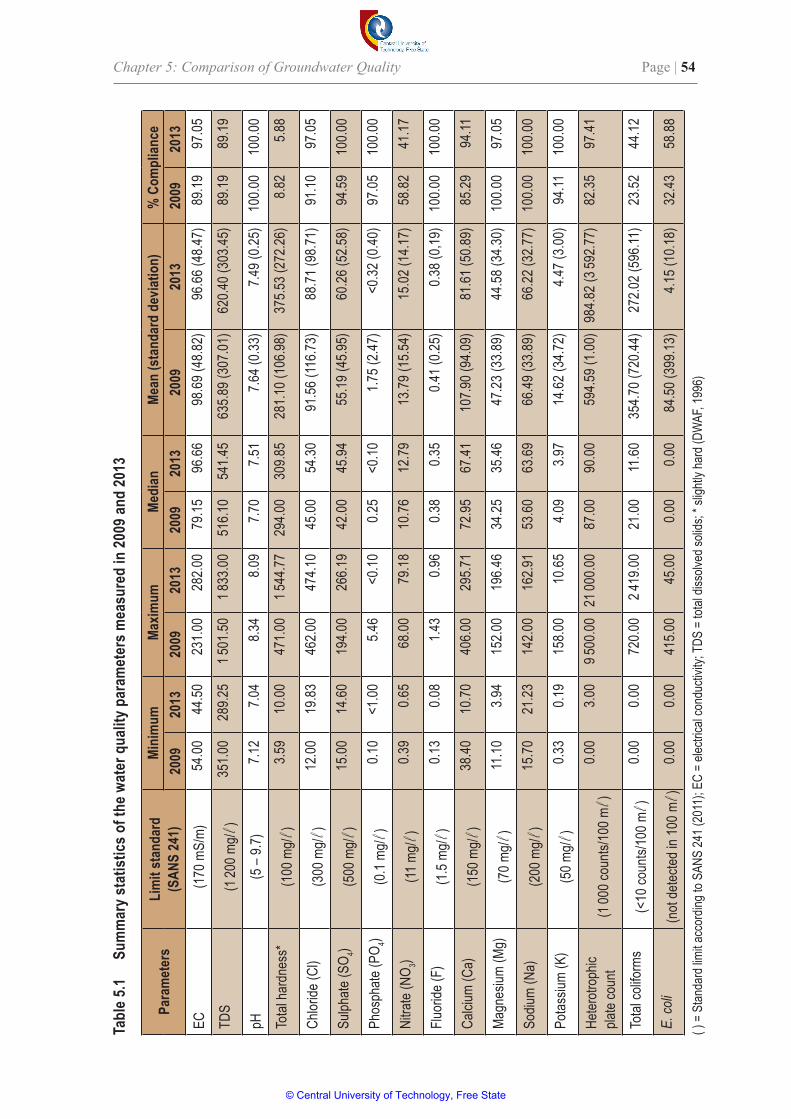
Chapter 5: Comparison of Groundwater Quality Page | 54
Tabl
e 5.1
Sum
mar
y sta
tistic
s of t
he w
ater
qua
lity p
aram
eter
s mea
sure
d in
2009
and
2013
Para
met
ers
Lim
it st
anda
rd
(SAN
S 24
1)Mi
nim
umMa
ximum
Medi
anMe
an (s
tand
ard
devia
tion)
% C
ompl
iance
2009
2013
2009
2013
2009
2013
2009
2013
2009
2013
EC(1
70 m
S/m)
54.00
44.50
231.0
028
2.00
79.15
96.66
98.69
(48.8
2)96
.66 (4
8.47)
89.19
97.05
TDS
(1 20
0 mg/
l )35
1.00
289.2
51 5
01.50
1 833
.0051
6.10
541.4
563
5.89 (
307.0
1)62
0.40 (
303.4
5)89
.1989
.19
pH(5
– 9.7
)7.1
27.0
48.3
48.0
97.7
07.5
17.6
4 (0.3
3)7.4
9 (0.2
5)10
0.00
100.0
0
Total
hard
ness
*(1
00 m
g/ l )
3.59
10.00
471.0
01 5
44.77
294.0
030
9.85
281.1
0 (10
6.98)
375.5
3 (27
2.26)
8.82
5.88
Chlor
ide (C
l)(3
00 m
g/ l )
12.00
19.83
462.0
047
4.10
45.00
54.30
91.56
(116
.73)
88.71
(98.7
1)91
.1097
.05
Sulph
ate (S
O 4 )(5
00 m
g/ l )
15.00
14.60
194.0
026
6.19
42.00
45.94
55.19
(45.9
5)60
.26 (5
2.58)
94.59
100.0
0
Phos
phate
(P O 4 )
(0.1
mg/ l
)0.1
0<1
.005.4
6<0
.100.2
5<0
.101.7
5 (2.4
7)<0
.32 (0
.40)
97.05
100.0
0
Nitra
te (N
O 3 )(11
mg/
l )0.3
90.6
568
.0079
.1810
.7612
.7913
.79 (1
5.54)
15.02
(14.1
7)58
.8241
.17
Fluor
ide (F
)(1
.5 mg
/ l )
0.13
0.08
1.43
0.96
0.38
0.35
0.41 (
0.25)
0.38 (
0,19)
100.0
010
0.00
Calci
um (C
a)(1
50 m
g/ l )
38.40
10.70
406.0
029
5.71
72.95
67.41
107.9
0 (94
.09)
81.61
(50.8
9)85
.2994
.11
Magn
esium
(Mg)
(70 m
g/ l )
11.10
3.94
152.0
019
6.46
34.25
35.46
47.23
(33.8
9)44
.58 (3
4.30)
100.0
097
.05
Sodiu
m (N
a)(2
00 m
g/ l )
15.70
21.23
142.0
016
2.91
53.60
63.69
66.49
(33.8
9)66
.22 (3
2.77)
100.0
010
0.00
Potas
sium
(K)
(50 m
g/ l )
0.33
0.19
158.0
010
.654.0
93.9
714
.62 (3
4.72)
4.47 (
3.00)
94.11
100.0
0
Heter
otrop
hic
plate
coun
t(1
000 c
ounts
/100 m
l )0.0
03.0
09 5
00.00
21 00
0.00
87.00
90.00
594.5
9 (1.0
0)98
4.82 (
3 592
.77)
82.35
97.41
Total
colifo
rms
(<10
coun
ts/10
0 m l )
0.00
0.00
720.0
02 4
19.00
21.00
11.60
354.7
0 (72
0.44)
272.0
2 (59
6.11)
23.52
44.12
E. co
li(n
ot de
tected
in 10
0 m l )
0.00
0.00
415.0
045
.000.0
00.0
084
.50 (3
99.13
)4.1
5 (10
.18)
32.43
58.88
( ) =
Stan
dard
limit a
ccor
ding t
o SAN
S 24
1 (20
11);
EC =
elec
trical
cond
uctiv
ity; T
DS =
total
diss
olved
solid
s; * s
lightl
y har
d (DW
AF, 1
996)
© Central University of Technology, Free State
Chapter 5: Comparison of Groundwater Quality Page | 55
nitrate, E. coli and total coliforms showed relatively low compliance across the farms and years.
Approximately 33% of the farms were non-compliant for E. coli and more than 50% for total coliforms
in both sampling years. For hardness, almost all the farms were non-compliant in both sampling
years. T-tests revealed that only three of the parameters demonstrated a significant change from
2009 to 2013, namely:
• pH (t = 3.165; p = 0.002);
• hardness (t = 2.113; p = 0.021); and
• potassium (t = 1.743; p = 0.0453).
The results demonstrated that the pH value and potassium levels of the water reduced during
the study period, while the harness levels increased. From this study and available analyses, it
is difficult to ascertain the origin for the change in the water quality. It can be concluded that the
increase of hardness is as a result of another chemical and not from the potassium.
5.3.1 Health and economic implications
Hard water generally poses no health risk to consumers; however, water that is very hard or
extremely hard could result in chronic health consequences for sensitive groups, such as infants,
the aged and immune compromised (DWAF et al., 1998). In this study approximately 45% of the
farms in 2009 and 57% in 2013 demonstrated hardness levels that pose a risk to the sensitive
consumer groups (Figure 5.1).
Hard water used for domestic purposes results in scale deposition, particularly in heating appliances,
and also increases the use of soap (Rubenowitz-Lundin and Hiscock, 2005). The groundwater on
many farms tested as hard or very hard, while the water on a few farms tested extremely hard
(Figure 5.1). Since water is used in all dairy cleaning operations, these levels of hard water could
add an additional cost to the running of a dairy by reducing the life span of equipment and increasing
the amount of soap used.
More than 50% of the farms studied in both years demonstrated levels of nitrates that could pose
a health risk. Of particular concern were the few farms with levels of nitrates exceeding 40 mg/ l which poses an acute risk for babies (DWAF et al., 1998) (Figure 5.2). Drinking water containing
nitrate at levels that exceed 50 mg/ l will be the major source of total nitrate intake, especially for
bottle-fed infants (WHO, 2011). Furthermore, nitrate poisoning of livestock could result in animal
losses (Tredoux et al., 2000). Other adverse health effects in animals include increased incidences of
abortions and stillborn calves, lower milk production and reduced weight gains (Tredoux et al., 2004).
© Central University of Technology, Free State
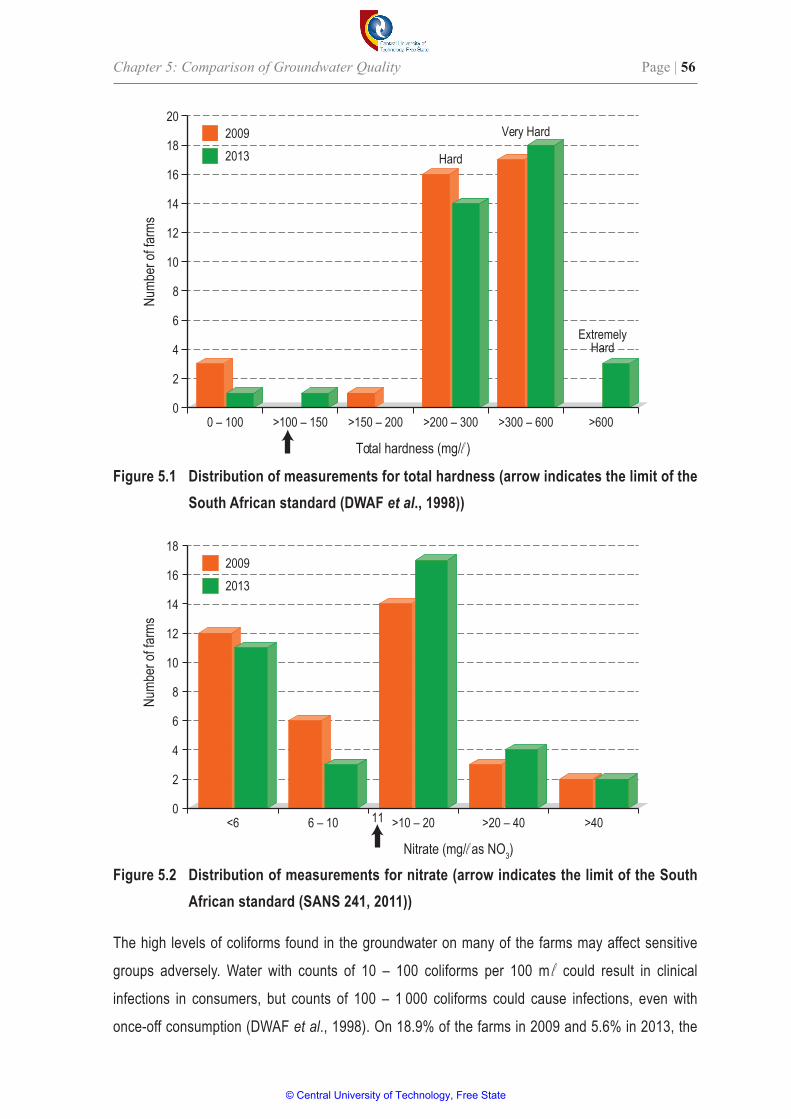
Chapter 5: Comparison of Groundwater Quality Page | 56
Figure 5.2 Distribution of measurements for nitrate (arrow indicates the limit of the South African standard (SANS 241, 2011))
0
2
4
6
8
10
12
14
16
18
Numb
er of
farm
s
<6 6 – 10 >10 – 20 >20 – 40 >40
Nitrate (mg/ las NO3)
20092013
11
The high levels of coliforms found in the groundwater on many of the farms may affect sensitive
groups adversely. Water with counts of 10 – 100 coliforms per 100 m l could result in clinical
infections in consumers, but counts of 100 – 1 000 coliforms could cause infections, even with
once-off consumption (DWAF et al., 1998). On 18.9% of the farms in 2009 and 5.6% in 2013, the
Figure 5.1 Distribution of measurements for total hardness (arrow indicates the limit of the South African standard (DWAF et al., 1998))
0
2
4
6
8
10
12
14
16
18
20
0 – 100 >100 – 150 >150 – 200 >200 – 300 >300 – 600 >600
Numb
er of
farm
s
Total hardness (mg/ l )
20092013 Hard
Very Hard
ExtremelyHard
© Central University of Technology, Free State
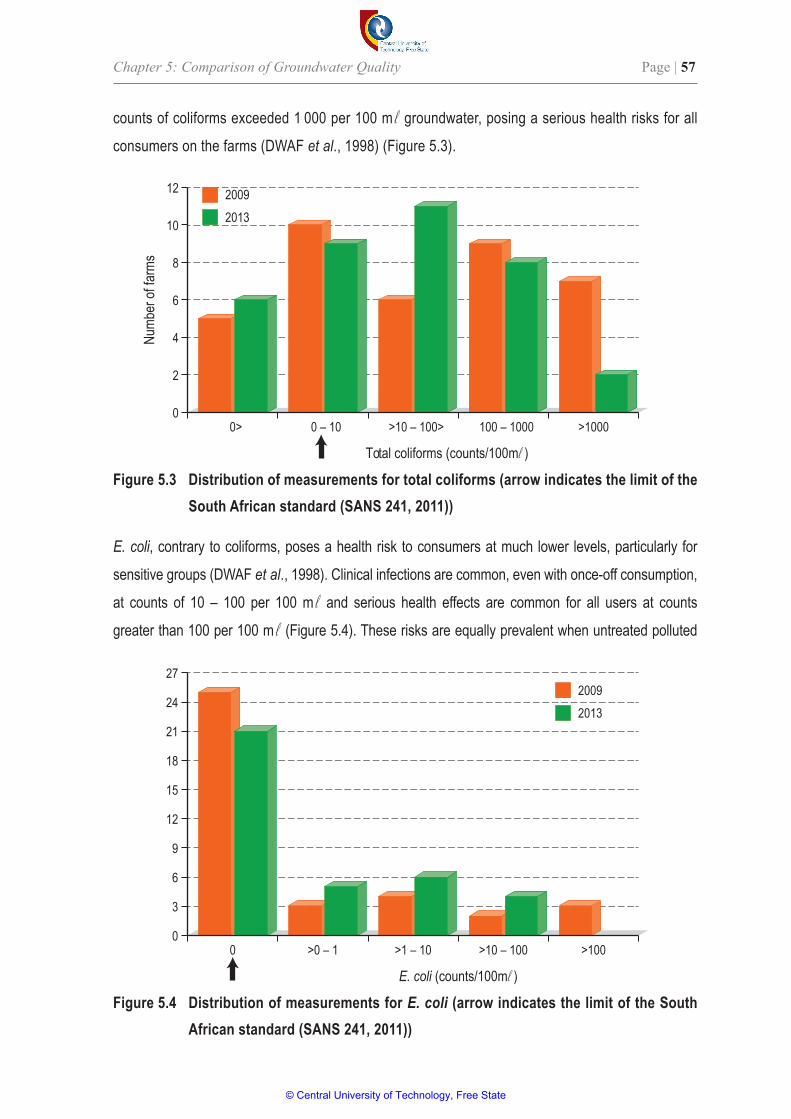
Chapter 5: Comparison of Groundwater Quality Page | 57
E. coli, contrary to coliforms, poses a health risk to consumers at much lower levels, particularly for
sensitive groups (DWAF et al., 1998). Clinical infections are common, even with once-off consumption,
at counts of 10 – 100 per 100 m l and serious health effects are common for all users at counts
greater than 100 per 100 m l (Figure 5.4). These risks are equally prevalent when untreated polluted
Figure 5.3 Distribution of measurements for total coliforms (arrow indicates the limit of the South African standard (SANS 241, 2011))
0> 0 – 10 >10 – 100> 100 – 1000 >1000
Total coliforms (counts/100m l )
20092013
0
2
4
6
8
10
12
Numb
er of
farm
s
Figure 5.4 Distribution of measurements for E. coli (arrow indicates the limit of the South African standard (SANS 241, 2011))
0 >0 – 1 >1 – 10 >10 – 100 >100
E. coli (counts/100m l )
20092013
0
3
6
9
12
15
18
21
24
27
counts of coliforms exceeded 1 000 per 100 m l groundwater, posing a serious health risks for all
consumers on the farms (DWAF et al., 1998) (Figure 5.3).
© Central University of Technology, Free State
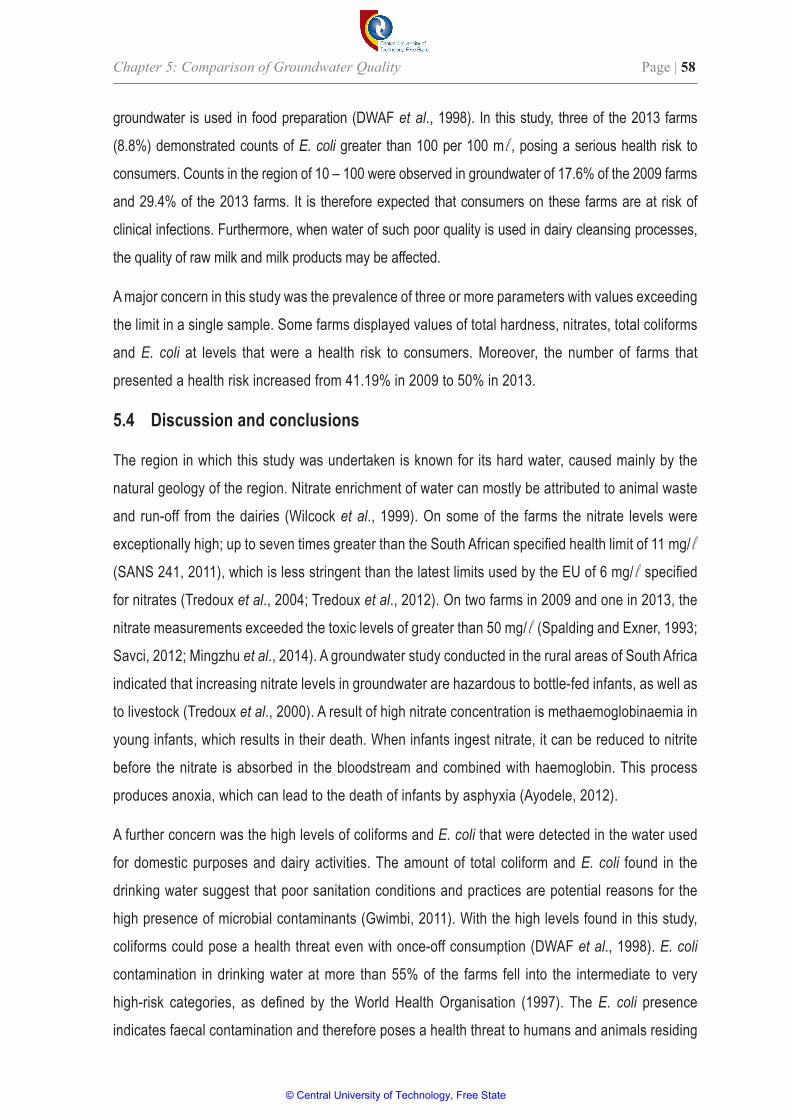
Chapter 5: Comparison of Groundwater Quality Page | 58
groundwater is used in food preparation (DWAF et al., 1998). In this study, three of the 2013 farms
(8.8%) demonstrated counts of E. coli greater than 100 per 100 m l, posing a serious health risk to
consumers. Counts in the region of 10 – 100 were observed in groundwater of 17.6% of the 2009 farms
and 29.4% of the 2013 farms. It is therefore expected that consumers on these farms are at risk of
clinical infections. Furthermore, when water of such poor quality is used in dairy cleansing processes,
the quality of raw milk and milk products may be affected.
A major concern in this study was the prevalence of three or more parameters with values exceeding
the limit in a single sample. Some farms displayed values of total hardness, nitrates, total coliforms
and E. coli at levels that were a health risk to consumers. Moreover, the number of farms that
presented a health risk increased from 41.19% in 2009 to 50% in 2013.
5.4 Discussion and conclusions
The region in which this study was undertaken is known for its hard water, caused mainly by the
natural geology of the region. Nitrate enrichment of water can mostly be attributed to animal waste
and run-off from the dairies (Wilcock et al., 1999). On some of the farms the nitrate levels were
exceptionally high; up to seven times greater than the South African specified health limit of 11 mg/ l (SANS 241, 2011), which is less stringent than the latest limits used by the EU of 6 mg/ l specified
for nitrates (Tredoux et al., 2004; Tredoux et al., 2012). On two farms in 2009 and one in 2013, the
nitrate measurements exceeded the toxic levels of greater than 50 mg/ l (Spalding and Exner, 1993;
Savci, 2012; Mingzhu et al., 2014). A groundwater study conducted in the rural areas of South Africa
indicated that increasing nitrate levels in groundwater are hazardous to bottle-fed infants, as well as
to livestock (Tredoux et al., 2000). A result of high nitrate concentration is methaemoglobinaemia in
young infants, which results in their death. When infants ingest nitrate, it can be reduced to nitrite
before the nitrate is absorbed in the bloodstream and combined with haemoglobin. This process
produces anoxia, which can lead to the death of infants by asphyxia (Ayodele, 2012).
A further concern was the high levels of coliforms and E. coli that were detected in the water used
for domestic purposes and dairy activities. The amount of total coliform and E. coli found in the
drinking water suggest that poor sanitation conditions and practices are potential reasons for the
high presence of microbial contaminants (Gwimbi, 2011). With the high levels found in this study,
coliforms could pose a health threat even with once-off consumption (DWAF et al., 1998). E. coli
contamination in drinking water at more than 55% of the farms fell into the intermediate to very
high-risk categories, as defined by the World Health Organisation (1997). The E. coli presence
indicates faecal contamination and therefore poses a health threat to humans and animals residing
© Central University of Technology, Free State
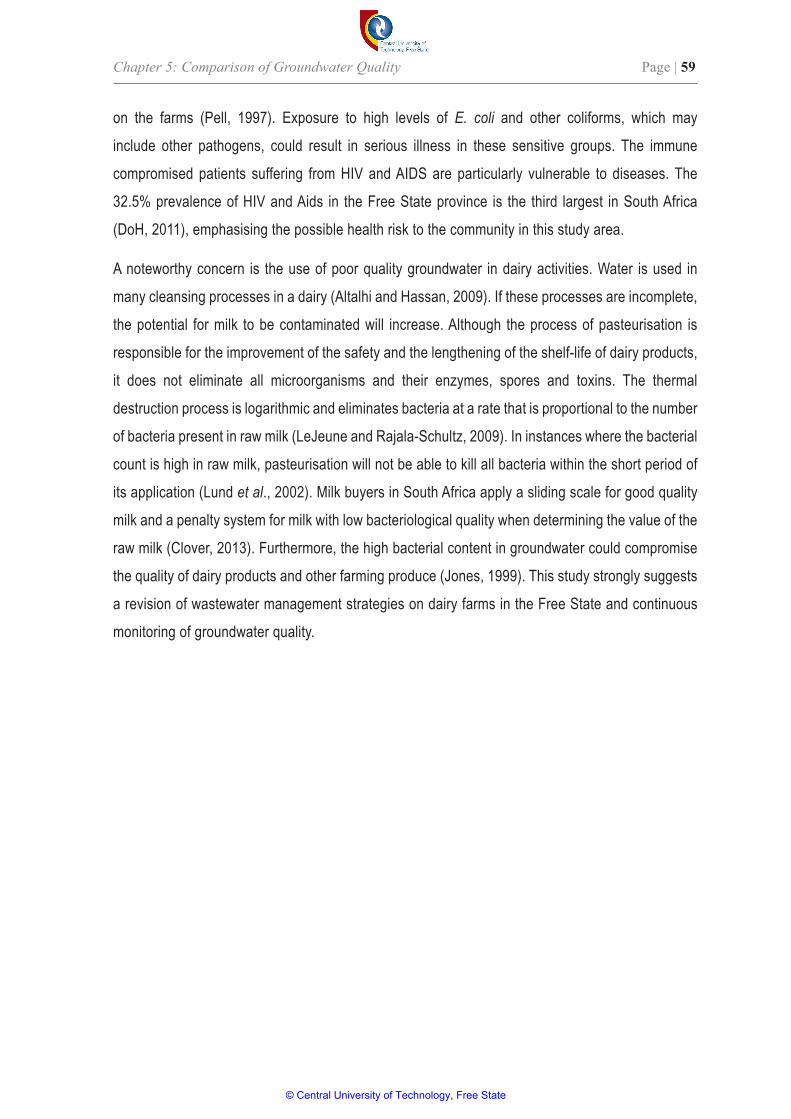
Chapter 5: Comparison of Groundwater Quality Page | 59
on the farms (Pell, 1997). Exposure to high levels of E. coli and other coliforms, which may
include other pathogens, could result in serious illness in these sensitive groups. The immune
compromised patients suffering from HIV and AIDS are particularly vulnerable to diseases. The
32.5% prevalence of HIV and Aids in the Free State province is the third largest in South Africa
(DoH, 2011), emphasising the possible health risk to the community in this study area.
A noteworthy concern is the use of poor quality groundwater in dairy activities. Water is used in
many cleansing processes in a dairy (Altalhi and Hassan, 2009). If these processes are incomplete,
the potential for milk to be contaminated will increase. Although the process of pasteurisation is
responsible for the improvement of the safety and the lengthening of the shelf-life of dairy products,
it does not eliminate all microorganisms and their enzymes, spores and toxins. The thermal
destruction process is logarithmic and eliminates bacteria at a rate that is proportional to the number
of bacteria present in raw milk (LeJeune and Rajala-Schultz, 2009). In instances where the bacterial
count is high in raw milk, pasteurisation will not be able to kill all bacteria within the short period of
its application (Lund et al., 2002). Milk buyers in South Africa apply a sliding scale for good quality
milk and a penalty system for milk with low bacteriological quality when determining the value of the
raw milk (Clover, 2013). Furthermore, the high bacterial content in groundwater could compromise
the quality of dairy products and other farming produce (Jones, 1999). This study strongly suggests
a revision of wastewater management strategies on dairy farms in the Free State and continuous
monitoring of groundwater quality.
© Central University of Technology, Free State
Chapter 6: Water Quality Index for Groundwater Page | 60
Chapter 6 A Water Quality Index for Groundwater on Dairy Farms
6.1 Introduction
One of the most effective ways to communicate the information with respect to water quality and
water quality trends is through the use of a suitable index. The suitability of a water source for
domestic use can best be described in terms of a water quality index (WQI). A WQI reduces the bulk
of information into a single value, by expressing water quality information in a logical and simplified
form (Nasirian 2007; González et al., 2012; Tyagi et al., 2013). This simplified form of water quality
data increases the level of understanding of water quality issues by non-water professionals, policy
makers and the general public (Tyagi et al., 2013).
The use of a WQI was initially proposed by Horton (1965) and Brown et al. (1970). Since that
time, many different methods for calculating a WQI have been developed. Generally, WQI consider
physical and chemical parameters but calculate the index in different ways (Štambuck-Giljanović,
1999).
A WQI can be defined as a rating scale that describes the composite impact of different water quality
parameters. It is usually dimensionless and expresses the relative magnitude of the composite
components of water quality (Muthulakshmi et al., 2013). Most WQI determine water quality from
the standpoint of suitability as a drinking water source (Yisa and Jimoh, 2010). The intention of a
WQI is to assess the general state of water depending on a range of predetermined water quality
parameters, which are then compared to a regulatory standard (González et al., 2012).
Few WQI consider microbiological parameters in combination with physical and chemical
parameters, and thus do not provide a holistic understanding of the health risk that water may
pose on consumers. The data in this study (captured in previous chapters) revealed that some of
the farms demonstrated high nitrate, coliform and E. coli values in the groundwater; making this
water unsuitable for domestic use and posing a health risk. Therefore, this study was undertaken
to develop a suitable WQI for groundwater, whilst also considering the potential health impact
the parameters may pose on humans at levels above the recommended standard. Existing WQI
calculation methods were reviewed for their potential use for groundwater; then modified and tested
to include physical, chemical and microbiological parameters using suitably chosen health limits.
© Central University of Technology, Free State
Chapter 6: Water Quality Index for Groundwater Page | 61
6.2 Methods
A review of the literature was undertaken to select a number of WQI that could be tested for their
potential use on groundwater measurements in South Africa, and that can also be applied by
non-professionals. Three prominent indexes were selected, namely the Weighted Arithmetic WQI
(WA-WQI) (Brown et al., 1972), the Weighted WQI (W-WQI) (Tiwari and Mishra, 1985; Jerome
and Pius, 2010) and the Canadian Council of Ministers of the Environment WQI (CCME-WQI)
(CCME, 2001). Both the WA-WQI and the CCME-WQI (CCME, 2001) are widely used to assess
water quality (Brown et al., 1972; Tyagi et al., 2013; CCME, 2001; UNEP, 2007), while the W-WQI
has been applied in various groundwater studies (Tiwari and Mishra, 1985; Ramakrishnaiah et al.,
2009; Jerome and Pius, 2010). The widely used National Sanitation Foundation (NSF) WQI was
excluded from this study (Brown et al., 1970; Kumar and Alappat, 2009), because of the complexity
of its mathematical calculations.
The three selected WQI were critically reviewed and compared for their suitability of use for
groundwater measurements. Eight WQI characteristics were devised to score the three selected
WQI. The characteristics included:
• which parameters are used in the WQI calculation;
• the required number of sampling rounds;
• the ease of implementation; and
• mathematical formulations used.
The characteristics for evaluation of a WQI were based upon previous experience of the author and
supervisors and the critical evaluation of WQI by Tyagi et al. (2013).
The water quality parameters that were used in the calculations of WQI values were selected
by first listing those commonly used to monitor drinking water in the Free State. For example,
parameters such as arsenic, cadmium and lead were excluded from this list as they have not been
associated with the drinking water assessments in the study area. Parameters that may pose a
health risk or are of economic importance in this region were identified through consultation with
two water quality experts of the Mangaung Metropolitan Municipality, Dr Elsa Potgieter, the chief
microbiologist and Mr Piet Wagener, the chief chemical analyst. A health related limit was assigned
to each of these parameters using the water quality limits for marginal water quality described by
DWAF et al. (1998). According to DWAF et al. (1998), marginal water quality implies that negative
effects may occur in some sensitive groups, such as people with medical conditions, babies, young
© Central University of Technology, Free State
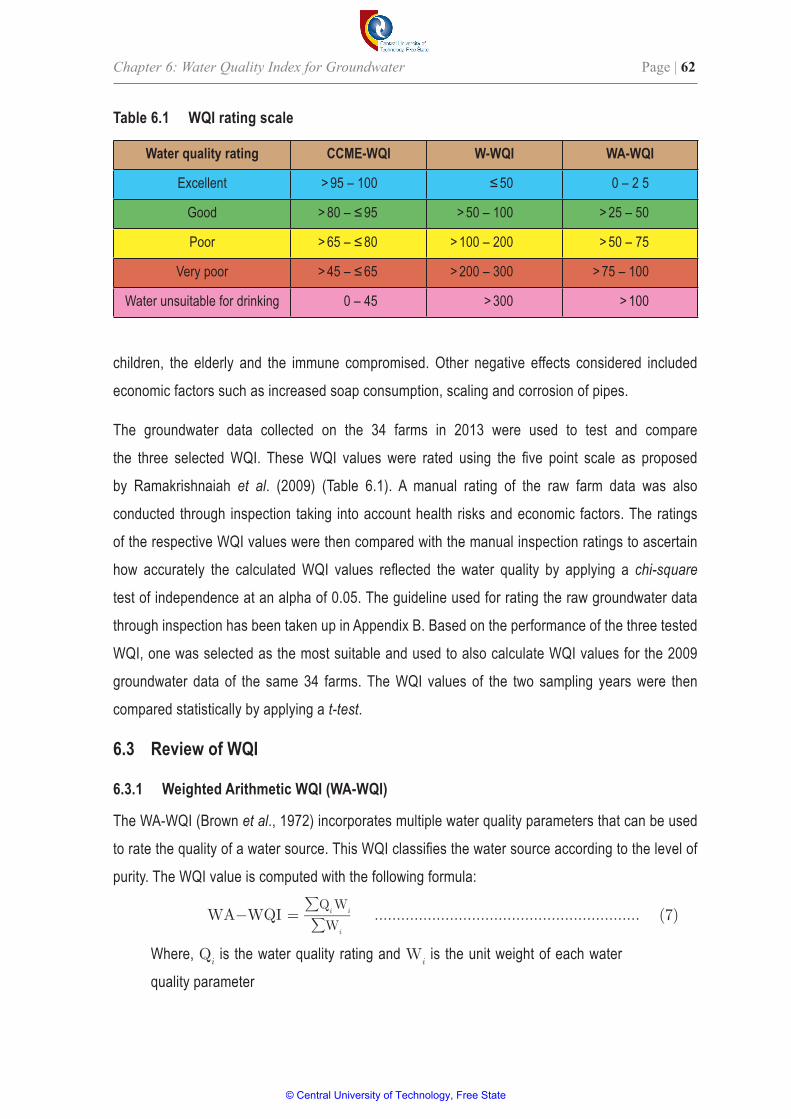
Chapter 6: Water Quality Index for Groundwater Page | 62
children, the elderly and the immune compromised. Other negative effects considered included
economic factors such as increased soap consumption, scaling and corrosion of pipes.
The groundwater data collected on the 34 farms in 2013 were used to test and compare
the three selected WQI. These WQI values were rated using the five point scale as proposed
by Ramakrishnaiah et al. (2009) (Table 6.1). A manual rating of the raw farm data was also
conducted through inspection taking into account health risks and economic factors. The ratings
of the respective WQI values were then compared with the manual inspection ratings to ascertain
how accurately the calculated WQI values reflected the water quality by applying a chi-square
test of independence at an alpha of 0.05. The guideline used for rating the raw groundwater data
through inspection has been taken up in Appendix B. Based on the performance of the three tested
WQI, one was selected as the most suitable and used to also calculate WQI values for the 2009
groundwater data of the same 34 farms. The WQI values of the two sampling years were then
compared statistically by applying a t-test.
6.3 Review of WQI
6.3.1 Weighted Arithmetic WQI (WA-WQI)
The WA-WQI (Brown et al., 1972) incorporates multiple water quality parameters that can be used
to rate the quality of a water source. This WQI classifies the water source according to the level of
purity. The WQI value is computed with the following formula:
WA-WQI = ∑ Q i W i _____ ∑ W i
............................................................ (7)
Where, Q i is the water quality rating and W i is the unit weight of each water
quality parameter
Table 6.1 WQI rating scale
Water quality rating CCME-WQI W-WQI WA-WQI
Excellent > 95 – 100 ≤ 50 0 – 2 5
Good > 80 – ≤ 95 > 50 – 100 > 25 – 50
Poor > 65 – ≤ 80 > 100 – 200 > 50 – 75
Very poor > 45 – ≤ 65 > 200 – 300 > 75 – 100
Water unsuitable for drinking 0 – 45 > 300 > 100
© Central University of Technology, Free State
Chapter 6: Water Quality Index for Groundwater Page | 63
The quality rating scale for each parameter is calculated by using the following:
Q i = 100 { V i - V 0 ______ S i - V 0 } ............................................................... (8)
Where, V i is the estimated concentration of the i th parameter of the water
sample, V i is the ideal value of the parameter in pure water, V 0 = 0 (except
pH = 7.0) and S i is the recommended standard value of the i th parameter.
The unit weight ( W i ) for each water quality parameter is calculated by using the following formula:
W i = K __ S i ................................................................................ (9)
Where, K is the proportionally constant.
It can also be calculated by using the following equation:
K = 1 ____ ∑ [ 1 __ S i
] ............................................................................. (10)
6.3.2 Weighted WQI (W-WQI)
The W-WQI (Tiwari and Mishra, 1985) computes a WQI value by applying a weighted index method.
Three steps are followed to calculate the WQI value (Tiwari and Mishra, 1985). In the first step, the
parameters are assigned a weight ( w i ) from one to five according to their relative importance in the
overall quality of water. A maximum weight of five is assigned to the most important parameters,
for example, in this study nitrate and E. coli were assigned a five. In the second step, the relative
weight ( W i ) is computed from the following equation:
W i = w i ____
∑ i=1
n
w i ........................................................................... (11)
Where, W i is the relative weight, w i is the weight of each parameter and n is
the number of parameters.
In the third step, a quality rating scale ( q i ) for each parameter is assigned by dividing its concentration
in each water sample by its respective standard and the result multiplied by 100:
q i = C i __ S i
× 100 ....................................................................... (12)
Where q i is the quality rating, C i is the concentration of each chemical parameter
in each water sample in mg/ l, and S i is standard for each parameter.
© Central University of Technology, Free State
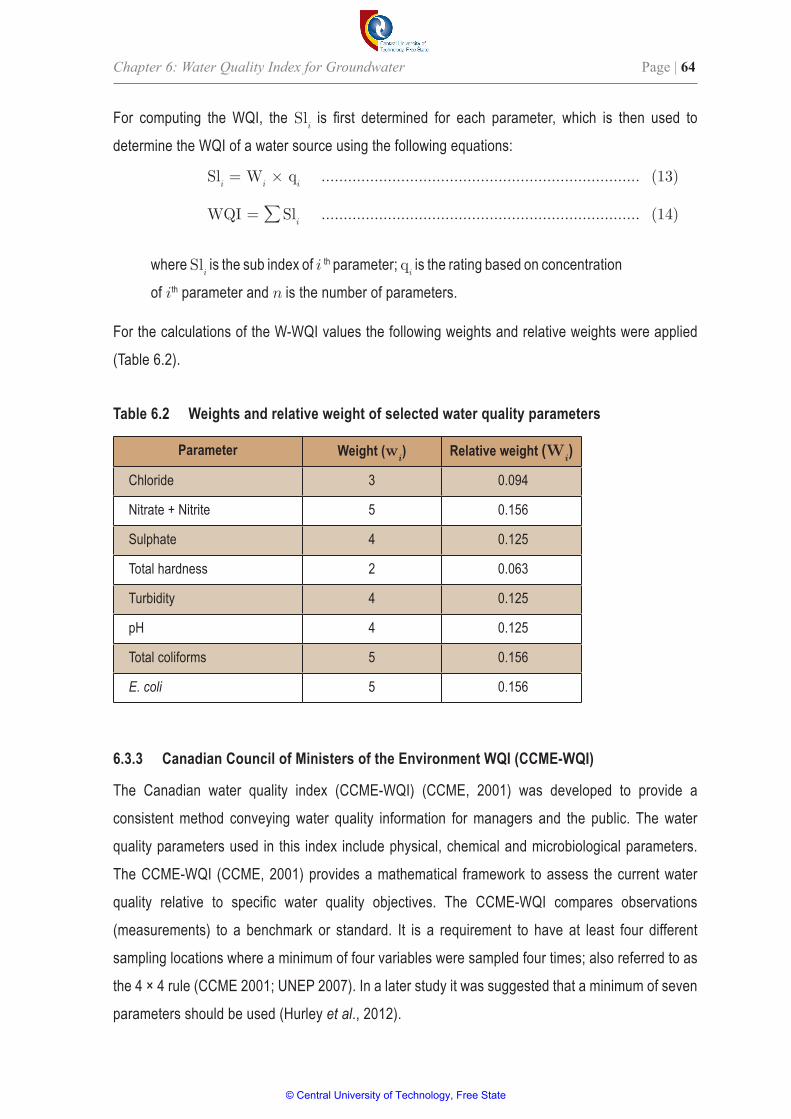
Chapter 6: Water Quality Index for Groundwater Page | 64
For computing the WQI, the Sl i is first determined for each parameter, which is then used to
determine the WQI of a water source using the following equations:
Sl i = W i × q i ........................................................................ (13)
WQI = ∑ Sl i ........................................................................ (14)
where Sl i is the sub index of i th parameter; q i is the rating based on concentration
of i th parameter and n is the number of parameters.
For the calculations of the W-WQI values the following weights and relative weights were applied
(Table 6.2).
Table 6.2 Weights and relative weight of selected water quality parameters
Parameter Weight ( w i ) Relative weight ( W i )
Chloride 3 0.094
Nitrate + Nitrite 5 0.156
Sulphate 4 0.125
Total hardness 2 0.063
Turbidity 4 0.125
pH 4 0.125
Total coliforms 5 0.156
E. coli 5 0.156
6.3.3 Canadian Council of Ministers of the Environment WQI (CCME-WQI)
The Canadian water quality index (CCME-WQI) (CCME, 2001) was developed to provide a
consistent method conveying water quality information for managers and the public. The water
quality parameters used in this index include physical, chemical and microbiological parameters.
The CCME-WQI (CCME, 2001) provides a mathematical framework to assess the current water
quality relative to specific water quality objectives. The CCME-WQI compares observations
(measurements) to a benchmark or standard. It is a requirement to have at least four different
sampling locations where a minimum of four variables were sampled four times; also referred to as
the 4 × 4 rule (CCME 2001; UNEP 2007). In a later study it was suggested that a minimum of seven
parameters should be used (Hurley et al., 2012).
© Central University of Technology, Free State
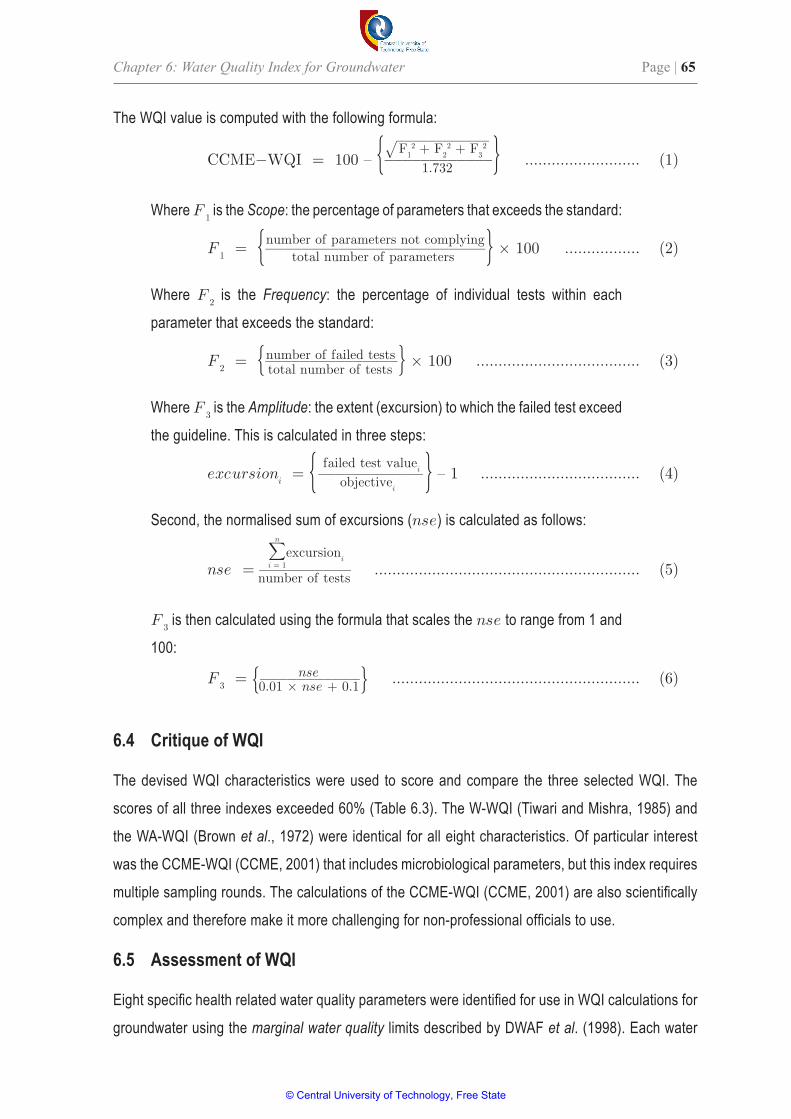
Chapter 6: Water Quality Index for Groundwater Page | 65
The WQI value is computed with the following formula:
CCME-WQI = 100 – { √____________ F 1 2 + F 2 2 + F 3 2 ____________ 1.732 } .......................... (1)
Where F 1 is the Scope: the percentage of parameters that exceeds the standard:
F 1 = { number of parameters not complying ________________________ total number of parameters } × 100 ................. (2)
Where F 2 is the Frequency: the percentage of individual tests within each
parameter that exceeds the standard:
F 2 = { number of failed tests _______________ total number of tests } × 100 ..................................... (3)
Where F 3 is the Amplitude: the extent (excursion) to which the failed test exceed
the guideline. This is calculated in three steps:
excursion i = { failed test value i ____________ objective i } – 1 .................................... (4)
Second, the normalised sum of excursions (nse) is calculated as follows:
nse = ∑ i = 1
n
excursion i __________ number of tests ............................................................ (5)
F 3 is then calculated using the formula that scales the nse to range from 1 and
100:
F 3 = { nse ___________ 0.01 × nse + 0.1 } ........................................................ (6)
6.4 Critique of WQI
The devised WQI characteristics were used to score and compare the three selected WQI. The
scores of all three indexes exceeded 60% (Table 6.3). The W-WQI (Tiwari and Mishra, 1985) and
the WA-WQI (Brown et al., 1972) were identical for all eight characteristics. Of particular interest
was the CCME-WQI (CCME, 2001) that includes microbiological parameters, but this index requires
multiple sampling rounds. The calculations of the CCME-WQI (CCME, 2001) are also scientifically
complex and therefore make it more challenging for non-professional officials to use.
6.5 Assessment of WQI
Eight specific health related water quality parameters were identified for use in WQI calculations for
groundwater using the marginal water quality limits described by DWAF et al. (1998). Each water
© Central University of Technology, Free State
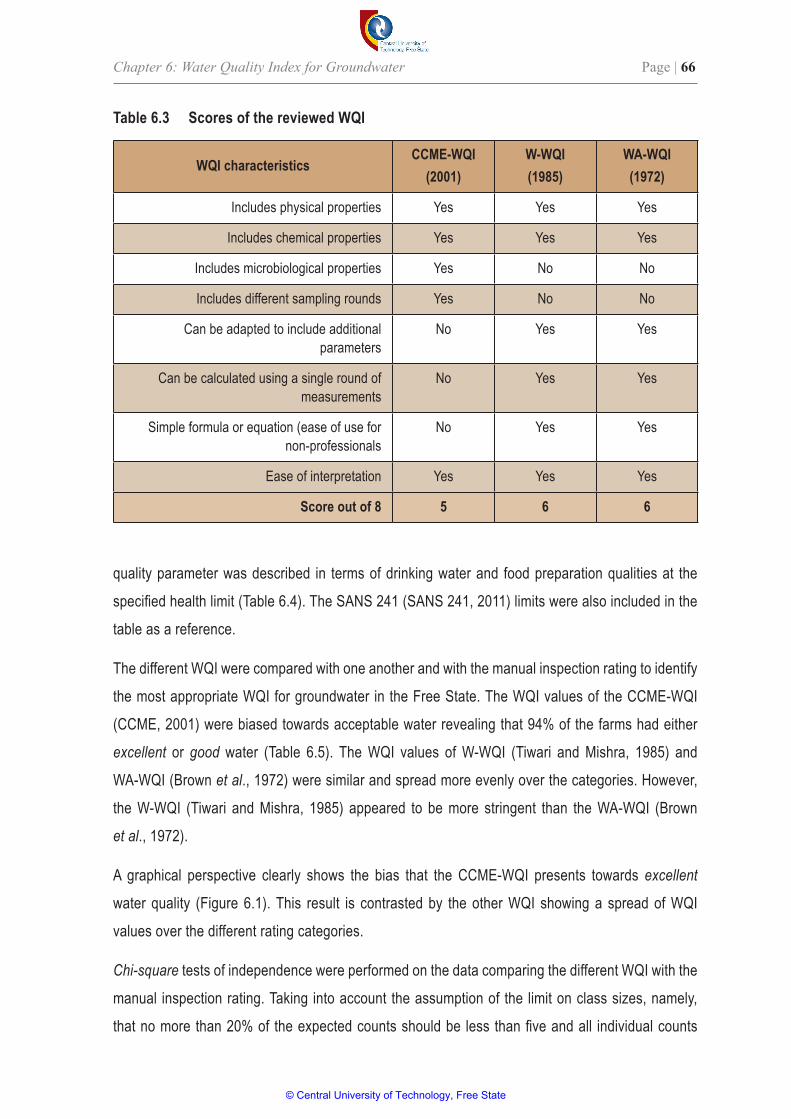
Chapter 6: Water Quality Index for Groundwater Page | 66
quality parameter was described in terms of drinking water and food preparation qualities at the
specified health limit (Table 6.4). The SANS 241 (SANS 241, 2011) limits were also included in the
table as a reference.
The different WQI were compared with one another and with the manual inspection rating to identify
the most appropriate WQI for groundwater in the Free State. The WQI values of the CCME-WQI
(CCME, 2001) were biased towards acceptable water revealing that 94% of the farms had either
excellent or good water (Table 6.5). The WQI values of W-WQI (Tiwari and Mishra, 1985) and
WA-WQI (Brown et al., 1972) were similar and spread more evenly over the categories. However,
the W-WQI (Tiwari and Mishra, 1985) appeared to be more stringent than the WA-WQI (Brown
et al., 1972).
A graphical perspective clearly shows the bias that the CCME-WQI presents towards excellent
water quality (Figure 6.1). This result is contrasted by the other WQI showing a spread of WQI
values over the different rating categories.
Chi-square tests of independence were performed on the data comparing the different WQI with the
manual inspection rating. Taking into account the assumption of the limit on class sizes, namely,
that no more than 20% of the expected counts should be less than five and all individual counts
Table 6.3 Scores of the reviewed WQI
WQI characteristicsCCME-WQI
(2001)W-WQI(1985)
WA-WQI(1972)
Includes physical properties Yes Yes Yes
Includes chemical properties Yes Yes Yes
Includes microbiological properties Yes No No
Includes different sampling rounds Yes No No
Can be adapted to include additional parameters
No Yes Yes
Can be calculated using a single round of measurements
No Yes Yes
Simple formula or equation (ease of use for non-professionals
No Yes Yes
Ease of interpretation Yes Yes Yes
Score out of 8 5 6 6
© Central University of Technology, Free State
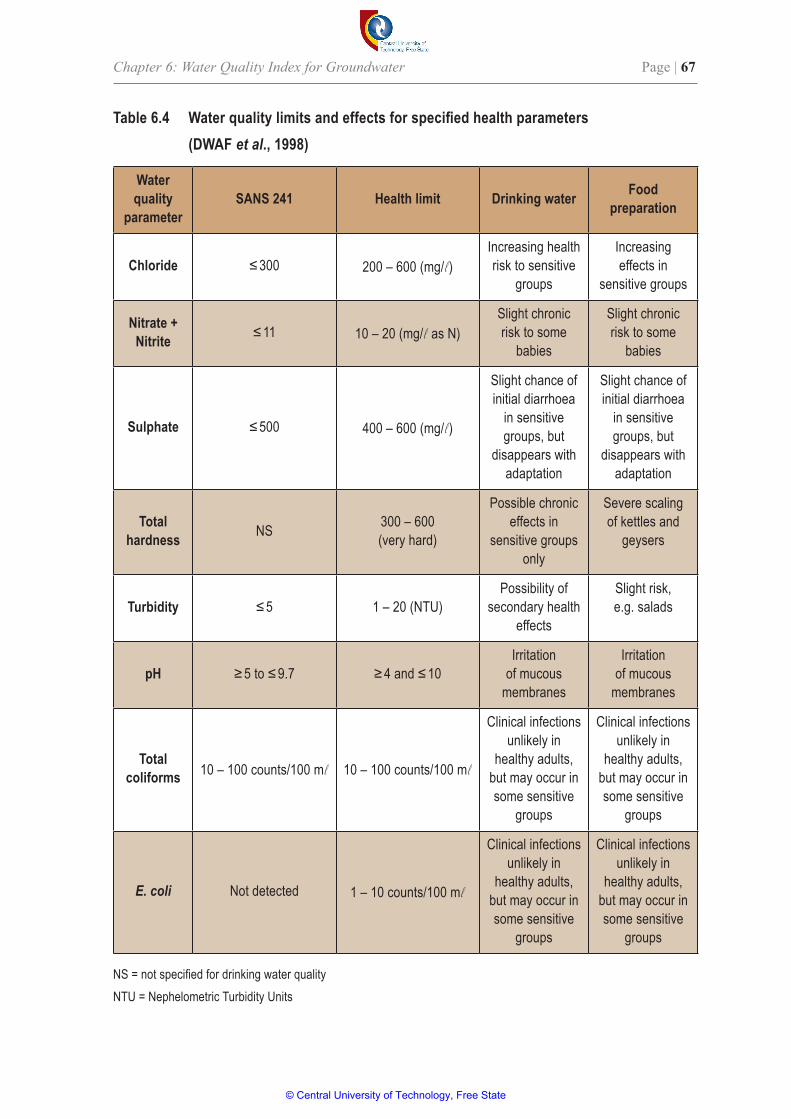
Chapter 6: Water Quality Index for Groundwater Page | 67
Table6.4 Waterqualitylimitsandeffectsforspecifiedhealthparameters (DWAF et al., 1998)
Water quality
parameterSANS 241 Health limit Drinking water Food
preparation
Chloride ≤ 300 200 – 600 (mg/ l)Increasing health risk to sensitive
groups
Increasing effects in
sensitive groups
Nitrate + Nitrite ≤ 11 10 – 20 (mg/ l as N)
Slight chronic risk to some
babies
Slight chronic risk to some
babies
Sulphate ≤ 500 400 – 600 (mg/ l)
Slight chance of initial diarrhoea
in sensitive groups, but
disappears with adaptation
Slight chance of initial diarrhoea
in sensitive groups, but
disappears with adaptation
Total hardness NS 300 – 600
(very hard)
Possible chronic effects in
sensitive groups only
Severe scaling of kettles and
geysers
Turbidity ≤ 5 1 – 20 (NTU)Possibility of
secondary health effects
Slight risk, e.g. salads
pH ≥ 5 to ≤ 9.7 ≥ 4 and ≤ 10Irritation
of mucous membranes
Irritation of mucous
membranes
Total coliforms 10 – 100 counts/100 m l 10 – 100 counts/100 m l
Clinical infections unlikely in
healthy adults, but may occur in some sensitive
groups
Clinical infections unlikely in
healthy adults, but may occur in some sensitive
groups
E. coli Not detected 1 – 10 counts/100 m l
Clinical infections unlikely in
healthy adults, but may occur in some sensitive
groups
Clinical infections unlikely in
healthy adults, but may occur in some sensitive
groups
NS = not specified for drinking water qualityNTU = Nephelometric Turbidity Units
© Central University of Technology, Free State
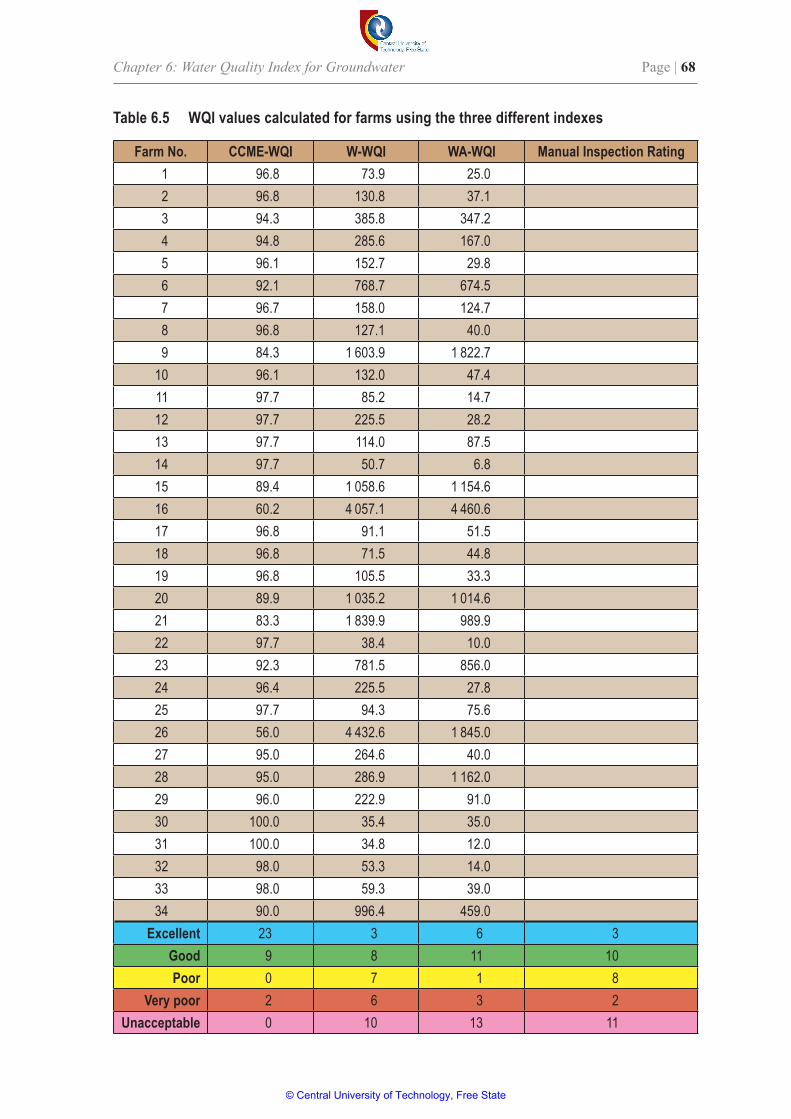
Chapter 6: Water Quality Index for Groundwater Page | 68
Table 6.5 WQI values calculated for farms using the three different indexes
Farm No. CCME-WQI W-WQI WA-WQI Manual Inspection Rating1 96.8 73.9 25.02 96.8 130.8 37.13 94.3 385.8 347.24 94.8 285.6 167.05 96.1 152.7 29.86 92.1 768.7 674.57 96.7 158.0 124.78 96.8 127.1 40.09 84.3 1 603.9 1 822.7
10 96.1 132.0 47.411 97.7 85.2 14.712 97.7 225.5 28.213 97.7 114.0 87.514 97.7 50.7 6.815 89.4 1 058.6 1 154.616 60.2 4 057.1 4 460.617 96.8 91.1 51.518 96.8 71.5 44.819 96.8 105.5 33.320 89.9 1 035.2 1 014.621 83.3 1 839.9 989.922 97.7 38.4 10.023 92.3 781.5 856.024 96.4 225.5 27.825 97.7 94.3 75.626 56.0 4 432.6 1 845.027 95.0 264.6 40.028 95.0 286.9 1 162.029 96.0 222.9 91.030 100.0 35.4 35.031 100.0 34.8 12.032 98.0 53.3 14.033 98.0 59.3 39.034 90.0 996.4 459.0
Excellent 23 3 6 3Good 9 8 11 10Poor 0 7 1 8
Very poor 2 6 3 2Unacceptable 0 10 13 11
© Central University of Technology, Free State
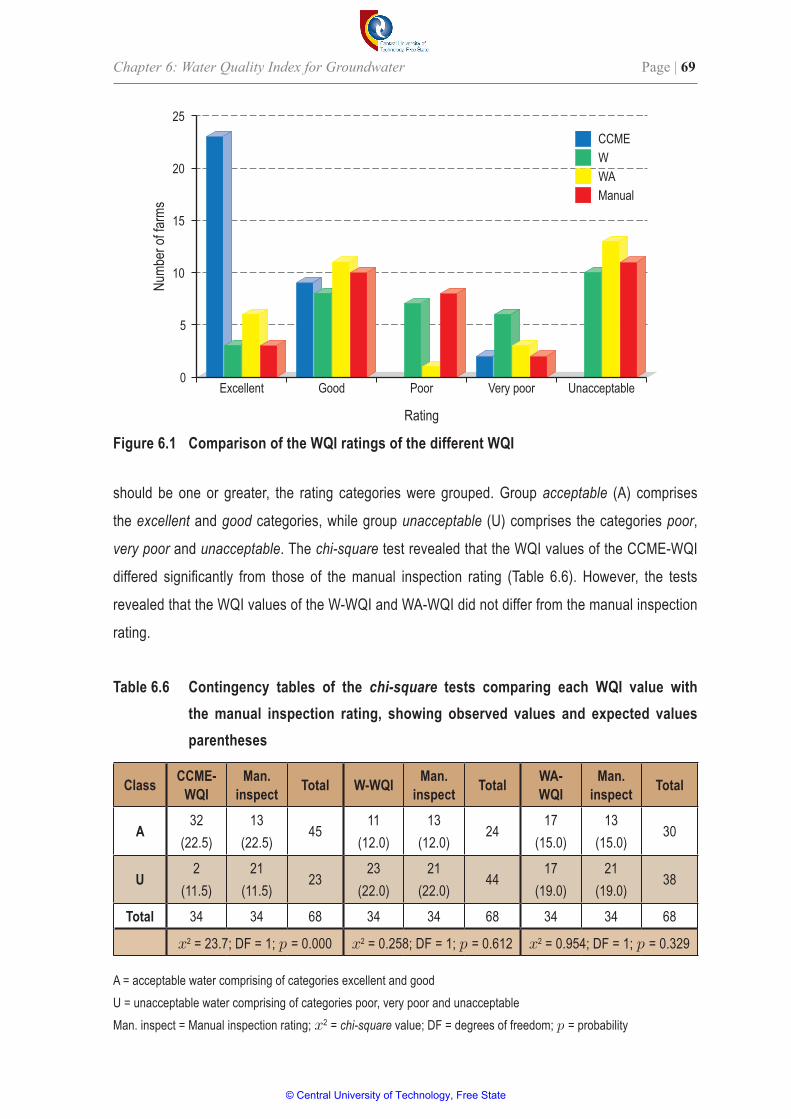
Chapter 6: Water Quality Index for Groundwater Page | 69
should be one or greater, the rating categories were grouped. Group acceptable (A) comprises
the excellent and good categories, while group unacceptable (U) comprises the categories poor,
very poor and unacceptable. The chi-square test revealed that the WQI values of the CCME-WQI
differed significantly from those of the manual inspection rating (Table 6.6). However, the tests
revealed that the WQI values of the W-WQI and WA-WQI did not differ from the manual inspection
rating.
Table 6.6 Contingency tables of the chi-square tests comparing each WQI value with the manual inspection rating, showing observed values and expected values parentheses
Class CCME-WQI
Man. inspect Total W-WQI Man.
inspect Total WA-WQI
Man. inspect Total
A32
(22.5)13
(22.5)45
11(12.0)
13(12.0)
2417
(15.0)13
(15.0)30
U2
(11.5)21
(11.5)23
23(22.0)
21(22.0)
4417
(19.0)21
(19.0)38
Total 34 34 68 34 34 68 34 34 68
x 2 = 23.7; DF = 1; p = 0.000 x 2 = 0.258; DF = 1; p = 0.612 x 2 = 0.954; DF = 1; p = 0.329
A = acceptable water comprising of categories excellent and goodU = unacceptable water comprising of categories poor, very poor and unacceptableMan. inspect = Manual inspection rating; x 2 = chi-square value; DF = degrees of freedom; p = probability
Figure 6.1 Comparison of the WQI ratings of the different WQI
0
5
10
15
20
25
Numb
er of
farm
s
Excellent Good Poor Unacceptable
Rating
CCMEWWAManual
© Central University of Technology, Free State
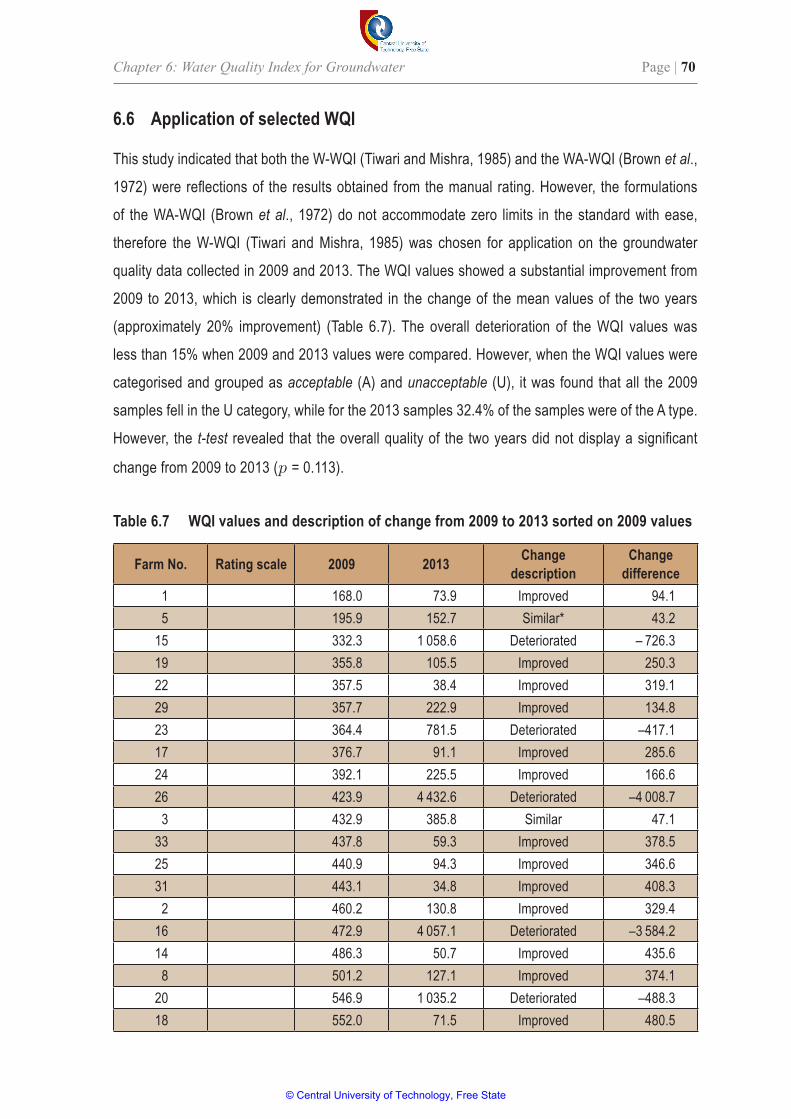
Chapter 6: Water Quality Index for Groundwater Page | 70
6.6 Application of selected WQI
This study indicated that both the W-WQI (Tiwari and Mishra, 1985) and the WA-WQI (Brown et al.,
1972) were reflections of the results obtained from the manual rating. However, the formulations
of the WA-WQI (Brown et al., 1972) do not accommodate zero limits in the standard with ease,
therefore the W-WQI (Tiwari and Mishra, 1985) was chosen for application on the groundwater
quality data collected in 2009 and 2013. The WQI values showed a substantial improvement from
2009 to 2013, which is clearly demonstrated in the change of the mean values of the two years
(approximately 20% improvement) (Table 6.7). The overall deterioration of the WQI values was
less than 15% when 2009 and 2013 values were compared. However, when the WQI values were
categorised and grouped as acceptable (A) and unacceptable (U), it was found that all the 2009
samples fell in the U category, while for the 2013 samples 32.4% of the samples were of the A type.
However, the t-test revealed that the overall quality of the two years did not display a significant
change from 2009 to 2013 (p = 0.113).
Table 6.7 WQI values and description of change from 2009 to 2013 sorted on 2009 values
Farm No. Rating scale 2009 2013 Change description
Change difference
1 168.0 73.9 Improved 94.15 195.9 152.7 Similar* 43.2
15 332.3 1 058.6 Deteriorated – 726.319 355.8 105.5 Improved 250.322 357.5 38.4 Improved 319.129 357.7 222.9 Improved 134.823 364.4 781.5 Deteriorated –417.117 376.7 91.1 Improved 285.624 392.1 225.5 Improved 166.626 423.9 4 432.6 Deteriorated –4 008.7
3 432.9 385.8 Similar 47.133 437.8 59.3 Improved 378.525 440.9 94.3 Improved 346.631 443.1 34.8 Improved 408.3
2 460.2 130.8 Improved 329.416 472.9 4 057.1 Deteriorated –3 584.214 486.3 50.7 Improved 435.6
8 501.2 127.1 Improved 374.120 546.9 1 035.2 Deteriorated –488.318 552.0 71.5 Improved 480.5
© Central University of Technology, Free State
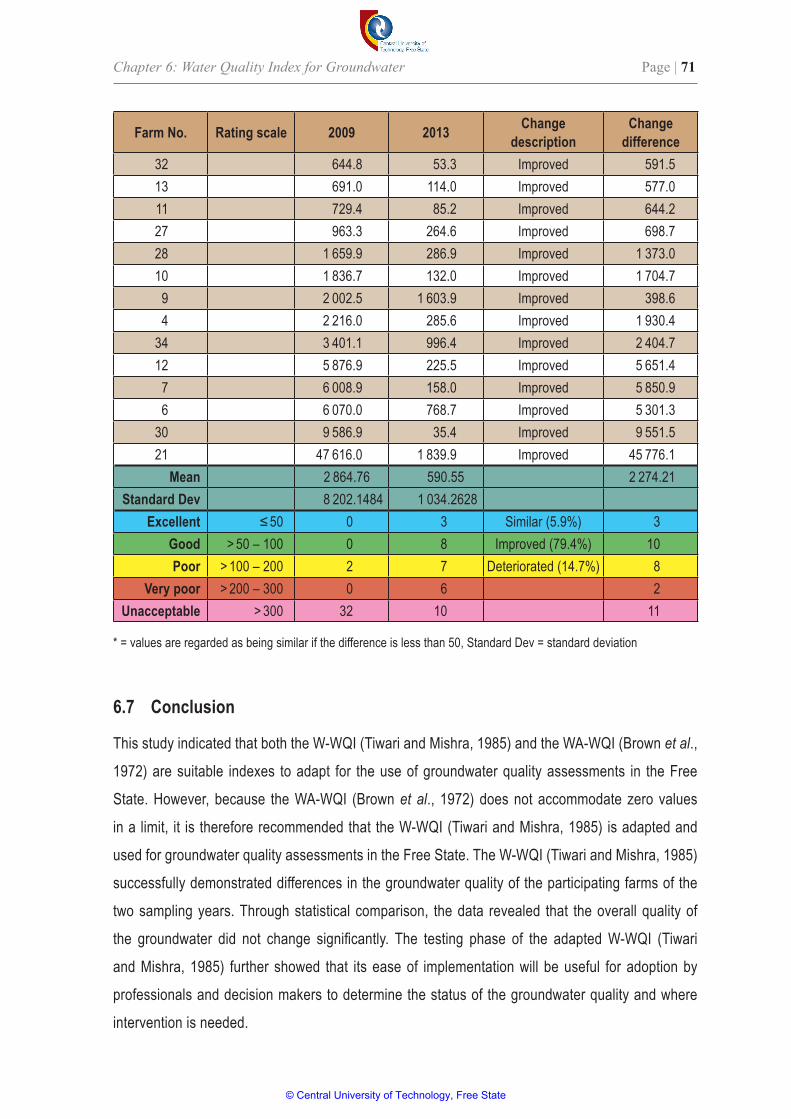
Chapter 6: Water Quality Index for Groundwater Page | 71
Farm No. Rating scale 2009 2013 Change description
Change difference
32 644.8 53.3 Improved 591.513 691.0 114.0 Improved 577.011 729.4 85.2 Improved 644.227 963.3 264.6 Improved 698.728 1 659.9 286.9 Improved 1 373.010 1 836.7 132.0 Improved 1 704.7
9 2 002.5 1 603.9 Improved 398.64 2 216.0 285.6 Improved 1 930.4
34 3 401.1 996.4 Improved 2 404.712 5 876.9 225.5 Improved 5 651.4
7 6 008.9 158.0 Improved 5 850.96 6 070.0 768.7 Improved 5 301.3
30 9 586.9 35.4 Improved 9 551.521 47 616.0 1 839.9 Improved 45 776.1
Mean 2 864.76 590.55 2 274.21Standard Dev 8 202.1484 1 034.2628
Excellent ≤ 50 0 3 Similar (5.9%) 3Good > 50 – 100 0 8 Improved (79.4%) 10Poor > 100 – 200 2 7 Deteriorated (14.7%) 8
Very poor > 200 – 300 0 6 2Unacceptable > 300 32 10 11
* = values are regarded as being similar if the difference is less than 50, Standard Dev = standard deviation
6.7 Conclusion
This study indicated that both the W-WQI (Tiwari and Mishra, 1985) and the WA-WQI (Brown et al.,
1972) are suitable indexes to adapt for the use of groundwater quality assessments in the Free
State. However, because the WA-WQI (Brown et al., 1972) does not accommodate zero values
in a limit, it is therefore recommended that the W-WQI (Tiwari and Mishra, 1985) is adapted and
used for groundwater quality assessments in the Free State. The W-WQI (Tiwari and Mishra, 1985)
successfully demonstrated differences in the groundwater quality of the participating farms of the
two sampling years. Through statistical comparison, the data revealed that the overall quality of
the groundwater did not change significantly. The testing phase of the adapted W-WQI (Tiwari
and Mishra, 1985) further showed that its ease of implementation will be useful for adoption by
professionals and decision makers to determine the status of the groundwater quality and where
intervention is needed.
© Central University of Technology, Free State
Chapter 7: Farm Management Practices and Infrastructure Page | 72
Chapter 7 Farm Management Practices and Infrastructure
7.1 Introduction
Dairy activities substantially impact the environment (Battini et al., 2014). Milking shed effluent
contains cow faeces, urine, chemicals, and wash water used in cleaning the milking units, pipelines,
bulk tanks, the floor and wall surfaces (Alveraz et al., 2011). Disposal of dairy effluent onto pastures
could result in an increased risk of contaminating waterways and groundwater. For example, it has
been shown that high levels of faecal coliforms have been detected in groundwater (Jiang et al.,
2010), which was the case with the farms in this study. Contaminated groundwater used without
being treated poses a public health risk for consumers (Collins et al., 2007).
Dairy effluent contains high concentrations of chloride, nitrates, as well as microbial contaminants,
which may include pathogens. Chloride originates from salts added to the cows’ feed, while nitrates
originate from natural mineral sources and anthropogenically as a by-product of agriculture, animal
and human wastes (Masetti et al., 2008). Pathogenic microorganisms that are found in manure can
cause serious illness and death in humans (Cotruvo et al., 2004).
Environmental considerations demand that dairies are sustainably managed. Farm management
practices and infrastructural design contribute to the load of the nutrient and faecal bacterial transfer
from dairy effluent in the soil to water sources (Monaghan et al., 2009). It is therefore important that
dairy managers consider potential farm management options and infrastructural designs to protect
their resources and consider the impact on the environment with more rigour (Ullman and Mukhtar,
2007). Best management practices can ensure that dairy operations become environmentally
more sustainable, reduce the generation of waste and avoid the degradation or contamination of
environmental resources such as soil and water (FAO and IDF, 2011).
Many activities on a dairy farm have the potential to affect groundwater quality (Van der Schans
et al., 2009). The amount of manure generated on the farm is determined by the number of cows.
Other influencing factors include, the distance from the collected manure to the borehole; the slope
from farm waste and sanitation facilities to the borehole; run-off; and the moistness of the soil
(Hooda et al., 2000; McLay et al., 2001; Collins et al., 2007; Gourley et al., 2012).
© Central University of Technology, Free State
Chapter 7: Farm Management Practices and Infrastructure Page | 73
The placement of a borehole and the protection of the head are key mechanisms to protect
groundwater (DWAF, 2004a). Boreholes are at risk of pollution by the accumulation of stagnant
water around the borehole head. By sealing the head of a borehole, run-off water and waste are
prevented from entering the borehole. Furthermore, pollution sources should be located downstream
from the borehole and measures should be taken to prevent the flow of waste and run-off in the
direction of a borehole (DWAF, 2004a; DWAF, 2004b).
The data in this study revealed that some farms demonstrated high nitrate, coliform and E. coli
values in the groundwater, making this water not suitable for domestic or dairy use. A data gathering
checklist was thus developed to gain insight into dairy farm management practices and dairy farm
infrastructure in an attempt to explain how the groundwater may become polluted.
7.2 Materials and methods
Of the original 75 farms from the 2009 sampling round, the 34 dairy farms that were still productive
in 2013, were used in this investigation. These farms were visited and data collected about dairy
farm management practices and infrastructure. A data gathering tool was developed and was used
to gather the data.
7.2.1 Development of the data gathering tool
Farm management practices and infrastructure on active dairy farms were investigated by means
of a data gathering checklist. Management aspects, such as the age of the dairy, number of
milking’s per day and handling of the dairy effluent, were investigated together with infrastructural
information, such as the number of boreholes used and the size of the bulk milk tanks.
The checklist was developed in six steps using national and international informing documents
(Figure 7.1)
• Step 1: Information on farm management practices and dairy farm infrastructure, of interest
to this study, was obtained.
• Step 2: The requirements for the COA (certificate of acceptability), as described in the
Regulations Relating to Hygiene Requirements for Milking Sheds, The Transport of Milk
and Related Matters (Regulation 961, 2012), was used as the primary guiding document to
construct the first draft of the checklist. This document is used by all environmental health
practitioners in South Africa. This draft checklist was then elaborated upon by adding specific
information specified in other documents namely, The Code of Hygienic Practice for Milk and
Milk Products developed by Codex (CAC/RCP, 2004), Sustainable Dairy Assurance Scheme
© Central University of Technology, Free State
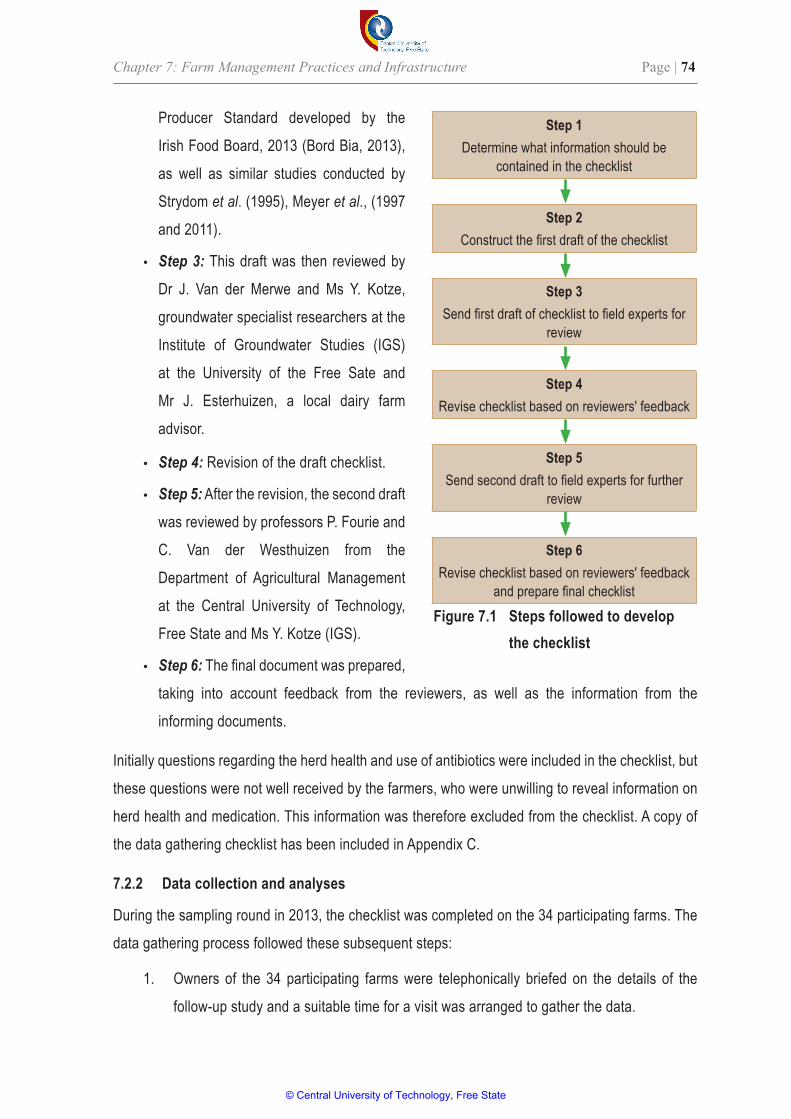
Chapter 7: Farm Management Practices and Infrastructure Page | 74
Producer Standard developed by the
Irish Food Board, 2013 (Bord Bia, 2013),
as well as similar studies conducted by
Strydom et al. (1995), Meyer et al., (1997
and 2011).
• Step 3: This draft was then reviewed by
Dr J. Van der Merwe and Ms Y. Kotze,
groundwater specialist researchers at the
Institute of Groundwater Studies (IGS)
at the University of the Free Sate and
Mr J. Esterhuizen, a local dairy farm
advisor.
• Step 4: Revision of the draft checklist.
• Step 5: After the revision, the second draft
was reviewed by professors P. Fourie and
C. Van der Westhuizen from the
Department of Agricultural Management
at the Central University of Technology,
Free State and Ms Y. Kotze (IGS).
• Step 6: The final document was prepared,
taking into account feedback from the reviewers, as well as the information from the
informing documents.
Initially questions regarding the herd health and use of antibiotics were included in the checklist, but
these questions were not well received by the farmers, who were unwilling to reveal information on
herd health and medication. This information was therefore excluded from the checklist. A copy of
the data gathering checklist has been included in Appendix C.
7.2.2 Data collection and analyses
During the sampling round in 2013, the checklist was completed on the 34 participating farms. The
data gathering process followed these subsequent steps:
1. Owners of the 34 participating farms were telephonically briefed on the details of the
follow-up study and a suitable time for a visit was arranged to gather the data.
Figure 7.1 Steps followed to develop the checklist
Step 1Determine what information should be
contained in the checklist
Step 2Construct the first draft of the checklist
Step 3Send first draft of checklist to field experts for
review
Step 4Revise checklist based on reviewers' feedback
Step 5Send second draft to field experts for further
review
Step 6Revise checklist based on reviewers' feedback
and prepare final checklist
© Central University of Technology, Free State
Chapter 7: Farm Management Practices and Infrastructure Page | 75
2. During a farm visit, the checklist was completed on-site by interviewing the farmer or the
dairy manager. At some farms the farmer or dairy manager was not available at the time
of the scheduled visit and thus only accessible data could be collected. The outstanding
data were then collected telephonically. All information was treated as confidential.
3. The data were captured and analysed using Microsoft Excel spreadsheets.
7.3 Results and discussion
Most of the participating dairy farms have been in operation for more than 20 years (33 of the
34 farms). Only one dairy farm was recently established; approximately five years ago. The major
dairy breeds in South Africa are Holstein-Friesland, Jersey, Guernsey and Ayrshire, of which the
Holstein-Friesland is the most popular followed by Jersey (Gertenbach, 2005). In this study, many
of the participating farms use Holstein cows for milk production (76%). The breeds on the remaining
farms included Jersey (14.7%), mixed herds (5.8%) and Ayrshire (2.9%).
Many activities on a dairy farm have the potential to affect groundwater quality. In particular, the
amount of manure generated on the farm is determined by the number of cows. Other influencing
factors include, the distance from the collected manure to the borehole; the slope from farm waste
and sanitation facilities to the borehole; and the moistness of the soil (Hooda et al., 2000; McLay
et al., 2001; Collins et al., 2007; Gourley et al., 2012).
Dairy practices on the participating farms varied substantially. All farmers confirmed that they had
obtained a COA (Table 7.1). The majority of the dairy farms sold raw milk to local Bloemfontein
buyers, while a few supplied raw milk to a bulk buyer in Gauteng. The sizes of the dairy herds
ranged from a few (< 10) to many (> 2 000) lactating cows. The milking frequency in the majority of
the dairies is twice per day. However, farms with large herds (> 300) milked three times a day and
therefore produced the largest volumes of raw milk. These farms also owned the largest bulk tanks.
Three of the large farms in this study also exhibited a large number of consumers (including farm
workers) (Table 7.2). This could be attributed to other extensive agricultural activities. On farm 4, the
dairy activities were complemented by extensive crop production and vegetable farming; farm 8 by
a dairy processing plant; and farm 33 by crop production and a sheep farming operation. Although
farm 23 could be regarded as being large because the dairy operation was the main agricultural
activity on the farm, there were relatively few consumers residing on the farm.
© Central University of Technology, Free State
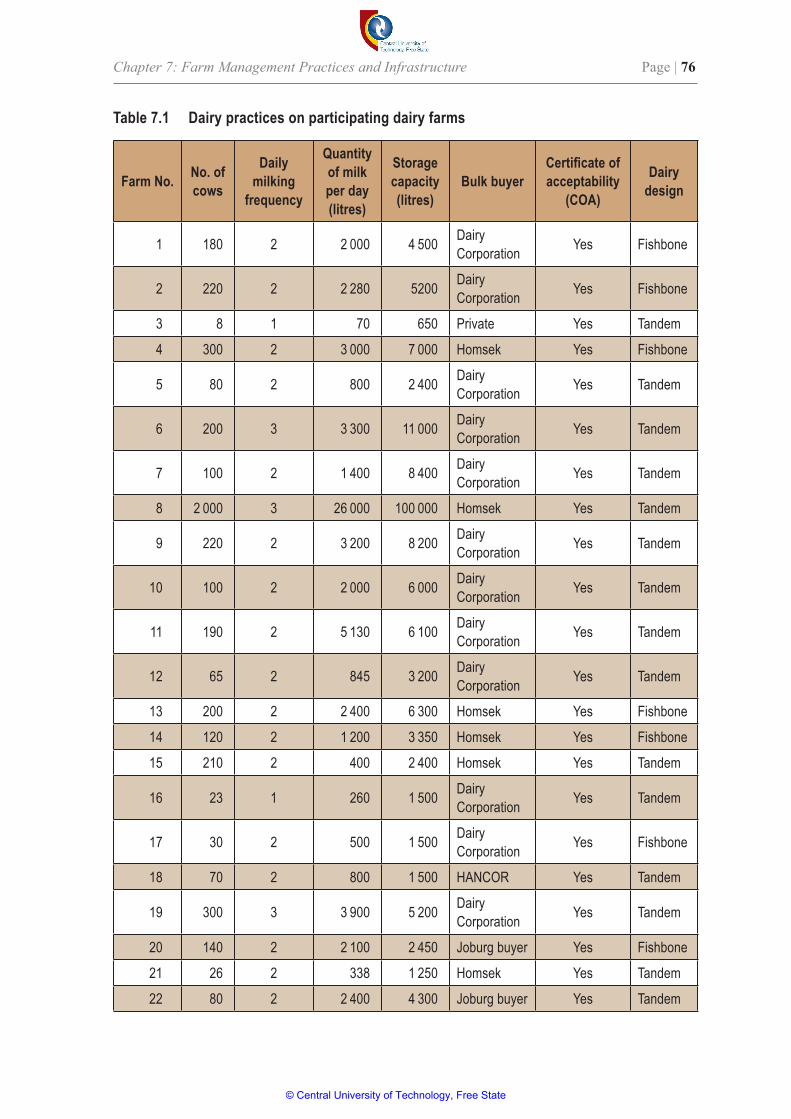
Chapter 7: Farm Management Practices and Infrastructure Page | 76
Table 7.1 Dairy practices on participating dairy farms
Farm No. No. of cows
Daily milking
frequency
Quantity of milk per day (litres)
Storage capacity (litres)
Bulk buyerCertificateofacceptability
(COA)
Dairy design
1 180 2 2 000 4 500 Dairy Corporation Yes Fishbone
2 220 2 2 280 5200 Dairy Corporation Yes Fishbone
3 8 1 70 650 Private Yes Tandem
4 300 2 3 000 7 000 Homsek Yes Fishbone
5 80 2 800 2 400 Dairy Corporation Yes Tandem
6 200 3 3 300 11 000 Dairy Corporation Yes Tandem
7 100 2 1 400 8 400 Dairy Corporation Yes Tandem
8 2 000 3 26 000 100 000 Homsek Yes Tandem
9 220 2 3 200 8 200 Dairy Corporation Yes Tandem
10 100 2 2 000 6 000 Dairy Corporation Yes Tandem
11 190 2 5 130 6 100 Dairy Corporation Yes Tandem
12 65 2 845 3 200 Dairy Corporation Yes Tandem
13 200 2 2 400 6 300 Homsek Yes Fishbone
14 120 2 1 200 3 350 Homsek Yes Fishbone
15 210 2 400 2 400 Homsek Yes Tandem
16 23 1 260 1 500 Dairy Corporation Yes Tandem
17 30 2 500 1 500 Dairy Corporation Yes Fishbone
18 70 2 800 1 500 HANCOR Yes Tandem
19 300 3 3 900 5 200 Dairy Corporation Yes Tandem
20 140 2 2 100 2 450 Joburg buyer Yes Fishbone
21 26 2 338 1 250 Homsek Yes Tandem
22 80 2 2 400 4 300 Joburg buyer Yes Tandem
© Central University of Technology, Free State
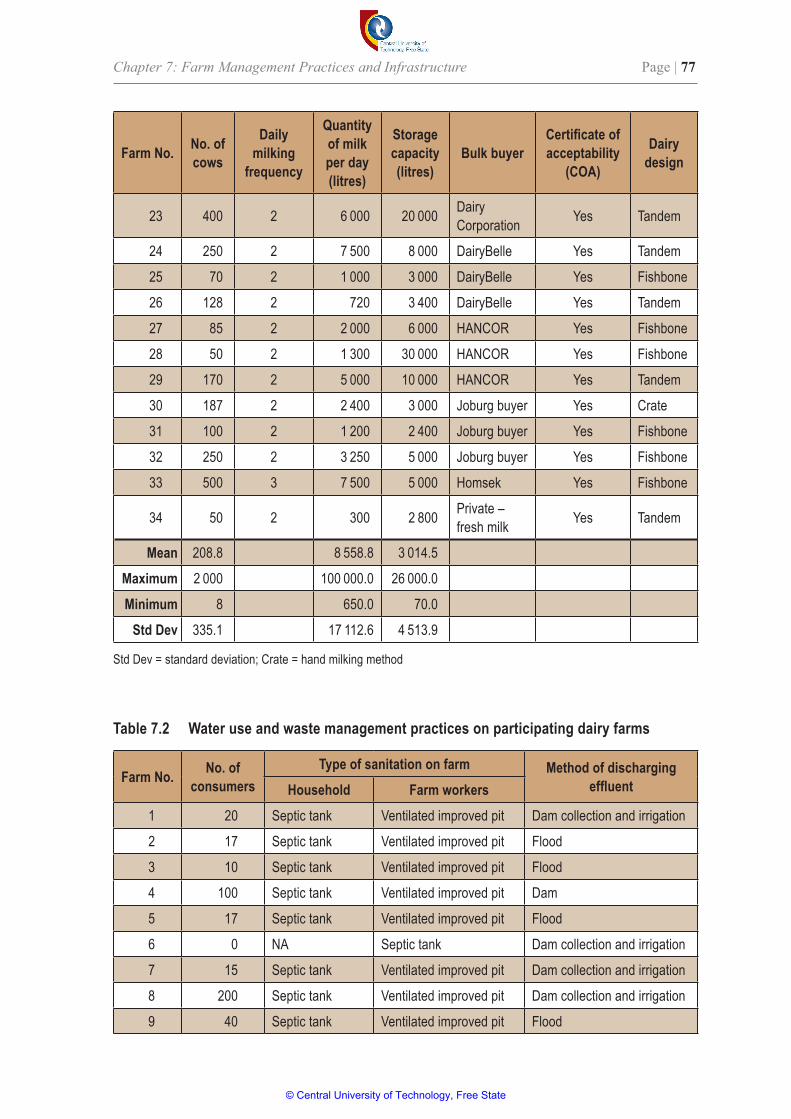
Chapter 7: Farm Management Practices and Infrastructure Page | 77
Farm No. No. of cows
Daily milking
frequency
Quantity of milk per day (litres)
Storage capacity (litres)
Bulk buyerCertificateofacceptability
(COA)
Dairy design
23 400 2 6 000 20 000 Dairy Corporation Yes Tandem
24 250 2 7 500 8 000 DairyBelle Yes Tandem
25 70 2 1 000 3 000 DairyBelle Yes Fishbone
26 128 2 720 3 400 DairyBelle Yes Tandem
27 85 2 2 000 6 000 HANCOR Yes Fishbone
28 50 2 1 300 30 000 HANCOR Yes Fishbone
29 170 2 5 000 10 000 HANCOR Yes Tandem
30 187 2 2 400 3 000 Joburg buyer Yes Crate
31 100 2 1 200 2 400 Joburg buyer Yes Fishbone
32 250 2 3 250 5 000 Joburg buyer Yes Fishbone
33 500 3 7 500 5 000 Homsek Yes Fishbone
34 50 2 300 2 800 Private – fresh milk Yes Tandem
Mean 208.8 8 558.8 3 014.5
Maximum 2 000 100 000.0 26 000.0
Minimum 8 650.0 70.0
Std Dev 335.1 17 112.6 4 513.9
Std Dev = standard deviation; Crate = hand milking method
Table 7.2 Water use and waste management practices on participating dairy farms
Farm No. No. of consumers
Type of sanitation on farm Method of discharging effluentHousehold Farm workers
1 20 Septic tank Ventilated improved pit Dam collection and irrigation
2 17 Septic tank Ventilated improved pit Flood
3 10 Septic tank Ventilated improved pit Flood
4 100 Septic tank Ventilated improved pit Dam
5 17 Septic tank Ventilated improved pit Flood
6 0 NA Septic tank Dam collection and irrigation
7 15 Septic tank Ventilated improved pit Dam collection and irrigation
8 200 Septic tank Ventilated improved pit Dam collection and irrigation
9 40 Septic tank Ventilated improved pit Flood
© Central University of Technology, Free State
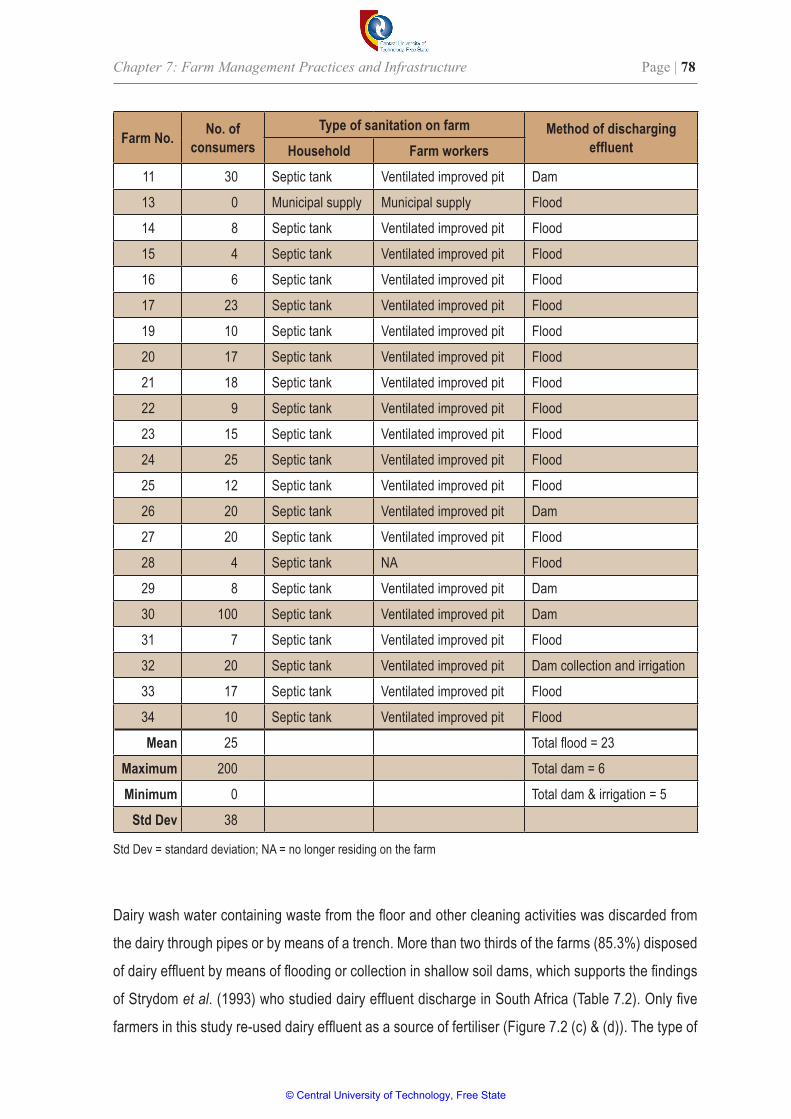
Chapter 7: Farm Management Practices and Infrastructure Page | 78
Farm No. No. of consumers
Type of sanitation on farm Method of discharging effluentHousehold Farm workers
11 30 Septic tank Ventilated improved pit Dam
13 0 Municipal supply Municipal supply Flood
14 8 Septic tank Ventilated improved pit Flood
15 4 Septic tank Ventilated improved pit Flood
16 6 Septic tank Ventilated improved pit Flood
17 23 Septic tank Ventilated improved pit Flood
19 10 Septic tank Ventilated improved pit Flood
20 17 Septic tank Ventilated improved pit Flood
21 18 Septic tank Ventilated improved pit Flood
22 9 Septic tank Ventilated improved pit Flood
23 15 Septic tank Ventilated improved pit Flood
24 25 Septic tank Ventilated improved pit Flood
25 12 Septic tank Ventilated improved pit Flood
26 20 Septic tank Ventilated improved pit Dam
27 20 Septic tank Ventilated improved pit Flood
28 4 Septic tank NA Flood
29 8 Septic tank Ventilated improved pit Dam
30 100 Septic tank Ventilated improved pit Dam
31 7 Septic tank Ventilated improved pit Flood
32 20 Septic tank Ventilated improved pit Dam collection and irrigation
33 17 Septic tank Ventilated improved pit Flood
34 10 Septic tank Ventilated improved pit Flood
Mean 25 Total flood = 23
Maximum 200 Total dam = 6
Minimum 0 Total dam & irrigation = 5
Std Dev 38
Std Dev = standard deviation; NA = no longer residing on the farm
Dairy wash water containing waste from the floor and other cleaning activities was discarded from
the dairy through pipes or by means of a trench. More than two thirds of the farms (85.3%) disposed
of dairy effluent by means of flooding or collection in shallow soil dams, which supports the findings
of Strydom et al. (1993) who studied dairy effluent discharge in South Africa (Table 7.2). Only five
farmers in this study re-used dairy effluent as a source of fertiliser (Figure 7.2 (c) & (d)). The type of
© Central University of Technology, Free State
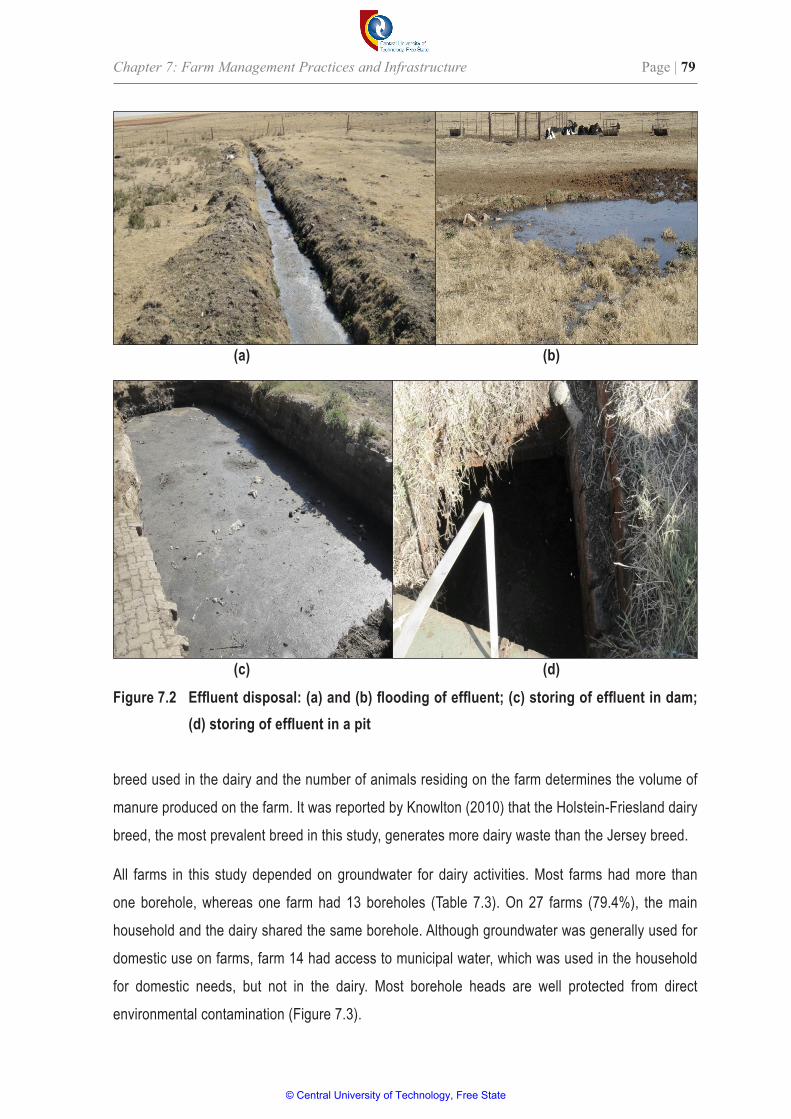
Chapter 7: Farm Management Practices and Infrastructure Page | 79
breed used in the dairy and the number of animals residing on the farm determines the volume of
manure produced on the farm. It was reported by Knowlton (2010) that the Holstein-Friesland dairy
breed, the most prevalent breed in this study, generates more dairy waste than the Jersey breed.
All farms in this study depended on groundwater for dairy activities. Most farms had more than
one borehole, whereas one farm had 13 boreholes (Table 7.3). On 27 farms (79.4%), the main
household and the dairy shared the same borehole. Although groundwater was generally used for
domestic use on farms, farm 14 had access to municipal water, which was used in the household
for domestic needs, but not in the dairy. Most borehole heads are well protected from direct
environmental contamination (Figure 7.3).
Figure7.2 Effluentdisposal:(a)and(b)floodingofeffluent;(c)storingofeffluentindam;(d)storingofeffluentinapit
(a) (b)
(c) (d)
© Central University of Technology, Free State
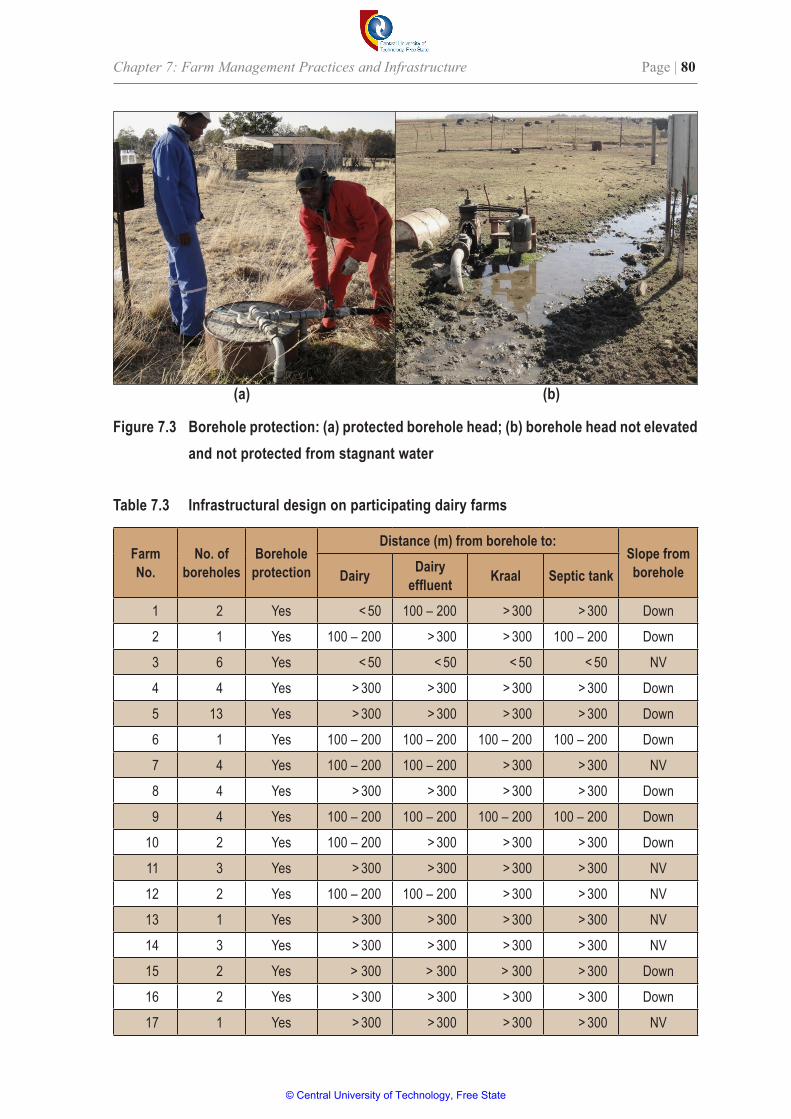
Chapter 7: Farm Management Practices and Infrastructure Page | 80
Figure 7.3 Borehole protection: (a) protected borehole head; (b) borehole head not elevated and not protected from stagnant water
(a) (b)
Table 7.3 Infrastructural design on participating dairy farms
Farm No.
No. of boreholes
Borehole protection
Distance (m) from borehole to:Slope from boreholeDairy Dairy
effluent Kraal Septic tank
1 2 Yes < 50 100 – 200 > 300 > 300 Down
2 1 Yes 100 – 200 > 300 > 300 100 – 200 Down
3 6 Yes < 50 < 50 < 50 < 50 NV
4 4 Yes > 300 > 300 > 300 > 300 Down
5 13 Yes > 300 > 300 > 300 > 300 Down
6 1 Yes 100 – 200 100 – 200 100 – 200 100 – 200 Down
7 4 Yes 100 – 200 100 – 200 > 300 > 300 NV
8 4 Yes > 300 > 300 > 300 > 300 Down
9 4 Yes 100 – 200 100 – 200 100 – 200 100 – 200 Down
10 2 Yes 100 – 200 > 300 > 300 > 300 Down
11 3 Yes > 300 > 300 > 300 > 300 NV
12 2 Yes 100 – 200 100 – 200 > 300 > 300 NV
13 1 Yes > 300 > 300 > 300 > 300 NV
14 3 Yes > 300 > 300 > 300 > 300 NV
15 2 Yes > 300 > 300 > 300 > 300 Down
16 2 Yes > 300 > 300 > 300 > 300 Down
17 1 Yes > 300 > 300 > 300 > 300 NV
© Central University of Technology, Free State
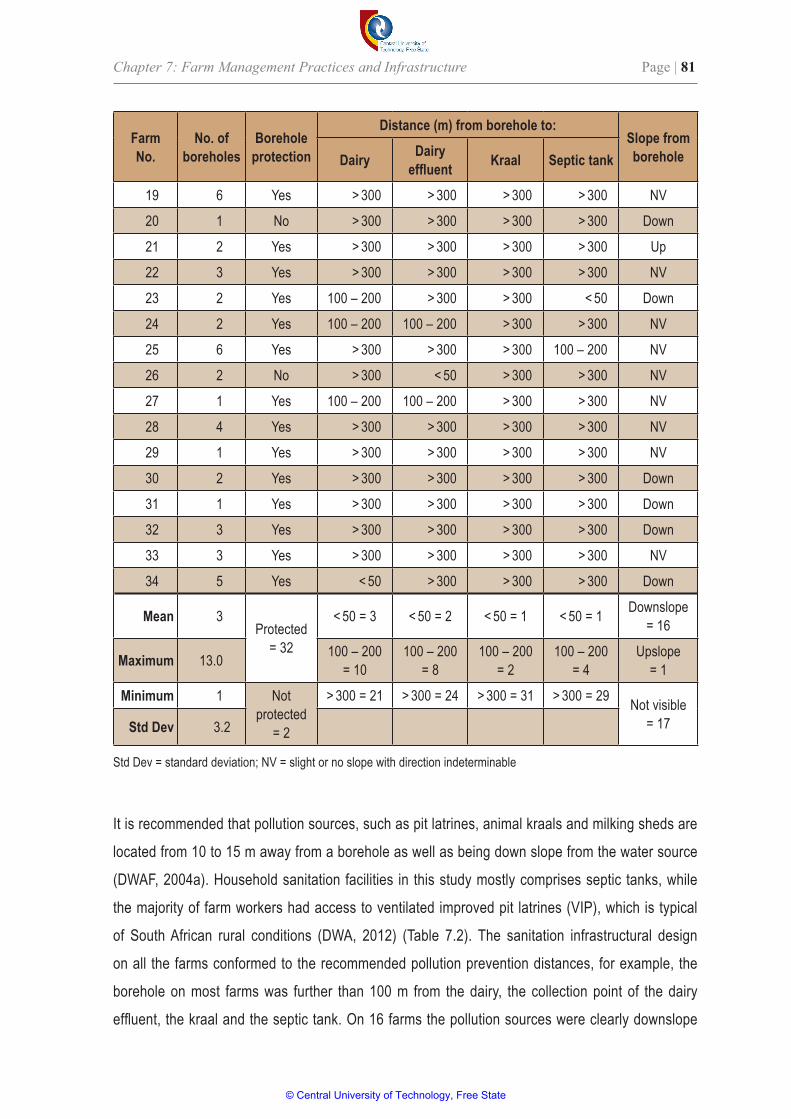
Chapter 7: Farm Management Practices and Infrastructure Page | 81
Farm No.
No. of boreholes
Borehole protection
Distance (m) from borehole to:Slope from boreholeDairy Dairy
effluent Kraal Septic tank
19 6 Yes > 300 > 300 > 300 > 300 NV
20 1 No > 300 > 300 > 300 > 300 Down
21 2 Yes > 300 > 300 > 300 > 300 Up
22 3 Yes > 300 > 300 > 300 > 300 NV
23 2 Yes 100 – 200 > 300 > 300 < 50 Down
24 2 Yes 100 – 200 100 – 200 > 300 > 300 NV
25 6 Yes > 300 > 300 > 300 100 – 200 NV
26 2 No > 300 < 50 > 300 > 300 NV
27 1 Yes 100 – 200 100 – 200 > 300 > 300 NV
28 4 Yes > 300 > 300 > 300 > 300 NV
29 1 Yes > 300 > 300 > 300 > 300 NV
30 2 Yes > 300 > 300 > 300 > 300 Down
31 1 Yes > 300 > 300 > 300 > 300 Down
32 3 Yes > 300 > 300 > 300 > 300 Down
33 3 Yes > 300 > 300 > 300 > 300 NV
34 5 Yes < 50 > 300 > 300 > 300 Down
Mean 3Protected
= 32
< 50 = 3 < 50 = 2 < 50 = 1 < 50 = 1 Downslope = 16
Maximum 13.0 100 – 200 = 10
100 – 200 = 8
100 – 200 = 2
100 – 200 = 4
Upslope = 1
Minimum 1 Not protected
= 2
> 300 = 21 > 300 = 24 > 300 = 31 > 300 = 29 Not visible = 17Std Dev 3.2
Std Dev = standard deviation; NV = slight or no slope with direction indeterminable
It is recommended that pollution sources, such as pit latrines, animal kraals and milking sheds are
located from 10 to 15 m away from a borehole as well as being down slope from the water source
(DWAF, 2004a). Household sanitation facilities in this study mostly comprises septic tanks, while
the majority of farm workers had access to ventilated improved pit latrines (VIP), which is typical
of South African rural conditions (DWA, 2012) (Table 7.2). The sanitation infrastructural design
on all the farms conformed to the recommended pollution prevention distances, for example, the
borehole on most farms was further than 100 m from the dairy, the collection point of the dairy
effluent, the kraal and the septic tank. On 16 farms the pollution sources were clearly downslope
© Central University of Technology, Free State
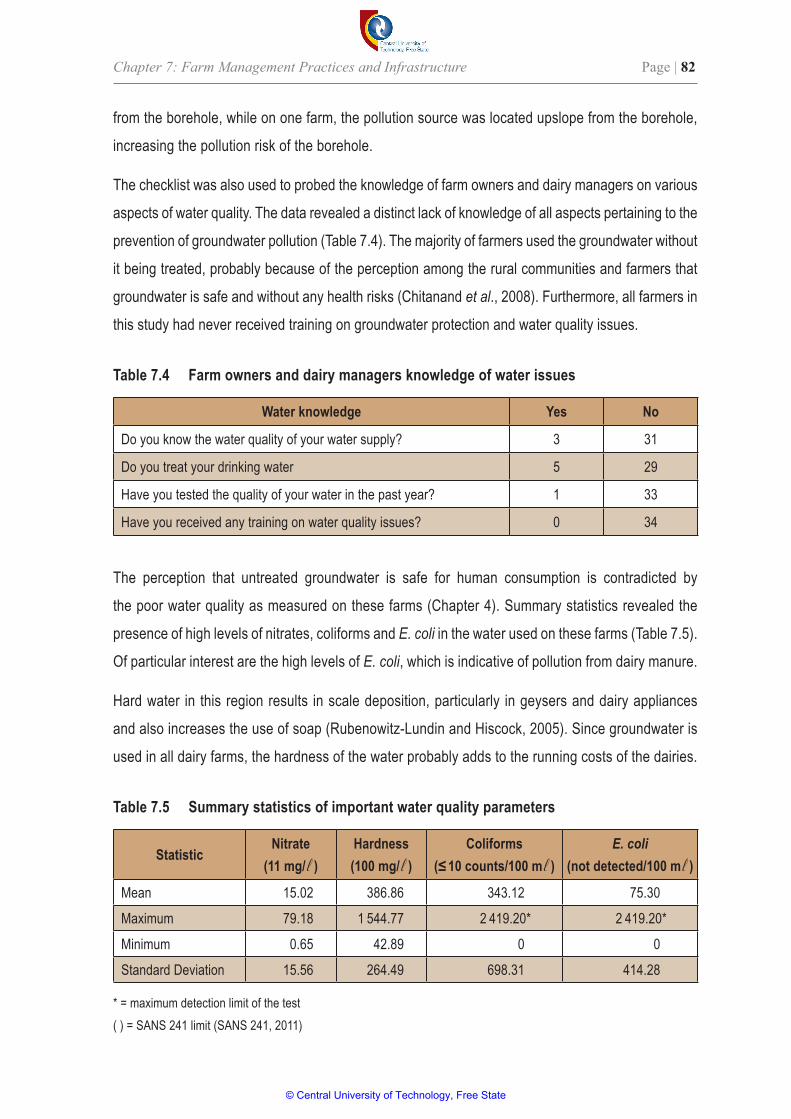
Chapter 7: Farm Management Practices and Infrastructure Page | 82
from the borehole, while on one farm, the pollution source was located upslope from the borehole,
increasing the pollution risk of the borehole.
The checklist was also used to probed the knowledge of farm owners and dairy managers on various
aspects of water quality. The data revealed a distinct lack of knowledge of all aspects pertaining to the
prevention of groundwater pollution (Table 7.4). The majority of farmers used the groundwater without
it being treated, probably because of the perception among the rural communities and farmers that
groundwater is safe and without any health risks (Chitanand et al., 2008). Furthermore, all farmers in
this study had never received training on groundwater protection and water quality issues.
Table 7.4 Farm owners and dairy managers knowledge of water issues
Water knowledge Yes No
Do you know the water quality of your water supply? 3 31
Do you treat your drinking water 5 29
Have you tested the quality of your water in the past year? 1 33
Have you received any training on water quality issues? 0 34
Table 7.5 Summary statistics of important water quality parameters
StatisticNitrate
(11 mg/ l )Hardness(100 mg/ l )
Coliforms(≤10counts/100ml )
E. coli(not detected/100 m l )
Mean 15.02 386.86 343.12 75.30
Maximum 79.18 1 544.77 2 419.20* 2 419.20*
Minimum 0.65 42.89 0 0
Standard Deviation 15.56 264.49 698.31 414.28
* = maximum detection limit of the test( ) = SANS 241 limit (SANS 241, 2011)
The perception that untreated groundwater is safe for human consumption is contradicted by
the poor water quality as measured on these farms (Chapter 4). Summary statistics revealed the
presence of high levels of nitrates, coliforms and E. coli in the water used on these farms (Table 7.5).
Of particular interest are the high levels of E. coli, which is indicative of pollution from dairy manure.
Hard water in this region results in scale deposition, particularly in geysers and dairy appliances
and also increases the use of soap (Rubenowitz-Lundin and Hiscock, 2005). Since groundwater is
used in all dairy farms, the hardness of the water probably adds to the running costs of the dairies.
© Central University of Technology, Free State
Chapter 7: Farm Management Practices and Infrastructure Page | 83
Possible correlations between farm management practices, infrastructure and the poor water
quality were investigated. A weak negative correlation existed between the number of cows on a
farm and the coliform values in the groundwater ( R 2 = 0.0023). Also, no correlation existed between
the number of cows on a farm and the E. coli values or the number of cows and the nitrate values
in the groundwater. These results suggested that the link between groundwater pollution and farm
management practices and infrastructure are not clear.
7.4 Conclusion
The challenge to increase production as well as to protect the environment and to ensure product
safety is an international challenge faced by all dairy farmers. To protect and ensure groundwater
quality in agricultural areas requires an integrated approach to farming (Schwarzenbach et al., 2010).
The results obtained from the study indicate that, although dairy farms vary in milk yield and size,
they are designed and managed in such a way as to prevent obvious groundwater contamination by
dairy effluent. The boreholes are protected and the distance from the borehole to the dairy and waste
collection area meet the criteria suggested by the Department of Water Affairs (DWA, 2004a). The
poor groundwater quality on the dairy farms is a health risk to all water consumers and a revision of
the current management practices is suggested. The extent of groundwater contamination largely
depends on the environmental context of an area, mostly hydrological and soil conditions (Graham
and Polizzotto, 2013). It is often difficult to isolate the source of groundwater pollution and therefore,
groundwater flow assessments will aid in the identification of dominant contamination sources of
the water (Graham and Polizzotto, 2013). The lack of knowledge and awareness of the farmers is
a concern and training and information sessions are needed to address this aspect. An in-depth
groundwater flow study will probably reveal some link between the dairy waste and groundwater
pollution because E. coli was present in the groundwater on 15 out of the 34 farms studied.
© Central University of Technology, Free State
Chapter 8: Conclusion and Recommendations Page | 84
Chapter 8 Conclusion and Recommendations
8.1 Introduction
Only 2.5% of the earth’s water is suitable for human consumption, the other 97% is in oceans
and seas (Chaudhary et al., 2011). Approximately 13% of the available freshwater is groundwater,
an essential source of drinking water for many people worldwide (Mahvi et al., 2005). More than
50% of the world’s population depends on groundwater as drinking water. Many rural and farming
communities are solely dependent on groundwater as their only source of drinking water (Mahvi
et al., 2005).
Although only about 13% of all water used in South Africa is from groundwater, it plays a major
role in South Africa, as millions of people are dependent on groundwater in rural and farming areas
(Colvin et al., 2008; Hay et al., 2012). Water quality at the source is dependent on the natural
geology of the area and the soils of the catchment, as well as anthropogenic factors such as land
use and disposal of waste in various forms.
Groundwater quality is described in terms of physical, chemical, and biological qualities. Naturally,
groundwater contains mineral ions. These ions originate from the surrounding geological structures
and slowly dissolve in the groundwater and are referred to as dissolved solids, which may be
either positively charged or negatively charged (Harter, 2003). The total mass of dissolved solids
is referred to as the total dissolved solids concentration and influences the electrical conductivity
of the water. Besides the naturally occurring inorganic constituents, organic matter originating from
topsoil, may affect the quality of groundwater. Complications arise where this water source becomes
contaminated and unfit for use because of high concentrations of chemicals and organic matter.
Intensive agriculture is one of the major anthropogenic sources of groundwater pollution. Dairy
farming, in particular, has been identified as an important source of domestic groundwater
contamination (Van der Schans et al., 2009). Contamination of groundwater occurs mainly through
inappropriate disposal of solid waste and effluent, land application of manure, fertiliser application
in mixed farming operations, as well as dairy wash water containing detergents and soaps. Typical
dairy contaminants include nitrates, phosphorus, faecal bacteria and sediment (Monaghan et al.,
2008). In this study, the quality of groundwater was investigated over two sampling years on dairy
© Central University of Technology, Free State
Chapter 8: Conclusion and Recommendations Page | 85
farms in the Free State. The results revealed concentrations of nitrates and faecal contaminants
well above acceptable limits, as well as high levels of hardness.
8.2 Nitrate pollution of groundwater
The manifestation of high nitrate levels in groundwater is a widespread phenomenon. Nitrate
pollution on dairy farms occurs via a variety of sources (Van der Schans et al., 2009). Typical
dairy farm nitrate pollutant sources include animal waste storage ponds, animal holding areas, crop
fields receiving animal waste and chemical fertiliser, surface run-off and waste from farm sanitation
facilities (Hooda et al., 2000; Smith et al., 2013).
Several studies focusing on groundwater quality have revealed elevated levels of nitrates, similar
to this study. In Ghana, 14% of 75 groundwater samples from the Densu Basin exceeded the WHO
limit of 10 mg/ l (Amoako et al., 2011). Measurements of nitrate concentrations of groundwater
samples from the basement complex of south western Nigeria reached levels up to 30.8 mg/ l (Ayodele, 2012). In Chikhwawa, Malawi significantly high nitrate concentrations of up to 200 mg/ l were recorded (Grimason et al., 2013). In this study, the highest measurements recorded in 2009
were 65.05 and 68.00 mg/ l, while in 2013 a measurement of 79.18 mg/ l was recorded.
When the mean nitrate measurements of the two years were compared (mean in 2009 = 13.7 mg/ l; mean in 2013 = 14.7 mg/ l), data indicated that nitrate levels in groundwater in the study region
could be increasing. This result is similar to the outcomes of a groundwater study in the Susa plain
of Khozestan-Iran, where data indicated an increase from a mean value of 6.3 mg/ l in 1998 to an
mean value of 10.4 mg/ l in 2004 (Mahvi et al., 2005).
When the state of pollution of the 2009 and 2013 groundwater samples of the participating farms
was compared, the data revealed minor differences in the overall nitrate pollution. The percentage
of non-compliant samples (n = 75) for 2009 was 49%, while for the non-compliant samples (n = 34)
for 2013 was 59%. In a similar dairy farm groundwater study in north eastern Mexico, 34% of the
samples were non-compliant (Pastén-Zapata et al., 2014), while in a groundwater study on dairy
farms in the San Joaquin Valley in California, all groundwater samples were non-compliant (Van der
Schans et al., 2009).
In South Africa, high nitrate levels in groundwater is the single most important reason for groundwater
sources to be declared unfit for drinking (Clarke et al., 2004; Colvin et al., 2008). Tredoux reported,
as early as 1993, that 27% of groundwater abstraction points (approximately 5 000) in South Africa
exceeded the current safe drinking water standard of 10 mg/ l (Colvin et al., 2008). This study
© Central University of Technology, Free State
Chapter 8: Conclusion and Recommendations Page | 86
supports this early finding that nitrate is a concern on dairy farms in the Free State, particularly to
the vulnerable members of the farming communities. Vulnerable members include infants, pregnant
woman, the elderly and the immune compromised. It was estimated in 2012 that 12.2% of the South
African population (6.4 million persons) were HIV positive, of which the Free State together with
Mpumalanga, had the second highest prevalence of all nine provinces (Shisana et al., 2014). The
Free State province had a HIV prevalence of 32.5% in 2011 (DoH, 2011).
The vulnerable communities on farms and other rural communities that rely upon groundwater
could be exposed to the widespread occurrence of high nitrate levels in South Africa. For example,
all but one of the groundwater samples at rural schools in the Greater Giyani Municipality exceeded
the recommended nitrate limit (Samie et al., 2013). Excessive consumption of water with high
levels of nitrate may result in the death of young infants as a result of methaemoglobinaemia or
“blue baby” disease. Because infants lack acidity in gastric juice, nitrate reducing bacteria can grow
in their upper intestinal tracts (Ayodele, 2012). When nitrate is ingested, it can be reduced to nitrite
before the nitrate is completely absorbed in the bloodstream and combine with haemoglobin to form
methaemoglobinaemia, which is ineffective as an oxygen carrier. The infant develops anoxaemia
and eventually dies by asphyxia (Ayodele, 2012). Other health effects associated with excessive
nitrate ingestion include cancer of gastrointestines and urinary tracts (Chaudhary et al., 2011) and
nitrate poisoning in animals (Pastén-Zapata et al., 2014).
In the environment, nitrates may be exported to surface water, which could lead to eutrophication,
thereby affecting biodiversity of mammals, birds, and fish populations by producing toxins and
reducing oxygen levels (Pastén-Zapata et al., 2014).
8.3 Microbiological pollution of groundwater
Groundwater is perceived as being less vulnerable to contamination than surface water given the
natural filtering ability of the soil subsurface (Graham and Polizzotto, 2013). Sanitation facilities
such as pit latrines and septic tanks are often presented as the most obvious sources of faecal
contamination of groundwater. Poor maintenance of boreholes, uncapped boreholes and poor
sanitary design, as well as subsurface leaching of microbial contaminants further contribute to
the microbial load of groundwater (Howard et al., 2003). Additional typical sources of microbial
contamination on dairy farms include inadequate manure and dairy effluent disposal.
Depending on the source, groundwater may contain a wide variety of harmless heterotrophic
microorganisms such as Flavobacterium spp., Pseudomonas spp., Acinetobacter spp.,
© Central University of Technology, Free State

Chapter 8: Conclusion and Recommendations Page | 87
Moraxella spp., Chromobacterium, Achromobacter spp. and Alcaligenes spp., as well as
numerous unidentified or unidentifiable bacteria (Aydin, 2007). Many microbial pathogens are
known to contaminate groundwater and include viruses, bacterial pathogens and protozoa, such
as Cryptospiridium and Giardia. These pathogens are frequently transmitted via drinking water
and are predominantly of faecal origin (Ashbolt, 2004). The presence of microbial contaminants
in groundwater indicates a rapid movement from the soil surface to the water-table because most
pathogenic microorganisms have only limited persistence; bacteria for example typically have
survival times measured in days or months (Howard et al., 2003).
Groundwater quality studies mostly constitute assessing the chemical and physical properties and
exclude microbiological analyses. Studies that do include microbiological quality assessments have
shown that microbial contamination of groundwater is relatively common. A groundwater study in
the Gaza Strip showed a number of non-compliant samples for coliforms and E. coli (16% and 7%
respectively). Similar results were found in a study conducted in Turkey (25% and 15% respectively)
(Aydin, 2007).
In Southern Africa, the prevalence of coliforms and E. coli in groundwater appeared to be higher
than in other studies. Gwimbi (2011) recorded that of the groundwater samples studies in Lesotho,
97% were non-compliant for coliforms and 71% for E. coli. In this study, the overall compliancy was
marginally better. In the 2009 sampling year, 60% of the samples were non-compliant for coliforms
and 29% for E. coli. In the 2013 round, 55% of the samples were non-compliant for coliforms and
41% for E. coli. The presence of coliforms and E. coli in so many samples in this study can probably
be attributed to poor sanitary conditions and unhygienic handling of solid waste and effluent, which
supports the view of Adekunle et al. (2007) that high coliform levels appear to be characteristic of
groundwater used for domestic purposes in rural and farming communities.
Faecal contamination of groundwater is a serious environmental health concern and has been linked
to outbreaks of various water-borne infections (Krolik et al., 2013). There were 288 documented
confirmed water-borne outbreaks of infectious enteric diseases caused by contaminated
groundwater in Canada over a 27-year period, with the most common pathogens being Giardia
intestinalis, Campylobacter sp., Salmonella and rotavirus (Krolik et al., 2013). Acute gastrointestinal
illness is the most recognised illness associated with poor microbiological water quality, presenting
symptoms such as fever, nausea, diarrhoea, and/or vomiting (Macler and Merkle, 2000). The
relatively high levels of coliforms and E. coli found in the groundwater on many of the farms in this
study are of concern, particularly for sensitive groups. Clinical infections from coliforms are common
© Central University of Technology, Free State
Chapter 8: Conclusion and Recommendations Page | 88
even with once-off consumption of water containing 100 – 1 000 coliforms per 100 m l (22% of farms
in 2009; 23% of farms in 2013) and serious health effects are indicated at levels > 1 000 per 100 m l (12% of farms in 2009; 5.6% of farms in 2013) (DWAF et al., 1998). Similarly, clinical infections are
common with once-off consumption of water containing 10 – 100 E. coli per 100 m l (8% of farms in
2009; 44% of farms in 2013) and serious health effects could result for users at counts greater than
100 per 100 m l (6.7% of farms in 2009) (DWAF et al., 1998). Furthermore, poor microbiological
water quality can also impact the quality of the dairy products and crops irrigated with such water,
which in turn could have a negative impact on the health of consumers of such produce (Perkins
et al., 2009; Elmoslemany et al., 2010; Hanjra et al., 2011).
8.4 Hardness of groundwater
Hardness levels in groundwater are determined by the geological structures of the underground
rock and soil (Deshmukh, 2013). Generally, hard water originates where the topsoil is thick with
limestone formations. The presence of cations of calcium and magnesium in groundwater is
predominantly responsible for groundwater hardness (Dave et al., 2012).
Most farms in this study presented hard water. In both sampling years, more than 90% of the
farms exceeded the limit of 100 mg/ l. The majority of the farms presented groundwater with very
hard water levels, more than 300 mg/ l. The maximum levels recorded in this study were 471 mg/ l (2009) and 1 544 mg/ l (2013). These results are similar to that of a study conducted in the different
municipalities of Limpopo, where most of the samples presented with hard to very hard water (Du
Toit et al., 2012).
Health effects of hard water are generally indicated in sensitive groups, causing possible chronic
effects. Particularly infants under the age of one year and individuals with a history of kidney or gall-
bladder stones (DWAF et al., 1998). Exposure to hard water has also been suggested to be a risk
factor that could aggravate eczema (WHO, 2011).
Hardness may have substantial financial implications for dairy farmers. Hard water prevents soap
lathering and increases the boiling point of water. Furthermore, hardness results in the accumulation
of scale (magnesium, manganese, iron, and calcium carbonates) in water delivery equipment
(Singh et al., 2012; Deshmukh, 2013). These effects impact the running cost of a dairy because of
exacerbated maintenance and electricity costs, as well as the increased soap use during cleaning
processes (Dave et al., 2012; Singh et al., 2012).
© Central University of Technology, Free State
Chapter 8: Conclusion and Recommendations Page | 89
8.5 Water quality index
Water quality indexes play a major role in the assessment and management of water quality.
The application and use of a WQI has increased across the world and is applied by water quality
professionals in USA, Canada, Europe, Iran, India and Nigeria (González et al., 2012; Yisa et al.,
2012; Mohebbi et al., 2013; Tyagi et al., 2013). The United Nations also applies a WQI to assess
the status of water quality worldwide (UNEP, 2007). The application of a WQI is a relatively recent
introduction and is used to communicate water quality information by water professionals to the
general public (Darko et al., 2013; Muthulakshmi et al., 2013; Tyagi et al., 2013).
In this study, various WQI were scrutinised and used to develop a suitable WQI that can be applied
to groundwater. Because of the versatility of the weighted WQI (Tiwari and Mishra, 1985; Jerome
and Pius, 2010), it was adapted, modified and extended for dairy farm groundwater. This modified
WQI includes, in particular, microbiological water quality parameters, which are conspicuously
absent from most other indexes. Other attributes of the modified WQI comprises the inclusion of
physical and chemical water quality parameters, adaptability to include additional parameters, ease
of interpretation, use of single sampling round measurements and simple to calculate.
The inclusion of the microbiological parameters as part of the modified WQI used in this study
revealed that the overall status of groundwater quality on the dairy farms was poor. The modified
WQI classified the groundwater as unsuitable for drinking of 35% of the farms in the 2009 sampling
season. In the 2013 sampling season, the groundwater quality had improved, showing only 11%
of the farms within an unsuitable for drinking classification, however this improvement was not
significant. In Nigeria, similar WQI results were obtained from a groundwater study, where poor
microbiological water quality was measured (Yisa et al., 2012).
8.6 Conclusion
This study supports the findings that groundwater is vulnerable to pollution from various sources on
dairy farms. These include waste disposal, sanitation practices and the use of fertiliser. In particular,
the microbiological quality of the groundwater on the dairy farms was poor. The high levels of
coliforms and E. coli in the groundwater confirm faecal pollution that could be indicative of poor
sanitary conditions. The farming communities residing on these farms consume the poor quality
groundwater on a daily basis. This water contains high concentrations of microbial organisms
and nitrates. Vulnerable groups on the farms are therefore particularly at risk of becoming ill.
Furthermore, the use of poor quality groundwater in dairy activities and other agricultural activities,
© Central University of Technology, Free State
Chapter 8: Conclusion and Recommendations Page | 90
such as the irrigation of crops, may further impact produce quality and could ultimately impact the
health of consumers.
A better understanding of the overall quality of groundwater in the Free State province is needed.
Limited data are available on groundwater quality, particularly in areas of agricultural activities and
mining. Further studies are thus needed for a more in-depth study of the groundwater quality in the
area and the reasons for change. Due to the inherent health impact that poor quality groundwater
holds in this region, it is imperative that farmers are made aware of the implications of using poor
quality groundwater in all operational and domestic activities, and how to undertake remedial
action. The versatility of the modified WQI has the potential to become a key tool in the study of
groundwater quality in the province and because of its simplicity of data interpretation, it could be of
great value to non-professionals such as farmers.
© Central University of Technology, Free State
Bibliography Page | 91
Bibliography
• Abernathy CO, Thomas DJ and Calderon RL. 2003. Health effects and risk assessment of
arsenic. The Journal of Nutrition. 133(5): 1536S-1538S.
• Adams S, Titus R, Pietersen K, Tredoux G and Harris C. 2001. Hydrochemical characteristics of
aquifers near Sutherland in the Western Karoo, South Africa. Journal of Hydrology. 241(1-2): 91.
• Adekunle IM, Adetunji MT, Gbadebo A and Banjoko OB. 2007. Assessment of groundwater
quality in a typical rural settlement in southwest Nigeria. International Journal of Environmental
Research and Public Health. 4(4): 307-318.
• Adesiyun AA, Webb L and Rahama S. 1995. Microbiological quality of raw cow’s milk at collection
centres in Trinidad. Journal of Food Protection. 58(2): 139-146.
• Ahaneku IE and Adeoye PA. 2014. Impact of pit latrines on groundwater quality of Fokoslum,
Ibadan, Southwestern Nigeria. British Journal of Applied Science & Technology. 4(3): 440-449.
• Ahmed R. 2010. Drinking water contamination and its effects on human health. In MPHP 429:
Introduction to Environmental Health 4.8.2010. [Online] Available at: http://www.cwru.edu/med/
epidbio/mphp439/Drinking_Water.pdf [Accessed: 16/11/2013].
• Akwensioge M. 2012. The influence of anthropogenic nitrate on groundwater quality in the Thaba
Nchu area. Unpublished M-thesis. University of the Free State, Bloemfontein.
• Ali I, Morin S, Barrington S, Whalen J, Bonnell R and Martinez J. 2006. Surface irrigation of dairy
farm effluent. Part I: Nutrient and bacterial load. Biosystems Engineering. 95(4): 547-556.
• Al-Khatib IA and Arafat HA. 2009. Chemical and microbiological quality of desalinated water,
groundwater and rain-fed cisterns in the Gaza strip, Palestine. Desalination. 249(3): 1165-1170.
• Alobaidy AHMJ, Abid HS and Maulood BK. 2010. Application of water quality index for
assessment of Dokan Lake ecosystem, Kurdistan Region, Iraq. Journal of Water Resource and
Protection. 2: 792-798.
• Altalhi AD and Hassan SA. 2009. Bacterial quality of raw milk investigated by Escherichia coli
and isolates analysis for specific virulence-gene markers. Food Control. 20: 913-917.
© Central University of Technology, Free State
Bibliography Page | 92
• Altekruse SF, Timbo BB, Mowbray JC, Bean NH and Potter ME. 1998. Cheese-associated
outbreaks of human illness in the United States, 1973 to 1992: Sanitary manufacturing practices
protect consumers. Journal of Food Protection. 61: 1405-1407.
• Alvarez VB, Eastridge M and Ji T. 2011. Reducing the Negative Impact of the Dairy Industry on
the Environment. In Fuquay JW, Fox PF and McSweeney PLH (eds.). Encyclopedia of Dairy
Sciences. 2 nd Ed. San Diego. Academic Press.
• Amoako J, Karikari AY and Ansa-Asare OD. 2011. Physico-chemical quality of boreholes in
Densu Basin of Ghana. Applied Water Science. 1: 41-48.
• Andrews J and Davison T. 2002. Dairy farm layout and design: Building and yard design, warm
climates. In Fuquay JW, Fox PF and McSweeney PLH (eds.). Encyclopedia of Dairy Sciences.
2 nd Ed. San Diego. Academic Press. pp. 13-28.
• Arbuckle TE, Sherman GJ, Corey PN, Walters D and Lo B. 1988. Water nitrates and CNS birth
defects: a population-based case-control study. Archives of Environmental Health. 43: 162-167.
• ARMC (Agricultural and Resource Management Council of Australia and New Zealand).
1999. Effluent management guidelines for dairy sheds in Australia. [Online] Available at:
http:/ /www.environment.gov.au/system/f i les/resources/9c8bc1b7-d21c-434a-a9c8-
1a0ec3c32848/files/dairy-sheds-australia-paper16a.pdf [Accessed:10/03/2012].
• Ashbolt NJ. 2004. Microbial contamination in drinking water and disease outcomes in developing
regions. Toxicology. 198: 229-238.
• Atalay A, Pao S, James M, Whitehead B and Allen A. 2008. Drinking water assessment
at underserved farms in Virginia’s coastal plain. Journal of Environmental Monitoring and
Restoration. 4: 53-64.
• ATSDR (Agency for Toxic Substances and Disease Registry). 2004. Toxic profile for copper.
[Online] Available at: http://www.atsdr.cdc.gov/toxprofiles/tp132-p.pdf [Accessed: 20/05/2014].
• ATSDR (Agency for Toxic Substances and Disease Registry). 2008. Toxic profile for cadmium.
[Online] Available at: http://www.atsdr.cdc.gov/toxprofiles/tp132-p.pdf [Accessed: 20/05/2014].
• Austin JW and Bergeron G. 1995. Development of bacterial biofilms in dairy processing lines.
Journal of Dairy Research. 62: 509-519. [Online] Available at: http://www.un.org/millenniumgoals/
environ.shtml [Accessed: 01/12/2013].
© Central University of Technology, Free State
Bibliography Page | 93
• Aydin A. 2007. The Microbiological and Physico-Chemical Quality of Groundwater in West
Thrace, Turkey. Polish Journal of Environmental Studies. 16(3): 377-383.
• Ayodele OS. 2012. Groundwater Quality Appraisal of Some Hand-Dug Wells and Boreholes
around Okemesi and Ikoro Area, Southwestern Nigeria. Global Journal of Science Frontier
Research Enviornment & Earth Sciences. 12(2): 17-33.
• Baram SD, Kurtzman DZ, Ronen Z, Peeters A and Dahan O. 2014. Assessing the impact of dairy
waste lagoons on groundwater quality using a spatial analysis of vadose zone and groundwater
information in a coastal phreatic aquifer. Journal of Environmental Management. 132: 135-144.
• Barba-Gutiérrez Y, Adenso-Díaz B and Lozano S. 2009. Eco-efficiency of electric and electronic
appliances: a data envelopment analysis (DEA). Environmental Modeling & Assessment. 14(4):
439-447.
• Batayneh AT. 2012. Toxic (aluminum, beryllium, boron, chromium and zinc) in groundwater:
health risk assessment. International Journal of Environmental Science and Technology. 9:
153-162.
• Battini F, Agostini A, Boulamanti AK, Giuntoli J and Amaducci S. 2014. Mitigating the
environmental impacts of milk production via anaerobic digestion of manure: Case study of a
dairy farm in the Po Valley. Science of the Total Environment. 481: 196-208.
• Baumgart-Getz A, Prokopy LS and Floress K. 2012. Why farmers adopt best management
practice in the United States: A meta-analysis of the adoption literature. Journal of Environmental
Management. 96(1): 17-25.
• Beck BF, Asmussen L and Leonard R. 1985. Relationship of geology, physiography, agricultural
land use and groundwater quality in Southwest Georgia. Groundwater. 23(5): 627-634.
• Belli P, Cantafora AF, Stella S, Barbieri S and Crimella C. 2013. Microbiological survey of milk
and dairy products from a small scale dairy processing unit in Maroua (Cameroon). Food Control.
32(2): 366-370.
• Biswas AK. 2001. Water policies in the developing world. International Journal of Water
Resources Development. 17(4): 489-499.
• Blackburn BG, Crun GF, Yoder JS, Hill V, Calderon RL, Chen V, Lee HS, Levy DA and Beach MJ.
2002. Surveillance of waterborne disease outbreaks associated with drinking water. Morbidity
and Mortality Weekly Report. 60(ss12): 1-32.
© Central University of Technology, Free State
Bibliography Page | 94
• Bogardi JJ, Dudgeon D, Lawford R, Flinkerbusch E, Meyn A, Pahl-Wostl C, Vielhauer K and
Vörösmarty C. 2012. Water security for a planet under pressure: interconnected challenges of
a changing world call for sustainable solutions. Current Opinion in Environmental Sustainability.
4(1): 35-43.
• Böhlke JK. 2002. Groundwater recharge and agricultural contamination. Hydrogeology Journal.
10(1): 153-179.
• Bord Bia (Irish Food Board). 2013. Sustainable Dairy Assurance Standard – Revision 01.
2013. [Online] Available at: http://www.bordbia.ie/industryservices/quality/SDQASDocuments/
SustainableDairyAssuranceScheme-ProducerStandard.pdf [Accessed: 10/03/2014].
• Borneman DL and Ingham S. 2014. Correlation between standard plate count and somatic cell
count milk quality results for Wisconsin dairy producers. Journal of Dairy Science. 97(5): 2646-
2652.
• Bouma J. 2011. Applying indicators, threshold values and proxies in environmental legislation: A
case study for Dutch dairy farming. Environmental Science and Policy. 14(3): 231-238.
• Boyacioglu B. 2007. Development of a water quality index based on a European classification
scheme. Water SA. 33(1): 101-106.
• Braune E and Xu Y. 2008. Groundwater management issues in Southern Africa – An IWRM
perspective. Water SA. 34(6) (IWRM Special Edition).
• Brown RM, McClelland NJ, Deininger RA and O’Conner MF. 1972. A water quality index crashing
the psychological barrier. In Proceedings of the International Conference on Water Pollution
Research. Jerusalem. 6: 787-797.
• Brown, RM, McClelland NJ, Deininger RA and Tozer RG. 1970. A Water Quality Index – Do We
Dare? Water & Sewage Works. pp. 339-343.
• Burkholder J, Libra B, Weyer P, Heathcote S, Koplin D, Thorne PS and Wichman M. 2007.
Impacts of Waste from Concentrated Animal Feeding Operations on Water Quality. Environmental
Health Perspective. 115(2): 308-312.
• Bytyqi H, Vehapi I, Rexhepi S, Thaqi M, Sallahi D and Mehmeti I. 2013. Impact of bacterial and
somatic cells content on quality fresh milk in small-scale dairy farms in Kosovo. Food & Nutrition
Sciences 4: 1014-1020. [Online] Available at: http://dx.doi.org/10.4236/fns.2013.410132
[Accessed: 26/04/2014].
© Central University of Technology, Free State
Bibliography Page | 95
• CAC/RCP (Codex Alimentarius Commission). 2004. Code of Hygiene Practice for Milk and
Milk Products. Rome. [Online] Available at: http://www.codexalimentarius.org/input/download/
standards/10087/CXP_057e.pdf [Accessed: 05/05/2014].
• Camejo J, Pacheco O and Guevara M. 2013. Study of Water Quality Classifiers. In Proceedings
of the Transboundary water management across borders and interfaces International Conference
& Workshops. Portugal.
• Carr GM and Neary JP. 2008. Water quality for ecosystems and human health. 2 nd Ed. United
Nations Environment Programme Global Environment Monitoring System.
• CCME (Canadian Council of Ministers of the Environment). 2001. Canadian water quality
guidelines for the protection of aquatic life: CCME Water Quality Index 1.0, User’s Manual. In
Canadian environmental quality guidelines, 1999. Winnipeg.
• CDC (Centre of Disease Control). 2013. Water-related emergencies and outbreaks. [Online]
Available at: http://www.cdc.gov/healthywater/emergency/fast_facts.html [Accessed: 20/05/2014].
• Chaudhary P, Ishaque M and Ishaque S. 2011. Chemical investigation of ground water near
agriculture field of Dhar, Madhya Pradesh (India). Journal of Environmental Research and
Development. 5(3): 638-643.
• Chitanand MP, Gyananath G and Lade HS. 2008. Bacterial assessment of groundwater: A case
study of Nanded city. Journal of Environmental Biology. 29(3): 315-318.
• Chomycia JC, Peter J, Hernes PJ, Harter T and Bergamaschi BA. 2008. Land management
impacts on dairy-derived dissolved organic carbon in ground water. Journal of Environmental
Quality. 37: 333-343.
• Claassen M. 2010. How much water do we have? In A CSIR Perspective on Water in South
Africa – 2010. CSIR Report No. CSIR/NRE/PW/IR/2011/0012/A. pp. 4-5.
• Clarke S, Tredoux G and Saayman I. 2004. In situ denitrification potential for South African
groundwater. In Proceedings of the 2004 Water Institute of Southern Africa (WISA) Biennial
Conference. Cape Town, South Africa. pp 413-422.
• Clover. 2013. Milk procurement protocol. [Online] Available at: http://www.clover.co.za/milk-
procurement-model [Accessed: 01/11/2013].
© Central University of Technology, Free State
Bibliography Page | 96
• Collins R, Mcleod M, Hedley M, Donnison A, Close M, Hanly J, Horne D, Ross C,
Davies-Colley R, Bagshaw C and Matthews L. 2007. Best management practices to mitigate
faecal contamination by livestock of New Zealand waters. New Zealand Journal of Agricultural
Research. 50(2): 267-278.
• Colvin C, Tredoux G, Clarke S, Le Meitre D, Engelbrecht P and Maherry A. 2008. Integration
goes underground: A review of groundwater research in support of sustainable development in
South Africa. Paper presented at the 2 nd CSIR Biannual Conference. CSIR, Pretoria.
• Corkal D, Schutzman WC and Hilliard CR. 2004. Rural water safety from the source to the on-
farm tap. Journal of Toxicology and Environmenatl Health. Part A. 67: 1619-1642.
• Cotruvo JA, Dufour A, Rees G, Bartram J, Carr R, Cliver DO, Craun GF, Fayer R and
Gannon VPG (Eds.). 2004. Water-borne Zoonoses – Identification, Causes and Control. London,
UK. IWA Publishing.
• Cummins PM, Dowling O and O’Connor BF. 2011. Ion-exchange chromatography: basic
principles and application to the partial purification of soluble mammalian prolyl oligopeptidase.
In Protein Chromatography. Humana Press. pp 215-228.
• DAFF (Department of Agriculture, Forestry and Fisheries). 2012. A Profile of the South African
Dairy Market Value Chain. [Online] Available at: http://www.nda.agric.za/doaDev/sideMenu/
Marketing/Annual%20Publications/Commodity%20Profiles/Livestock/Dairy%20Market%
20Value%20Chain%20Profile%202012-2013.pdf [Accessed: 26/10/2013].
• Dahiya S, Singh B, Gaur S, Garg VK and Kushwaha HS. 2007. Analysis of groundwater quality
using fuzzy synthetic evaluation. Journal of Hazardous Materials. 147: 938-946.
• Darko HF, Ansa-Asare O and Paintsil A. 2013. A Number Description of Ghanaian Water
Quality – A Case Study of the Southwestern and Coastal Rivers Systems of Ghana. Journal of
Environmental Protection. 4: 1318-1327.
• Dave GB, Limbachiya MC, Patel KC, Nimavat KS and Vyas KB. 2012. Some chemical property
of ground water use for plantation of Vijapur region’s villages of Gujarat, India. Journal of Applied
Technology in Environmental Sanitation. 2(1): 1-5.
• De Buyser ML, Dufour B, Maire M and Lafarge V. 2001. Implication of milk and milk products in
food-borne diseases in France and in different industrialised countries. International Journal of
Food Microbiology. 67(1): 1-17.
© Central University of Technology, Free State
Bibliography Page | 97
• De Magny GC, Thiaw W, Kumar V, Manga NIM, Diop BM, Gueye L, Kamara M, Roche B,
Raghu Murtugudde R, Rita R and Colwell RR. 2012. Cholera Outbreak in Senegal in 2005:
Was Climate a Factor? PLoS ONE. 7(8). [Online] Available at: http://www.plosone.org/article/
info%3Adoi%2F10.1371%2Fjournal.pone.0044577 [Accessed: 26/10/2013].
• De Oliveira LK, Fleck JD, Comerlato J, Kluge M, Bergamaschi B, Fabres RB, Da Luz RB, Dos
Santos Da Silva JV, Rodrigues MT, Genro JL, Staggemeier R, Baldasso N and Spilki FR. 2012.
Enteric viruses in water samples from Brazilian dairy farms. Agricultural Water Management.
111: 34-39.
• DEA (Department of Environmental Affairs). 2000. Environmental potential atlas for the Free
State. Dominant Geology. South Africa.
• Delfs JO, Gayler S, Streck T, Selle B, Klein C, Priesack E, Singh AKT, Wang W and Kolditz O.
2013. A distributed multi-compartment hydrological model with dynamic vegetation and nutrient
turnover. In EGU General Assembly Conference Abstracts. 15: 11134. 201.
• Deshmukh KK. 2013. Evaluation of groundwater quality with regard to livestock use from
Sangamner area, Ahmednagar district, Maharashtra, India. Rasayan Journal of Chemistry. 6(3):
245-257.
• Dinius SH. 1987. Design of an index of water quality. Water Resources Bulletin. 23(5): 833-843.
• DoH (Department of Health). 2011. The National Antenatal Sentinel HIV and Syphilis Prevalence
Survey, 2010. Pretoria. Internet publication. [Online] Available at: www.health-e.org.za/wp.../
f0980fb5107a7ce543a8bd5730e52333.pdf [Accessed: 14/10/2013].
• Dojlido J, Raniszewski J and Woyciechowska J. 1994. Water quality index-application for river in
Vistula River Basin in Poland. Water Science and Technology. 30(10): 57-64.
• Douagui AG, Kouame IK, Koffi K, Goula ATB, Dibi B, Gone DL, Coulibaly K, Seka AM,
Kouassi AK, Mangoua JMO and Savane I. 2012. Assessment of the bacteriological quality and
nitrate pollution risk of Quaternary groundwater in the southern part of Abidjan District (Côte
d’Ivoire). Journal of Hydro-Environment Research. 6(3): 227-238.
• DSA (Dairy Standards Agency). 2013. Code of practice for milk producers. [Online] Availabe
at: http://www.mpo.co.za/downloads/COP_for_Milk_Producers_Oct_2013.pdf [Accessed:
15/12/2013].
• Du Toit W, Holland M, Weidemann R and Botha F. 2012. Can groundwater be successfully
implemented as a bulk water resource within rural Limpopo Province? Analysis based on GRIP
© Central University of Technology, Free State
Bibliography Page | 98
datasets. Water SA. 38(3). International Conference on Groundwater. Special Edition 2012.
• DWA (Department of Water Affairs). 2010. National Groundwater Strategy. Department of Water
Affairs, Pretoria. [Online] Available at: http://www.dwa.gov.za/Groundwater/gs.aspx [Accessed:
17/05/2010].
• DWA (Department of Water Affairs). 2011. Blue Drop report 2011. [Online] Available at: http://www.
ewisa.co.za/misc/BLUE_GREENDROPREPORT/BlueDrop2011.htm [Accessed: 15/10/2013].
• DWA (Department of Water Affairs). 2012. Sanitation services – quality of sanitation in South
Africa. Report on the Sanitation Services in South Africa. [Online] Available at: http://www.
thepresidency-dpme.gov.za/dpmewebsite/_admin/Images/ProductDocuments/Sanitation%20
Report.pdf [Accessed: 20/12/2012].
• DWA (Department of Water Affairs). 2012. Water reconciliation strategy study for the large bulk
water supply systems: greater Bloemfontein area. Pretoria.
• DWAF (Department of Water Affairs and Forestry). 1996. South African Water Quality Guidelines.
2 nd Ed. Volume 1. Domestic Use.
• DWAF (Department of Water Affairs and Forestry). 2000. Policy and strategy for groundwater
quality management in South Africa. Number W.1.0: 1 st Ed.
• DWAF (Department of Water Affairs and Forestry). 2004a. Groundwater Protection. Guidelines
for protecting boreholes and wells. Toolkit for water services. Number 3.3. Pretoria.
• DWAF (Department of Water Affairs and Forestry). 2004b. Guidelines on protecting groundwater
from contamination. Toolkit for water services. Number 3.4. Pretoria.
• DWAF (Department of Water Affairs and Forestry). 2006. Minimum requirements for sampling
drinking water systems: A user-friendly summary guide. Ver. 1. Pretoria.
• DWAF (Department of Water Affairs and Forestry). 2009a. A Drinking Water Quality Framework
for South Africa. Minimum Requirements for Blue drop certification. 4 th Ed. Pretoria.
• DWAF (Department of Water Affairs and Forestry). 2009b. A strategy for incentive-based
regulation Blue and Green drop certification. Pretoria.
• DWAF, DoH and WRC (Department of Water Affairs and Forestry, Department of Health
and Water Research Commission). 1998. Quality of domestic water supplies. Vol 1, 2 nd Ed.
No:TT101/98.
• Dzwairo B, Hoko Z, Love D and Guzha E. 2006. Assessment of the impacts of pit latrines on
© Central University of Technology, Free State
Bibliography Page | 99
groundwater quality in rural areas: A case study from Mawendera District, Zimbabwe. Physics
and Chemistry of the Earth. 31: 779-788.
• EC (European Commission). 1998. The quality of water intended for human consumption.
COUNCIL DIRECTIVE 98/83/EC. Official Journal of the European Communities.
• EFSA (European Food Safety Association). 2009. Effects of farming systems on dairy cow
welfare and disease. Annex to the EFSA Journal. 1143: 11-284.
• Elmoslemany AM, Keefe GP, Dohoo IR, Wichtel JJ, Stryhn H and Dingwell RT. 2010. The
association between bulk tank milk analysis for raw milk quality and on-farm management
practices. Preventive Veterinary Medicine. 95(1): 32-40.
• EPA (Environmental Protection Agency). 1999. 25 Years of the Safe Drinking Water Act:
History and trends. EPA Report 816-R-99-007. [Online] Available at: http://yosemite.epa.gov/
water/owrccatalog.nsf/0/b126b7616c71450285256d83004fda48?OpenDocument [Accessed:
15/05/2014].
• EPA (Environmental Protection Agency). 2003. National Management Measures to Control
Nonpoint Source Pollution from Agriculture. EPA 841-B-03-004. [Online] Available at: http://
water.epa.gov/polwaste/nps/agriculture/agmm_index.cfm [Accessed: 15/05/2014].
• Esterhuizen L, Fossey A and Lues JFR. 2012. Dairy farm borehole water quality in the greater
Mangaung region of the Free State Province, South Africa. Water SA. 38(5): 803-806.
• FAO and IDF (Food and Agriculture Organization of the United Nations and International Dairy
Federation). 2011. Guide to good dairy farming practice. Animal production and health guidelines.
No. 8. Rome. [Online] Available at: www.fao.org/docrep/014/ba0027e/ba0027e00.pdf [Accessed:
18/05/2014].
• Fawell J and Niewenhuijsen M. 2003. Contaminants in drinking water. British Medical Bulletin.
68: 199-208.
• Fawell J, Bailey K, Chilton J, Dahi E, Fewtrell L and Magara Y. 2006. Fluoride in drinking water.
London, UK. IWA Publishing.
• FDC (Free State Development Corporation). 2014. Free State province economy. [Online]
Available at: http://www.fdc.co.za/index.php?option=com_content&view=article&id=79&Item
id=89 [Accessed: 12/06/2014].
• Fenton O, Healy MG, Brennan RB, Serrenho AJ, Lalor ST, O hUallacháin D and Richards KG.
2011. Agricultural Dairy Wastewaters. Waste Water – Evaluation and Management. [Online]
© Central University of Technology, Free State
Bibliography Page | 100
Available at: http://www.intechopen.com/books/wastewater-evaluation-and-management/agricultural-
dairy-wastewaters [Accessed: 10/10/2013].
• Foster S and Ait-Kadi M. 2012. Integrated Water Resources Management (IWRM): How does
groundwater fit in? Hydrogeology Journal. 20(3): 415-418.
• Frank JF and Hassan AN. 2003. Microorganisms associated with milk. In Roginski H, Fuquay JW
and Fox PF (eds.). Encyclopedia of Dairy Sciences. London. Academic Press.
• Gandure S, Walker S and Botha JJ. 2013. Farmers’ perceptions of adaptation to climate change
and water stress in a South African rural community. Environmental Development. 5: 39-53.
• Gertenbach WD. 2005. Breeds of dairy cattle. Cedara Agricultural Development Institute.
[Online] Available at: http://agriculture.kzntl.gov.za/AgricPublications/ProductionGuidelines/Dairying
inKwaZuluNatal/BreedsofDairyCattle/tabid/239/Default.aspx [Accessed: 22/10/2013].
• Gillingham AG and Thorrold BS. 2000. A review of New Zealand research measuring
phosphorus in runoff from pasture. Journal of Environmental Quality. 29: 88-96.
• Gleeson D, O’Connell A and Jordan K. 2013. Review of potential sources and control of
thermoduric bacteria in bulk-tank milk. Irish Journal of Agricultural and Food Research. 52(2):
217-227.
• Gomo M, Steyl G and Van Tonder G. 2012. Investigation of Groundwater Recharge and Stable
Isotopic Characteristics of an Alluvial Channel. Hydrology Current Research. S12: 1-7. [Online]
Available at: http://dx.doi.org/10.4172/2157-7587.S12-002 [Accessed: 20/01/2014].
• González JD, Carvajal LF and Toro FM. 2012. Water quality index based on fuzzy logic applied
to the Aburra river basin in the jurisdiction of the metropolitan area. Dyna. 171: 50-58.
• Goss M and Richards C. 2008. Development of a risk-based index for source water protection
planning, which supports the reduction of pathogens from agricultural activity entering water
resources. Journal of Environmental Management. 87: 623-632.
• Gourley CJP, Aarons SR and Powell JM. 2012. Nitrogen use efficiency and manure management
practices in contrasting dairy production systems. Agriculture, Ecosystems and Environment.
147: 73-81.
• Graham JP and Polizzotto ML. 2013. Pit latrines and their impacts on groundwater quality: a
© Central University of Technology, Free State
Bibliography Page | 101
systematic review. Environmental Health Perspectives. 121(5): 521-530.
• Gray NF. 2014. The Implications of Global Warming and Climate Change on Waterborne
Diseases. In Percival S, Yates MV, Williams D, Chalmers R and Gray N. Microbiology of
Waterborne Diseases. 2 nd Ed. London. Academic Press. pp. 653-666.
• Grimason AM, Morse TD, Beattie TK, Masangwi SJ, Jabu GC, Taulo SC and Lungu KK. 2013.
Classification and quality of groundwater supplies in the Lower Shire Valley, Malawi – Part 1:
Physico-chemical quality of borehole water supplies in Chikhwawa, Malawi. Water SA. 39(4):
563-572.
• Gwimbi P. 2011. The microbial quality of drinking water in Manonyane community: Maseru
District (Lesotho). African Health Sciences. 11(3): 474-480. [Online] Available at: http://water.
epa.gov/polwaste/nps/agriculture/upload/2003_09_24_NPS_agmm_chap4d.pdf [Accessed:
10/04/2013].
• Hanjra MA, Evans AEV, Jiang Y, Qadir M and Drechsel P. 2011. Wastewater irrigation and
environmental health: Implications for water governance and public policy. International Journal
Hygiene and Environmental Health. 215(3): 255-269.
• Harter T. 2001. Groundwater Hydrology. Department of Land, Air and Water Resources,
University of California. [Online] Available at: http://groundwater.ucdavis.edu/files/136254.pdf
[Accessed: 20/09/2014].
• Harter T. 2003. Groundwater Quality and Groundwater Pollution. ANR Publication. University
of California. [Online] Available at: http://groundwater.ucdavis.edu/files/156562.pdf [Accessed:
20/09/2014].
• Harter T, Davis H, Mathews MC and Meyer RD. 2002. Shallow groundwater quality on dairy
farms with irrigated forage crops. Journal of Contaminant Hydrology. 55: 287-315.
• Hay ER, Riemann K, Van Zyl G and Thompson I. 2012. Ensuring water supply for all towns and
villages in the Eastern Cape and Western Cape Provinces of South Africa. Water SA. 38(3)
International Conference on Groundwater. Special Edition 2012: 437-444.
• Healy MG, Rodgers M and Mulgueen J. 2007. Treatment of dairy wastewater using constructed
wetlands and intermittent sand filters. Bioresource Technology. 98: 2268-2281.
• Heuvelink AE, Van Heerwaarden C, Zwartkruis-Nahuis CA, Tilburg JJHCT, Bos HM, Heilmann FGC,
Hofhuis A, Hoekstra T and De Boer TE. 2009. Two outbreaks of campylobacteriosis associated
with the consumption of raw cows’ milk. International Journal of Food Microbiology. 134: 70-74.
© Central University of Technology, Free State
Bibliography Page | 102
• Hillerton JE and Berry E. 2004. Quality of the milk supply: European Regulations Versus Practice.
NMC Annual Meeting Proceedings. pp. 207-214
• Hooda PS, Edwards UAC, Anderson HA and Miller A. 2000. A review of water quality concerns
in livestock farming areas. Science of the Total Environment. 250: 143-167.
• Horton RK.1965. An index number system for rating water quality. Journal Water Pollution
Control Federation. 37(3): 300-306.
• Houlbrooke DJ. 2008. Best practice management of farm dairy effluent in the Manawatu-
Wanganui region. Horizons Regional Council. Reviewed in AgResearch. [Online] Available at:
www.envirolink.govt.nz/pagefiles/376/421-hzlc43.pdf [Accessed: 18/02/2014].
• Howard G, Pedley S, Barrett M, Nalubega M and Johal K. 2003. Risk factors contributing to
microbiological contamination of shallow groundwater in Kampala, Uganda. Water Research.
37: 3421-3429.
• HPA (Health Protection Agency). 2004. Enumeration of coliforms and Esherichia coli by IDEXX
(Colilert 18) Quanti-try™. National Standard Method. W18 Issue 2. [Online] Available at: http://
www.hap-standardmethods.org.uk/pdf-sops.asp [Accessed: 13/10/2013].
• Hudak PF. 2000. Regional trends in nitrate content of Texas groundwater. Journal of Hydrology.
228: 37-47.
• Huebsch M, Horan B, Blum P, Richards KG, Grant J and Fenton O. 2013. Impact of agronomic
practices of an intensive dairy farm on nitrogen concentrations in a karst aquifer in Ireland.
Agriculture, Ecosystems & Environment. 179: 187-199.
• Hurley T, Sadiq R and Mazumder A. 2012. Adaptation and evaluation of the Canadian Council
of Ministers of the Environment Water Quality Index (CCME WQI) for use as an effective tool to
characterize drinking source water quality. Water Research. 46: 3544-3552.
• Hutton G and Bartram J. 2008. Global costs of attaining the Millennium Development Goal for
water supply and sanitation. Bulletin of the World Health Organization. 86: 13-19.
• Jamieson RC, Gordon RJ, Sharples KE, Stratton GW and Madani A. 2002. Movement and
persistence of fecal bacteria in agricultural soils and subsurface drainage water: A review.
Canadian Biosystems Engineering. 44(1): 1-9.
• Jayarao BM, Donaldson SC, Straley BA, Sawant AA, Hegde NV and Brown JL. 2006. A survey
© Central University of Technology, Free State
Bibliography Page | 103
of foodborne pathogens in bulk tank milk and raw milk consumption among farm families in
Pennsylvania. Journal of Dairy Science. 89(7): 2451-2458.
• Jayarao BM, Pillai SR, Sawant AA, Wolfgang DR and Hegde NV. 2004. Guidelines for monitoring
bulk tank milk somatic cell and bacterial counts. Journal of Dairy Science. 87(10): 3561-3573.
• Jerome C and Pius A. 2010. Evaluation of Water Quality Index and its impact on the quality of
life in an industrial area in Bangalore, South India. American Journal of Scientific and Industrial
Research. 1(3): 595-603.
• Jiang S, Pang L, Buchan GD, Šimůnek J, Noonan MJ and Close ME. 2010. Modeling water flow
and bacterial transport in undisturbed lysimeters under irrigations of dairy shed effluent and
water using HYDRUS-1D. Water Research. 44(4): 1050-1061.
• Jones DL. 1999. Potential health risks associated with the persistence of Escherichia coli 0157
in agricultural environments. Soil Use and Management. 15(2): 78-83.
• Jones EA and Hemmings MJ. 1989. Spectrophotometric determination, by flow-injection
analysis, of thiocyanate in metallurgical process solutions containing free cyanide and metal
cyanide complexes. South African Journal of Chemistry. 42(1): 6-8.
• Kay D, Crowther J, Fewtrell L, Francis AC, Hopkins M, Kay C, McDonald AT, Stapleton CM,
Watkins J, Wilkinson J and Wyer MD. 2008. Quantification and control of microbial pollution from
agriculture: a new policy challenge? Environmental Science and Policy. 2: 171-184.
• Khan AA, Paterson R and Khan H. 2005. Modification and Application of the Canadian Council
of Ministers of the Environment Water Quality Index (CCME WQI) for the Communication of
Drinking Water Quality Data in Newfoundland and Labrador. Water Quality Research Journal of
Canada. 39: 285-293.
• Knowlton KF, Wilkerson VA, Casper DP and Mertens DR. 2010. Manure nutrient excretion by
Jersey and Holstein cows. Journal of Dairy Science. 93(1): 407-412.
• Knüppe K. 2011. The challenges facing sustainable and adaptive groundwater management in
South Africa. Water SA. 37(1): 67-79.
• Kostraba JN, Gay EC, Rewers M and Hamman RF. 1992. Nitrate levels in community drinking
waters and risk of IDDM: an ecological analysis. Diabetes Care. 15: 1505-1508.
• Kotze YL, Van Tonder GJ and Van der Merwe J. 2013. Groundwater use authorisations as part of
groundwater resource management in water scarce areas within South Africa. Paper presented
© Central University of Technology, Free State
Bibliography Page | 104
at 13 th Groundwater Division Conference. Durban, South Africa.
• Krolik J, Maier A, Evans G, Belanger P, Hall G, Joyce A and Majury A. 2013. A spatial analysis
of private well water Escherichia coli contamination in southern Ontario. Geospatial Health. 8(1):
65–75.
• Kumar D and Alappat BJ. 2009. NSF-Water Quality Index: Does it Represent the Experts’
Opinion? Practice Periodical of Hazardous, Toxic and Radioactive Waste Management. 13(1):
75-79.
• KZN DAEA (KwaZulu-Natal Department of Agriculture and Environmental Affairs). 2013. Breeds of
dairy cattle. [Online] Available at: http://www.kzndae.gov.za/en-za/agriculture/agricpublications/
productionguidelines/dairyinginkwazulunatal/breedsofdairycattle.aspx [Accessed: 06/05/2014].
• LeJeune JT and Rajala-Schultz PJ. 2009. Unpasteurized milk: A continued public health threat.
Clinical Infectious Diseases. 48(1): 93-100.
• Levy J. 2011. Review: groundwater management and groundwater/surface-water interaction in
the context of South African water policy. Hydrogeology Journal. 20: 205-226.
• Li JW, Xin ZT, Wang XW, Zheng JL and Chao FH. 2002. Mechanisms of inactivation of hepatitis A
virus by chlorine. Applied and Environmental Microbiology. 68(10): 4951-4955.
• Liou SM, Lo SM and Wang SH. 2004. A Generalized Water Quality Index for Taiwan.
Environmental Monitoring and Assessment. 96(1-3): 35-52.
• Lund BM and O’Brien SJ. 2011. The occurrence and prevention of foodborne disease in
vulnerable people. Foodborne Pathogens and Disease. 8(9): 961-973.
• Lund BM, Gould WG and Rampling AM. 2002. Pasteurization of milk and the heat resistance of
Mycobacterium avium subsp. paratuberculosis: A critical review of the data. International Journal
of Food Microbiology. 77: 135-145.
• MacDonald AM and Davies J. 2000. A brief review of groundwater for rural water supply in
sub-Saharan Africa. BGS Technical Report WC/00/33. [Online] Available at: http://nora.nerc.
ac.uk/501047/1/SSA_review_lr.pdf [Accessed: 22/08/2013].
• MacDonald AM, Bonsor HC, Dochartaigh BEO and Taylor RG. 2012. Quantitative maps of
groundwater resources in Africa. Environmental Research Letters. UK. IOP Publishing Ltd.
• Macler BA and Merkle JC. 2000. Current knowledge on groundwater microbial pathogens and
© Central University of Technology, Free State
Bibliography Page | 105
their control. Hydrogeology Journal. 8: 29-40.
• Maherry A, Clarke S, Tredoux G and Engelbrecht P. 2009. A spatial and temporal analysis of
the nitrate concentrations in groundwater for South Africa. Paper presented at the Biennial
Groundwater Conference of the International Association of Hydrogeologists. Somerset West,
South Africa. 16-18 November 2009.
• Mahvi AH, Nouri J, Babaei AA and Nabizade R. 2005. Agricultural activities impact on groundwater
nitrate pollution. International Journal of Environmental Science and Technology. 2(1): 41-47.
• Masetti M, Poli S, Sterlacchini S, Beretta GP and Facchi A. 2008. Spatial and statistical
assessment of factors influencing nitrate contamination in groundwater. Journal of Environmental
Management. 86: 272-281.
• McLay CDA, Dragten R, Sparling G and Selvarajah N. 2001. Predicting groundwater nitrate
concentrations in a region of mixed agricultural land use: a comparison of three approaches.
Environmental Pollution. 115(2):191-204.
• Meyer D, Price PL, Rossow HA, Silva-del-Rio N, Karle BM, Robinson PH, DePeters EJ and
Fadel JG. 2011. Survey of dairy housing and manure management practices in California.
Journal of Dairy Science. 94(9): 4744-4750.
• Meyer M, Garnett DI and Guthrie JC. 1997. A survey of dairy manure management practices in
California. Journal of Dairy Science. 80(8): 1841-1845.
• Milk SA. 2013. Lacto Data Statistics. Milk South Africa. 16(2): 1-24. [Online] Available at:
http://www.milksa.co.za/sites/default/files/BIPLAC015%20November%202012.pdf [Accessed:
12/02/2014].
• Millogo V, Svennersten SK, Ouédraogo GA and Agenäs S. 2010. Raw milk hygiene at farms,
processing units and local markets in Burkina Faso. Food Control. 21(7): 1070-1074.
• Mingzhu L, Seyf-Laye AM, Ibrahim T, Gbandi DB and Honghan C. 2014 Tracking sources of
groundwater nitrate contamination using nitrogen and oxygen stable isotopes at Beijing area,
China. Environmental Earth Sciences. 72(3): 707-715.
• Mintz ED and Tauxe RV. 2013. Cholera in Africa: A Closer Look and a Time for Action. Journal of
Investigative Dermatology. 208(1): S4-S7.
• Mkhabela TS and Mndeme SH. 2010. The cost of producing milk in the KwaZulu-Natal Midlands
© Central University of Technology, Free State
Bibliography Page | 106
of South Africa: a cost-curve approach. Agrekon. 49(1): 122-142.
• Mohebbi MR, Saeedi R, Montazeri A, Vaghefi KA, Labbafi S, Oktaie S, Abtahi M and
Mohagheghian A. 2013. Assessment of water quality in groundwater resources of Iran using a
modified drinking water quality index (DWQI). Ecological Indicators. 30: 28-34.
• Mokhele E and Walker S. 2012. Evaluation of NASA satellite and modelled temperature data
for simulating maize water requirement satisfaction index in the Free State Province of South
Africa. Physics and Chemistry of the Earth. 50: 157-164.
• Molewa E. 2011. Statement by the Minister of Water and Environmental Affairs Mrs Edna Molewa
at the release of the Blue Drop and Green Drop assessment reports. [Online] Available at: http://
www.gov.za/speeches/view.php?sid=19743 [Accessed: 30/06/2011].
• Molineri AI, Marcelo LS, Alejandra LC, Vilma RC, Verónica EN, Norma BR, Julio CB and Luis FC.
2012. Association between milking practices and psychrotrophic bacterial counts in bulk tank
milk. Revista Argentina de Microbiología. 44(3): 187-194.
• Momba MNB, Obi CL and Thompson P. 2009. Survey of disinfection efficiency of small drinking
water treatment plants: challenges facing small water treatment plants in South Africa. Water SA.
35(4): 485-493.
• Monaghan RM, Carey PL, Wilcock RJ, Drewry JJ, Houlbrooke DJ, Quinn JM and Thorrold BS.
2009. Linkages between land management activities and stream water quality in a border dyke-
irrigated pastoral catchment. Agriculture, Ecosystems and Environment. 129: 201-211.
• Monaghan RM, De Klein CAM and Muirhead RW. 2008. Prioritisation of farm scale remediation
efforts for reducing losses of nutrients and faecal indicator organisms to waterways: A case
study of New Zealand dairy farming. Journal of Environmental Management. 87: 609–622.
• Monaghan RM, Hedley MJ, Di HJ, McDowell RW, Cameron KC and Ledgard SF. 2007. Nutrient
management in New Zealand pastures — recent developments and future issues. New Zealand
Journal of Agricultural Research. 50: 181-201.
• Mpenyana-Monyatsi L and Momba MNB. 2012. Assessment of groundwater quality in the rural
areas of the North West Province, South Africa. Scientific Research and Essays. 7(8): 903-914.
• Mpenyana-Monyatsi L, Onyango MS and Momba MNB. 2012. Groundwater quality in a South
African rural community: A possible threat to public health. Polish Journal of Environmental
Studies. 21: 1349–1358.
• Munnik V. 2013. Blue and Green Drop are turning the tide in water quality. The Mvula Trust.
© Central University of Technology, Free State
Bibliography Page | 107
South Africa. [Online] Available at: http://www.mvula.co.za/images/uploads/Blue__Green_Drop.
pdf [Accessed: 12/04/2014].
• Muthulakshmi AL, Natesan U, Deepthi K, Ferrer VA, Venugopalan VP and Narasimhan SV.
2013. Assessment of water quality through indices around Kalpakkam, Southeast coast of India.
Archives of Environmental Science. 7: 23-32.
• Nada S, Ilija D, Igor T, Jelena M and Ruzica G. 2012. Implication of food safety measures on
microbiological quality of raw and pasteurized milk. Food Control. 25(2): 728-731.
• Nasirian M. 2007. A new water quality index for environmental contamination contributed by
mineral processing: A case study of Amang (Tin Tailing) processing activity. Journal of Applied
Sciences. 7(20): 2977-2987.
• National Water Act, No. 36 of 1998. [Online] Available at: http://www.acts.co.za/ [Accessed:
24/09/2013].
• Ndambi OA and Hemme T. 2009. An economic comparison of typical dairy farming systems in
South Africa, Morocco, Uganda and Cameroon. Tropical Animal Health and Production. 41: 979-
994.
• Nel J, Xu Y, Batelaan O and Brendonck L. 2009. Benefit and Implementation of Groundwater
Protection Zoning in South Africa. Water Resources Management. 23(14): 2895-2911.
• NFU (National Farmers Union). 2010 . Dairy cow welfare strategy. NFU. [Online] Available at:
http://www.eblex.org.uk/wp/wp-content/uploads/2013/06/Dairy-cow-welfare-report-2010.pdf
[Accessed: 04/04/2013].
• Nolan BT and Hitt KJ. 2006. Vulnerability of shallow groundwater and drinking-water wells to
nitrate in the United States. Environmental Science and Technology. 40(24): 7834-7840.
• NZFSA (New Zealand Food Safety Authority). 2009. NZCP1: Code of practice for the design and
operation of farm dairies. pp. 11-14.
• Oberholster PJ and Ashton PJ. 2008. An Overview of the Current Status of Water Quality and
Eutrophication in South African Rivers and Reservoirs. Parliamentary Grant Deliverable – March
2008. State of the Nation Report. pp. 1-15.
• Obilonu AN, Chijioke C, Igwegbe WE and Ibearugbulem OIand Abubakar YF. 2013. Water quality
challenges and impact. International Letters of Natural Sciences. 4: 44-53.
© Central University of Technology, Free State
Bibliography Page | 108
• Odonkor ST and Addo KK. 2013. Bacteriological profile and physico-chemical quality of ground
water: a case study of bore hole water sources in a rural Ghanaian community. International
Journal of Current Microbiology and Applied Sciences. 2(8): 21-40.
• Oliver SP, Boor KJ, Murphy SC and Murinda SE. 2009b. Food safety hazards associated with
consumption of raw milk. Foodborne Pathogens and Disease. 6: 793-806.
• Oliver SP, Jayarao BM and Almeida RA. 2005. Foodborne pathogens in milk and the dairy farm
environment: food safety and public health implications. Foodborne Pathogens and Disease. 2:
115-129.
• Ongoley ED. 1999. Water quality management: design, financing and sustainability
considerations. In Proceedings of the African Water Resources Policy Conference. Nairobi. The
World Bank. pp.1-16.
• Owen R. 2011. Groundwater needs assessment: Limpopo Basin Commission. Africa
Groundwater Network. [Online] Available at: www.splash-era.net/downloads/groundwater/2_
LIMCOM_final_report.pdf [Accessed: 04/08/2013].
• Palaniappan M, Gleick PH, Allen L, Choen MJ, Christian-Smith J, Smith C and Rose N (eds.).
2010. Clearing the waters. A focus on water quality solutions. United Nations Environment
Programme. [Online] Available at: http://www.unep.org/PDF/Clearing_the_Waters.pdf
[Accessed: 04/06/2013].
• Pastén-Zapata E, Ledesma-Ruiz R, Harter T, Ramírez AI and Mahlknecht J. 2014. Assessment
of sources and fate of nitrate in shallow groundwater of an agricultural area by using a multi-
tracer approach. Science of the Total Environment. 470-471: 855-864.
• Pell AN. 1997. Manure and Microbes: Public and Animal Health Problem? Journal of Dairy
Science. 80(10): 2673-2681.
• Perkins NR, Kelton DF, Hand KJ, MacNaughton G, Berke O and Leslie E. 2009. An analysis of
the relationship between bulk tank milk quality and wash water quality on dairy farms in Ontario,
Canada. Journal of Dairy Science. 92: 3714-3722.
• Pietersen K, Beekman HE, Holland M and Adams S. 2012. Groundwater governance in South
Africa: A status assessment. Water SA. 38(3): 435-459.
© Central University of Technology, Free State
Bibliography Page | 109
• Rahaman MM and Varis O. 2005. Integrated water resources management: evolution, prospects
and future challenges. Sustainability: Science, Practice & Policy. 1(1): 15-21.
• Rajkumar Y and Xu Y. 2011. Protection of Borehole Water Quality in Sub-Saharan Africa using
Minimum Safe Distances and Zonal Protection. Water Resources Management. 25(13): 3413-
3425.
• Ramakrishnaiah CR, Sadashivaiah C and Ranganna G. 2009. Assessment of Water Quality
Index for the groundwater in Tumkur Taluk, Kamataka State, India. E-Journal of Chemistry. 6(2):
523-530.
• Regulation 961 (South African Government Notice No. R961 of 23 November 2012). 2012.
Regulations Relating to Hygiene Requirements for Milking Sheds, The Transport of Milk and Related
Matters. Act No 54 of 1972. [Online] Available at: http://www.capetown.gov.za/en/CityHealth/
Documentation/Documents/Reg_Relating_to_Hygiene_Req_MilkingShedsTransport_Milk.pdf
[Accessed: 08/12/2013].
• Riekert P. 2007. Latest Arsenic Removal Technologies for Drinking Water Applications. [Online]
Available at: http://smallwatersystems.ucdavis.edu/ResearchProjects/documents/Arsenic_
Review_11-07.pdf [Accessed: 06/06/2014].
• Roccaro P, Mancini G and Vagliasindi FG. 2005. Water intended for human consumption – Part I:
Compliance with European water quality standards. Desalination. 176(1): 1-11.
• Roche JF. 2006. The effect of nutritional management of the dairy cow on reproductive efficiency.
Animal Reproduction Science. 96(3): 282-296.
• Rodríguez DC, Pino N and Peñuela G. 2012. Microbiological quality indicators in waters of dairy
farms: Detection of pathogens by PCR in real time. Science of the Total Environment. 427-428:
314-318.
• Rogers L. 2008. Environmental management guidelines for the dairy industry. NSW Department
of Primary Industries. New South Wales. Orange.
• Ruane EM, Murphy PNC, Healy MG, French P and Rodgers M. 2011. On-farm treatment of dairy
soiled water using aerobic woodchip filters. Water Research. 45: 6668-6676.
• Rubenowitz-Lundin E and Hiscock KM. 2005. Water hardness and health effects. In: Selinus O,
Alloway B, Centeno JA, Finkelman RB, Fuge R, Lindh U and Smedley P (eds.). 2005. Essentials
© Central University of Technology, Free State
Bibliography Page | 110
of Medical Geology. Netherlands. Academic Press. pp. 331-345.
• Ruegg PL. 2003. Practical Food Safety Interventions for Dairy Production. Journal of Dairy
Science. 86(E. Suppl.): E1-E9.
• Saeedi M, Abessi O, Sharifi F and Meraji H. 2010. Development of groundwater quality index.
Environmental Monitoring and Assessment. 16: 327-335.
• SAI (Sustainable Agriculture Initiative Platform). 2009. Principles & Practices for the Sustainable
Dairy Farming. [Online] Available at: http://www.saiplatform.org/uploads/Library/PPsDairy2009-2.
pdf [Accessed: 15/05/2014].
• Salo S, Ehavald H, Raaska L, Vokk R and Wirtanen G. 2006. Microbial surveys in Estonian
dairies. LWT–Food Science Technologies. 39(5): 460-471.
• Salo S, Friis A and Wirtanen G. 2005. Improving the cleaning of tanks. In: Lelieveld HLM (ed.).
Handbook of hygiene control in the food industry. Netherlands. Taylor & Francis.
• Samie A, Makonto OT, Mojapelo P, Bessong PO, Odiyo JO and Uaboi-Egbenni PO. 2013.
Physico-chemical assessment of borehole water used by schools in Greater Giyani Municipality,
Mopani district, South Africa. African Journal of Biotechnology. 12(30): 4858-4865.
• SANS 241 (South African Bureau of Standards). 2006. South African National Standard Drinking
Water Standard. SABS, Pretoria. (SANS 241-2006).
• SANS 241 (South African Bureau of Standards). 2011. Drinking water. Part 1. Microbial, physical,
aesthetic and chemical determinants. SABS, Pretoria. (SANS 241-1:2011).
• Santhi C, Srinivasan R, Arnold JG and Williams JR. 2006. A modelling approach to evaluate the
impacts of water quality management plans implemented in a watershed in Texas. Environmental
Modelling and Software. 21: 1141-1157.
• Sarkar B, Chakrabarti PP, Vijaykumar A and Kale V. 2006. Wastewater treatment in dairy
industries — possibility of reuse. Desalination. 195: 141-152.
• Saunders JA, Lee M-K, Uddin A, Mohammad S, Wilkin RT, Fayek M and Korte NE. 2005. Natural
arsenic contamination of Holocene alluvial aquifers by linked tectonic, weathering, and microbial
processes. Geochemistry, Geophysics, Geosystems. 6(4): 1-7.
• Savci S. 2012. An Agricultural Pollutant: Chemical Fertilizer. International Journal of
Environmental Science and Development. 3(1): 77-80.
© Central University of Technology, Free State
Bibliography Page | 111
• Schwarzenbach RP, Egli T, Hofsetter TB, Von Gunten U and Wehrli B. 2010. Global Water
Pollution and Human Health. Annual Review of Environment and Resources. 35: 109-136.
• Seth ON, Tagbor TA and Bernard O. 2014. Assessment of chemical quality of groundwater
over some rock types in Ashanti Region, Ghana. American Journal of Scientific and Industrial
Research. 5(1): 1-6.
• Shisana O, Rehle T, Simbayi LC, Zuma K, Jooste S, Zungu N, Labadarios D and Onoya D.
2014. South African National HIV Prevalence, Incidence and Behaviour Survey, 2012. Cape
Town. HSRC Press.
• Simpson MW, Allen DM and Journeay MM. 2012. Assessing risk to groundwater quality using an
integrated risk framework. Environmental Earth Sciences. 62(8): 1577-1595.
• Sims JT, Bergström L, Bowman BT and Oenema O. 2005. Nutrient management for intensive
animal agriculture: policies and practices for sustainability. Soil Use and Management. 21: 141-
151.
• Singh B, Chauhan JS and Mohan A. 2012. A construction of water quality index considering
physicochemical properties for drinking purposes in a rural settlement: a case study of Gajraula
region, Ganga River Basin (North India). Water Science and Technology: Water Supply. 12(6):
818–828.
• Sivakumar B. 2011. Global climate change and its impacts on water resources planning and
management: assessment and challenges. Stochastic Environmental Research and Risk
Assessment. 25(4): 583-600.
• Skerrett HE and Holland CV. 2000. The occurrence of Cryptosporidium in environmental waters
in the greater Dublin area. Water Research. 34: 3755-3760.
• Smith AP, Western AW and Hannah MC. 2013. Linking water quality trends with land use
intensification in dairy farming catchments. Journal of Hydrology. 476: 1-12.
• Spalding RF and Exner ME. 1993. Occurrence of Nitrate in Groundwater – A Review. Journal of
Environment Quality. 22: 392-402.
• Spanua C, Bergerb YM, Thomasc DL and Ruegg PL. 2011. Impact of intramammary antimicrobial
dry treatment and teat sanitation on somatic cell count and intramammary infection in dairy
ewes. Small Ruminant Research. 97: 139-145.
• Srinivas PG, Kumar NP, Prasad AS and Hemalatha T. 2011. Generation of Groundwater Quality
© Central University of Technology, Free State
Bibliography Page | 112
Index Map – A Case Study. Civil and Environmental Research. 1(2): 9-20.
• Štambuk-Giljanović, N. 1999. Water Quality Evaluation by Index in Dalmatia. Water Research.
33(16): 3423-3440.
• STATS SA (Statistics South Africa). 2013. Millennium Development Goals: Country Report.
Stats SA, Pretoria. [Online] Available at: http://www.za.undp.org/content/dam/south_africa/docs/
Reports/The_Report/MDG_October-2013.pdf [Accessed: 12/02/2013].
• Stein PL. 2001. The great Sydney water crisis of 1998. Water, Air and Pollution. 123(1-4):
419-436.
• Strydom JP, Mostert JF and Britz TJ. 1993. Effluent production and disposal in the South African
dairy industry: A postal survey. Water SA. 19(3): 253-258.
• Strydom JP, Mostert JF and Britz TJ. 1995. Aerobic treatment of a synthetic dairy effluent using
a hybrid digester. Water SA. 21: 125-130.
• Strydom W. 2010. How Much Water Do We Have? – Groundwater. In A CSIR perspective on
water in South Africa – 2010. CSIR Report No. CSIR/NRE/PW/IR/2011/0012/A. pp. 6-7. [Online]
Available at: http://www.csir.co.za/nre/docs/CSIR%20Perspective%20on%20Water_2010.PDF
[Accessed: 24/08/2013].
• Swamee PK and Tyagi A. 2000. Describing water quality with aggregate index. Journal of
Environmental Engineering. 126(5): 451-455.
• Taylor R, Cronin A, Pedley S, Barker J and Atkinson T. 2004. The implications of groundwater
velocity variations on microbial transport and wellhead protection – review of field evidence.
FEMS Microbiology Ecology. 49: 17-26.
• Tiwari TN and Mishra MA. 1985. A preliminary assignment of water quality index to major rivers.
Indian Journal of Environmental Protection. 5: 276-279.
• Tredoux G, Engelbrecht JFP, Talma AS and Israel S. 2004. Groundwater nitrate: a rural water
supply threat. In: Proceedings of the 5 th WaterNet/WARFSA Annual Symposium. Windhoek,
Namibia.
• Tredoux G, Genthe B, Steyn M and Germanis J. 2012. Managed aquifer recharge for potable
reuse in Atlantis, South Africa. Water Reclamation Technologies for Safe Managed Aquifer
© Central University of Technology, Free State
Bibliography Page | 113
Recharge. 121.
• Tredoux G, Talma AS and Engelbrecht JFP. 2000. The increasing nitrate hazard in groundwater
in the rural areas. Paper presented at the WISA Biennial Conference. Sun City, South Africa.
pp. 1-12.
• Tyagi S, Sharma B, Singh P and Dobhal R. 2013. Water Quality Assessment in terms of Water
Quality Index. American Journal of Water Resources. 1(3): 34-38.
• Ul-Haq N, Arain MA, Badar N, Rasheed M and Haque Z. 2011. Drinking water: A major source
of lead exposure in Karachi, Pakistan. Eastern Mediterranean Health Journal. 17(11): 882-886.
• Ullman JL and Mukhtar S. 2007. Impact of dairy housing practices on lagoon effluent
characteristics: Implications for nitrogen dynamics and salt accumulation. Bioresource
Technology. 98: 745-752.
• UN (United Nations). 2010. Committee on Economic Socal and Community Rights (2002)
General comment no. 15: The right to water. UN Doc. E/C.12/2010. New York. United Nations.
• UN (United Nations). 2013a. The Millennium Development Goals Report 2013. New York. United
Nations. pp. 46-48.
• UN (United Nations). 2013b. UN Goal 7: Ensure Environmental Sustainability. [Online] Available
at: http://www.un.org/millenniumgoals/pdf/Goal_7_fs.pdf. [Accessed: 12/02/2014].
• UN (United Nations General Assembly). 2000. United Nations Millennium Declaration.
A/RES/55/2. New York. United Nations.
• UNDP (United Nations Development Programme). 2003. Human development report. The
Millennium Development Goals: A compact amongst nations to end poverty. New York. Oxford
University Press.
• UNEP (United Nations Environment Programme). 2007. Global Drinking Water Quality Index
Development and Sensitivity Analysis Report. [Online] Available at: http://www.gemswater.org
[Accessed: 20/03/2013].
• Usher BH, Pretorius JA and Van Tonder GJ. 2007. Management of a Karoo fractured-rock aquifer
system – Kalkveld Water User Association (WUA). Water SA. 32(1): 9-19.
• Van der Schans ML, Harter T, Leijnse A, Mathews MC and Meyer RD. 2009. Characterizing
sources of nitrate leaching from an irrigated dairy farm in Merced County, California. Journal of
© Central University of Technology, Free State
Bibliography Page | 114
Contaminant Hydrology. 110(1): 9-21.
• Van Tonder, G. 2009. Groundwater management under the new Water Act in South Africa.
Hydrogeology Journal. 7: 421-422.
• Van Vuuren L. 2014. Misguided technology choices throwing fat in municipal fire. The Water
Wheel. July/August: 34-36.
• Vasanthavigar M, Srinivasamoorthy K, Vijayaragavan K, Ganthi R, Chidambaram S, Anandhan P,
Manivannan R and Vasudevan S. 2010. Application of water quality index for groundwater
quality assessment: Thirumanimuttar sub-basin, Tamilnadu, India. Environmental Monitoring
Assessment. 17: 595-609.
• Viles A. 2007. Review of Groundwater Resources in the Orange River Catchment. [Online]
Available at: http://www.orangesenqurak.com/UserFiles/File/Other/Water%20Resources%20
Management%20Plan%20Study/Groundwater.pdf [Accessed: 02/12/2013].
• Ward MH, De Kok TM, Levallois P, Brender J, Gulis G, Nolan BT and Van Derslice J. 2005.
Workgroup report: Drinking-water nitrate and health – recent findings and research needs.
Environmental Health Perspective. 113: 1607-1614.
• Water Services Act, No. 108 of 1997. [Online] Available at: http://www.acts.co.za/ [Accessed:
20/09/2013].
• WFD (Water Framework Directive) 2000. Directive 2000/60/EC of the European Parliament and
of the Council establishing a framework for the Community action in the field of water policy.
Official Journal. L 327,22. [Online] Available at: http://eur-lex.europa.eu/legal-content/EN/TXT/
PDF/?uri=CELEX:02000L0060-20090625&from=EN [Accessed: 19/09/2013].
• WHO (World Health Organization). 2008. Guidelines for Drinking-Water Quality. 3 rd Ed. Volume 1,
Geneva. World Health Organization.
• WHO (World Health Organization). 2011. Guidelines for Drinking-Water Quality. 4 th Ed. Geneva.
World Health Organization.
• WHO (World Health Organization). 2012. Arsenic fact sheet number 372. [Online] Available at:
http://www.who.int/mediacentre/factsheets/fs372/en/ [Accessed: 02/12/2013].
• WHO (World Health Organization with UNICEF). 2000. Global Water Supply and Sanitation
Assessment 2000 Report. [Online] Available at: http://www.who.int/water_sanitation_health/
monitoring/jmp2000.pdf [Accessed: 23/10/2013].
© Central University of Technology, Free State
Bibliography Page | 115
• Wilcock RJ, Nagels JW, Rodda HJE, O’Conner MB, Thorrold BS and Barnett JW. 1999. Water
quality of a lowland stream in a New Zealand dairy farming catchment. New Zealand Journal of
Marine and Freshwater Research. 33: 683-696.
• Williamson JC, Taylor MD, Torrens RS and Vojvodic-Vukovic M. 1998. Reducing nitrogen
leaching from dairy farm effluent-irrigated pasture using dicyandiamide: a lysimeter study.
Agriculture, Ecosystems and Environment. 69: 81-88.
• Woyessa YE, Hensley M and Van Rensburg LD, 2006. Catchment management in semiarid
area of central South Africa: Strategy for improving water productivity. In: Water Research
Commission. Water Institute of South Africa (WISA) Biennial Conference. Durban, South Africa.
pp. 648-654.
• WRC (Water Research Commission). 2003. Management of water related microbial diseases.
WRC Report No. TT 175/03.
• WRC (Water Research Commission). 2010. Integrated Water Quality Management: a mind-set
change. WRC Report No. TT 450/10.
• Xu Y and Usher B. 2006. Groundwater pollution in Africa. The Netherlands. CRC Press. Taylor
& Francis. p. 3.
• Yisa J and Jimoh TO. 2010. Analytical studies on water quality index of river Landzu. American
Journal of Applied Sciences. 7(4): 453-458.
• Yisa J, Jimoh TO and Oyibo OM. 2012 Underground water assessment using water quality
index. Leonardo Journal of Sciences. 21: 33-42.
• Zali MA, Retnam A, Juahir H, Zain SM, Kasim MF, Abdullah B and Saadudin SB. 2011. Sensitivity
Analysis for Water Quality Index (WQI) Prediction for Kinta River, Malaysia. World Applied
Sciences Journal. 14: 60-65.
• Zalidis G, Stamatiadis S, Takavakoglou V, Eskridge K and Misopolinos N. 2002. Impacts of
agricultural practices on soil and water quality in the Mediterranean region and proposed
assessment methodology. Agriculture, Ecosystems and Environment. 88: 137-146.
© Central University of Technology, Free State
Appendix A Page | 116
Appendix A Supplementary Information to Chapter 4
WISA 2012 PRESENTATION: POLLUTION INDEX FOR DAIRY FARM BOREHOLE WATER QUALITY IN THE FREE STATE, SOUTH AFRICA
Esterhuizen 1 , L., Fossey 2 , A. and Potgieter 3 E.
1 School of Environmental and Agricultural Sciences, Faculty of Health and Environmental
Sciences, Private Bag 20539, Bloemfontein, 9301, South Africa. [email protected]
Tel: 051 50731782 Biotechnology, Faculty of Health and Environmental Sciences, Private Bag 20539,
Bloemfontein, 9301, South Africa.3 Microbiology Laboratory Services, Mangaung Metropolitan Municipality, P.O. Box 3704,
Bloemfontein, 9300, South Africa.
Abstract
In South Africa, many dairy farms depend on borehole water as the only source of drinking water.
Generally, dairy wastewater is discharged onto pastures and land, posing a risk of polluting
groundwater. Pollutants, such as nitrates, may cause diseases in humans and animals and
adversely affect the environment. A pollution index will assist in the rating of boreholes according
to drinking water quality standards. In this study, borehole drinking water quality of 75 dairy farms
in the Free State, was assessed for physical, chemical and microbiological parameters. Standard
sampling procedures were followed, the water analysed and the data compared to the drinking
water quality standards of South Africa, South African National Standards, 241 of 2006. A water
quality index and rating was determined for each farm borehole. The nitrogen content for 49.3% of
the farms exceeded the prescribed limit. Similarly, for total coliforms, 68%, and for E. coli, 30.6%, of
the farms exceeded the acceptable limits. Some 10.7% of the farm boreholes exceeded the limits
for all three the major pollutants, namely, nitrates, coliforms and E. coli. Farming communities rely
upon borehole water as the sole drinking water source. Currently, data on borehole water quality of
South Africa dairy farms is limited. Those boreholes that are monitored are sampled infrequently.
Because of the potential for pollution of groundwater from activities on dairy farms, polluted water
may pose a health risk to all water consumers on the farm. A pollution index, generated from water
© Central University of Technology, Free State
Appendix A Page | 117
quality data, provides a means to rate borehole water quality and to identify farms posing the
highest health risk to the consumers. This risk assessment tool has the potential to facilitate farming
management decisions, thereby reducing or eliminating the exposure of farming communities to
poor quality drinking water.
Keywords: water quality index; borehole drinking water quality; E. coli; coliforms; nitrate
INTRODUCTION
Dairy farming is a major role-player in the agricultural sector of South Africa and contributes to
economical development and sustainability in the country. All dairy enterprises utilise water for all
the steps of the dairy industry, including cleaning, sanitization, heating, cooling and floor washing.
Dairy wastewater is characterised by the high biological oxygen demand (BOD) and chemical
oxygen demand (COD) contents, high levels of dissolved or suspended solids including fats, oils
and grease, nutrients, such as ammonia or minerals and phosphates, and therefore require proper
attention before disposal (1).
Dairy farm wastewater, which refers to manure and urine deposited during milking, is diluted
during washing down of a milking shed floor (2; 3). Animal waste in dairy run-off is a major source
of pollution and nutrient enrichment of streams and groundwater, and may have significant
environmental impacts (4; 5; 6). The harmful effects of agricultural activities on groundwater (7; 8;
9) is becoming more and more of a concern worldwide (10), for example, high concentrations of
ammoniacal nitrogen are harmful to stream animals if not adequately diluted (4).
It has been demonstrated that groundwater quality becomes affected, particularly through salt and
nitrate leaching, during heavy agricultural activities (11). Therefore, manure handling and disposal
practices in dairy enterprises are currently undergoing critical revision to reduce their impact on
groundwater quality (12).
South Africa is a water-scarce country and the central region, which includes the Free State, is an
arid area. Many of the dairy farms in the Free State are not close to any surface water sources and
utilise borehole water for all dairy activities and for drinking water.
A study by Strydom et al. (13) on the handling practices of dairy wastewater in South Africa, showed
that most farm wastewater was discharged onto pastures and land by irrigation, and has not
changed since that time (personal communication C. Louw, 2010). With the increasing growth of
the dairy industry together with the risk posed by dairy wastewater, there is no doubt that practices
© Central University of Technology, Free State
Appendix A Page | 118
to protect groundwater sources should be instituted. According to WHO organisation, about 80% of
all the diseases in human beings are caused by water (14). Once the groundwater is contaminated,
its quality cannot be restored by stopping the pollutants from the source (15).
Little is known about direct groundwater quality impacts from the many elements of dairy manure
management operations (16). A water quality index (WQI) is one of the most effective tools to
communicate information on the quality of water to the consumers and concerned citizens. It, thus,
becomes an important parameter for the assessment of groundwater (17, 18, 19, 14). The use of
a WQI to communicate water quality is used since the seventies as documented by Saeedi (20).
WQI is defined as a rating reflecting the composite influence of different water quality parameters.
WQI is calculated from the point of view of the suitability of groundwater for human consumption.
Therefore, the objective of the present work was to study groundwater quality of 75 dairy farms in
the Free State and to discuss the suitability of groundwater for human based consumption based on
computed water quality index values (WQI). The Free State is the third largest province, comprising
10.6% of South Africa’s land area, and accommodates most of the dairy farms in South Africa in the
eastern and northern regions.
STUDY AREA AND METHODS
The 75 farms studied are located in the three districts of Motheo, Xhariep and Lejweleputswa of
the Free State (Figure 1). Groundwater samples were collected from the 75 dairy farms during
2009. Each of the groundwater samples was collected at the point of use in the dairy on the farm.
Fourteen parameters were analysed, namely, pH, electrical conductivity, total hardness, chloride,
sulphate, phosphate, nitrate, fluoride, calcium, magnesium, sodium, potassium, total coliforms
and E. coli. Standard sampling and analytical procedures as prescribed by South African National
Standards 241 (21) and Department of Water Affairs (22) were applied.
WQI was calculated from the point of view of suitability of groundwater for human consumption.
Three steps were followed to compute the WQI (14). In the first step, each of the fourteen parameters
was assigned a weighting ( w i ) of relative importance in the overall quality of drinking water. In
step 2 the relative weight ( W i ) was calculated with the following calculation:
W i = w i ____
∑ i=1
n
w i ................................................................................ (1)
Where, W i is the relative weight, w i is the weight of each parameter and n is
the number of parameters.
© Central University of Technology, Free State
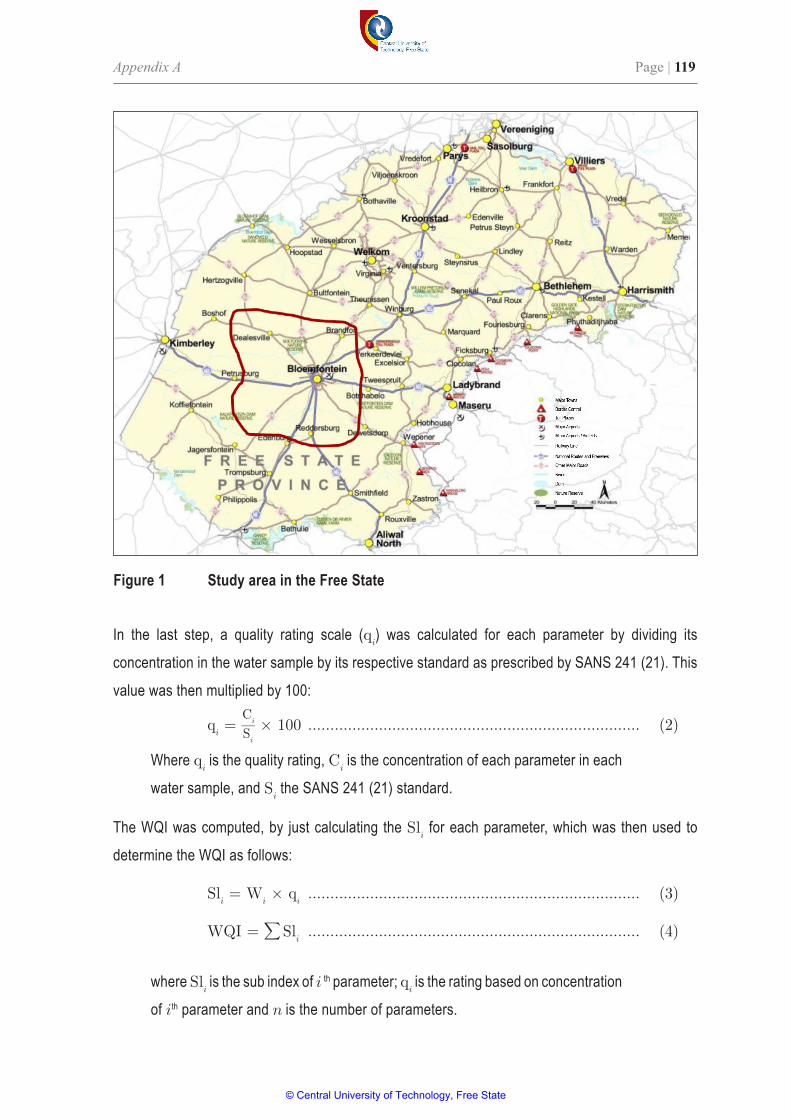
Appendix A Page | 119
In the last step, a quality rating scale ( q i ) was calculated for each parameter by dividing its
concentration in the water sample by its respective standard as prescribed by SANS 241 (21). This
value was then multiplied by 100:
q i = C i __ S i
× 100 ........................................................................... (2)
Where q i is the quality rating, C i is the concentration of each parameter in each
water sample, and S i the SANS 241 (21) standard.
The WQI was computed, by just calculating the Sl i for each parameter, which was then used to
determine the WQI as follows:
Sl i = W i × q i ........................................................................... (3)
WQI = ∑ Sl i ........................................................................... (4)
where Sl i is the sub index of i th parameter; q i is the rating based on concentration
of i th parameter and n is the number of parameters.
Figure 1 Study area in the Free State
© Central University of Technology, Free State
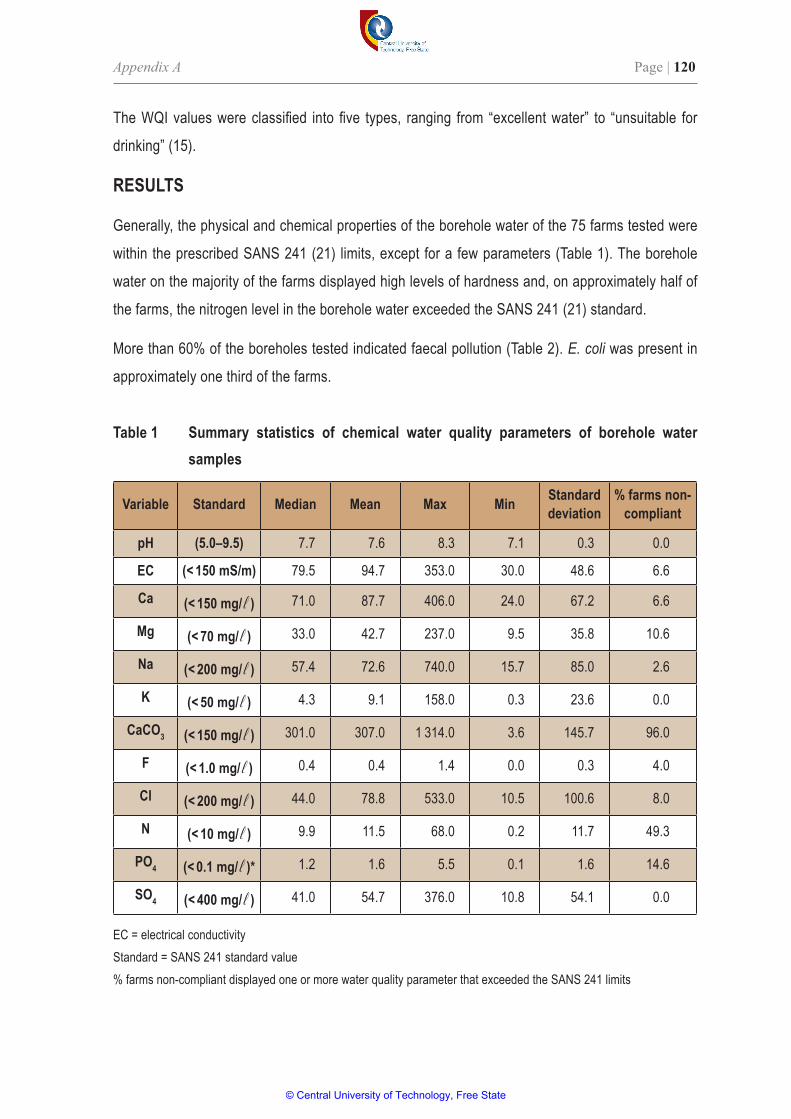
Appendix A Page | 120
The WQI values were classified into five types, ranging from “excellent water” to “unsuitable for
drinking” (15).
RESULTS
Generally, the physical and chemical properties of the borehole water of the 75 farms tested were
within the prescribed SANS 241 (21) limits, except for a few parameters (Table 1). The borehole
water on the majority of the farms displayed high levels of hardness and, on approximately half of
the farms, the nitrogen level in the borehole water exceeded the SANS 241 (21) standard.
More than 60% of the boreholes tested indicated faecal pollution (Table 2). E. coli was present in
approximately one third of the farms.
Table 1 Summary statistics of chemical water quality parameters of borehole water samples
Variable Standard Median Mean Max Min Standard deviation
% farms non-compliant
pH (5.0–9.5) 7.7 7.6 8.3 7.1 0.3 0.0
EC (< 150 mS/m) 79.5 94.7 353.0 30.0 48.6 6.6
Ca (< 150 mg/ l ) 71.0 87.7 406.0 24.0 67.2 6.6
Mg (< 70 mg/ l ) 33.0 42.7 237.0 9.5 35.8 10.6
Na (< 200 mg/ l ) 57.4 72.6 740.0 15.7 85.0 2.6
K (< 50 mg/ l ) 4.3 9.1 158.0 0.3 23.6 0.0
CaC O 3 (< 150 mg/ l ) 301.0 307.0 1 314.0 3.6 145.7 96.0
F (< 1.0 mg/ l ) 0.4 0.4 1.4 0.0 0.3 4.0
Cl (< 200 mg/ l ) 44.0 78.8 533.0 10.5 100.6 8.0
N (< 10 mg/ l ) 9.9 11.5 68.0 0.2 11.7 49.3
PO 4 (< 0.1 mg/ l )* 1.2 1.6 5.5 0.1 1.6 14.6
SO 4 (< 400 mg/ l ) 41.0 54.7 376.0 10.8 54.1 0.0
EC = electrical conductivityStandard = SANS 241 standard value% farms non-compliant displayed one or more water quality parameter that exceeded the SANS 241 limits
© Central University of Technology, Free State
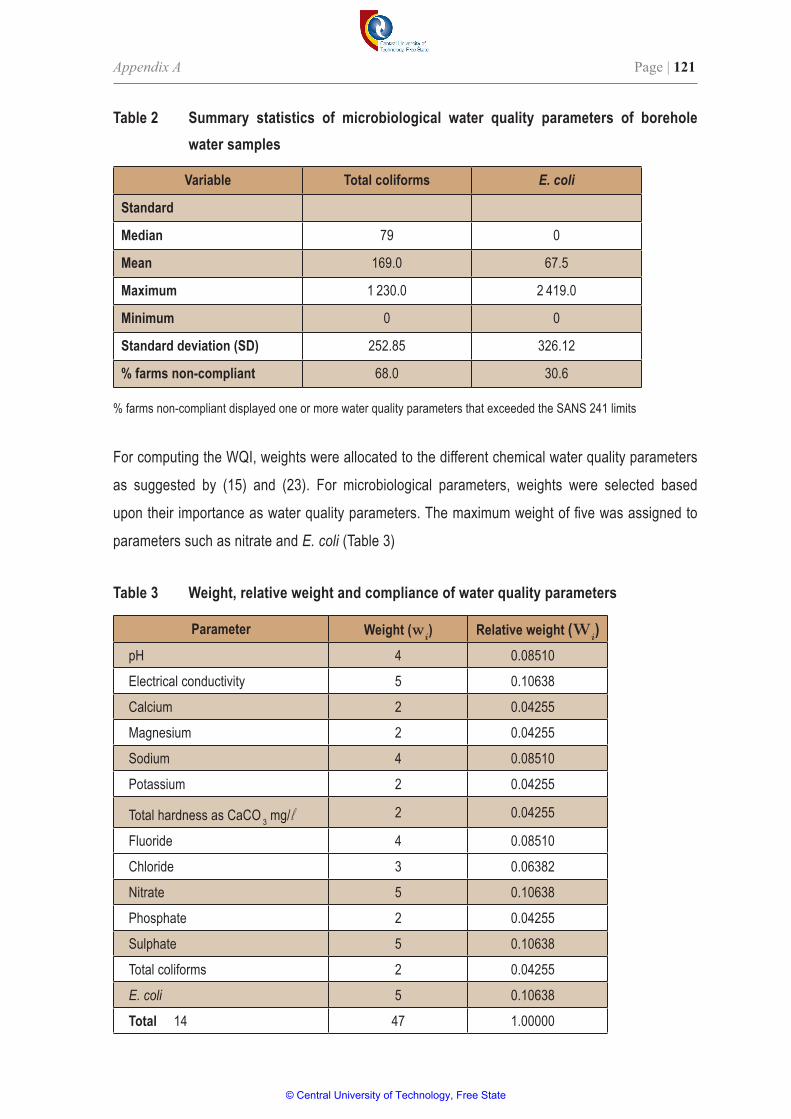
Appendix A Page | 121
For computing the WQI, weights were allocated to the different chemical water quality parameters
as suggested by (15) and (23). For microbiological parameters, weights were selected based
upon their importance as water quality parameters. The maximum weight of five was assigned to
parameters such as nitrate and E. coli (Table 3)
Table 2 Summary statistics of microbiological water quality parameters of borehole water samples
Variable Total coliforms E. coli
Standard
Median 79 0
Mean 169.0 67.5
Maximum 1 230.0 2 419.0
Minimum 0 0
Standard deviation (SD) 252.85 326.12
% farms non-compliant 68.0 30.6
% farms non-compliant displayed one or more water quality parameters that exceeded the SANS 241 limits
Table 3 Weight, relative weight and compliance of water quality parameters
Parameter Weight ( w i ) Relative weight ( W i )pH 4 0.08510
Electrical conductivity 5 0.10638
Calcium 2 0.04255
Magnesium 2 0.04255
Sodium 4 0.08510
Potassium 2 0.04255
Total hardness as CaCO 3 mg/ l 2 0.04255
Fluoride 4 0.08510
Chloride 3 0.06382
Nitrate 5 0.10638
Phosphate 2 0.04255
Sulphate 5 0.10638
Total coliforms 2 0.04255
E. coli 5 0.10638
Total 14 47 1.00000
© Central University of Technology, Free State
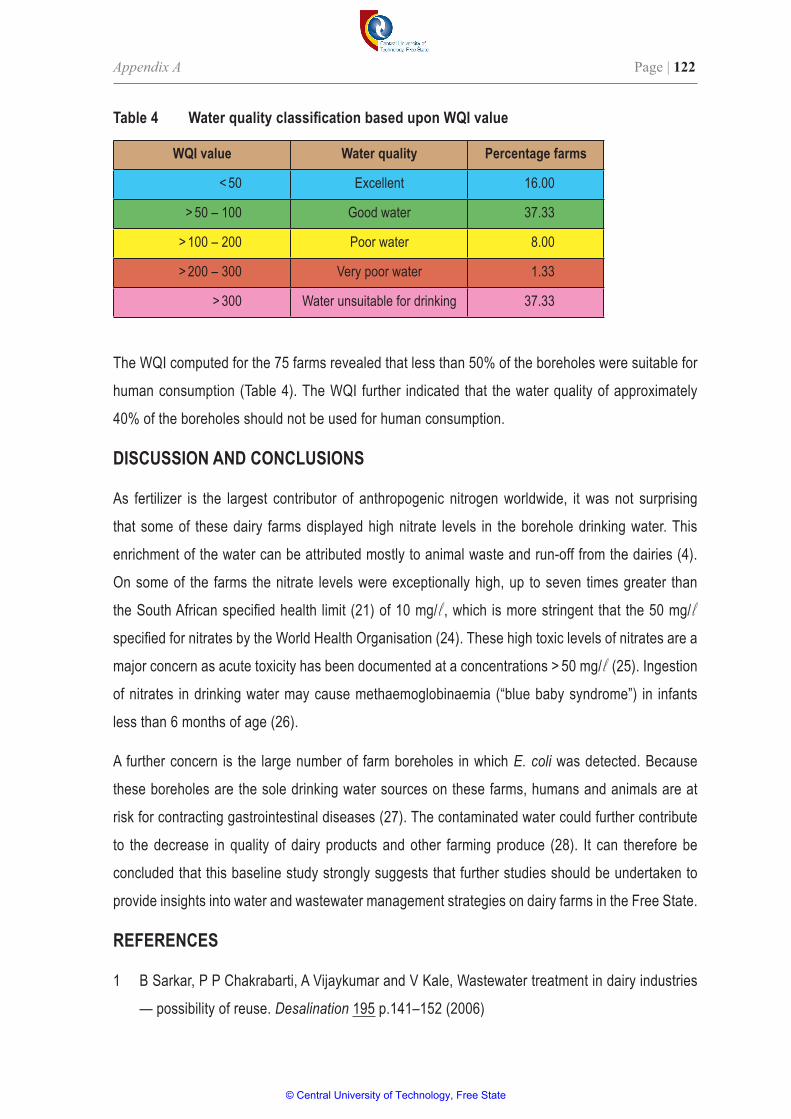
Appendix A Page | 122
The WQI computed for the 75 farms revealed that less than 50% of the boreholes were suitable for
human consumption (Table 4). The WQI further indicated that the water quality of approximately
40% of the boreholes should not be used for human consumption.
DISCUSSION AND CONCLUSIONS
As fertilizer is the largest contributor of anthropogenic nitrogen worldwide, it was not surprising
that some of these dairy farms displayed high nitrate levels in the borehole drinking water. This
enrichment of the water can be attributed mostly to animal waste and run-off from the dairies (4).
On some of the farms the nitrate levels were exceptionally high, up to seven times greater than
the South African specified health limit (21) of 10 mg/ l, which is more stringent that the 50 mg/ l
specified for nitrates by the World Health Organisation (24). These high toxic levels of nitrates are a
major concern as acute toxicity has been documented at a concentrations > 50 mg/ l (25). Ingestion
of nitrates in drinking water may cause methaemoglobinaemia (“blue baby syndrome”) in infants
less than 6 months of age (26).
A further concern is the large number of farm boreholes in which E. coli was detected. Because
these boreholes are the sole drinking water sources on these farms, humans and animals are at
risk for contracting gastrointestinal diseases (27). The contaminated water could further contribute
to the decrease in quality of dairy products and other farming produce (28). It can therefore be
concluded that this baseline study strongly suggests that further studies should be undertaken to
provide insights into water and wastewater management strategies on dairy farms in the Free State.
REFERENCES
1 B Sarkar, P P Chakrabarti, A Vijaykumar and V Kale, Wastewater treatment in dairy industries
— possibility of reuse. Desalination 195 p.141–152 (2006)
Table4 WaterqualityclassificationbaseduponWQIvalue
WQI value Water quality Percentage farms
< 50 Excellent 16.00
> 50 – 100 Good water 37.33
> 100 – 200 Poor water 8.00
> 200 – 300 Very poor water 1.33
> 300 Water unsuitable for drinking 37.33
© Central University of Technology, Free State
Appendix A Page | 123
2 J C Williamson, M D Taylor, R S Torrens and M Vojvodic-Vukovic, Reducing nitrogen leaching
from dairy farm effluent-irrigated pasture using dicyandiamide: a lysimeter study. Agriculture,
Ecosystems and Environment 69 p.81-88 (1998)
3 P S Hooda, U A C Edwards, H A Anderso, and A Miller, A review of water quality concerns in
livestock farming areas. Science of the Total Environment 250, p.143-167 (2000)
4 R J Wilcock, J W Nagels, H J E Rodda, M B O’Conner, B S Thorrold and J W Barnett, Water
quality of a lowland stream in a New Zealand dairy farming catchment. New Zealand Journal of
Marine and Freshwater Research 33 p.683-696 (1999)
5 A Atalay, S Pao, M James, B Whitehead and A Allen, Drinking water assessment at underserved
farms in Virginia’s coastal plain. Journal of Environmental Monitoring and Restoration 4
p.53-64 (2008)
6 D Kay, J Crowther, L Fewtrell, AC Francis, M Hopkins, C Kay, A T McDonald, C M Stapleton,
J Watkins, J Wilkinson and M D Wyer, Quantification and control of microbial pollution from
agriculture: a new policy challenge? Environmental Science and Policy 2 p.171–184 (2008)
7 A G Gillingham and B S Thorrold, A review of New Zealand research measuring phosphorus in
runoff from pasture. Journal of Environmental Quality 29 p.88–96 (2000)
8 H J Di and K C Cameron, Nitrate leaching in temperate agro ecosystems: sources, factors and
mitigating strategies. Nutrient Cycling in Agro Ecosystems 46 p.237–256 (2002)
9 R M. Monaghan, R J Paton, L C Smith, J J Drewry and R P Littlejohn, The impacts of nitrogen
fertilisation and increased stocking rate on pasture yield, soil physical condition and nutrient
losses in drainage from a cattle-grazed pasture. New Zealand Journal of Agricultural Research
48:2 p.227-240 (2005)
10 C Santhi, R Srinivasan, J G Arnold and J R Williams, A modeling approach to evaluate the
impacts of water quality management plans implemented in a watershed in Texas. Environmental
Modelling and Software 21 p.1141-1157 (2006)
11 N A Mohammad, and J J Kaluarachchi, Assessment and management of long-term nitrate
pollution of ground water in agriculture-dominated watersheds. Journal of Hydrology 295
p.225–245 (2004)
12 M Goss and C Richards, Development of a risk-based index for source water protection
planning, which supports the reduction of pathogens from agricultural activity entering water
resources. Journal of Environmental Management 87 p.623–632 (2008)
© Central University of Technology, Free State
Appendix A Page | 124
13 J P Strydom, J F Mostert, and T J Britz, Effluent production and disposal in the South African
dairy industry: A postal survey. Water SA 19:3 p.253-258 (1993)
14 World Health Organization, Guidelines for drinking-water quality: Surveillance and control of
community supplies. Volume 3 (1997)
15 C R Ramakrishnaiah, C Sadashivaiah and G Ranganna, Assessment of Water Quality Index
for the groundwater in Tumkur Taluk, Karnataka State, India. E-Journal of Chemistry 6:2
p.523-530 (2009)
16 T Harter, H Davis, M C Mathews and R D Meyer, Shallow groundwater quality on dairy farms
with irrigated forage crops. Journal of Contaminant Hydrology 55 p.287-315 (2002)
17 B Boyacioglu, Development of a water quality index based on a European classification
scheme. Water SA 33:1 p.101-106 (2007)
18 F Dos Santos Simões, A B Moreira, M C Bisinoti, S M Nobre Gimenez and M J Santos Yabe,
Water quality index as a simple indicator of aquaculture effects on aquatic bodies. Ecological
Indicators 8 p.476-484 (2008)
19 P Samantray, B M Mishra, C R Panda and S P Rout, Assessment of Water Quality Index
in Mahanadi and Atharabanki Rivers and Taldanda Canal in Paradip Area, India. Journal of
Human Ecology 26:3 p.153-161 (2009)
20 M Saeedi, O Abessi, F Sharifi, and H Meraji, Development of groundwater quality index.
Environmental Monitoring and Assessment 16 p.327-335 (2010)
21 South African Bureau of Standards, South African National Standard, Drinking Water Standard
SANS 241 (2006)
22 Department of Water Affairs and Forestry, Minimum Requirements for sampling drinking water.
systems. Ver. 1 (2006)
23 M Vasanthavigar, K Srinivasamoorthy, K Vijayaragavan, R Ganthi, S Chidambaram, P Anandhan,
R Manivannan and S Vasudevan, Application of water quality index for groundwater quality
assessment: Thirumanimuttar sub-basin, Tamilnadu, India. Environmental Monitoring and
Assessment 17 p.595–609 (2010)
24 World Health Organization, Guidelines for Drinking-Water quality. 4 th Edition (2011)
25 R F Spalding and M E Exner, Occurrence of Nitrate in Groundwater – A Review, Journal of
Environment Quality 22 p.392-402 (1993)
© Central University of Technology, Free State

Appendix A Page | 125
26 M H. Ward, T M. De Kok, P Levallois, J Brender, G Gulis, B T Nolan and J Van Derslice,
Workgroup Report: Drinking-water nitrate and health – recent findings and research needs.
Environmental Health Perspectives 113:11 p.1607–1614 (2005)
27 A N Pell, Manure and Microbes: Public and Animal Health Problem? Journal of Dairy Science
80 p.267-2681(1997.)
28 D L Jones, Potential health risks associated with the persistence of Escherichia coli 0157 in
agricultural environments. Soil Use and Management 15:2 p.78-83 (1999)
© Central University of Technology, Free State
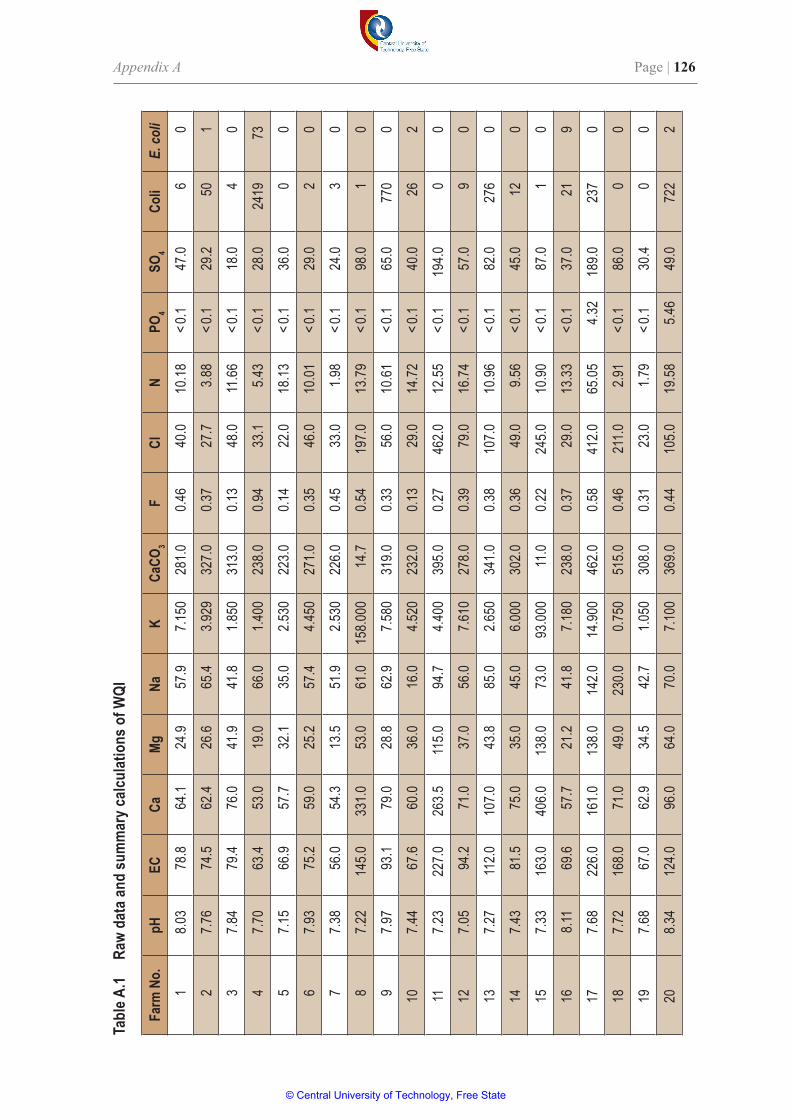
Appendix A Page | 126
Tabl
e A.1
Raw
data
and
sum
mar
y calc
ulat
ions
of W
QI
Farm
No.
pHEC
CaMg
NaK
CaCO
3 F
ClN
PO 4
SO 4
Coli
E. co
li1
8.03
78.8
64.1
24.9
57.9
7.150
281.0
0.46
40.0
10.18
< 0.1
47.0
60
27.7
674
.562
.426
.665
.43.9
2932
7.00.3
727
.73.8
8< 0
.129
.250
1
37.8
479
.476
.041
.941
.81.8
5031
3.00.1
348
.011
.66< 0
.118
.04
0
47.7
063
.453
.019
.066
.01.4
0023
8.00.9
433
.15.4
3< 0
.128
.024
1973
57.1
566
.957
.732
.135
.02.5
3022
3.00.1
422
.018
.13< 0
.136
.00
0
67.9
375
.259
.025
.257
.44.4
5027
1.00.3
546
.010
.01< 0
.129
.02
0
77.3
856
.054
.313
.551
.92.5
3022
6.00.4
533
.01.9
8< 0
.124
.03
0
87.2
214
5.033
1.053
.061
.015
8.000
14.7
0.54
197.0
13.79
< 0.1
98.0
10
97.9
793
.179
.028
.862
.97.5
8031
9.00.3
356
.010
.61< 0
.165
.077
00
107.4
467
.660
.036
.016
.04.5
2023
2.00.1
329
.014
.72< 0
.140
.026
2
117.2
322
7.026
3.511
5.094
.74.4
0039
5.00.2
746
2.012
.55< 0
.119
4.00
0
127.0
594
.271
.037
.056
.07.6
1027
8.00.3
979
.016
.74< 0
.157
.09
0
137.2
711
2.010
7.043
.885
.02.6
5034
1.00.3
810
7.010
.96< 0
.182
.027
60
147.4
381
.575
.035
.045
.06.0
0030
2.00.3
649
.09.5
6< 0
.145
.012
0
157.3
316
3.040
6.013
8.073
.093
.000
11.0
0.22
245.0
10.90
< 0.1
87.0
10
168.1
169
.657
.721
.241
.87.1
8023
8.00.3
729
.013
.33< 0
.137
.021
9
177.6
822
6.016
1.013
8.014
2.014
.900
462.0
0.58
412.0
65.05
4.32
189.0
237
0
187.7
216
8.071
.049
.023
0.00.7
5051
5.00.4
621
1.02.9
1< 0
.186
.00
0
197.6
867
.062
.934
.542
.71.0
5030
8.00.3
123
.01.7
9< 0
.130
.40
0
208.3
412
4.096
.064
.070
.07.1
0036
9.00.4
410
5.019
.585.4
649
.072
22
© Central University of Technology, Free State
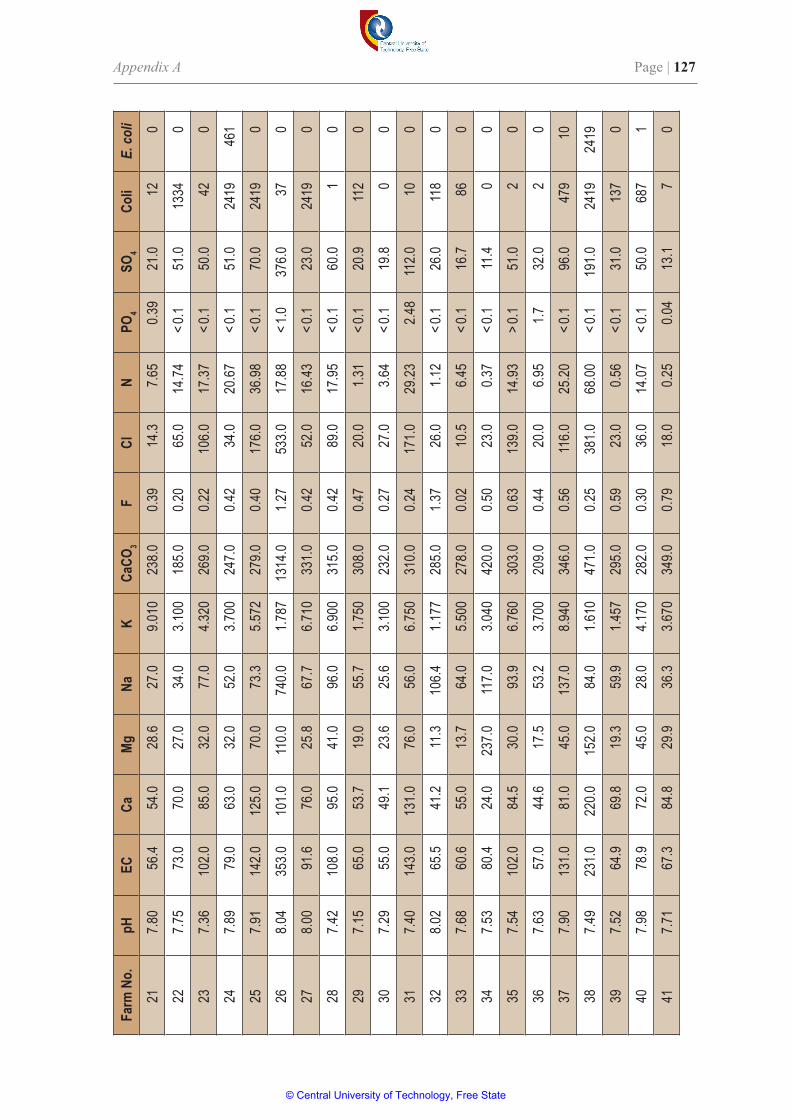
Appendix A Page | 127
Farm
No.
pHEC
CaMg
NaK
CaCO
3 F
ClN
PO 4
SO 4
Coli
E. co
li21
7.80
56.4
54.0
28.6
27.0
9.010
238.0
0.39
14.3
7.65
0.39
21.0
120
227.7
573
.070
.027
.034
.03.1
0018
5.00.2
065
.014
.74< 0
.151
.013
340
237.3
610
2.085
.032
.077
.04.3
2026
9.00.2
210
6.017
.37< 0
.150
.042
0
247.8
979
.063
.032
.052
.03.7
0024
7.00.4
234
.020
.67< 0
.151
.024
1946
1
257.9
114
2.012
5.070
.073
.35.5
7227
9.00.4
017
6.036
.98< 0
.170
.024
190
268.0
435
3.010
1.011
0.074
0.01.7
8713
14.0
1.27
533.0
17.88
< 1.0
376.0
370
278.0
091
.676
.025
.867
.76.7
1033
1.00.4
252
.016
.43< 0
.123
.024
190
287.4
210
8.095
.041
.096
.06.9
0031
5.00.4
289
.017
.95< 0
.160
.01
0
297.1
565
.053
.719
.055
.71.7
5030
8.00.4
720
.01.3
1< 0
.120
.911
20
307.2
955
.049
.123
.625
.63.1
0023
2.00.2
727
.03.6
4< 0
.119
.80
0
317.4
014
3.013
1.076
.056
.06.7
5031
0.00.2
417
1.029
.232.4
811
2.010
0
328.0
265
.541
.211
.310
6.41.1
7728
5.01.3
726
.01.1
2< 0
.126
.011
80
337.6
860
.655
.013
.764
.05.5
0027
8.00.0
210
.56.4
5< 0
.116
.786
0
347.5
380
.424
.023
7.011
7.03.0
4042
0.00.5
023
.00.3
7< 0
.111
.40
0
357.5
410
2.084
.530
.093
.96.7
6030
3.00.6
313
9.014
.93> 0
.151
.02
0
367.6
357
.044
.617
.553
.23.7
0020
9.00.4
420
.06.9
51.7
32.0
20
377.9
013
1.081
.045
.013
7.08.9
4034
6.00.5
611
6.025
.20< 0
.196
.047
910
387.4
923
1.022
0.015
2.084
.01.6
1047
1.00.2
538
1.068
.00< 0
.119
1.024
1924
19
397.5
264
.969
.819
.359
.91.4
5729
5.00.5
923
.00.5
6< 0
.131
.013
70
407.9
878
.972
.045
.028
.04.1
7028
2.00.3
036
.014
.07< 0
.150
.068
71
417.7
167
.384
.829
.936
.33.6
7034
9.00.7
918
.00.2
50.0
413
.17
0
© Central University of Technology, Free State
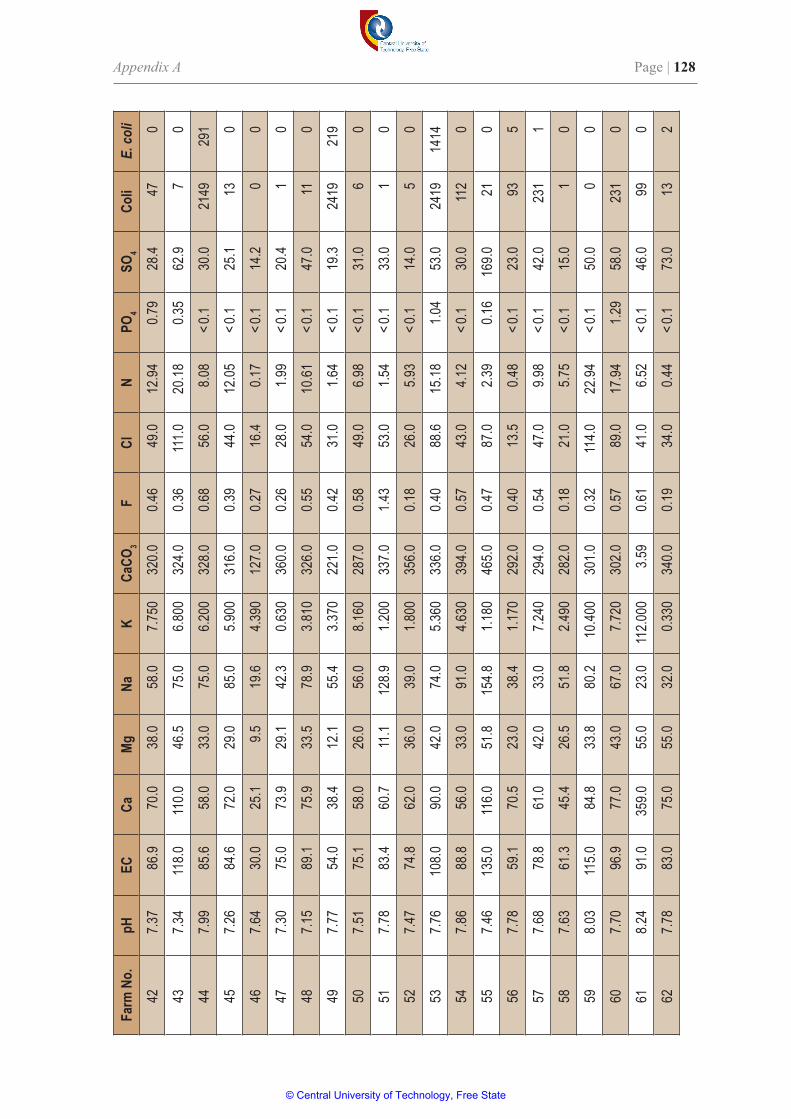
Appendix A Page | 128
Farm
No.
pHEC
CaMg
NaK
CaCO
3 F
ClN
PO 4
SO 4
Coli
E. co
li42
7.37
86.9
70.0
38.0
58.0
7.750
320.0
0.46
49.0
12.94
0.79
28.4
470
437.3
411
8.011
0.046
.575
.06.8
0032
4.00.3
611
1.020
.180.3
562
.97
0
447.9
985
.658
.033
.075
.06.2
0032
8.00.6
856
.08.0
8< 0
.130
.021
4929
1
457.2
684
.672
.029
.085
.05.9
0031
6.00.3
944
.012
.05< 0
.125
.113
0
467.6
430
.025
.19.5
19.6
4.390
127.0
0.27
16.4
0.17
< 0.1
14.2
00
477.3
075
.073
.929
.142
.30.6
3036
0.00.2
628
.01.9
9< 0
.120
.41
0
487.1
589
.175
.933
.578
.93.8
1032
6.00.5
554
.010
.61< 0
.147
.011
0
497.7
754
.038
.412
.155
.43.3
7022
1.00.4
231
.01.6
4< 0
.119
.324
1921
9
507.5
175
.158
.026
.056
.08.1
6028
7.00.5
849
.06.9
8< 0
.131
.06
0
517.7
883
.460
.711
.112
8.91.2
0033
7.01.4
353
.01.5
4< 0
.133
.01
0
527.4
774
.862
.036
.039
.01.8
0035
6.00.1
826
.05.9
3< 0
.114
.05
0
537.7
610
8.090
.042
.074
.05.3
6033
6.00.4
088
.615
.181.0
453
.024
1914
14
547.8
688
.856
.033
.091
.04.6
3039
4.00.5
743
.04.1
2< 0
.130
.011
20
557.4
613
5.011
6.051
.815
4.81.1
8046
5.00.4
787
.02.3
90.1
616
9.021
0
567.7
859
.170
.523
.038
.41.1
7029
2.00.4
013
.50.4
8< 0
.123
.093
5
577.6
878
.861
.042
.033
.07.2
4029
4.00.5
447
.09.9
8< 0
.142
.023
11
587.6
361
.345
.426
.551
.82.4
9028
2.00.1
821
.05.7
5< 0
.115
.01
0
598.0
311
5.084
.833
.880
.210
.400
301.0
0.32
114.0
22.94
< 0.1
50.0
00
607.7
096
.977
.043
.067
.07.7
2030
2.00.5
789
.017
.941.2
958
.023
10
618.2
491
.035
9.055
.023
.011
2.000
3.59
0.61
41.0
6.52
< 0.1
46.0
990
627.7
883
.075
.055
.032
.00.3
3034
0.00.1
934
.00.4
4< 0
.173
.013
2
© Central University of Technology, Free State
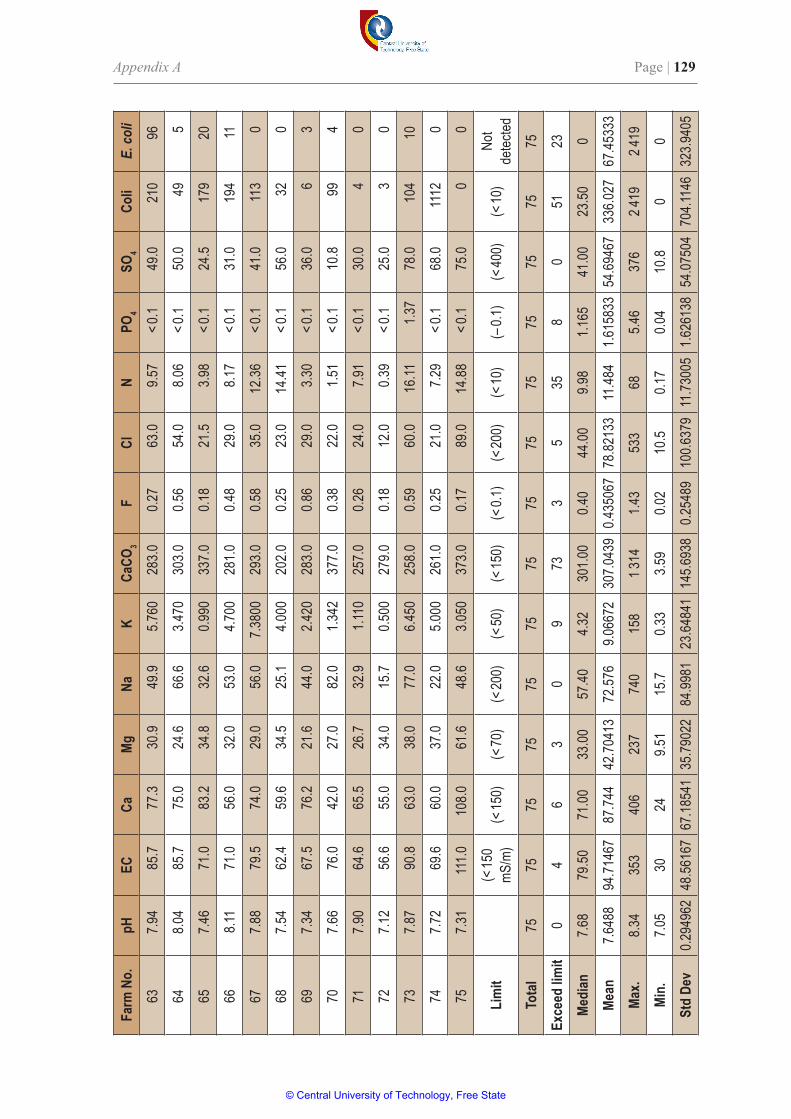
Appendix A Page | 129
Farm
No.
pHEC
CaMg
NaK
CaCO
3 F
ClN
PO 4
SO 4
Coli
E. co
li63
7.94
85.7
77.3
30.9
49.9
5.760
283.0
0.27
63.0
9.57
< 0.1
49.0
210
96
648.0
485
.775
.024
.666
.63.4
7030
3.00.5
654
.08.0
6< 0
.150
.049
5
657.4
671
.083
.234
.832
.60.9
9033
7.00.1
821
.53.9
8< 0
.124
.517
920
668.1
171
.056
.032
.053
.04.7
0028
1.00.4
829
.08.1
7< 0
.131
.019
411
677.8
879
.574
.029
.056
.07.3
800
293.0
0.58
35.0
12.36
< 0.1
41.0
113
0
687.5
462
.459
.634
.525
.14.0
0020
2.00.2
523
.014
.41< 0
.156
.032
0
697.3
467
.576
.221
.644
.02.4
2028
3.00.8
629
.03.3
0< 0
.136
.06
3
707.6
676
.042
.027
.082
.01.3
4237
7.00.3
822
.01.5
1< 0
.110
.899
4
717.9
064
.665
.526
.732
.91.1
1025
7.00.2
624
.07.9
1< 0
.130
.04
0
727.1
256
.655
.034
.015
.70.5
0027
9.00.1
812
.00.3
9< 0
.125
.03
0
737.8
790
.863
.038
.077
.06.4
5025
8.00.5
960
.016
.111.3
778
.010
410
747.7
269
.660
.037
.022
.05.0
0026
1.00.2
521
.07.2
9< 0
.168
.011
120
757.3
111
1.010
8.061
.648
.63.0
5037
3.00.1
789
.014
.88< 0
.175
.00
0
Lim
it(<
150
mS/m
)(<
150)
(< 70
)(<
200)
(< 50
)(<
150)
(< 0.
1)(<
200)
(< 10
)(–
0.1)
(< 40
0)(<
10)
Not
detec
ted
Tota
l75
7575
7575
7575
7575
7575
7575
75
Exce
ed lim
it0
46
30
973
35
358
051
23
Medi
an7.6
879
.5071
.0033
.0057
.404.3
230
1.00
0.40
44.00
9.98
1.165
41.00
23.50
0
Mean
7.648
894
.7146
787
.744
42.70
413
72.57
69.0
6672
307.0
439
0.435
067
78.82
133
11.48
41.6
1583
354
.6946
733
6.027
67.45
333
Max.
8.34
353
406
237
740
158
1 314
1.43
533
685.4
637
62 4
192 4
19
Min.
7.05
3024
9.51
15.7
0.33
3.59
0.02
10.5
0.17
0.04
10.8
00
Std
Dev
0.294
962
48.56
167
67.18
541
35.79
022
84.99
8123
.6484
114
5.693
80.2
5489
100.6
379
11.73
005
1.626
138
54.07
504
704.1
146
323.9
405
© Central University of Technology, Free State
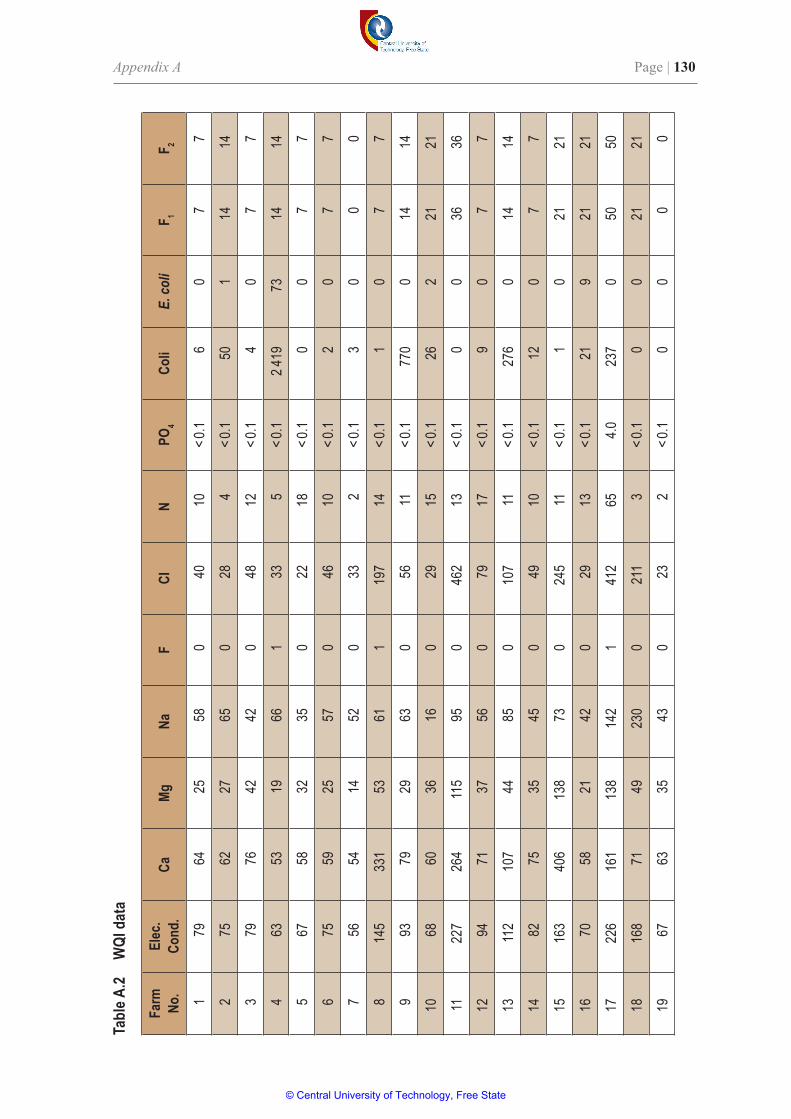
Appendix A Page | 130
Tabl
e A.2
WQI
dat
a
Farm
No
.El
ec.
Cond
.Ca
MgNa
FCl
N PO
4 Co
liE.
coli
F 1 F 2
179
6425
580
4010
< 0.1
60
77
275
6227
650
284
< 0.1
501
1414
379
7642
420
4812
< 0.1
40
77
463
5319
661
335
< 0.1
2 419
7314
14
567
5832
350
2218
< 0.1
00
77
675
5925
570
4610
< 0.1
20
77
756
5414
520
332
< 0.1
30
00
814
533
153
611
197
14< 0
.11
07
7
993
7929
630
5611
< 0.1
770
014
14
1068
6036
160
2915
< 0.1
262
2121
1122
726
411
595
046
213
< 0.1
00
3636
1294
7137
560
7917
< 0.1
90
77
1311
210
744
850
107
11< 0
.127
60
1414
1482
7535
450
4910
< 0.1
120
77
1516
340
613
873
024
511
< 0.1
10
2121
1670
5821
420
2913
< 0.1
219
2121
1722
616
113
814
21
412
654.0
237
050
50
1816
871
4923
00
211
3< 0
.10
021
21
1967
6335
430
232
< 0.1
00
00
© Central University of Technology, Free State
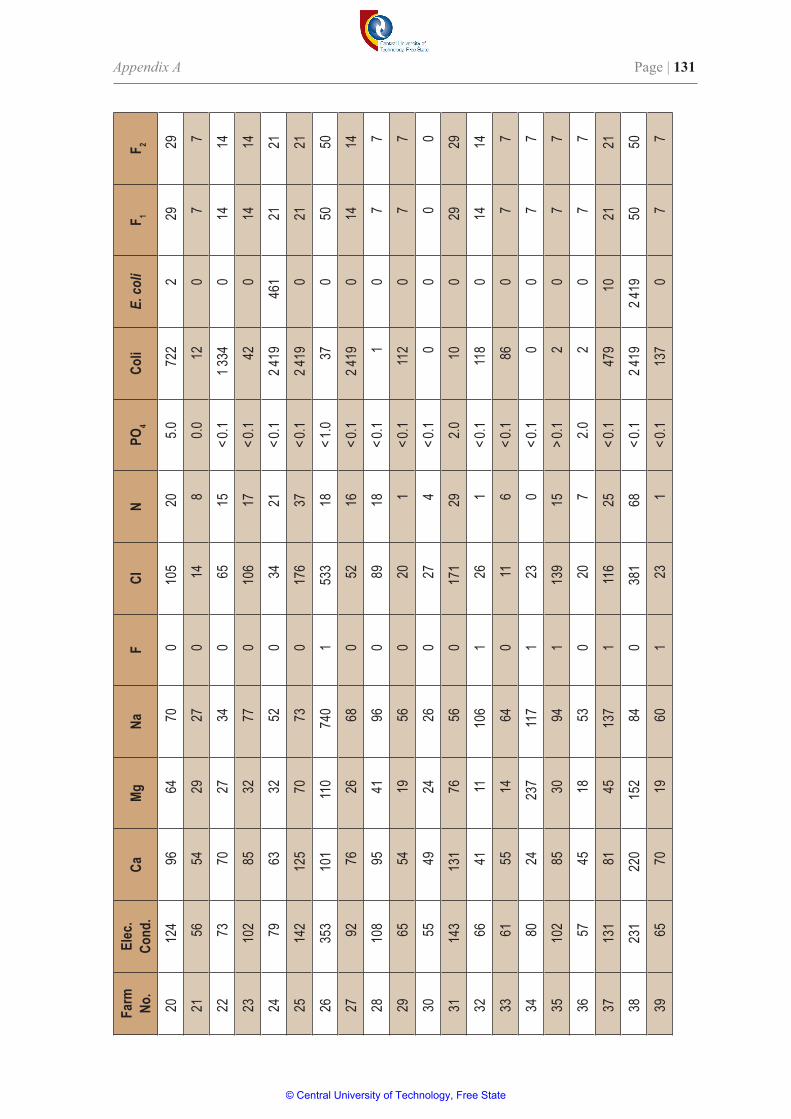
Appendix A Page | 131
Farm
No
.El
ec.
Cond
.Ca
MgNa
FCl
N PO
4 Co
liE.
coli
F 1 F 2
2012
496
6470
010
520
5.072
22
2929
2156
5429
270
148
0.012
07
7
2273
7027
340
6515
< 0.1
1 334
014
14
2310
285
3277
010
617
< 0.1
420
1414
2479
6332
520
3421
< 0.1
2 419
461
2121
2514
212
570
730
176
37< 0
.12 4
190
2121
2635
310
111
074
01
533
18< 1
.037
050
50
2792
7626
680
5216
< 0.1
2 419
014
14
2810
895
4196
089
18< 0
.11
07
7
2965
5419
560
201
< 0.1
112
07
7
3055
4924
260
274
< 0.1
00
00
3114
313
176
560
171
292.0
100
2929
3266
4111
106
126
1< 0
.111
80
1414
3361
5514
640
116
< 0.1
860
77
3480
2423
711
71
230
< 0.1
00
77
3510
285
3094
113
915
> 0.1
20
77
3657
4518
530
207
2.02
07
7
3713
181
4513
71
116
25< 0
.147
910
2121
3823
122
015
284
038
168
< 0.1
2 419
2 419
5050
3965
7019
601
231
< 0.1
137
07
7
© Central University of Technology, Free State
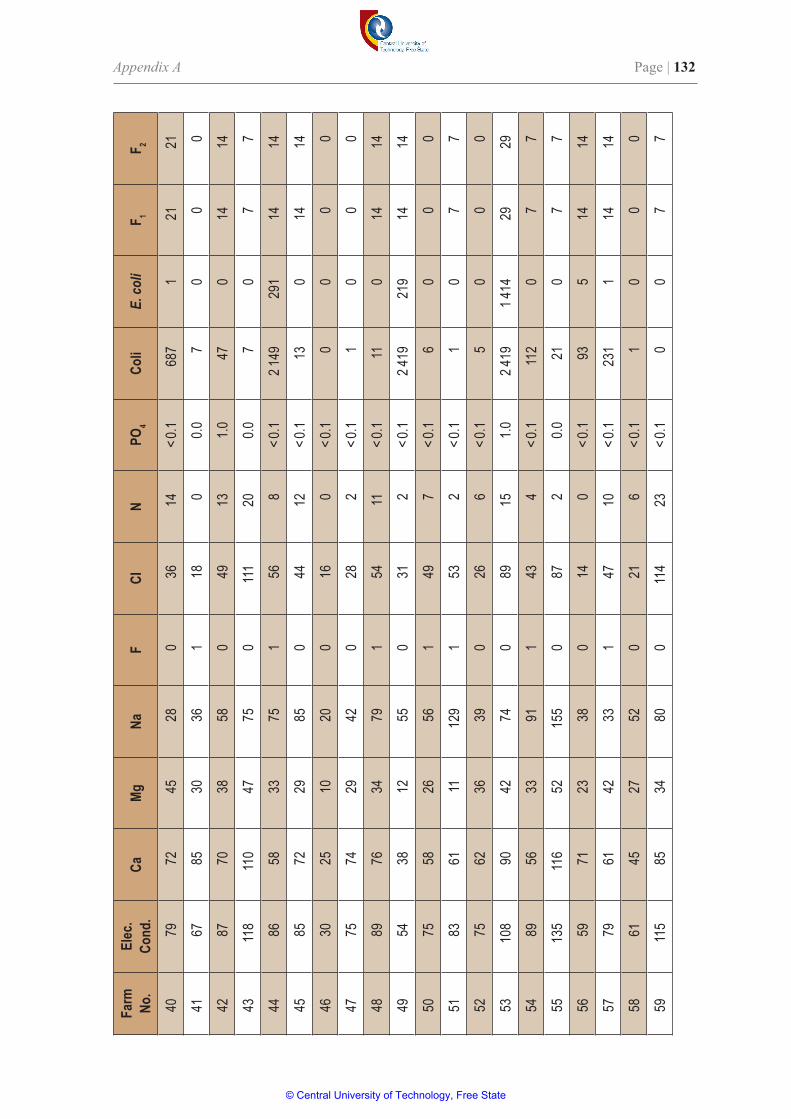
Appendix A Page | 132
Farm
No
.El
ec.
Cond
.Ca
MgNa
FCl
N PO
4 Co
liE.
coli
F 1 F 2
4079
7245
280
3614
< 0.1
687
121
21
4167
8530
361
180
0.07
00
0
4287
7038
580
4913
1.047
014
14
4311
811
047
750
111
200.0
70
77
4486
5833
751
568
< 0.1
2 149
291
1414
4585
7229
850
4412
< 0.1
130
1414
4630
2510
200
160
< 0.1
00
00
4775
7429
420
282
< 0.1
10
00
4889
7634
791
5411
< 0.1
110
1414
4954
3812
550
312
< 0.1
2 419
219
1414
5075
5826
561
497
< 0.1
60
00
5183
6111
129
153
2< 0
.11
07
7
5275
6236
390
266
< 0.1
50
00
5310
890
4274
089
151.0
2 419
1 414
2929
5489
5633
911
434
< 0.1
112
07
7
5513
511
652
155
087
20.0
210
77
5659
7123
380
140
< 0.1
935
1414
5779
6142
331
4710
< 0.1
231
114
14
5861
4527
520
216
< 0.1
10
00
5911
585
3480
011
423
< 0.1
00
77
© Central University of Technology, Free State
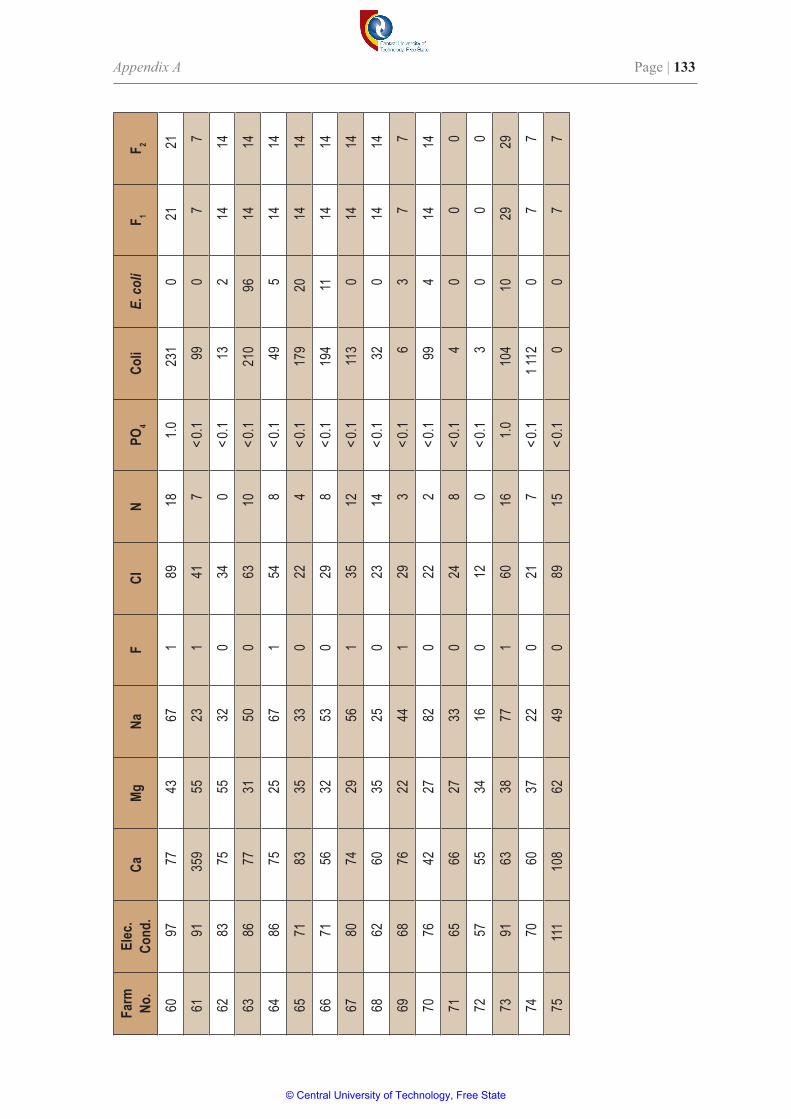
Appendix A Page | 133
Farm
No
.El
ec.
Cond
.Ca
MgNa
FCl
N PO
4 Co
liE.
coli
F 1 F 2
6097
7743
671
8918
1.023
10
2121
6191
359
5523
141
7< 0
.199
07
7
6283
7555
320
340
< 0.1
132
1414
6386
7731
500
6310
< 0.1
210
9614
14
6486
7525
671
548
< 0.1
495
1414
6571
8335
330
224
< 0.1
179
2014
14
6671
5632
530
298
< 0.1
194
1114
14
6780
7429
561
3512
< 0.1
113
014
14
6862
6035
250
2314
< 0.1
320
1414
6968
7622
441
293
< 0.1
63
77
7076
4227
820
222
< 0.1
994
1414
7165
6627
330
248
< 0.1
40
00
7257
5534
160
120
< 0.1
30
00
7391
6338
771
6016
1.010
410
2929
7470
6037
220
217
< 0.1
1 112
07
7
7511
110
862
490
8915
< 0.1
00
77
© Central University of Technology, Free State
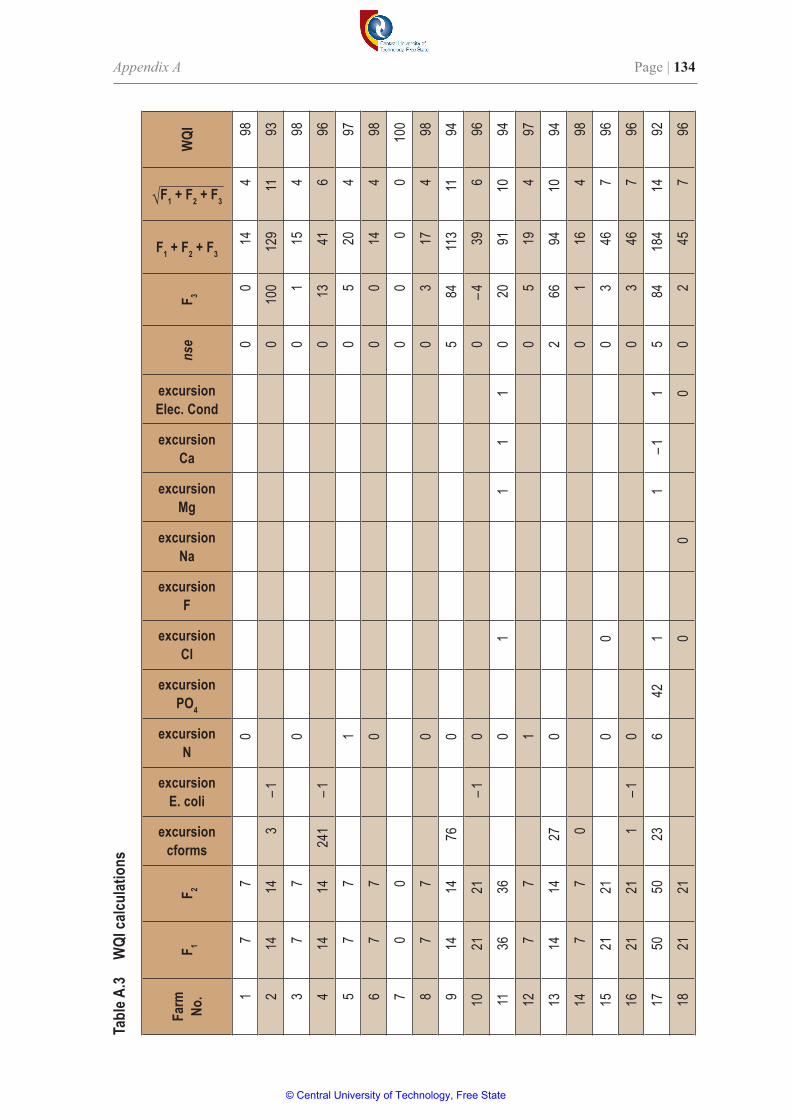
Appendix A Page | 134
Tabl
e A.3
WQI
calcu
latio
ns
Farm
No
. F 1
F 2
excursion cforms
excursion E. coli
excursion N
excursion PO 4
excursion Cl
excursion F
excursion Na
excursion Mg
excursion Ca
excursion Elec. Cond
nse
F 3
F 1 + F 2 + F 3
√__________
F 1 + F 2 + F 3 W
QI
17
70
00
144
98
214
143
– 10
100
129
1193
37
70
01
154
98
414
1424
1– 1
013
416
96
57
71
05
204
97
67
70
00
144
98
70
00
00
010
0
87
70
03
174
98
914
1476
05
8411
311
94
1021
21– 1
00
– 439
696
1136
360
11
11
020
9110
94
127
71
05
194
97
1314
1427
02
6694
1094
147
70
01
164
98
1521
210
00
346
796
1621
211
– 10
03
467
96
1750
5023
642
11
– 11
584
184
1492
1821
210
00
02
457
96
© Central University of Technology, Free State
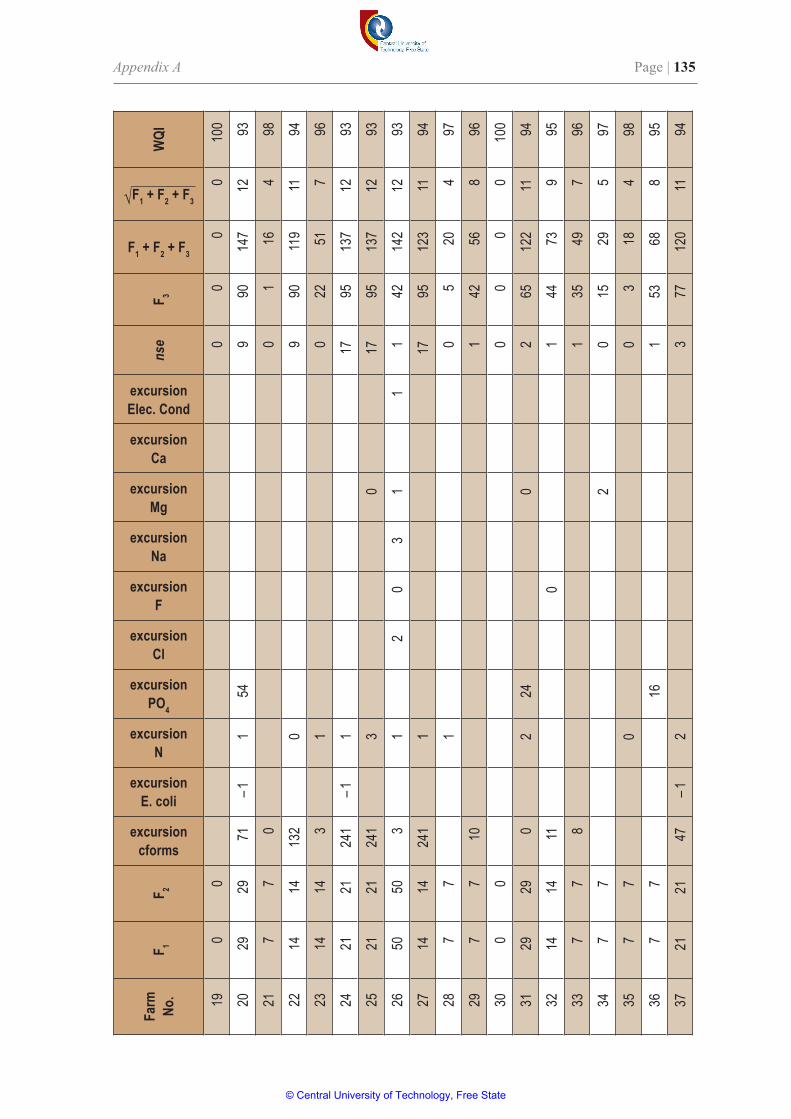
Appendix A Page | 135
Farm
No
. F 1
F 2
excursion cforms
excursion E. coli
excursion N
excursion PO 4
excursion Cl
excursion F
excursion Na
excursion Mg
excursion Ca
excursion Elec. Cond
nse
F 3
F 1 + F 2 + F 3
√__________
F 1 + F 2 + F 3
WQI
190
00
00
010
0
2029
2971
– 11
549
9014
712
93
217
70
01
164
98
2214
1413
20
990
119
1194
2314
143
10
2251
796
2421
2124
1– 1
117
9513
712
93
2521
2124
13
017
9513
712
93
2650
503
12
03
11
142
142
1293
2714
1424
11
1795
123
1194
287
71
05
204
97
297
710
142
568
96
300
00
00
010
0
3129
290
224
02
6512
211
94
3214
1411
01
4473
995
337
78
135
497
96
347
72
015
295
97
357
70
03
184
98
367
716
153
688
95
3721
2147
– 12
377
120
1194
© Central University of Technology, Free State

Appendix A Page | 136
Farm
No
. F 1
F 2
excursion cforms
excursion E. coli
excursion N
excursion PO 4
excursion Cl
excursion F
excursion Na
excursion Mg
excursion Ca
excursion Elec. Cond
nse
F 3
F 1 + F 2 + F 3
√__________
F 1 + F 2 + F 3
WQI
3850
5024
1– 1
61
01
1895
195
1492
397
713
148
628
95
4021
21– 1
00
– 438
696
410
00
00
010
0
4214
144
00
2251
796
437
71
07
215
97
4414
1424
1– 1
1794
123
1194
4514
140
00
332
697
460
00
00
010
0
470
00
00
010
0
4814
140
00
130
597
4914
1424
1– 1
1794
123
1194
500
00
00
010
0
517
70
03
174
98
520
00
00
010
0
5329
2924
1– 1
19
1895
152
1293
547
710
142
568
96
557
70
014
498
5614
148
– 11
3463
895
© Central University of Technology, Free State
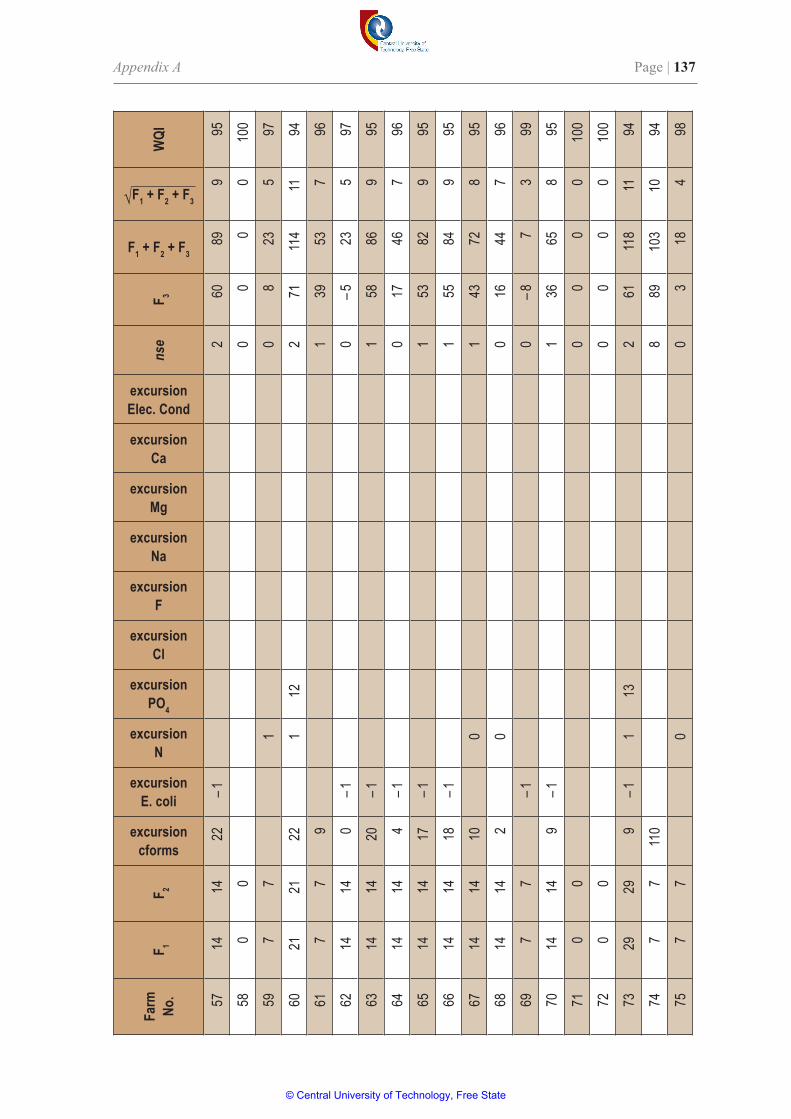
Appendix A Page | 137
Farm
No
. F 1
F 2
excursion cforms
excursion E. coli
excursion N
excursion PO 4
excursion Cl
excursion F
excursion Na
excursion Mg
excursion Ca
excursion Elec. Cond
nse
F 3
F 1 + F 2 + F 3
√__________
F 1 + F 2 + F 3
WQI
5714
1422
– 12
6089
995
580
00
00
010
0
597
71
08
235
97
6021
2122
112
271
114
1194
617
79
139
537
96
6214
140
– 10
– 523
597
6314
1420
– 11
5886
995
6414
144
– 10
1746
796
6514
1417
– 11
5382
995
6614
1418
– 11
5584
995
6714
1410
01
4372
895
6814
142
00
1644
796
697
7– 1
0– 8
73
99
7014
149
– 11
3665
895
710
00
00
010
0
720
00
00
010
0
7329
299
– 11
132
6111
811
94
747
711
08
8910
310
94
757
70
03
184
98
© Central University of Technology, Free State
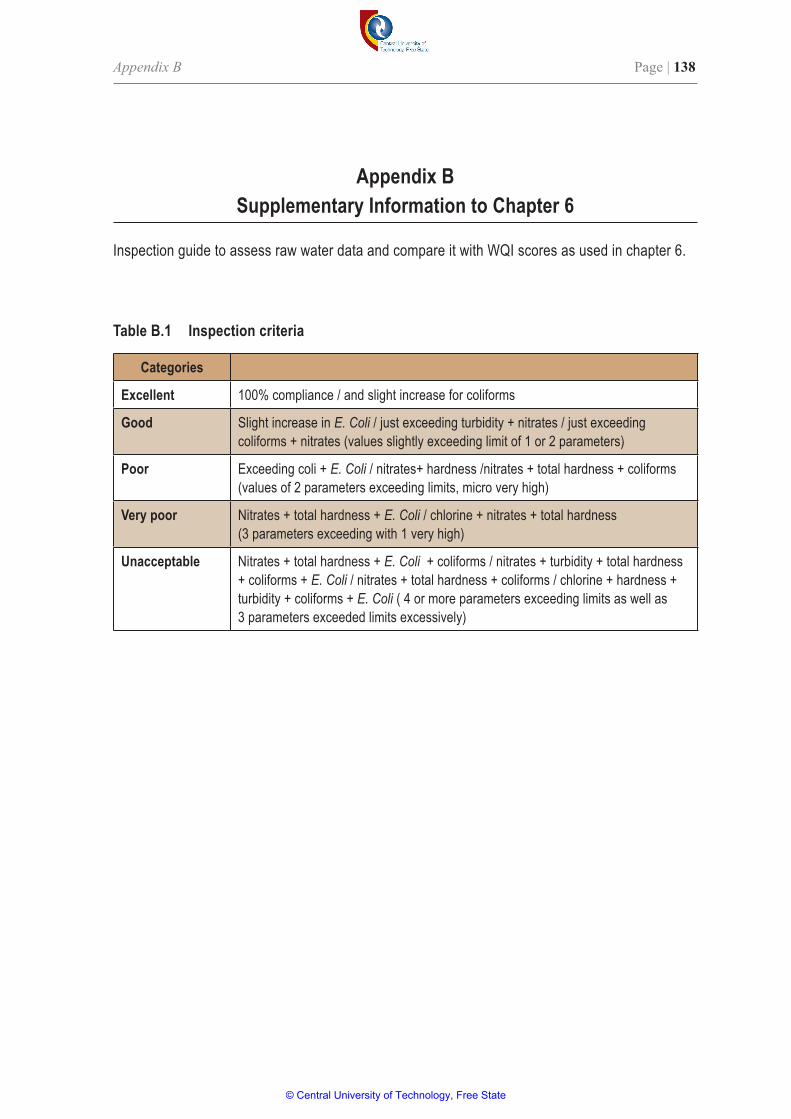
Appendix B Page | 138
Appendix B Supplementary Information to Chapter 6
Inspection guide to assess raw water data and compare it with WQI scores as used in chapter 6.
Table B.1 Inspection criteria
Categories
Excellent 100% compliance / and slight increase for coliforms
Good Slight increase in E. Coli / just exceeding turbidity + nitrates / just exceeding coliforms + nitrates (values slightly exceeding limit of 1 or 2 parameters)
Poor Exceeding coli + E. Coli / nitrates+ hardness /nitrates + total hardness + coliforms (values of 2 parameters exceeding limits, micro very high)
Very poor Nitrates + total hardness + E. Coli / chlorine + nitrates + total hardness (3 parameters exceeding with 1 very high)
Unacceptable Nitrates + total hardness + E. Coli + coliforms / nitrates + turbidity + total hardness + coliforms + E. Coli / nitrates + total hardness + coliforms / chlorine + hardness + turbidity + coliforms + E. Coli ( 4 or more parameters exceeding limits as well as 3 parameters exceeded limits excessively)
© Central University of Technology, Free State
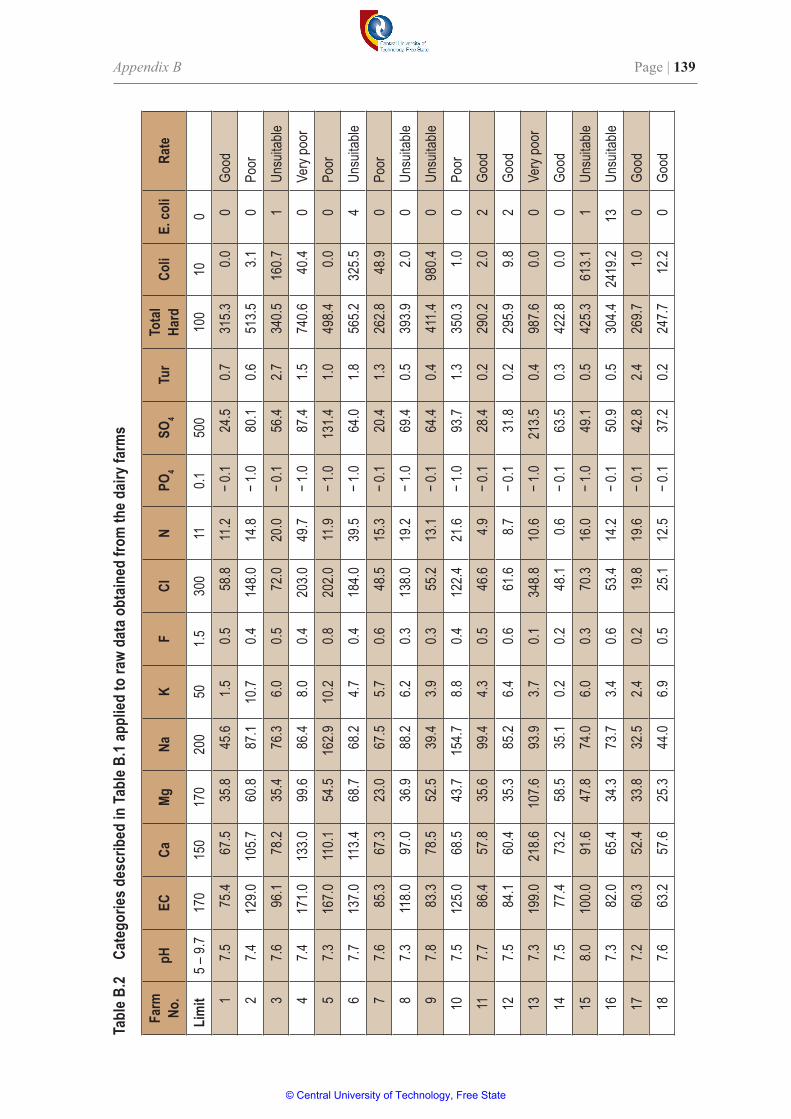
Appendix B Page | 139
Tabl
e B.2
Cate
gorie
s des
crib
ed in
Tabl
e B.1
appl
ied to
raw
data
obt
ained
from
the d
airy f
arm
s
Farm
No
.pH
ECCa
MgNa
KF
ClN
PO 4
SO 4
Tur
Tota
l Ha
rdCo
liE.
coli
Rate
Lim
it5 –
9.7
170
150
170
200
501.5
300
110.1
500
100
100
17.5
75.4
67.5
35.8
45.6
1.50.5
58.8
11.2
− 0.1
24.5
0.731
5.30.0
0Go
od
27.4
129.0
105.7
60.8
87.1
10.7
0.414
8.014
.8− 1
.080
.10.6
513.5
3.10
Poor
37.6
96.1
78.2
35.4
76.3
6.00.5
72.0
20.0
− 0.1
56.4
2.734
0.516
0.71
Unsu
itable
47.4
171.0
133.0
99.6
86.4
8.00.4
203.0
49.7
− 1.0
87.4
1.574
0.640
.40
Very
poor
57.3
167.0
110.1
54.5
162.9
10.2
0.820
2.011
.9− 1
.013
1.41.0
498.4
0.00
Poor
67.7
137.0
113.4
68.7
68.2
4.70.4
184.0
39.5
− 1.0
64.0
1.856
5.232
5.54
Unsu
itable
77.6
85.3
67.3
23.0
67.5
5.70.6
48.5
15.3
− 0.1
20.4
1.326
2.848
.90
Poor
87.3
118.0
97.0
36.9
88.2
6.20.3
138.0
19.2
− 1.0
69.4
0.539
3.92.0
0Un
suita
ble
97.8
83.3
78.5
52.5
39.4
3.90.3
55.2
13.1
− 0.1
64.4
0.441
1.498
0.40
Unsu
itable
107.5
125.0
68.5
43.7
154.7
8.80.4
122.4
21.6
− 1.0
93.7
1.335
0.31.0
0Po
or
117.7
86.4
57.8
35.6
99.4
4.30.5
46.6
4.9− 0
.128
.40.2
290.2
2.02
Good
127.5
84.1
60.4
35.3
85.2
6.40.6
61.6
8.7− 0
.131
.80.2
295.9
9.82
Good
137.3
199.0
218.6
107.6
93.9
3.70.1
348.8
10.6
− 1.0
213.5
0.498
7.60.0
0Ve
ry po
or
147.5
77.4
73.2
58.5
35.1
0.20.2
48.1
0.6− 0
.163
.50.3
422.8
0.00
Good
158.0
100.0
91.6
47.8
74.0
6.00.3
70.3
16.0
− 1.0
49.1
0.542
5.361
3.11
Unsu
itable
167.3
82.0
65.4
34.3
73.7
3.40.6
53.4
14.2
− 0.1
50.9
0.530
4.424
19.2
13Un
suita
ble
177.2
60.3
52.4
33.8
32.5
2.40.2
19.8
19.6
− 0.1
42.8
2.426
9.71.0
0Go
od
187.6
63.2
57.6
25.3
44.0
6.90.5
25.1
12.5
− 0.1
37.2
0.224
7.712
.20
Good
© Central University of Technology, Free State
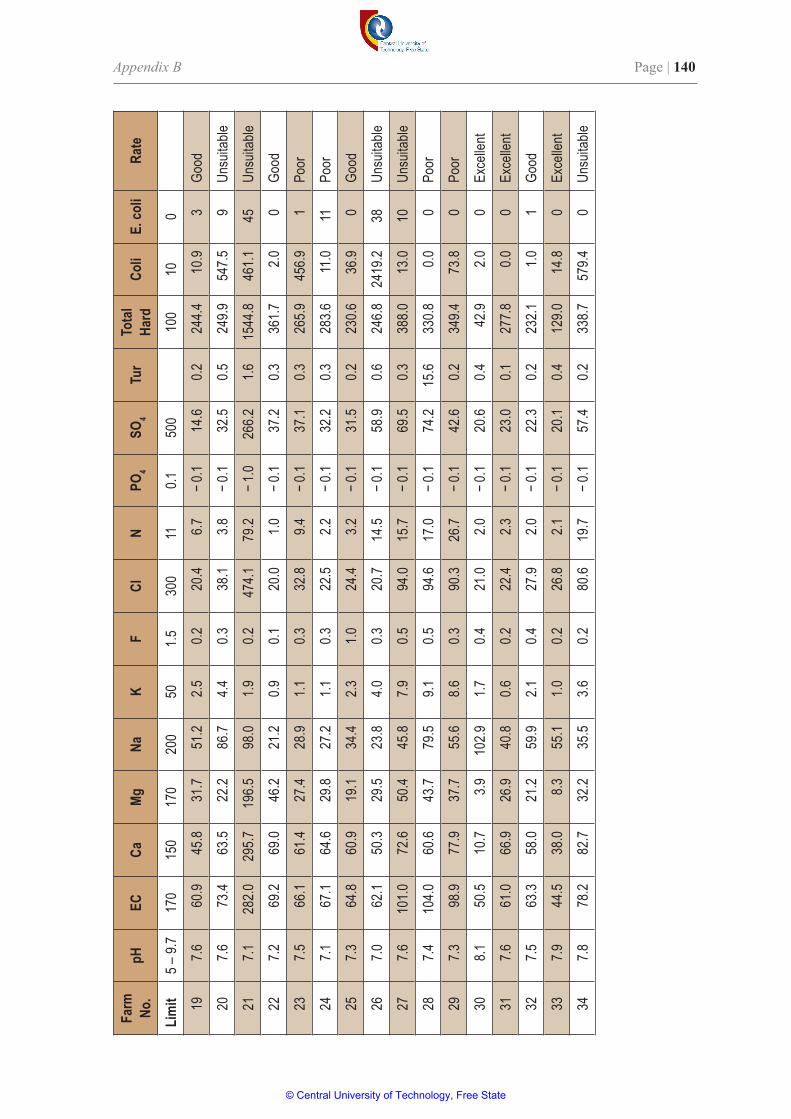
Appendix B Page | 140
Farm
No
.pH
ECCa
MgNa
KF
ClN
PO 4
SO 4
Tur
Tota
l Ha
rdCo
liE.
coli
Rate
Lim
it5 –
9.7
170
150
170
200
501.5
300
110.1
500
100
100
197.6
60.9
45.8
31.7
51.2
2.50.2
20.4
6.7− 0
.114
.60.2
244.4
10.9
3Go
od
207.6
73.4
63.5
22.2
86.7
4.40.3
38.1
3.8− 0
.132
.50.5
249.9
547.5
9Un
suita
ble
217.1
282.0
295.7
196.5
98.0
1.90.2
474.1
79.2
− 1.0
266.2
1.615
44.8
461.1
45Un
suita
ble
227.2
69.2
69.0
46.2
21.2
0.90.1
20.0
1.0− 0
.137
.20.3
361.7
2.00
Good
237.5
66.1
61.4
27.4
28.9
1.10.3
32.8
9.4− 0
.137
.10.3
265.9
456.9
1Po
or
247.1
67.1
64.6
29.8
27.2
1.10.3
22.5
2.2− 0
.132
.20.3
283.6
11.0
11Po
or
257.3
64.8
60.9
19.1
34.4
2.31.0
24.4
3.2− 0
.131
.50.2
230.6
36.9
0Go
od
267.0
62.1
50.3
29.5
23.8
4.00.3
20.7
14.5
− 0.1
58.9
0.624
6.824
19.2
38Un
suita
ble
277.6
101.0
72.6
50.4
45.8
7.90.5
94.0
15.7
− 0.1
69.5
0.338
8.013
.010
Unsu
itable
287.4
104.0
60.6
43.7
79.5
9.10.5
94.6
17.0
− 0.1
74.2
15.6
330.8
0.00
Poor
297.3
98.9
77.9
37.7
55.6
8.60.3
90.3
26.7
− 0.1
42.6
0.234
9.473
.80
Poor
308.1
50.5
10.7
3.910
2.91.7
0.421
.02.0
− 0.1
20.6
0.442
.92.0
0Ex
celle
nt
317.6
61.0
66.9
26.9
40.8
0.60.2
22.4
2.3− 0
.123
.00.1
277.8
0.00
Exce
llent
327.5
63.3
58.0
21.2
59.9
2.10.4
27.9
2.0− 0
.122
.30.2
232.1
1.01
Good
337.9
44.5
38.0
8.355
.11.0
0.226
.82.1
− 0.1
20.1
0.412
9.014
.80
Exce
llent
347.8
78.2
82.7
32.2
35.5
3.60.2
80.6
19.7
− 0.1
57.4
0.233
8.757
9.40
Unsu
itable
© Central University of Technology, Free State
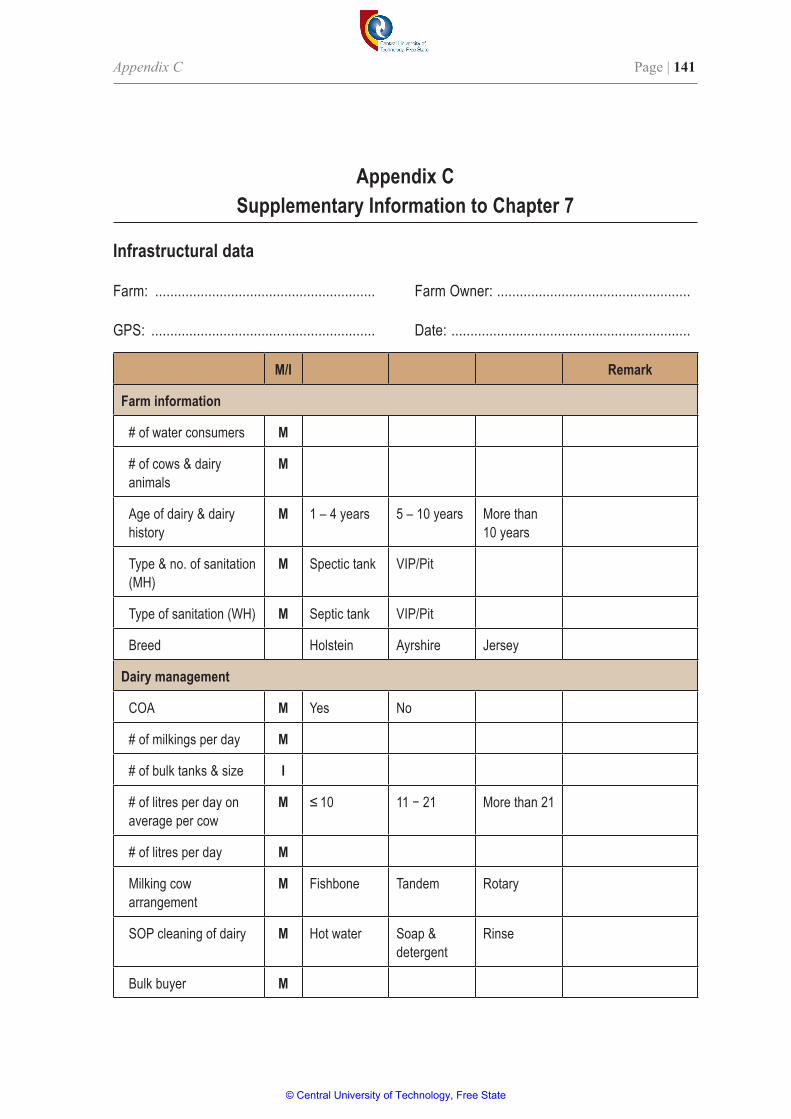
Appendix C Page | 141
Appendix C Supplementary Information to Chapter 7
Infrastructural data
Farm: .......................................................... Farm Owner: ...................................................
GPS: ........................................................... Date: ...............................................................
M/I Remark
Farm information
# of water consumers M
# of cows & dairy animals
M
Age of dairy & dairy history
M 1 – 4 years 5 – 10 years More than 10 years
Type & no. of sanitation (MH)
M Spectic tank VIP/Pit
Type of sanitation (WH) M Septic tank VIP/Pit
Breed Holstein Ayrshire Jersey
Dairy management
COA M Yes No
# of milkings per day M
# of bulk tanks & size I
# of litres per day on average per cow
M ≤ 10 11 − 21 More than 21
# of litres per day M
Milking cow arrangement
M Fishbone Tandem Rotary
SOP cleaning of dairy M Hot water Soap & detergent
Rinse
Bulk buyer M
© Central University of Technology, Free State
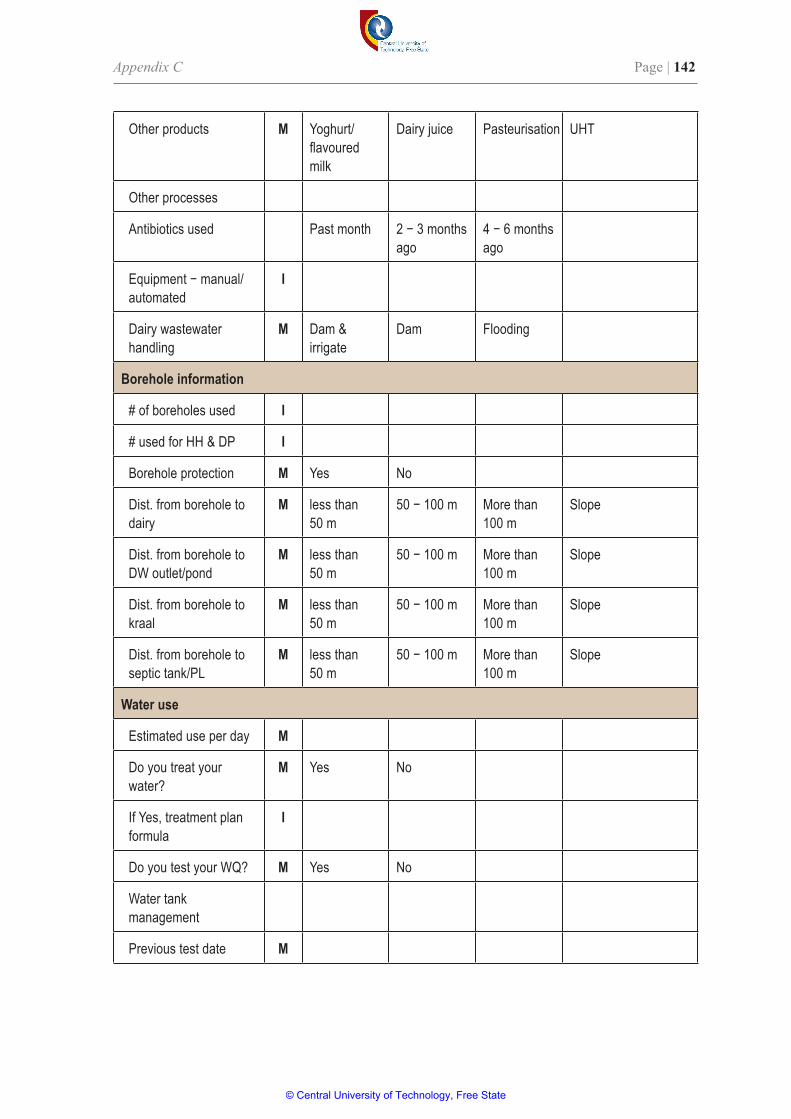
Appendix C Page | 142
Other products M Yoghurt/flavoured milk
Dairy juice Pasteurisation UHT
Other processes
Antibiotics used Past month 2 − 3 months ago
4 − 6 months ago
Equipment − manual/automated
I
Dairy wastewater handling
M Dam & irrigate
Dam Flooding
Borehole information
# of boreholes used I
# used for HH & DP I
Borehole protection M Yes No
Dist. from borehole to dairy
M less than 50 m
50 − 100 m More than 100 m
Slope
Dist. from borehole to DW outlet/pond
M less than 50 m
50 − 100 m More than 100 m
Slope
Dist. from borehole to kraal
M less than 50 m
50 − 100 m More than 100 m
Slope
Dist. from borehole to septic tank/PL
M less than 50 m
50 − 100 m More than 100 m
Slope
Water use
Estimated use per day M
Do you treat your water?
M Yes No
If Yes, treatment plan formula
I
Do you test your WQ? M Yes No
Water tank management
Previous test date M
© Central University of Technology, Free State

Appendix C Page | 143
Dairy farm layout
© Central University of Technology, Free State