Embed Size (px)
Citation preview
In This Issue
Winter 1999Volume 8, Issue 4
On Tap is a publication of theNational Drinking
Water Clearinghouse,sponsored by the
Rural Utilities Service.
Continued on page 18
Drinking Water News For America’s Small Communities
A Brief History ofDrinking WaterRegulationsby Jamie KnottsNDWC Promotions Coordinator
Twenty-five years ago, Congress passed anact that brought sweeping changes for America’sdrinking water systems. Since the Safe DrinkingWater Act (SDWA) of 1974 went into effect,water systems have encountered many new regu-lations, such as meeting specific water qualitystandards, monitoring for contaminants, and submitting water quality reports.
The first SDWA was born after four years ofsometimes contentious work by Congress todevelop a national program that would ensure thequality of America’s drinking water. For the firsttime, the 1974 act authorized the U.S. Environ-mental Protection Agency (EPA) to set standardsfor any contaminant in public water systems thatadversely affects public health.
How did the SDWA come about?The U.S. Public Health Service (PHS) set
the earliest formal drinking water standards in1914, says Frederick W. Pontius, P.E., consultanton regulatory affairs and compliance issues in his‘‘History of the Safe Drinking Water” on EPA’sWeb site (address is located at the end of thisarticle). These standards sought to prevent trans-mission of communicable diseases in water sup-plies on interstate carriers, such as buses, trains,and eventually planes.
Community water systems were not forcedto comply with the regulations; however, moststates and municipalities adopted the PHS stan-dards as guidelines. Under these standards, thePHS set limits for total bacterial plate count, butbecause they could not agree to specific chemicaland physical characteristics, these initial standardswere limited to bacteriological water quality issues.
SpecialSDWA
Anniver-sary Issue
This Futures Forum was held December 16 at the Hyatt Regency Hotel in Washington, D.C.
The purpose of the Futures Forum was toevaluate challenges facing the nation in ensuring a safe drinking water supply. EPA and its part-ners have gathered suggestions from individualsall over the country. And EPA has offered onlineforums for those who wish to contribute atwww.epa.gov/safewater/sdwa25/futures.
The all-encompassing question of how toensure safe drinking water in 2025 is dividedinto seven subsets of questions: treatmenttechnologies, source water quality, sensitive sub-populations, cost, small systems, unserved popula-tion, and research.
For further information about EPA’s forum,call Charlene Shaw at (202) 260-2285 or e-mailher at [email protected]. Look for a sum-mary of Futures Forum findings in the Spring2000 issue of On Tap.
Safe Drinking Water Protects Our FutureFlying over the country, lakes and ponds
sparkle like glass. Rivers thread silvery throughthe earth tone patchwork. A quarter-century ago,then President Gerald Ford signed the SafeDrinking Water Act (SDWA) into law to protectthe public in every tiny community nestled into
this vast landscape. The U.S. Environmental
Protection Agency (EPA) is cel-ebrating the 25th anniversary of thislandmark environmental legisla-tion by sharing a vision for
drinking water in 2025 in a ‘‘Futures Forum.’’The EPA and a dozen
partners have engaged in the for-midable, year-long task of gathering
answers to the question: How should we ensure safe
drinking water in 25years?
2 On Tap Winter 1999
Volume 8, Issue 4Winter 1999
Sponsored by
Rural Utilities ServiceAdministrator
Wally B. Beyer
Loan SpecialistDonna Roderick
Established in 1991 at WestVirginia University, the
National Drinking WaterClearinghouse is funded by
the Water and WasteDisposal Division of theRural Utilities Service.
National Drinking WaterClearinghouse
Manager, WVU EnvironmentalServices and Training Division
John L. Mori, Ph.D.
Program CoordinatorSanjay Saxena
Managing EditorHarriet Emerson, MSJ
EditorKathy Jesperson
Technical Assistance SpecialistsMohamed Lahlou, Ph.D.Babu Madabhushi, MS
Vipin Bhardwaj
Promotions CoordinatorJamie Knotts
Graphic DesignerMichelle Sanders
On Tap is a free publication,produced four times a year(February, May, August, andNovember). Articles, lettersto the editor, news items,
photographs, or other materi-als submitted for publication
are welcome. Pleaseaddress correspondence to:
Editor, On Tap, NDWCWest Virginia University
P.O. Box 6064Morgantown, WV 26506-6064
(800) 624-8301(304) 293-4191
http://www.ndwc.wvu.edu
Permission to quote from orreproduce articles in this
publication is granted whendue acknowledgment is
given. Please send a copy of the publication in whichinformation was used tothe On Tap editor at the
address above.
The contents of this publica-tion do not necessarily reflectthe views and policies of theRural Utilities Service, nor
does mention of trade namesor commercial products con-
stitute endorsement or recommendation for use.
ISSN 1061-9291
Equal Opportunity/AffirmativeAction Institution
Printed on recycled paper
On TapOn Tap Toasts SDWA’s 25th Anniversary
We dedicate this issue of On Tapto the SafeDrinking Water Act (SDWA)—the major nationallegislation that has ensured safe drinking wateracross the country for the last quarter century. Webegin with a brief history of SDWA regulations byJamie Knotts, National Drinking Water Clearing-house (NDWC) promotions coordinator, and aquick look at the future of water. (See page 1.)
We had no idea our introduction to watertank diving would create controversy, but it has.We’ve received several letters on the topic. (See page 21.) If you take issue with what weprint, by all means, let us know about it.
We’d like to welcome Michelle Sanders, ournew graphic designer. Sanders earned a bachelor’sdegree in English with a television broadcastingemphasis at Waynesburg College, then a degreein graphic design at West Virginia University(WVU). Her specialties include Web design,multi-media, animation, and conference presen-tation. She most recently worked for WVU at theNASA Facility in Fairmont, West Virginia.
Also, Jose` Fernando Giraldo Rios ofPereira, Colombia, is currently translating theNDWC Tech Briefs into Spanish. He is a partici-pant in the Council for International Programsthat places international professionals with WVUdepartments to learn and exchange information.
Giraldo has a background in civil engineering,development projects, and business management.He has held several administrative positions inpublic works and public services, and mostrecently served as general manager of the PereiraAqueduct and Sewage Company.
Finally, this will be my last issue as On Tapeditor. I’ve accepted the position of publications
supervisor for the Environmental Services andTraining Division (ESTD) at WVU. The NDWCis one of four ESTD organizations that includethe National Small Flows Clearinghouse,National Environmental Training Center forSmall Communities, and the National OnsiteDemonstration Programs. I’ve had the pleasureof editing On Tapand working with the NDWC’stalented staff since January 1995. Thanks to allof you who have contacted me with suggestions,information, praise, and corrections.
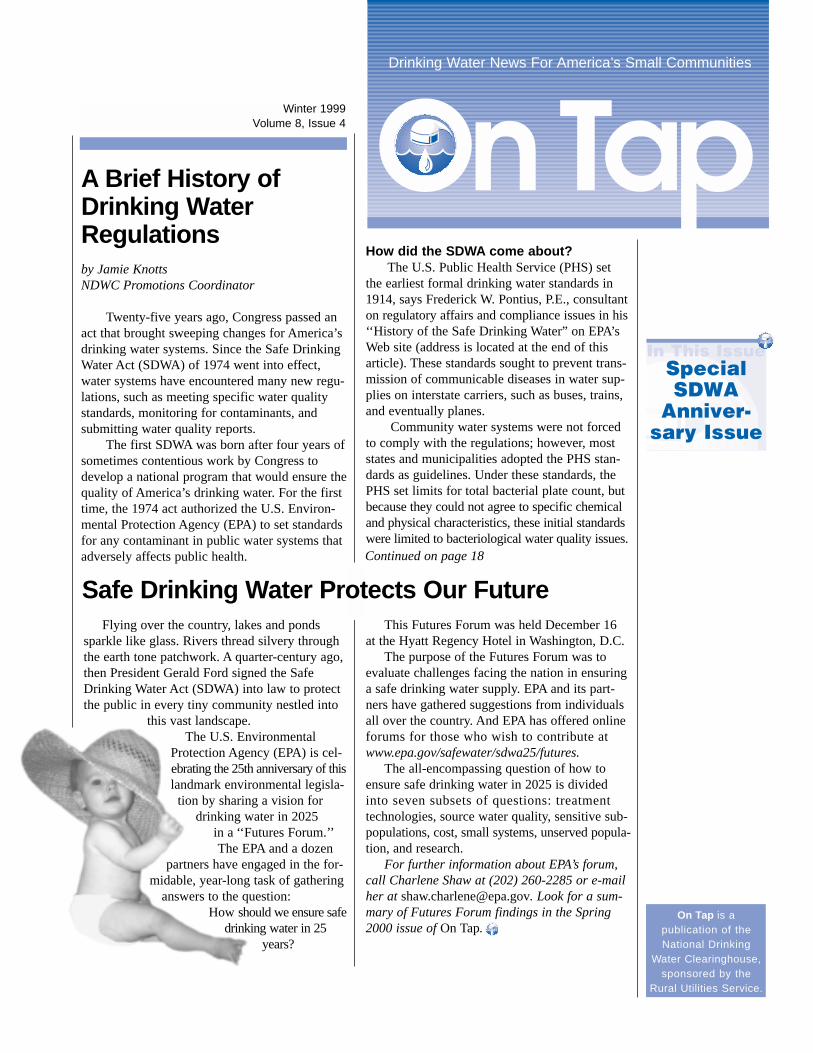
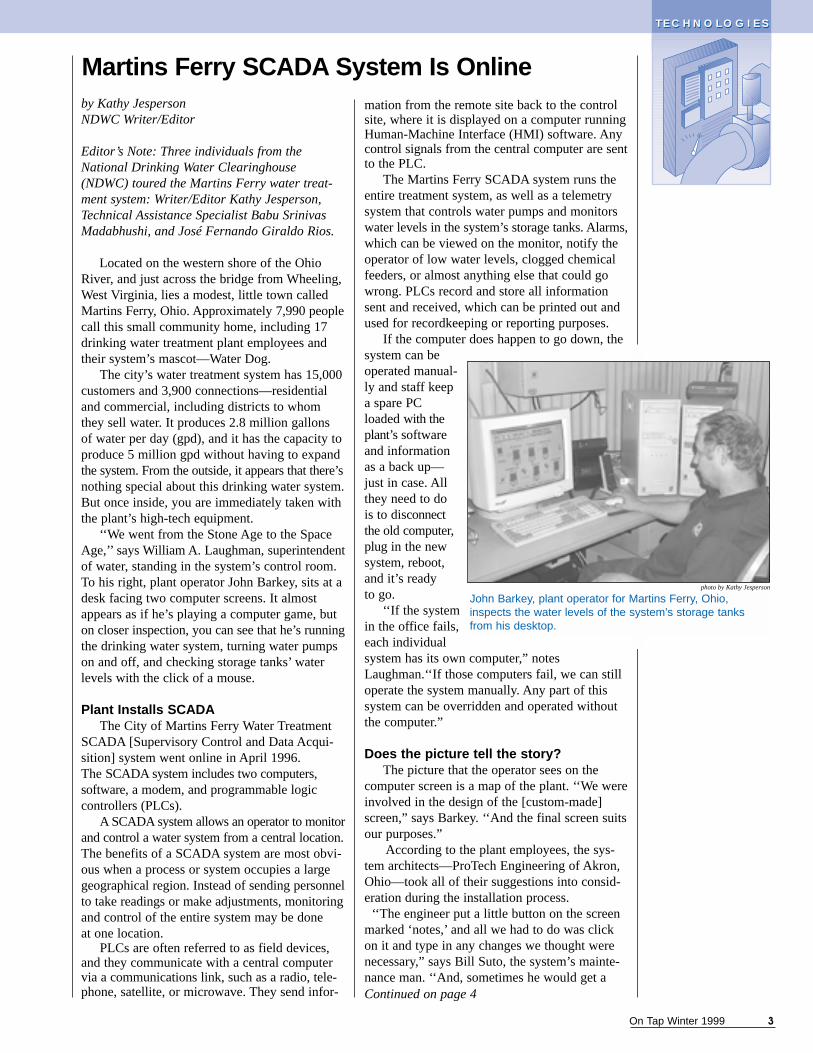
Staff and friends of the National Drinking Water Clearinghouse raise a toast of clean, pure water to the 25th Anniversary of the SafeDrinking Water Act. Pictured left to right (first row) Michelle Sanders, Mark Kemp-Rye, Adrienne Kemp-Rye, Kathy Jesperson,Jamie Knotts; (middle row) Mary Stewart, Shekhar Gothoskar, José Fernando Giraldo Rios, Margaret Caigan McKenzie, BabuSrinivas Madabhushi, Mohamed Lahlou; (back row) Bryan Palko, Kairi Frame, Robin Anderson, Dolly Moran, and Betty Golden.
Harriet EmersonOn TapEditor
photo by Harriet Emerson
On Tap Winter 1999 3
by Kathy JespersonNDWC Writer/Editor
Editor’s Note: Three individuals from theNational Drinking Water Clearinghouse(NDWC) toured the Martins Ferry water treat-ment system: Writer/Editor Kathy Jesperson,Technical Assistance Specialist Babu SrinivasMadabhushi, and José Fernando Giraldo Rios.
Located on the western shore of the OhioRiver, and just across the bridge from Wheeling,West Virginia, lies a modest, little town calledMartins Ferry, Ohio. Approximately 7,990 peoplecall this small community home, including 17drinking water treatment plant employees andtheir system’s mascot—Water Dog.
The city’s water treatment system has 15,000customers and 3,900 connections—residentialand commercial, including districts to whomthey sell water. It produces 2.8 million gallons of water per day (gpd), and it has the capacity toproduce 5 million gpd without having to expandthe system. From the outside, it appears that there’snothing special about this drinking water system.But once inside, you are immediately taken withthe plant’s high-tech equipment.
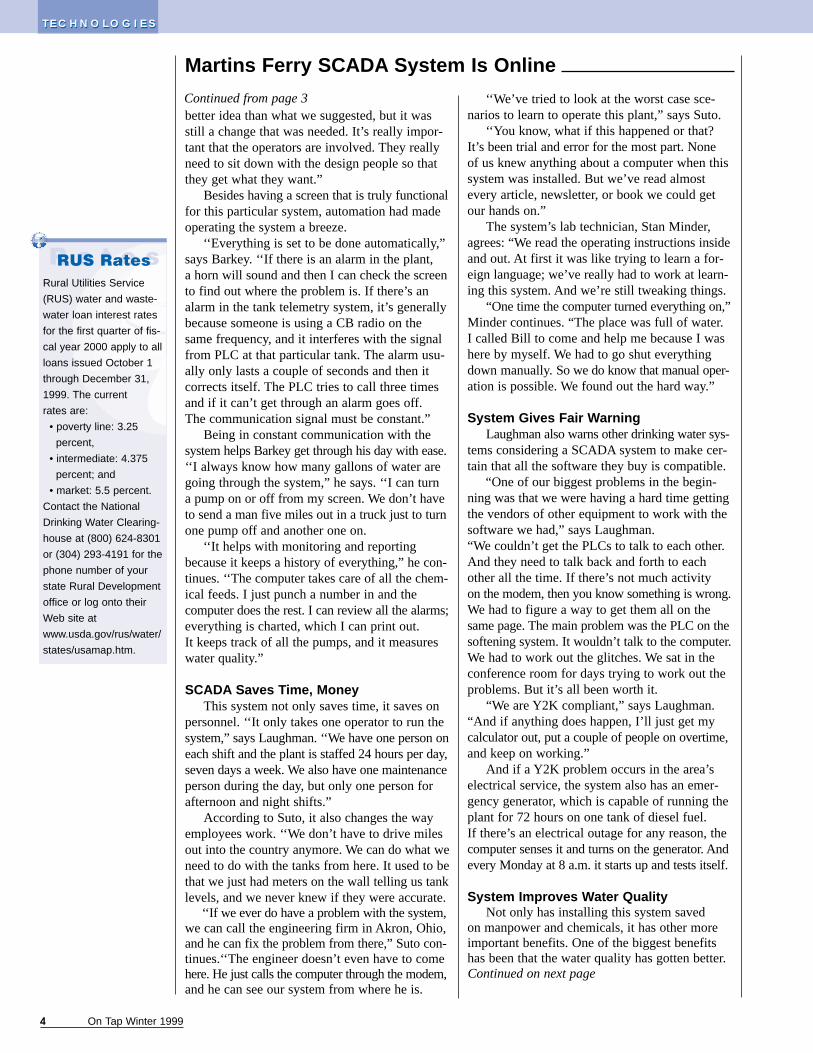
‘‘We went from the Stone Age to the SpaceAge,’’ says William A. Laughman, superintendentof water, standing in the system’s control room.To his right, plant operator John Barkey, sits at adesk facing two computer screens. It almostappears as if he’s playing a computer game, buton closer inspection, you can see that he’s runningthe drinking water system, turning water pumpson and off, and checking storage tanks’ waterlevels with the click of a mouse.
Plant Installs SCADAThe City of Martins Ferry Water Treatment
SCADA [Supervisory Control and Data Acqui-sition] system went online in April 1996. The SCADA system includes two computers, software, a modem, and programmable logic controllers (PLCs).
A SCADA system allows an operator to monitorand control a water system from a central location.The benefits of a SCADA system are most obvi-ous when a process or system occupies a largegeographical region. Instead of sending personnelto take readings or make adjustments, monitoringand control of the entire system may be done at one location.
PLCs are often referred to as field devices,and they communicate with a central computervia a communications link, such as a radio, tele-phone, satellite, or microwave. They send infor-
mation from the remote site back to the controlsite, where it is displayed on a computer runningHuman-Machine Interface (HMI) software. Anycontrol signals from the central computer are sentto the PLC.
The Martins Ferry SCADA system runs theentire treatment system, as well as a telemetrysystem that controls water pumps and monitorswater levels in the system’s storage tanks. Alarms,which can be viewed on the monitor, notify theoperator of low water levels, clogged chemicalfeeders, or almost anything else that could gowrong. PLCs record and store all informationsent and received, which can be printed out andused for recordkeeping or reporting purposes.
If the computer does happen to go down, thesystem can beoperated manual-ly and staff keepa spare PCloaded with theplant’s softwareand informationas a back up—just in case. Allthey need to dois to disconnectthe old computer,plug in the newsystem, reboot,and it’s ready to go.
‘‘If the systemin the office fails,each individualsystem has its own computer,” notesLaughman.‘‘If those computers fail, we can stilloperate the system manually. Any part of thissystem can be overridden and operated withoutthe computer.”
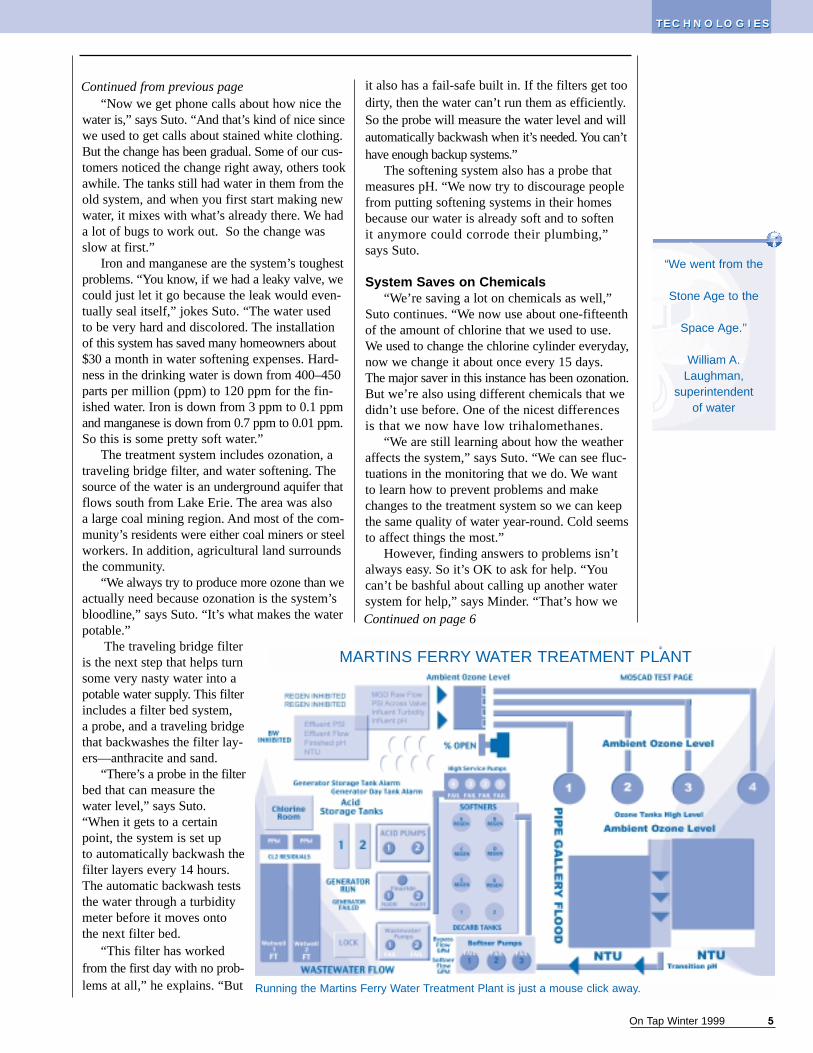
Does the picture tell the story?The picture that the operator sees on the
computer screen is a map of the plant. ‘‘We wereinvolved in the design of the [custom-made]screen,” says Barkey. ‘‘And the final screen suitsour purposes.”
According to the plant employees, the sys-tem architects—ProTech Engineering of Akron,Ohio—took all of their suggestions into consid-eration during the installation process.‘‘The engineer put a little button on the screen
marked ‘notes,’ and all we had to do was clickon it and type in any changes we thought werenecessary,” says Bill Suto, the system’s mainte-nance man. ‘‘And, sometimes he would get aContinued on page 4
Martins Ferry SCADA System Is Online
T E C H N O L O G I E ST E C H N O L O G I E S
John Barkey, plant operator for Martins Ferry, Ohio,inspects the water levels of the system’s storage tanksfrom his desktop.
photo by Kathy Jesperson
better idea than what we suggested, but it wasstill a change that was needed. It’s really impor-tant that the operators are involved. They reallyneed to sit down with the design people so thatthey get what they want.”
Besides having a screen that is truly functionalfor this particular system, automation had madeoperating the system a breeze.
‘‘Everything is set to be done automatically,”says Barkey. ‘‘If there is an alarm in the plant, a horn will sound and then I can check the screento find out where the problem is. If there’s analarm in the tank telemetry system, it’s generallybecause someone is using a CB radio on thesame frequency, and it interferes with the signalfrom PLC at that particular tank. The alarm usu-ally only lasts a couple of seconds and then itcorrects itself. The PLC tries to call three timesand if it can’t get through an alarm goes off. The communication signal must be constant.”
Being in constant communication with thesystem helps Barkey get through his day with ease.‘‘I always know how many gallons of water aregoing through the system,” he says. ‘‘I can turn a pump on or off from my screen. We don’t haveto send a man five miles out in a truck just to turnone pump off and another one on.
‘‘It helps with monitoring and reportingbecause it keeps a history of everything,” he con-tinues. ‘‘The computer takes care of all the chem-ical feeds. I just punch a number in and the computer does the rest. I can review all the alarms;everything is charted, which I can print out. It keeps track of all the pumps, and it measureswater quality.”
SCADA Saves Time, Money This system not only saves time, it saves on
personnel. ‘‘It only takes one operator to run thesystem,” says Laughman. ‘‘We have one person oneach shift and the plant is staffed 24 hours per day,seven days a week. We also have one maintenanceperson during the day, but only one person forafternoon and night shifts.”
According to Suto, it also changes the wayemployees work. ‘‘We don’t have to drive milesout into the country anymore. We can do what weneed to do with the tanks from here. It used to bethat we just had meters on the wall telling us tanklevels, and we never knew if they were accurate.
‘‘If we ever do have a problem with the system,we can call the engineering firm in Akron, Ohio,and he can fix the problem from there,” Suto con-tinues.‘‘The engineer doesn’t even have to comehere. He just calls the computer through the modem,and he can see our system from where he is.
4 On Tap Winter 1999
Martins Ferry SCADA System Is Online
‘‘We’ve tried to look at the worst case sce-narios to learn to operate this plant,” says Suto.
‘‘You know, what if this happened or that? It’s been trial and error for the most part. None of us knew anything about a computer when thissystem was installed. But we’ve read almostevery article, newsletter, or book we could getour hands on.”
The system’s lab technician, Stan Minder,agrees: “We read the operating instructions insideand out. At first it was like trying to learn a for-eign language; we’ve really had to work at learn-ing this system. And we’re still tweaking things.
“One time the computer turned everything on,”Minder continues. “The place was full of water.I called Bill to come and help me because I washere by myself. We had to go shut everythingdown manually. So we do know that manual oper-ation is possible. We found out the hard way.”
System Gives Fair Warning Laughman also warns other drinking water sys-
tems considering a SCADA system to make cer-tain that all the software they buy is compatible.
“One of our biggest problems in the begin-ning was that we were having a hard time gettingthe vendors of other equipment to work with thesoftware we had,” says Laughman. “We couldn’t get the PLCs to talk to each other.And they need to talk back and forth to eachother all the time. If there’s not much activity on the modem, then you know something is wrong.We had to figure a way to get them all on thesame page. The main problem was the PLC on thesoftening system. It wouldn’t talk to the computer.We had to work out the glitches. We sat in theconference room for days trying to work out theproblems. But it’s all been worth it.
“We are Y2K compliant,” says Laughman. “And if anything does happen, I’ll just get mycalculator out, put a couple of people on overtime,and keep on working.”
And if a Y2K problem occurs in the area’selectrical service, the system also has an emer-gency generator, which is capable of running theplant for 72 hours on one tank of diesel fuel. If there’s an electrical outage for any reason, thecomputer senses it and turns on the generator. Andevery Monday at 8 a.m. it starts up and tests itself.
System Improves Water QualityNot only has installing this system saved
on manpower and chemicals, it has other moreimportant benefits. One of the biggest benefitshas been that the water quality has gotten better. Continued on next page
Continued from page 3
T E C H N O L O G I E ST E C H N O L O G I E S
R a t e sRUS RatesRural Utilities Service
(RUS) water and waste-
water loan interest rates
for the first quarter of fis-
cal year 2000 apply to all
loans issued October 1
through December 31,
1999. The current
rates are:
• poverty line: 3.25
percent,
• intermediate: 4.375
percent; and
• market: 5.5 percent.
Contact the National
Drinking Water Clearing-
house at (800) 624-8301
or (304) 293-4191 for the
phone number of your
state Rural Development
office or log onto their
Web site at
www.usda.gov/rus/water/
states/usamap.htm.
On Tap Winter 1999 5
“Now we get phone calls about how nice thewater is,” says Suto. “And that’s kind of nice sincewe used to get calls about stained white clothing.But the change has been gradual. Some of our cus-tomers noticed the change right away, others tookawhile. The tanks still had water in them from theold system, and when you first start making newwater, it mixes with what’s already there. We hada lot of bugs to work out. So the change wasslow at first.”
Iron and manganese are the system’s toughestproblems. “You know, if we had a leaky valve, wecould just let it go because the leak would even-tually seal itself,” jokes Suto. “The water used to be very hard and discolored. The installationof this system has saved many homeowners about$30 a month in water softening expenses. Hard-ness in the drinking water is down from 400–450partsper million (ppm) to 120 ppm for the fin-ished water. Iron is down from 3 ppm to 0.1 ppmand manganese is down from 0.7 ppm to 0.01 ppm.So this is some pretty soft water.”
The treatment system includes ozonation, atraveling bridge filter, and water softening. Thesource of the water is an underground aquifer thatflows south from Lake Erie. The area was also a large coal mining region. And most of the com-munity’s residents were either coal miners or steelworkers. In addition, agricultural land surroundsthe community.
“We always try to produce more ozone than weactually need because ozonation is the system’sbloodline,” says Suto. “It’s what makes the waterpotable.”
The traveling bridge filteris the next step that helps turnsome very nasty water into apotable water supply. This filterincludes a filter bed system, a probe, and a traveling bridgethat backwashes the filter lay-ers—anthracite and sand.
“There’s a probe in the filterbed that can measure thewater level,” says Suto.“When it gets to a certainpoint, the system is set up to automatically backwash thefilter layers every 14 hours.The automatic backwash teststhe water through a turbiditymeter before it moves ontothe next filter bed.
“This filter has workedfrom the first day with no prob-lems at all,” he explains. “But
it also has a fail-safe built in. If the filters get toodirty, then the water can’t run them as efficiently.So the probe will measure the water level and willautomatically backwash when it’s needed. You can’thave enough backup systems.”
The softening system also has a probe thatmeasures pH. “We now try to discourage peoplefrom putting softening systems in their homesbecause our water is already soft and to soften it anymore could corrode their plumbing,” says Suto.
System Saves on Chemicals “We’re saving a lot on chemicals as well,”
Suto continues. “We now use about one-fifteenthof the amount of chlorine that we used to use.We used to change the chlorine cylinder everyday,now we change it about once every 15 days. The major saver in this instance has been ozonation.But we’re also using different chemicals that wedidn’t use before. One of the nicest differencesis that we now have low trihalomethanes.
“We are still learning about how the weatheraffects the system,” says Suto. “We can see fluc-tuations in the monitoring that we do. We wantto learn how to prevent problems and makechanges to the treatment system so we can keepthe same quality of water year-round. Cold seemsto affect things the most.”
However, finding answers to problems isn’talways easy. So it’s OK to ask for help. “Youcan’t be bashful about calling up another watersystem for help,” says Minder. “That’s how weContinued on page 6
Running the Martins Ferry Water Treatment Plant is just a mouse click away.
T E C H N O L O G I E ST E C H N O L O G I E S
“We went from the
Stone Age to the
Space Age.’’
William A.Laughman,
superintendent of water
Continued from previous page
MARTINS FERRY WATER TREATMENT PLANT
6 On Tap Winter 1999
When you’re looking for drinking water infor-mation, remember that the National DrinkingWater Clearinghouse (NDWC) is online. Recently,we added a new keyword search feature to ourWeb site.
Users may now search for specific drinkingwater-related topics that were written about inOn Tapand Water Sense,the NDWC’s quarterlynewsletters. Once users search for a topic, theymay download an electronic copy of the news-letter in which the article appeared. Not all news-letters dating back to 1991 are online, howeverthey will soon be available.
Continued from page 5
Martins Ferry SCADA System Is Online
solved a problem we were having with the softener.It kept clogging. I read an article in a newsletter,and called the system that was highlighted. Andwe then came up with the hot water injection sys-tem that we’re using for the sodium hydroxide.
“We also have a first class lab onsite,” con-tinues Minder. “We test for pH, fluoride, alkalinity,hardness, iron and manganese, bacteria, and sta-bility. This plant could be set up for really smallsystems, and it could run without an operator.”
How expensive is it? “The whole SCADA set-up was less than
$90,000,” says Laughman. “The new plant, alongwith the new water lines and tie-ins with the exist-ing water system, cost $10.5 million.”
According to Laughman, funding for the sys-tem was secured through a 2 percent, low-interesthardship loan from the Ohio Water DevelopmentAuthority (OWDA), and they received an$118,000 grant from the OWDA to pay the interest during construction.
“Our water rates average $15.90 to $26.50per month,” says Laughman. “Residentialhookups in town are unmetered, commercial are
metered, and residents outside the city limits aremetered. Residential customers who are meteredpay an average of $33.10 per month.”
Pride in Ownership “We watched the construction of this plant
from the ground up,” says Minder. “We wantedto know the history of the building so we couldknow where things were, like pipes, and so forth.This was going to be the place where we wouldbe working, so we wanted to know it inside and out.”
Suto sums up feelings for all the employees.“The change in the last few years has beenamazing. There’s a lot of job satisfaction. We are very thankful for what we have.”
For more information about the City ofMartins Ferry Water Treatment Plant, callLaughman at (740) 633-1378. For further infor-mation about SCADA system costs, see theWinter 2000 issue of Water Sense.
To learn more about treating water withozone, see “Tech Brief: Ozone’’ in the centersection of this issue of On Tap.
Water is a bargain:
You can refill an
eight-ounce glass of
water approximately
15,000 times for the
same cost as a
six-pack of soda.
Blue Thumb Project
NDWC Launches Keyword Search Engine
Do you help small communities?If you sell or manufacture a product or offer a
service that will save small communities moneyand improve their water quality or system infra-structure, let us know about it. You greatlyincrease your chances of discussing your productin our newsletters if you include contacts in atleast three small communities.
Call the NDWC at (800) 624-8301 or (304) 293-4191.
T E C H N O L O G I E ST E C H N O L O G I E S
In addition to our publications, the NDWCWeb site offers water facts, our award-winninggroundwater poster, a “what’s new” section, andour new product catalog with online ordering.Currently, our most popular items are the TechBriefs, the drinking water treatment fact sheetspublished in On Tap. Tech Briefs were down-loaded more than 2,300 times in the last year.
To search for specific drinking water information, log onto the NDWC’s Web site atwww.ndwc.wvu.edu.
The U.S. Department of Agriculture’s RuralUtilities Service funds the NDWC and, assuch, we cannot endorse products, not do we accept advertising in our newsletters—On Tap and Water Sense. However, we’revery interested in new technologies and inno-vative concepts, and often speak with compa-ny representatives or mention specific products in our articles.
On Tap Winter 1999 7
RUS Project Officer To RetireDonna Roderick, project officer for the
National Drinking Water Clearinghouse (NDWC)and other technical assistance programs fundedthrough the U.S. Department of Agriculture’sRural Utilities Service (RUS), will retire fromthe federal government on December 31, 1999,after 30 years of service. Roderick has workedwith the NDWC since its creation in 1991.
A native of Maine, Roderick began hercareer with the Farmers Home Administration(FmHA)—now RUS—in her home state in 1969.She then served in several positions, includingcounty office clerk in Bridgeton, Maine, assistantcounty supervisor in Bucksport and Westbrook,Maine, and county supervisor in Gardner,Massachusetts.
In 1981 Roderick moved to Washington,D.C., to work as a loan specialist with FmHA.She has been involved with the Technical Assist-ance and Training (TAT) grant program since itsinception in 1988. According to Roderick, oneof the reasons that TAT was started was to “pro-tect the billions of dollars the government hasinvested in water and wastewater improvementsby providing technical help to small systems.”
Reflecting on her 30 years with the federalgovernment, Roderick is most proud of the serv-ice RUS programs have afforded communities.
“I had the chance to be a small part of helpinga whole lot of people,” she says. “It has been avery gratifying experience.
“The NDWC is one of those programs,”says Roderick. “It serves an important functionof getting much-needed information about drink-ing water to the country’s small communities.’’
Because the NDWC worked so closely withRoderick, her absence will be felt.
“The continuity of having Donna Roderickwork with our program has been most beneficial,”says Sanjay Saxena, NDWC program coordina-tor. “We will miss Donna—and wish her all the best in her future endeavors—and we lookforward to continuing our commitment to smallcommunity drinking water systems in the year2000 and beyond.”
Deanna Plauché will be the new RUS projectofficer beginning January 1, 2000. More infor-mation on Roderick and Plauché will be availablein the Winter issue of Water Sense, the otherNDWC publication.
E. coli 0157:H7 isn’t an index reference. It’sone of the hundreds of strains of Escherichiacoli that is an emerging cause of foodborne andwaterborne illnesses. While E. coli typicallylives harmlessly in the intestines of healthyhumans and animals, E. coli 0157:H7 produces a powerful toxin that can cause severe illness.
The first time E. coli was recognized as thecause of illness was in 1982 after an outbreakthat was traced to contaminated hamburgers.Since then, most infections are believed to havecome from eating undercooked meat. However,some infections have been waterborne. And people have become sick after drinking or swimming in contaminated water.
E. coli is a type of fecal coliform bacteriathat is found in the intestines of humans and ani-mals. If water is contaminated with E. coli, it isa strong indication that sewage or animal wasteis responsible. During rainfalls, snowmelts, orother types of precipitation, E. coli may bewashed into creeks, rivers, streams, lakes, orgroundwater. Without proper treatment, E. colican end up in drinking water.
What are the symptons?Infection from E. coli can cause severe
bloody diarrhea and abdominal cramps. How-ever, there is usually no fever. In some people,especially children under five years old and theelderly, the infection can also cause a conditioncalled hemolytic uremic syndrome, which destroysthe red blood cells and causes the kidneys to fail.This is a life-threatening condition that requiresblood transfusions and kidney dialysis.
Symptoms of infection usually appear withintwo to four days, but can take up to eight days.Most people recover without antibiotics in fiveto 10 days. And there is no evidence that antibi-otics improve the course of disease.
Chlorine, ultraviolet light, or ozone all inacti-vate or kill E. coli.Surface water systems are re-quired to treat for its presence.
For more information about E. coli, call the SafeDrinking Water Hotline at (877) 372-9283.
E. Coli Contamination Can Cause Illness
N E W S & N O T E SN E W S & N O T E S
8 On Tap Winter 1999
T E C H N O L O G I E ST E C H N O L O G I E S
by Thomas W. Haster, P.E., Associate Jessica L. Brown, E.I.T.Freese and Nichols, Inc. Fort Worth, Texas
Sam Oswood, Deputy General Manager Brown County Water Improvement District Brownwood, Texas
Editor’s Note: The distribution system discussedin this study is in a larger community than thosewe usually write about in On Tap (10,000 orfewer people), however, the information is appli-cable to small systems.
Historically, water quality modeling has beenlimited to large skeletonized water distributionsystems due to cost, data requirements, andmodeling software limitations. This is no longer the case.
Freese and Nichols, Inc., conductedhydraulic and water quality modeling for theCity of Brownwood, Texas, (population 20,000)to determine appropriate system improvements.Older developed parts of the city’s water distri-bution system had experienced poor water quali-ty from water line corrosion resulting in a lossof chlorine residual.
The purpose of the study was to pinpointproblem areas and devise a capital improvementprogram to improve water quality throughout thewater distribution system. The steps and constraintsinvolved in conducting water quality modelingfor a small city included: a) field testing, b) modelcalibration, c) hydraulic and water quality mod-eling, d) capital improvement plan development,and e) verification and operation testing.
What was the purpose of the study?The purpose of the water quality modeling
was to identify the chlorine content of the waterentering the distribution system and how quicklythe content decays to a point below regulatorystandards. The parameter used to identify thequality of the water in the distribution system isthe chlorine residual. Typically, chlorine or chlo-ramine is added to water for disinfection at a watertreatment plant to maintain the water qualitythroughout a distribution system. More and morein water distribution systems, chloramine (a comb-ination of chlorine and ammonia) is used in lieuof free chlorine to minimize the formation of dis-infection byproducts, such as trihalomethanes.
The Texas Natural Resources ConservationCommission (TNRCC) publishes minimumwater disinfection standards for public watersystems in the Texas Administrative Code. Thesestandards state that a free chlorine residual of0.2 milligrams per liter (mg/l) or chloramineresidual of 0.5 mg/l must be maintained through-out treated water distribution systems at all times.
In the near future, TNRCC will publish morestringent water quality standards that will alsolimit the maximum chlorine residual within awater distribution system to 4.0 mg/l. This willforce a significant number of public water sys-tems to make disinfection changes and waterdistribution system operational changes.
To meet existing disinfection standards,many water distribution systems presently feedhigh dosages of chloramine (in excess of 4.0mg/l) at the water treatment plant to overcomepoor water distribution systems just to maintainthe chlorine residual at or above 0.5 mg/l.
Typical causes of chlorine residual losses indistribution systems include corroded water linesand storage tanks, biofilm buildup in water lines,long dead-end water lines with small waterusage, long detention times in storage tanks, andover-sized water transmission lines.
What are chlorine decay mechanisms?Previous studies have shown that two pri-
mary mechanisms cause chlorine residuals todecay within a distribution system. The firstmechanism is bulk decay, which represents thechlorine residual decay that occurs when thechlorine or chloramine reacts with organic orinorganic chemicals within the water. This decaymechanism is totally independent of the waterdistribution system. As a result, the bulk chlorine
Water Quality Modeling in DistributionSystems for Small Cities
Continued on next page
On Tap Winter 1999 9
Continued on page 10
T E C H N O L O G I E ST E C H N O L O G I E S
decay can be measured relatively closely underlab controlled conditions.
The second mechanism is wall reactiondecay, which represents the chlorine decay thatoccurs when the chlorine reacts with corrosionor tuberculation within water lines and storagetanks or with biofilms attached to the distribu-tion lines. Tuberculation and biofilms exhibitchlorine demands within a water distributionsystem. This chlorine demand removes chlorinefrom the water, which in turn decreases thechlorine residual concentration within the water.
The field testing needed for water qualitymodeling can be broken down into two areas:the field testing related to chlorine bulk decayand the field testing related to wall reactiondecay. Field testing provides the needed infor-mation to calibrate the water quality model andto determine which decay mechanism is pre-dominate within a water distribution system.
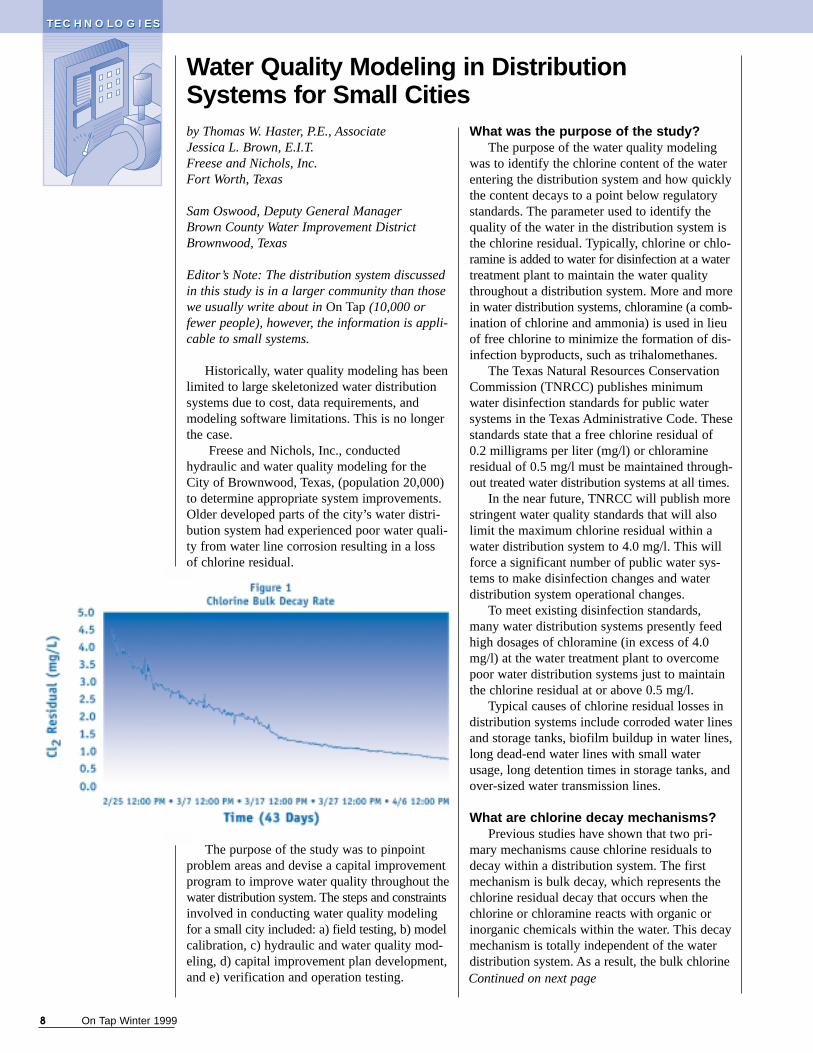
How was bulk decay measured?For Brownwood’s water quality study, the
chlorine bulk decay was estimated by taking a5-gallon container of water from the down-stream side of the water treatment plant andmeasuring the chlorine concentration within the5-gallon container over a period of one month.
Water treatment plant staff took chlorineresidual measurements every couple of hours fora month to determine how quickly the chlorineresidual decayed. Results indicate that the initialchlorine concentration was approximately 4.25mg/l. (See Figure 1 on facing page.) After oneweek, the chlorine residual decayed to 2.75mg/l. After two weeks, the chlorine residualdecayed to approximately 2.10 mg/l. Althoughsignificant, these residuals levels are well abovethe minimum chlorine residual standard of 0.5mg/l set by the TNRCC.
How was wall reaction decay measured?The second step in field testing procedures
was to quantify the wall reaction decay causedfrom corrosion and biofilms within the pipingand storage facilities, which required that chlo-rine residual samples be taken at various loca-tions throughout the distribution system to seehow the water quality changed as the water trav-eled through the distribution system.
Five sampling points were taken throughoutthe city for first testing. Ten sampling points,including the initial five, were taken throughoutthe city for testing conducted approximatelyeight months later.
How were sampling points selected?The first sampling point was chosen to iden-
tify the water quality entering the distributionsystem, while the remaining four were selectedto represent the various remote areas of thewater distribution system. Chlorine residual test-ing was conducted hourly to see how the waterquality changed as water demands changedthroughout the day, as well as determining spa-tial water quality changes throughout the distri-bution system.
What did sampling show?Sampling was performed in April and again
in December 1998. Results showed that chlorineresidual at the first two sampling pointsremained fairly constant throughout the testingperiod at 3.0 to 4.0 mg/l; however, at the thirdsampling point, chlorine residuals near the court-house degraded significantly to a point belowminimum state regulatory requirements through-out the day as water demands increased.
Sampling point four showed the same gener-al water quality trend as at the courthouse andboth of these sampling points demonstrated thatthe chlorine residual degraded significantly dur-ing periods of high water consumption.
The fifth sampling point showed that the chlor-ine residuals at this location remained fairly con-stant at a high residual level of 2.75 to 3.25 mg/l.
The initial five sampling points that wereretested all showed higher residuals inDecember, with the first two sampling pointsranging between 4.0 and 5.0 mg/l. Samplingpoint three showed chlorine residuals degradingbelow the minimum requirement later than in theApril testing. And the fourth sampling pointshowed the chlorine residuals to be much higherthan during the April testing, not falling below2.5 mg/l. The fifth sampling point showed slight-ly higher in December with a residual rangingbetween 2.5 and 4.0 mg/l.
The chlorine residual at sampling point six,an industrial park, showed to be fairly constantuntil it dropped from 2.3 mg/l to 0.5 mg/l in twohours. The seventh sampling point showed fairlyhigh residuals, averaging around 3.0 mg/l.Sampling point eight is located in the downtownarea. The chlorine residuals began to fall at 11 a.m.and never rose above 1.0 mg/l after 8 p.m.Sampling point nine maintained a fairly highresidual, never dropping below 2.5 mg/l. The chlor-ine residual at the pump station, the final sam-pling point, remained constant just below 3.0 mg/l.
If every household
in America had a
faucet that dripped
once each second,
928 million gallons
of water a day
would leak away.
Blue Thumb Project
Continued from previous page
Water Fact
10 On Tap Winter 1999
Water Quality Modeling in Distribution Systems for Small Cities
Continued from page 9
T E C H N O L O G I E ST E C H N O L O G I E S
What were the results?The results of the chlorine residual testing
throughout the distribution system demon-strated that:
• Chlorine residual levels in the oldest partof the system are significantly worse thanthe remaining parts of the distribution system.
• Chlorine residuals seem to fall significantlyin the evening when there is a high demandthroughout the city.
• When demand is low, a majority of the demand is met by water with a high chlo-rine residual supplied directly from the water treatment plant.
• When demand is high, water is pulled from other areas where the chlorine residual has decayed due to a longer residence time in the system, for example, a booster pump station.
• Computer modeling showed a strong corre-lation between the direction of flows in the piping network and resulting chlorine residuals.
• Results also indicate that wall reaction decay through corrosion and tuberculationwithin the old unlined cast iron pipes dom-inates the water quality degradation throughout the distribution system.
How was the model calibrated?The computer model used for the chlorine
residual modeling is Haestad’s CYBERNETVersion 3.1. This hydraulic model uses theEPANET’s analytical engine to perform waterquality modeling. The EPANET model representschlorine decay using a first-order rate of decay:C(t)=COe-kt where CO is the initial chlorineconcentration (mg/l) and t is time (day). Thechlorine decay constant k (1/day) represents acombination of the bulk chlorine decay and the
chlorine decay associated with wall reactionswithin the pipeline. The EPANET model allowsthe user to input two different k constants repre-senting the two primary decay mechanisms—kband kw.
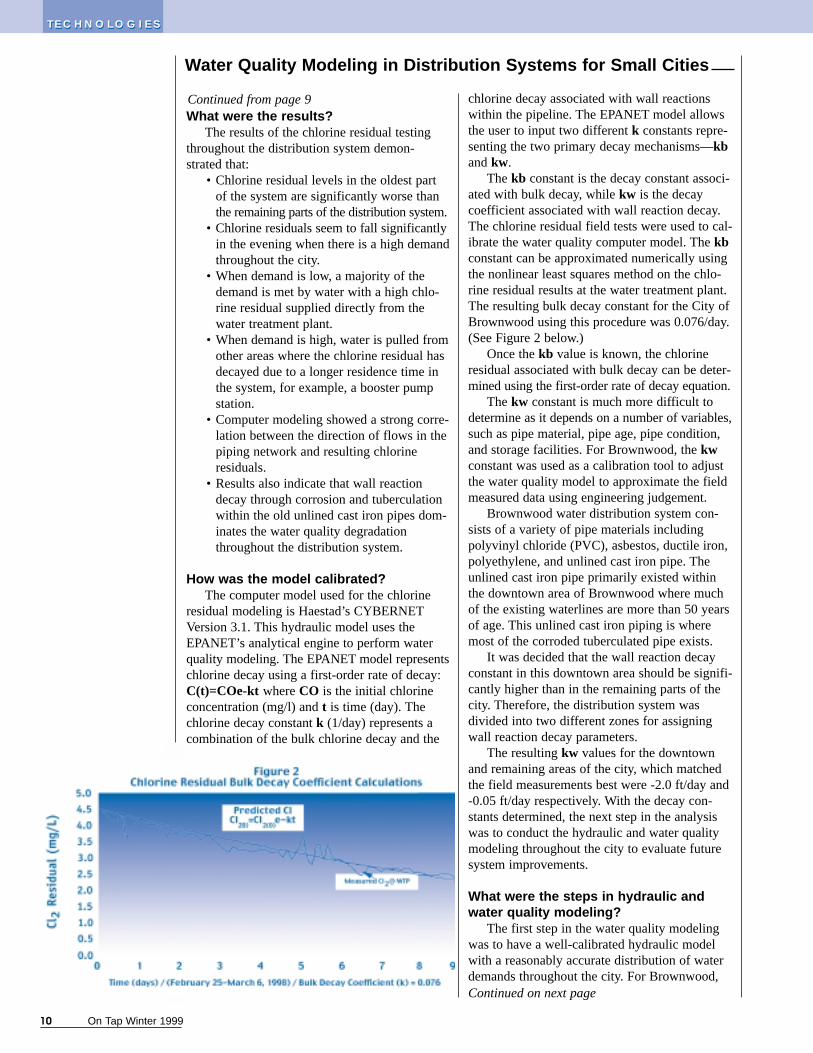
The kb constant is the decay constant associ-ated with bulk decay, while kw is the decaycoefficient associated with wall reaction decay.The chlorine residual field tests were used to cal-ibrate the water quality computer model. The kbconstant can be approximated numerically usingthe nonlinear least squares method on the chlo-rine residual results at the water treatment plant.The resulting bulk decay constant for the City ofBrownwood using this procedure was 0.076/day.(See Figure 2 below.)
Once the kb value is known, the chlorineresidual associated with bulk decay can be deter-mined using the first-order rate of decay equation.
The kw constant is much more difficult todetermine as it depends on a number of variables,such as pipe material, pipe age, pipe condition,and storage facilities. For Brownwood, the kwconstant was used as a calibration tool to adjustthe water quality model to approximate the fieldmeasured data using engineering judgement.
Brownwood water distribution system con-sists of a variety of pipe materials includingpolyvinyl chloride (PVC), asbestos, ductile iron,polyethylene, and unlined cast iron pipe. Theunlined cast iron pipe primarily existed withinthe downtown area of Brownwood where muchof the existing waterlines are more than 50 yearsof age. This unlined cast iron piping is wheremost of the corroded tuberculated pipe exists.
It was decided that the wall reaction decayconstant in this downtown area should be signifi-cantly higher than in the remaining parts of thecity. Therefore, the distribution system wasdivided into two different zones for assigningwall reaction decay parameters.
The resulting kw values for the downtownand remaining areas of the city, which matchedthe field measurements best were -2.0 ft/day and-0.05 ft/day respectively. With the decay con-stants determined, the next step in the analysiswas to conduct the hydraulic and water qualitymodeling throughout the city to evaluate futuresystem improvements.
What were the steps in hydraulic andwater quality modeling?
The first step in the water quality modelingwas to have a well-calibrated hydraulic modelwith a reasonably accurate distribution of waterdemands throughout the city. For Brownwood,Continued on next page
It is also recommended, as part of the waterquality improvements, that water quality samplingpoints be installed at various locations through-out a city, and that cities begin implementing bi-directional flushing programs in which mainte-nance staff routinely flush the entire distributionsystem on a periodic cycle of every two to threeyears. Another helpful tool in maintaining ade-quate chlorine residual levels is adding chlorineresiduals as an item monitored on the city’sSCADA [Supervisory Control and Data Acqui-sition] systems.
What did this study show?Results showed that water quality modeling
could be conducted effectively for small cities aspart of a water distribution system study. Thebulk decay parameter can be calculated with reasonable accuracy using field testing, leavingthe wall reaction decay parameter as a calibra-tion parameter based on the field data through-out the distribution system. The results also indicated that the flow pattern throughout thedistribution system has a significant impact onthe resulting chlorine residuals, especially inolder corroded pipeline.
The case study “Water Quality Modeling inDistribution Systems for Small Cities” was delivered to participants of the American Water WorksAssociation (AWWA) 1999 Engineering and Con-struction Conference “Building the 21st CenturyWater Works: Are You Prepared?”
For a copy of the proceedings on CD-ROM,contact the AWWA at 6666 West Quincy Ave, Denver,Co 80235 or call them at (800) 926-7337. Youmay also order via e-mail at [email protected] cost is $75 for AWWA members and $115for nonmembers. Shipping is $10 in the U.S. and$30 outside the country.
For further information about the WaterQuality Modeling Study, contact the architectural/engineering firm Freese and Nichols, Inc, at 4055International Plaza, Suite 200, Ft. Worth, TX76109. You may call them at (817) 735-7300.
References1. Boulos, P.F., Moore, M.R. 1997. Using Hydraulic Modeling to Solve Water
Quality Problems.In Proc. Norfolk: AWWA 1997 Distribution SystemSymposium.
2. Haestad Methods Inc., CYBERNET User ManualVersion 3.0. Waterbury,Connecticut: Haested.
3. Rossman, Lewis A January 1994. EPANET Users Manual,Version 1.1.Cincinnati: U.S. Environmental Protection Agency Drinking Water ResearchDivision, Risk Reduction Engineering Laboratory.
On Tap Winter 1999 11
all large commercial and industrial customerswere treated as point demands with the remain-ing system demands distributed throughout thecity using the various land uses present withinthe city. It was necessary to run the hydraulicand water quality model as an extended periodsimulation over a six-day time period. This wasnecessary to minimize the impact of unknowninitial boundary conditions, such as chlorineresiduals at remote storage facilities.
The chlorine concentration entering the dis-tribution system from the water treatment plantwas held constant at 5.0 mg/l, which matched thechlorine residual sampling at the clearwell. Theresulting chlorine residuals throughout the cityas determined using the computer analysis indi-cated that the downtown and remote airport areaswere the two primary locations where the waterquality degrades to a point below satisfactory.
Capital Improvement Plan Is DevelopedSeveral steps can be taken to improve the
water quality concerns in a water distributionsystem, such as water line replacement, bidirec-tional flushing, adding booster chlorination sta-tions, and increasing storage turnover. ForBrownwood’s water distribution system, severalpipe coupons (a sliced-out section of pipe) weretaken in the downtown area to determine thedegree of corrosion and tuberculation within theold water lines.
These coupons showed severe tuberculationwithin the old unlined cast iron pipes. In loca-tions where existing water lines still have goodintegrity, it was recommended that the waterlines be cleaned to remove the existing tubercu-lation and lined with cement mortar lining andthat the inside of several storage tanks berepainted. This will remove some of the chlorinedemand within the distribution system. It wasalso recommended that several booster chlorina-tion stations be installed at existing storage tanksto improve the chlorine residual levels in thewater distribution system.
What about verification and operation?The verification testing for Brownwood
Water Distribution System has not yet been com-pleted since the city is still in the process of con-structing water system improvements. Field test-ing and water quality modeling should be con-ducted after system improvements are completedto determine the improvements in chlorine residualthroughout the water distribution system and todetermine how, and at what level, the chlorinebooster stations are to be designed.
T E C H N O L O G I E ST E C H N O L O G I E S
Continued from previous page
Log on and searchwith the NationalDrinking WaterClearinghouse’s
new Drinking WaterKeyword Search
engine atwww.ndwc.wvu.edu.
12 On Tap Winter 1999
Tennessee Training Centers Teach Operators
Continued on next page
by Kathy JespersonNDWC Staff Writer/Editor
Editor’s Note: Sanjay Saxena, National DrinkingWater Clearinghouse (NDWC) program coordi-nator, and Kathy Jesperson, NDWC writer/edi-tor, visited both of these training centers in theprocess of researching this article.
The Country Music Hall of Fame, the GrandOle Opry, and Graceland are only a few of theattractions that draw tourists to Tennessee.
But while country music fans may “come toTennessee because they’re playing our song,”there are two more reasons to be lured to thissouthern state: the Tennessee Association of UtilityDistrict’s (TAUD) Training Station and theTennessee Department of Environment andConservation’s Fleming Training Center.
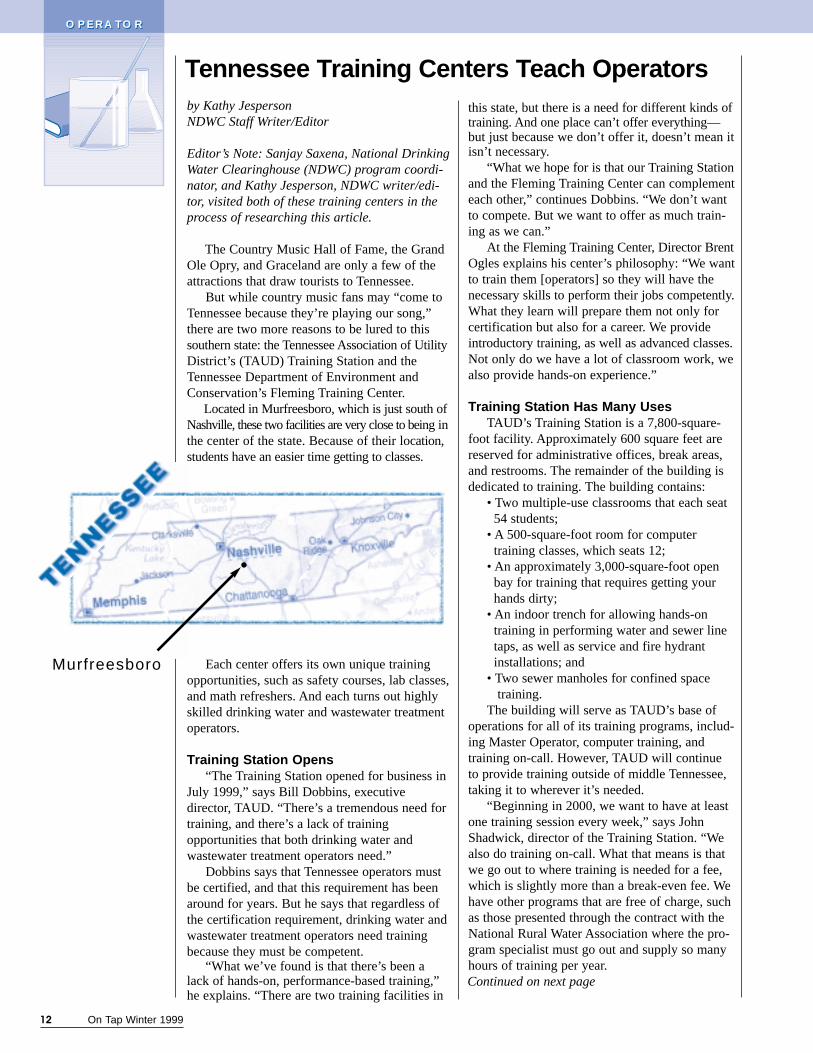
Located in Murfreesboro, which is just south ofNashville, these two facilities are very close to being inthe center of the state. Because of their location,students have an easier time getting to classes.
Each center offers its own unique trainingopportunities, such as safety courses, lab classes,and math refreshers. And each turns out highlyskilled drinking water and wastewater treatmentoperators.
Training Station Opens“The Training Station opened for business in
July 1999,” says Bill Dobbins, executive director, TAUD. “There’s a tremendous need fortraining, and there’s a lack of training opportunities that both drinking water andwastewater treatment operators need.”
Dobbins says that Tennessee operators mustbe certified, and that this requirement has beenaround for years. But he says that regardless ofthe certification requirement, drinking water andwastewater treatment operators need trainingbecause they must be competent.
“What we’ve found is that there’s been alack of hands-on, performance-based training,”he explains. “There are two training facilities in
this state, but there is a need for different kinds oftraining. And one place can’t offer everything—but just because we don’t offer it, doesn’t mean itisn’t necessary.
“What we hope for is that our Training Stationand the Fleming Training Center can complementeach other,” continues Dobbins. “We don’t wantto compete. But we want to offer as much train-ing as we can.”
At the Fleming Training Center, Director BrentOgles explains his center’s philosophy: “We wantto train them [operators] so they will have thenecessary skills to perform their jobs competently.What they learn will prepare them not only forcertification but also for a career. We provideintroductory training, as well as advanced classes.Not only do we have a lot of classroom work, wealso provide hands-on experience.”
Training Station Has Many UsesTAUD’s Training Station is a 7,800-square-
foot facility. Approximately 600 square feet arereserved for administrative offices, break areas,and restrooms. The remainder of the building isdedicated to training. The building contains:
• Two multiple-use classrooms that each seat 54 students;
• A 500-square-foot room for computer training classes, which seats 12;
• An approximately 3,000-square-foot open bay for training that requires getting your hands dirty;
• An indoor trench for allowing hands-on training in performing water and sewer line taps, as well as service and fire hydrant installations; and
• Two sewer manholes for confined space training.
The building will serve as TAUD’s base ofoperations for all of its training programs, includ-ing Master Operator, computer training, andtraining on-call. However, TAUD will continueto provide training outside of middle Tennessee,taking it to wherever it’s needed.
“Beginning in 2000, we want to have at leastone training session every week,” says JohnShadwick, director of the Training Station. “Wealso do training on-call. What that means is thatwe go out to where training is needed for a fee,which is slightly more than a break-even fee. Wehave other programs that are free of charge, suchas those presented through the contract with theNational Rural Water Association where the pro-gram specialist must go out and supply so manyhours of training per year.
O P E R A T O RO P E R A T O R
Murfreesboro
“But we try to make our fee affordable,” hesays. “If the system can’t send the operator, thenwe come to them. Sometimes, daily fees can besplit among several small systems. One-dayworkshops cost $750 with a $25 per person fee.”
However, Shadwick points out that some-times you can’t move the equipment you need touse, so operators have to come to where theequipment is. “Our training is performancebased,” explains Shadwick. “When we offered acomputer training course that included softwarefor the consumer confidence report (CCR), thesystems that came left with their report done.”
Classes Require Certification“Our classes require certification,” he contin-
ues. ‘‘It’s an issue of competency. You can take awritten test and still not be able to do the task.You have to show that you can do it before youleave the building.
“Before students take the exam, they have theopportunity to practice under supervision,”Shadwick adds. “But the tester will not coachthem during the exam. And they don’t take theexam until they’re ready. However, they alsodon’t complete the course until they demonstratethe ability—nothing will be handed to them.”
And students will have plenty of equipmentwith which to practice. “We have $8,000 to$10,000 worth of equipment that’s been donatedby private industry,” says Shadwick. “We have anumber of equipment suppliers.
“The Training Station is also equipped withtrenches for training in line-tapping and othertraining as well as manholes for confined spacetraining,” he continues. “When we hold lab
On Tap Winter 1999 13
classes, we usually have students bring their ownlab equipment. Often, you can invest in lab equip-ment that will be outdated by the next year so wehave them bring their own. And practicing withyour own equipment makes it easier as well.”
Because certification is crucial to Tennesseeoperators, Shadwick says that the TrainingStation offers a course called the Cram Session.“The Cram Session is about 18 years old,” heexplains. “Last year, we had 142 attendees. Whatthese sessions do is to prepare them [operators]for the certification exam. We try to get the fearof arithmetic out of them because that’s thebiggest reason some people fail. The certification
exam has about a 40 percentpass rate. And of the peoplewho take the Cram Session,the pass rate increases toabout 60 to 70 percent.
“We intend no failures,”he says. “But there are twobig problems for operatorswith training: money andtime. Hot or cold, no matterwhat—there’s always somekind of training we’ll haveto do out there.”
Center Has ThreeFunctions
On the other side oftown, the Fleming TrainingCenter has three functions:1) to provide training class-es and seminars for thoseinterested in gaining skills in
the water and wastewater treatment fields, 2) tohouse the administrative functions of the state’sWater and Wastewater Operator CertificationBoard, and 3) to provide technical assistance towater and wastewater plants across the state.
The center’s training function providesinstruction in a number of areas—not only basicclasses in mathematics, operations, and laboratoryprocedures, but also advanced treatment techniques.Hands-on experience is stressed in topical classes,such as water meter maintenance and repair, leakdetection, fire hydrants, filter maintenance, advancedjar testing, and cross-connection control.
The center contains approximately 27,000square feet, which consists of:
• Two medium-sized classrooms,• One large classroom,• A 230-seat auditorium,• Two laboratories,• A demonstration area, and • Various smaller offices and meeting rooms.
“We intend no fail-
ures, but there are
two big problems
for operators with
training: money
and time.”
John Shadwick,director of the
Training Station
O P E R A T O RO P E R A T O R
Continued from previous page
Continued on page 14
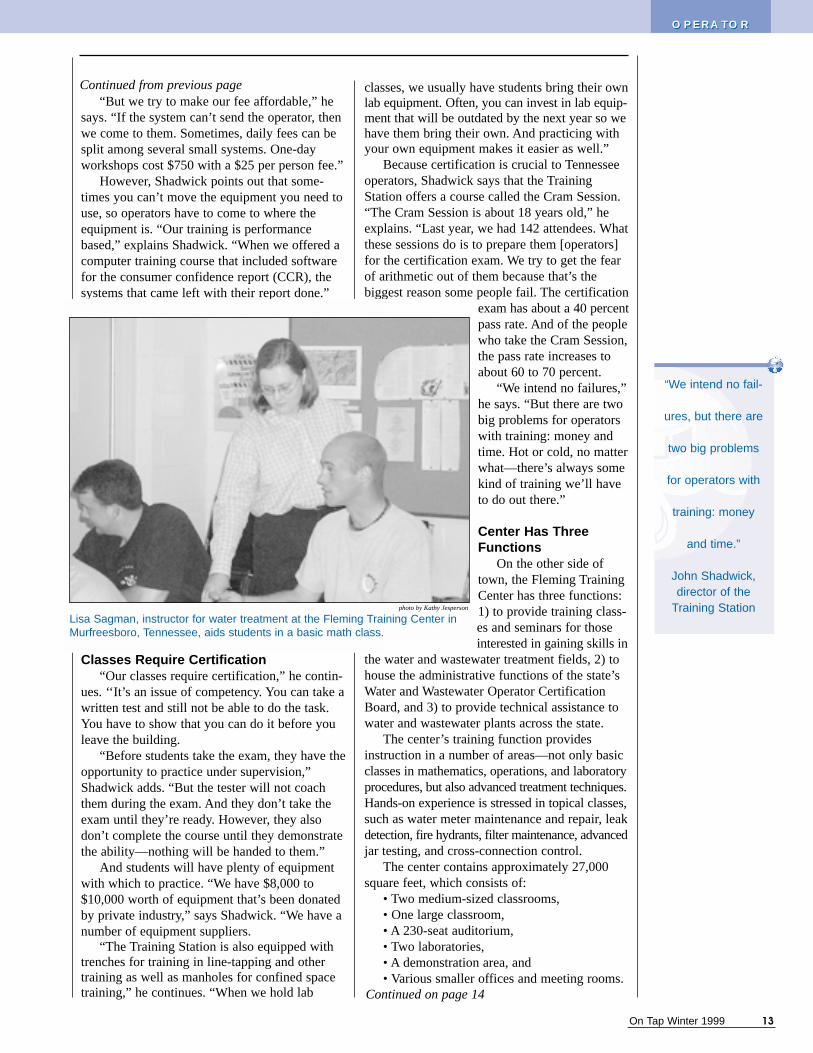
Lisa Sagman, instructor for water treatment at the Fleming Training Center inMurfreesboro, Tennessee, aids students in a basic math class.
photo by Kathy Jesperson
14 On Tap Winter 1999
Approximately $75,000 of new laboratory andoperational equipment was purchased last year tobe used in their classes. Additionally, the centeris expanding its offerings to include a number ofcomputer-based resources, such as all major waterreference materials on CD-ROM, as well as anumber of computer-based operator trainingcourses. These materials are available to anyonewanting to learn more about the water industry.
This fall, the center is partnering with theUniversity of Tennessee Environmental HealthServices to offer a series of utility-oriented safetyclasses. The courses will include emergencyresponse, confined space entry, and personal pro-tective equipment—which will provide the nec-essary training needed to meet federal mandates.
“We schedule our courses 18 months inadvance, and classes are free,” he explains. “Wetry to make sure that Tennessee’s training andeducation programs for operators are adequate andup-to-date. A few years ago, when we sent outrenewal forms, we included a survey to get oper-ators opinions about training. What we discoveredwas that, basically, they were pleased with the jobwe did. Several new classes were suggested, andmost of those have been incorporated into ourschedule. They also suggested that we try to takeour classes on the road more. We have done thisby offering several extension classes where five- or10-day classes are taught off site one day per weekfor several weeks. Additionally, we now offerseveral specialty schools, such as leak detection,at smaller plant sites and provide hands-on trainingexperience in the field in real-life situations.
“Mostly, we concentrate on the fundamentals,”he continues. “Our instructors must be able to com-municate to a diverse group. Class sizes rangeanywhere from 10 to about 35 students, and theseminars often have more in them.
“We try to assist them in learning as much asthey can to prepare for a career and a certificationexam,” says Ogles. “We don’t teach the exam.We want them to know what they need to knowto be successful in their chosen field.”
Certification Mandated by StatutesMost of the center’s certification activities are
mandated by statutes and regulations. Currently, thestate offers certification in 14 fields of water andwastewater treatment, collection, distribution,and disposal.
According to Ogles, the certification exam isgiven twice a year on the same day in three dif-ferent locations across the state. And he hopes thatthe training operators receive at the Fleming Train-ing Center help them pass the certification exam.
“One thing I heard a lot about when I tookthis position was that the exam does not reflectwhat operators need to know,” he adds. “Toevaluate this concern, we formed two commit-tees, using people in the industry. They per-formed a job analysis and formulated need-to-know criteria for each of the certification classes.They then assigned priorities to each subjectarea and categorized all of our questions. Everyquestion was subjected to a rigorous technicaland stylistic review. In some cases, we wrotenew or additional questions.
“All of our exams are generated based onthis analysis,” Ogles notes. “This is the samething that the Safe Drinking Water Act is nowrequiring of all state certification programs. Youcould say that we were ahead of the game in thisarea. Although the pass rate is only about 50percent, operators who take training courses andstudy do significantly better on the exams. Theexams accurately reflect what an operator needsto know. We are very pleased with the tests thatwe created.”
Ogles also explains that the center conductsseminars for the state’s continuing educationrequirement. “We [the state] only require fivehours of continuing education every three years.This can be accomplished in a one-day class orseminar. All of the center’s seminars and train-ing courses have been approved for continuingeducation credit.
“We take our continuing education classes towhere they’re needed,” he continues. “Even withthat, sometimes it’s a struggle for operators ofsmall systems to get there. Often, they don’thave as many resources or opportunities toattend training activities. Their salaries aresmaller, travel costs are an obstacle, and it’sharder for them to leave their jobs.”
Technical Assistance Provided“Our trainers are also technical assistance
providers,” says Ogles. “They are all certifiedwater and wastewater operators. Some monthsthey do most of the technical assistance out ofthe office. Other months most of it is done outin the field. Our instructors must balance techni-cal assistance with training. When classes are insession, field visits must take lower priority.
“We offer training and technical assistance toanyone who wants it,” he adds. “We are uniquein that we have this training facility with waterand wastewater in the same facility. And that’s areal help. It’s also beneficial that we supplytechnical assistance to systems who want it.
Continued from page 13
“We try to assist
them in learning as
much as they can to
prepare for a career
and a certification
exam. We don’t
teach the exam.
We want them to
know what they
need to know to be
successful in their
chosen field.”
Brent Ogles, director of the
Fleming TrainingCenter
Continued on next page
O P E R A T O RO P E R A T O R
Tennessee Training Centers Teach Operators
On Tap Winter 1999 15
We get a lot of chemical dosage questions,and we try to assist operators in making theirsystems work better. Wastewater people bring insamples and want to know what kind bacteria ispresent in it. The good bacteria often determineshow well their plants run.
“We stay pretty busy,” Ogles says. “We onlyhave a staff of four instructors, and we trainbetween 1,500 and 1,800 students yearly. Ourclasses run from one day to 10 days in length.Other divisions within our department also useour facility. Occasionally, we have so muchgoing on that we had to park people on the grass.
“I’m thankful for what we’ve got here,” con-cludes Ogles. “We don’t have to pack up equip-
On Tapreaders also may be interested in pro-ceedings from two international conferences: the13th Ozone World Congress, 1997, in Kyoto,Japan, and the Regional Conference onOzonation and Advanced Oxidation Processes(AOPs) in Water Treatment: Applications andResearch, in Poitiers, France, 1999.
The 13th Ozone World Congress proceedingsare available in three volumes that address abroad range of topics in the area of ozone gener-ation and applications technology. Subjectsinclude: water purification and wastewater treat-ment processes, reaction mechanisms, transferand contact systems, advanced oxidationprocesses, water treatment processes, byproducts,disinfection, and ozone generators.
Do you want to know more about ozone?The section about effects on organisms
includes nine papers about ozone in medicine.Also covered are state of the art ozone applicationin France, Germany, the United Kingdom, Poland,Switzerland, Canada, the U.S., and Japan.
The proceedings from the RegionalConference on Ozonation and AOPs in WaterTreatment Applications and Research contains58 papers covering subjects, such as ozone appli-cation in drinking water treatment, cooling watertreatments, wastewater processes and otherfields; advanced oxidation processes, ozonationcontactors, and bromate formation.
For more information or to order, go to the pro-duct section of the International Ozone AssociationWeb site at www.intozoneassoc.org/ioaweb4.htm.
Continued from previous page
Tennessee Training Centers Teach Operators
R E S O U R C E SR E S O U R C E S
Submit Your System Information to RESULTS
ment and run around with it. And that’s a defi-nite plus. We also welcome whoever wants totake the classes. But we don’t really advertisethat we’re here. We hope that word of mouthwill generate more student interest.”
For more information about the TrainingStation, contact TAUD at 840 Commercial Court,Murfrees- boro, Tennessee 37129, or call (615)896-9022. You also may visit their Web site atwww.taud.org.
To find out more about the Fleming TrainingCenter, contact the center at 2022 BlantonDrive, Murfreesboro, Tennessee 37129, or call(615) 898-8090. You also may visit their Website at www.state.tn.us/environment/dca/fleming.htm.
The National Drinking Water Clearinghouse’s(NDWC) popular treatment technologies databaseRESULTS [the Registry of Equipment Suppliers ofTreatment Technologies for Small Systems] can besearched free of charge online. And now, operators cansubmit their system's information online too.
RESULTS is a database containing informationabout treatment technologies used in small systems,manufacturers/suppliers of technologies, and systemcontacts. The database offers valuable first-step infor-mation for small system owners and operators, designengineers, and others who are exploring treatmenttechnologies for their specific water problems.
For example, a system that needs to treat its waterfor iron can search the database and find more than180 other systems that treat for iron. Users can learnabout the treatment method used, capital costs of the
plant, maintenance costs, the equipment vendor, andthe system’s contact information, so they may reachthe operator. Database users can evaluate alternativetreatment options or compare the costs that other sys-tems expended for their equipment.
Operators can help the NDWC improve theRESULTS database by providing information abouttheir systems. The greater the number of entries in thedatabase, the more useful it will be to users searchingfor small system information.
Log onto the NDWC’s Web site atwww.ndwc.wvu.edu to submit information to the onlineRESULTS Questionnaire or to search the databasefree of charge. For those without Internet access, con-tact an NDWC technical assistant at (800) 624-8301or (304) 293-4191 to receive a printed questionnaireor to run searches free of charge.
16 On Tap Winter 1999
What is arsenic?
QUESTION & ANSWERQUESTION & ANSWER
Continued on next page
by Babu Srinivas MadabhushiTechnical Assistance Specialist
Arsenic (As) is a common, inorganic drink-ing water contaminant. It is a naturally occurringsemi-metal that is tasteless and odorless. Arsenicoccurs naturally in the oceans, Earth’s crust,rocks, and soil. In drinking water, arsenic existsmainly in two states: As+3 (arsenite) and As+5(arsenate). The concentrations of arsenic in theEarth’s crust range between 2 and 5,000 micro-grams per liter or parts per billion (ppb).
Arsenic has long been identified as a toxicant.Previously, arsenic contamination was associatedwith skin cancer and other disorders, but recentstudies suggest that drinking water with high levelsof arsenic also can lead to bladder and lung cancer,which are more likely to be fatal.
What are the sources of arsenic?As a component of underground rocks and
soil, arsenic works its way into groundwater andenters the food chain through either drinking wateror consuming plants that have absorbed the mineral.
People also may be exposed from industrialsources, as arsenic is used in semiconductormanufacturing, petroleum refining, wood preser-vatives, animal feed additives, and herbicides.
Water from wells often has higher concentra-tions of arsenic than does surface water, such aslakes and streams. The American Water WorksAssociation’s (AWWA) National ArsenicOccurrence survey indicates that hard waterscontain higher levels of arsenic than soft waters.
In some areas, concentrations in groundwaterare elevated as a result of erosion from local rocks.Arsenic also can be found in plants, fish, and shell-fish. Mining, manufacturing, and pesticide disposalalso can contribute to arsenic contamination.
How does arsenic contaminate water?Arsenic can combine with other elements in
water to form two types of derivatives (arsenicals):inorganic and organic. In general, inorganicarsenicals are more toxic than organic arsenicals.While food contains both inorganic and organicarsenicals, drinking water primarily containsinorganic arsenicals. For this reason, arsenic con-tamination of drinking water represents, by far,the greatest hazard. Arsenic can enter water throughvarious ways, such as the dissolution of mineralsand ores, industrial effluents, and also fromatmospheric deposition. Surface arsenic-relatedpollutants enter the groundwater system by grad-ually moving with the flow of groundwater fromrains, melting snow, and other types of precipitation.
How is contamination determined? A laboratory analysis must be carried out
since arsenic is tasteless and colorless. Municipalwater systems regularly test for arsenic, and testresults can be obtained directly from them. Peopleusing private wells must take care of the testingthemselves. Tests usually cost from $25 to $35.
Is arsenic regulated?The allowable concentration of arsenic in
potable water has been regulated in the U.S.since the U.S. Public Health Service set a stan-dard of 50 ppb in 1942. The U.S. EnvironmentalProtection Agency (EPA) established the currentmaximum contaminant level (MCL) for arsenic,50 ppb, in 1975.
At present, there are very few groundwatersupplies in the U.S. that exceed the current arsenicstandards. However, there are wells in some partsof the Southwest, and other localized areas aroundthe country that do exceed this standard. Loweringthe MCL would, obviously, increase this numberof water sources exceeding the standard.
Why change the standard?According to Robert Goyer, retired professor,
University of Western Ontario, Chapel Hill,North Carolina, “New information on arsenicexposure and cancer indicate that EPA’s currentstandard for acceptable levels of arsenic indrinking water does not sufficiently protect pub-lic health.’’ Though additional research is need-ed, existing data indicate that the MCL shouldbe reduced to ensure that amounts of arsenic indrinking water are at levels that do not posepotential health risks.
“The U.S. Environmental Protection Agencyshould develop a stricter standard for allowablelevels of arsenic in the nation’s drinking watersupplies as soon as possible,” states a new reportby a National Research Council committee.
The range of values EPA is currently consid-ering is from 2 to 20 ppb. In the process of settingthe new standard, EPA is evaluating the occurrenceof arsenic in source waters, the health effects ofarsenic, routine monitoring of arsenic by waterutilities, and available treatment technologies forremoving arsenic from source waters.
In 1996, Congress established certainrequirements the EPA must meet in designatinga new standard for arsenic. By January 1, 2000,the new water standard will be introduced, andby January 1, 2001, the final arsenic rule will gointo effect. This gives sufficient time for thewater systems to take significant steps to reducearsenic from their drinking water supplies.
On Tap Winter 1999 17
QUESTION & ANSWERQUESTION & ANSWER
How does it affect the human body?Arsenic is readily absorbed from the gas-
trointestinal tract into the blood. The mechanismsthrough which arsenic causes cancer are not wellunderstood, but the existing data indicate thatarsenic probably causes chromosomal abnormal-ities that subsequently cause cancer. Sensitivityto arsenic’s effects is very subjective, varies fromone individual to another, and appears to be influ-enced by factors such as nutrition and genetics.
What are the effects of contamination? Consuming food and water are the major
sources of arsenic exposure. Arsenic-relatedhealth problems are prevalent in Asian countries.
Health effects from consuming arsenic-contaminated drinking water are delayed. Skinlesions generally appear first but only after aminimum exposure of approximately five years.
Daily consumption of water with greaterthan 50 ppb of arsenic, which is less than onepercent of the fatal dose, can lead to problemswith the skin, and circulatory and nervous sys-tems. Hyperpigmentation, depigmentation, ker-atosis, and peripheral vascular disorders are themost commonly reported symptoms of chronicarsenic exposure. If arsenic builds up to highertoxic levels, it may cause organ cancers, a num-ber of internal cancers, and neural disorders.
Consumption of arsenic-contaminated watermay cause stomach pain, nausea, vomiting, diar-rhea, numbness in hands and feet, partial sparalysis, and blindness.
Studies show that in addition to causing skin,bladder, and lung cancer, consuming arsenic canalso cause skin lesions, anemia, nerve damage,and circulatory problems. New data and modelsfor estimating risk indicate that the likelihood ofdeveloping cancer from drinking water that con-tains the maximum allowable amount of arsenicgreatly increases when lung and bladder cancersare included.
How is arsenic removed from water?Fortunately, there are many technologies
available for arsenic removal. The list includescoagulation/filtration, lime softening, ionexchange, activated alumina, and membraneprocesses, such as reverse osmosis (RO),nanofiltration (NF) and electrodialysis. Pretreat-ment may be needed in some cases to ensureacceptable treatment by the primary unit.
The selection of treatment technology is crit-ical, however, as it should not affect the rest ofthe treatment process. According to EPA’sArsenic Research Plan, these technologies areeffective for the current MCL of 50 ppb of
arsenic, but if the MCL is lowered, furtherresearch must be carried out to determine theeffectiveness of these technologies.
For drinking and cooking, water can betreated through distillation, deionization, or ROif arsenite is first oxidized into arsenate. Somestudies have shown that conventional treatmentwith aluminum and iron salts can be used toremove arsenic from drinking water.
One simple option is to blend waters high inarsenic with water low in arsenic content, or tooxidize the arsenic to arsenate form, and thenremove it with conventional alum or iron coagu-lation, or by the lime softening process. But,these conventional methods may not be suffi-cient if the MCL is lowered to 2 ppb.
Studies have shown that RO is generallyeffective in removing arsenic from source water.Laboratory studies indicate RO membranesreduce arsenic by almost 70–90 percent. Theeffect of pressure and temperature on arsenicremoval needs to be studied further.
One 1997 study by Waypa et al indicatesthat, contrary to general notion, high removalefficiencies can be obtained for As+3 also, usingRO and NF. This will prove beneficial for treat-ing groundwater, in which arsenic is present inAs+3 state. Pretreatment of water may berequired to avoid membrane fouling.
NF has proven to remove just about anyharmful material from drinking water. However,at this time, this technology also removes allnon-harmful material as well, leaving it tastinglike distilled water.
Manganese greensand filtration is also anoption. A study in Canada used potassium per-manganate as a pre-oxidant followed by man-ganese greensand filtration. Arsenic removalwas in the range of 90–98 percent. To removeorganic arsenic, granular activated carbon filtra-tion can be added.
Some treatment technologies may not beamenable to point-of-entry, whole house treatments.In these cases, point-of-use units may be thebest option. New types of treatment technologies,including co-precipitation treatment, ion exchange,activated alumina filtration, and chemical pack-ages for household treatment, are being tested.Some studies have reported preliminary success-es in using packets of chemicals for householdtreatment. Some of these can be used for arsenicremoval in conjunction with disinfection.
References1. Office of Research and Development Research Plan for Arsenic in Drinking
Water.1998. National Center for Environmental Assessment. Cincinnati:U.S. Environmental Protection Agency (EPA/600/R-98/042).
Continued on page 18
Continued on page 18
2. Scott, K.N., Green, J.F., Do, H.D. and McLean, S.J. April, 1995. “ArsenicRemoval by Coagulation,” Journal AWWA, pp: 114–126. Denver: AmericanWater Works Association.
3. Waypa, J.J., Elimelich, M., and Hering, J.G. October 1997. “Arsenic Removalby RO and NF membranes,” Journal AWWA, pp: 102–114. Denver: AmericanWater Works Association.
4. Hunt, J. October 1997. “Dealer develops simple, reliable treatment method,’’Water Conditioning and Purification, pp: 104–107.
5. Ellis, R.W. January 1997. “Manganese Greensand Filtration,” WaterConditioning and Purification,pp: 54–57.
6. Clifford, D. and Lin, C.C. 1991. Arsenic removal from drinking water in SanYsidro, New Mexico.Cincinatti: U.S. Environmental Protection Agency RiskReduction Laboratory (EPA/600/S2-91/011).
7. Eaton, A.W. February 1994. “Determining the practical quantitation level forArsenic,” Journal AWWA, pp: 100–114. Denver: American Water WorksAssociation.
The year 1925 brought an update to the drink-ing water standards. PHS first instituted a limit forbacteriological counts. They also set limits forphysical and chemical levels for lead, copper,zinc, and excessive soluble minerals.
The PHS again revised drinking water stan-dards in 1942, 1946, and in 1962. These revisionsspelled out guidelines for methods of bacterio-logical sampling and set maximum permissibleconcentrations for such substances as arsenic,fluoride, lead, selenium, and copper. All told, 28constituents were covered by the standards.
Pontius notes that the standards were limitedin ensuring safe drinking water for the public. Onlythose 700 or so water systems that supplied waterto interstate carriers—fewer than 2 percent ofwater suppliers—had to abide by the federal rules.
Concern Arises over Water QualityBy the late 1960s, economics, population, and
industrial growth increased the need for more water.By necessity, communities often drew raw waterfrom polluted sources. News articles appeared inthe Washington Post,the New York Timesandother publications concerning the quality of thenation’s public water supply.
In 1970, the PHS released results of its Com-munity Water Supply Study (CWSS), whichpainted a disturbing picture of the public’s watersupply. The study looked at whether water systemsmet the 1962 PHS standards, and of the 969 publicwater systems surveyed, 41 percent did not.And it concluded that eight million Americanswere drinking substandard water.
In addition, the study indicated that systems,particularly small ones serving fewer than 500customers, had problems with source water pro-tection, disinfection, clarification, and distributionsystem pressure.
In the early 1970s, researchers discovered thatchlorine reacts with organic material in waterduring disinfection to form a class of compoundsreferred to as trihalomethanes (THMs) or disin-fection byproducts (DBP). The health effects ofthese DBPs were unknown at the time and led toconcern for the public’s safety. (For more infor-mation about THMs, see the Spring 1999 issueof On Tap.)
Congress Gets InvolvedInterest in public drinking water safety
mounted in the early seventies as questions con-tinued to be raised about water safety. The CWSSreport increased public and legislative interest.Congress began to examine legislation that wouldallow the federal government to set maximumcontaminant levels (MCL) permissible in drinkingwater. Congress held hearings in 1971, 1972, and1973—but legislation died.
After four years of committee work, Congressenacted the SDWA in 1974 and authorized EPAto set standards to protect users from any con-taminant in public water systems that may haveadverse health effects.
What did the 1974 Act require?The new regulations stipulated that EPA
develop new national standards, oversee specialstudies and research, and guide implementation.EPA required all public water systems to complywith health standards it issued, but regulationsdid not apply to noncommunity water systemsserving transient populations.
EPA adopted the National Interim PrimaryDrinking Water Regulations in December 1975and later proposed a revised set of regulationsbased on a study of the health effects of drinkingwater contaminants.
Continued from page 17
What is arsenic?
Continued from page 1
Continued on next page
18 On Tap Winter 1999
A Brief History of Drinking Water Regulations
8. McNeill, L., and Edwards, M. May 1997. “Arsenic removal during precipita-tive softening,” ASCE Journal of Environmental Engineering, pp: 453–460.Reston, VA: American Society of Civil Engineers.
9. Analytical Chemistry of Arsenic in Drinking Water [Project #914](www.awwarf.com/exsums/914.htm).
10. Arsenic Information (www.lcse.umn.edu/~jolson/groundwater/arsenic.html).11. Arsenic Reduction Systems (www.krudico.com/arsenic.htm).12. Arsenic affects the whole body, A report on Medical Survey in West Bengal,
India (www.kfunigraz.ac.at/twiwww/aan/newsl1/affects.html).13. Frequently Asked Questions about Arsenic (www.wellowner.org/arsenic.htm).14. Cancer risk from Arsenic highlighted in NRC Report (www.unisci.com/sto-
ries/19991/0326991.htm).15.“EPA Needs more stringent standard for Arsenic in Drinking Water,” National
Academy of Sciences. (www4.nationalacademies.org/news.nsf/).
On Tap Winter 1999 19
New regulations recommended maximumcontaminant levels (RMCL) set to prevent knownor anticipated health effects. The RMCL, subse-quently referred to as the maximum contaminantlevel goal, acted as a goal rather than an enforce-able regulation. EPA did establish a set of feder-ally enforceable regulations called the MCLs.
By the late 1970s, EPA set standards for sixpesticides; turbidity; THMs; radionuclides; and in-organic, organic, and microbiological contaminants.By the early 1980s, 23 contaminants were regulated.
Changes Are Made in 1986In 1986, the SDWA was reauthorized and
significantly changed, in part because EPA wasunable to develop regulations in a timely man-ner. In the 1986 amendments, Congress listed 83contaminants—including 22 EPA had alreadyset—and required EPA to establish or revisestandards for each contaminant within three years.
In addition, after the standards for the initial83 were set, EPA was required to add 25 con-taminants—although this requirement was notmet—to the list every three years. This require-ment raised concerns about unfunded federalmandates—in particular, what the impact ofmeeting regulations would be on local drinkingwater systems without the accompanying federaldollars to help systems meet the requirements.
Other requirements that took effect includeda ban on lead pipes, solders, and flux; disinfec-tion in all public drinking water, new wellheadand sole source aquifer protection programs; andrecommendations for best available technologyfor treating regulated contaminants.
SDWA Is Reauthorized AgainIn 1996, Congress reauthorized the SDWA
and repealed the requirement that EPA regulate25 new contaminants every three years. Instead,they established a process to select and regulatecontaminants that pose the greatest risk to thepublic health, using risk assessment and cost-benefit analysis. The change was made to cor-rect problems EPA faced in trying to implement
the 1986 amendments. Many small systemsfound it difficult to afford expensive laboratorytests for what some considered exotic chemicals.
Congress focused on four major reformthemes in the 1996 Amendments:
• new funding for communities and states through a drinking water state revolvingfund to provide infrastructure capital;
• a focus on preventing problems, not merelyon correcting them once they occurred,using such tools as operator certificationand source water protection;
• regulatory improvements that included better science, assessing the risk of contam-inant exposure, and a cost-benefit analysiswhen national primary regulations are pro-posed; and
• better information for consumers through annual Consumer Confidence Reports.
EPA Meets DeadlinesImplementation of the 1996 SDWA is pro-
gressing. EPA has kept pace with its deadlines. Asummary table of statutory requirements in theSDWA Amendments of 1996 and other relateddeadlines may be found at www.epa.gov/ogwdw/sdwa/sdwa.html. You can also view a list ofactions EPA has completed through links on the site.
‘‘In 1996, the Administration and Congressgave the American people a sensible and com-prehensive law to protect public health,” stated J.Charles Fox, EPA Assistant Administrator, Officeof Water, in a Senate oversight hearing March 3,1999. ‘‘EPA and its partners have created aframework that embodies the principles of the1996 Amendments, and developed many of thetools necessary to provide cost-effective publichealth protection into the 21st Century.’’
For a more extensive look at the SDWA throughthe years, read Frederick W. Pontius’ History ofthe Safe Drinking Water Act online at EPA’s Website www.epa.gov/safewater/sdwa25/sdwa.html.You may phone Pontius at (303) 986-9923 or e-mail him at [email protected].
Continued from previous page
Need answers to your drinking water questions?
The National Drinking WaterClearinghouse’s (NDWC) techni-cal assistants are available toanswer questions about drinkingwater issues such as specific reg-ulatory requirements, financingmethods, contaminants,and howto treat water quality problems.
If you have a drinking water-related question and don’t knowwhere to turn, call the NDWC at(800) 624-8301 or (304) 293-4191and ask to speak with a drinkingwater technical assistant.
????
??
20 On Tap Winter 1999
Dear Editor:Concerning the article in On Tap, Summer 1999,
Volume 8, Issue 2, I take issue with some of thecomments put forth by Wayne Dykstra, presidentof Liquid Engineering, Billings, Montana; andby Michelle Moore, author of the article.
I do agree with several of the points raised,such as who is qualified to inspect water storagetanks, and about the Occupational Safety andHealth Administration (OSHA) compliance forwater tanks.
Some of the items that should be addressed,in addition to the ones raised, are:
• Is a remote controlled submersible vehiclepreferable? In many cases it can achieve satisfactory results without the require-ments of OSHA.
• Is your dive inspector trained and know-ledgeable in OSHA compliance regarding fall protection?
• Is your dive inspector knowledgeable regard-ing operations of a water storage tank?
• Is your dive inspector an engineer?• Is your dive inspector a NACE [National
Association of Corrosion Engineers] Certified Coating Inspector?
• Is your dive inspector an AWS [American Welding Society] Certified Well Inspector?
• How long has the diving contractor been involved in inspection of water storage tanks?
• What type of track record does the dive inspection firm have with past project?
Mr. Dykstra says that commercial diversshould never be confused with SCUBA divers.First of all, many commercial divers do use theSCUBA diving system, which is simply anabbreviation for Self-Contained UnderwaterBreathing Apparatus. Also, SCUBA, while pos-sibly not appropriate in every situation, versusan umbilical and hard hat, does keep the diverfrom causing turbidity in the water system.
Videotaping is an excellent visual record ofthe dive, but turbidity cannot be monitored withthe camera on the head of a hard-hat diver whenhe is looking forward and not toward his feet.The utilities will not be able to document theturbidity at the foot elevation, or turbiditycaused from walking on the floor area of thetank behind the diver. An advantage withSCUBA divers is they can achieve neutral buoy-ancy, thus not causing turbidity problems.
I do agree with Mr. Dykstra that recreationaldiving programs and certifications should not bea baseline qualification for a dive inspector. Thereare many facets and many hours of trainingrequired to achieve competence as a confined
Letters to the Editorspace potable water storage tank dive inspector.Mr. Dykstra also states that five divers over thelast seven years have been killed in diving acci-dents all of them were using scuba equipment, andfour of the five were only sport certified divers.
Mr. Dykstra does not list if any members ofthe Association of Diving Contractors (ADC),which he advocates as a standard in the industry,were involved in any of the accidents. And, ifumbilical hard-hat diving is preferable, why werethose ADC members using SCUBA equipment?
Mr. Dykstra also does not list the U.S. Navyqualifications for training and advocates that onlyACDE [Association of Commercial DivingEducators] commercial dive training certificationis valid. I take issue with that because ACDE train-ing is the direct offshoot of the U.S. Navy training.
To close, any utility that is considering a diveinspection needs to think about:
1. What they want to achieve in the inspec-tion and if a dive inspector is the correct- procedure versus a total drained and dry inspection.
2. The utility also should be concerned that the dive contractor follows state, local, and federal regulations as far as maintaining the quality of water and safety of per-sonnel involved in any inspection. Dive inspections are very specialized.
Finally, as Mr. Dykstra stated—“just becauseyou can go out and buy an airplane or a firetruck does not mean you are automatically apilot or a fireman.” I would like to state thatbecause you have received ACDE commercialdive training, it does not make you a potablewater storage tank inspector following all con-fined space requirements regulated by OSHA.
Curtis Peacock,Project Manager/Inspection ServicesDixon Engineering and Inspection Services For The Coating Industry
You may write to Dixon Engineering andInspection Services For The Coating Industry at1104 Third Ave., Lake Odessa, MI 48849 or callthem at (616) 374-3221.
L E T T E R SL E T T E R S
On Tap Winter 1999 21
Letters to the EditorDear Editor:Having reviewed Mr. Peacock’s comments
on the recent On Taparticle “Is there a diver inyour tank?” I would have to agree with virtuallyall of his comments. Unfortunately, due to thespace limitations in the original article, many ofmy comments and observations were taken outof context or edited in a manner that may haveled to some confusion. With respect to thoseissues raised by Mr. Peacock, the first is “SCUBAdivers.” The two specific issues involved withthe use of SCUBA [Self- Contained UnderwaterBreathing Apparatus] are diver qualificationsand the equipment.
Mr. Peacock and I both agree that the “sport”diver certifications do not provide an adequatelevel of either training or technical expertise tosafely conduct technically valid potable watersystem diving work. While appropriate Navy orACDE [Association of Commercial DivingEducators] training may provide satisfactorytraining, neither of these agencies provides thenecessary technical background to adequatelyensure a recognized and repeatable investigation.That technical expertise can only be gainedthrough education, training, and experience.With that in mind, we have made the commit-ment to having licensed structural and civil engi-neers on staff, to provide this technical expertiseto our clients, as well as the best possible train-ing for our divers.
As for diver equipment, AWWA [AmericanWater Works Association] specifically allows theuse of SCUBA in potable water tanks. Unfortun-ately, this policy is in direct contradiction toexisting OSHA [Occupational Health and SafetyAdministration] regulations that mandate the useof hard hats in confined spaces, or areas wherethe possibility of head injury to a worker mayoccur. This has been confirmed many times byAnthony Brown, OSHA Director of ConstructionRegulation, in Washington, D.C. OSHA’s positionis that because divers are involved does not excludethem from other existing OSHA regulations.
I’m sure that Mr. Peacock or his employeesdo not work in “dirty” water tanks or aroundplumbing, piping, or valves without wearing ahard hat. If that is indeed the case, what affords “special protection” to divers from these sameintrinsic hazards? As an employer, I cannot ingood conscience allow my employees to beexposed to hazards that can be easily mitigatedby spending a few more dollars for the properprotective equipment—this is best provided bythe use of commercial “hard hat” gear.
With respect to the Association of DivingContractors (ADC), I only referenced this group
L E T T E R SL E T T E R S
because I don’t know of any other diving organi-zation that has made any effort to develop a stan-dardized set of safe commercial diving policiesand standards, as well as promulgate a set of potablewater diving standards. My company has devel-oped polices and procedures that greatly exceedOSHA, AWWA, and even ADC’s standards,because we feel that these standards fall far shortof the minimum requirements that are necessaryin this arena.
As for turbidity, I agree completely with Mr.Peacock’s observations. That is why LiquidEngineering Corporation divers routinely inflatetheir dry suits, the same way a SCUBA diverinflates his buoyancy compensator to achieveneutral buoyancy. Further, our diver umbilicalsare specifically constructed to float on the surfaceof the water, as opposed to dragging them acrossthe floor of a reservoir.
On the issue of fatalities, one of the diverdeaths I mentioned did indeed involve an ADCmember. First, the diver in question was equippedwith SCUBA and second, there is some questionwhether the dive team involved was followingADC standards and policies. The diving contractorreceived a number of expensive fines from OSHAfor violations.
It certainly was not my intent to suggest thatADC members are “magically” better divers orcompanies than non-members. My point wasprecisely the opposite. There are dozens of diverswho are seriously injured and killed each and everyyear—many of them are ADC member employees(offshore oil industry, etc.). Unfortunately, in ourniche, potable industry—and given the tens ofthousands of safe reservoir diving incursions thatoccur every year—it is very easy to becomecomplacent and ignore the fact that every singlewater tank dive has hundreds of opportunities fora catastrophic result (head injury, slips, falls, etc.)—even ignoring the hostile marine environment itself.
Hopefully, this will address the issues raisedin Mr. Peacock’s letter in a satisfactory manner.As we all know, safe diving and technicalinspection competence are the result of propercredentials and training, adequate preparation,and careful planning, regardless of the companyundertaking the work.
Wayne Dykstra, PresidentLiquid Engineering Corporation
You may write to LEC at 2484 Overland Ave.,Billings, MT 59102 or call (800) 438-2187. Youmay also log onto their Web site at [email protected].
22 On Tap Winter 1999
Editor’s Note: This is a condensed version of aletter by John Conrady, P.E., ConradyConsultant Services, Vero Beach, Florida, whichmay be viewed in its entirety on our Web site atwww.ndwc.wvu.edu.Please note that WayneDykstra did not have an opportunity to respondto this letter.
John Conrady took issue with a number ofitems in “Is that a diver in your tank?” He believesthat portions of the article were “seriously incor-rect and misleading” with respect to the current1910 OSHA [Occupational Health and SafetyAdministration] Commercial Diving StandardsSubpart T “Commercial Diving Operations,” aswell as with the existing AWWA [AmericanWater Works Association] C652-92 Standard.
Conrady says that information in the articlemay encourage On Tapreaders to avoid solicit-ing bids from companies that have been safelyconducting underwater storage facility inspec-tions for years. He also says that the articleinfers that a utility or company should only usecertified members of the Association of DivingContractors (ADC).
He explains that the only existing “Com-mercial Diving Certification” is from the ADC,which is obtained by joining and paying yearlydues. Consequently, many commercial divingcompanies don’t belong to ADC. He furthernotes that anyone who completes an Associationof Commercial Diving Educators (ACDE)approved commercial dive training program isstill ineligible to obtain an “ADC commercialdiver certification” unless they join ADC andbecome yearly dues paying members.
Also, ADC has specifically made provisionsto certify divers where documented evidence ofqualifications and experience in commercial div-ing exists—instead of completion of an ACDEprogram—if they join ADC and become yearlydues paying members.
However, he states that there is no such thingas a “certified commercial diver” per OSHA1910. The regulation states, “Each dive teammember shall have the experience or trainingnecessary to perform assigned tasks in a safe andhealthful manner” and does not require or estab-lish a “Commercial Diver Certification.”
He also says that the article indicates that “commercial divers” do not use SCUBA (SelfContained Underwater Breathing Apparatus)equipment, such as compressed air cylinders,masks, and regulators, and that divers who do useSCUBA equipment are not “commercial divers.”
But he notes that the OSHA SCUBA divingregulation specifically identifies the procedures Continued on next page
L E T T E R SL E T T E R S
Reader Responds to Tank Diving Articleto be followed when using SCUBA equipmentfor “commercial diving” purposes—and specifi-cally allows the use of masks.
According to the article, the diver also mustbe totally encapsulated in a dry diving helmet, adry suit, and must use surface supplied air.However, the revised AWWA C652-92 Section5.4.1 Equipment and Clothing, Subsection5.4.1(a) states that both SCUBA and externallysupplied air methods are acceptable air sources.The standard states, “… The head shall be fullyencapsulated by one or a combination of the fol-lowing: helmet, dry suit hood, or full face mask.”
Conrady also says that the article gave theimpression that conducting an underwaterinspection is an extremely hazardous operation.He states that only six recorded deaths haveoccurred in water storage facilities during 40 ormore years of non-military diving. He says thatno diving accidents, injuries, or deaths have beenrecorded by any of the companies that specializein conducting the underwater inspection in thelast 10 or more years. Conrady estimates thatutility employees, utility boards, or otheruntrained individuals inspect 200 to 500 waterstorage facilities each year, using common recre-ational sequipment.
According to the article, OSHA diving regu-lations specify that there must be a minimumthree-man team and that all must be fully qualifieddivers. However, 1910 OSHA CommercialDiving Standards Subpart T states: “For theunderwater inspection of water storage facilities,if the diving operation is conducted in a waterdepth of 100 feet or less, and the inspector utilizesa surface supplied air system, the minimum man-power requirement is two persons, one diver andone dive tender, and a standby diver is not required.”
This would change to three persons, includ-ing a standby diver, only if a SCUBA bottle isused for the inspection instead of a surface sup-plied air system
AWWA C652-92 Standard Section 5Subsection 5.4.2 Personnel Requirements states: “It is recommended that the dive team performingthe work should include a minimum of twoSCUBA -certified divers (one being a standbydiver), each with diving experience in closedconfined spaces, and experience in the use of theunderwater inspection equipment. Unless otherwisespecified by the purchaser, the standby diverneed not be suited up and, in case of emergency,is not required to undergo disinfection proceduresbefore entering the water-storage-facility.”
According to the Standard revision, which isnot in effect and still being debated, the dive
Other MATAC services include taking an in-depthlook at maintenance practices and managementcontrols, and exploring a system’s present andfuture financial viability.
After the assessment, MATAC provides adetailed report identifying current operations,maintenance, management, and financial healthof the system, making recommendations formeeting current and future SDWA requirements—including fulfilling future financial obligations.
MATAC provides assistance to small drink-ing water systems in Maryland, Virginia, WestVirginia, Pennsylvania, Delaware, and New Jersey.
For more information about MATAC, write tothe Maryland Center for Environmental Training,8730 Mitchell Road, La Plata, Maryland, 20646-0910. You may also call (301) 934-7546 or visittheir Web site at www.mcet.org/specproject/matac.htm.
On Tap Winter 1999 23
team should consist of two “qualified” (not cer-tified) divers and a third person should be presentfor the inspection who is required to be certifiedin CPR and First Aid.
Since Janaury 1982, Conrady has been inthe business of inspecting water storage facili-ties. He worked with EPA and AWWA to estab-lish a disinfection procedure for inspections thatwas accepted and approved by both organiza-tions. He is currently a member of the AWWA
C652-92 Standard Disinfection of Water StorageFacilities” subcommittee that is working onrevisions to existing standards.
To learn more about OSHA regulations visitwww.osha-slc.gov/OshStd_data/1910_0424.html. AWWA standards are available atwww.awwa.org/awwastds.htm.
You may write to Conrady ConsultantServices, Box 650948, Vero Beach, Florida32965-0948 or call (561) 562-1117.
Continued from page 22
MATAC Provides Assistance to Small SystemsRealizing the difficulties small systems face
with regard to capacity development, the reau-thorized 1996 Safe Drinking Water Act (SDWA)provides for regional university-based TechnicalAssistance Centers (TACs) that provide training,education, and technical assistance to public watersystems. (See the Fall 1999 On Tapfor more infor-mation about TACs. See the Fall 1998 Water Sensefor more information about capacity development.)
The Mid-Atlantic Technology AssistanceCenter (MATAC) is one such center. Housedwithin the Maryland Center for EnvironmentalTraining (MCET) and located at the CharlesCounty Community College, MATAC providesno-cost evaluations of small water systems,using a capacity development approach.
“Our evaluators look at all aspects of a watersystem,’’ says Frank Comstock, MATAC projectcoordinator, adding that evaluations delve intoproduction, treatment, and distribution of water.
Is water getting cheaper? It’s true, accordingto a news story on the Water and WastewaterInternationalWeb site. The story notes that thecost of water dropped an average of 0.5 percent tojust under 51 cents per cubic meter, reports thelatest 1999 NUS International Water Cost Analysis.
Richard Soultanian, Co-President of NationalUtility Service (NUS), Inc., notes that one of thegreatest price drops was in Newark, New Jersey,where consumers received a reduction of almostseven percent.
“In contrast, prices rose three percent in LosAngeles, California, over the past year, one ofthe few rises for the year,’’ says Soultanian.
The story notes that this is good news forinflation, but warns that the situation could soonchange, following the recent drought and floods.Other highlights from the NUS International
Water Cost Analysis include: • German consumers pay the most for their
water; • South Africa posted the greatest price
increase (9.8 percent); • Finland consumers obtained the greatest
price decrease (down 2.3 percent); and • Canada’s water prices remain the cheapest
surveyed. The annual survey is part of NUS’s utility
cost management work to help organizationsobtain better utility prices.
For more information about the survey, con-tact the NUS at One Maynard Drive, Park Ridge,New Jersey 07656. Or call (201) 391-4300.Information about other surveys is also availableon their Web site at www.nusinc.com.
U.S. Water Prices Getting Cheaper
R E S O U R C E SR E S O U R C E S
Reader Responds to Tank Diving Article
National Drinking Water ClearinghouseWest Virginia UniversityP.O. Box 6064Morgantown, WV 26506-6064
ADDRESS SERVICE REQUESTED
NonprofitOrganization
U.S. Postage PaidPermit No. 34
Features
A Brief History ofDrinking Water Regulations,
Page 1
Martins FerrySCADA System
Is Online,Page 3
Water Quality andModeling in
Distribution Systemsfor Small Cities,
Page 8
Tech Brief: Ozone,
center pages
Tennessee Training CentersTeach Operators,
Page 12
Departments
NDWC Page,Page 2
RUS Rates,Page 4
Operator section,page 12
Q&A: What is arsenic?
Page 16
NDWC Mission StatementThe National Drinking Water Clearinghouse
assists small communities by collecting,developing, and providing timely information
relevant to drinking water issues.
C O N T E N T SC O N T E N T S
Note: The free items listed below are limited toone of each per order. Call (800) 624-8301 or(304) 293-4191 to order products and to verifyprices. Please allow three to four weeks for de-livery. Actual shipping charges are added toeach order. National Drinking Water Clearing-house (NDWC) products also may be orderedvia e-mail at [email protected] are subject to availability.
On Tap, Winter 1996Item #ONTAP20This special Safe
Drinking water Act (SDWA)reauthorization issueexplores the impacts the actwill have on small drinkingwater systems.
Impact of Pipe Coatings on DrinkingWater QualityItem #DWBLRE01This booklet presents case studies of trace
chemical contamination in the City of Calgary’sdistribution system. In most cases, it wasobserved that the cause of the contamination wasthe internal pipe coating material. Results sug-gest that proper and careful selection of the pipelinings and testing are required to provide safedrinking water.
Safe Drinking Water Act PocketGuide and 1996 AmendmentsItem #DWPKRG25—1996This booklet is designed specifically for the
owners and operators of small water systems. Itexplains the SDWA in clear and understandableterms. It also provides the 1996 amendments tothe SDWA.
Standardized Costs for Water SupplyDistribution Systems: Complete EPA ReportItem #DWBKDM19—1992This report includes cost data for construc-
tion, operation, and maintenance of domesticwater distribution pipelines, water pumping sta-tions, and water storage reservoirs.
Corrosion Manual for Internal Corrosionof Water Distribution SystemsItem #DWBKDM15—1984This manual provides information about the
causes and types of corrosion, as well as practi-cal guidance for detecting and solving corrosion-related problems.
SDWA, Distribution System Products Available