Embed Size (px)
Citation preview
GUIDELINES FOR DRINKING-WATER QUALITY MANAGEMENT FOR NEW ZEALAND CHAPTER 12: TREATMENT PROCESSES, PRETREATMENT – MAY 2019 1
Chapter 12: Treatment processes, pretreatment Contents
12.1 Introduction 2
12.2 Groundwater 3
12.2.1 Aeration 4
12.2.2 Oxidation processes 8
12.2.3 pH adjustment 8
12.3 Surface water 9
12.3.1 Bank filtration and infiltration galleries 9
12.3.2 Off-river storage 15
12.3.3 Presedimentation 18
12.3.4 Prefiltration 20
12.3.5 Microstrainers 21
12.3.6 Roughing filters 22
References 23
List of tables Table 12.1: Reduction times for selected micro-organisms in surface water 16
Table 12.2: Studies of protozoa removal from off-river raw water storage 17
List of figures Figure 12.1: Tray aerator 6
2 GUIDELINES FOR DRINKING-WATER QUALITY MANAGEMENT FOR NEW ZEALAND CHAPTER 12: TREATMENT PROCESSES, PRETREATMENT – MAY 2019
12.1 Introduction Pretreatment of surface water includes processes such as bankside filtration, infiltration galleries, presedimentation, off-river storage, roughing filters, screens and microstrainers. Many pretreatment processes are natural processes, enhanced by design to improve water quality. Pretreatment options may be compatible with a variety of water treatment processes ranging in complexity from simple disinfection to membrane processes. Pretreatment is used to reduce, and/or to stabilise variations in the microbial, natural organic matter and particulate load. The main pretreatment process for groundwater discussed in this chapter is aeration. Other factors that affect groundwater quality are discussed in Chapter 3: Source Waters, section 3.2. Down-hole maintenance of screens and pipes is also discussed in Chapter 3. This chapter covers bankside filtration and the other pretreatment processes that do not qualify for protozoal log credits. Management of the catchment in order to enhance raw water quality is discussed in Chapter 3: Source Waters. The treatment processes that do qualify are discussed in the water treatment chapters: coagulation (Chapter 13), filtration (Chapter 14), and disinfection (Chapter 15). Roof water is discussed in Chapter 19. The 2008 DWSNZ include a new section, section 5.17: Alternative processes: treatment compliance criteria, whereby water suppliers may apply to the Ministry of Health to have other treatment processes assessed for a log credit rating. This approach, which is explained more fully in section 8.4.5 of the Guidelines, allows water suppliers to apply for a log credit rating (or a variation to the prescribed log credits) for a treatment plant or process: a) not covered in sections 5.1–5.16 of the DWSNZ
b) that performs demonstrably better than its compliance criteria c) that performs to a lesser, but reliable, level than specified in its compliance
criteria. In theory, it could be possible that a pretreatment process discussed in this chapter could be modified or operated in such a manner that it qualifies for log credits. Risk management issues related to pretreatment processes are discussed in the: • MoH Public Health Risk Management Plan Guide PHRMP Ref. 1.1: Surface Water
Abstraction – Rivers, Streams and Infiltration Galleries. • MoH Public Health Risk Management Plan Guide PHRMP Ref. P3: Treatment
Processes – Pre-Treatment Storage.
• MoH Public Health Risk Management Plan Guide PHRMP Ref. P4.3: Pre-oxidation.
GUIDELINES FOR DRINKING-WATER QUALITY MANAGEMENT FOR NEW ZEALAND CHAPTER 12: TREATMENT PROCESSES, PRETREATMENT – MAY 2019 3
12.2 Groundwater For bacterial and protozoal compliance purposes, the DWSNZ (section 4.5) distinguish between secure and non-secure bore waters, with shallow non-secure bore waters (which includes springs) being considered equivalent to surface waters. Except where discussing compliance issues, the Guidelines consider groundwater to include all water extracted from under the ground. Springs flow out of the ground at the surface but may contain water that has been underground for a very short time or distance. However, the types of pretreatment commonly applied to springs means that in this section of the Guidelines, springs are considered equivalent to groundwater. When surface water enters the ground, changes in its quality occur relatively slowly. For this reason, groundwater sources have a more consistent quality than surface waters. Most bore water pumps have a fixed output so even the flow rate does not change. When surface water goes underground, it usually carries organic material with it from the top soil and ground cover. This material decays over time, adding to the carbon dioxide content; dissolved oxygen is consumed in the process. This is not toxic or even distasteful, lemonade contains very high levels of CO2! The problem with carbon dioxide is that it reacts with the water to form carbonic acid, lowering the pH of the water. If this falls to below 7 (as a guide), the following problems may occur:
• the water will dissolve iron and manganese and, potentially, other metals from the ground itself. These metals stay in solution as long as the pH and dissolved oxygen concentration is low; higher pH levels will normally see them precipitate out as unsightly red, brown or black slimes, flocs or encrustations. This pH lift occurs at a tap when the pressure is released and the carbon dioxide comes out of solution and is replaced by dissolved oxygen
• metallic fittings, particularly copper, zinc (from brass and from galvanised steel), and iron will be corroded. This may affect people’s health, especially in the case of copper which has often been measured at concentrations well above its MAV (see datasheet), as well as causing bitter tastes and staining of clothing, basins, baths and pans. For discussion on corrosion of plumbing materials, refer to Chapter 10: Chemical Compliance, section 10.3.4
• concrete and other lime-based materials such as plaster pipe linings and asbestos cement pipes will dissolve, causing the pH of water sitting in the pipes to rise, even to above pH 10. This dissolution can result in detritus (loose sand etc) and the loss of corrosion-prevention linings.
Refer to Chapter 3: Source Waters, section 3.2 for a detailed discussion on groundwater. This includes the development of the well, screens, corrosion, and the deposition of iron and manganese.
4 GUIDELINES FOR DRINKING-WATER QUALITY MANAGEMENT FOR NEW ZEALAND CHAPTER 12: TREATMENT PROCESSES, PRETREATMENT – MAY 2019
12.2.1 Aeration Aeration is a physical process aimed at: • increasing the dissolved oxygen of the water; and/or • decreasing the dissolved carbon dioxide content • assisting in the removal of iron and manganese
• removing other volatile matter such as radon, methane, hydrogen sulphide and taste and odour causing compounds. WRF (2014) summarised a study that determined the effectiveness of tray aeration technology for removing 13 focus carcinogenic volatile organic compounds (VOCs) to the sub μg/L concentration range. The VOCs’ removal efficiencies were studied by collecting operational data from pilot plant operations, under various air-to-water ratios (53–652), three different temperatures (4, 12, and 20°C), and 1 to 6 trays in series. Further information is included in the individual datasheets.
Note that although aeration is discussed in this groundwater sub-section, some surface waters may require aeration too. The first objective is more common in wastewater treatment, where oxygen is required for bacterial respiration. The second is more common in groundwaters used for drinking. The aeration process removes the gas by jostling it out of solution and sending it to the surface. Normally, surface water such as stream or river water already has a high dissolved oxygen and low dissolved carbon dioxide content. However, this is not usually the case with groundwater. The simplest test for whether there is a high carbon dioxide content is to measure the pH, then aerate the water (by, for example, shaking a half-full sample bottle) and re-measure the pH. If it increases by one pH unit or so, you can be confident the water has enough carbon dioxide in it to merit aeration. See Sinton (1986) and Sundaram et al (2009) for advice on sampling groundwater. The laboratory method for analysing carbon dioxide is described in Standard Methods (APHA et al 2005). Care is needed when collecting a sample for carbon dioxide analysis; the procedure is described in Chapter 4: Selection of Water Source and Treatment, section 4.4.1. Some underground waters contain other dissolved gases such as ammonia and/or hydrogen sulphide, or even methane. These will have marked effects on the aesthetics of the water, in both taste and odour. They also can be reduced by aeration, but may be more difficult to treat than carbon dioxide. Laboratory testing is needed to verify their presence, although in the case of H2S, it may be easier to detect by smell. To aerate water, it needs to be split into a thin film or tiny droplets to maximise its exposure to the air. This can be done a number of ways:
GUIDELINES FOR DRINKING-WATER QUALITY MANAGEMENT FOR NEW ZEALAND CHAPTER 12: TREATMENT PROCESSES, PRETREATMENT – MAY 2019 5
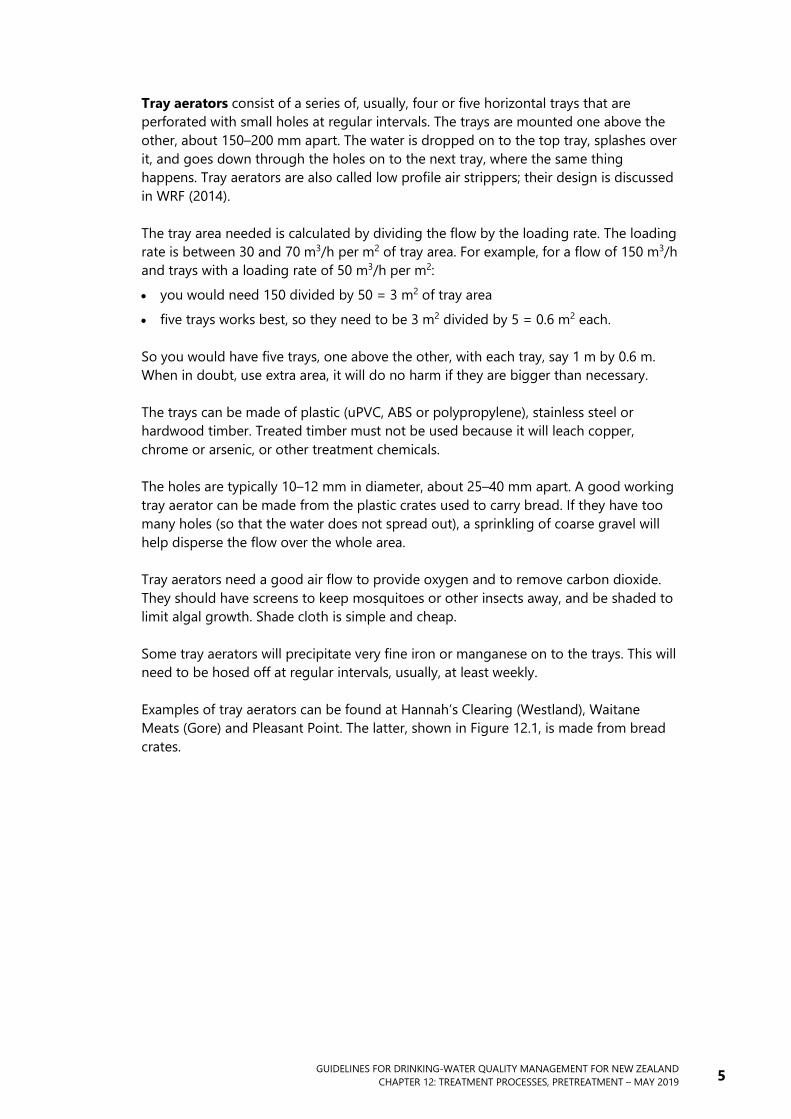
Tray aerators consist of a series of, usually, four or five horizontal trays that are perforated with small holes at regular intervals. The trays are mounted one above the other, about 150–200 mm apart. The water is dropped on to the top tray, splashes over it, and goes down through the holes on to the next tray, where the same thing happens. Tray aerators are also called low profile air strippers; their design is discussed in WRF (2014). The tray area needed is calculated by dividing the flow by the loading rate. The loading rate is between 30 and 70 m3/h per m2 of tray area. For example, for a flow of 150 m3/h and trays with a loading rate of 50 m3/h per m2:
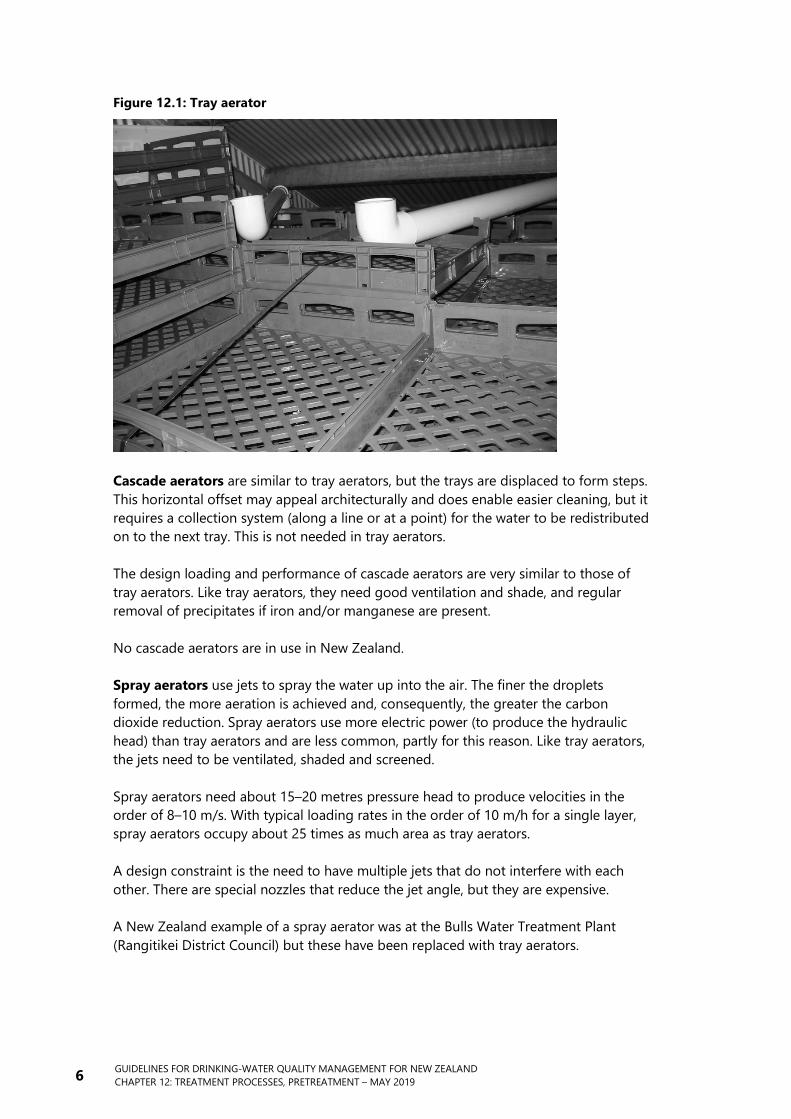
• you would need 150 divided by 50 = 3 m2 of tray area • five trays works best, so they need to be 3 m2 divided by 5 = 0.6 m2 each. So you would have five trays, one above the other, with each tray, say 1 m by 0.6 m. When in doubt, use extra area, it will do no harm if they are bigger than necessary. The trays can be made of plastic (uPVC, ABS or polypropylene), stainless steel or hardwood timber. Treated timber must not be used because it will leach copper, chrome or arsenic, or other treatment chemicals. The holes are typically 10–12 mm in diameter, about 25–40 mm apart. A good working tray aerator can be made from the plastic crates used to carry bread. If they have too many holes (so that the water does not spread out), a sprinkling of coarse gravel will help disperse the flow over the whole area. Tray aerators need a good air flow to provide oxygen and to remove carbon dioxide. They should have screens to keep mosquitoes or other insects away, and be shaded to limit algal growth. Shade cloth is simple and cheap. Some tray aerators will precipitate very fine iron or manganese on to the trays. This will need to be hosed off at regular intervals, usually, at least weekly. Examples of tray aerators can be found at Hannah’s Clearing (Westland), Waitane Meats (Gore) and Pleasant Point. The latter, shown in Figure 12.1, is made from bread crates.
6 GUIDELINES FOR DRINKING-WATER QUALITY MANAGEMENT FOR NEW ZEALAND CHAPTER 12: TREATMENT PROCESSES, PRETREATMENT – MAY 2019
Figure 12.1: Tray aerator
Cascade aerators are similar to tray aerators, but the trays are displaced to form steps. This horizontal offset may appeal architecturally and does enable easier cleaning, but it requires a collection system (along a line or at a point) for the water to be redistributed on to the next tray. This is not needed in tray aerators. The design loading and performance of cascade aerators are very similar to those of tray aerators. Like tray aerators, they need good ventilation and shade, and regular removal of precipitates if iron and/or manganese are present. No cascade aerators are in use in New Zealand. Spray aerators use jets to spray the water up into the air. The finer the droplets formed, the more aeration is achieved and, consequently, the greater the carbon dioxide reduction. Spray aerators use more electric power (to produce the hydraulic head) than tray aerators and are less common, partly for this reason. Like tray aerators, the jets need to be ventilated, shaded and screened. Spray aerators need about 15–20 metres pressure head to produce velocities in the order of 8–10 m/s. With typical loading rates in the order of 10 m/h for a single layer, spray aerators occupy about 25 times as much area as tray aerators. A design constraint is the need to have multiple jets that do not interfere with each other. There are special nozzles that reduce the jet angle, but they are expensive. A New Zealand example of a spray aerator was at the Bulls Water Treatment Plant (Rangitikei District Council) but these have been replaced with tray aerators.
GUIDELINES FOR DRINKING-WATER QUALITY MANAGEMENT FOR NEW ZEALAND CHAPTER 12: TREATMENT PROCESSES, PRETREATMENT – MAY 2019 7
Entrained air aerators disperse air through the water to allow the transfer of gas from the water into the air, or vice versa. However, they are rarely used, because the energy cost of running a compressor is usually much higher than that of pumping the water. Packed tower aerators are towers through which the water flows down against a current of air blown from a compressor. The towers are filled with surface contactors, a little like the plastic media used for wastewater treatment, to increase the contact area between the water and the air. These contactors are not there for microbiological reasons; they are there solely to increase the contact area. They may be made of plastic, wood or loose media. The main design parameters for packed towers are the specific surface area provided by the media, column diameter, column height, and water and air flow rates. Packed tower aerators are often called aerators for removing gas and air stripping towers for removing volatile carbon compounds. They can achieve good results in removing or oxidising gases such as methane, ammonia and hydrogen sulphide but are not common in New Zealand.
Removal rates All aerators typically remove only about 50 percent of the dissolved gases. Some may reach nearly 75 percent, but none will remove all of it. The remaining carbon dioxide is usually neutralised with an alkali, such as hydrated lime or sodium hydroxide (caustic soda), forming bicarbonate and lifting the pH back to non-aggressive levels, see section 12.2.3.
Cleaning If not much iron or manganese is being precipitated, aerators may need to be hosed down only every few months or so. However, high precipitation rates may necessitate cleaning several times a week. Insect screens and air inlets also need to be cleaned from time to time.
Filtration After aeration, filtration may be needed to remove further iron and manganese. If so, the carbon dioxide should be neutralised before the water is filtered. The filters should be fine sand (say, 18/36 grade) and be of the normal rapid sand filter design. See Chapter 18: Aesthetic Considerations, section 18.3 for a discussion on iron and manganese removal. Air stripping and aeration are discussed in Chapter 5 of AWWA (1990). Chapter 2 of USEPA (2004) is the ETV Testing Plan for Volatile Organic Compound (VOC) Removal by Air Stripping Technology for use as a guide in the development of the Product-Specific Test Plan for testing of air stripping equipment, within the structure provided by the ETV Protocol document for VOC removal.
8 GUIDELINES FOR DRINKING-WATER QUALITY MANAGEMENT FOR NEW ZEALAND CHAPTER 12: TREATMENT PROCESSES, PRETREATMENT – MAY 2019
12.2.2 Oxidation processes Aeration is the most common process for removing gases such as carbon dioxide and occasionally methane and H2S. Aeration is also used to help in precipitating dissolved iron and manganese. Sometimes the direct addition of an oxidising chemical may be needed to help precipitate the metals and maybe oxidise gases such as ammonia. The following oxidising chemicals are in common use:
• chlorine, in any form. For example, chlorine will oxidise ferrous iron to ferric iron, making it insoluble so that it precipitates out; it will also oxidise sulphide
• potassium permanganate, also known as Condy’s crystals. This is effective at destroying some organic substances and oxidising any manganese bound on to them. Again, the manganese is rendered insoluble and precipitates out. It is not used very often in New Zealand
• ozone, apart from being used as a disinfectant, is sometimes used to oxidise taste and odour compounds because many of these compounds are very resistant to oxidation, but is also used to oxidise iron and manganese, and ammonia, which breaks down to nitrogen and water. It is reported to be used on one groundwater source near Wanganui to reduce the ammonia content. Overseas it may be used to break down pesticide molecules.
Solutions and liquid chemicals are usually added by dose pump into carry water which is then dispersed into the main flow. In smaller supplies, the carry water may be the main pipe. If the chemical is a gas (gas chlorine and ozone), it is always added to carry water, separate from the main supply. There is often a feedback control loop that adjusts the dose rate to respond to variations in the raw water. The effect is measured in one of three ways: residual chlorine level, pH or ORP (oxidation/reduction potential). Oxidation processes are discussed in Chapter 12 of AWWA (1990). See Chapter 18: Aesthetic Considerations, section 18.3 for a discussion on removal of aesthetic determinands.
12.2.3 pH adjustment As mentioned in section 12.2.1, carbon dioxide (CO2) can also be removed from water by dosing it with hydrated lime or sodium hydroxide (caustic soda). Aeration is generally the cheaper option, but chemical dosage may be attractive if it avoids breaking the pressure. The CO2 concentration needs to be measured, see Chapter 10, section 10.3.4. When collecting a sample for analysis of CO2, great care is needed to ensure that the water is not aerated. This can be done by attaching a plastic tube to the tap and inserting the other end to the bottom of the sample bottle, and displacing several volumes before replacing the lid on the sample bottle.
GUIDELINES FOR DRINKING-WATER QUALITY MANAGEMENT FOR NEW ZEALAND CHAPTER 12: TREATMENT PROCESSES, PRETREATMENT – MAY 2019 9
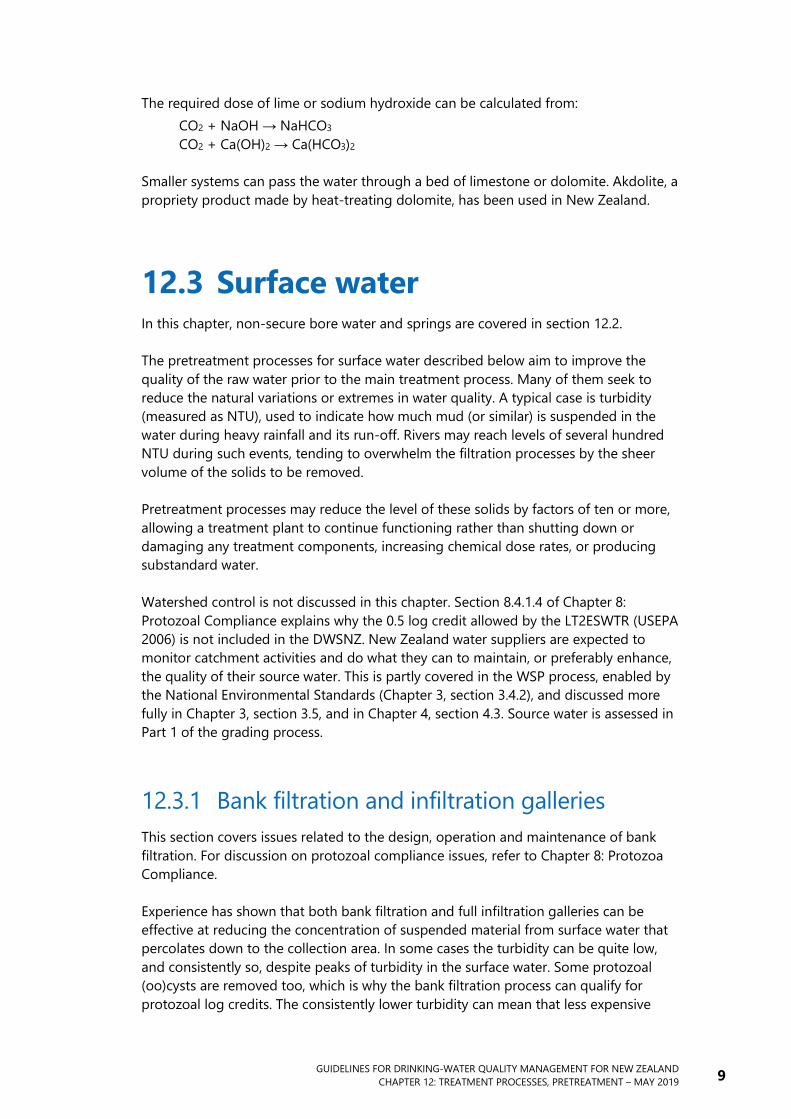
The required dose of lime or sodium hydroxide can be calculated from: CO2 + NaOH → NaHCO3 CO2 + Ca(OH)2 → Ca(HCO3)2
Smaller systems can pass the water through a bed of limestone or dolomite. Akdolite, a propriety product made by heat-treating dolomite, has been used in New Zealand.
12.3 Surface water In this chapter, non-secure bore water and springs are covered in section 12.2. The pretreatment processes for surface water described below aim to improve the quality of the raw water prior to the main treatment process. Many of them seek to reduce the natural variations or extremes in water quality. A typical case is turbidity (measured as NTU), used to indicate how much mud (or similar) is suspended in the water during heavy rainfall and its run-off. Rivers may reach levels of several hundred NTU during such events, tending to overwhelm the filtration processes by the sheer volume of the solids to be removed. Pretreatment processes may reduce the level of these solids by factors of ten or more, allowing a treatment plant to continue functioning rather than shutting down or damaging any treatment components, increasing chemical dose rates, or producing substandard water. Watershed control is not discussed in this chapter. Section 8.4.1.4 of Chapter 8: Protozoal Compliance explains why the 0.5 log credit allowed by the LT2ESWTR (USEPA 2006) is not included in the DWSNZ. New Zealand water suppliers are expected to monitor catchment activities and do what they can to maintain, or preferably enhance, the quality of their source water. This is partly covered in the WSP process, enabled by the National Environmental Standards (Chapter 3, section 3.4.2), and discussed more fully in Chapter 3, section 3.5, and in Chapter 4, section 4.3. Source water is assessed in Part 1 of the grading process.
12.3.1 Bank filtration and infiltration galleries This section covers issues related to the design, operation and maintenance of bank filtration. For discussion on protozoal compliance issues, refer to Chapter 8: Protozoa Compliance. Experience has shown that both bank filtration and full infiltration galleries can be effective at reducing the concentration of suspended material from surface water that percolates down to the collection area. In some cases the turbidity can be quite low, and consistently so, despite peaks of turbidity in the surface water. Some protozoal (oo)cysts are removed too, which is why the bank filtration process can qualify for protozoal log credits. The consistently lower turbidity can mean that less expensive
10 GUIDELINES FOR DRINKING-WATER QUALITY MANAGEMENT FOR NEW ZEALAND CHAPTER 12: TREATMENT PROCESSES, PRETREATMENT – MAY 2019
treatment such as cartridge or diatomaceous earth filtration can be used instead of chemical coagulation in order to achieve protozoal compliance. Bank filtration is the process of using vertical or horizontal wells beside rivers and/or lakes. The idea is to use naturally occurring sands to filter the water as it flows through to the gathering well or gallery. To gain protozoa removal credits for this process, the amount of sand present needs to be significant, see section 5.3 of the DWSNZ, which was based on the LT2ESWTR (USEPA 2006). The evidence that the USEPA accepted that showed bank filtration was effective was, in turn, gained from experience of filtering River Rhine water through stop banks and the underlying material. Pang (2009) reported findings from a study of microbial removal in a range of substrates; higher rates were found in volcanic soils, pumice sand, fine sand, and highly weathered aquifer rocks. Low removal rates were found in structured clayey soils, stony soils, coarse gravel aquifers, fractured rocks, and karst limestone. Microbial removal rates were inversely correlated with infiltration rates and transport velocity. Sprenger et al (2014) reported that a highly polluted river water in India achieved a virus removal rate of more than a million-fold (>6 log) when the water passed through sands for 50 m in 119 days. There are several bank filtration schemes in Germany. Typically, they have: • continuous river flow, stable river banks
• sand and gravel river bed, bed erosion • sand and gravel aquifers with a hydraulic conductivity higher than 1·x 10-4 m/s
• aquifer thickness between 3 and 70 m, average 20 m • average infiltration rates <0.2 m3/(m2 day)
• distance between wells and riverbank mostly >50 m
• travel time mostly between 25 and 300 days • mostly vertical wells, a few sites with horizontal wells
• water abstraction capacities between 20 and 600,000 m3/d • proportion of bank filtrate in the pumped raw water more than 50 percent at most
sites. All sites have their own peculiar restrictions, and advantages. Whilst some simplistic diagrammatic examples are shown below, the well or gallery needs to be designed or proven for each location. Few streams and rivers are sited in alluvial sands alone, there will be flow-blocking material such as silts, clays and bedrock ledges. Many New Zealand river beds are largely made up of boulders, which will not offer much treatment. These factors will control where the water may be taken from. The WSP should allow for the risks at each particular site. Risks may include: • flood damage to the structures • floods flowing over the site and inundating the (originally clean) water • flow levels dropping to such an extent that there is inadequate water available to take.
GUIDELINES FOR DRINKING-WATER QUALITY MANAGEMENT FOR NEW ZEALAND CHAPTER 12: TREATMENT PROCESSES, PRETREATMENT – MAY 2019 11
There will be other risks peculiar to each site. Some examples of bank filtration and infiltration galleries are as follows.
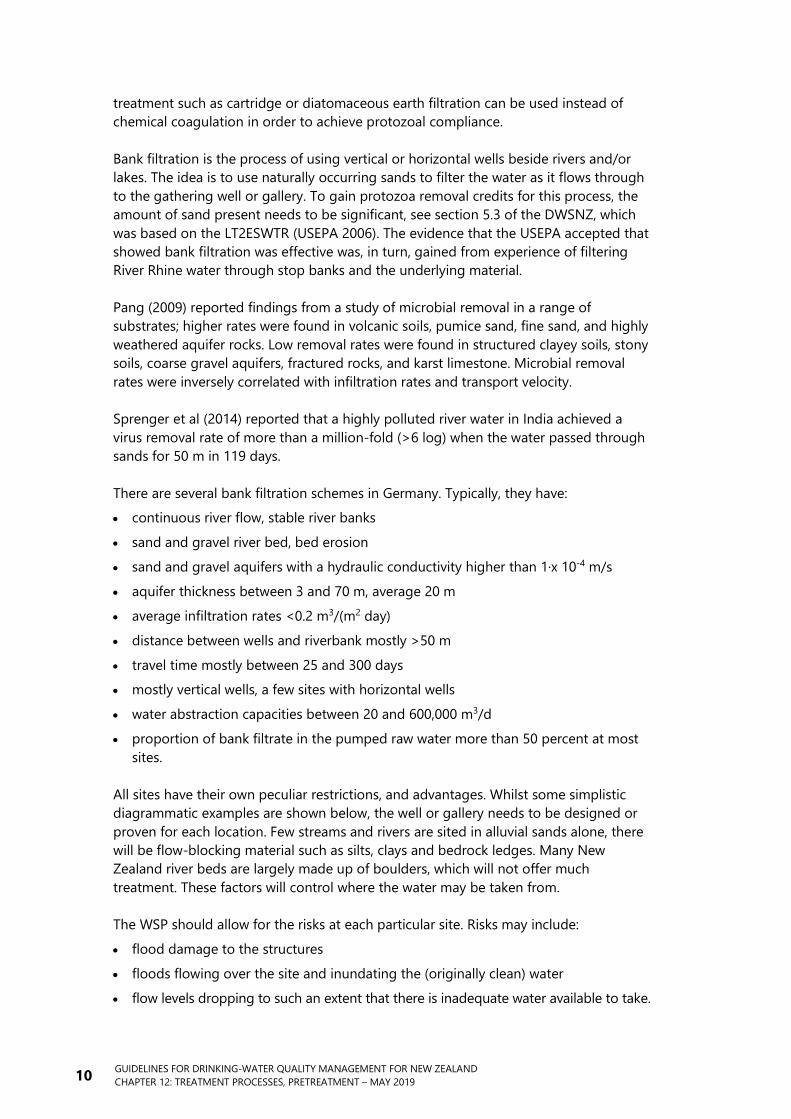
Vertical wells
An example of this type of intake is the Taieri bores in Outram, near Dunedin. In some cases, particularly after local wet weather, groundwater may flow towards the river, so the water collected may be from adjacent surface land, not the river. The granular material must have a d10 of 1 mm or less. The d10 is the size that 10 percent of the material is smaller than; likewise, d60 is the size that 60 percent is smaller than. A grade of sand ranging between 0.6 mm and 1.2 mm would probably have a d10 of about 0.66 mm and a d60 of about 0.96. Within a given range, the relative amounts of different-sized grains can vary and the effectiveness of the filter is determined by the fineness of the material overall. This is expressed as the ratio of the d60 to the d10, or uniformity coefficient (UC). The UC of the sand described above would be 0.96 divided by 0.66 = 1.45. Good filters usually have a UC of 1.5 or lower. Vertical wells may use a central screen surrounded by a filter pack. The shaft is dug to a much greater diameter than that of the screen, say 1.1 m for a 200 mm screen, and a temporary liner such as a large steel pipe (for this example, about 1 m in diameter) inserted to stop the surrounding material collapsing. The screen is put in place, the filter material inserted in the gap and the liner removed. This technique enables a good thickness of filter material but is more suited to shallower wells of up to 15 m deep; any deeper and it becomes very difficult to remove the liner. Normally, in deep wells, the screen is placed directly against the country of the aquifer. Following this, the well is usually surged to pull small sand through the screen, this process is called well development. It is important that the design prevents dirty water flowing down the sides of the shaft, polluting the cleaner water below. This would be one of the risks addressed by the WSP.
12 GUIDELINES FOR DRINKING-WATER QUALITY MANAGEMENT FOR NEW ZEALAND CHAPTER 12: TREATMENT PROCESSES, PRETREATMENT – MAY 2019
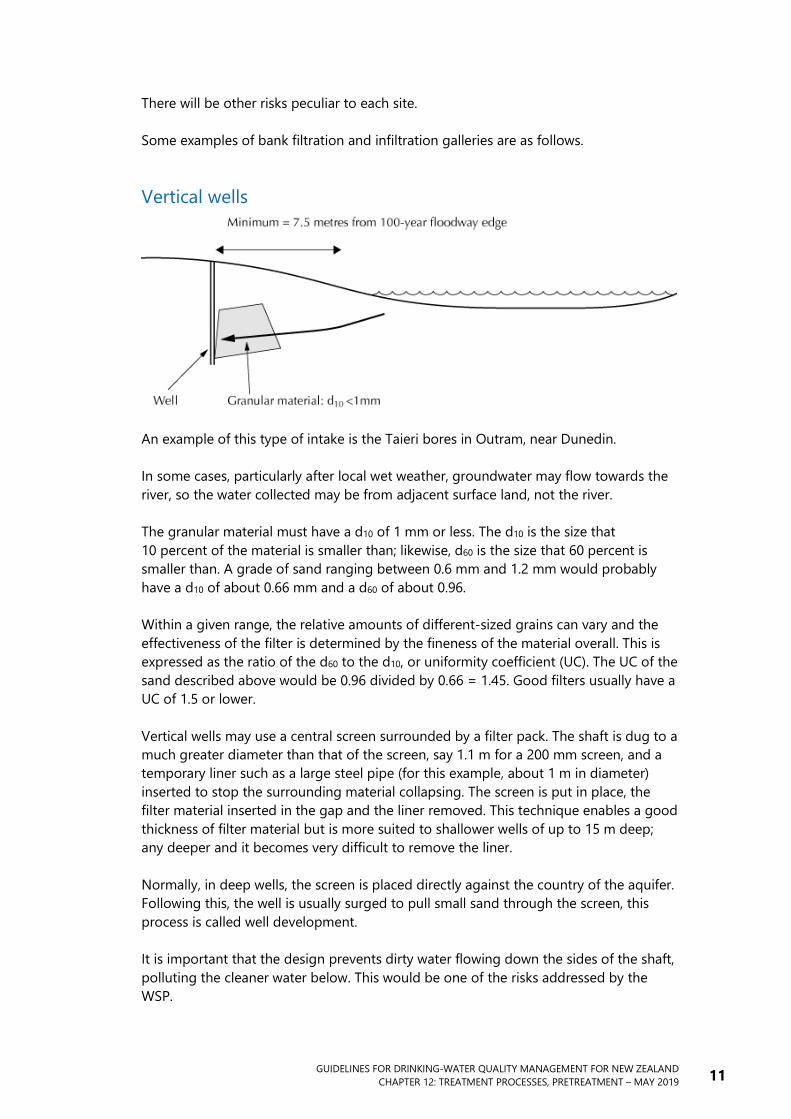
Horizontal wells
The protozoal log removal credits allowed for bank filtration systems in the DWSNZ are based on data analysis carried out by the USEPA (2003a) and finalised in USEPA (2006). For such a system to qualify for 0.5 log removal of Cryptosporidium oocysts, it is required that: 1 A horizontal or vertical well is used. 2 The ground is unconsolidated gravels or sands that either have a d10 of <1 mm
or can be demonstrated to be an effective filter.
3 The groundwater flow path is at least 7.5 metres long. For vertical wells, this distance is measured from the 100-year flood edge to the well; for horizontal wells, it is measured from the river edge and bed under normal flows to the nearest point of the gallery.
4 Turbidity measurements are taken at least four-hourly. These must show an average daily maximum of less than 1 NTU, unless a satisfactory explanation is given for non-compliance.
To qualify for 1 log removal credit, the groundwater flow path must be at least 15 m. In New Zealand some infiltration galleries differ from these bank filtration arrangements. The usual method of constructing these galleries is: • a horizontal trench is excavated, parallel to the river
• a slotted pipe is laid, usually bedded in a filter pack of carefully graded gravel • the trench is backfilled, usually with the excavated gravels
• the supply is withdrawn from all of the slotted pipe length. Many of these galleries do not comply with the criteria for bankside filtration.
GUIDELINES FOR DRINKING-WATER QUALITY MANAGEMENT FOR NEW ZEALAND CHAPTER 12: TREATMENT PROCESSES, PRETREATMENT – MAY 2019 13
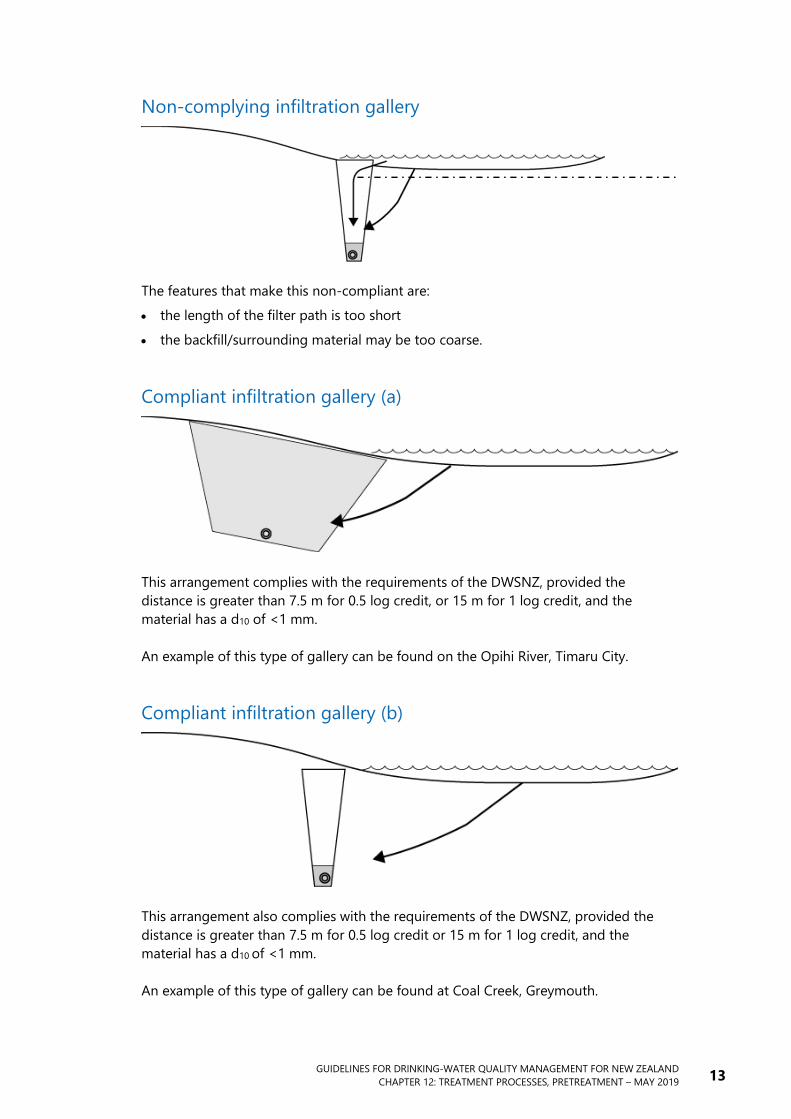
Non-complying infiltration gallery
The features that make this non-compliant are: • the length of the filter path is too short • the backfill/surrounding material may be too coarse.
Compliant infiltration gallery (a)
This arrangement complies with the requirements of the DWSNZ, provided the distance is greater than 7.5 m for 0.5 log credit, or 15 m for 1 log credit, and the material has a d10 of <1 mm. An example of this type of gallery can be found on the Opihi River, Timaru City.
Compliant infiltration gallery (b)
This arrangement also complies with the requirements of the DWSNZ, provided the distance is greater than 7.5 m for 0.5 log credit or 15 m for 1 log credit, and the material has a d10 of <1 mm. An example of this type of gallery can be found at Coal Creek, Greymouth.
14 GUIDELINES FOR DRINKING-WATER QUALITY MANAGEMENT FOR NEW ZEALAND CHAPTER 12: TREATMENT PROCESSES, PRETREATMENT – MAY 2019
The bank filtration mechanism operates by the normal methods of filtration, not unlike the slow sand filtration process (see Chapter 14):
• direct mechanical screening, ie, stopping the transport of large particles. The material will stop particles that are 30 percent of its d10 or bigger. So, if the d10 is 1 mm, it will stop particles of 300 microns and more
• settling of particles on to horizontal layers in the sand • spinning out particles at tight corners, sending them into quiet areas where they
settle out • adsorption of particles on to the surfaces of the material • grazing of micro-organisms by resident biota. Bank filtration also significantly reduces soluble organic material in surface water. This is probably because the organic material is electrostatically attracted to the surface of the filtration material where tiny aquatic animals graze. As noted above, organic material in surface water decays over time. Thus the ideal time to abstract the raw water is after most of the particles have been removed but before any dissolved organics have produced carbon dioxide, which would lower the pH and dissolve iron or manganese from the soil. Design loading rates for infiltration galleries are usually around 0.2–0.5 litres per second per metre of length, with the pipes sized to keep velocities under 0.7 m/s. The general rule is the lower the loading rate, the better the result. The pipe should also be large enough to allow for maintenance; an internal diameter of at least 150 mm will allow access for cleaning. The size of the slots should allow a maximum hole velocity of 0.3 m/s, as for well screens. It is normal to pack the gallery pipe into a filter pack with material graded to limit soil migration. This filter pack is usually five times the d30 (ie, the size that 30 percent of the material is finer than) of the parent country. Typical groundwater flow rates into the galleries/wells are around 1.5–15 m/d (USEPA 2003a). For the design loading rates of 0.2–0.5 L/s/m, this requires a flow path between 3 m and 10 m wide. Maintenance requirements are usually very low. The very high surface area gives low surface loading rates, with little build-up of material on the soil-water interface. Normally, stream erosion is adequate to keep this surface sufficiently clear. Some galleries are fitted with air scour header pipes to blow air through the filter material. Care should be taken with this, as air bubbles that get trapped act as aquicludes, thus reducing the flow (or increasing the headloss) through the aquifer. Bank filtration can protect a river intake to a very high degree. There are several examples in New Zealand that achieve extremely good turbidity reduction, including the Opihi gallery in Timaru, which reduces from about 150 NTU to about 2 NTU under flood flows.
GUIDELINES FOR DRINKING-WATER QUALITY MANAGEMENT FOR NEW ZEALAND CHAPTER 12: TREATMENT PROCESSES, PRETREATMENT – MAY 2019 15
For further information about the advantages and disadvantages of this technique, site selection and aquifer requirements, design, construction and operational consideration, see USEPA (2006). Refer also to Chapter 4 of the review draft LT2ESWTR Toolbox Guidance Manual (USEPA 2009) which discusses issues related to bank filtration. Aqualinc (2014a) conducted a literature review of design features and performance of different types of infiltration galleries. The objectives were to: • to identify the cause of past gallery non-performance and failures • to determine possible solutions to the problems • to prepare a set of guidelines for design, construction, maintenance and operation
of galleries that will minimise the effects of the in-stream and riverbed environments.
Aqualinc (2014b) produced guidelines for those involved in the planning, appraisal, approval, funding, design, construction, operation and maintenance of intakes that use infiltration as a method to capture, control and distribute river water. The guide discusses the advantages and limitations of using infiltration galleries and provides the information to assist practitioners who decide whether, in given circumstances, infiltration galleries are appropriate. Water quality issues are not included.
12.3.2 Off-river storage Off-river raw water storage reservoirs are basins located between a water source (typically a river or stream) and the water treatment plant. They can range from an impoundment in a side valley, to a constructed lagoon system on the flat. They can overcome the problems of damming the main stream and its associated problems of higher costs, fish migration and perhaps even navigation. It may be possible to avoid taking water from rivers and streams when water quality is poor (eg, following heavy rainfall) in order to reduce risk and to prevent potential problems in subsequent treatment processes. Rather than operate a stop/start treatment plant with its associated uncertainty of continuous supply, it may be more convenient to use off-river storage. Holding pumped water in a side valley at a higher elevation may enable gravity-feeding the treatment plant, reducing peak power prices. Off-river storage can be helpful to ensure an adequate supply of raw water in situations where the run of stream flow is very low during dry periods. By decreasing the contamination of the raw water, the protozoal log credit requirement may be lower, and the amount of treatment required can possibly be reduced. For example, a stream or river typically may have a turbidity of 1–4 NTU, and if the raw water colour is low, chemical coagulation may not be needed. This means diatomaceous earth, slow sand, membrane, cartridge or bag filtration could provide a suitable one-step treatment. Alternatively, if the colour level does require chemical coagulation, a consistently low turbidity raw water should allow use of a direct filtration plant. However, in New Zealand conditions, it is not unusual for the turbidity in streams or rivers to exceed 50 NTU quite suddenly due to heavy rain in the catchment. If the
16 GUIDELINES FOR DRINKING-WATER QUALITY MANAGEMENT FOR NEW ZEALAND CHAPTER 12: TREATMENT PROCESSES, PRETREATMENT – MAY 2019
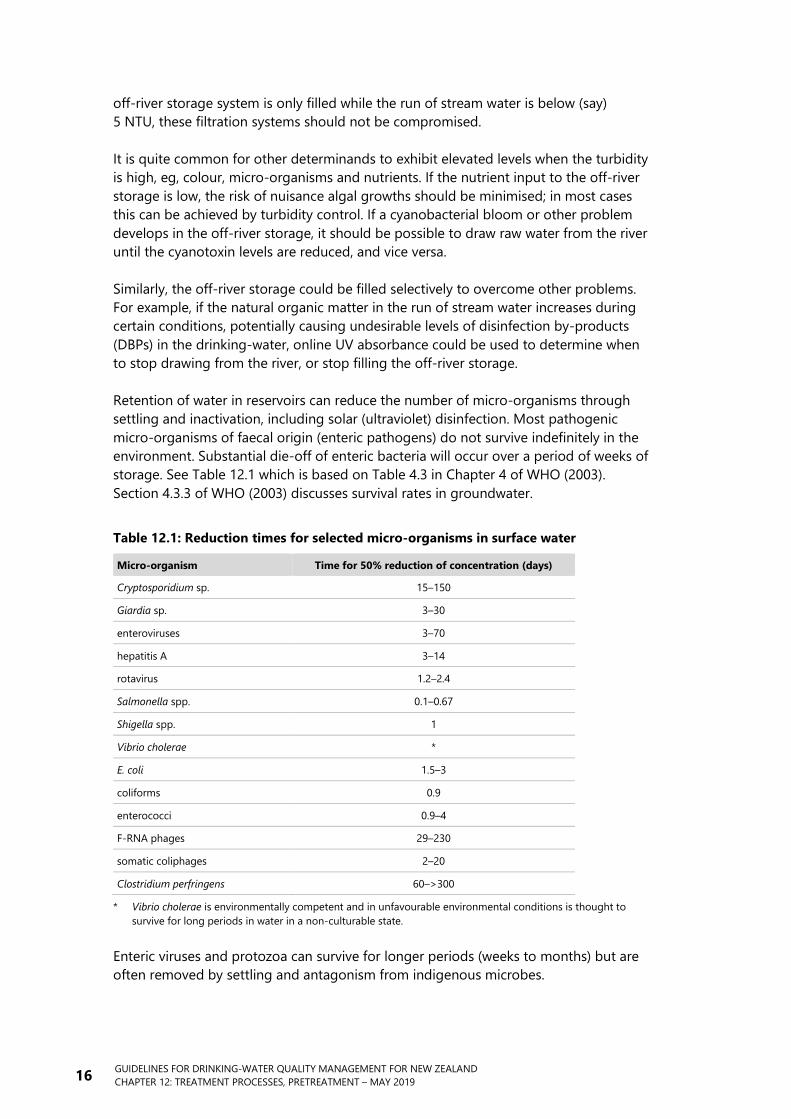
off-river storage system is only filled while the run of stream water is below (say) 5 NTU, these filtration systems should not be compromised. It is quite common for other determinands to exhibit elevated levels when the turbidity is high, eg, colour, micro-organisms and nutrients. If the nutrient input to the off-river storage is low, the risk of nuisance algal growths should be minimised; in most cases this can be achieved by turbidity control. If a cyanobacterial bloom or other problem develops in the off-river storage, it should be possible to draw raw water from the river until the cyanotoxin levels are reduced, and vice versa. Similarly, the off-river storage could be filled selectively to overcome other problems. For example, if the natural organic matter in the run of stream water increases during certain conditions, potentially causing undesirable levels of disinfection by-products (DBPs) in the drinking-water, online UV absorbance could be used to determine when to stop drawing from the river, or stop filling the off-river storage. Retention of water in reservoirs can reduce the number of micro-organisms through settling and inactivation, including solar (ultraviolet) disinfection. Most pathogenic micro-organisms of faecal origin (enteric pathogens) do not survive indefinitely in the environment. Substantial die-off of enteric bacteria will occur over a period of weeks of storage. See Table 12.1 which is based on Table 4.3 in Chapter 4 of WHO (2003). Section 4.3.3 of WHO (2003) discusses survival rates in groundwater.
Table 12.1: Reduction times for selected micro-organisms in surface water
Micro-organism Time for 50% reduction of concentration (days)
Cryptosporidium sp. 15–150
Giardia sp. 3–30
enteroviruses 3–70
hepatitis A 3–14
rotavirus 1.2–2.4
Salmonella spp. 0.1–0.67
Shigella spp. 1
Vibrio cholerae *
E. coli 1.5–3
coliforms 0.9
enterococci 0.9–4
F-RNA phages 29–230
somatic coliphages 2–20
Clostridium perfringens 60–>300
* Vibrio cholerae is environmentally competent and in unfavourable environmental conditions is thought to survive for long periods in water in a non-culturable state.
Enteric viruses and protozoa can survive for longer periods (weeks to months) but are often removed by settling and antagonism from indigenous microbes.
GUIDELINES FOR DRINKING-WATER QUALITY MANAGEMENT FOR NEW ZEALAND CHAPTER 12: TREATMENT PROCESSES, PRETREATMENT – MAY 2019 17
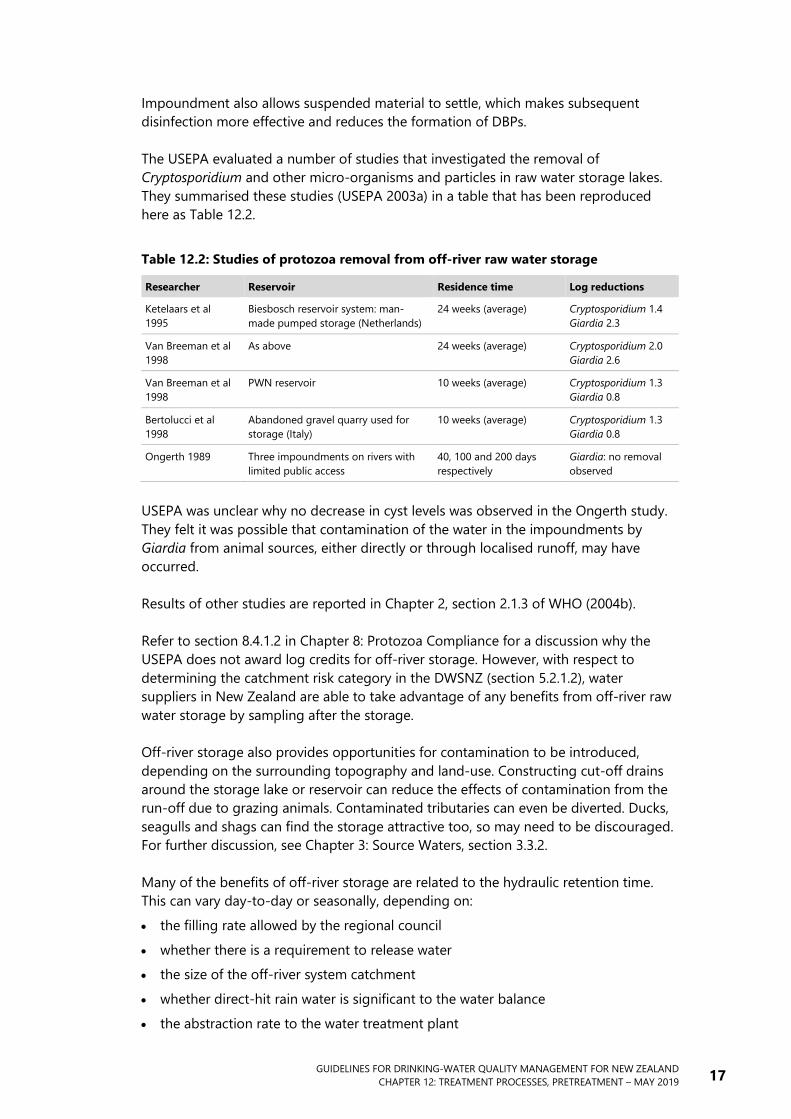
Impoundment also allows suspended material to settle, which makes subsequent disinfection more effective and reduces the formation of DBPs. The USEPA evaluated a number of studies that investigated the removal of Cryptosporidium and other micro-organisms and particles in raw water storage lakes. They summarised these studies (USEPA 2003a) in a table that has been reproduced here as Table 12.2.
Table 12.2: Studies of protozoa removal from off-river raw water storage
Researcher Reservoir Residence time Log reductions
Ketelaars et al 1995
Biesbosch reservoir system: man-made pumped storage (Netherlands)
24 weeks (average) Cryptosporidium 1.4 Giardia 2.3
Van Breeman et al 1998
As above 24 weeks (average) Cryptosporidium 2.0 Giardia 2.6
Van Breeman et al 1998
PWN reservoir 10 weeks (average) Cryptosporidium 1.3 Giardia 0.8
Bertolucci et al 1998
Abandoned gravel quarry used for storage (Italy)
10 weeks (average) Cryptosporidium 1.3 Giardia 0.8
Ongerth 1989 Three impoundments on rivers with limited public access
40, 100 and 200 days respectively
Giardia: no removal observed
USEPA was unclear why no decrease in cyst levels was observed in the Ongerth study. They felt it was possible that contamination of the water in the impoundments by Giardia from animal sources, either directly or through localised runoff, may have occurred. Results of other studies are reported in Chapter 2, section 2.1.3 of WHO (2004b). Refer to section 8.4.1.2 in Chapter 8: Protozoa Compliance for a discussion why the USEPA does not award log credits for off-river storage. However, with respect to determining the catchment risk category in the DWSNZ (section 5.2.1.2), water suppliers in New Zealand are able to take advantage of any benefits from off-river raw water storage by sampling after the storage. Off-river storage also provides opportunities for contamination to be introduced, depending on the surrounding topography and land-use. Constructing cut-off drains around the storage lake or reservoir can reduce the effects of contamination from the run-off due to grazing animals. Contaminated tributaries can even be diverted. Ducks, seagulls and shags can find the storage attractive too, so may need to be discouraged. For further discussion, see Chapter 3: Source Waters, section 3.3.2. Many of the benefits of off-river storage are related to the hydraulic retention time. This can vary day-to-day or seasonally, depending on: • the filling rate allowed by the regional council • whether there is a requirement to release water • the size of the off-river system catchment
• whether direct-hit rain water is significant to the water balance • the abstraction rate to the water treatment plant
18 GUIDELINES FOR DRINKING-WATER QUALITY MANAGEMENT FOR NEW ZEALAND CHAPTER 12: TREATMENT PROCESSES, PRETREATMENT – MAY 2019
• how much short-circuiting occurs (under different inflow and water level situations) • whether the lake stratifies (if it does, its effective retention time is greatly reduced) • whether stratification is broken down by artificial aeration. Management of lakes and reservoirs is discussed in chapter 3, section 3.3.2. See also NIWA (2012).
12.3.3 Presedimentation Presedimentation may be used to remove animals, floating macrophytes, gravel, sand, and other large or gritty or floating material from the source water, and to dampen particle loading to the rest of the treatment plant. Presedimentation is similar to conventional sedimentation, except that presedimentation may be operated at higher loading rates and may not involve use of chemical coagulants. Also, some water supplies operate the presedimentation process periodically and only in response to periods of high particle loading. Sometimes a presedimentation basin is no more than a pond that has been dug out between the intake and the water treatment plant. To enhance their performance, a coagulant is sometimes added, often crudely.
a) Presedimentation without coagulant Presedimentation without coagulant is simply settling the raw water before any treatment, thereby allowing heavier solids to drop out. It is more commonly used for river sources that are subject to very high solids loadings. It is particularly effective in removing or reducing coarse solids such as branches, gravels and sands. Without chemical aids such as coagulation, it is not effective at reducing fine silts, clays or organic materials. Presedimentation is usually carried out in a tank or small natural basin. The use of much larger basins can be called off-river storage (section 12.3.2). On its own, presedimentation involves installing a settlement device such as: • a clarifier tank with a sloping bottom, or
• a clarifier with a scraped bottom, or • a plate or tube settler. For any of these, the key loading feature is the overflow rate. This is the flow into the device divided by the plan area of the settlement surfaces. For a tank, this is simply the plan area of the tank; for tube and plate settlers, it is the total plan area of horizontal surfaces. To settle a particular kind of particle, the overflow rate must be no faster than the speed at which that particle falls. Because small particles tend to settle more slowly than large ones, the slower the overflow rate, the smaller the particles removed.
GUIDELINES FOR DRINKING-WATER QUALITY MANAGEMENT FOR NEW ZEALAND CHAPTER 12: TREATMENT PROCESSES, PRETREATMENT – MAY 2019 19
Clays and organic materials are very slow to settle and difficult to remove without chemical additives, such as coagulants, or by using very fine filtration such as membranes. Silts settle a little faster, but still very slowly. For example, 2 micron silt particles will settle at about 10 mm/h. If the flow into the tank is 100 m3/h, the area of the tank will have to be 100 divided by 0.01; ie, 10,000 m2, or three football fields! This can be speeded up significantly by coagulation. Alum floc particles typically settle at around 2 m/h. So, at the same flow rate, the area needed would be only 100 divided by 2, ie, only 50 m2. Sand settles faster than silt. For example, at 600 microns, it will fall at around 900 m/h. Using the same flow rate, the area required is only 100 divided by 900, ie, 0.11 m2. In practical terms, it is feasible to remove sands, difficult to reduce silts, and virtually impossible to remove clays and organics unless very large areas are used. Presedimentation without storage as well is not common in New Zealand. The few examples include Mt Grand water treatment plant in Dunedin, which has a parallel plate separator with a loading rate of around 10 m/h. This is being replaced with raw water off-river storage, primarily for an emergency supply, not as a settlement step. Reservoirs commonly cover very large areas, because it is usually uneconomical to make them deep. This means they are very effective as settlement devices. The settlement function of a raw water reservoir combines very well with its other purposes, such as mixing and emergency reserves. Again, the settlement achieved can be estimated from the plan area of the reservoir; the depth (provided it is enough to limit currents) is not important. To see why the depth does not matter, consider what happens if the depth is doubled. The particle now has to fall twice as far to fall to the floor, but it has twice as long to do it in. Why? Because the horizontal flow through is now half of the original speed. Therefore, depth does not matter.
b) Presedimentation with coagulant The USEPA (2003a) proposed in its draft LT2ESWTR to award a presumptive 0.5 log Cryptosporidium treatment credit for presedimentation that meets three criteria (refer to Chapter 8: Protozoa Compliance, section 8.4.1.3 Presedimentation (with coagulation) for details of the criteria). Calling this process presedimentation is a misnomer because the USEPA really considers this to be the sedimentation step in the coagulation, sedimentation, rapid gravity sand filtration process, ie, what the USEPA calls conventional full treatment, hardly a pretreatment process. Therefore presedimentation with coagulant is discussed in Chapter 13: Coagulation Processes.
20 GUIDELINES FOR DRINKING-WATER QUALITY MANAGEMENT FOR NEW ZEALAND CHAPTER 12: TREATMENT PROCESSES, PRETREATMENT – MAY 2019
12.3.4 Prefiltration Prefiltration is used to remove large solids from the raw water before it is treated. The process usually involves screens and the filtration process is purely mechanical; it is not chemically assisted. Section 12.3.6 discusses roughing filters. Prefiltration is often used at river and reservoir intakes, where a coarse screen prevents large solids that can block valves, such as fish, parts of trees and the like, from being taken in. The holes in the screen are usually 1–2 mm, although some are significantly coarser than this. Types of screens include: • fixed bar screen, usually with the bars vertical. These require raking from time to
time, often manually, sometimes automatically • fixed bar screen mounted on to the downstream face of the weir. These allow water
flowing over them to fall into the intake chamber inside the weir structure. If debris builds up against the screen and blocks it, the flow of the water tends to push it off again and back into the river. These screens are suitable only for small streams, because the weir has to carry the entire flow. They require very little maintenance
• fixed mesh screen. These are not very common, as the mesh is below the surface of the water and is therefore very difficult to get at and clean
• liftable mesh screen. These are often mounted on a steel frame and are quite heavy. Some are lifted by electric winch, others by a towrope off a vehicle. They are relatively common.
Most intake screens are sized based on a surface velocity of less than 0.15 m/s. Following this initial screening, prefiltration can be by:
1 Rotating drum screen, similar to those used in wastewater. These are not commonly used in water supplies. Their cost (both initial and operating) is high and they are not so much more effective as to warrant the expense.
2 Stepping screen. These resemble, and operate like, escalators. The solids are lifted out of the water by the steps and are washed off before the steps come around again to re-enter the water. They are more common than rotating drum screens and are often used to remove leaves and coarse algal material. An example can be found at Oamaru.
3 Washable disc filters. These comprise a stack of discs mounted one on top of the other, with the gaps between them set by bumps on the discs. The water passes through a hole in the middle of the rings. The gaps between the discs range from 100 microns, down to about 5 microns, which is still too big to capture micro-organisms, silts, clays or natural organic matter, so they do not qualify for protozoa log credits in the DWSNZ. For backwashing, they are unclamped to loosen them before the cleaning flow starts. They also need to be stripped down occasionally (six-monthly or yearly) and, for many applications, soaked in acid or caustic soda. They are very useful filters in many applications. Two of the commoner brands available in New Zealand are Amiad and Arkal, both from Israel. Some models are automatically or continuously cleaned.
GUIDELINES FOR DRINKING-WATER QUALITY MANAGEMENT FOR NEW ZEALAND CHAPTER 12: TREATMENT PROCESSES, PRETREATMENT – MAY 2019 21
4 Washable mobile media such as sand filters. These present a good barrier against a lot of particles, including quite small, turbidity-causing silts and clays. Typically, they act as the equivalent of about 10 micron filters. They are washed by air/water scour in the same way as conventional gravity rapid sand filters. They differ from normal rapid sand filters by having very high loading rates, too high to prevent floc from being sheared and passing through the sand. They do not qualify for protozoa log credits in DWSNZ.
Prefiltration is often used upstream of another process to reduce its load. For example, sand filters (single or multimedia) or 5 micron cartridge filters can be installed upstream of 1 micron cartridges being used for protozoa removal, or used to reduce the turbidity prior to a disinfection process.
12.3.5 Microstrainers Microstrainers are useful for removing algal cells and large protozoa such as Balantidium coli, but have no significant impact on bacteria or viruses (WHO 2004b). Several microstrainers were installed in New Zealand about 40–60 years ago. Some may still be operating. They may still be practical for some source waters. Microstrainers are revolving drum screens made of the finest stainless steel mesh available, with gaps as small as 23 microns. This size is regarded as adequate to remove lumps too big for chlorine to penetrate. Microstraining followed by chlorination therefore can ensure inactivation of bacteria and viruses. A microstrainer is typically a cylinder with mesh walls, revolving on its side about three-quarters immersed in water. The raw water enters through one end (the other is closed) and flows out through the mesh into the tank that contains it. The solids are caught on the inside surface of the mesh as the cylinder rotates. At the top of the rotation, they are washed off by high-pressure sprays from outside and collected in a trough mounted just above the inside water level. The difference between the inside and outside water levels, the so-called straining head, is around 40–60 mm. Washwater use is around 1.5–2.5 percent of flow through the plant. No chemicals are used and the washwater can usually be returned directly to a stream. The loading rate varies depending on mesh size and raw water quality, but is about 25–40 m/h through the total screen area. Microstrainers were installed at many sites in New Zealand in the 1960s and virtually all have since been replaced because they do not present an adequate barrier to protozoa such as Giardia and Cryptosporidium and do not remove colloidal matter. One plant operating in Dunedin is being replaced with a membrane plant, and there are several in private plants such as meat works.
22 GUIDELINES FOR DRINKING-WATER QUALITY MANAGEMENT FOR NEW ZEALAND CHAPTER 12: TREATMENT PROCESSES, PRETREATMENT – MAY 2019
Algae removal High populations of phytoplankton can cause problems with different types of water treatment. The numbers of cells per litre in eutrophic lakes can be so high that processes such as cartridge, membrane, diatomaceous earth or slow sand filters can block quickly and become uneconomic. Chemical coagulation plants can also be affected. During daylight hours, algae produce oxygen, creating bubbles that can cause the sludge blanket to rise and perhaps break up. The resultant floc carryover can put an excessive load on the filters. The algae can also grow on the sand beds, shortening filter runs. Some algae can be difficult to remove during backwash. Killing the algae with chlorine or ozone at the treatment plant could result in taste and odour problems as the organisms decay. Microstrainers can remove a large percentage of the cells without introducing excessive headloss. The drum speed can be increased if the algae begin to block the microfabric. The microfabric is available in a range of mesh sizes, from 23 microns to 65 microns. Laboratory trials can help select the most appropriate mesh. Between a third and a half of reservoir algae (about 700 cells per mL in a New Zealand raw water) have been removed by a 65 micron microstrainer. During trials for a new Auckland water source, about 90 percent of Waikato River phytoplankton were removed by a 23 micron microstrainer. On average, these organisms were a little larger than the reservoir species. Despite the high removal of phytoplankton, the turbidity did not decrease much, indicating that those phytoplankton did not contribute greatly to the turbidity measurement. In both cases, colonies and larger cells were removed more effectively than small cells.
12.3.6 Roughing filters According to the USEPA (2003a), roughing filtration is a technique used primarily in developing countries to remove solids from high turbidity source waters prior to treatment with slow sand filters. A roughing filter contains coarse media (typically rock or gravel) and is used to reduce turbidity levels before processes such as slow sand filtration, diatomaceous earth (DE) or membrane filtration. The American Water Works Association Research Foundation (AWWARF) has reviewed design variables for roughing filters (Collins et al 1994, quoted in WHO 2004b).
GUIDELINES FOR DRINKING-WATER QUALITY MANAGEMENT FOR NEW ZEALAND CHAPTER 12: TREATMENT PROCESSES, PRETREATMENT – MAY 2019 23
Typically, roughing filters consist of a series of sedimentation tanks filled with progressively smaller diameter media in the direction of the flow. The media can be gravel, plastic, crushed coconut, rice husks, or a similar locally available material. The flow direction in roughing filters can be either horizontal or vertical, and vertical roughing filters can be either upflow or downflow. The media in the tanks effectively reduce the vertical settling distance of particles to a distance of a few millimetres. As sediment builds on the media, it eventually sloughs off and begins to accumulate in the lower section, while simultaneously regenerating the upper portions of the filter. The filters require periodic cleaning to remove the collected silt. Originally it was thought that the USEPA would recommend a 0.5 protozoa log credit towards additional Cryptosporidium treatment requirements for roughing filters. However, after review of available literature, the USEPA was unable to identify design and implementation conditions for roughing filters that would provide reasonable assurance of consistently achieving a 0.5 log removal of oocysts. Hence roughing filters do not appear in the DWSNZ, so are not discussed in Chapter 8: Protozoa Compliance. Some research reported in USEPA (2003a) found that long filters (10 m) at low filtration rates (0.5 m/h) were capable of reducing high suspended solids concentrations (1000 mg/L TSS) down to less than 3 mg/L. Other studies found roughing filters were capable of reducing peak turbidities by 80 to 90 percent, and faecal coliforms by 77 to 89 percent. Roughing filters have their place as a form of pretreatment, especially for turbid or highly changeable river water.
References APHA, et al. 2005. Standard Methods for the Examination of Water and Wastewater (21st edition). Washington DC: American Public Health Association, American Water Works Association, and Water Environment Federation.
Aqualinc. 2014a. Infiltration Gallery Investigation. Aqualinc Research Ltd. Prepared for Marlborough District Council. Report No C14003/1. Envirolink Report 1402, 36 pp. March 2014. http://www.envirolink.govt.nz/Envirolink-reports/.
Aqualinc. 2014b. Infiltration Gallery Guidelines: Design, construction, operation and maintenance. Aqualinc Research Ltd. Prepared for Marlborough District Council. Report No C14003/2. Envirolink Report 1402, 34 pp. April 2014. http://www.envirolink.govt.nz/Envirolink-reports/.
Aqualinc. 2014b. Infiltration Gallery Guidelines: Design, construction, operation and maintenance. Aqualinc Research Ltd. Prepared for Marlborough District Council. Report No 14003/2. Envirolink Report 1402, 34 pp. http://www.envirolink.govt.nz/Envirolink-reports/.
AWWA. 1990. Water Quality and Treatment (4th edition). McGraw-Hill Inc.
24 GUIDELINES FOR DRINKING-WATER QUALITY MANAGEMENT FOR NEW ZEALAND CHAPTER 12: TREATMENT PROCESSES, PRETREATMENT – MAY 2019
Bertolucci G, Gilli G, Carraro E, et al. 1998. Influence of raw water storage on Giardia, Cryptosporidium and nematodes. Wat Sci Technol 37(2): 261–7.
Collins MR, et al. 1994. Evaluation of Roughing Filtration Design Variables. Denver, CO: American Water Works Association Research Foundation and the American Water Works Association.
Ketelaars H, Medema G, van Breemen L, et al. 1995. Occurrence of Cryptosporidium oocysts and Giardia cysts in the River Meuse and removal in the Biesbosch Reservoirs. Aqua 44: 108–11.
The New Zealand Ministry of Health’s Guides for drinking-water supplies can be accessed as Word documents on the Ministry of Health website: http://www.health.govt.nz/water then select publications and Water Safety Plans.
Ministry of Health. Public Health Risk Management Plan Guide PHRMP Ref. 1.1. Surface Water Abstraction – Rivers, Streams and Infiltration Galleries. Wellington: Ministry of Health.
Ministry of Health. Public Health Risk Management Plan Guide PHRMP Ref. P3. Treatment Processes – Pre-Treatment Storage. Wellington: Ministry of Health.
Ministry of Health. Public Health Risk Management Plan Guide PHRMP Ref. P4.3. Pre-oxidation. Wellington: Ministry of Health.
Ministry of Health. 2005. Drinking-water Standards for New Zealand 2005. Wellington: Ministry of Health.
NIWA. 2012. Guidelines for Artificial Lakes: Before construction, maintenance of new lakes and rehabilitation of degraded lakes. NIWA Client Report No: HAM2011-045. 177 pp. http://www.envirolink.govt.nz/Envirolink-tools/.
Ongerth J. 1989. Giardia cyst concentration in river water. J AWWA 81(9): 81–6.
Pang L. 2009. Microbial removal rates in subsurface media estimated from published studies of field experiments and large intact soil cores. J Environ Qual 38(4): 1531–59.
Sinton L. 1986. A Guide to Groundwater Sampling Techniques. National Water and Soil Conservation Authority, Water and Soil Miscellaneous Publication No. 99.
Sprenger C, et al. 2014. Removal of indigenous coliphages and enteric viruses during riverbank filtration from highly polluted river water in Delhi (India). Journal of Water and Health 12(2): 332–42. doi:10.2166/wh.2014.134.
Sundaram B, Feitz A, Caritat P de, et al. 2009. Groundwater Sampling and Analysis: A field guide. Commonwealth of Australia, Geoscience Australia, Record 2009/27, 95 pp. http://www.ga.gov.au/image_cache/GA15501.pdf.
USEPA. 2003a. Long Term 2 Enhanced Surface Water Treatment Rule; Proposed Rule. National Primary Drinking Water Regulations: 40 CFR Parts 141 and 142, 11 August. See Final Rule (2006).
USEPA. 2003b. Long Term 2 Enhanced Surface Water Treatment Rule: Toolbox Guidance Manual, Chapter 4: Bankside Filtration. Draft. EPA-815-D-03-009. Washington: United States Environmental Protection Agency. See USEPA (2009) for latest version.
GUIDELINES FOR DRINKING-WATER QUALITY MANAGEMENT FOR NEW ZEALAND CHAPTER 12: TREATMENT PROCESSES, PRETREATMENT – MAY 2019 25
USEPA. 2004. Protocol for Equipment Verification Testing of Volatile Organic Chemical Removal. Environmental Technology Verification Protocol (ETV). 04/9209/EPADWCTR. Prepared by NSF. 138 pp. http://www.epa.gov/etv/pubs/049209epadwctr.pdf.
USEPA. 2006. National Primary Drinking Water Regulations: Long Term 2 Enhanced Surface Water Treatment Rule: Final Rule. (LT2ESWTR). Federal Register Part II, 40 CFR Parts 9, 141 and 142. Washington: National Archives and Records Administration. See http://www.epa.gov/fedrgstr/EPA-WATER/2006/January/Day-05/w04a.pdf http://www.epa.gov/fedrgstr/EPA-WATER/2006/January/Day-05/w04b.pdf http://www.epa.gov/fedrgstr/EPA-WATER/2006/January/Day-05/w04c.pdf or go to http://www.epa.gov/lawsregs/rulesregs/sdwa/lt2/compliance.cfm.
USEPA. 2009. Long Term 2 Enhanced Surface Water Treatment Rule, Toolbox Guidance Manual Review Draft. Go into http://www.epa.gov/safewater/disinfection/lt2/ and then enter: toolbox guidance manual review draft in the ‘search’ box, or go to http://www.epa.gov/ogwdw/disinfection/lt2/pdfs/guide_lt2_lt2eswtr_toolboxgm_revdraft_060809.pdf.
USEPA. 2010. Long Term 2 Enhanced Surface Water Treatment Rule, Toolbox Guidance Manual. EPA-815-R-09-016. 375 pp. http://www.epa.gov/safewater/disinfection/lt2/pdfs/guide_lt2_toolboxguidancemanual.pdf.
Van Breemen L, Ketelaars H, Hoogenboezem W, et al. 1998. Storage reservoirs: a first barrier for pathogenic micro-organisms in The Netherlands. Water Science and Technology 37(2): 253–60.
WHO. 2003. Assessing Microbial Safety of Drinking-water: Improving approaches and methods. Published on behalf of the World Health Organization and the Organisation for Economic Co-operation and Development by IWA Publishing, London. Available at: http://www.who.int/water_sanitation_health/dwq/9241546301/en/index.html.
WHO. 2004a. Guidelines for Drinking-water Quality (3rd edition). Geneva: World Health Organization. Available at: www.who.int/water_sanitation_health/dwq/gdwq3/en/print.html see also the addenda.
WHO. 2004b. Water Treatment and Pathogen Control: Process efficiency in achieving safe drinking water. MW Le Chevallier, K-K Au (eds). ISBN: 1 84339 069 8. 123 pp. Published by IWA Publishing, London, UK. Available on the internet at: www.who.int/water_sanitation_health/publications/en/index.html.
WHO. 2011. Guidelines for Drinking-water Quality 2011 (4th edition). Geneva: World Health Organization. Available at: http://www.who.int/water_sanitation_health/publications/2011/dwq_guidelines/en/index.html.
WHO. 2017. Guidelines for Drinking-water Quality: Fourth edition incorporating the first Addendum. Geneva: World Health Organization. 631 pp. http://www.who.int/water_sanitation_health/publications/drinking-water-quality-guidelines-4-including-1st-addendum/en/.
WRF. 2014. Removal of Volatile Organic Contaminants via Low Profile Aeration Technology. 58 pp. http://www.waterrf.org/PublicReportLibrary/4439.pdf.