Embed Size (px)
Citation preview
Drink Without Waste Executive Summary
Why Drink Without Waste?A Hong Kong environmental group has estimated that 5.2 million plastic bottles are discarded in Hong Kong every day.1 The majority ends up in landfill, but many end up littering on land and in the ocean. Efforts by the Government, businesses and individuals to reduce consumption of single-use beverage packaging (SUBP) and to increase levels of recycling have had minimal impact. Changes in the regulations in Mainland China in the past year have made it harder to export recyclable materials for processing, leaving Hong Kong and many other territories considering how best to deal with recycling.
Recognising the need for a systemic and collaborative approach, in 2017 a group of concerned stakeholders including beverage producers, NGOs, retailers, think tanks, waste collectors and other corporates came together to form the Single-Use Beverage Packaging Working Group, with the aim of ensuring sustainable management of SUBP in Hong Kong. The initiative is called 'Drink Without Waste', and in early 2018 the Working Group commissioned a research report, of which this is the executive summary, to consult stakeholders and to assess the most effective means of achieving their aim.
For the purposes of the study, beverages are defined as 'non-alcoholic, non-dairy beverages sold in sealed containers within the Hong Kong market.'
The steps involved in the research were as follows:• Analysis of the Hong Kong beverage market and packaging management practices• Review of international best practice• Stakeholder engagement on sustainable beverage packaging management in Hong Kong• Economic, social and environmental assessment of two different potential scenarios
As Hong Kong's population and economy have grown, so too have levels of municipal solid waste (MSW) generation, which are now approaching 11,000 tonnes per day. High disposable incomes, a culture of convenience, as well as 60 million tourists passing through Hong Kong every year have led to an average daily MSW level per capita of over 2 kg per day.
Consumption of soft drink beverages has risen steadily over the same period, leading to an increase in disposal of the single-use PET bottles, liquid cartons, metal cans and glass bottles in which they are packaged, collectively single-use beverage packaging, or SUBP.
This document is the Executive Summary of the Drink without Waste Research Report issued by Deloitte. For details please refer to the full research report on https://www2.deloitte.com/content/dam/Deloitte/cn/Documents/risk/deloitte-cn-ra-drink-without-waste-en-181204.pdf.
Drink without waste executive summary | Why Drink Without Waste?
01
1 South China Morning Post. Hong Kong throws away 5.2 million bottles every single day – is it time to ban sale of the plastic disposables? (2017). http://www.scmp.com/news/hong-kong/health-environment/article/2116318/hong-kong-throws-away-52-million-bottles-every
What are the characteristics of Hong Kong's beverage market?
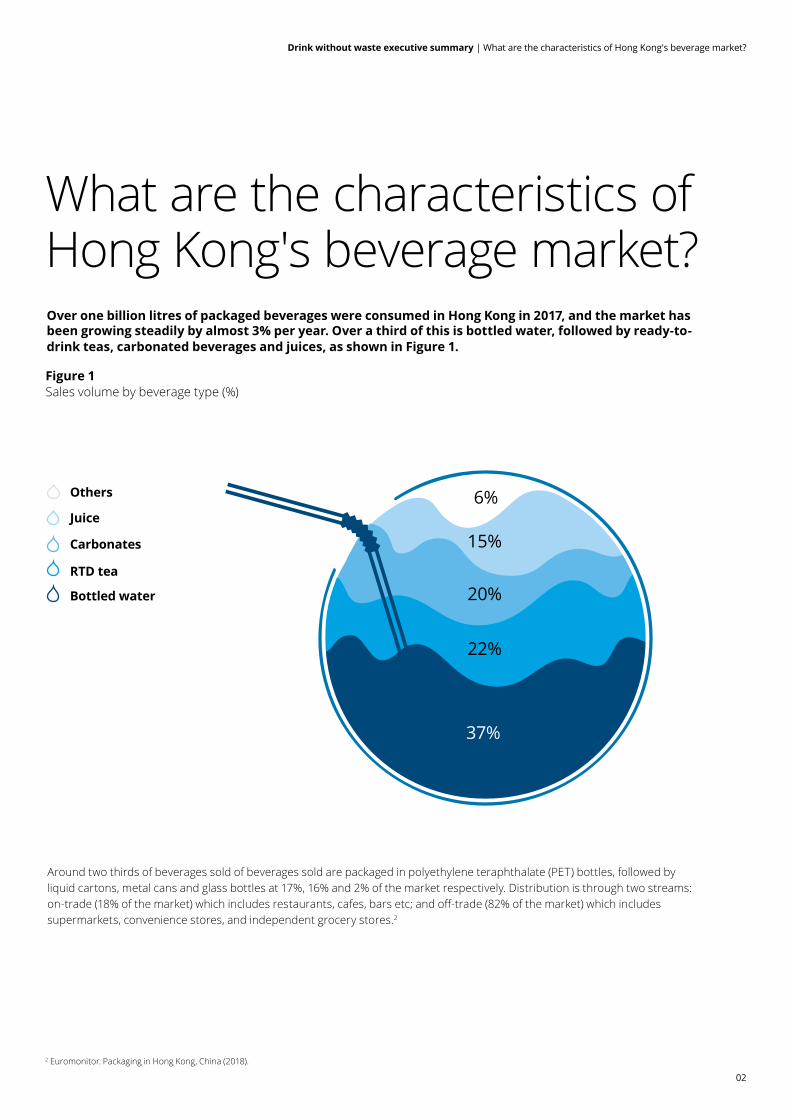
Figure 1Sales volume by beverage type (%)
Over one billion litres of packaged beverages were consumed in Hong Kong in 2017, and the market has been growing steadily by almost 3% per year. Over a third of this is bottled water, followed by ready-to-drink teas, carbonated beverages and juices, as shown in Figure 1.
Around two thirds of beverages sold of beverages sold are packaged in polyethylene teraphthalate (PET) bottles, followed by liquid cartons, metal cans and glass bottles at 17%, 16% and 2% of the market respectively. Distribution is through two streams: on-trade (18% of the market) which includes restaurants, cafes, bars etc; and off-trade (82% of the market) which includes supermarkets, convenience stores, and independent grocery stores.2
2 Euromonitor. Packaging in Hong Kong, China (2018).
6%
15%
20%
22%
37%
Carbonates
Juice
RTD tea
Others
Bottled water
Drink without waste executive summary | What are the characteristics of Hong Kong's beverage market?
02
Drink without waste executive summary | What are the characteristics of Hong Kong's beverage market?
03
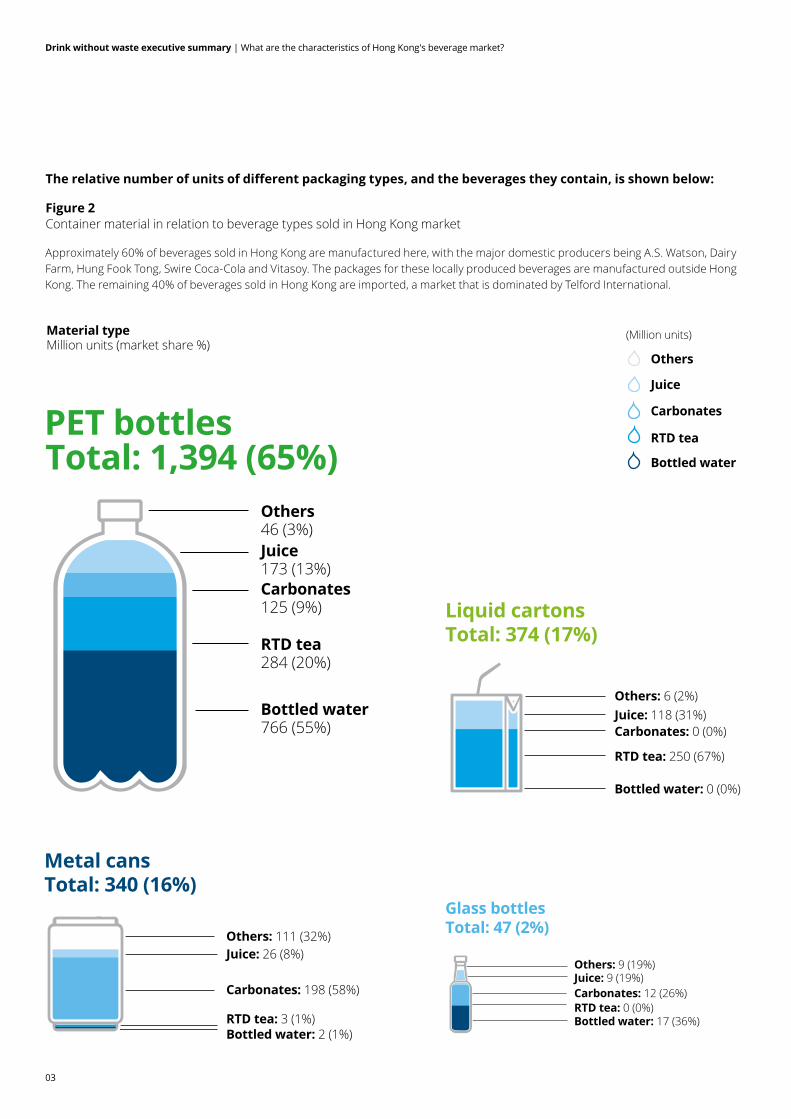
Liquid cartons Total: 374 (17%)
Bottled water: 0 (0%)
RTD tea: 250 (67%)
Carbonates: 0 (0%)Juice: 118 (31%)Others: 6 (2%)
Figure 2Container material in relation to beverage types sold in Hong Kong market
The relative number of units of different packaging types, and the beverages they contain, is shown below:
Approximately 60% of beverages sold in Hong Kong are manufactured here, with the major domestic producers being A.S. Watson, Dairy Farm, Hung Fook Tong, Swire Coca-Cola and Vitasoy. The packages for these locally produced beverages are manufactured outside Hong Kong. The remaining 40% of beverages sold in Hong Kong are imported, a market that is dominated by Telford International.
Material typeMillion units (market share %)
Carbonates
Juice
RTD tea
Others
Bottled water
(Million units)
Metal cansTotal: 340 (16%)
Bottled water: 2 (1%)RTD tea: 3 (1%)
Carbonates: 198 (58%)
Juice: 26 (8%)Others: 111 (32%)
Total: 1,394 (65%)PET bottles
Bottled water 766 (55%)
RTD tea284 (20%)
Carbonates 125 (9%)
Juice 173 (13%)
Others 46 (3%)
Glass bottlesTotal: 47 (2%)
Bottled water: 17 (36%)RTD tea: 0 (0%)Carbonates: 12 (26%) Juice: 9 (19%)Others: 9 (19%)

Drink without waste executive summary | How is beverage packaging waste currently managed?
Figure 3The upstream life cycle of a typical beverage package
The upstream life cycle of a typical beverage package is shown in the value chain below.
How is beverage packaging waste currently managed?The first step in sustainable management of SUBP is to avoid them entering the market in the first place, and various initiatives are underway in Hong Kong with this aim.
The Government maintains a network of over 2,000 drinking fountains in Government buildings, sports facilities and country parks. In 2017 they took a further step of banning the sale of small water bottles (less than 1 litre) in 1,500 vending machines in Government-owned venues. Various institutions and businesses such as universities, hotels and event organisers are also taking steps to reduce the number of SUBP used. Drinking water fountains can be found throughout Hong Kong airport and in various malls, while in September 2018 the MTR installed the first drinking fountain in one of their stations.
When it comes to post-consumer waste management, general refuse in Hong Kong is either collected by FEHD or private contractors, or disposed of by individuals or
businesses in refuse collection points or in public litter bins. Once collected it is taken to one of seven refuse transfer stations (RTSs) where it is compacted and then sent to landfill for final disposal. An incinerator, or integrated waste management facility (IWMF) is currently scheduled to be completed by 2024, after which around one third of Hong Kong's waste will be incinerated.3
Before the implementation of Mainland China's 'National Sword' policy, EPD estimated that recyclables collected constituted around 35% of the total MSW annually.4 Of these collected recyclables, 97% is believed to be exported to recyclers and re-processors in Mainland China and overseas, and hence there is no certainty as to whether they are recycled in a responsible manner. As Mainland China has tightened up their regulations relating to the import of contaminated recyclables, Hong Kong businesses are increasingly sending recyclable materials to other markets such as South East Asia.
3 The design capacity of the incinerator is 3,000 tonnes per day, although 10% by volume (20-30% by weight) will be produced as ash and be landfilled.4 EPD. Monitoring of Solid Waste in Hong Kong for 2016 (2017). https://www.wastereduction.gov.hk/sites/default/files/msw2016.pdf
04
Hon
On-trade
Off-trade
OverseasManufacture
of BottledDrinks
Productionof Packaged
Drinks
Import ofPackaged
Drinks
Raw Materials
OverseasManufacture of BeverageContainers Wholesale ConsumptionDistribution
Import of Preform
Containers
Import of Beverage Containers
Re-Export
Export
HONG KONG
05
Drink without waste executive summary | How is beverage packaging waste currently managed?
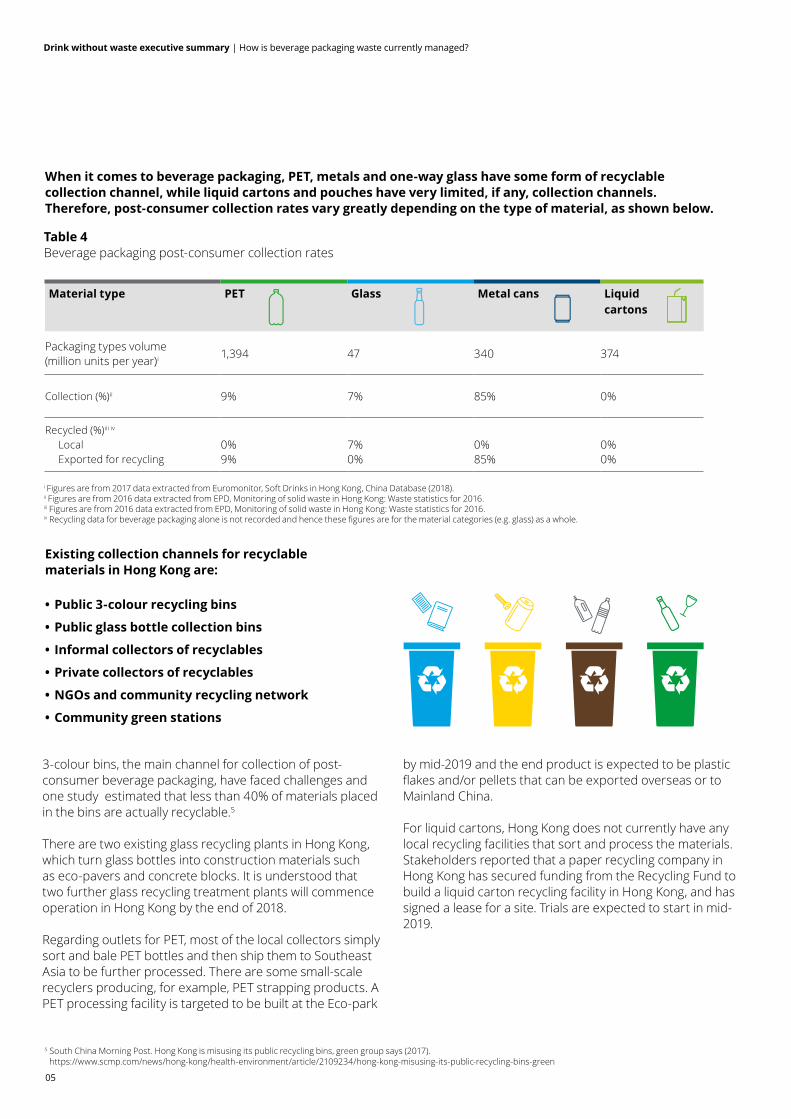
Table 4Beverage packaging post-consumer collection rates
When it comes to beverage packaging, PET, metals and one-way glass have some form of recyclable collection channel, while liquid cartons and pouches have very limited, if any, collection channels. Therefore, post-consumer collection rates vary greatly depending on the type of material, as shown below.
5 South China Morning Post. Hong Kong is misusing its public recycling bins, green group says (2017). https://www.scmp.com/news/hong-kong/health-environment/article/2109234/hong-kong-misusing-its-public-recycling-bins-green
Material type PET Glass Metal cans Liquid cartons
Packaging types volume(million units per year)i 1,394 47 340 374
Collection (%)ii 9% 7% 85% 0%
Recycled (%)iii iv
Local Exported for recycling
0%9%
7%0%
0%85%
0%0%
i Figures are from 2017 data extracted from Euromonitor, Soft Drinks in Hong Kong, China Database (2018).ii Figures are from 2016 data extracted from EPD, Monitoring of solid waste in Hong Kong: Waste statistics for 2016. iii Figures are from 2016 data extracted from EPD, Monitoring of solid waste in Hong Kong: Waste statistics for 2016. iv Recycling data for beverage packaging alone is not recorded and hence these figures are for the material categories (e.g. glass) as a whole.
3-colour bins, the main channel for collection of post-consumer beverage packaging, have faced challenges and one study estimated that less than 40% of materials placed in the bins are actually recyclable.5
There are two existing glass recycling plants in Hong Kong, which turn glass bottles into construction materials such as eco-pavers and concrete blocks. It is understood that two further glass recycling treatment plants will commence operation in Hong Kong by the end of 2018.
Regarding outlets for PET, most of the local collectors simply sort and bale PET bottles and then ship them to Southeast Asia to be further processed. There are some small-scale recyclers producing, for example, PET strapping products. A PET processing facility is targeted to be built at the Eco-park
by mid-2019 and the end product is expected to be plastic flakes and/or pellets that can be exported overseas or to Mainland China.
For liquid cartons, Hong Kong does not currently have any local recycling facilities that sort and process the materials. Stakeholders reported that a paper recycling company in Hong Kong has secured funding from the Recycling Fund to build a liquid carton recycling facility in Hong Kong, and has signed a lease for a site. Trials are expected to start in mid-2019.
Existing collection channels for recyclable materials in Hong Kong are:
• Public 3-colour recycling bins
• Public glass bottle collection bins
• Informal collectors of recyclables
• Private collectors of recyclables
• NGOs and community recycling network
• Community green stations
06
Is Hong Kong doing enough?
Metal cans have the highest collection rate of all beverage packages, and are typically exported to Mainland China for recycling.
Nascent processing and recycling businesses that actually recycle in Hong Kong (as opposed to collectors and aggregators who export the collected materials) encounter the challenge of securing sufficient feedstock to operate efficiently and economically.
Due to the low collection rates for beverage packaging (with the exception of metal cans) and other types of waste, Hong Kong Government is in the process of introducing a number of Producer Responsibility Schemes (PRSs). These schemes compel producers to take responsibility for the waste produced by packaging of their products, by paying for proper end-of-life management. As a first step, the Government introduced the Produce Eco-Responsibility Ordinance (PERO) in 2008, which is the foundational legal framework for all the current and planned PRSs in Hong Kong.
Hong Kong's first PRS, the plastic bag charge, was first introduced in 2009, while the Waste Electrical and Electronic Equipment (WEEE) PRS was introduced in August 2018. The first PRS for beverage packaging materials, the glass PRS, was approved by LegCo in 2016, and at the time of
writing implementation details were under review and due to be submitted to LegCo in late 2018. In early 2018, the Government announced an 18-month feasibility study for a PRS on plastic product containers, which includes PET beverage bottles. There has been speculation as to whether such a scheme might include a deposit return scheme (DRS) or other form of rebate but at the time of writing no firm details have been announced. As well as the planned PRSs for glass and plastics, the Government is also proposing to introduce a waste charging scheme at the end of 2019.
The plastic bag charge has been successful in diverting nearly 540 million plastic bags from landfill. However the various PRSs have attracted a degree of criticism. Firstly, stakeholders reported a lack of transparency over the level of levy collected, and how effectively the money is put to use for collecting and treating the regulated materials. Questions have been raised as to whether the relative responsibilities of different stakeholders are properly assigned. Under the current WEEE and glass PRSs, responsibility for collection rests solely with the contractor hired by the Government. If the collection rate is not achieved, only the contractor is penalised. The PERO and the various PRSs focus on the downstream part of the value chain (i.e. mostly collection) with little or no focus on upstream considerations, such as designing for recyclability.
In the last two decades, the Hong Kong Government has introduced a number of roadmaps setting out a vision and targets for reducing waste sent to landfill, the latest being the 'Hong Kong Blueprint for the Sustainable Use of Resources 2013-2022.' Meeting the targets set out in these roadmaps has proved challenging, largely due to the long time required to introduce new policies. For example, the glass PRS discussed above took almost a decade from early planning to start of implementation.
Hong Kong's waste management system has been largely designed around landfills, and infrastructure to feed waste into these landfills. According to stakeholders, it is not clear how the planned IWMF will fit in and contribute to a more holistic and sustainable waste management system. For business and citizens, it is much more difficult to recycle materials than it is to dispose of waste in the MSW system. Hong Kong has over 42,000 public refuse bins (a staggering one per 190 citizens) compared to only 2,800 3-colour recycling bins.
Further, there is a lack of a unified waste management structure. EPD is responsible for developing policies in relation to waste management and recycling, while FEHD is in charge of front-line waste and recyclables collection duties. EPD is however responsible for reporting on progress on
recycling targets even though progress is heavily dependent on FEHD. Some stakeholders consulted favoured a unified Waste Authority that would have overall responsibility for ensuring that the Government's own recycling targets are met.
To sum up, there has been slow progress in recycling policy and practice in Hong Kong over the last decade. In view of increased public concern about recycling in general, and post-consumer beverage packing in particular, coupled with the mainland Chinese ban on import of untreated recyclables, Hong Kong should quickly establish recycling facilities at scale within the territory if we are to ensure that post-consumer packaging waste is properly treated.
Drink without waste executive summary | Is Hong Kong doing enough?
07
Drink without waste executive summary | What are other places doing?
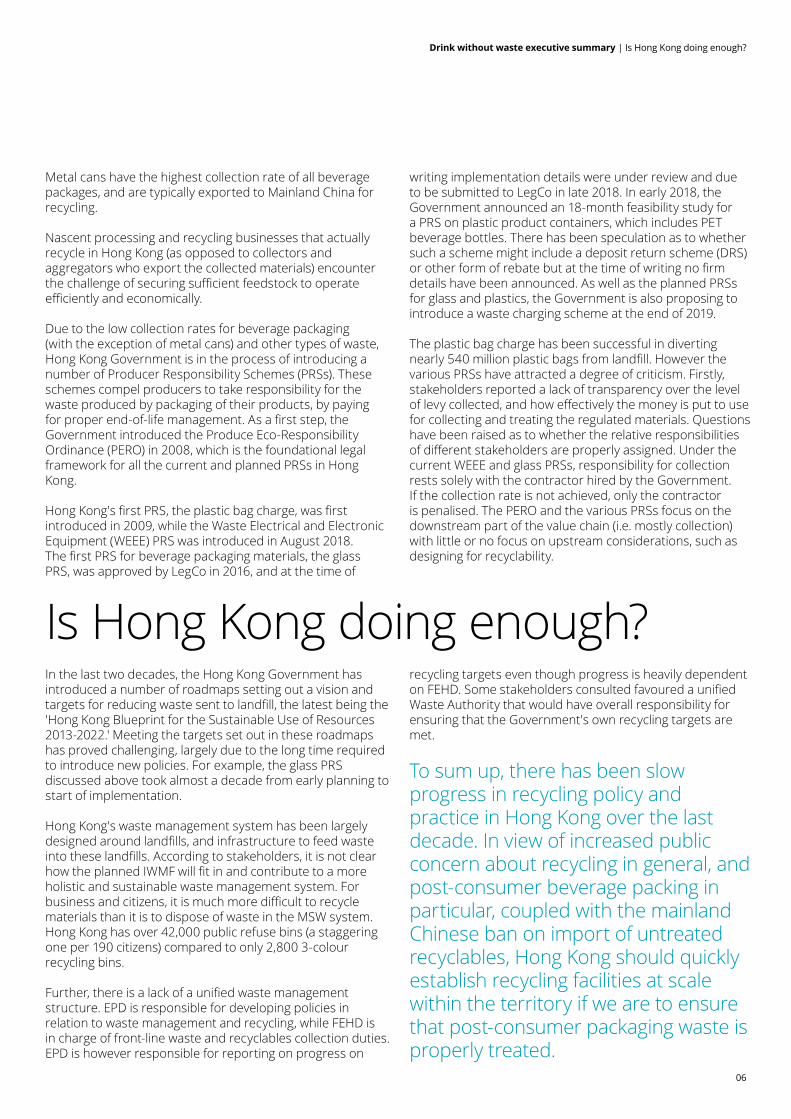
What are other places doing?As part of the research, a review was carried out of international best practice in sustainable packaging management. The table below provides an overview of the key characteristics of each selected five case studies in comparison to Hong Kong.
Category Hong Kong California1 Germany South Africa South Korea Taiwan2
MSW generated (kg/cap/day)
2.14 (2016)3 2.4 1.74 0.8 (2012)5 1.0 (2010)6 1.07
Recycling rate (%)8
PET
Liquid cartons
Aluminium
Glass
9 (2016)9 10
0 (2016)9 10
85 (2016)9 10 11
7 (2016)9 10
76 (2016)1
15 (2015)12
91 (2016)1
72 (2016)1
94 (2015)13
81 (2016)14
99 (2013)15
86 (2016)16
65 (2017)17
68 (2016)18
72 (2015)19
80 (2014)20
70-8021 22
N/A22
3622
7722
95 (2012)23
35 (2018)23
9 (2018)23
78 (2018)23
Avoidance measures
Partial bans
Table 5Key characteristics of each selected five case studies in comparison to Hong Kong
1 CalRecycle State of Recycling. State of Disposal and Recycling in California (2017). http://www.calrecycle.ca.gov/publications/Documents/1612/2017%20State%20of%20Recycling%20and%20Disposal%20Report_01612.pdf 2 EPA Waste Statistics. Official statistics at EPA website (2017). https://www.epa.gov.tw/site/epa/public/MMO/EnvStatistics/c4020.pdf3 EPD. Hong Kong Waste Statistics at a glance (2016). https://www.wastereduction.gov.hk/sites/default/files/msw2016_ataglance.pdf 4 Eurostat. Municipal waste by waste operations (2018). http://ec.europa.eu/eurostat/statistics-explained/index.php/Waste_statistics#Total_waste_generation5 OECD, Environmental Performance Reviews South Africa Highlights (2013). https://www.oecd.org/env/country-reviews/South%20Africa%20EPR%20[f]%20[lr].pdf 6 Ministry of Environment, Environmental Review (2015). http://eng.me.go.kr/web/board/read.do?pagerOffset=0&maxPageItems=10&maxIndexPages=10&searchKey=&searchValue=&menuId=30&orgCd=&boardId= 565930&boardMasterId=547&boardCategoryId=&decorator 7 EPA Waste Statistics. Official statistics at EPA website (2017). https://www.epa.gov.tw/site/epa/public/MMO/EnvStatistics/c4020.pdf8 Recycling is the terminology applied in overseas studies and sources, which is consistent with the industry norm.9 EPD. Monitoring of Solid Waste in Hong Kong for 2016 (2017). https://www.wastereduction.gov.hk/sites/default/files/msw2016.pdf10 Recycling rates for each type of packaging were estimated based on the disposal and recovery weights for PET, Tetra Pak, aluminium and glass presented in EPD's "Monitoring of Solid Waste in Hong Kong for 2016". For the purpose of this study, it is assumed that the recycling rates for each of these materials apply to the single-use beverage packaging.11 For the purpose of this study, aluminium cans were assumed as the predominant type amongst all metal cans. However, it is worth noting that RTD coffee was about 20% of all soft drinks consumed in metal cans. RTD coffee is generally filled in steel cans when it comes to metal packaging.12 Evok Innovations. Interview with M. Biddle, Managing Director at Evok Innovations (2018). 13 Eurostat. Municipal waste by waste operations (2018). http://ec.europa.eu/eurostat/statistics-explained/index.php/Waste_statistics#Total_waste_generation14 Der Grüne Punkt. EPR for Packaging in Germany (2017). https://www.grontpunkt.no/media/2866/2017-11-22-denison-dsd-oslo-final.pdf15 European Aluminium. Aluminium beverage can recycling at new record high (2016). https://european-aluminium.eu/media/1038/2016-01-21-european-aluminium-press-release-alubevcanrecycling_.pdf 16 Eurostat. Municipal waste by waste operations (2018). http://ec.europa.eu/eurostat/statistics-explained/index.php/Waste_statistics#Total_waste_generation17 PETCO. Interview with PETCO (April 2018).18 PRASA. South Africa’s paper recycling rate rises to 68.4% (2017). http://recyclepaper.co.za/south-africas-paper-recycling-rate-rises-to-68-4/ 19 Godfrey, L. & Oelofse, S. Historical Review of Waste Management and Recycling in South Africa (2017). http://www.mdpi.com/2079-9276/6/4/5720 GreenCape. Waste Economy – 2016 Market Intelligence Report (2016). https://www.greencape.co.za/assets/MIRs%202016/GreenCape-Waste-MIR-2016.pdf 21 Estimated as of the target from interview with Korea Environmental Corporation.22 KEKO. Interview with Korea Environmental Corporation (2018). 23 EPA. Interview with EPA (May 2018).
08
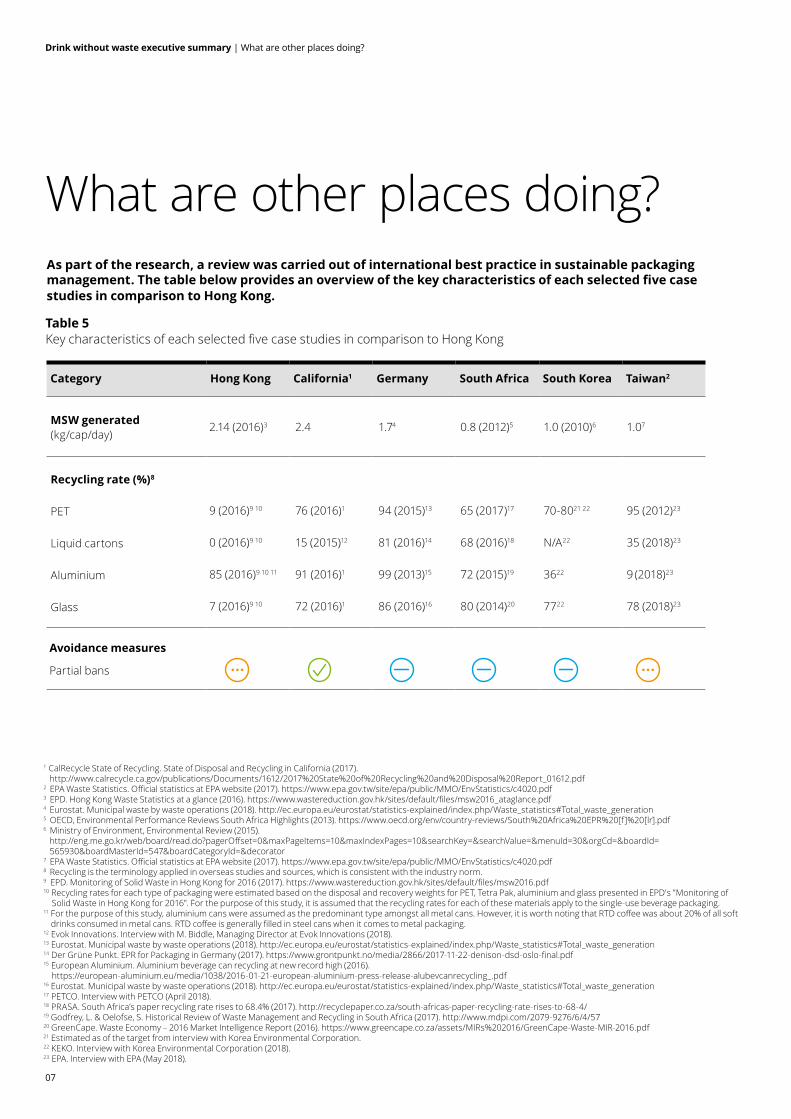
Category Hong Kong California1 Germany South Africa South Korea Taiwan2
Waste management system
EPR Industry
Organisational
Financial
Government-led
Voluntary
DRS
Manual
RVM
Other measures
Local recycling facility
Pay-as-you-throw scheme
Eco-design regulations
Landfill tax
Landfill ban
Legend Non-existent Nascent Intermediate Advanced
Drink without waste executive summary | What are other places doing?
09
Drink without waste executive summary | What are other places doing?
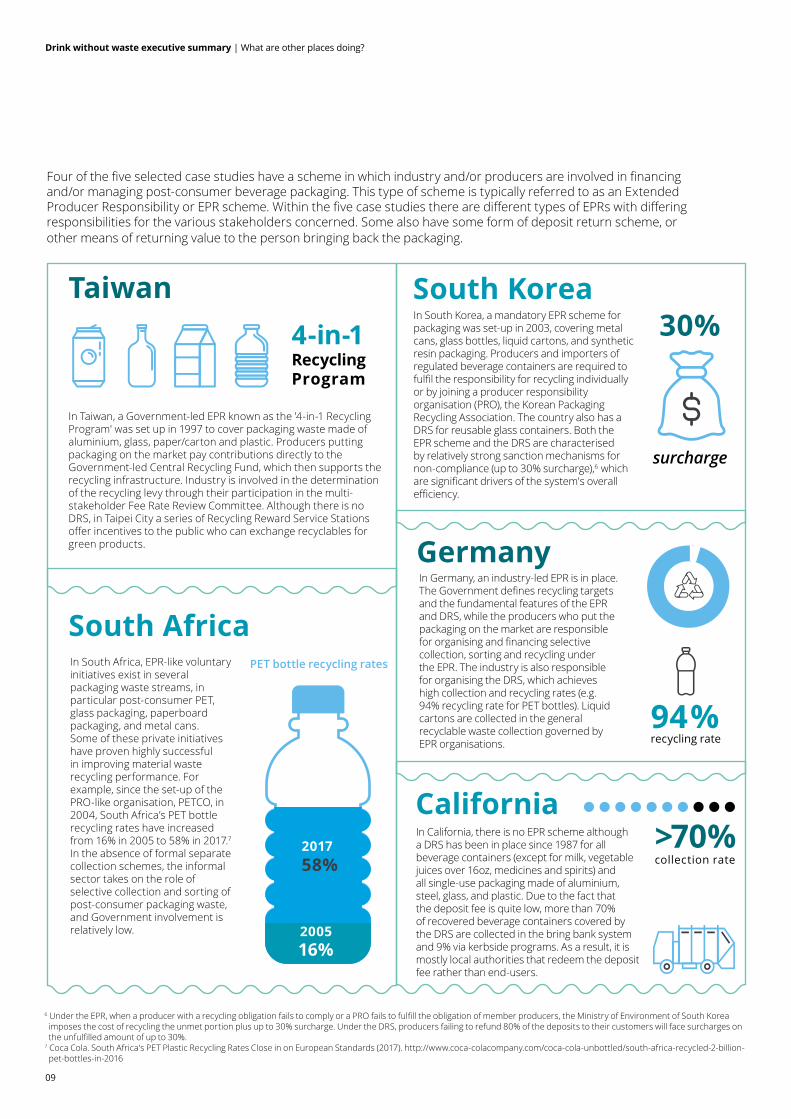
Four of the five selected case studies have a scheme in which industry and/or producers are involved in financing and/or managing post-consumer beverage packaging. This type of scheme is typically referred to as an Extended Producer Responsibility or EPR scheme. Within the five case studies there are different types of EPRs with differing responsibilities for the various stakeholders concerned. Some also have some form of deposit return scheme, or other means of returning value to the person bringing back the packaging.
6 Under the EPR, when a producer with a recycling obligation fails to comply or a PRO fails to fulfill the obligation of member producers, the Ministry of Environment of South Korea imposes the cost of recycling the unmet portion plus up to 30% surcharge. Under the DRS, producers failing to refund 80% of the deposits to their customers will face surcharges on the unfulfilled amount of up to 30%. 7 Coca Cola. South Africa's PET Plastic Recycling Rates Close in on European Standards (2017). http://www.coca-colacompany.com/coca-cola-unbottled/south-africa-recycled-2-billion- pet-bottles-in-2016
South Korea
Germany
California
Taiwan
South AfricaIn South Africa, EPR-like voluntary initiatives exist in several packaging waste streams, in particular post-consumer PET, glass packaging, paperboard packaging, and metal cans. Some of these private initiatives have proven highly successful in improving material waste recycling performance. For example, since the set-up of the PRO-like organisation, PETCO, in 2004, South Africa’s PET bottle recycling rates have increased from 16% in 2005 to 58% in 2017.7 In the absence of formal separate collection schemes, the informal sector takes on the role of selective collection and sorting of post-consumer packaging waste, and Government involvement is relatively low.
PET bottle recycling rates
In Taiwan, a Government-led EPR known as the '4-in-1 Recycling Program' was set up in 1997 to cover packaging waste made of aluminium, glass, paper/carton and plastic. Producers putting packaging on the market pay contributions directly to the Government-led Central Recycling Fund, which then supports the recycling infrastructure. Industry is involved in the determination of the recycling levy through their participation in the multi-stakeholder Fee Rate Review Committee. Although there is no DRS, in Taipei City a series of Recycling Reward Service Stations offer incentives to the public who can exchange recyclables for green products.
58%2017
200516%
surcharge
30%
94% recycling rate
4-in-1 RecyclingProgram
>70% collection rate
In Germany, an industry-led EPR is in place. The Government defines recycling targets and the fundamental features of the EPR and DRS, while the producers who put the packaging on the market are responsible for organising and financing selective collection, sorting and recycling under the EPR. The industry is also responsible for organising the DRS, which achieves high collection and recycling rates (e.g. 94% recycling rate for PET bottles). Liquid cartons are collected in the general recyclable waste collection governed by EPR organisations.
In South Korea, a mandatory EPR scheme for packaging was set-up in 2003, covering metal cans, glass bottles, liquid cartons, and synthetic resin packaging. Producers and importers of regulated beverage containers are required to fulfil the responsibility for recycling individually or by joining a producer responsibility organisation (PRO), the Korean Packaging Recycling Association. The country also has a DRS for reusable glass containers. Both the EPR scheme and the DRS are characterised by relatively strong sanction mechanisms for non-compliance (up to 30% surcharge),6 which are significant drivers of the system's overall efficiency.
In California, there is no EPR scheme although a DRS has been in place since 1987 for all beverage containers (except for milk, vegetable juices over 16oz, medicines and spirits) and all single-use packaging made of aluminium, steel, glass, and plastic. Due to the fact that the deposit fee is quite low, more than 70% of recovered beverage containers covered by the DRS are collected in the bring bank system and 9% via kerbside programs. As a result, it is mostly local authorities that redeem the deposit fee rather than end-users.
10
Drink without waste executive summary | What could Hong Kong do differently?
Reduction and avoidance activities, as well as eco-design of packaging, are increasingly seen throughout the world as well as in the selected case studies. However, most are limited in scope and many cover other single-use items but not beverage packaging. Of the five case studies, California has the most notable avoidance initiatives. Since the beginning of 2018, the sale of rigid plastic water bottles of 21 fluid ounces (620 ml) is banned in public buildings, at public outdoor events as well as for vendors selling beverages on San Francisco city streets. Further, since March 2017 the sale of water in any type of single-use packaging is banned at indoor and outdoor events on city property. Singapore, although not one of the selected case studies, has an interesting approach to eco-design. The Government introduced the voluntary Singapore Packaging Agreement in 2007, to encourage companies to sign up to reduce their packaging waste over a period of five years.
It can be seen from the case studies described above that for a territory to achieve high collection and recycling rates,
actions are required throughout the value chain, from design of packaging, through collection, recycling and end use, whilst also creating disincentives for disposing of waste to landfill or incineration.
The overall governance and administration of the scheme is important. A promising option for Hong Kong, taking account of market conditions and stakeholder views, is an industry-led EPR with close involvement of the Government in setting and enforcing targets as well as implementing regulations to cover aspects such as eco-design and inclusion of importers. Hong Kong has an opportunity to innovate and show global leadership in the extent and type of Government-industry partnership to tackle the issue of sustainable packaging management.8
Due to Mainland China's 'National Sword' policy, the global landscape of recycling is changing and it remains to be seen to what extent the approaches and metrics described above will change as a result.
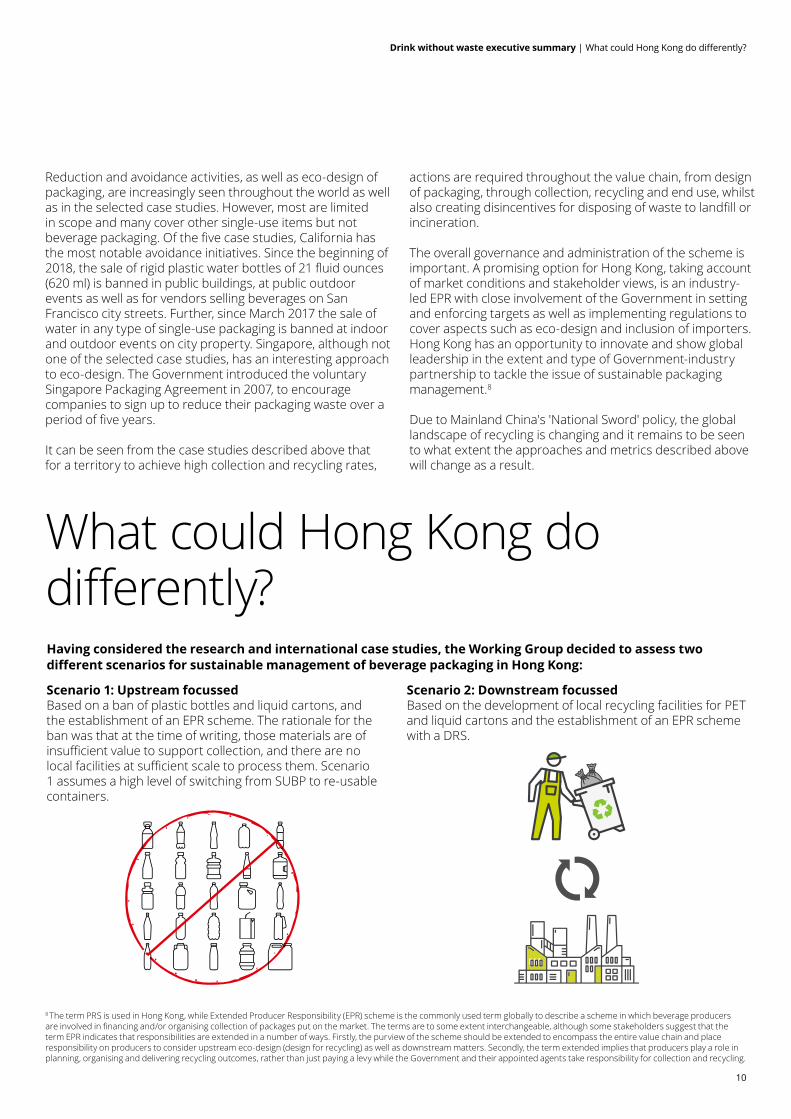
What could Hong Kong do differently?Having considered the research and international case studies, the Working Group decided to assess two different scenarios for sustainable management of beverage packaging in Hong Kong:
Scenario 1: Upstream focussed Based on a ban of plastic bottles and liquid cartons, and the establishment of an EPR scheme. The rationale for the ban was that at the time of writing, those materials are of insufficient value to support collection, and there are no local facilities at sufficient scale to process them. Scenario 1 assumes a high level of switching from SUBP to re-usable containers.
Scenario 2: Downstream focussed Based on the development of local recycling facilities for PET and liquid cartons and the establishment of an EPR scheme with a DRS.
8 The term PRS is used in Hong Kong, while Extended Producer Responsibility (EPR) scheme is the commonly used term globally to describe a scheme in which beverage producers are involved in financing and/or organising collection of packages put on the market. The terms are to some extent interchangeable, although some stakeholders suggest that the term EPR indicates that responsibilities are extended in a number of ways. Firstly, the purview of the scheme should be extended to encompass the entire value chain and place responsibility on producers to consider upstream eco-design (design for recycling) as well as downstream matters. Secondly, the term extended implies that producers play a role in planning, organising and delivering recycling outcomes, rather than just paying a levy while the Government and their appointed agents take responsibility for collection and recycling.
11
Drink without waste executive summary | What could Hong Kong do differently?
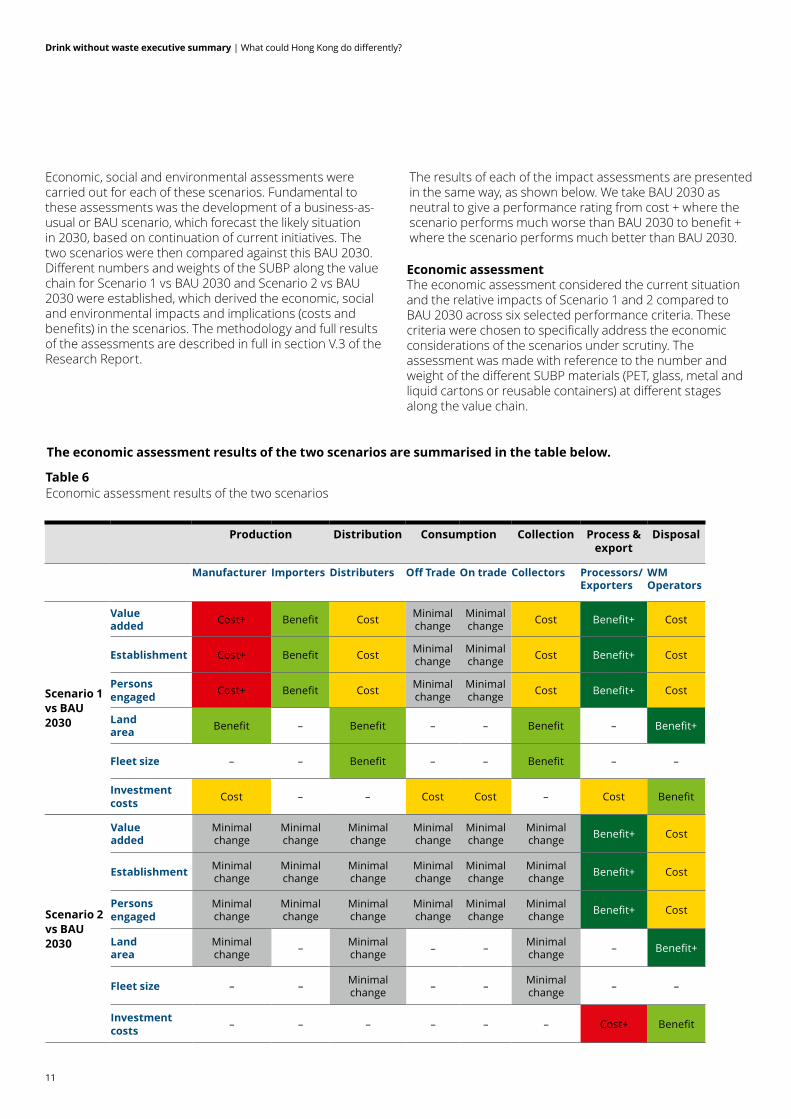
Economic, social and environmental assessments were carried out for each of these scenarios. Fundamental to these assessments was the development of a business-as-usual or BAU scenario, which forecast the likely situation in 2030, based on continuation of current initiatives. The two scenarios were then compared against this BAU 2030. Different numbers and weights of the SUBP along the value chain for Scenario 1 vs BAU 2030 and Scenario 2 vs BAU 2030 were established, which derived the economic, social and environmental impacts and implications (costs and benefits) in the scenarios. The methodology and full results of the assessments are described in full in section V.3 of the Research Report.
The results of each of the impact assessments are presented in the same way, as shown below. We take BAU 2030 as neutral to give a performance rating from cost + where the scenario performs much worse than BAU 2030 to benefit + where the scenario performs much better than BAU 2030.
Table 6Economic assessment results of the two scenarios
The economic assessment results of the two scenarios are summarised in the table below.
Production Distribution Consumption Collection Process & export
Disposal
Manufacturer Importers Distributers Off Trade On trade Collectors Processors/ Exporters
WM Operators
Scenario 1 vs BAU2030
Value added Cost+ Benefit Cost Minimal
changeMinimal change Cost Benefit+ Cost
Establishment Cost+ Benefit Cost Minimal change
Minimal change Cost Benefit+ Cost
Personsengaged Cost+ Benefit Cost Minimal
changeMinimal change Cost Benefit+ Cost
Land area Benefit – Benefit – – Benefit – Benefit+
Fleet size – – Benefit – – Benefit – –
Investmentcosts Cost – – Cost Cost – Cost Benefit
Economic assessmentThe economic assessment considered the current situation and the relative impacts of Scenario 1 and 2 compared to BAU 2030 across six selected performance criteria. These criteria were chosen to specifically address the economic considerations of the scenarios under scrutiny. The assessment was made with reference to the number and weight of the different SUBP materials (PET, glass, metal and liquid cartons or reusable containers) at different stages along the value chain.
Scenario 2 vs BAU2030
Value added
Minimal change
Minimal change
Minimal change
Minimal change
Minimal change
Minimal change Benefit+ Cost
Establishment Minimal change
Minimal change
Minimal change
Minimal change
Minimal change
Minimal change Benefit+ Cost
Personsengaged
Minimal change
Minimal change
Minimal change
Minimal change
Minimal change
Minimal change Benefit+ Cost
Land area
Minimal change – Minimal
change – – Minimal change – Benefit+
Fleet size – – Minimal change – – Minimal
change – –
Investmentcosts – – – – – – Cost+ Benefit
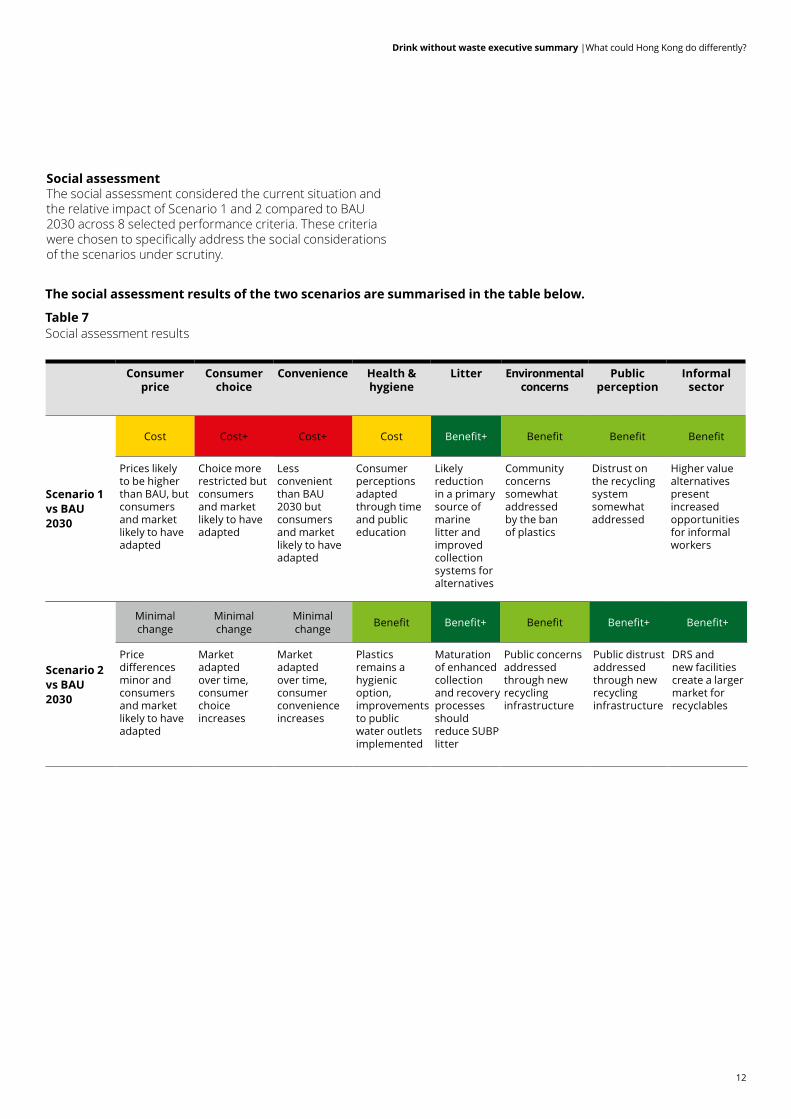
Social assessment The social assessment considered the current situation and the relative impact of Scenario 1 and 2 compared to BAU 2030 across 8 selected performance criteria. These criteria were chosen to specifically address the social considerations of the scenarios under scrutiny.
12
Drink without waste executive summary |What could Hong Kong do differently?
Table 7Social assessment results
Consumer price
Consumer choice
Convenience Health & hygiene
Litter Environmental concerns
Public perception
Informal sector
Scenario 1 vs BAU2030
Cost Cost+ Cost+ Cost Benefit+ Benefit Benefit Benefit
Prices likely to be higher than BAU, but consumers and market likely to have adapted
Choice more restricted but consumers and market likely to have adapted
Less convenient than BAU 2030 but consumers and market likely to have adapted
Consumer perceptions adapted through time and public education
Likely reduction in a primary source of marine litter and improved collection systems for alternatives
Community concerns somewhat addressed by the ban of plastics
Distrust on the recycling system somewhat addressed
Higher value alternatives present increased opportunities for informal workers
Scenario 2 vs BAU2030
Minimalchange
Minimalchange
Minimalchange Benefit Benefit+ Benefit Benefit+ Benefit+
Price differences minor and consumers and market likely to have adapted
Market adapted over time, consumer choice increases
Market adapted over time, consumer convenience increases
Plastics remains a hygienic option, improvements to public water outlets implemented
Maturation of enhanced collection and recovery processes should reduce SUBP litter
Public concerns addressed through new recycling infrastructure
Public distrust addressed through new recycling infrastructure
DRS and new facilities create a larger market for recyclables
The social assessment results of the two scenarios are summarised in the table below.
13
Drink without waste executive summary | What do these results mean?
What do these results mean?The above findings can be summarised as follows. The economic assessment found that Scenario 2 gives rise to a slight net benefit compared to the BAU 2030, whereas Scenario 1 gives rise to a slight net cost compared to BAU 2030. Scenario 2 was also found to bring a minimal impact to the majority of stakeholders along the value chain. As a result, it is reasonable to conclude that Scenario 2 performs marginally better than Scenario 1 in the economic assessment.
In the social assessment of Scenario 1, consumer choice, price and convenience were all negatively affected compared to the BAU 2030. Scenario 2, by contrast, was found to bring benefits or minimal changes in the majority of social assessment categories. As a result, it is reasonable to
conclude that Scenario 2 performs much better than Scenario 1 in terms of social considerations. The environmental assessment found that both scenarios yielded benefits compared to BAU 2030, but that in Scenario 1 the benefits were greater. As a result, it is reasonable to conclude that Scenario 1 performs marginally better than Scenario 2 in terms of environmental considerations.
Considering all three assessments together, Scenario 2 performs better than Scenario 1. If a greater degree of avoidance, eco-design and materials switching were incorporated into Scenario 2, then the environmental performance would be improved. The following section outlines the key steps required to achieve this.
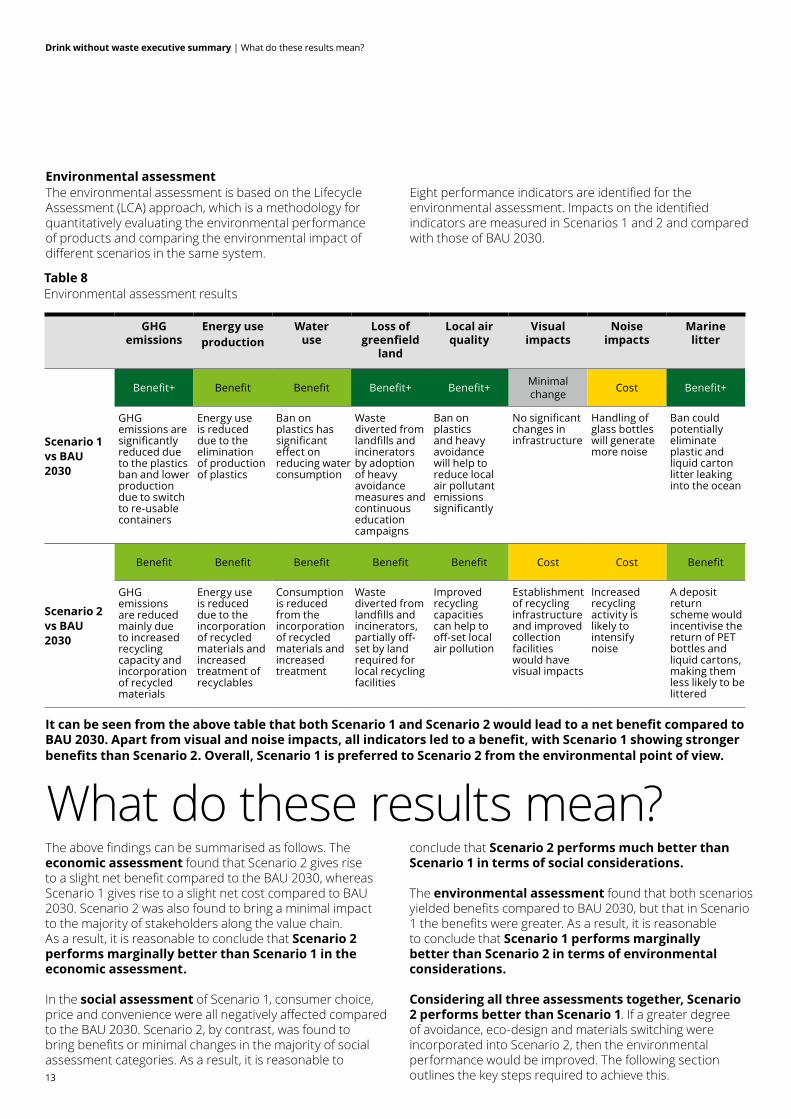
Table 8Environmental assessment results
GHG emissions
Energy use production
Wateruse
Loss of greenfield
land
Local air quality
Visual impacts
Noise impacts
Marine litter
Scenario 1 vs BAU2030
Benefit+ Benefit Benefit Benefit+ Benefit+ Minimalchange Cost Benefit+
GHG emissions are significantly reduced due to the plastics ban and lower production due to switch to re-usable containers
Energy use is reduced due to the elimination of production of plastics
Ban on plastics has significant effect on reducing water consumption
Waste diverted from landfills and incinerators by adoption of heavy avoidance measures and continuous education campaigns
Ban on plastics and heavy avoidance will help to reduce local air pollutant emissions significantly
No significant changes in infrastructure
Handling of glass bottles will generate more noise
Ban could potentially eliminate plastic and liquid carton litter leaking into the ocean
It can be seen from the above table that both Scenario 1 and Scenario 2 would lead to a net benefit compared to BAU 2030. Apart from visual and noise impacts, all indicators led to a benefit, with Scenario 1 showing stronger benefits than Scenario 2. Overall, Scenario 1 is preferred to Scenario 2 from the environmental point of view.
Scenario 2 vs BAU2030
Benefit Benefit Benefit Benefit Benefit Cost Cost Benefit
GHG emissions are reduced mainly due to increased recycling capacity and incorporation of recycled materials
Energy use is reduced due to the incorporation of recycled materials and increased treatment of recyclables
Consumption is reduced from the incorporation of recycled materials and increased treatment
Waste diverted from landfills and incinerators, partially off-set by land required for local recycling facilities
Improved recycling capacities can help to off-set local air pollution
Establishment of recycling infrastructure and improved collection facilities would have visual impacts
Increased recycling activity is likely to intensify noise
A deposit return scheme would incentivise the return of PET bottles and liquid cartons, making them less likely to be littered
Environmental assessmentThe environmental assessment is based on the Lifecycle Assessment (LCA) approach, which is a methodology for quantitatively evaluating the environmental performance of products and comparing the environmental impact of different scenarios in the same system.
Eight performance indicators are identified for the environmental assessment. Impacts on the identified indicators are measured in Scenarios 1 and 2 and compared with those of BAU 2030.
•
Extended producer responsibility scheme • Our research shows that different types of EPR can be successful, from Government-led, industry-led, voluntary, etc. • Government should consider allowing industry to be more proactively involved in the scheme and to embrace truly extended producer responsibility in the forthcoming plastic PRS legislation.• A similar scheme for liquid cartons (whether PRS or EPR) should be introduced or at least announced concurrently with the plastics scheme in order to avoid material switching for levy evasion.
14
Drink without waste executive summary | Way forward
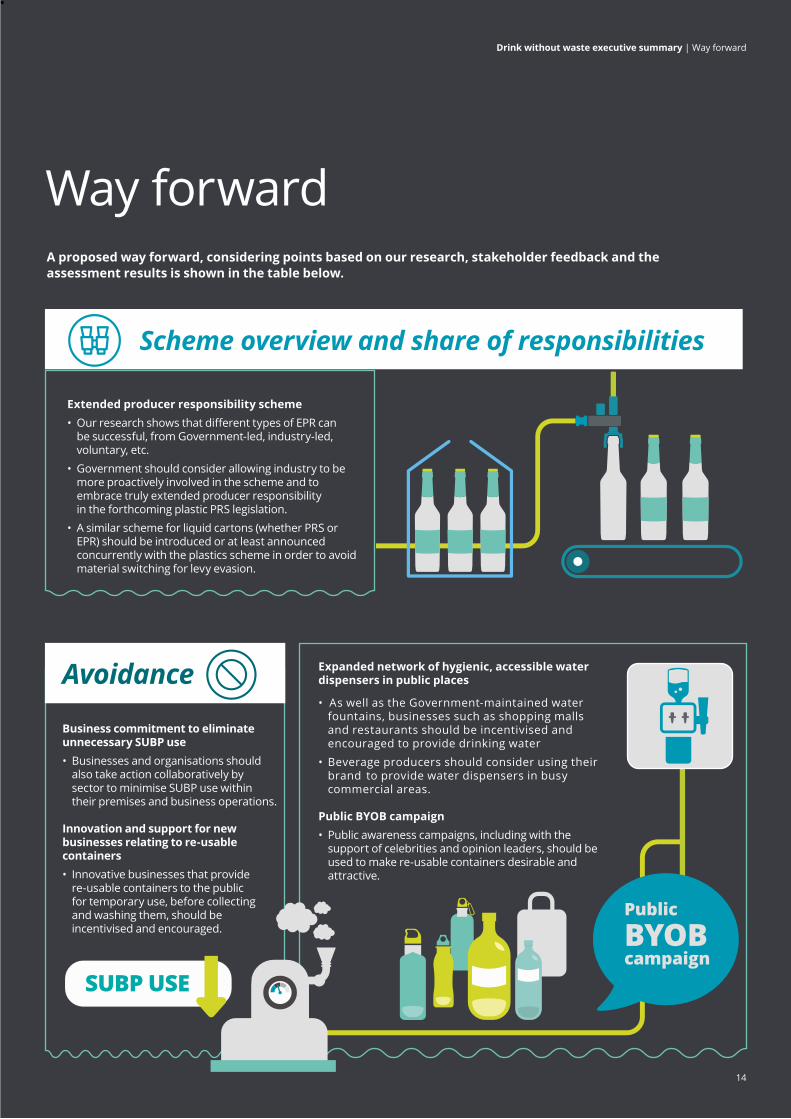
Way forwardA proposed way forward, considering points based on our research, stakeholder feedback and the assessment results is shown in the table below.
Expanded network of hygienic, accessible water dispensers in public places
• As well as the Government-maintained water fountains, businesses such as shopping malls and restaurants should be incentivised and encouraged to provide drinking water• Beverage producers should consider using their brand to provide water dispensers in busy commercial areas.
Public BYOB campaign • Public awareness campaigns, including with the support of celebrities and opinion leaders, should be used to make re-usable containers desirable and attractive.
Scheme overview and share of responsibilities
Business commitment to eliminate unnecessary SUBP use• Businesses and organisations should also take action collaboratively by sector to minimise SUBP use within their premises and business operations. Innovation and support for new businesses relating to re-usable containers• Innovative businesses that provide re-usable containers to the public for temporary use, before collecting and washing them, should be incentivised and encouraged.
Avoidance
SUBP USE
PublicBYOBcampaign
•
15
Drink without waste executive summary | Way forward
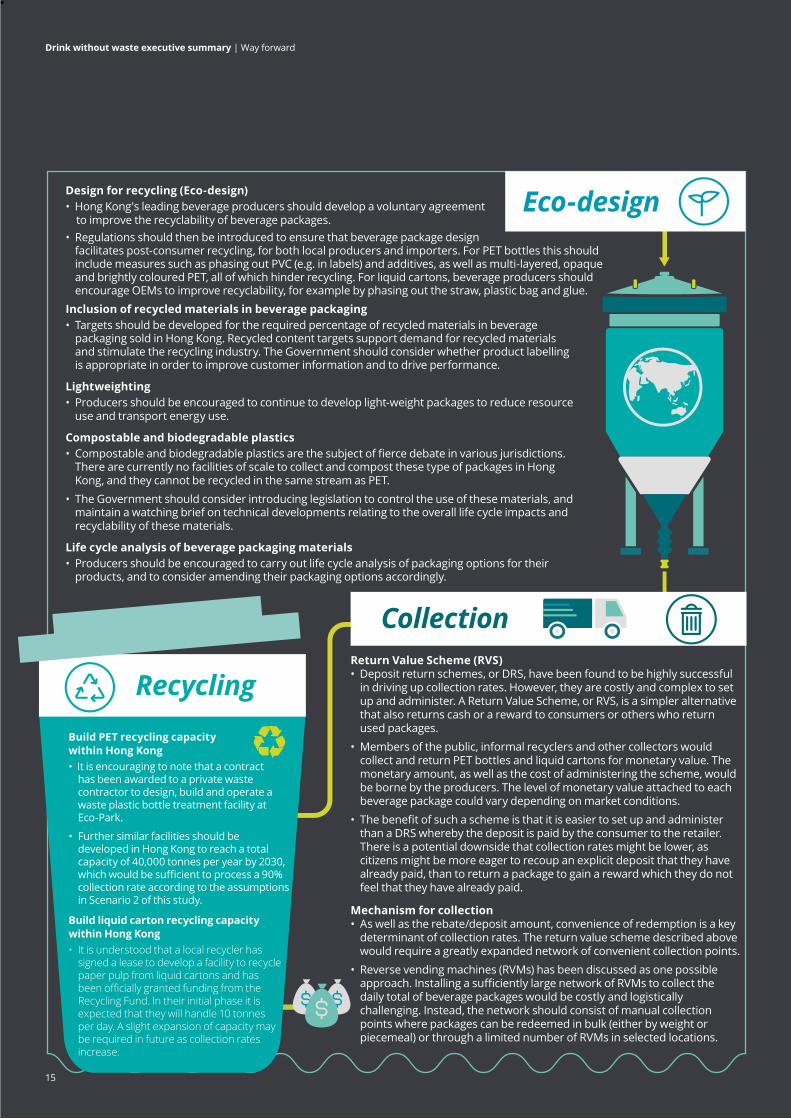
Design for recycling (Eco-design)• Hong Kong's leading beverage producers should develop a voluntary agreement to improve the recyclability of beverage packages. • Regulations should then be introduced to ensure that beverage package design facilitates post-consumer recycling, for both local producers and importers. For PET bottles this should include measures such as phasing out PVC (e.g. in labels) and additives, as well as multi-layered, opaque and brightly coloured PET, all of which hinder recycling. For liquid cartons, beverage producers should encourage OEMs to improve recyclability, for example by phasing out the straw, plastic bag and glue.
Return Value Scheme (RVS)• Deposit return schemes, or DRS, have been found to be highly successful in driving up collection rates. However, they are costly and complex to set up and administer. A Return Value Scheme, or RVS, is a simpler alternative that also returns cash or a reward to consumers or others who return used packages. • Members of the public, informal recyclers and other collectors would collect and return PET bottles and liquid cartons for monetary value. The monetary amount, as well as the cost of administering the scheme, would be borne by the producers. The level of monetary value attached to each beverage package could vary depending on market conditions. • The benefit of such a scheme is that it is easier to set up and administer than a DRS whereby the deposit is paid by the consumer to the retailer. There is a potential downside that collection rates might be lower, as citizens might be more eager to recoup an explicit deposit that they have already paid, than to return a package to gain a reward which they do not feel that they have already paid.
Mechanism for collection• As well as the rebate/deposit amount, convenience of redemption is a key determinant of collection rates. The return value scheme described above would require a greatly expanded network of convenient collection points.• Reverse vending machines (RVMs) has been discussed as one possible approach. Installing a sufficiently large network of RVMs to collect the daily total of beverage packages would be costly and logistically challenging. Instead, the network should consist of manual collection points where packages can be redeemed in bulk (either by weight or piecemeal) or through a limited number of RVMs in selected locations.
Eco-design
Build PET recycling capacity within Hong Kong• It is encouraging to note that a contract has been awarded to a private waste contractor to design, build and operate a waste plastic bottle treatment facility at Eco-Park.
• Further similar facilities should be developed in Hong Kong to reach a total capacity of 40,000 tonnes per year by 2030, which would be sufficient to process a 90% collection rate according to the assumptions in Scenario 2 of this study.
Build liquid carton recycling capacity within Hong Kong• It is understood that a local recycler has signed a lease to develop a facility to recycle paper pulp from liquid cartons and has been officially granted funding from the Recycling Fund. In their initial phase it is expected that they will handle 10 tonnes per day. A slight expansion of capacity may be required in future as collection rates increase.
Recycling
Inclusion of recycled materials in beverage packaging• Targets should be developed for the required percentage of recycled materials in beverage packaging sold in Hong Kong. Recycled content targets support demand for recycled materials and stimulate the recycling industry. The Government should consider whether product labelling is appropriate in order to improve customer information and to drive performance.
Lightweighting• Producers should be encouraged to continue to develop light-weight packages to reduce resource use and transport energy use. Compostable and biodegradable plastics• Compostable and biodegradable plastics are the subject of fierce debate in various jurisdictions. There are currently no facilities of scale to collect and compost these type of packages in Hong Kong, and they cannot be recycled in the same stream as PET. • The Government should consider introducing legislation to control the use of these materials, and maintain a watching brief on technical developments relating to the overall life cycle impacts and recyclability of these materials. Life cycle analysis of beverage packaging materials• Producers should be encouraged to carry out life cycle analysis of packaging options for their products, and to consider amending their packaging options accordingly.
Collection
•
16
Drink without waste executive summary | Conclusion
In conclusion, many of the observations in this section relate to projects or activities that are already on-going or under planning in Hong Kong. The systemic nature and complex value chain dependencies of beverage packaging management require close co-ordination of all related parties. Hong Kong has the opportunity to innovate in developing a world-leading collaboration between industry and Government in solving these challenges. Key to the successful delivery of the above points is on-going management and monitoring of the various required activities in a programmatic and pragmatic manner. The Drink Without Waste Working Group, in collaboration with the Government, is ideally placed to perform this function. Beyond packaging management and
considering other waste and recycling streams, the Government should also assess whether there is a need for a unified body, such as a Waste Authority, to oversee the whole value chain from design through to recycling.
Barely a day goes by without news coverage of single-use plastic reductions, improved beverage packing management and circular economy. In the same quarter as this research report was launched, the European Parliament voted for a complete ban on a range of single-use plastics, and called for a reduction in single-use plastic for food and drink containers. Hong Kong businesses, NGOs and citizens aspire to be at the leading edge of this trend towards sustainable beverage packaging management, as befits our status as Asia's World City.
Note to reader
This Executive Summary of the Drink Without Waste Research Report (the "Executive Summary") is solely prepared for the purpose set forth in the engagement letter dated 11 January 2018 in relation to services on the management of single-use beverage packaging in Hong Kong between Deloitte Advisory (Hong Kong) Limited and ADM Capital Foundation (the "Company") and is not to be used for any other purposes and/or by any other person or entity. This Executive Summary does not include any representation as to the quality or performance of the Company's goods or services nor their fitness or suitability for any customer-intended purpose. Also, this Executive Summary does not include any assurance of information and data presented.
No other person or entity is entitled to rely, in any manner, or for any purpose, on this Executive Summary. We do not assume responsibility towards or accept liability to any other person for the contents of this Executive Summary. For the avoidance of doubt, all duties and liabilities (including without limitation, those arising from negligence or otherwise) to any third parties are specifically disclaimed.
About Deloitte Global Deloitte refers to one or more of Deloitte Touche Tohmatsu Limited, a UK private company limited by guarantee (“DTTL”), its network of member firms, and their related entities. DTTL and each of its member firms are legally separate and independent entities. DTTL (also referred to as “Deloitte Global”) does not provide services to clients. Please see www.deloitte.com/about to learn more about our global network of member firms.
Deloitte provides audit & assurance, consulting, financial advisory, risk advisory, tax and related services to public and private clients spanning multiple industries. Deloitte serves over 80 percent of the Fortune Global 500® companies through a globally connected network of member firms in more than 150 countries and territories bringing world-class capabilities, insights, and high-quality service to address clients’ most complex business challenges. To learn more about how Deloitte’s approximately 286,000 professionals make an impact that matters, please connect with us on Facebook, LinkedIn, or Twitter.
About Deloitte ChinaThe Deloitte brand first came to China in 1917 when a Deloitte office was opened in Shanghai. Now the Deloitte China network of firms, backed by the global Deloitte network, deliver a full range of audit & assurance, consulting, financial advisory, risk advisory and tax services to local, multinational and growth enterprise clients in China. We have considerable experience in China and have been a significant contributor to the development of China's accounting standards, taxation system and local professional accountants. To learn more about how Deloitte makes an impact that matters in the China marketplace, please connect with our Deloitte China social media platforms via www2.deloitte.com/cn/en/social-media.
This communication contains general information only, and none of Deloitte Touche Tohmatsu Limited, its member firms, or their related entities (collectively the “Deloitte Network”) is by means of this communication, rendering professional advice or services. Before making any decision or taking any action that may affect your finances or your business, you should consult a qualified professional adviser. No entity in the Deloitte Network shall be responsible for any loss whatsoever sustained by any person who relies on this communication.
©2018. For information, contact Deloitte China.HK-050ENG-18
About Cistri LimitedCistri Limited is an independent urban development consultancy firm providing multi-disciplinary advice in the fields of urban and property economics, master planning, urban and landscape design from our offices in Hong Kong and Singapore.
Our newly-established Hong Kong office is the result of a merger in May 2018, with Hong Kong urban development consultancy, Waters Economics Ltd.
Cistri is supported by its parent company in Australia, pre-eminent adviser on cities and communities, with over 500 people located in 5 offices.
Our clients include corporates in real estate, infrastructure, transport and the environment, as well as governments and public authorities, multilateral agencies and NGOs.
We are valued for advice and solutions that are practical and innovative, drawing on sound research, analytical rigor and above all, an evidence-base.