Embed Size (px)
Citation preview

D:/rg/folien/ms/ms-USA-040511.pptF 1
Assessment of prediction error
of risk prediction models
Thomas Gerds and Martin Schumacher
Institute of Medical Biometry and Medical InformaticsUniversity Hospital Freiburg, Germany

D:/rg/folien/ms/ms-USA-040511.pptF 2
– Situation
– Measures of prediction error
– Application to prediction of breast cancer survival
– General conclusion
– Considerations for breast cancer risk prediction
Outline
D:/rg/folien/ms/ms-USA-040511.pptF 3
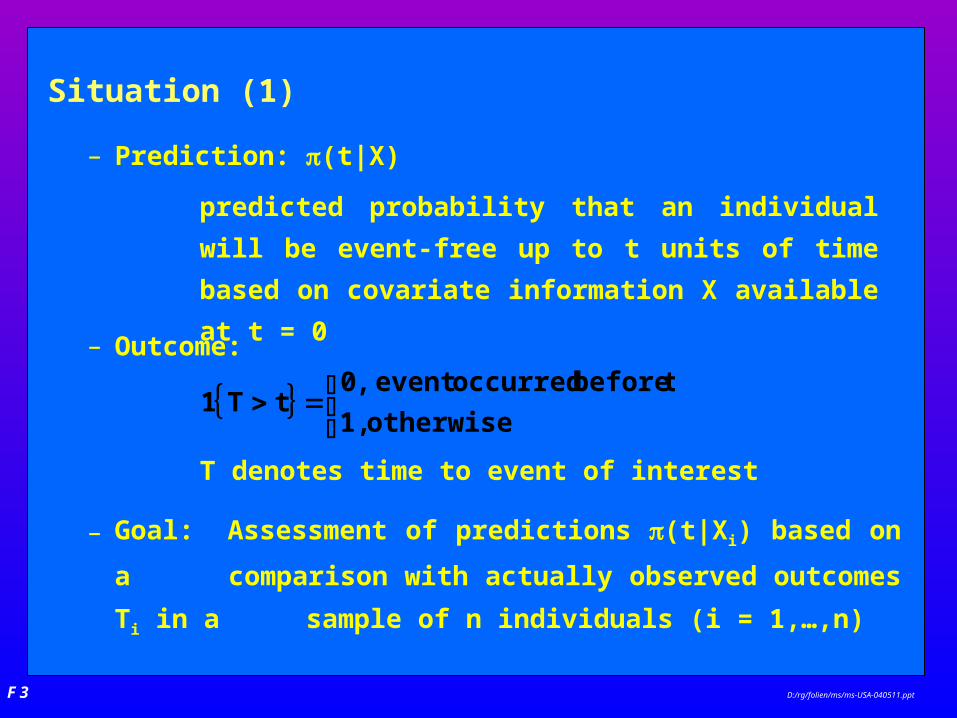
Situation (1)
– Goal: Assessment of predictions (t|Xi) based on a
comparison with actually observed outcomes Ti in a sample
of n individuals (i = 1,…,n)
predicted probability that an individual will be event-
free up to t units of time based on covariate
information X available at t = 0
– Prediction: (t|X)
{ }⎩⎨⎧
=>otherwise 1,
t before occurredevent ,0tT1
T denotes time to event of interest
– Outcome:
D:/rg/folien/ms/ms-USA-040511.pptF 4
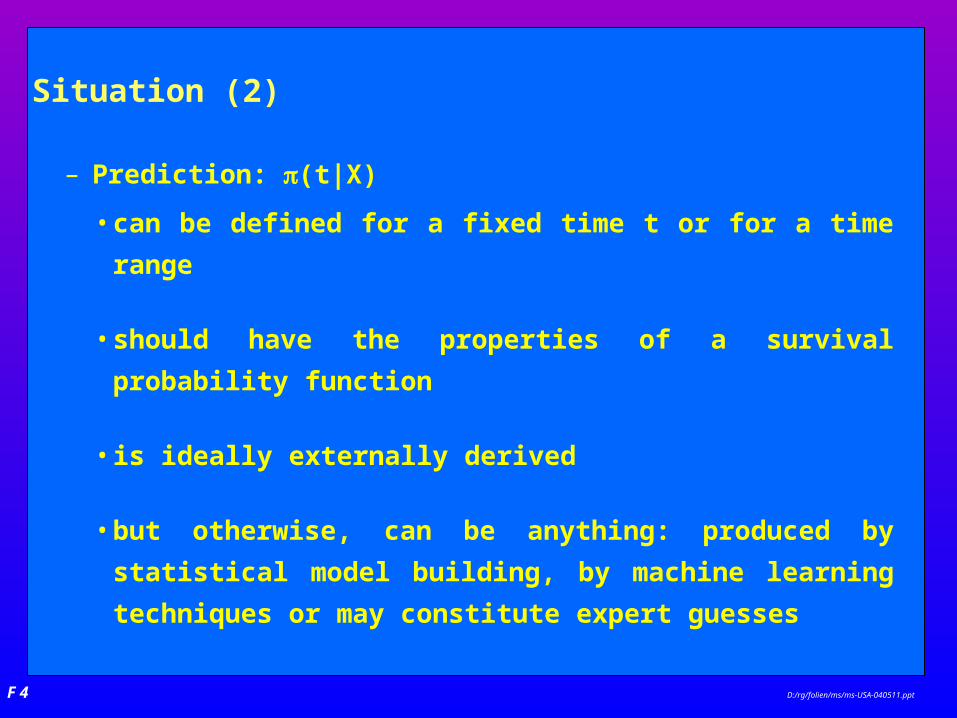
Situation (2)
• can be defined for a fixed time t or for a time range
• should have the properties of a survival probability function
• is ideally externally derived
• but otherwise, can be anything: produced by statistical
model building, by machine learning techniques or may
constitute expert guesses
– Prediction: (t|X)
D:/rg/folien/ms/ms-USA-040511.pptF 5
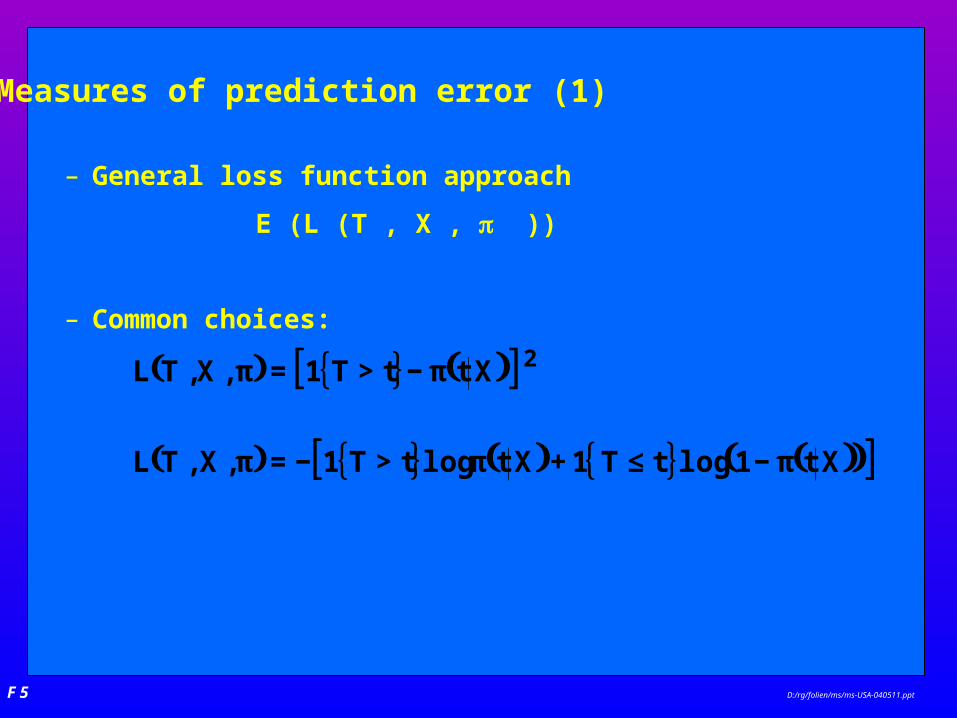
Measures of prediction error (1)
( ) { } ( )[ ]
( ) { } ( ) { } ( )( )[ ]Xt1logtT1XtlogtT1,X , TL
XttT1 ,X, TL 2
π−≤+π>−=π
π−>=π
– General loss function approach
E (L (T , X , ))
– Common choices:
D:/rg/folien/ms/ms-USA-040511.pptF 6
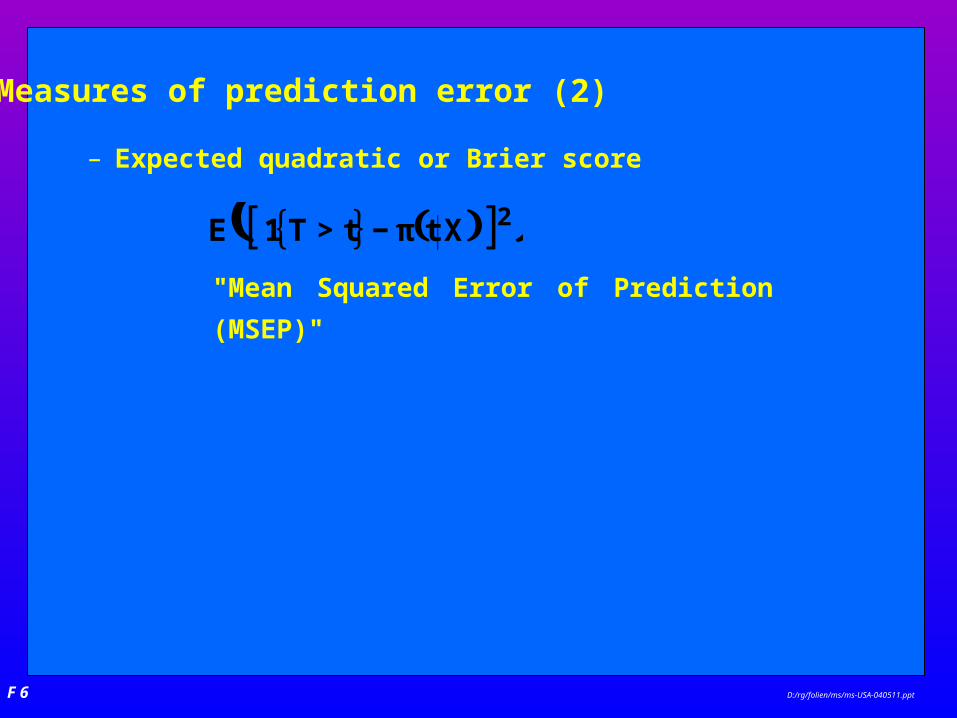
Measures of prediction error (2)
{ } ( )[ ]( )2XttT1E π−>
– Expected quadratic or Brier score
"Mean Squared Error of Prediction (MSEP)"

D:/rg/folien/ms/ms-USA-040511.pptF 7
Measures of prediction error (2)
{ } ( )[ ]( )2XttT1E π−>
– Expected quadratic or Brier score
"Mean Squared Error of Prediction (MSEP)"
– Decomposition
{ } ( )[ ]{ } ( )[ ] { } ( )[ ]22
2
XtStTXtStT1
XttT1
−>π+−>=
π−>
S(t|X) denotes the "true" probability that an individual with
covariate X will be event-free up to t

D:/rg/folien/ms/ms-USA-040511.pptF 8
Measures of prediction error (3)
{ } ( )[ ]∑ −>=
n
1i
2ii XttT1
n1
– Empirical quadratic or Brier Score
"Residual Sum of Squares (RSS)"
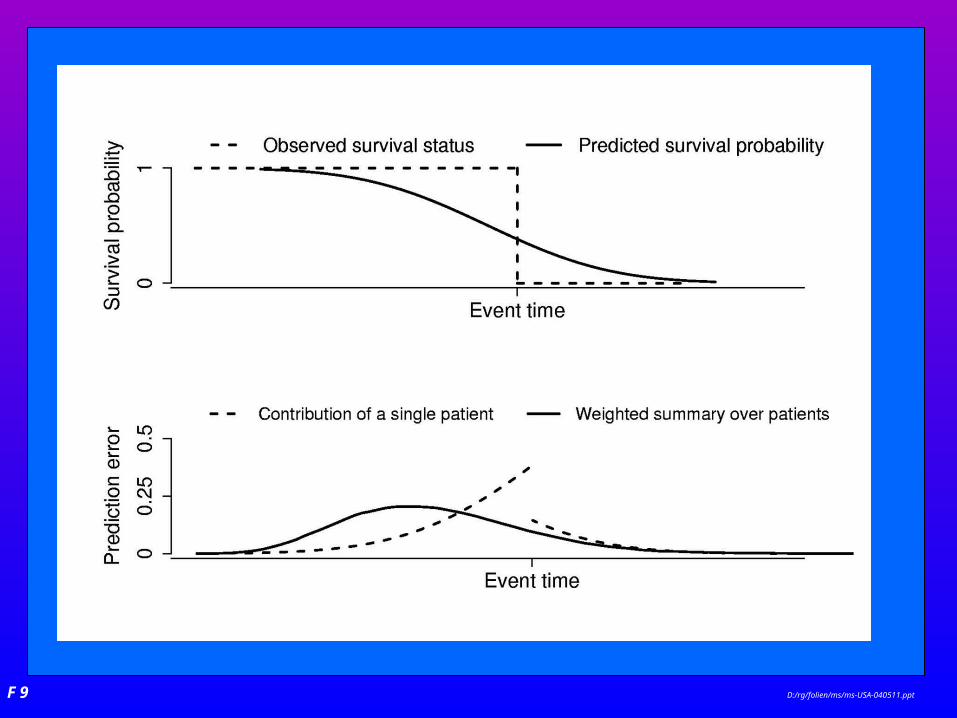
– MSEP and RSS are time-dependent in survival problems
– Graphical tool: plotting RSS over time
D:/rg/folien/ms/ms-USA-040511.pptF 9

D:/rg/folien/ms/ms-USA-040511.pptF 10
Measures of prediction error (3)
– Incorporation of censored observations
( ) { } ( )[ ]∑ −>=
n
1i
2iii XttT1tw
n1
"Weighted Residual Sum of Squares (WRSS)"
– Empirical quadratic or Brier Score
{ } ( )[ ]∑ −>=
n
1i
2ii XttT1
n1
"Residual Sum of Squares (RSS)"
D:/rg/folien/ms/ms-USA-040511.pptF 11
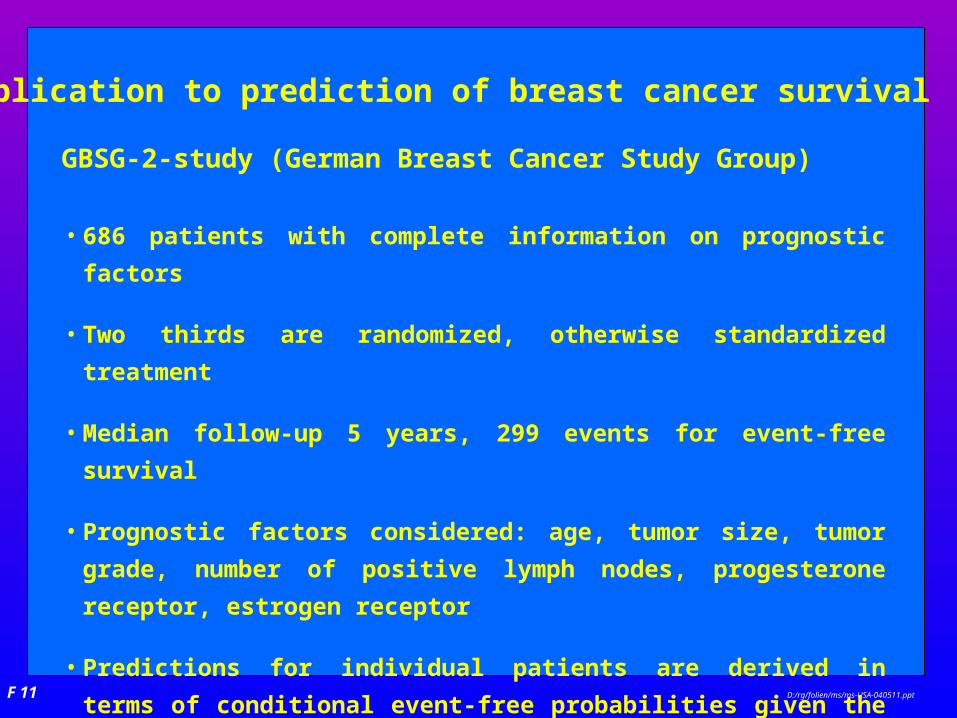
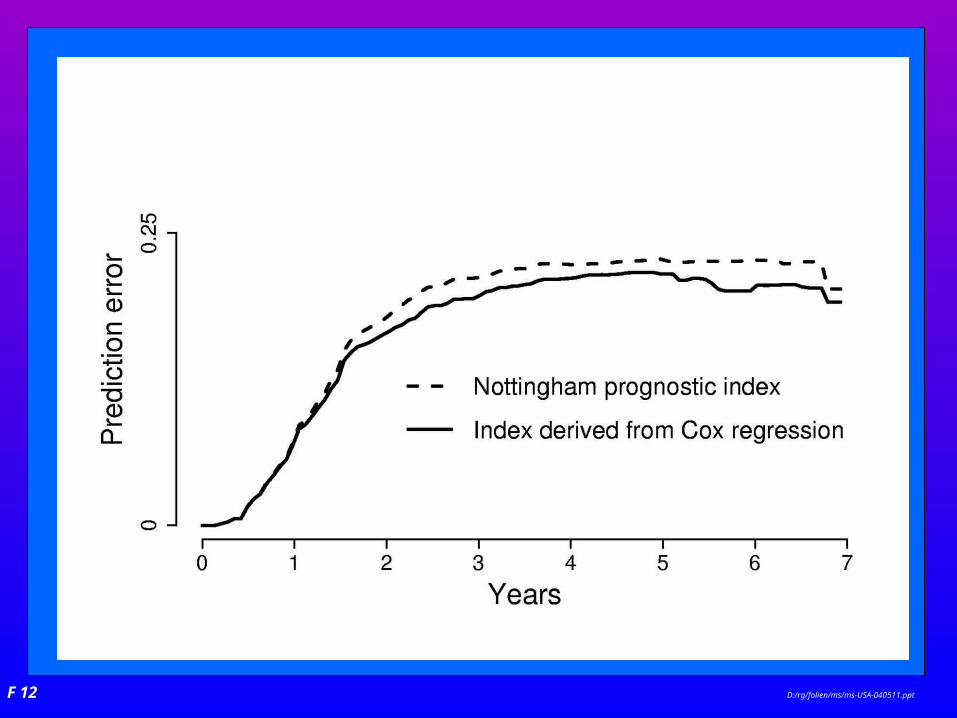
Application to prediction of breast cancer survival
GBSG-2-study (German Breast Cancer Study Group)
• 686 patients with complete information on prognostic factors
• Two thirds are randomized, otherwise standardized treatment
• Median follow-up 5 years, 299 events for event-free survival
• Prognostic factors considered: age, tumor size, tumor grade, number
of positive lymph nodes, progesterone receptor, estrogen receptor
• Predictions for individual patients are derived in terms of conditional
event-free probabilities given the covariate combination by means of
the Nottingham Prognostic Index and a Cox regression model with all
six prognostic factors
D:/rg/folien/ms/ms-USA-040511.pptF 12
D:/rg/folien/ms/ms-USA-040511.pptF 13
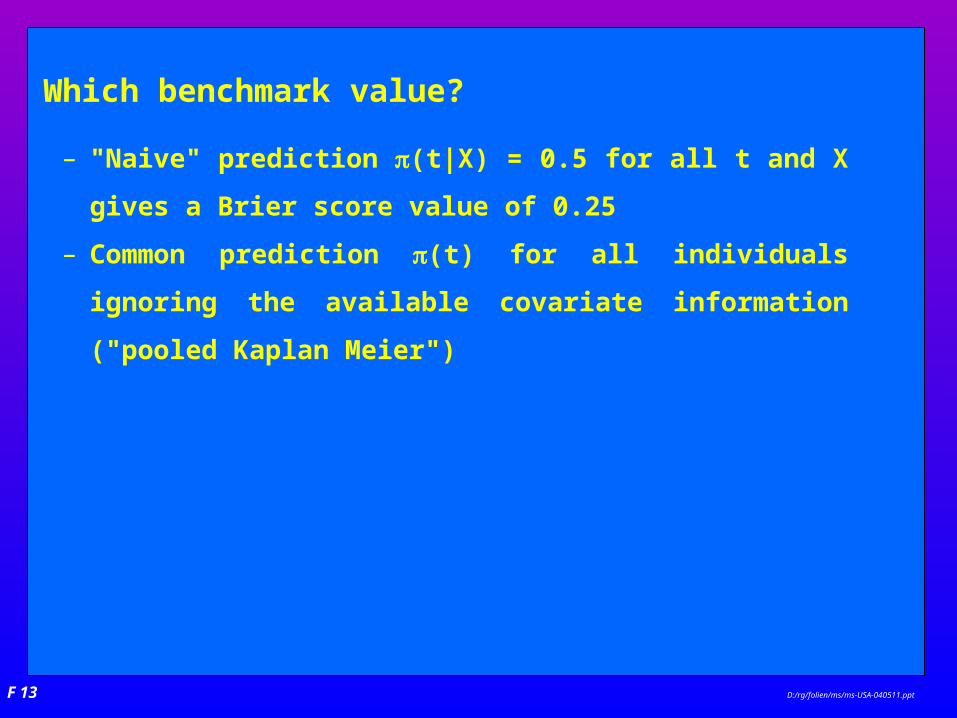
Which benchmark value?
– "Naive" prediction (t|X) = 0.5 for all t and X gives a Brier
score value of 0.25
– Common prediction (t) for all individuals ignoring the
available covariate information ("pooled Kaplan Meier")

D:/rg/folien/ms/ms-USA-040511.pptF 14

D:/rg/folien/ms/ms-USA-040511.pptF 15
Which benchmark value?
– "Naive" prediction (t|X) = 0.5 for all t and X gives a Brier
score of 0.25
– Common prediction (t) for all individuals ignoring the
available covariate information ("pooled Kaplan Meier")'
– Calculation of R2-measures for checking various aspects of
prediction models
( ) ( )( )( )( )t,tWRSS
Xt,tWRSS1tR2
π
π−=

D:/rg/folien/ms/ms-USA-040511.pptF 16
D:/rg/folien/ms/ms-USA-040511.pptF 17

D:/rg/folien/ms/ms-USA-040511.pptF 18
– is the mean squared error of prediction (MSEP) when predictions are
made in terms of event(-free) probabilities
– allows the assessment of any kind of predictions based on individual
covariate values
– can be estimated even in the presence of right censoring by a weighted
residual sum of squares in a nonparametric way
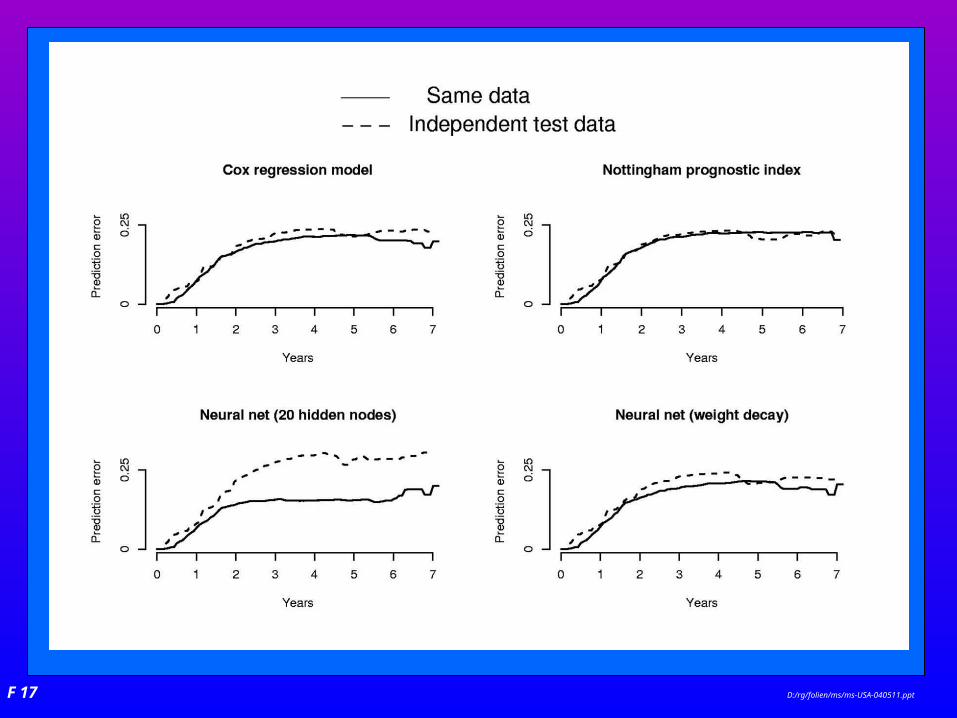
– is a valuable tool to detect overfitting
– allows the calculation of R2-measures
– can be adapted to the situation of competing risks and dynamic
updating of predictions
General conclusion
The quadratic or Brier score
D:/rg/folien/ms/ms-USA-040511.pptF 19
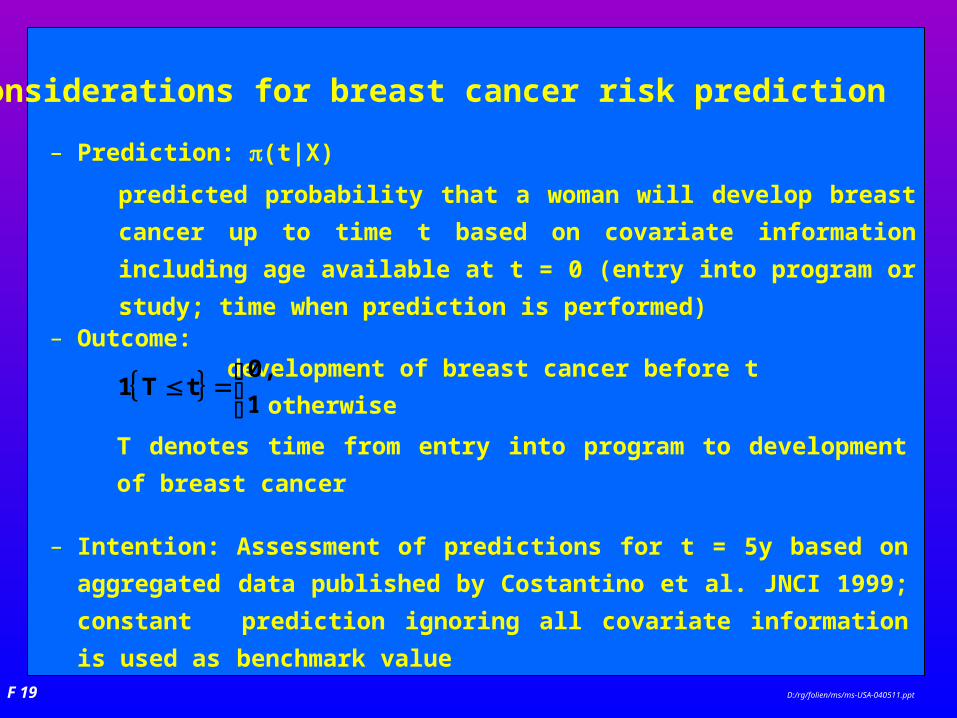
Considerations for breast cancer risk prediction
– Intention: Assessment of predictions for t = 5y based on aggregated
data published by Costantino et al. JNCI 1999; constant
prediction ignoring all covariate information is used as
benchmark value
predicted probability that a woman will develop breast cancer up to
time t based on covariate information including age available at t = 0
(entry into program or study; time when prediction is performed)
– Prediction: (t|X)
T denotes time from entry into program to development of breast
cancer
– Outcome:development of breast cancer before t{ }
⎩⎨⎧
=≤ 1,
0,tT1
otherwise
D:/rg/folien/ms/ms-USA-040511.pptF 20
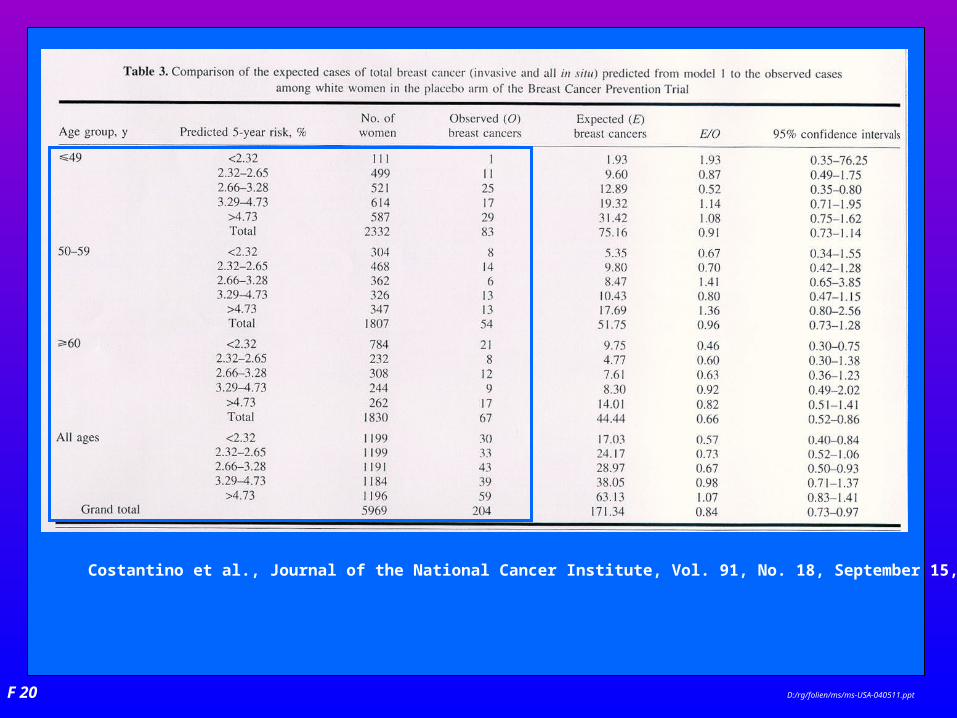
Costantino et al., Journal of the National Cancer Institute, Vol. 91, No. 18, September 15, 1999

D:/rg/folien/ms/ms-USA-040511.pptF 21
Estimated prediction error based on aggregated data
Brier Score Logarithmic score
Age group, y model 1 const. pred. model 1 const. pred.
49 0.03428 0.03432 0.15289 0.15367
50 – 59 0.02900 0.02899 0.13446 0.13434
60 0.03519 0.03527 0.15625 0.15702
All ages 0.03296 0.03301 0.14834 0.14897

D:/rg/folien/ms/ms-USA-040511.pptF 22
Estimated relative risk (RR) for predicted risk quintiles
(model 1, all ages)Predicted 5-year, %
risk
< 2.32 1199 30 1
2.32 – 2.65 1199 33 1.1
2.66 – 3.28 1191 43 1.436
3.29 – 4.73 1184 39 1.316
> 4.73 1196 59 1.972
No. of women
Observed breast cancer
RR

D:/rg/folien/ms/ms-USA-040511.pptF 23
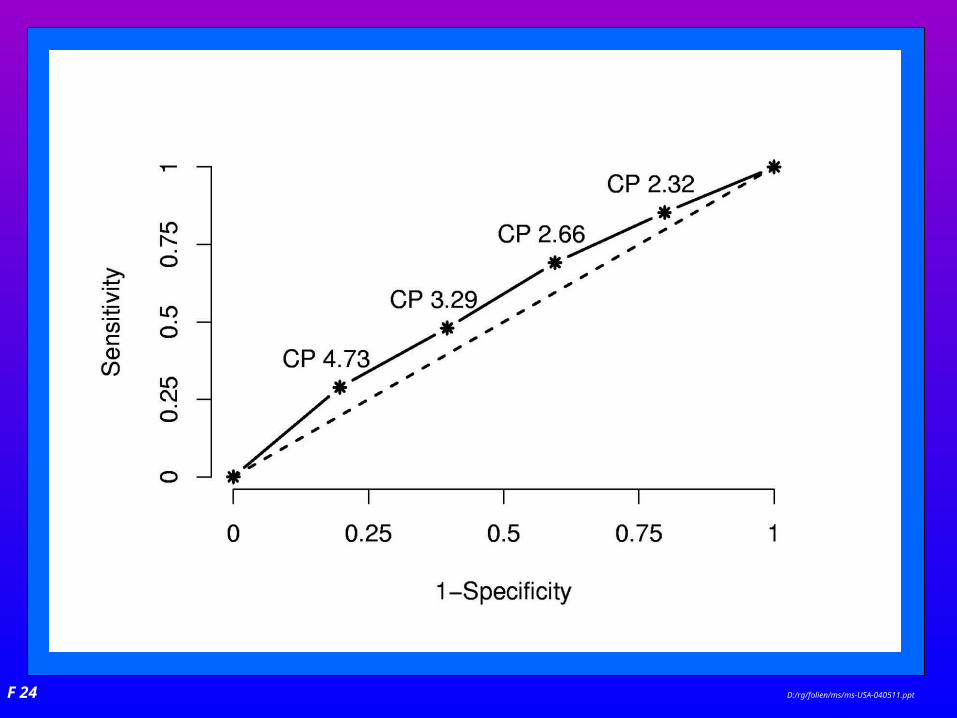
"Diagnostic" properties of predicted risk quintiles
(model 1, all ages)
2.32 0.853 0.203 0.036 0.975
2.66 0.690 0.405 0.039 0.974
3.29 0.480 0.604 0.041 0.971
4.73 0.289 0.803 0.049 0.970
Sensitivity Pos. pred. value
Specificity Neg. pred. value
CutpointPred. 5-year risk, %
D:/rg/folien/ms/ms-USA-040511.pptF 24