Embed Size (px)
Citation preview
Dreyfus Municipal Bond Infrastructure Fund, Inc.
ANNUAL REPORT February 28, 2018
Dreyfus Municipal Bond Infrastructure Fund, Inc.
Protecting Your Privacy Our Pledge to You
THE FUND IS COMMITTED TO YOUR PRIVACY. On this page, you will find the Fund’s policies and practices for collecting, disclosing, and safeguarding “nonpublic personal information,” which may include financial or other customer information. These policies apply to individuals who purchase Fund shares for personal, family, or household purposes, or have done so in the past. This notification replaces all previous statements of the Fund’s consumer privacy policy, and may be amended at any time. We’ll keep you informed of changes as required by law. YOUR ACCOUNT IS PROVIDED IN A SECURE ENVIRONMENT. The Fund maintains physical, electronic and procedural safeguards that comply with federal regulations to guard nonpublic personal information. The Fund’s agents and service providers have limited access to customer information based on their role in servicing your account. THE FUND COLLECTS INFORMATION IN ORDER TO SERVICE AND ADMINISTER YOUR ACCOUNT. The Fund collects a variety of nonpublic personal information, which may include: • Information we receive from you, such as your name,
address, and social security number. • Information about your transactions with us, such as the
purchase or sale of Fund shares. • Information we receive from agents and service providers,
such as proxy voting information. THE FUND DOES NOT SHARE NONPUBLIC PERSONAL INFORMATION WITH ANYONE, EXCEPT AS PERMITTED BY LAW. Thank you for this opportunity to serve you.
The views expressed in this report reflect those of the portfoliomanager(s) only through the end of the period covered and do notnecessarily represent the views of Dreyfus or any other person in theDreyfus organization. Any such views are subject to change at any time based upon market or other conditions and Dreyfus disclaimsany responsibility to update such views. These views may not berelied on as investment advice and, because investment decisions fora Dreyfus fund are based on numerous factors, may not be relied on as an indication of trading intent on behalf of any Dreyfus fund.
Not FDIC-Insured • Not Bank-Guaranteed • May Lose Value

Contents T H E F U N D
A Letter from the President of Dreyfus 2 Discussion of Fund Performance 3 Selected Information 5 Statement of Investments 6 Statement of Assets and Liabilities 17 Statement of Operations 18 Statement of Cash Flows 19 Statement of Changes in Net Assets 20 Financial Highlights 21 Notes to Financial Statements 22 Report of Independent Registered Public Accounting Firm 30 Additional Information 31 Important Tax Information 34 Board Members Information 35 Officers of the Fund 38 Officers and Directors 41
F O R M O R E I N F O R M AT I O N
Back Cover
2
A LETTER FROM THE PRESIDENT OF DREYFUS
Dear Shareholder:
We are pleased to present this annual report for Dreyfus Municipal Bond Infrastructure Fund, Inc., covering the 12-month period from March 1, 2017 through February 28, 2018. For information about how the fund performed during the reporting period, as well as general market perspectives, we provide a Discussion of Fund Performance on the pages that follow.
Financial markets early in the reporting period were dominated by expectations of more business-friendly regulatory, tax and fiscal policies from a newly inaugurated U.S. presidential administration. Domestic and international stocks continued to rally in the spring as corporate earnings grew and global economic conditions improved. Later, the passage of tax reform legislation fueled additional stock market gains.
In light of three short-term interest-rate hikes and concerns that inflation might accelerate in a growing economy, high-quality government bonds generally produced flat total returns for the reporting period. Corporate-backed securities and municipal bonds fared somewhat better, generating moderately positive results.
The markets’ performance over the reporting period was supported by solid underlying fundamentals, including sustained economic growth, a robust labor market and strong consumer and business confidence. We currently expect these favorable conditions to persist, but we remain watchful for economic and political developments that could negatively affect the markets. Indeed, in February 2018, we witnessed a return of heightened volatility to the financial markets. As always, we encourage you to discuss the risks and opportunities of today’s investment environment with your financial advisor.
Thank you for your continued confidence and support.
Sincerely,
Renee Laroche-Morris President The Dreyfus Corporation March 15, 2018
Dreyfus Municipal BondInfrastructure Fund, Inc. The Fund
DISCUSSION OF FUND PERFORMANCE (Unaudited)
3
For the period from March 1, 2017 through February 28, 2018, as provided by Daniel Rabasco and Jeffrey Burger, Portfolio Managers
Market and Fund Performance Overview For the 12-month period ended February 28, 2018, Dreyfus Municipal Bond Infrastructure Fund, Inc. achieved a total return of 7.10% on a net-asset-value basis.1 Over the same period, the fund provided aggregate income dividends of $0.6360 per share, which reflects a distribution rate of 5.17%.2
Municipal bonds produced positive total returns as favorable supply-and-demand dynamics in the municipal securities market and moderating long-term interest rates over the first half of the reporting period more than offset later bouts of market weakness. The fund continued to produce competitive levels of current income through an emphasis on longer-term and lower-rated municipal bonds.
The Fund’s Investment Approach The fund seeks to provide as high a level of current income exempt from regular federal income tax as is consistent with the preservation of capital. The fund’s portfolio is composed principally of investments that finance the development, support, or improvement of America’s infrastructure.
Under normal circumstances, the fund pursues its investment objective by investing at least 80% of its Managed Assets3 in municipal bonds issued to finance infrastructure sectors and projects in the United States. Also, under normal circumstances, the fund will invest at least 50% of its Managed Assets in municipal bonds that, at the time of investment, are rated investment grade, meaning that up to 50% of Managed Assets can be invested in below-investment-grade municipal bonds. Projects in which the fund may invest include (but are not limited to) those in the transportation, energy and utilities, social infrastructure, and water and environmental sectors. We focus on identifying undervalued sectors and securities, and minimize the use of interest-rate forecasting. We select municipal bonds using fundamental credit analysis to estimate the relative value and attractiveness of various sectors and securities and to exploit pricing inefficiencies.
The fund employs leverage by issuing preferred stock and participating in tender-option bond programs. The use of leverage can magnify gain-and-loss potential depending on market conditions.
Supply-and-Demand Dynamics Drove Municipal Bonds Market weakness in the weeks before the start of the reporting period proved temporary, and municipal bonds rebounded from low valuations over the ensuing months as the supply of newly issued securities moderated and investor demand increased. Consequently, municipal bonds ranked among the top performing sectors of the U.S. bond market over the reporting period’s first half.
Later in 2017, the market encountered renewed volatility amid uncertainty regarding the impact of tax reform legislation on municipal bonds. Issuers responded to this uncertainty by issuing a high volume of new securities before year-end, and the resulting supply-and-demand imbalance put downward pressure on municipal bond prices. Heightened market volatility continued through January 2018 despite a dearth of new issuance and a return to more favorable supply-and-demand dynamics. Investors grew concerned that the Federal Reserve Board might raise short-term interest rates more than previously expected in an environment of greater fiscal
DISCUSSION OF FUND PERFORMANCE (Unaudited) (continued)
4
stimulus, increased economic growth, accelerating inflation, and ballooning federal budget deficits. The market generally stabilized in February.
Although credit conditions have remained sound in the strong economy, growth in tax revenues has slowed nationally, and several states are facing pressure from underfunded pension systems.
Revenue-Backed Bonds Supported Fund Results The fund’s ability to generate competitive levels of tax-exempt income was enhanced during the reporting period by overweighted exposure to higher yielding revenue-backed bonds with long maturities and BBB and high yield credit ratings. The fund achieved especially favorable results among bonds backed by revenues from continuing care centers and retirement homes in the health care sector, charter schools in the education sector, industrial development projects, and the states’ settlement of litigation with U.S. tobacco companies. The fund also benefited from an underweighted position in lower yielding general obligation bonds. Lack of exposure to uninsured bonds from Puerto Rico also supported the fund’s results.
Although disappointments proved relatively mild during the reporting period, higher quality bonds issued on behalf of essential municipal services such as water-and-sewer districts and public power utilities generally lagged market averages. In addition, the fund’s leveraging strategy was constrained by higher financing costs in the rising interest-rate environment.
A Constructive Investment Posture Market volatility surrounding the enactment of tax reform legislation and potentially rising short-term interest rates appears to have eased. While sharply lower corporate tax rates could weigh on demand for municipal bonds from banks and insurance companies, modestly lower personal tax rates seem unlikely to dampen demand from individual investors seeking tax-exempt current income, and we expect favorable supply-and-demand dynamics to continue to support municipal bond prices over the foreseeable future. In addition, municipal bonds historically have been less sensitive than U.S. Treasury securities to rising interest rates. Therefore, we have maintained a constructive investment posture, including an emphasis on higher yielding revenue bonds with long maturities.
March 15, 2018 1 Total return includes reinvestment of dividends and any capital gains paid, based upon net asset value per share. Past performance is
no guarantee of future results. Income may be subject to state and local taxes, and some income may be subject to the federal alternative minimum tax for certain investors. Capital gains, if any, are fully taxable.
2 Distribution rate per share is based upon dividends per share paid from net investment income during the period, divided by the market price per share at the end of the period, adjusted for any capital gain distributions.
3 “Managed Assets” of the fund means the fund’s total assets, including any assets attributable to effective leverage, minus certain defined accrued liabilities.
Bonds are subject generally to interest-rate, credit, liquidity, and market risks, to varying degrees. Generally, all other factors being equal, prices of investment-grade bonds are inversely related to interest-rate changes, and rate increases can cause price declines. High yield bonds are subject to increased credit and liquidity risk and are considered speculative in terms of the issuer’s perceived ability to pay interest on a timely basis and to repay principal upon maturity. Unlike investment-grade bonds, prices of high yield bonds may fluctuate unpredictably and not necessarily inversely with changes in interest rates. The use of leverage may magnify the fund’s gains or losses. For derivatives with a leveraging component, adverse changes in the value or level of the underlying asset can result in a loss that is much greater than the original investment in the derivative.
SELECTED INFORMATION February 28, 2018 (Unaudited)
5
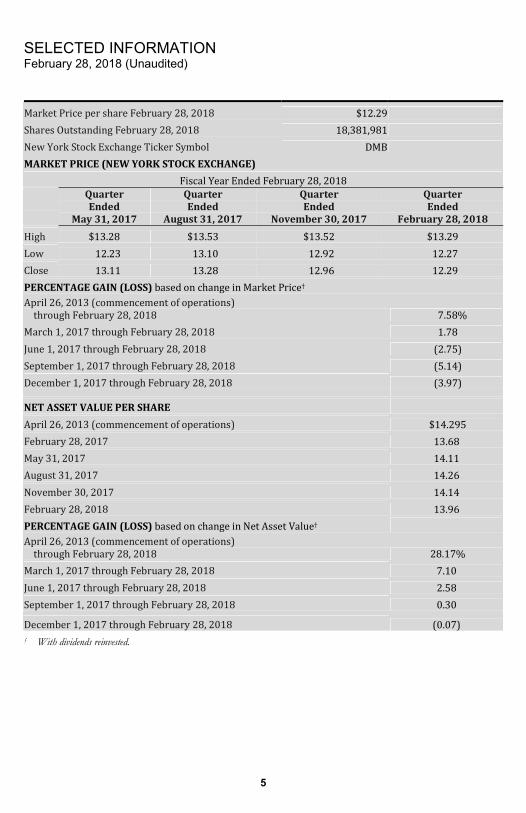
Market Price per share February 28, 2018 $12.29Shares Outstanding February 28, 2018 18,381,981New York Stock Exchange Ticker Symbol DMBMARKET PRICE (NEW YORK STOCK EXCHANGE) Fiscal Year Ended February 28, 2018
Quarter Ended
May 31, 2017
Quarter Ended
August 31, 2017
Quarter Ended
November 30, 2017
Quarter Ended
February 28, 2018 High $13.28 $13.53 $13.52 $13.29 Low 12.23 13.10 12.92 12.27 Close 13.11 13.28 12.96 12.29 PERCENTAGE GAIN (LOSS) based on change in Market Price† April 26, 2013 (commencement of operations) through February 28, 2018 7.58% March 1, 2017 through February 28, 2018 1.78 June 1, 2017 through February 28, 2018 (2.75) September 1, 2017 through February 28, 2018 (5.14) December 1, 2017 through February 28, 2018 (3.97) NET ASSET VALUE PER SHARE April 26, 2013 (commencement of operations) $14.295 February 28, 2017 13.68 May 31, 2017 14.11 August 31, 2017 14.26 November 30, 2017 14.14 February 28, 2018 13.96 PERCENTAGE GAIN (LOSS) based on change in Net Asset Value† April 26, 2013 (commencement of operations) through February 28, 2018 28.17% March 1, 2017 through February 28, 2018 7.10 June 1, 2017 through February 28, 2018 2.58 September 1, 2017 through February 28, 2018 0.30 December 1, 2017 through February 28, 2018 (0.07) † With dividends reinvested.
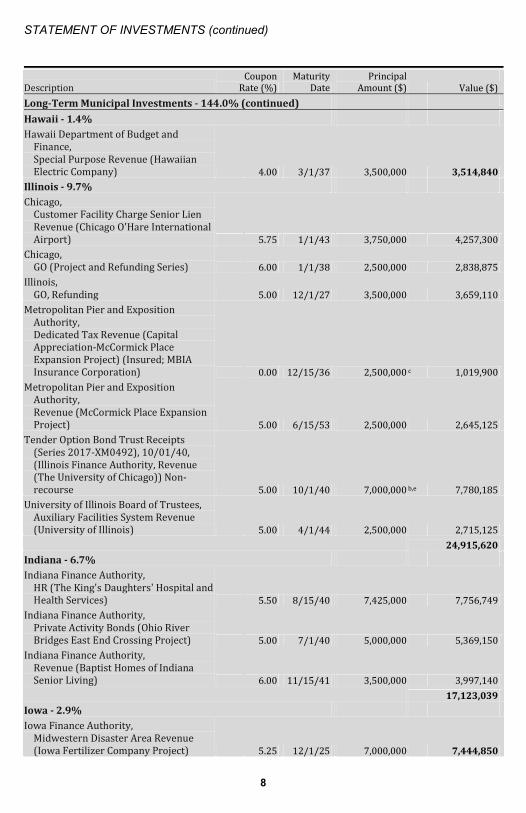
STATEMENT OF INVESTMENTS February 28, 2018
6
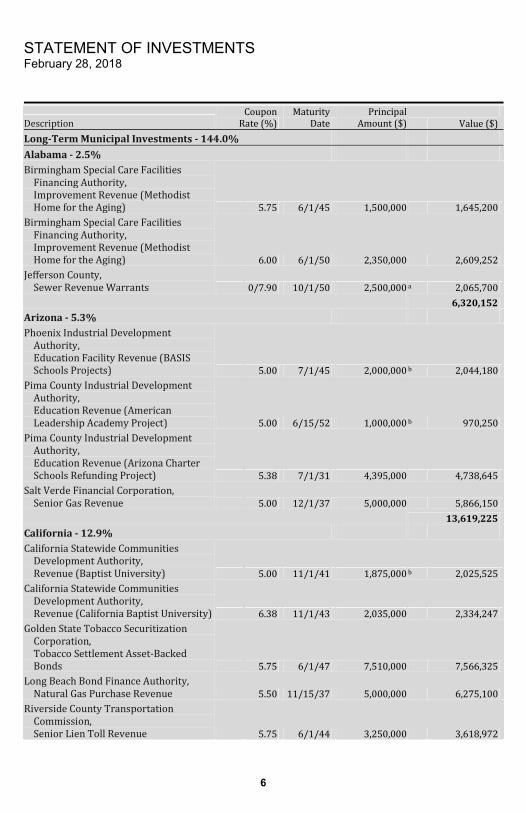
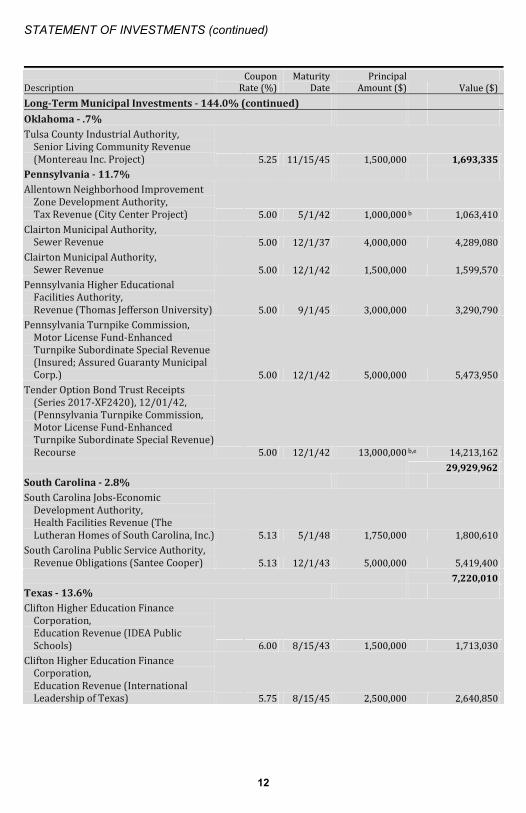
Description Coupon Rate (%) Maturity Date PrincipalAmount ($) Value ($)Long-Term Municipal Investments - 144.0%
Alabama - 2.5% Birmingham Special Care Facilities Financing Authority, Improvement Revenue (Methodist Home for the Aging) 5.75 6/1/45 1,500,000 1,645,200Birmingham Special Care Facilities Financing Authority, Improvement Revenue (Methodist Home for the Aging) 6.00 6/1/50 2,350,000 2,609,252Jefferson County, Sewer Revenue Warrants 0/7.90 10/1/50 2,500,000 a 2,065,700 6,320,152
Arizona - 5.3% Phoenix Industrial Development Authority, Education Facility Revenue (BASIS Schools Projects) 5.00 7/1/45 2,000,000 b 2,044,180Pima County Industrial Development Authority, Education Revenue (American Leadership Academy Project) 5.00 6/15/52 1,000,000 b 970,250Pima County Industrial Development Authority, Education Revenue (Arizona Charter Schools Refunding Project) 5.38 7/1/31 4,395,000 4,738,645Salt Verde Financial Corporation, Senior Gas Revenue 5.00 12/1/37 5,000,000 5,866,150 13,619,225
California - 12.9% California Statewide Communities Development Authority, Revenue (Baptist University) 5.00 11/1/41 1,875,000 b 2,025,525California Statewide Communities Development Authority, Revenue (California Baptist University) 6.38 11/1/43 2,035,000 2,334,247Golden State Tobacco Securitization Corporation, Tobacco Settlement Asset-Backed Bonds 5.75 6/1/47 7,510,000 7,566,325Long Beach Bond Finance Authority, Natural Gas Purchase Revenue 5.50 11/15/37 5,000,000 6,275,100Riverside County Transportation Commission, Senior Lien Toll Revenue 5.75 6/1/44 3,250,000 3,618,972
7
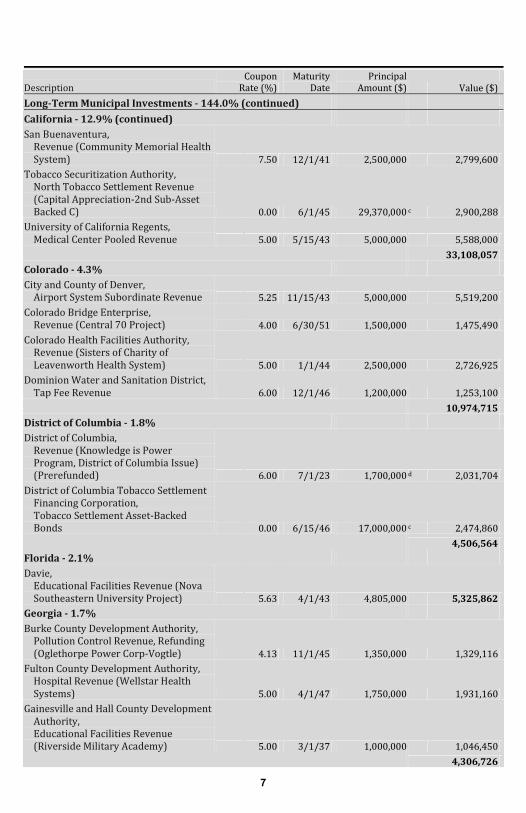
Description Coupon Rate (%) Maturity Date PrincipalAmount ($) Value ($)Long-Term Municipal Investments - 144.0% (continued)
California - 12.9% (continued) San Buenaventura, Revenue (Community Memorial Health System) 7.50 12/1/41 2,500,000 2,799,600Tobacco Securitization Authority, North Tobacco Settlement Revenue (Capital Appreciation-2nd Sub-Asset Backed C) 0.00 6/1/45 29,370,000 c 2,900,288University of California Regents, Medical Center Pooled Revenue 5.00 5/15/43 5,000,000 5,588,000 33,108,057
Colorado - 4.3% City and County of Denver, Airport System Subordinate Revenue 5.25 11/15/43 5,000,000 5,519,200Colorado Bridge Enterprise, Revenue (Central 70 Project) 4.00 6/30/51 1,500,000 1,475,490Colorado Health Facilities Authority, Revenue (Sisters of Charity of Leavenworth Health System) 5.00 1/1/44 2,500,000 2,726,925Dominion Water and Sanitation District, Tap Fee Revenue 6.00 12/1/46 1,200,000 1,253,100 10,974,715
District of Columbia - 1.8% District of Columbia, Revenue (Knowledge is Power Program, District of Columbia Issue) (Prerefunded) 6.00 7/1/23 1,700,000 d 2,031,704District of Columbia Tobacco Settlement Financing Corporation, Tobacco Settlement Asset-Backed Bonds 0.00 6/15/46 17,000,000 c 2,474,860 4,506,564
Florida - 2.1% Davie, Educational Facilities Revenue (Nova Southeastern University Project) 5.63 4/1/43 4,805,000 5,325,862
Georgia - 1.7% Burke County Development Authority, Pollution Control Revenue, Refunding (Oglethorpe Power Corp-Vogtle) 4.13 11/1/45 1,350,000 1,329,116Fulton County Development Authority, Hospital Revenue (Wellstar Health Systems) 5.00 4/1/47 1,750,000 1,931,160Gainesville and Hall County Development Authority, Educational Facilities Revenue (Riverside Military Academy) 5.00 3/1/37 1,000,000 1,046,450 4,306,726
STATEMENT OF INVESTMENTS (continued)
8
Description Coupon Rate (%) Maturity Date PrincipalAmount ($) Value ($)Long-Term Municipal Investments - 144.0% (continued)
Hawaii - 1.4% Hawaii Department of Budget and Finance, Special Purpose Revenue (Hawaiian Electric Company) 4.00 3/1/37 3,500,000 3,514,840
Illinois - 9.7% Chicago, Customer Facility Charge Senior Lien Revenue (Chicago O'Hare International Airport) 5.75 1/1/43 3,750,000 4,257,300Chicago, GO (Project and Refunding Series) 6.00 1/1/38 2,500,000 2,838,875Illinois, GO, Refunding 5.00 12/1/27 3,500,000 3,659,110Metropolitan Pier and Exposition Authority, Dedicated Tax Revenue (Capital Appreciation-McCormick Place Expansion Project) (Insured; MBIA Insurance Corporation) 0.00 12/15/36 2,500,000 c 1,019,900Metropolitan Pier and Exposition Authority, Revenue (McCormick Place Expansion Project) 5.00 6/15/53 2,500,000 2,645,125Tender Option Bond Trust Receipts (Series 2017-XM0492), 10/01/40, (Illinois Finance Authority, Revenue (The University of Chicago)) Non-recourse 5.00 10/1/40 7,000,000 b,e 7,780,185University of Illinois Board of Trustees, Auxiliary Facilities System Revenue (University of Illinois) 5.00 4/1/44 2,500,000 2,715,125 24,915,620
Indiana - 6.7% Indiana Finance Authority, HR (The King's Daughters' Hospital and Health Services) 5.50 8/15/40 7,425,000 7,756,749Indiana Finance Authority, Private Activity Bonds (Ohio River Bridges East End Crossing Project) 5.00 7/1/40 5,000,000 5,369,150Indiana Finance Authority, Revenue (Baptist Homes of Indiana Senior Living) 6.00 11/15/41 3,500,000 3,997,140 17,123,039
Iowa - 2.9% Iowa Finance Authority, Midwestern Disaster Area Revenue (Iowa Fertilizer Company Project) 5.25 12/1/25 7,000,000 7,444,850
9
Description Coupon Rate (%) Maturity Date PrincipalAmount ($) Value ($)Long-Term Municipal Investments - 144.0% (continued)
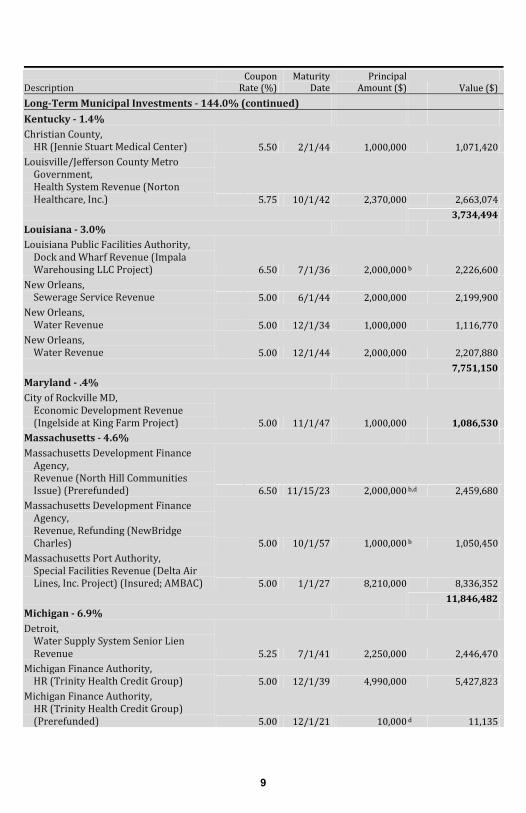
Kentucky - 1.4% Christian County, HR (Jennie Stuart Medical Center) 5.50 2/1/44 1,000,000 1,071,420Louisville/Jefferson County Metro Government, Health System Revenue (Norton Healthcare, Inc.) 5.75 10/1/42 2,370,000 2,663,074 3,734,494
Louisiana - 3.0% Louisiana Public Facilities Authority, Dock and Wharf Revenue (Impala Warehousing LLC Project) 6.50 7/1/36 2,000,000 b 2,226,600New Orleans, Sewerage Service Revenue 5.00 6/1/44 2,000,000 2,199,900New Orleans, Water Revenue 5.00 12/1/34 1,000,000 1,116,770New Orleans, Water Revenue 5.00 12/1/44 2,000,000 2,207,880 7,751,150Maryland - .4% City of Rockville MD, Economic Development Revenue (Ingelside at King Farm Project) 5.00 11/1/47 1,000,000 1,086,530
Massachusetts - 4.6% Massachusetts Development Finance Agency, Revenue (North Hill Communities Issue) (Prerefunded) 6.50 11/15/23 2,000,000 b,d 2,459,680Massachusetts Development Finance Agency, Revenue, Refunding (NewBridge Charles) 5.00 10/1/57 1,000,000 b 1,050,450Massachusetts Port Authority, Special Facilities Revenue (Delta Air Lines, Inc. Project) (Insured; AMBAC) 5.00 1/1/27 8,210,000 8,336,352 11,846,482
Michigan - 6.9% Detroit, Water Supply System Senior Lien Revenue 5.25 7/1/41 2,250,000 2,446,470Michigan Finance Authority, HR (Trinity Health Credit Group) 5.00 12/1/39 4,990,000 5,427,823Michigan Finance Authority, HR (Trinity Health Credit Group) (Prerefunded) 5.00 12/1/21 10,000 d 11,135
STATEMENT OF INVESTMENTS (continued)
10
Description Coupon Rate (%) Maturity Date PrincipalAmount ($) Value ($)Long-Term Municipal Investments - 144.0% (continued)
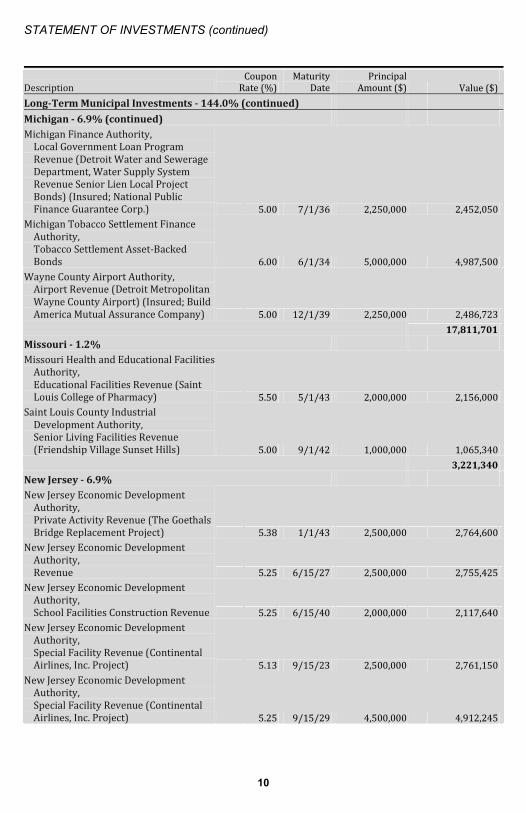
Michigan - 6.9% (continued) Michigan Finance Authority, Local Government Loan Program Revenue (Detroit Water and Sewerage Department, Water Supply System Revenue Senior Lien Local Project Bonds) (Insured; National Public Finance Guarantee Corp.) 5.00 7/1/36 2,250,000 2,452,050Michigan Tobacco Settlement Finance Authority, Tobacco Settlement Asset-Backed Bonds 6.00 6/1/34 5,000,000 4,987,500Wayne County Airport Authority, Airport Revenue (Detroit Metropolitan Wayne County Airport) (Insured; Build America Mutual Assurance Company) 5.00 12/1/39 2,250,000 2,486,723 17,811,701
Missouri - 1.2% Missouri Health and Educational Facilities Authority, Educational Facilities Revenue (Saint Louis College of Pharmacy) 5.50 5/1/43 2,000,000 2,156,000Saint Louis County Industrial Development Authority, Senior Living Facilities Revenue (Friendship Village Sunset Hills) 5.00 9/1/42 1,000,000 1,065,340 3,221,340
New Jersey - 6.9% New Jersey Economic Development Authority, Private Activity Revenue (The Goethals Bridge Replacement Project) 5.38 1/1/43 2,500,000 2,764,600New Jersey Economic Development Authority, Revenue 5.25 6/15/27 2,500,000 2,755,425New Jersey Economic Development Authority, School Facilities Construction Revenue 5.25 6/15/40 2,000,000 2,117,640New Jersey Economic Development Authority, Special Facility Revenue (Continental Airlines, Inc. Project) 5.13 9/15/23 2,500,000 2,761,150New Jersey Economic Development Authority, Special Facility Revenue (Continental Airlines, Inc. Project) 5.25 9/15/29 4,500,000 4,912,245
11
Description Coupon Rate (%) Maturity Date PrincipalAmount ($) Value ($)Long-Term Municipal Investments - 144.0% (continued)
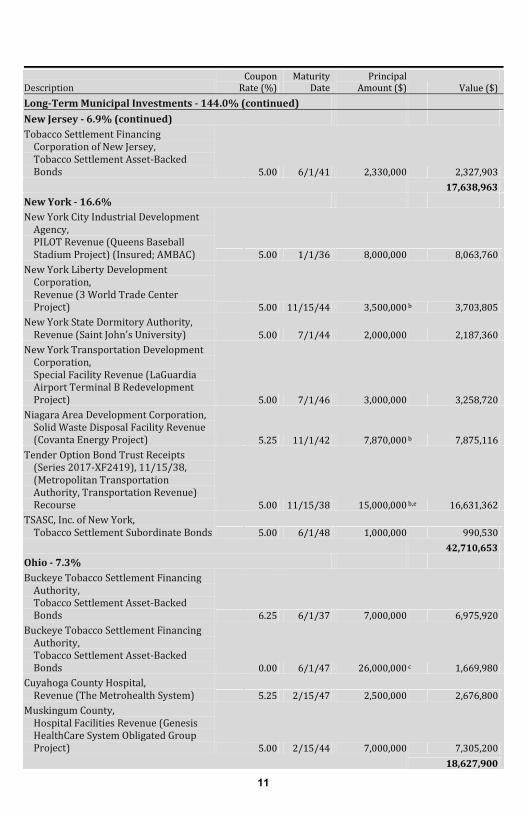
New Jersey - 6.9% (continued) Tobacco Settlement Financing Corporation of New Jersey, Tobacco Settlement Asset-Backed Bonds 5.00 6/1/41 2,330,000 2,327,903 17,638,963
New York - 16.6% New York City Industrial Development Agency, PILOT Revenue (Queens Baseball Stadium Project) (Insured; AMBAC) 5.00 1/1/36 8,000,000 8,063,760New York Liberty Development Corporation, Revenue (3 World Trade Center Project) 5.00 11/15/44 3,500,000 b 3,703,805New York State Dormitory Authority, Revenue (Saint John's University) 5.00 7/1/44 2,000,000 2,187,360New York Transportation Development Corporation, Special Facility Revenue (LaGuardia Airport Terminal B Redevelopment Project) 5.00 7/1/46 3,000,000 3,258,720Niagara Area Development Corporation, Solid Waste Disposal Facility Revenue (Covanta Energy Project) 5.25 11/1/42 7,870,000 b 7,875,116Tender Option Bond Trust Receipts (Series 2017-XF2419), 11/15/38, (Metropolitan Transportation Authority, Transportation Revenue) Recourse 5.00 11/15/38 15,000,000 b,e 16,631,362TSASC, Inc. of New York, Tobacco Settlement Subordinate Bonds 5.00 6/1/48 1,000,000 990,530 42,710,653
Ohio - 7.3% Buckeye Tobacco Settlement Financing Authority, Tobacco Settlement Asset-Backed Bonds 6.25 6/1/37 7,000,000 6,975,920Buckeye Tobacco Settlement Financing Authority, Tobacco Settlement Asset-Backed Bonds 0.00 6/1/47 26,000,000 c 1,669,980Cuyahoga County Hospital, Revenue (The Metrohealth System) 5.25 2/15/47 2,500,000 2,676,800Muskingum County, Hospital Facilities Revenue (Genesis HealthCare System Obligated Group Project) 5.00 2/15/44 7,000,000 7,305,200 18,627,900
STATEMENT OF INVESTMENTS (continued)
12
Description Coupon Rate (%) Maturity Date PrincipalAmount ($) Value ($)Long-Term Municipal Investments - 144.0% (continued)
Oklahoma - .7% Tulsa County Industrial Authority, Senior Living Community Revenue (Montereau Inc. Project) 5.25 11/15/45 1,500,000 1,693,335
Pennsylvania - 11.7% Allentown Neighborhood Improvement Zone Development Authority, Tax Revenue (City Center Project) 5.00 5/1/42 1,000,000 b 1,063,410Clairton Municipal Authority, Sewer Revenue 5.00 12/1/37 4,000,000 4,289,080Clairton Municipal Authority, Sewer Revenue 5.00 12/1/42 1,500,000 1,599,570Pennsylvania Higher Educational Facilities Authority, Revenue (Thomas Jefferson University) 5.00 9/1/45 3,000,000 3,290,790Pennsylvania Turnpike Commission, Motor License Fund-Enhanced Turnpike Subordinate Special Revenue (Insured; Assured Guaranty Municipal Corp.) 5.00 12/1/42 5,000,000 5,473,950Tender Option Bond Trust Receipts (Series 2017-XF2420), 12/01/42, (Pennsylvania Turnpike Commission, Motor License Fund-Enhanced Turnpike Subordinate Special Revenue) Recourse 5.00 12/1/42 13,000,000 b,e 14,213,162 29,929,962
South Carolina - 2.8% South Carolina Jobs-Economic Development Authority, Health Facilities Revenue (The Lutheran Homes of South Carolina, Inc.) 5.13 5/1/48 1,750,000 1,800,610South Carolina Public Service Authority, Revenue Obligations (Santee Cooper) 5.13 12/1/43 5,000,000 5,419,400 7,220,010
Texas - 13.6% Clifton Higher Education Finance Corporation, Education Revenue (IDEA Public Schools) 6.00 8/15/43 1,500,000 1,713,030Clifton Higher Education Finance Corporation, Education Revenue (International Leadership of Texas) 5.75 8/15/45 2,500,000 2,640,850
13
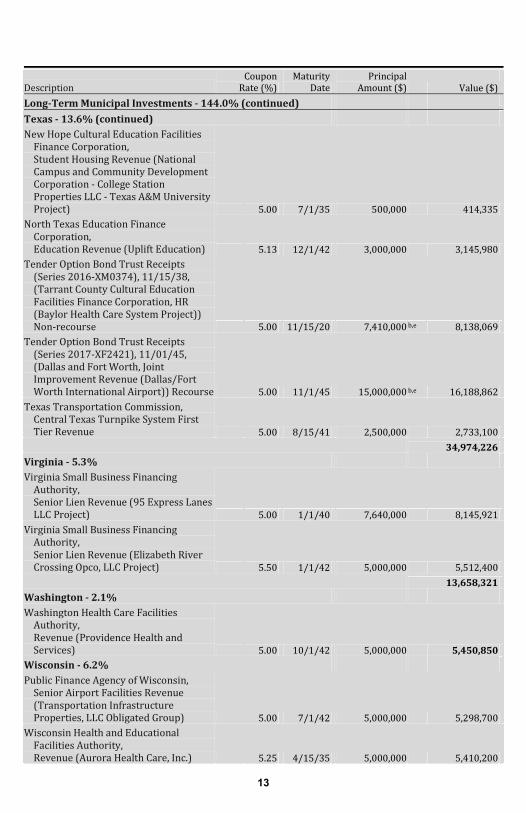
Description Coupon Rate (%) Maturity Date PrincipalAmount ($) Value ($)Long-Term Municipal Investments - 144.0% (continued)
Texas - 13.6% (continued) New Hope Cultural Education Facilities Finance Corporation, Student Housing Revenue (National Campus and Community Development Corporation - College Station Properties LLC - Texas A&M University Project) 5.00 7/1/35 500,000 414,335North Texas Education Finance Corporation, Education Revenue (Uplift Education) 5.13 12/1/42 3,000,000 3,145,980Tender Option Bond Trust Receipts (Series 2016-XM0374), 11/15/38, (Tarrant County Cultural Education Facilities Finance Corporation, HR (Baylor Health Care System Project)) Non-recourse 5.00 11/15/20 7,410,000 b,e 8,138,069Tender Option Bond Trust Receipts (Series 2017-XF2421), 11/01/45, (Dallas and Fort Worth, Joint Improvement Revenue (Dallas/Fort Worth International Airport)) Recourse 5.00 11/1/45 15,000,000 b,e 16,188,862Texas Transportation Commission, Central Texas Turnpike System First Tier Revenue 5.00 8/15/41 2,500,000 2,733,100 34,974,226Virginia - 5.3% Virginia Small Business Financing Authority, Senior Lien Revenue (95 Express Lanes LLC Project) 5.00 1/1/40 7,640,000 8,145,921Virginia Small Business Financing Authority, Senior Lien Revenue (Elizabeth River Crossing Opco, LLC Project) 5.50 1/1/42 5,000,000 5,512,400 13,658,321
Washington - 2.1% Washington Health Care Facilities Authority, Revenue (Providence Health and Services) 5.00 10/1/42 5,000,000 5,450,850
Wisconsin - 6.2% Public Finance Agency of Wisconsin, Senior Airport Facilities Revenue (Transportation Infrastructure Properties, LLC Obligated Group) 5.00 7/1/42 5,000,000 5,298,700Wisconsin Health and Educational Facilities Authority, Revenue (Aurora Health Care, Inc.) 5.25 4/15/35 5,000,000 5,410,200
STATEMENT OF INVESTMENTS (continued)
14
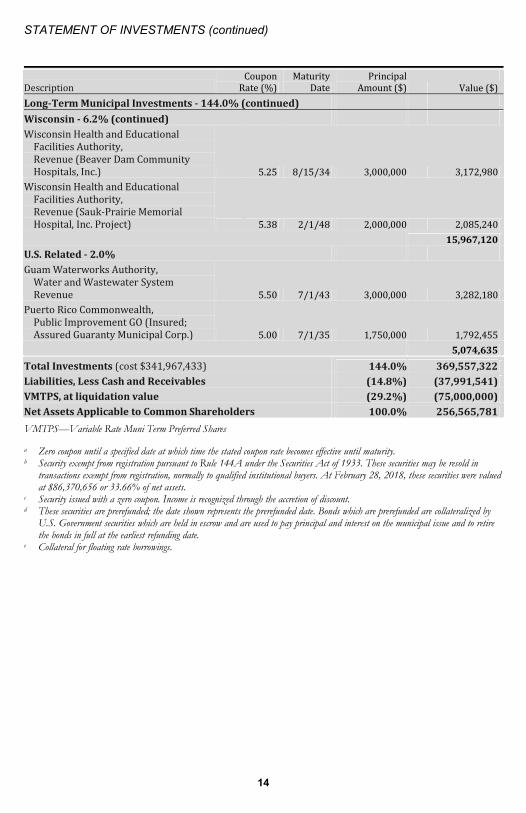
Description Coupon Rate (%) Maturity Date PrincipalAmount ($) Value ($)Long-Term Municipal Investments - 144.0% (continued)
Wisconsin - 6.2% (continued) Wisconsin Health and Educational Facilities Authority, Revenue (Beaver Dam Community Hospitals, Inc.) 5.25 8/15/34 3,000,000 3,172,980Wisconsin Health and Educational Facilities Authority, Revenue (Sauk-Prairie Memorial Hospital, Inc. Project) 5.38 2/1/48 2,000,000 2,085,240 15,967,120
U.S. Related - 2.0% Guam Waterworks Authority, Water and Wastewater System Revenue 5.50 7/1/43 3,000,000 3,282,180Puerto Rico Commonwealth, Public Improvement GO (Insured; Assured Guaranty Municipal Corp.) 5.00 7/1/35 1,750,000 1,792,455 5,074,635
Total Investments (cost $341,967,433) 144.0% 369,557,322Liabilities, Less Cash and Receivables (14.8%) (37,991,541)VMTPS, at liquidation value (29.2%) (75,000,000)Net Assets Applicable to Common Shareholders 100.0% 256,565,781
VMTPS—Variable Rate Muni Term Preferred Shares
a Zero coupon until a specified date at which time the stated coupon rate becomes effective until maturity. b Security exempt from registration pursuant to Rule 144A under the Securities Act of 1933. These securities may be resold in
transactions exempt from registration, normally to qualified institutional buyers. At February 28, 2018, these securities were valued at $86,370,656 or 33.66% of net assets.
c Security issued with a zero coupon. Income is recognized through the accretion of discount. d These securities are prerefunded; the date shown represents the prerefunded date. Bonds which are prerefunded are collateralized by
U.S. Government securities which are held in escrow and are used to pay principal and interest on the municipal issue and to retire the bonds in full at the earliest refunding date.
e Collateral for floating rate borrowings.
15
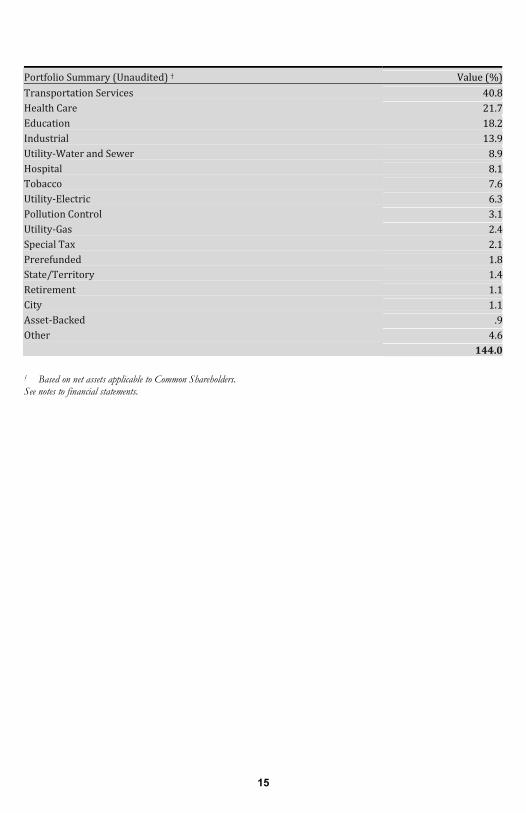
Portfolio Summary (Unaudited) † Value (%)Transportation Services 40.8Health Care 21.7Education 18.2Industrial 13.9Utility-Water and Sewer 8.9Hospital 8.1Tobacco 7.6Utility-Electric 6.3Pollution Control 3.1Utility-Gas 2.4Special Tax 2.1Prerefunded 1.8State/Territory 1.4Retirement 1.1City 1.1Asset-Backed .9Other 4.6 144.0 † Based on net assets applicable to Common Shareholders. See notes to financial statements.
16
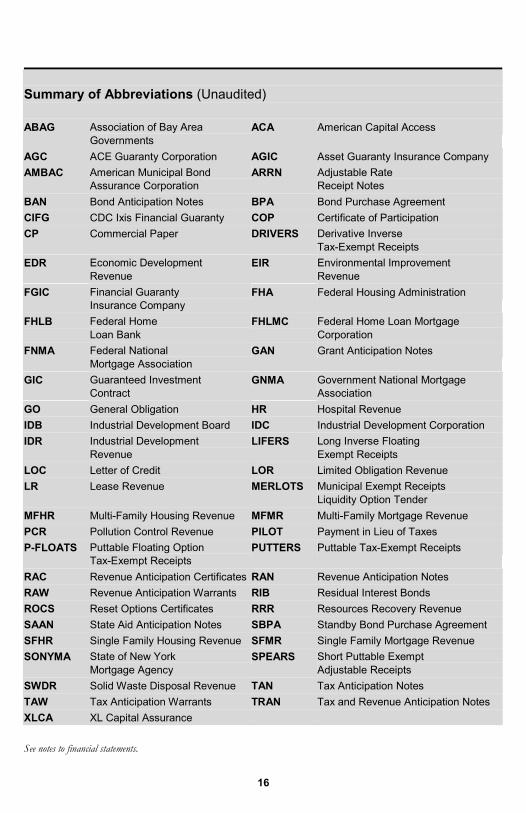
Summary of Abbreviations (Unaudited) ABAG Association of Bay Area
Governments ACA American Capital Access
AGC ACE Guaranty Corporation AGIC Asset Guaranty Insurance Company AMBAC American Municipal Bond
Assurance Corporation ARRN Adjustable Rate
Receipt Notes BAN Bond Anticipation Notes BPA Bond Purchase Agreement CIFG CDC Ixis Financial Guaranty COP Certificate of Participation CP Commercial Paper DRIVERS Derivative Inverse
Tax-Exempt Receipts EDR Economic Development
Revenue EIR Environmental Improvement
Revenue FGIC Financial Guaranty
Insurance Company FHA Federal Housing Administration
FHLB Federal Home Loan Bank
FHLMC Federal Home Loan Mortgage Corporation
FNMA Federal National Mortgage Association
GAN Grant Anticipation Notes
GIC Guaranteed Investment Contract
GNMA Government National Mortgage Association
GO General Obligation HR Hospital Revenue IDB Industrial Development Board IDC Industrial Development Corporation IDR Industrial Development
Revenue LIFERS Long Inverse Floating
Exempt Receipts LOC Letter of Credit LOR Limited Obligation Revenue LR Lease Revenue MERLOTS Municipal Exempt Receipts
Liquidity Option Tender MFHR Multi-Family Housing Revenue MFMR Multi-Family Mortgage Revenue PCR Pollution Control Revenue PILOT Payment in Lieu of Taxes P-FLOATS Puttable Floating Option
Tax-Exempt Receipts PUTTERS Puttable Tax-Exempt Receipts
RAC Revenue Anticipation Certificates RAN Revenue Anticipation Notes RAW Revenue Anticipation Warrants RIB Residual Interest Bonds ROCS Reset Options Certificates RRR Resources Recovery Revenue SAAN State Aid Anticipation Notes SBPA Standby Bond Purchase Agreement SFHR Single Family Housing Revenue SFMR Single Family Mortgage Revenue SONYMA State of New York
Mortgage Agency SPEARS Short Puttable Exempt
Adjustable Receipts SWDR Solid Waste Disposal Revenue TAN Tax Anticipation Notes TAW Tax Anticipation Warrants TRAN Tax and Revenue Anticipation Notes XLCA XL Capital Assurance
See notes to financial statements.
STATEMENT OF ASSETS AND LIABILITIES February 28, 2018
17
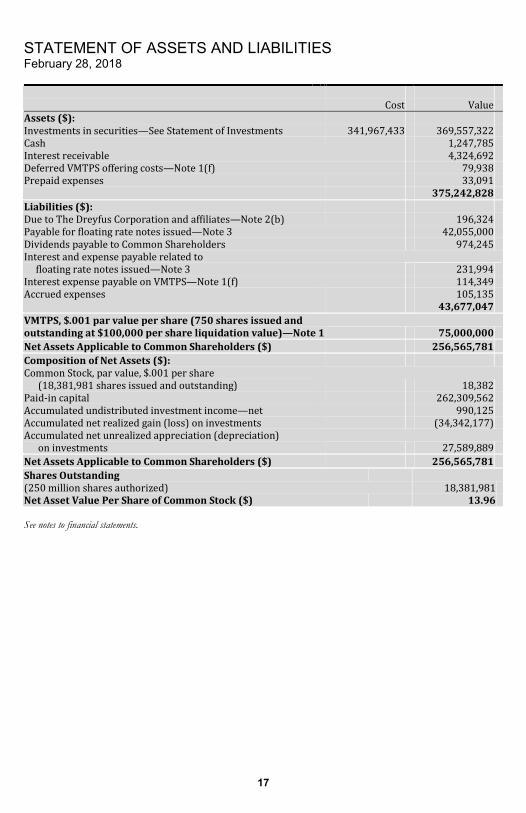
Cost Value
Assets ($): Investments in securities—See Statement of Investments 341,967,433 369,557,322 Cash 1,247,785 Interest receivable 4,324,692 Deferred VMTPS offering costs—Note 1(f) 79,938 Prepaid expenses 33,091 375,242,828 Liabilities ($): Due to The Dreyfus Corporation and affiliates—Note 2(b) 196,324 Payable for floating rate notes issued—Note 3 42,055,000 Dividends payable to Common Shareholders 974,245 Interest and expense payable related to floating rate notes issued—Note 3 231,994 Interest expense payable on VMTPS—Note 1(f) 114,349 Accrued expenses 105,135 43,677,047 VMTPS, $.001 par value per share (750 shares issued and outstanding at $100,000 per share liquidation value)—Note 1 75,000,000 Net Assets Applicable to Common Shareholders ($) 256,565,781 Composition of Net Assets ($): Common Stock, par value, $.001 per share (18,381,981 shares issued and outstanding) 18,382 Paid-in capital 262,309,562 Accumulated undistributed investment income—net 990,125 Accumulated net realized gain (loss) on investments (34,342,177) Accumulated net unrealized appreciation (depreciation) on investments 27,589,889 Net Assets Applicable to Common Shareholders ($) 256,565,781 Shares Outstanding (250 million shares authorized) 18,381,981 Net Asset Value Per Share of Common Stock ($) 13.96 See notes to financial statements.
STATEMENT OF OPERATIONS Year Ended February 28, 2018
18
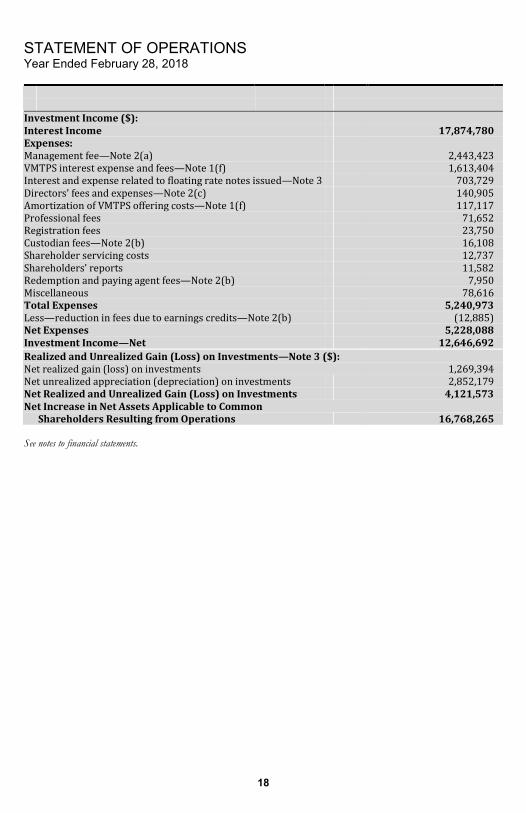
Investment Income ($): Interest Income 17,874,780 Expenses: Management fee—Note 2(a) 2,443,423 VMTPS interest expense and fees—Note 1(f) 1,613,404 Interest and expense related to floating rate notes issued—Note 3 703,729 Directors’ fees and expenses—Note 2(c) 140,905 Amortization of VMTPS offering costs—Note 1(f) 117,117 Professional fees 71,652 Registration fees 23,750 Custodian fees—Note 2(b) 16,108 Shareholder servicing costs 12,737 Shareholders’ reports 11,582 Redemption and paying agent fees—Note 2(b) 7,950 Miscellaneous 78,616 Total Expenses 5,240,973 Less—reduction in fees due to earnings credits—Note 2(b) (12,885) Net Expenses 5,228,088 Investment Income—Net 12,646,692 Realized and Unrealized Gain (Loss) on Investments—Note 3 ($): Net realized gain (loss) on investments 1,269,394 Net unrealized appreciation (depreciation) on investments 2,852,179 Net Realized and Unrealized Gain (Loss) on Investments 4,121,573 Net Increase in Net Assets Applicable to Common Shareholders Resulting from Operations 16,768,265 See notes to financial statements.
STATEMENT OF CASH FLOWS Year Ended February 28, 2018
19
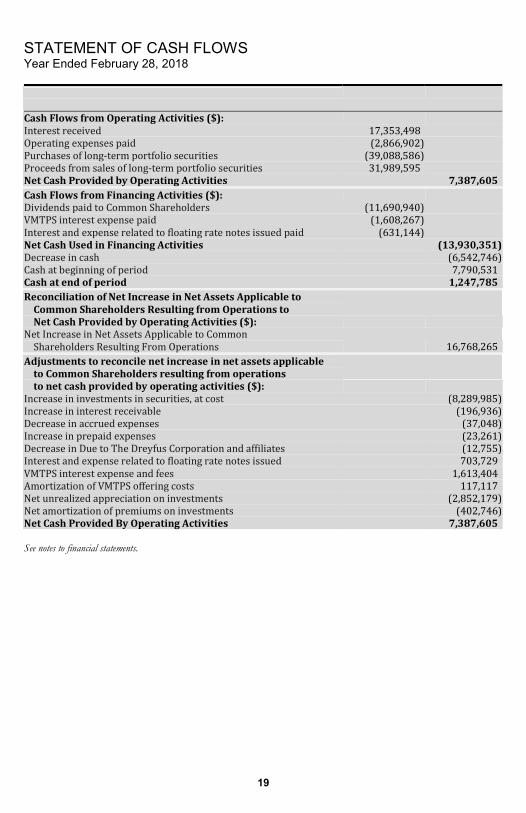
Cash Flows from Operating Activities ($): Interest received 17,353,498Operating expenses paid (2,866,902)Purchases of long-term portfolio securities (39,088,586)Proceeds from sales of long-term portfolio securities 31,989,595Net Cash Provided by Operating Activities 7,387,605Cash Flows from Financing Activities ($): Dividends paid to Common Shareholders (11,690,940)VMTPS interest expense paid (1,608,267)Interest and expense related to floating rate notes issued paid (631,144)Net Cash Used in Financing Activities (13,930,351)Decrease in cash (6,542,746)Cash at beginning of period 7,790,531Cash at end of period 1,247,785Reconciliation of Net Increase in Net Assets Applicable to
Common Shareholders Resulting from Operations to Net Cash Provided by Operating Activities ($): Net Increase in Net Assets Applicable to Common Shareholders Resulting From Operations 16,768,265
Adjustments to reconcile net increase in net assets applicable to Common Shareholders resulting from operations to net cash provided by operating activities ($): Increase in investments in securities, at cost (8,289,985)Increase in interest receivable (196,936)Decrease in accrued expenses (37,048)Increase in prepaid expenses (23,261)Decrease in Due to The Dreyfus Corporation and affiliates (12,755)Interest and expense related to floating rate notes issued 703,729VMTPS interest expense and fees 1,613,404Amortization of VMTPS offering costs 117,117Net unrealized appreciation on investments (2,852,179)Net amortization of premiums on investments (402,746)
Net Cash Provided By Operating Activities 7,387,605
See notes to financial statements.
STATEMENT OF CHANGES IN NET ASSETS
20
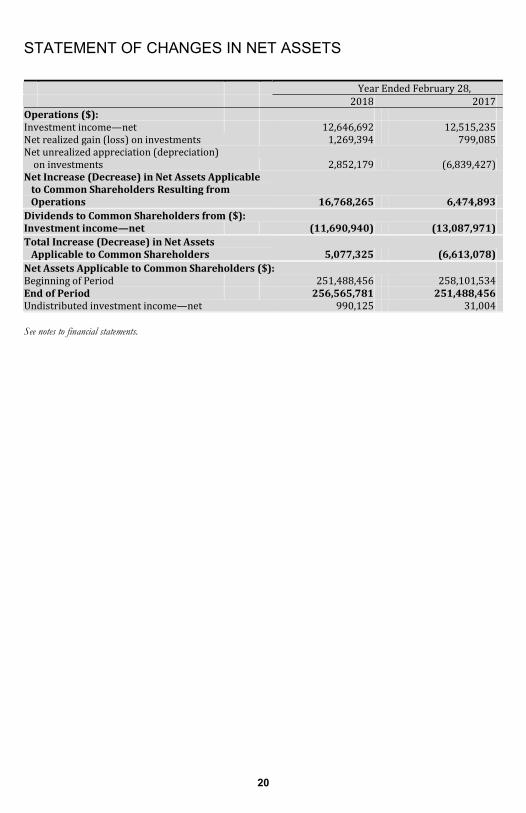
Year Ended February 28, 2018 2017
Operations ($): Investment income—net 12,646,692 12,515,235 Net realized gain (loss) on investments 1,269,394 799,085 Net unrealized appreciation (depreciation) on investments 2,852,179 (6,839,427) Net Increase (Decrease) in Net Assets Applicable to Common Shareholders Resulting from Operations 16,768,265 6,474,893 Dividends to Common Shareholders from ($): Investment income—net (11,690,940) (13,087,971) Total Increase (Decrease) in Net Assets Applicable to Common Shareholders 5,077,325 (6,613,078) Net Assets Applicable to Common Shareholders ($): Beginning of Period 251,488,456 258,101,534 End of Period 256,565,781 251,488,456 Undistributed investment income—net 990,125 31,004 See notes to financial statements.
FINANCIAL HIGHLIGHTS
21
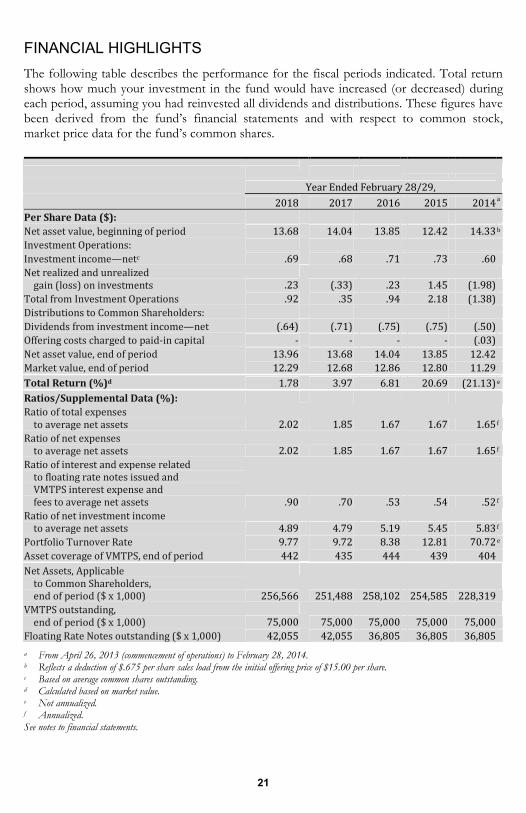
The following table describes the performance for the fiscal periods indicated. Total return shows how much your investment in the fund would have increased (or decreased) during each period, assuming you had reinvested all dividends and distributions. These figures have been derived from the fund’s financial statements and with respect to common stock, market price data for the fund’s common shares.
Year Ended February 28/29, 2018 2017 2016 2015 2014aPer Share Data ($): Net asset value, beginning of period 13.68 14.04 13.85 12.42 14.33bInvestment Operations: Investment income—netc .69 .68 .71 .73 .60 Net realized and unrealized gain (loss) on investments .23 (.33) .23 1.45 (1.98) Total from Investment Operations .92 .35 .94 2.18 (1.38) Distributions to Common Shareholders: Dividends from investment income—net (.64) (.71) (.75) (.75) (.50) Offering costs charged to paid-in capital - - - - (.03) Net asset value, end of period 13.96 13.68 14.04 13.85 12.42 Market value, end of period 12.29 12.68 12.86 12.80 11.29 Total Return (%)d 1.78 3.97 6.81 20.69 (21.13) eRatios/Supplemental Data (%): Ratio of total expenses to average net assets 2.02 1.85 1.67 1.67 1.65f Ratio of net expenses to average net assets 2.02 1.85 1.67 1.67 1.65f Ratio of interest and expense related to floating rate notes issued and VMTPS interest expense and fees to average net assets .90 .70 .53 .54 .52f Ratio of net investment income to average net assets 4.89 4.79 5.19 5.45 5.83f Portfolio Turnover Rate 9.77 9.72 8.38 12.81 70.72eAsset coverage of VMTPS, end of period 442 435 444 439 404 Net Assets, Applicable to Common Shareholders, end of period ($ x 1,000) 256,566 251,488 258,102 254,585 228,319 VMTPS outstanding, end of period ($ x 1,000) 75,000 75,000 75,000 75,000 75,000 Floating Rate Notes outstanding ($ x 1,000) 42,055 42,055 36,805 36,805 36,805 a From April 26, 2013 (commencement of operations) to February 28, 2014. b Reflects a deduction of $.675 per share sales load from the initial offering price of $15.00 per share. c Based on average common shares outstanding. d Calculated based on market value. e Not annualized. f Annualized. See notes to financial statements.
NOTES TO FINANCIAL STATEMENTS
22
NOTE 1—Significant Accounting Policies:
Dreyfus Municipal Bond Infrastructure Fund, Inc. (the “fund”) is registered under the Investment Company Act of 1940, as amended (the “Act”), as a non-diversified closed-end management investment company. The fund’s investment objective is to seek to provide as high a level of current income exempt from regular federal income tax as is consistent with the preservation of capital. The Dreyfus Corporation (the “Manager” or “Dreyfus”), a wholly-owned subsidiary of The Bank of New York Mellon Corporation (“BNY Mellon”), serves as the fund’s investment adviser. Effective January 31, 2018, BNY Mellon Asset Management North America Corporation (“BNY Mellon AMNA”), a wholly-owned subsidiary of BNY Mellon and an affiliate of Dreyfus, serves as the fund’s sub-investment adviser. BNY Mellon AMNA is a specialist multi-asset investment manager formed by the combination of certain BNY Mellon affiliated investment management firms, including Standish Mellon Asset Management Company LLC, which served as the fund's sub-investment adviser prior to January 31, 2018. The fund’s Common Stock trades on the New York Stock Exchange (the “NYSE”) under the ticker symbol DMB.
The fund has outstanding 750 shares of VMTPS, with a liquidation preference of $100,000 per share (plus an amount equal to accumulated but unpaid dividends upon liquidation) and a stated mandatory redemption date of February 1, 2021, which are not registered under the Act. The fund is subject to a Redemption and Paying Agent Agreement with The Bank of New York Mellon, a subsidiary of BNY Mellon and an affiliate of Dreyfus, with respect to the VMTPS.
The fund is subject to certain restrictions relating to the VMTPS. Failure to comply with these restrictions could preclude the fund from declaring any distributions to shareholders of Common Stock (“Common Shareholders”) or repurchasing shares of Common Stock and/or could trigger the mandatory redemption of VMTPS at liquidation value. Thus, redemptions of VMTPS may be deemed to be outside of the control of the fund. In addition, the VMTPS have a mandatory redemption date of February 1, 2021. The fund will have the right to request that the holders of 100% of the aggregate outstanding amount of the VMTPS, in their sole and absolute discretion, extend the term of the Term Redemption Date for an additional 364 day period.
The holders of VMTPS, voting as a separate class, have the right to elect at least two directors. The holders of VMTPS will vote as a separate class on certain other matters, as required by law. The fund’s Board of Directors
23
(the “Board”) has designated Nathan Leventhal and Benaree Pratt Wiley as directors to be elected by the holders of VMTPS.
The Financial Accounting Standards Board (“FASB”) Accounting Standards Codification is the exclusive reference of authoritative U.S. generally accepted accounting principles (“GAAP”) recognized by the FASB to be applied by nongovernmental entities. Rules and interpretive releases of the Securities and Exchange Commission (“SEC”) under authority of federal laws are also sources of authoritative GAAP for SEC registrants. The fund’s financial statements are prepared in accordance with GAAP, which may require the use of management estimates and assumptions. Actual results could differ from those estimates.
The fund enters into contracts that contain a variety of indemnifications. The fund’s maximum exposure under these arrangements is unknown. The fund does not anticipate recognizing any loss related to these arrangements.
(a) Portfolio valuation: The fair value of a financial instrument is the amount that would be received to sell an asset or paid to transfer a liability in an orderly transaction between market participants at the measurement date (i.e., the exit price). GAAP establishes a fair value hierarchy that prioritizes the inputs of valuation techniques used to measure fair value. This hierarchy gives the highest priority to unadjusted quoted prices in active markets for identical assets or liabilities (Level 1 measurements) and the lowest priority to unobservable inputs (Level 3 measurements).
Additionally, GAAP provides guidance on determining whether the volume and activity in a market has decreased significantly and whether such a decrease in activity results in transactions that are not orderly. GAAP requires enhanced disclosures around valuation inputs and techniques used during annual and interim periods.
Various inputs are used in determining the value of the fund’s investments relating to fair value measurements. These inputs are summarized in the three broad levels listed below:
Level 1—unadjusted quoted prices in active markets for identical investments.
Level 2—other significant observable inputs (including quoted prices for similar investments, interest rates, prepayment speeds, credit risk, etc.).
Level 3—significant unobservable inputs (including the fund’s own assumptions in determining the fair value of investments).
NOTES TO FINANCIAL STATEMENTS (continued)
24
The inputs or methodology used for valuing securities are not necessarily an indication of the risk associated with investing in those securities.
Changes in valuation techniques may result in transfers in or out of an assigned level within the disclosure hierarchy. Valuation techniques used to value the fund’s investments are as follows:
Investments in securities are valued each business day by an independent pricing service (the “Service”) approved by the Board. Investments for which quoted bid prices are readily available and are representative of the bid side of the market in the judgment of the Service are valued at the mean between the quoted bid prices (as obtained by the Service from dealers in such securities) and asked prices (as calculated by the Service based upon its evaluation of the market for such securities). Other investments (which constitute a majority of the portfolio securities) are carried at fair value as determined by the Service, based on methods which include consideration of the following: yields or prices of municipal securities of comparable quality, coupon, maturity and type; indications as to values from dealers; and general market conditions. All of the preceding securities are generally categorized within Level 2 of the fair value hierarchy.
The Service is engaged under the general supervision of the Board.
When market quotations or official closing prices are not readily available, or are determined to not accurately reflect fair value, such as when the value of a security has been significantly affected by events after the close of the exchange or market on which the security is principally traded, but before the fund calculates its net asset value, the fund may value these investments at fair value as determined in accordance with the procedures approved by the Board. Certain factors may be considered when fair valuing investments such as: fundamental analytical data, the nature and duration of restrictions on disposition, an evaluation of the forces that influence the market in which the securities are purchased and sold, and public trading in similar securities of the issuer or comparable issuers. These securities are either categorized within Level 2 or 3 of the fair value hierarchy depending on the relevant inputs used.
For restricted securities where observable inputs are limited, assumptions about market activity and risk are used and are generally categorized within Level 3 of the fair value hierarchy.
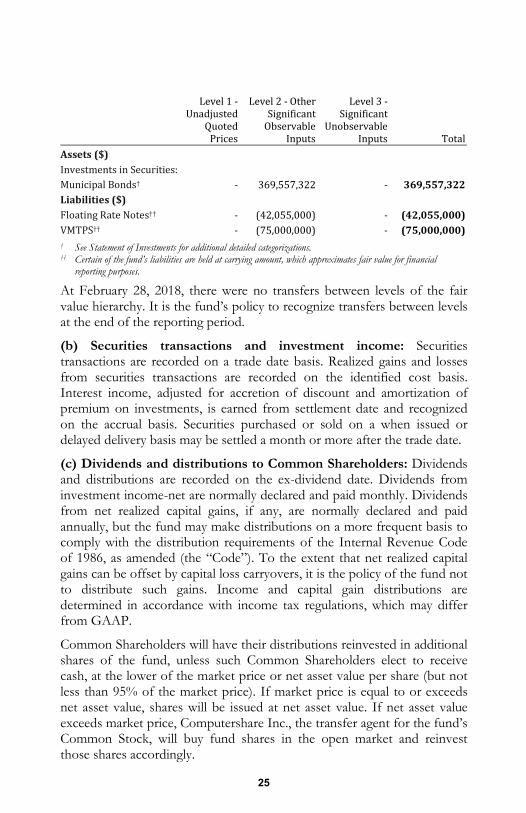
The following is a summary of the inputs used as of February 28, 2018 in valuing the fund’s investments:
25
Level 1 -Unadjusted Quoted PricesLevel 2 - Other Significant Observable Inputs
Level 3 -Significant Unobservable Inputs TotalAssets ($) Investments in Securities: Municipal Bonds† - 369,557,322 - 369,557,322Liabilities ($) Floating Rate Notes†† - (42,055,000) - (42,055,000)VMTPS†† - (75,000,000) - (75,000,000)† See Statement of Investments for additional detailed categorizations. †† Certain of the fund’s liabilities are held at carrying amount, which approximates fair value for financial
reporting purposes.
At February 28, 2018, there were no transfers between levels of the fair value hierarchy. It is the fund’s policy to recognize transfers between levels at the end of the reporting period.
(b) Securities transactions and investment income: Securities transactions are recorded on a trade date basis. Realized gains and losses from securities transactions are recorded on the identified cost basis. Interest income, adjusted for accretion of discount and amortization of premium on investments, is earned from settlement date and recognized on the accrual basis. Securities purchased or sold on a when issued or delayed delivery basis may be settled a month or more after the trade date.
(c) Dividends and distributions to Common Shareholders: Dividends and distributions are recorded on the ex-dividend date. Dividends from investment income-net are normally declared and paid monthly. Dividends from net realized capital gains, if any, are normally declared and paid annually, but the fund may make distributions on a more frequent basis to comply with the distribution requirements of the Internal Revenue Code of 1986, as amended (the “Code”). To the extent that net realized capital gains can be offset by capital loss carryovers, it is the policy of the fund not to distribute such gains. Income and capital gain distributions are determined in accordance with income tax regulations, which may differ from GAAP.
Common Shareholders will have their distributions reinvested in additional shares of the fund, unless such Common Shareholders elect to receive cash, at the lower of the market price or net asset value per share (but not less than 95% of the market price). If market price is equal to or exceeds net asset value, shares will be issued at net asset value. If net asset value exceeds market price, Computershare Inc., the transfer agent for the fund’s Common Stock, will buy fund shares in the open market and reinvest those shares accordingly.
NOTES TO FINANCIAL STATEMENTS (continued)
26
On February 2, 2018, the Board declared a cash dividend of $.0530 per share from investment income-net, payable on March 1, 2018 to Common Shareholders of record as of the close of business on February 16, 2018. The ex-dividend date was February 15, 2018.
(d) Dividends and distributions to shareholders of VMTPS: Dividends on VMTPS are normally declared daily and paid monthly. The Applicable Rate is equal to the rate per annum that results from the sum of the (a) Applicable Base Rate and (b) Ratings Spread as determined pursuant to the Applicable Rate Determination for the VMTPS on the Rate Determination Date immediately preceding such Subsequent Rate Period. The Applicable Rate of the VMTPS was equal to the sum of .95% per annum plus the Securities Industry and Financial Markets Association Municipal Swap Index rate of 1.09% on February 22, 2018. The dividend rate as of February 28, 2018 for the VMTPS was 2.04%.
(e) Federal income taxes: It is the policy of the fund to continue to qualify as a regulated investment company, which can distribute tax-exempt dividends, by complying with the applicable provisions of the Code, and to make distributions of income and net realized capital gain sufficient to relieve it from substantially all federal income and excise taxes.
As of and during the period ended February 28, 2018, the fund did not have any liabilities for any uncertain tax positions. The fund recognizes interest and penalties, if any, related to uncertain tax positions as income tax expense in the Statement of Operations. During the period ended February 28, 2018, the fund did not incur any interest or penalties.
Each tax year in the four-year period ended February 28, 2018 remains subject to examination by the Internal Revenue Service and state taxing authorities.
At February 28, 2018, the components of accumulated earnings on a tax basis were as follows: undistributed tax-exempt income $2,027,334, accumulated capital losses $34,802,995 and unrealized appreciation $28,050,707.
Under the Regulated Investment Company Modernization Act of 2010, the fund is permitted to carry forward capital losses for an unlimited period. Furthermore, capital loss carryovers retain their character as either short-term or long-term capital losses.
The accumulated capital loss carryover is available for federal income tax purposes to be applied against future net realized capital gains, if any, realized subsequent to February 28, 2018. The fund has $30,654,202 of
27
short-term capital losses and $4,148,793 of long-term capital losses which can be carried forward for an unlimited period.
The tax character of distributions paid to shareholders during the fiscal periods ended February 28, 2018 and February 28, 2017 were as follows: tax-exempt income $11,679,884 and $13,063,207, and ordinary income $11,056 and $24,764, respectively.
During the period ended February 28, 2018, as a result of permanent book to tax differences, primarily due to the tax treatment for amortization adjustments, dividend reclassification and nondeductable VMTPS offering costs, the fund increased accumulated undistributed investment income-net by $3,369, increased accumulated net realized gain (loss) on investments by $98,910 and decreased paid-in capital by $102,279. Net assets and net asset value per share were not affected by this reclassification.
(f) VMTPS: In the fund’s Statement of Assets and Liabilities, VMTPS aggregate liquidation preference is shown as a liability since they have a stated mandatory redemption date of February 1, 2021. Dividends paid to VMTPS are treated as interest expense and recorded on the accrual basis. Costs directly related to the issuance of the VMTPS are considered debt issuance costs which have been deferred and are being amortized into expense over the life of the VMTPS.
NOTE 2—Management Fee, Sub-Investment Advisory Fee and Other Transactions with Affiliates:
(a) Pursuant to a management agreement (the “Agreement”) with Dreyfus, the management fee is computed at the annual rate of .65% of the value of the fund’s daily total assets, including any assets attributable to effective leverage, minus certain defined accrued liabilities (the “Managed Assets”) and is payable monthly.
Pursuant to a sub-investment advisory agreement between Dreyfus and BNY Mellon AMNA, Dreyfus pays BNY Mellon AMNA a monthly fee at the annual rate of .27% of the value of the fund’s average daily Managed Assets.
(b) The fund compensates The Bank of New York Mellon under a custody agreement for providing custodial services for the fund. These fees are determined based on net assets and transaction activity. During the period ended February 28, 2018, the fund was charged $16,108 pursuant to the custody agreement. These fees were partially offset by earnings credits of $12,885.
NOTES TO FINANCIAL STATEMENTS (continued)
28
The fund has an arrangement with the custodian whereby the fund may receive earnings credits when positive cash balances are maintained, which are used to offset custody fees. For financial reporting purposes, the fund includes net earnings credits as an expense offset in the Statement of Operations.
The fund compensates The Bank of New York Mellon under a Redemption and Paying Agent Agreement for providing certain transfer agency and payment services with respect to the VMTPS for the fund. During the period ended February 28, 2018, the fund was charged $7,950 for the services provided by the Redemption and Paying Agent.
During the period ended February 28, 2018, the fund was charged $6,617 for services performed by the Chief Compliance Officer and his staff.
The components of “Due to The Dreyfus Corporation and affiliates” in the Statement of Assets and Liabilities consist of: management fees $186,690, custodian fees $600, Redemption and Paying Agent fees $4,638 and Chief Compliance Officer fees $4,396.
(c) Each Board member also serves as a Board member of other funds within the Dreyfus complex. Annual retainer fees and attendance fees are allocated to each fund based on net assets.
NOTE 3—Securities Transactions:
The aggregate amount of purchases and sales of investment securities, excluding short-term securities, during the period ended February 28, 2018, amounted to $39,088,586 and $31,989,595, respectively.
Inverse Floater Securities: The fund participates in secondary inverse floater structures in which fixed-rate, tax-exempt municipal bonds are transferred to a trust (the “Inverse Floater Trust”). The Inverse Floater Trust typically issues two variable rate securities that are collateralized by the cash flows of the fixed-rate, tax-exempt municipal bonds. One of these variable rate securities pays interest based on a short-term floating rate set by a remarketing agent at predetermined intervals (“Trust Certificates”). A residual interest tax-exempt security is also created by the Inverse Floater Trust, which is transferred to the fund, and is paid interest based on the remaining cash flows of the Inverse Floater Trust, after payment of interest on the other securities and various expenses of the Inverse Floater Trust. An Inverse Floater Trust may be collapsed without the consent of the fund due to certain termination events such as bankruptcy, default or other credit event.
The fund accounts for the transfer of bonds to the Inverse Floater Trust as secured borrowings, with the securities transferred remaining in the fund’s
29
investments, and the Trust Certificates reflected as fund liabilities in the Statement of Assets and Liabilities.
The fund may invest in inverse floater securities on either a non-recourse or recourse basis. These securities are typically supported by a liquidity facility provided by a bank or other financial institution (the “Liquidity Provider”) that allows the holders of the Trust Certificates to tender their certificates in exchange for payment from the Liquidity Provider of par plus accrued interest on any business day prior to a termination event. When the fund invests in inverse floater securities on a non-recourse basis, the Liquidity Provider is required to make a payment under the liquidity facility due to a termination event to the holders of the Trust Certificates. When this occurs, the Liquidity Provider typically liquidates all or a portion of the municipal securities held in the Inverse Floater Trust. A liquidation shortfall occurs if the Trust Certificates exceed the proceeds of the sale of the bonds in the Inverse Floater Trust (“Liquidation Shortfall”). When a fund invests in inverse floater securities on a recourse basis, the fund typically enters into a reimbursement agreement with the Liquidity Provider where the fund is required to repay the Liquidity Provider the amount of any Liquidation Shortfall. As a result, a fund investing in a recourse inverse floater security bears the risk of loss with respect to any Liquidation Shortfall.
The average amount of borrowings outstanding under the inverse floater structure during the period ended February 28, 2018 was approximately $42,055,000, with a related weighted average annualized interest rate of 1.67%.
VMTPS: The average amount of borrowings outstanding for the VMTPS during the period ended February 28, 2018 was approximately $75,000,000, with a related weighted average annualized interest rate of 2.15%.
At February 28, 2018, the cost of investments for federal income tax purposes was $299,451,615; accordingly, accumulated net unrealized appreciation on investments was $28,050,707, consisting of $28,683,170 gross unrealized appreciation and $632,463 gross unrealized depreciation.
REPORT OF INDEPENDENT REGISTERED PUBLIC ACCOUNTING FIRM
30
To the Shareholders and the Board of Directors of Dreyfus Municipal Bond Infrastructure Fund, Inc.
Opinion on the Financial Statements We have audited the accompanying statement of assets and liabilities of Dreyfus Municipal Bond Infrastructure Fund, Inc. (the “Fund”), including the statement of investments, as of February 28, 2018, and the related statement of operations for the year then ended, the statements of changes in net assets for each of the two years in the period then ended, the financial highlights for each of the five years in the period then ended and the related notes (collectively referred to as the “financial statements”). In our opinion, the financial statements present fairly, in all material respects, the financial position of Dreyfus Municipal Bond Infrastructure Fund, Inc. at February 28, 2018, the results of its operations for the year then ended, the changes in its net assets for each of the two years in the period then ended and its financial highlights for each of the five years in the period then ended, in conformity with U.S. generally accepted accounting principles.
Basis for opinion These financial statements are the responsibility of the Fund’s management. Our responsibility is to express an opinion on the Fund’s financial statements based on our audits. We are a public accounting firm registered with the Public Company Accounting Oversight Board (United States) (“PCAOB”) and are required to be independent with respect to the Fund in accordance with the U.S. federal securities laws and the applicable rules and regulations of the Securities and Exchange Commission and the PCAOB. We conducted our audits in accordance with the standards of the PCAOB. Those standards require that we plan and perform the audit to obtain reasonable assurance about whether the financial statements are free of material misstatement, whether due to error or fraud. The Fund is not required to have, nor were we engaged to perform, an audit of the Fund’s internal control over financial reporting. As part of our audits, we are required to obtain an understanding of internal control over financial reporting, but not for the purpose of expressing an opinion on the effectiveness of the Fund’s internal control over financial reporting. Accordingly, we express no such opinion. Our audits included performing procedures to assess the risks of material misstatement of the financial statements, whether due to error or fraud, and performing procedures that respond to those risks. Such procedures included examining, on a test basis, evidence regarding the amounts and disclosures in the financial statements. Our procedures included confirmation of securities owned as of February 28, 2018, by correspondence with the custodian and others or by other appropriate auditing procedures where replies were not received. Our audits also included evaluating the accounting principles used and significant estimates made by management, as well as evaluating the overall presentation of the financial statements. We believe that our audits provide a reasonable basis for our opinion.
We have served as the auditor of one or more Dreyfus investment companies since at least 1957, but we are unable to determine the specific year. New York, New York April 24, 2018

ADDITIONAL INFORMATION (Unaudited)
31
Dividend Reinvestment Plan
The fund’s Dividend Reinvestment Plan (the “Plan”) is commonly referred to as an “opt-out” plan. Each Common Shareholder who participates in the Plan will have all distributions of dividends and capital gains automatically reinvested in additional Common Shares by Computershare Inc. as agent (the “Plan Agent”). Common Shareholders who elect not to participate in the Plan will receive all distributions in cash, which will be paid by check and mailed directly to the shareholder of record (or if the shares are held in street or other nominee name, then to the nominee) by the Plan Agent, as dividend disbursing agent. Common Shareholders whose shares are held in the name of a broker or nominee should contact the broker or nominee to determine whether and how they may participate in the Plan. The Plan Agent serves as agent for the Common Shareholders in administering the Plan. After the fund declares a dividend or makes a capital gain distribution, the Plan Agent will, as agent for the shareholders, either (i) receive the cash payment and use it to buy Common Shares in the open market, on the NYSE or elsewhere, for the participants’ accounts or (ii) distribute newly issued Common Shares of the fund on behalf of the participants. The Plan Agent will receive cash from the fund with which to buy Common Shares in the open market if, on the distribution payment date, the net asset value per share exceeds the market price per Common Share plus estimated brokerage commissions on that date. The Plan Agent will receive the dividend or distribution in newly issued Common Shares of the fund if, on the payment date, the market price per share plus estimated brokerage commissions equals or exceeds the net asset value per share of the fund on that date. The number of shares to be issued will be computed at a per share rate equal to the greater of (i) the net asset value or (ii) 95% of the closing market price per Common Share on the payment date.
Participants in the Plan may withdraw from the Plan at any time upon written notice to the Plan Agent. Such withdrawal will be effective immediately if received not less than ten days prior to a distribution record date; otherwise, it will be effective for all subsequent distributions. When a participant withdraws from the Plan or the Plan is terminated, such participant will receive whole Common Shares in his or her account under the Plan and will receive a cash payment for any fraction of a Common Share credited to such account. If any participant elects to have the Plan Agent sell all or part of his or her Common Shares and remit the proceeds, the Plan Agent is authorized to deduct a $15.00 fee plus $0.10 per share in brokerage commissions.
In the case of shareholders, such as banks, brokers or nominees, which hold Common Shares for others who are the beneficial owners, the Plan Agent will administer the Plan on the basis of the number of Common Shares certified from time to time by the record shareholders as representing the total amount registered in the record shareholder’s name and held for the account of beneficial owners who are participants in the Plan.
The Plan Agent’s fees for the handling of reinvestment of dividends and other distributions will be paid by the fund. Each participant will pay a pro rata share of
ADDITIONAL INFORMATION (Unaudited) (continued)
32
brokerage commissions incurred with respect to the Plan Agent’s open market purchases in connection with the reinvestment of distributions. There are no other charges to participants for reinvesting dividends or capital gain distributions. Purchases and/or sales are usually made through a broker affiliated with the Plan Agent.
Experience under the Plan may indicate that changes are desirable. Accordingly, the fund reserves the right to amend or terminate the Plan as applied to any distribution paid subsequent to written notice of the change sent to all shareholders of the fund at least 90 days before the record date for the dividend or distribution. The Plan also may be amended or terminated by the Plan Agent by at least 90 days’ written notice to all shareholders of the fund. All correspondence concerning the Plan should be directed to the Plan Agent by calling 1-855-866-0953, or writing P.O. Box 43006, Providence, RI 02940-3006.
The automatic reinvestment of dividends and other distributions will not relieve participants of any income tax that may be payable or required to be withheld on such dividends or distributions. See “Tax Matters.”
Level Distribution Policy
The fund’s dividend policy is to distribute substantially all of its net investment income to its shareholders on a monthly basis. In order to provide shareholders with a more consistent yield to the current trading price of shares of Common Stock of the fund, the fund may at times pay out more or less than the entire amount of net investment income earned in any particular month and may at times in any month pay out any accumulated but undistributed income in addition to net investment income earned in that month. As a result, the dividends paid by the fund for any particular month may be more or less than the amount of net investment income earned by the fund during such month. The fund’s current accumulated but undistributed net investment income, if any, is disclosed in the Statement of Assets and Liabilities, which comprises part of the Financial Information included in this report.
Benefits and Risks of Leveraging
The fund utilizes leverage to seek to enhance the yield and net asset value of its Common Stock. These objectives cannot be achieved in all interest rate environments. To leverage, the fund has issued VMTPS and floating rate certificate securities, which pay dividends or interest at prevailing short-term interest rates, and invests the proceeds in long-term municipal bonds. The interest earned on these investments is paid to Common Shareholders in the form of dividends, and the value of these portfolio holdings is reflected in the per share net asset value of the fund’s Common Stock. In order for either of these forms of leverage to benefit Common Shareholders, the yield curve must be positively sloped: that is, short-term interest rates must be lower than long-term interest rates. At the same time, a period of generally declining interest rates will benefit Common Shareholders. If either of these conditions change along with other factors that may have an effect on preferred dividends or floating rate certificate securities, then the risk of leveraging will begin to outweigh the benefits.

33
Supplemental Information
During the period ended February 28, 2018, there were (i) no material changes in the fund’s investment objectives or fundamental investment policies and (ii) no changes in the fund’s charter or by-laws that would delay or prevent a change of control of the fund. Effective October 6, 2017, Christine L. Todd no longer serves as a portfolio manager of the fund. Daniel A. Rabasco, Jeffrey B. Burger and Thomas C. Casey continue to serve as the fund’s portfolio managers.

IMPORTANT TAX INFORMATION (Unaudited)
34
In accordance with federal tax law, the fund hereby reports all the dividends paid from investment income-net during its fiscal year ended February 28, 2018 as “exempt-interest dividends” (not generally subject to regular Federal income tax), except $11,056 that is being reported as an ordinary income distribution for reporting purposes. Where required by federal tax law rules, shareholders will receive notification of their portion of the fund’s taxable ordinary dividends (if any), capital gains distributions (if any) and tax-exempt dividends paid for the 2018 calendar year on Form 1099-DIV, which will be mailed in early 2019.
BOARD MEMBERS INFORMATION (Unaudited) INDEPENDENT BOARD MEMBERS
35
Joseph S. DiMartino (74) Chairman of the Board (2013) Current term expires in 2020
Principal Occupation During Past 5 Years: • Corporate Director and Trustee (1995-present)
Other Public Company Board Memberships During Past 5 Years: • CBIZ (formerly, Century Business Services, Inc.), a provider of outsourcing functions for small and
medium size companies, Director (1997-present)
No. of Portfolios for which Board Member Serves: 125 ———————
Francine J. Bovich (66) Board Member (2015) Current term expires in 2018
Principal Occupation During Past 5 Years: • Trustee, The Bradley Trusts, private trust funds (2011-present)
Other Public Company Board Membership During Past 5 Years: • Director, Annaly Capital Management, Inc., a real estate investment trust (May 2014-present)
No. of Portfolios for which Board Member Serves: 72 ———————
Isabel P. Dunst (71) Board Member (2014) Current term expires in 2020
Principal Occupation During Past 5 Years: • Senior Counsel to the law firm of Hogan Lovells LLP (2015-present; previously, Partner, 1990-
2014)
No. of Portfolios for which Board Member Serves: 33 ———————
Nathan Leventhal (75) Board Member (2013) Current term expires in 2019
Principal Occupation During Past 5 Years: • President Emeritus of Lincoln Center for the Performing Arts (2001-present) • Chairman of the Avery Fisher Artist Program (1997-2014)
Other Public Company Board Membership During Past 5 Years: • Movado Group, Inc., Director (2003-present)
No. of Portfolios for which Board Member Serves: 47 ———————
BOARD MEMBERS INFORMATION (Unaudited) (continued) INDEPENDENT BOARD MEMBERS (continued)
36
Robin A. Melvin (54) Board Member (2014) Current term expires in 2019
Principal Occupation During Past 5 Years: • Co-chairman, Illinois Mentoring Partnership, non-profit organization dedicated to increasing the
quantity and quality of mentoring services in Illinois (2014-present; board member since 2013)
No. of Portfolios for which Board Member Serves: 100 ———————
Roslyn M. Watson (68) Board Member (2014) Current term expires in 2018
Principal Occupation During Past 5 Years: • Principal, Watson Ventures, Inc., a real estate investment company (1993-present)
No. of Portfolios for which Board Member Serves: 58 ———————
Benaree Pratt Wiley (71) Board Member (2013) Current term expires in 2020
Principal Occupation During Past 5 Years: • Principal, The Wiley Group, a firm specializing in strategy and business development (2005-present)
Other Public Company Board Membership During Past 5 Years: • CBIZ (formerly, Century Business Services, Inc.), a provider of outsourcing functions for small and
medium size companies, Director (2008-present)
No. of Portfolios for which Board Member Serves: 79 ———————
INTERESTED BOARD MEMBERS
37
J. Charles Cardona (62) Board Member (2014) Current term expires in 2019
Principal Occupation During Past 5 Years: • Retired. President and a Director of the Manager (2008-2016), Chairman of the MBSC Securities
Corporation (“MBSC”) (2013-2016, Executive Vice President, 1997-2013) • No. of Portfolios for which Board Member Serves: 33
J. Charles Cardona is deemed to be an “interested person” (as defined under the Act) of the fund as a result of his previous affiliation with The Dreyfus Corporation.
——————— Gordon J. Davis (76) Board Member (2013) Current term expires in 2018
Principal Occupation During Past 5 Years: • Partner in the law firm of Venable LLP (2012-present)
Other Public Company Board Membership During Past 5 Years: • Consolidated Edison, Inc., a utility company, Director (1997-2014) • The Phoenix Companies, Inc., a life insurance company, Director (2000-2014)
No. of Portfolios for which Board Member Serves: 54
Gordon J. Davis is deemed to be an “interested person” (as defined under the Act) of the fund as a result of his affiliation with Venable LLP, which provides legal services to the fund.
———————
The address of the Board Members and Officers is c/o The Dreyfus Corporation, 200 Park Avenue, New York, New York 10166.
OFFICERS OF THE FUND (Unaudited)
38
BRADLEY J. SKAPYAK, President since December 2012.
Chief Operating Officer and a director of the Manager since June 2009, Chairman of Dreyfus Transfer, Inc., an affiliate of the Manager and the transfer agent of the funds, since May 2011 and Chief Executive Officer of MBSC Securities Corporation since August 2016. He is an officer of 62 investment companies (comprised of 125 portfolios) managed by the Manager. He is 59 years old and has been an employee of the Manager since February 1988.
BENNETT A. MACDOUGALL, Chief Legal Officer since October 2015.
Chief Legal Officer of the Manager and Associate General Counsel and Managing Director of BNY Mellon since June 2015; from June 2005 to June 2015, he served in various capacities with Deutsche Bank – Asset & Wealth Management Division, including as Director and Associate General Counsel, and Chief Legal Officer of Deutsche Investment Management Americas Inc. from June 2012 to May 2015. He is an officer of 63 investment companies (comprised of 150 portfolios) managed by the Manager. He is 46 years old and has been an employee of the Manager since June 2015.
JAMES BITETTO, Vice President since August 2005 and Secretary since February 2018.
Managing Counsel of BNY Mellon and Secretary of the Manager, and an officer of 63 investment companies (comprised of 150 portfolios) managed by the Manager. He is 51 years old and has been an employee of the Manager since December 1996.
JOSEPH M. CHIOFFI, Vice President and Assistant Secretary since December 2012.
Managing Counsel of BNY Mellon, and an officer of 63 investment companies (comprised of 150 portfolios) managed by the Manager. He is 56 years old and has been an employee of the Manager since June 2000.
MAUREEN E. KANE, Vice President and Assistant Secretary since April 2015.
Managing Counsel of BNY Mellon since July 2014; from October 2004 until July 2014, General Counsel, and from May 2009 until July 2014, Chief Compliance Officer of Century Capital Management. She is an officer of 63 investment companies (comprised of 150 portfolios) managed by the Manager. She is 56 years old and has been an employee of the Manager since July 2014.
SARAH S. KELLEHER, Vice President and Assistant Secretary since April 2014.
Senior Counsel of BNY Mellon since March 2013, from August 2005 to March 2013, Associate General Counsel of Third Avenue Management. She is an officer of 63 investment companies (comprised of 150 portfolios) managed by the Manager. She is 42 years old and has been an employee of the Manager since March 2013.
JEFF PRUSNOFSKY, Vice President and Assistant Secretary since December 2012.
Senior Managing Counsel of BNY Mellon, and an officer of 63 investment companies (comprised of 150 portfolios) managed by the Manager. He is 52 years old and has been an employee of the Manager since October 1990.
NATALYA ZELENSKY, Vice President and Assistant Secretary since March 2017.
Counsel and Vice President of BNY Mellon since May 2016; Attorney at Wildermuth Endowment Strategy Fund/Wildermuth Advisory, LLC from November 2015 until May 2016; Assistant General Counsel at RCS Advisory Services from July 2014 until November 2015; Associate at Sutherland, Asbill & Brennan from January 2013 until January 2014; Associate at K&L Gates from October 2011 until January 2013. She is an officer of 63 investment companies (comprised of 150 portfolios) managed by Dreyfus. She is 32 years old and has been an employee of the Manager since May 2016.
JAMES WINDELS, Treasurer since December 2012.
Director – Mutual Fund Accounting of the Manager, and an officer of 63 investment companies (comprised of 150 portfolios) managed by the Manager. He is 59 years old and has been an employee of the Manager since April 1985.
RICHARD CASSARO, Assistant Treasurer since December 2012.
Senior Accounting Manager – Money Market and Municipal Bond Funds of the Manager, and an officer of 63 investment companies (comprised of 150 portfolios) managed by the Manager. He is 59 years old and has been an employee of the Manager since September 1982.

39
GAVIN C. REILLY, Assistant Treasurer since December 2012.
Tax Manager of the Investment Accounting and Support Department of the Manager, and an officer of 63 investment companies (comprised of 150 portfolios) managed by the Manager. He is 49 years old and has been an employee of the Manager since April 1991.
ROBERT S. ROBOL, Assistant Treasurer since December 2012.
Senior Accounting Manager – Dreyfus Financial Reporting of the Manager, and an officer of 63 investment companies (comprised of 150 portfolios) managed by the Manager. He is 53 years old and has been an employee of the Manager since October 1988.
ROBERT SALVIOLO, Assistant Treasurer since December 2012.
Senior Accounting Manager – Equity Funds of the Manager, and an officer of 63 investment companies (comprised of 150 portfolios) managed by the Manager. He is 50 years old and has been an employee of the Manager since June 1989.
ROBERT SVAGNA, Assistant Treasurer since December 2002.
Senior Accounting Manager – Fixed Income and Equity Funds of the Manager, and an officer of 63 investment companies (comprised of 150 portfolios) managed by the Manager. He is 50 years old and has been an employee of the Manager since November 1990.
JOSEPH W. CONNOLLY, Chief Compliance Officer since December 2012.
Chief Compliance Officer of the Manager and The Dreyfus Family of Funds (63 investment companies, comprised of 150 portfolios). He is 60 years old and has served in various capacities with the Manager since 1980, including manager of the firm’s Fund Accounting Department from 1997 through October 2001.

NOTES
40
OFFICERS AND DIRECTORS Dreyfus Municipal Bond Infrastructure Fund, Inc. 200 Park Avenue New York, NY 10166
41
Directors Officers (continued) Joseph S. DiMartino, Chairman Assistant Treasurers (continued) Francine J. Bovich Robert Salviolo J. Charles Cardona† Robert Svagna Gordon J. Davis† Chief Compliance Officer Isabel P. Dunst Joseph W. Connolly Nathan Leventhal†† Portfolio Managers Robin A. Melvin Jeffrey Burger Roslyn M. Watson Thomas C. Casey Benaree Pratt Wiley†† Daniel A. Rabasco † Interested Board Member †† Elected by holders of VMTPS Manager Officers The Dreyfus Corporation President Custodian Bradley J. Skapyak The Bank of New York Mellon Chief Legal Officer Counsel Bennett A. MacDougall Proskauer Rose LLP Vice President and Secretary Transfer Agent, James Bitetto Dividend Disbursing Agent Vice Presidents and Assistant Secretaries and Registrar Joseph M. Chioffi Computershare Inc. Maureen E. Kane (Common Stock) Sarah S. Kelleher The Bank of New York Mellon Jeff Prusnofsky (VMTP Shares) Natalya Zelensky Stock Exchange Listing Treasurer NYSE Symbol: DMB James Windels Initial SEC Effective Date Assistant Treasurers 4/26/13 Richard Cassaro Gavin C. Reilly Robert S. Robol The fund’s net asset value per share appears in the following publications: Barron’s, Closed-End Bond Funds section under the heading “Municipal Bond Funds” every Monday; The Wall Street Journal, Mutual Funds section under the heading “Closed-End Funds” every Monday. Notice is hereby given in accordance with Section 23(c) of the Act that the fund may purchase shares of its common stock in the open market when it can do so at prices below the then current net asset value per share.
For More Information
Dreyfus Municipal Bond Infrastructure Fund, Inc. 200 Park Avenue New York, NY 10166 Manager The Dreyfus Corporation 200 Park Avenue New York, NY 10166 Sub-Investment Adviser BNY Mellon Asset Management North America Corporation BNY Mellon Center One Boston Place Boston, MA 02108-4408
Custodian The Bank of New York Mellon 225 Liberty Street New York, NY 10286 Transfer Agent & Registrar (Common Stock) Computershare Inc. 480 Washington Boulevard Jersey City, NJ 07310 Dividend Disbursing Agent (Common Stock) Computershare Inc. P.O. Box 30170 College Station, TX 77842
Ticker Symbol: DMB
The fund files its complete schedule of portfolio holdings with the Securities and Exchange Commission (“SEC”) for the first and third quarters of each fiscal year on Form N-Q. The fund’s Forms N-Q are available on the SEC’s website at www.sec.gov and may be reviewed and copied at the SEC’s Public Reference Room in Washington, D.C. (phone 1-800-SEC-0330 for information).
A description of the policies and procedures that the fund uses to determine how to vote proxies relating to portfolio securities and information regarding how the fund voted these proxies for the most recent 12-month period ended June 30 is available at www.dreyfus.com and on the SEC’s website at www.sec.gov and without charge, upon request, by calling 1-800-DREYFUS.
The fund posts regularly certain information at https://public.dreyfus.com/insightsideas/ research-articles/splash/DMB.html, including certain asset coverage and leverage ratios (within 5 business days of the last day of each month) and a fact sheet containing certain statistical information (within 15 business days of the last day of each month).
© 2018 MBSC Securities Corporation 0805AR0218