Embed Size (px)
Citation preview

How to Publish Your Quality Improvement Project—
DAVID COOPERBERG, MD DEPARTMENT OF PEDIATRICS SECTION OF HOSPITAL MEDICINE
Designing and Executing Your QI Project as Scholarly Activity

Acknowledgements
SCHC Resident QI Curriculum Team
Celeste Chamberlain, PhD, Director of Quality
Cheryl Gebeline-Myer, MS, former Director of Process Improvement
Mackenzie Frost, MD
Paul Shore, MD, MS
Improving Adolescent HIV Screening Team
Lorena Pereira, MD
Clint Steib, HIV Coordinator
Peter Osgood, MD
Roberta Laguerre, MD
Dan Conway, MD
Doug Thompson, MD, MMM
Evan Weiner, MD
Mario Cruz, MD (co-designed handout)
Katie McPeak, MD and the Improving Time to Third Next Available Newborn Clinic Team
Aarti Patel, MD and the Improving Nurse-Resident Communication Team
Tess Woehrlen, MPH and the Improving Hospitalist-Primary Care Provider Handoff Team

Objectives
1. Design a high-impact QI project 2. Apply the SQUIRE guideline to draft a QI manuscript

Disclosure
I have no relevant disclosures
Disclaimer
This talk is not about Quality Assurance Office of Research provides additional support and random reviews
through the QA/QI division
For more information: Contact: Office of Research Karen Skinner, MSN, RN, NHA, CCRP, Director QA/QI Kirtanaa Voralu BSc, MStat, Analyst
Drexel University1601 Cherry Street, Suite 10-444, Philadelphia, PA 19102 Tel: 215.255.7883 | Fax: 215.255.7874 http://www.drexel.edu/research/compliance/qa/
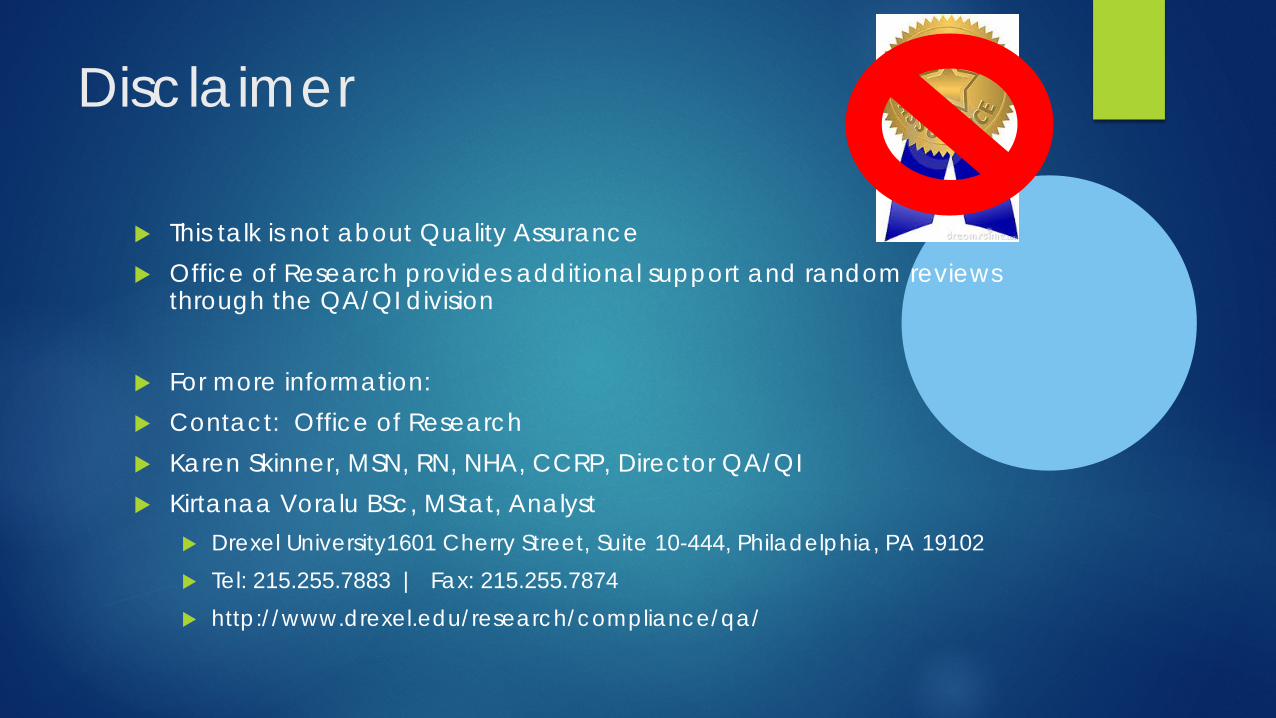
Resources
www.squire-statement.org
Handout: Quality Improvement Scholarship: Taking Your QI Project to the Next Level
Handout: Examples QI Posters
QI Abstract accepted as platform presentation
Published QI Reports

Brief Review of Quality Improvement in Healthcare
Systematic approach to problem identification and improvement
Multidisciplinary team process
Objective, data driven process
Minimizing variation in processes to improve outcomes
7

Outline
Steps in Designing and Executing QI Project
Use Standardized Quality Improvement Reporting Excellence (SQUIRE) Guideline to Draft QI Report Manuscript
Use example of Improving Adolescent HIV Screening Rates at SCHC

Adequate Preparation Before You Get Started…
Check with Drexel IRB Letter of determination
IRB exempt
Expedited IRB review

Adequate Preparation
CITI Training Perform Literature Review
Existing programs/projects Discuss with local/regional experts in field

Building Your Improvement Team
Identify Key Stakeholders
Stakeholder
Definition: Anyone who can help affect change or may be effected by the potential interventions

Consider Influence and Interest
Influence Interest
Option 1 High High
Option 2 High Low
Option 3 Low High
Option 4 Low Low
Jonathan Boutelle: Understanding Organizational Stakeholders for Design Success, 2004. http://www.boxesandarrows.com/view/understanding_organizational_stakeholders_for_design_success

Influence Interest
Option 1 High High
Option 2 High Low
Option 3 Low High
Option 4 Low Low
Jonathan Boutelle: Understanding Organizational Stakeholders for Design Success, 2004. http://www.boxesandarrows.com/view/understanding_organizational_stakeholders_for_design_success
Prioritize Stakeholders
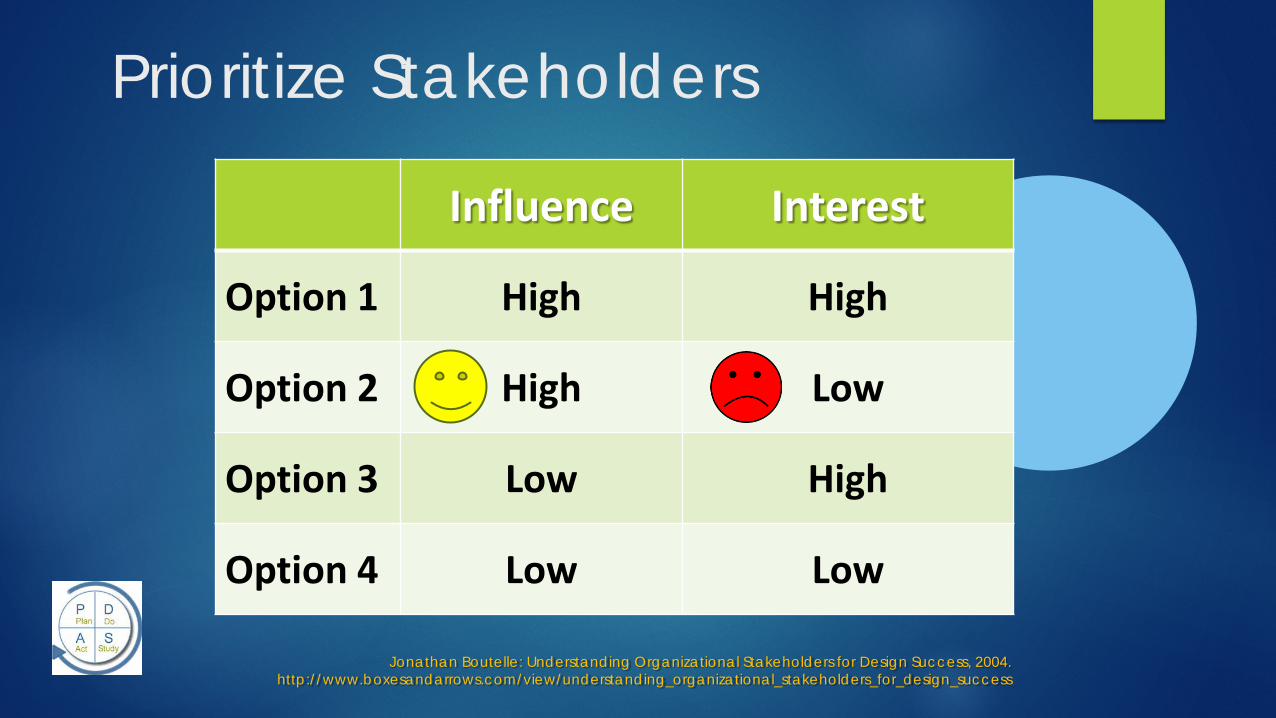
Influence Interest
Option 1 High High
Option 2 High Low
Option 3 Low High
Option 4 Low Low
Jonathan Boutelle: Understanding Organizational Stakeholders for Design Success, 2004. http://www.boxesandarrows.com/view/understanding_organizational_stakeholders_for_design_success
Prioritize Stakeholders

Influence Interest
Option 1 High High
Option 2 High Low
Option 3 Low High
Option 4 Low Low
Jonathan Boutelle: Understanding Organizational Stakeholders for Design Success, 2004. http://www.boxesandarrows.com/view/understanding_organizational_stakeholders_for_design_success
Prioritize Stakeholders

Self- and Team-Reflection
Does your improvement team have the requisite skills?
Do team members represent relevant perspectives?
Who else should join your improvement team?

Team Roster Project Year 2 (2012-2013) Team leader: Lorena Pereira Residents:
Yasmin Bahora Daria Ferro Zoabe Hafeez Diamond Harris Elisabeth Heal Ji Kong Meyeon Shin Peter Osgood Yesha Patel Lauren Weaver
HIV Coordinators: Barbara Bungy Clint Steib
Mentors: Daniel Conway David Cooperberg Jill Foster
Katie McPeak Roberta Frederick-Laguerre Doug Thompson

Getting Started
Selecting a High-Impact Project High Risk High Volume Problem-Prone
Evidence-based (Recognized Standard)
Align with Organizational Priorities
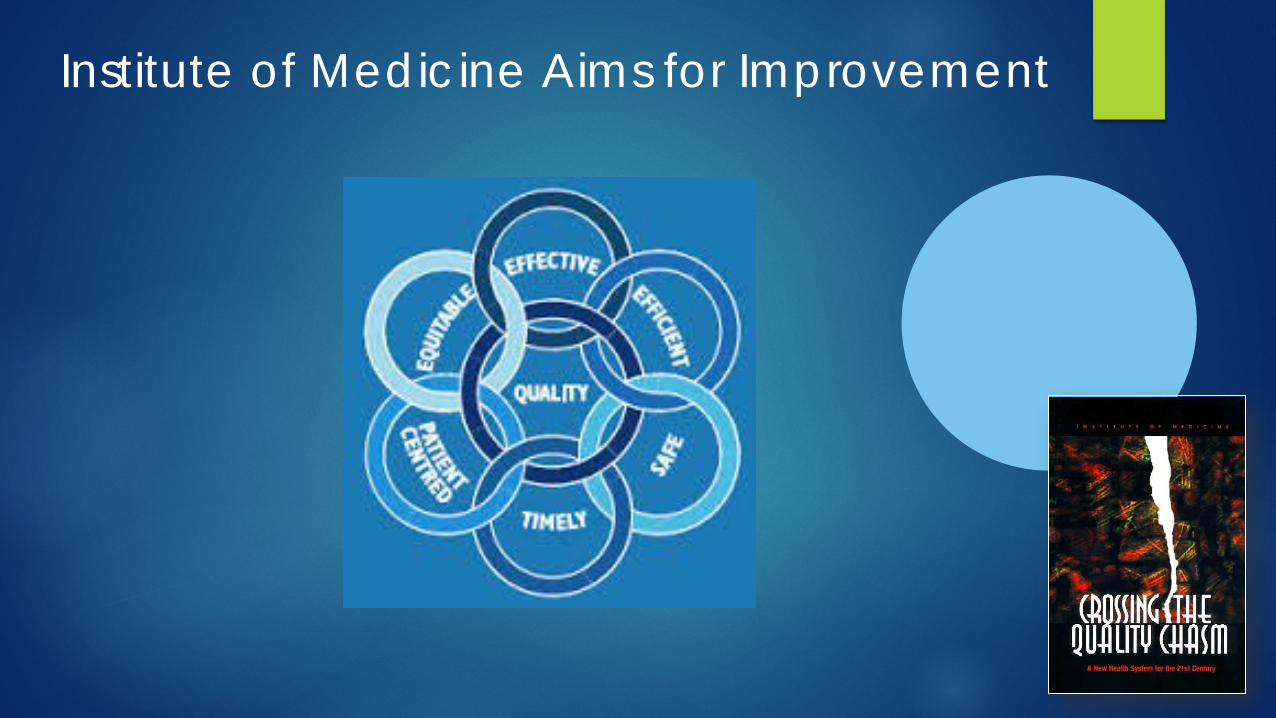
Institute of Medicine Aims for Improvement
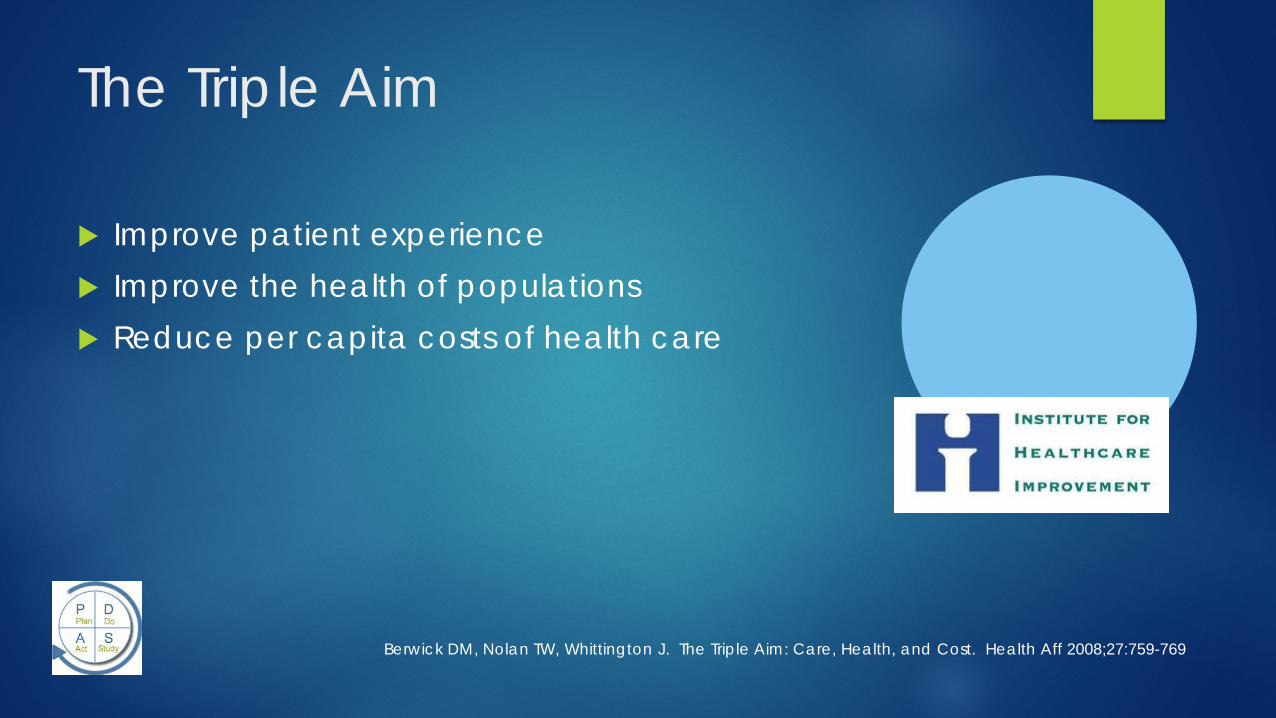
The Triple Aim
Improve patient experience Improve the health of populations Reduce per capita costs of health care
Berwick DM, Nolan TW, Whittington J. The Triple Aim: Care, Health, and Cost. Health Aff 2008;27:759-769
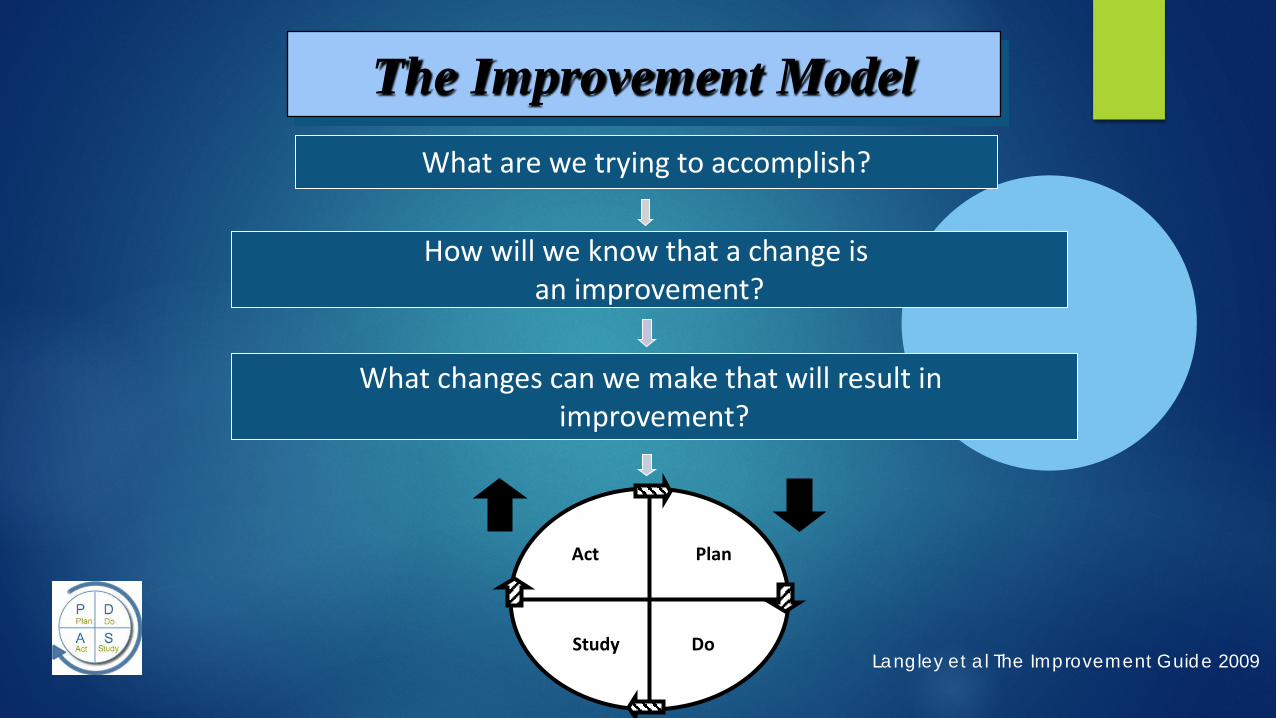
What are we trying to accomplish?
How will we know that a change is an improvement?
Plan
Do Study
Act
What changes can we make that will result in improvement?
The Improvement Model
Langley et al The Improvement Guide 2009

Introduction

Introduction
Brief Literature Review Nature and Severity of Local Problem Specific Aim Measures Primary and Secondary Study Questions

Brief Literature Review Incidence of AIDS has increased by 21% in youth aged 13-24 years1
Half of all new HIV infections occur in 13-24 year olds2
Risk-based testing associated with delayed diagnosis3 The 2006 CDC guideline4
Recommend HIV screening all patients ages 13-24 years if prevalence > 1/1000
Two sites describe improved screening rates in patients ages 13-64 years5 8% to 53% (New York)
3% to 17% (Louisiana)
No published studies describe improvement in adolescent screening rates 1AAP, Pediatrics 2011
2Spiegel H, Current HIV/AIDS Reports 2009 3CDC, MMWR 2011
4MMRW 2006 5Lin X, et.al, MMRW 2014

Nature and Severity of Local Problem
In Philadelphia, the incidence of HIV is FIVE TIMES the national average exceeding 1/1000
Prior to 2011, HIV screening at St. Christopher’s Hospital for Children Risk based
Inconsistent
Not always documented

What are we trying to accomplish?
How will we know that a change is an improvement?
Plan
Do Study
Act
What changes can we make that will result in improvement?
The Improvement Model
Langley et al The Improvement Guide 2009
Aim Statement

Establish Clear Goals
Global Aim Specific (SMART) Aim

Global Aim
Improve HIV Screening Rates in Adolescents
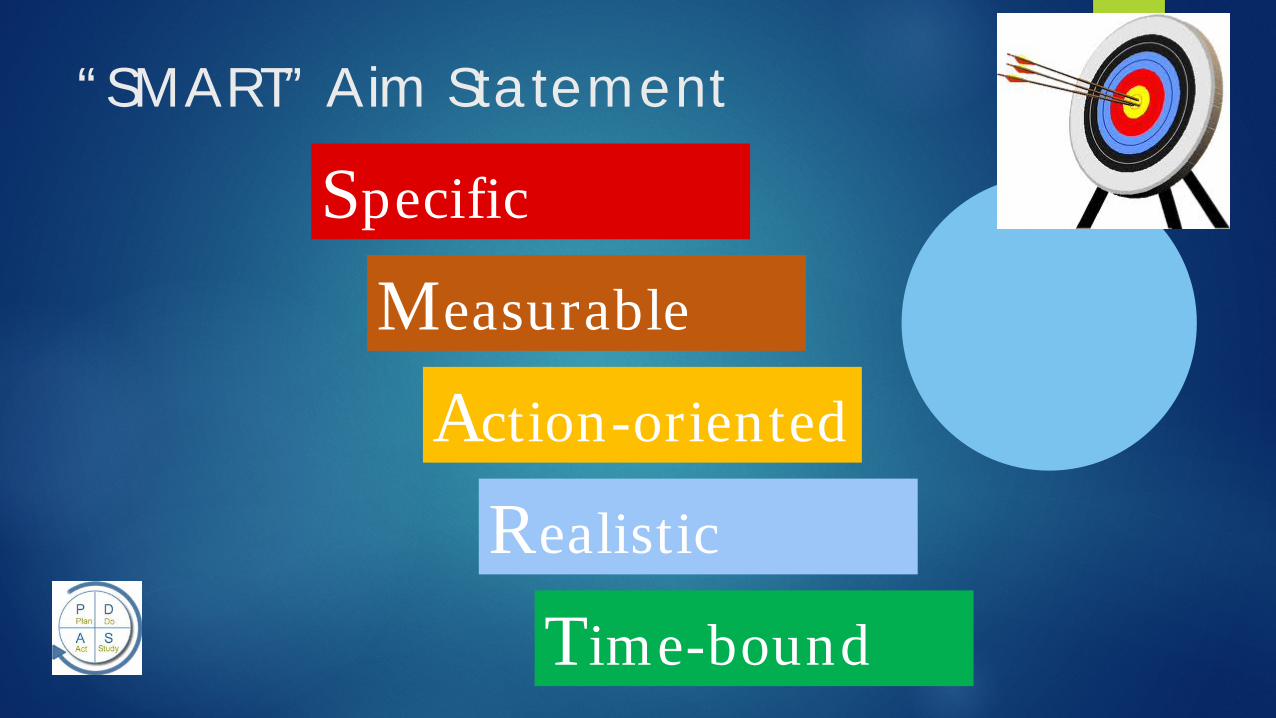
“SMART” Aim Statement
Specific
Measurable
Action-oriented
Realistic
Time-bound

Specific SMART Aim
By June 30, 2013, 70% of patients aged 13 years and above presenting to the SCHC CCAH ambulatory clinic will have a documented annual HIV screen

What are we trying to accomplish?
How will we know that a change is an improvement?
Plan
Do Study
Act
What changes can we make that will result in improvement?
The Improvement Model
Langley et al The Improvement Guide 2009
Measure

Measurement for QI
You can’t improve what you can’t (or don’t) measure
Measures tell a team if the changes they make are making a difference
Should speed improvement, not slow it down
Measurement is not the goal

Definitions Process Measure: whether an activity has been accomplished (i.e. was
PDSA cycle carried out as planned)
Outcome Measure: relate directly to aim; offer evidence that changes are having an impact at the system level
Balancing Measure: make sure that other important measure does not fall off
Langley, et.al, The Improvement Guide, 2nd edition

Process Measure Definition: HIV Screening in Adolescents in Ambulatory Clinic
Numerator: # patients age >/= 13 years for whom HIV screening test performed within the past 12 months in the Ambulatory Clinic Denominator: # patients age >/= 13 years who present to the Ambulatory Clinic
Reported monthly

Other measures (not specified in example)
Outcome Measure Examples would be:
% of newly-diagnosed patients presenting with AIDS
% of newly-diagnosed patients presenting with primary HIV infection
Balancing Measure (example would be rate of pregnancy testing in
female adolescents presenting to Ambulatory Clinic)

Primary and Secondary Study Question
Primary Study Question Can we design and implement interventions that reliably improve
HIV screening in adolescent patients in the ambulatory clinic?
Secondary Study Question (not stated)

METHODS

Methods
Ethical considerations Setting Planning the Intervention Planning the Study of the Intervention Methods of Evaluation Analysis

Setting
Describes local context and local processes
Planning the Intervention
Process Map of local process Key Driver Diagram

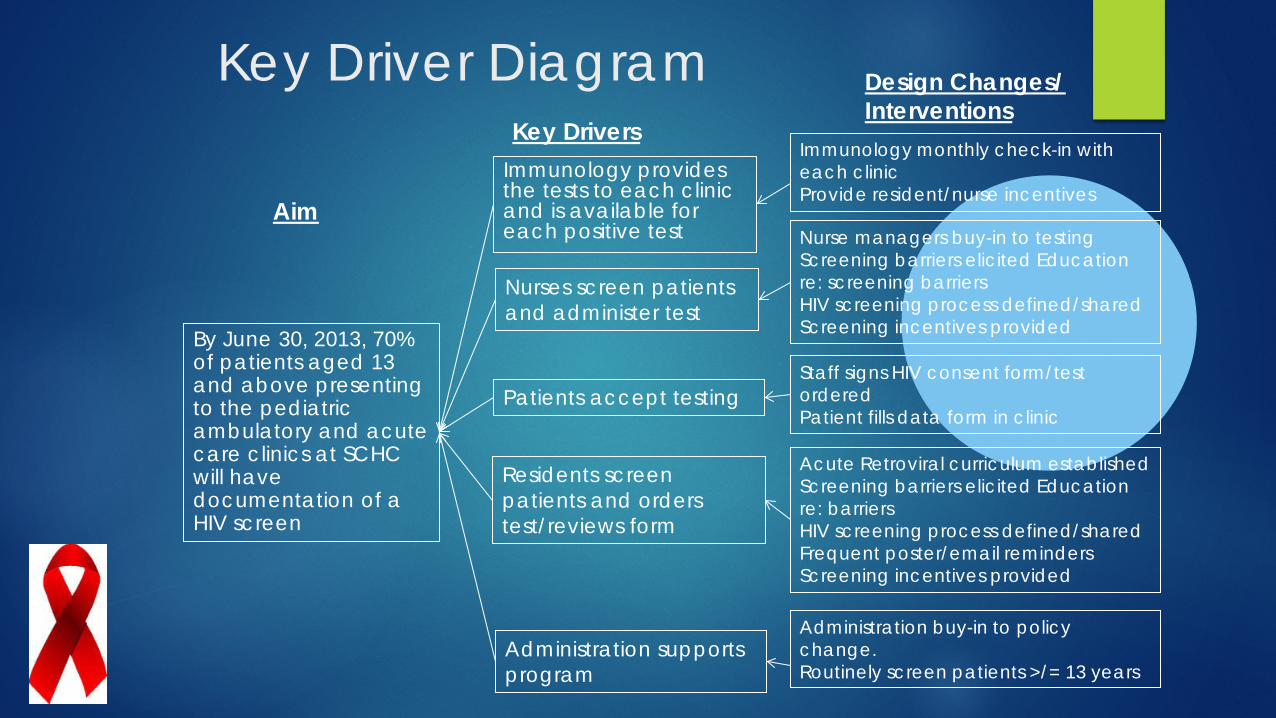
Key Driver Diagram
Key Drivers
Design Changes/ Interventions
Aim
An effective tool for breaking down complex questions or improvement goals and structuring them into smaller, more-focused “drivers”

Each Key Driver
Focused Answers the question, “What has to go right in order to accomplish
our aim?” Stated in the affirmative
Key Drivers
Design Changes/ Interventions
Aim
Key Driver Diagram
Immunology provides the tests to each clinic and is available for each positive test
By June 30, 2013, 70% of patients aged 13 and above presenting to the pediatric ambulatory and acute care clinics at SCHC will have documentation of a HIV screen
Nurses screen patients and administer test
Patients accept testing
Residents screen patients and orders test/reviews form
Immunology monthly check-in with each clinic Provide resident/nurse incentives
Nurse managers buy-in to testing Screening barriers elicited Education re: screening barriers HIV screening process defined/shared Screening incentives provided
Staff signs HIV consent form/test ordered Patient fills data form in clinic
Acute Retroviral curriculum established Screening barriers elicited Education re: barriers HIV screening process defined/shared Frequent poster/email reminders Screening incentives provided
Administration supports program
Administration buy-in to policy change. Routinely screen patients >/= 13 years

Plan-Do-Study-Act cycle ramp

What are we trying to accomplish?
How will we know that a change is an improvement?
Plan
Do Study
Act
What changes can we make that will result in improvement?
The Improvement Model
Langley et al The Improvement Guide 2009
Interventions

Standardized Process for HIV Screening
YES
YES NO
Test performed
Results reviewed
with patient
HIV test offered by nurse
Screening opportunity
missed
Screening opportunity
missed
NO NO
Patient fills out data form
Resident screens patient, fills out
form and tasks nurse

Intervention: Reminder Cards

Table of Interventions (examples) Category of Intervention
Specific Intervention Setting Date Initiated
Identifying Risks and Barriers
Collaboration with front-line staff to identify barriers to testing
Primary Pediatrics Clinic Emergency Department
April 2013 April 2013
Implementing Resources
HIV Coordinator hired 60-second HIV test implemented
Ambulatory Clinic Emergency Department
March 2012
Education Peer-to-peer review of screening process Nursing/MA Education on HIV testing kit Retroviral Curriculum for Residents
Ambulatory Clinic Ambulatory Clinic Hospital-wide
August 2012 September 2012 January 2013
Incentives Nursing Incentives Resident/Nursing Incentives
Ambulatory Clinic Hospital-wide
May 2012 March 2013
Provide Reminders Resident reminders Ambulatory Clinic December 2012
Survey/Evaluation Residents, Nurses, Medical Assistants survey of knowledge, attitudes, practices
Ambulatory Clinic March 2013
Policy Medical Executive Committee Approval
Hospital-wide March 2, 2013

Table of Interventions

Planning the Study of the Intervention Study Design
Observational time series with multiple planned sequential interventions

Planning the Study of the Intervention
Methods to Ensure Internal Validity of Data Improve documentation of screening tests performed (Compare to laboratory administrative data)
Planning the Study of the Intervention
Methods to Promote External Validity/Generalizability

Level 1: Straw
Level 2: Wood
Level 3: Brick
RELIABILITY

Education Training Feedback Try Harder
LEVEL 1 RELIABILITY

Standardize process Redundancy Decision aids
LEVEL 2 RELIABILITY
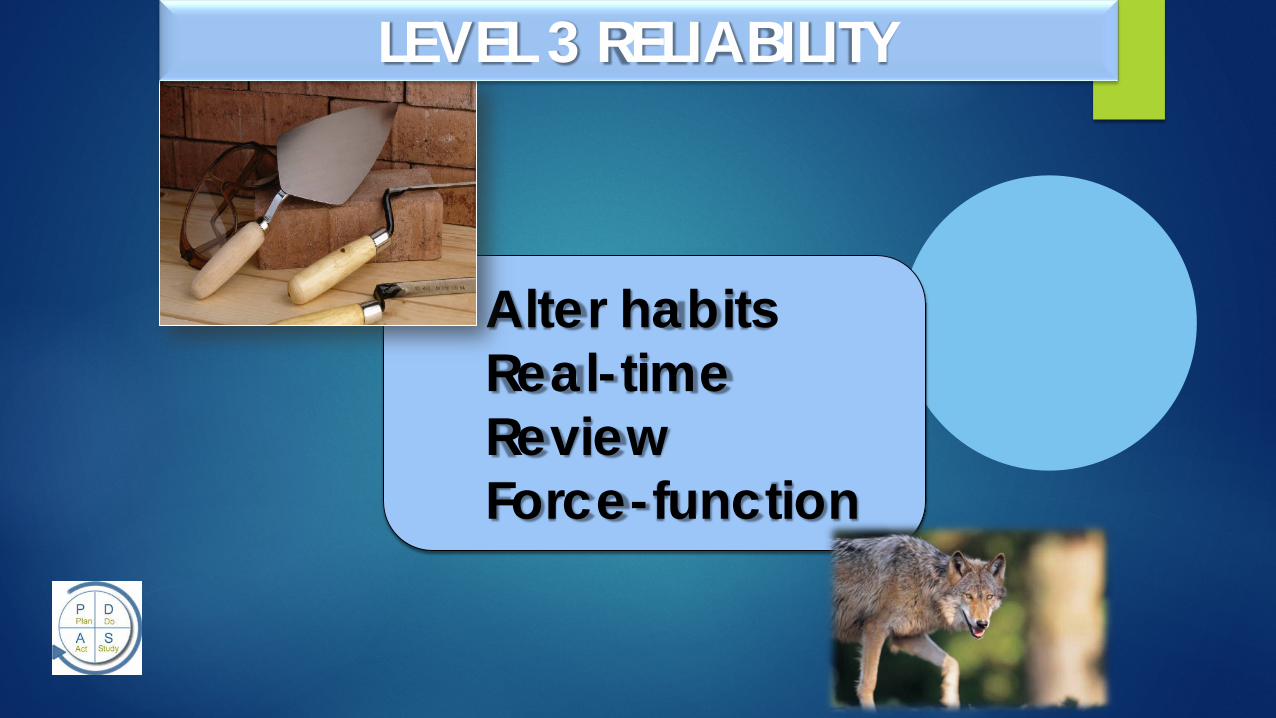
Alter habits Real-time Review Force-function
LEVEL 3 RELIABILITY

Planning the Study of the Intervention Methods to Promote External Validity/Generalizability
Level 1 reliability interventions Reminders Education Incentives
Level 2 reliability interventions Standardize screening process Policy change
Level 3 reliability interventions Alter everyday habits

Methods of Evaluation
HIV coordinator tracks testing via outpatient clinic form # tests performed
patient age
location of testing

Analysis
Statistical Process Control Charts created using QI Charts©1
Rules for Detecting Special Cause Variation2 were used to
differentiate special cause from common cause variation
1QI Charts©, Scoville Associates 2009 2Shewhart WA. The Economic Control of Quality of Manufactured Product 1931

Results

Results
Outcomes

Results
Outcomes During the study period (January 2012 – April 2013)
Rate of HIV screening in Ambulatory Clinic improved from 34% to 84%
3 new patients were diagnosed with HIV
1 previously known HIV+ patient who had been lost-to-follow-up was re-introduced to specialty care

Statistical Process Control
Statistical Process Control Powerful tool for quality improvement projects Foundation in theory of variation Shows when changes are occurring due to Special Cause
Variation v. Common Cause Variation
Involves Control Limits and tests of change Plot Data in Run Order Calculate the Center Line Calculate Control Limits
• Average rate +/- 3*standard deviation
Langley G, The Improvement Guide 2009

0%
10%
20%
30%
40%
50%
60%
70%
80%
90%
100%
1/1/
12
2/1/
12
3/1/
12
4/1/
12
5/1/
12
6/1/
12
7/1/
12
8/1/
12
9/1/
12
10/1
/12
11/1
/12
12/1
/12
1/1/
13
2/1/
13
3/1/
13
4/1/
13
Resident education and approval to screen in Acute Care as well
Nursing staff education
Change in policy: age of screening lowered from 15 to 13 years
Incentives provided to residents
Incentives provided to nursing staff
Ambulatory Screening Rates

Understanding Variation
Common Cause Variation: variation expected within a given system Example: The high temperature in Philadelphia in March (variation from
-3 degrees to 60 degrees Fahrenheit may be expected)
Special Cause Variation: variation beyond what is expected in a given system

Rules for Detecting Special Cause
A single point outside the control limits 8 consecutive points on one side of the mean 6 consecutive points increasing or decreasing 2 of 3 consecutive points in the outer 1/3 approaching the
control limit
Shewhart WA. The Economic Control of Quality of Manufactured Product 1931

0%
10%
20%
30%
40%
50%
60%
70%
80%
90%
100%
1/1/
12
2/1/
12
3/1/
12
4/1/
12
5/1/
12
6/1/
12
7/1/
12
8/1/
12
9/1/
12
10/1
/12
11/1
/12
12/1
/12
1/1/
13
2/1/
13
3/1/
13
4/1/
13
Resident education and approval to screen in Acute Care as well
Nursing staff education
Change in policy: age of screening lowered from 15 to 13 years
Incentives provided to residents
Incentives provided to nursing staff
Ambulatory Screening Rates

HIV Screening Rates: Patients >/= 13 years by Month (Jan 2012 – April 2013)
0%
5%
10%
15%
20%
25%
30%
1/…
2/…
3/…
4/…
5/…
6/…
7/…
8/…
9/… 1… 1… 1… 1/…
2/…
3/…
4/…
Overall HIV screening rates
0%
5%
10%
15%
20%
25%
30%
1/…
2/…
3/…
4/…
5/…
6/…
7/…
8/…
9/… 1… 1… 1… 1/…
2/…
3/…
4/…
ED screening rate
0%10%20%30%40%50%60%70%80%90%
100%
1/…
2/…
3/…
4/…
5/…
6/…
7/…
8/…
9/…
10…
11…
12…
1/…
2/…
3/…
4/…
Ambulatory Screening Rates
0%10%20%30%40%50%60%70%80%90%
100%
1/…
2/…
3/…
4/…
5/…
6/…
7/…
8/…
9/…
10…
11…
12…
1/…
2/…
3/…
4/…
Primary Peds Screening Rates
0%
5%
10%
15%
20%
25%
30%
1/…
2/…
3/…
4/…
5/…
6/…
7/…
8/…
9/… 1… 1… 1… 1/…
2/…
3/…
4/…
Inpatient Screening Rates

Discussion

Discussion
Summary Relation to other evidence Limitations Interpretation Conclusion
Summary
Keys to Success Inter-professional collaboration
Front-line staff engagement
Resident Leadership Broadcasting ‘Great Catches’ Peer-to-Peer Model of Education

Relation to other evidence
Recently published study (June 2014 MMWR) Improved screening rates in NY and LA in patients ages 13-64 years Still well-short of universal screening Did not specifically address adolescent HIV screening

Limitations
Internal Validity Data not cross-referenced with laboratory administrative data Possible that testing in ED is not documented

Limitations
External Validity/Generalizability Local Context

Limitations External Validity/Generalizability
Dedicated HIV coordinator (funded via Gilead) The Dorothy Mann Center (funded via Ryan White Fund)
6 physicians (1 immunologist, 3 infectious disease specialists, 1 general pediatrician, 1 psychiatrist)
1 physician’s assistant
1 nurse practitioner
1 licensed practicing nurse
2 social workers
2 case managers
Local QI Culture

Interpretation
Next Steps Utilize technology (in EHR) to facilitate screening
Decision aids Pre-checked orders for screening
Spread this intervention through a multisite collaborative

Conclusion Implications for future study of improvement interventions Links between routine screening
Earlier detection/treatment Decreased rate of presenting with advanced HIV infection Decreased high-risk behaviors Decreased transmission of HIV Decreased incidence of HIV in adolescents in one community Decreased healthcare costs
A multisite collaborative may accelerate improvement

Other
Funding
Other
Funding Grant from Gilead
Rapid HIV tests
HIV tester/data collector
Dorothy Mann Center is funded by Part A and Part B Ryan White HIV/AIDS Treatment Modernization Act
AIDS Activities Coordinating Office in Philadelphia


Examples

Examples

Examples

Example: Abstract Submission accepted as Platform Presentation Title: Effect of a Newborn Access Program on Third Next Available Appointment and No-Show Rates in
an urban, underserved academic healthcare center Katie E McPeak, M.D.1, Deborah A Sandrock, M.D.1, David Cooperberg, M.D.1, Selima N Shuler-Jenkins1, Bruce A Bernstein, PhD.1 and Lee M Pachter, D.O.1. 1Section of General Pediatrics, St. Christopher's Hospital for Children, Philadelphia, PA, United States.
Background: Timely access (72 hrs per AAP) to post-discharge newborn (NB) care can be challenging. Prior to our intervention, NBs in our center were scheduled into resident continuity clinics. NB scheduling problems resulted in overbooking, high no-shows, and delayed access to care.
Objective: To decrease time to third next available appointments (TNAA) by 50% within 6 months. Design/Methods: A multidisciplinary team was formed, consisting of practice leadership, clinical and
non-clinical staff. Utilizing planned sequential interventions, this team developed and piloted a NB clinic with a new scheduling model, aiming to have NBs seen in a single point of entry to care. TNAA is calculated weekly utilizing methods published on www.ihi.org (Institute for Healthcare Improvement). No-show rates were extracted via Next Gen EPM. We used QI Charts© to create statistical process control charts. The API rules for detecting special cause variation were applied.
Results: TNAA decreased by 78% within 2 months. No-show rates decreased after intervention (9.6% vs. 12.2%, p=0.05). An additional 63 NBs were seen in 6 months, at an average charge of $145/visit. This amounts to a return on investment of roughly $18,000/year.
Conclusions: Timely access to NB care was achieved, aligning our center's aim with AAP recommendations. Keys to success were: a dedicated NB team, warm-call reminders, and a supply-demand scheduling model. Significant reduction in TNAA was accomplished. While temporally related, this intervention does not demonstrate causality. Next steps are to measure sustainability and replicate this model at other centers. Future outcome measures include breastfeeding sustainability and re-admission rates for jaundice and breastfeeding issues.

Results
#scheduled newborn appointments
# kept newborn appointments
# no-show newborn appointments
% No show rate (#no show/#scheduled)
Pre-Intervention 1128 860 137 12.15%
Post-Intervention 1132 923 109 9.63%
Delta (change) Post vs. Pre Implementation
+4 +63 -28 -2.52%

Time to Third Next Available Appointments

Examples of Published QI Reports
Brady PW, Muething S, Kotagal U, et.al, Improving situation awareness to reduce unrecognized clinical deterioration and serious safety events. Pediatrics. 2013;131(1):e298-308.
Volpe D, Harrison S, Damian F, et.al, Improving timeliness of antibiotic delivery for patients with fever and suspected neutropenia in a pediatric emergency department. Pediatrics. 2012;130(1):e201-10.
Fischer D, Cochran KM, Provost LP, et.al, Reducing central line-associated bloodstream infections in North Carolina NICUs. Pediatrics. 2013;132(6):e1664-71.