Embed Size (px)
Citation preview

Dressed for Success?The Effect of School Uniforms on Achievement and
Behavior
Growth of Uniform AdoptionIncreasingly, urban school districts in the US have been adopting uniform dress codes.
In 1996 only 3% of public schools required uniforms.
Long Beach, CA became first large district to require uniforms for all students in 1994.
In 1996 President Clinton & US Dept. of Education tried to make it easier for districts to adopt uniforms.
By 2005 14% of public schools had uniforms
Uniforms have since spread to many major US school districts. New York City, Houston, Philadelphia, Chicago, Dallas, Boston
Evidence on Uniform ImpactsMany politicians & school administrators believe uniforms lead to improved behavior and higher test scores.
Actual empirical evidence is very sparse & unclear.Brunsma & Rockquemore (1998), Brunsma (2004), Stanley (1996), Yeung (2009)
Potentially suffer from substantial bias.Prior research relies on cross-sectional OLS or first-difference evidence.Uniforms likely to be adopted in schools with more behavior/achievement problems.
What We DoAdministrative data on student behavior, attendance and test scores in a large urban school district in the southwest (LUSD-SW).
Schools in LUSD choose whether and when to adopt uniforms.
Use variation in school uniform policies over time to assess impact of uniforms on student outcomes.
Account for endogenous uniform adoption & student switching through student fixed-effects, school fixed-effects, & school-specific linear time-trends.
Test for residual trending and enforcement.
How Might Uniforms Affect Achievement, Attendance, & Behavior?
Provide regimentation respect for authority.
Improve safety via identification of trespassers attend school more.
Make students feel as part of a community and reduce pressure on students to “fit in” attend school more.
May encourage positive attitudes, increase self esteem.
On other hand, may stifle expression forcing them to rebel against authority.
Focus on uniforms may distract from other discipline.
Uniforms in LUSD
Schools in LUSD choose whether to require uniforms both cross-sectional & time variation.
Uniform policies Specific colored polo shirts – between 1 and 3 colors, sometimes specific to grade levelSpecific style of pants - e.g. kahki, denimSometimes require shirt with school emblem.
Violating uniform policy can result in punishments as severe as in-school suspension.

Typical LUSD Uniforms
Data
Administrative records on individual students from 1993 – 2006.
Disciplinary infractions and attendance rates.
Stanford Achievement Test scores (1998 and later).
Student demographics.
Dates of school uniform adoption determined via survey of school principals.
79% of schools in operation in 2007-08 provided year of adoption, 14% date could not be determined, 7% refused.
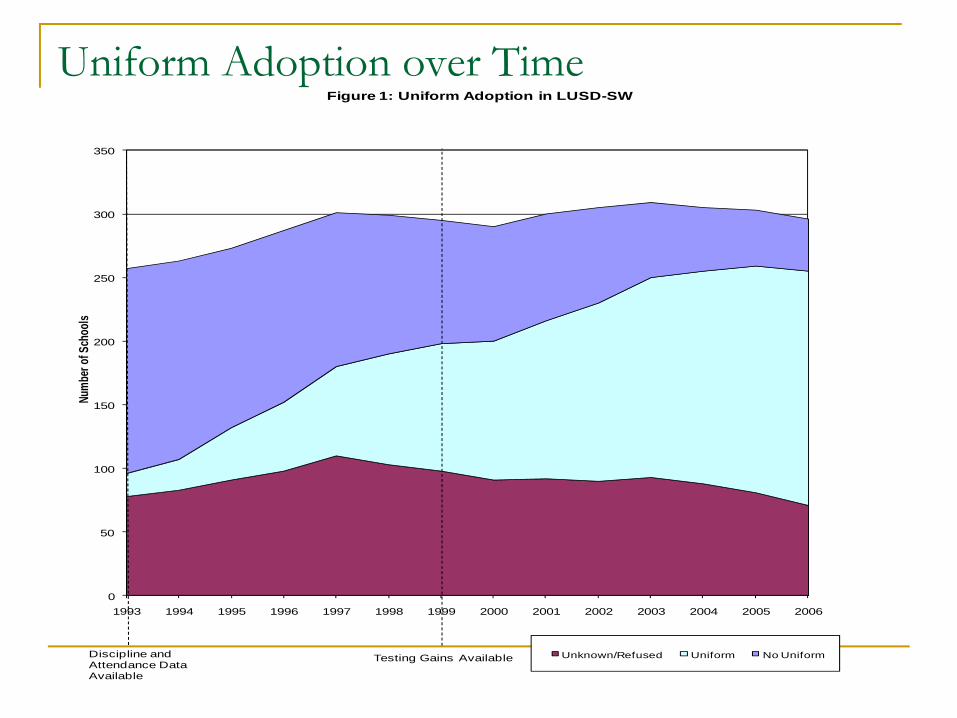
Uniform Adoption over Time
0
50
100
150
200
250
300
350
1993 1994 1995 1996 1997 1998 1999 2000 2001 2002 2003 2004 2005 2006
Numb
er of
Scho
olsFigure 1: Uniform Adoption in LUSD-SW
Unknown/Refused Uniform No UniformDiscipline and Attendance Data Available
Testing Gains Available
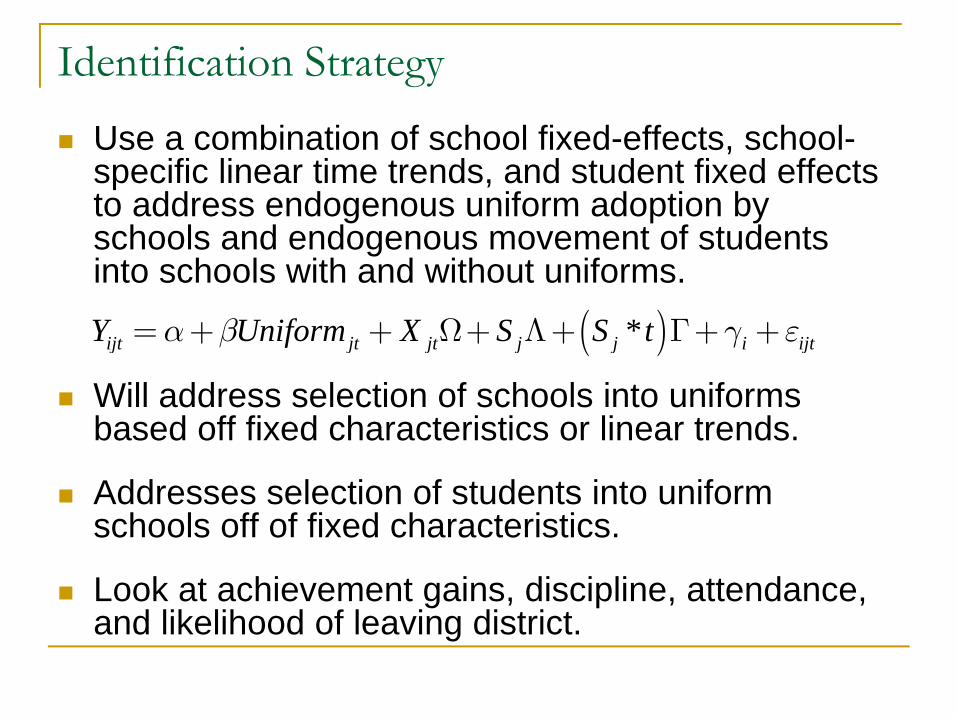
Identification Strategy
Use a combination of school fixed-effects, school-specific linear time trends, and student fixed effects to address endogenous uniform adoption by schools and endogenous movement of students into schools with and without uniforms.
Will address selection of schools into uniforms based off fixed characteristics or linear trends.
Addresses selection of students into uniform schools off of fixed characteristics.
Look at achievement gains, discipline, attendance, and likelihood of leaving district.
( )*ijt jt jt j j i ijtY Uniform X S S tα β γ ε= + + Ω+ Λ+ Γ+ +
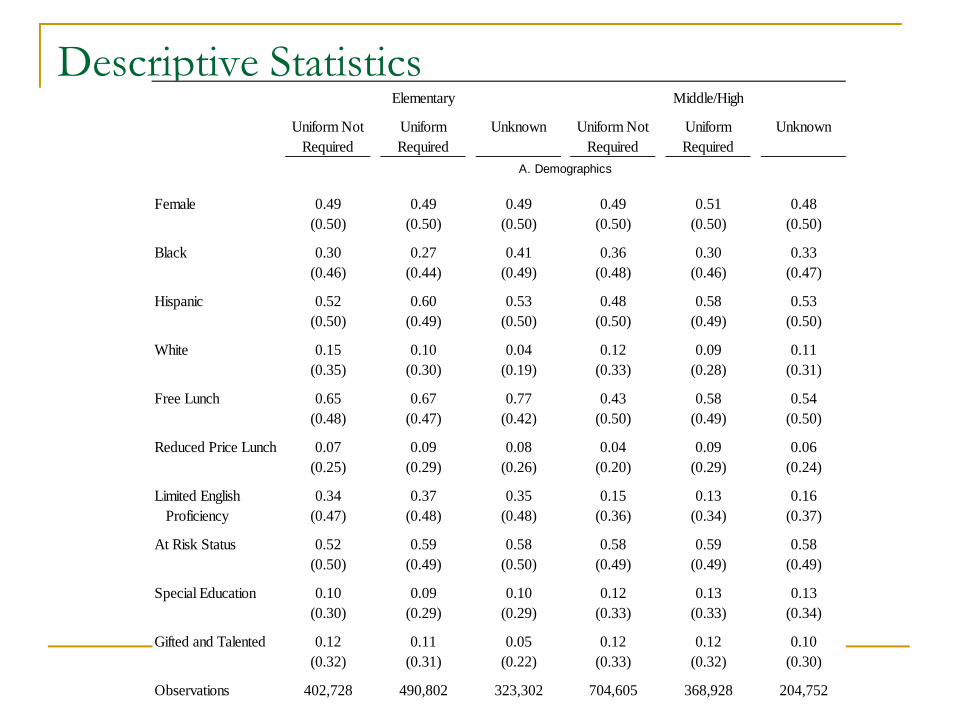
Descriptive StatisticsUniform Not
RequiredUniform Required
Unknown Uniform Not Required
Uniform Required
Unknown
Female 0.49 0.49 0.49 0.49 0.51 0.48(0.50) (0.50) (0.50) (0.50) (0.50) (0.50)
Black 0.30 0.27 0.41 0.36 0.30 0.33(0.46) (0.44) (0.49) (0.48) (0.46) (0.47)
Hispanic 0.52 0.60 0.53 0.48 0.58 0.53(0.50) (0.49) (0.50) (0.50) (0.49) (0.50)
White 0.15 0.10 0.04 0.12 0.09 0.11(0.35) (0.30) (0.19) (0.33) (0.28) (0.31)
Free Lunch 0.65 0.67 0.77 0.43 0.58 0.54(0.48) (0.47) (0.42) (0.50) (0.49) (0.50)
Reduced Price Lunch 0.07 0.09 0.08 0.04 0.09 0.06(0.25) (0.29) (0.26) (0.20) (0.29) (0.24)
Limited English 0.34 0.37 0.35 0.15 0.13 0.16 Proficiency (0.47) (0.48) (0.48) (0.36) (0.34) (0.37)
At Risk Status 0.52 0.59 0.58 0.58 0.59 0.58(0.50) (0.49) (0.50) (0.49) (0.49) (0.49)
Special Education 0.10 0.09 0.10 0.12 0.13 0.13(0.30) (0.29) (0.29) (0.33) (0.33) (0.34)
Gifted and Talented 0.12 0.11 0.05 0.12 0.12 0.10(0.32) (0.31) (0.22) (0.33) (0.32) (0.30)
Observations 402,728 490,802 323,302 704,605 368,928 204,752
Elementary Middle/High
A. Demographics
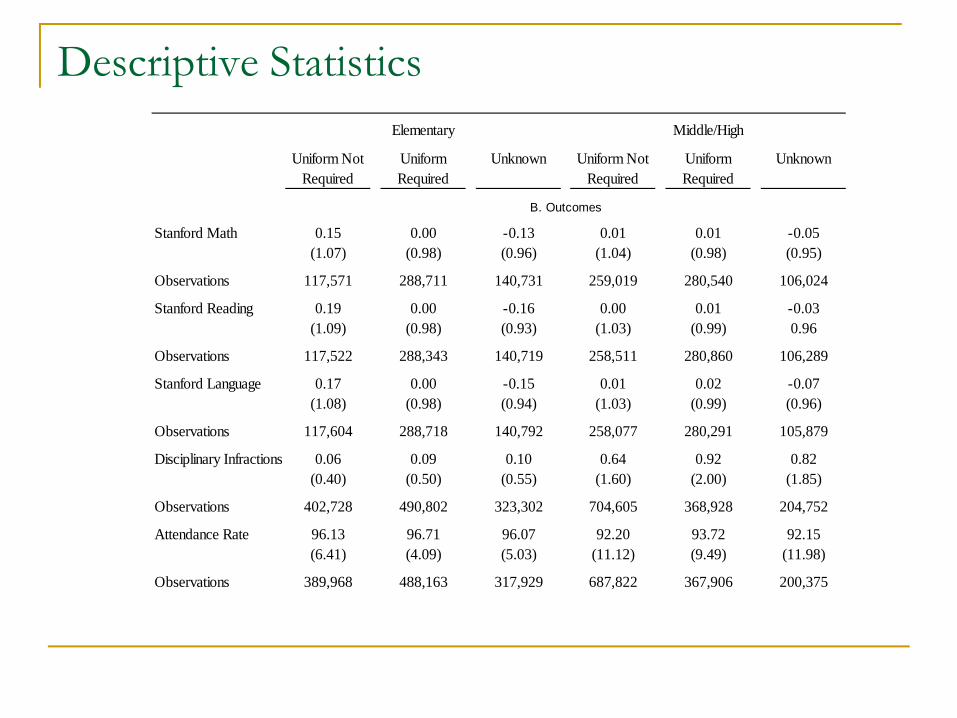
Descriptive Statistics
Uniform Not Required
Uniform Required
Unknown Uniform Not Required
Uniform Required
Unknown
Stanford Math 0.15 0.00 -0.13 0.01 0.01 -0.05(1.07) (0.98) (0.96) (1.04) (0.98) (0.95)
Observations 117,571 288,711 140,731 259,019 280,540 106,024
Stanford Reading 0.19 0.00 -0.16 0.00 0.01 -0.03(1.09) (0.98) (0.93) (1.03) (0.99) 0.96
Observations 117,522 288,343 140,719 258,511 280,860 106,289
Stanford Language 0.17 0.00 -0.15 0.01 0.02 -0.07(1.08) (0.98) (0.94) (1.03) (0.99) (0.96)
Observations 117,604 288,718 140,792 258,077 280,291 105,879
Disciplinary Infractions 0.06 0.09 0.10 0.64 0.92 0.82(0.40) (0.50) (0.55) (1.60) (2.00) (1.85)
Observations 402,728 490,802 323,302 704,605 368,928 204,752
Attendance Rate 96.13 96.71 96.07 92.20 93.72 92.15(6.41) (4.09) (5.03) (11.12) (9.49) (11.98)
Observations 389,968 488,163 317,929 687,822 367,906 200,375
Elementary Middle/High
B. Outcomes
Effect of Uniforms on Attendance and Discipline
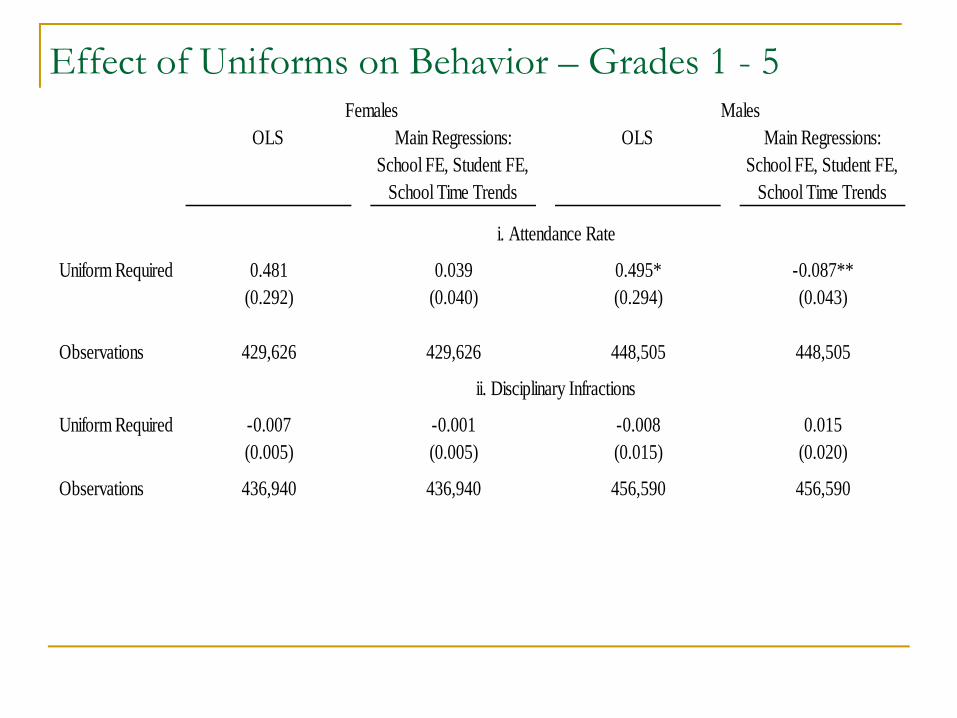
Effect of Uniforms on Behavior – Grades 1 - 5
OLS Main Regressions:School FE, Student FE,
School Time Trends
OLS Main Regressions:School FE, Student FE,
School Time Trends
Uniform Required 0.481 0.039 0.495* -0.087**(0.292) (0.040) (0.294) (0.043)
Observations 429,626 429,626 448,505 448,505
Uniform Required -0.007 -0.001 -0.008 0.015(0.005) (0.005) (0.015) (0.020)
Observations 436,940 436,940 456,590 456,590
Females Males
i. Attendance Rate
ii. Disciplinary Infractions
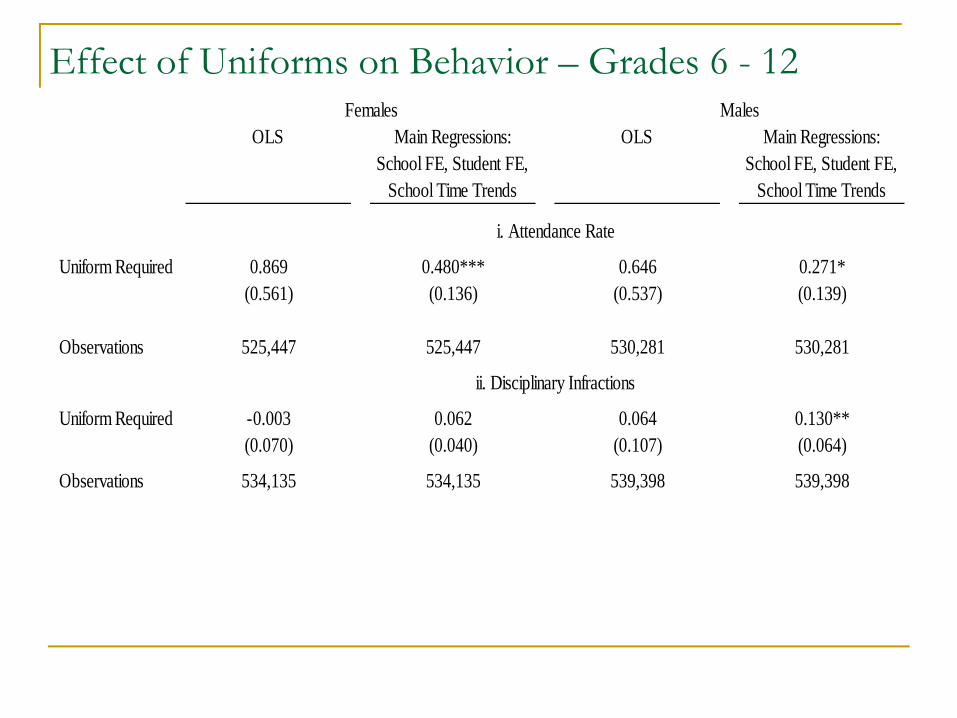
Effect of Uniforms on Behavior – Grades 6 - 12
OLS Main Regressions:School FE, Student FE,
School Time Trends
OLS Main Regressions:School FE, Student FE,
School Time Trends
Uniform Required 0.869 0.480*** 0.646 0.271*(0.561) (0.136) (0.537) (0.139)
Observations 525,447 525,447 530,281 530,281
Uniform Required -0.003 0.062 0.064 0.130**(0.070) (0.040) (0.107) (0.064)
Observations 534,135 534,135 539,398 539,398
Females Males
i. Attendance Rate
ii. Disciplinary Infractions
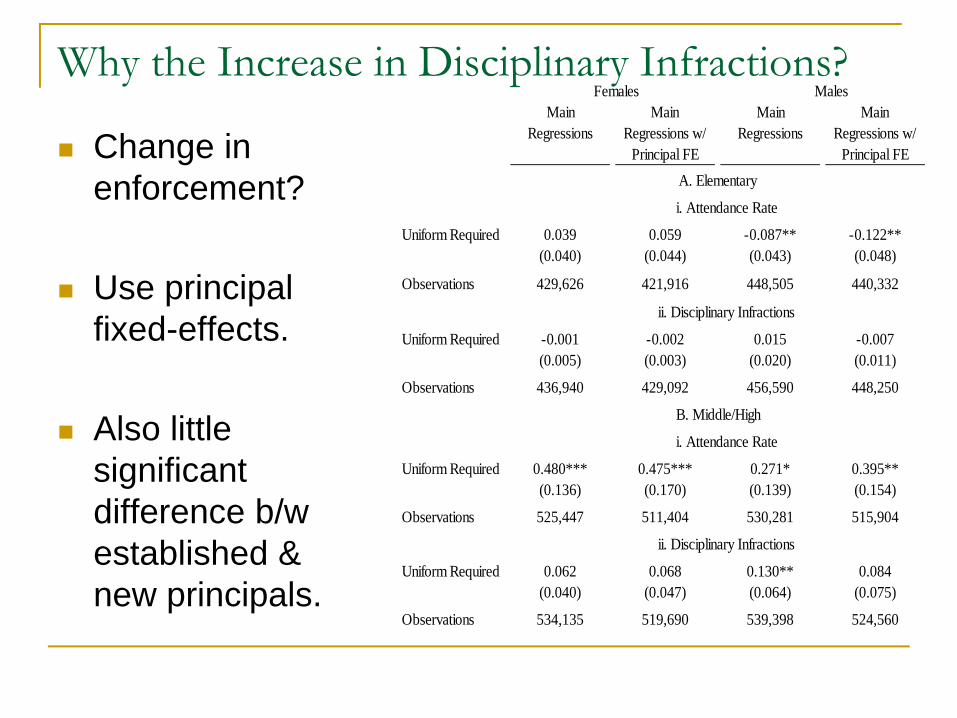
Why the Increase in Disciplinary Infractions?
Change in enforcement?
Use principal fixed-effects.
Also little significant difference b/w established & new principals.
Main Regressions
Main Regressions w/
Principal FE
Main Regressions
Main Regressions w/
Principal FE
Uniform Required 0.039 0.059 -0.087** -0.122**(0.040) (0.044) (0.043) (0.048)
Observations 429,626 421,916 448,505 440,332
Uniform Required -0.001 -0.002 0.015 -0.007(0.005) (0.003) (0.020) (0.011)
Observations 436,940 429,092 456,590 448,250
Uniform Required 0.480*** 0.475*** 0.271* 0.395**(0.136) (0.170) (0.139) (0.154)
Observations 525,447 511,404 530,281 515,904
Uniform Required 0.062 0.068 0.130** 0.084(0.040) (0.047) (0.064) (0.075)
Observations 534,135 519,690 539,398 524,560
Females Males
i. Attendance Rate
ii. Disciplinary Infractions
i. Attendance Rate
ii. Disciplinary Infractions
A. Elementary
B. Middle/High
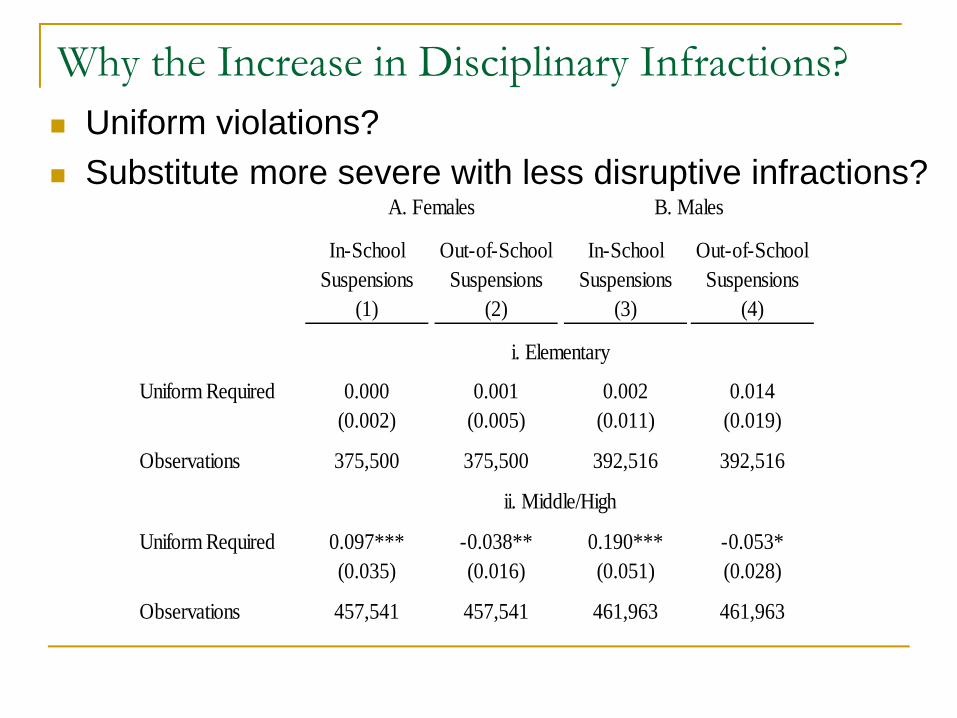
Why the Increase in Disciplinary Infractions?Uniform violations?Substitute more severe with less disruptive infractions?
In-School Suspensions
Out-of-School Suspensions
In-School Suspensions
Out-of-School Suspensions
(1) (2) (3) (4)
Uniform Required 0.000 0.001 0.002 0.014(0.002) (0.005) (0.011) (0.019)
Observations 375,500 375,500 392,516 392,516
Uniform Required 0.097*** -0.038** 0.190*** -0.053*(0.035) (0.016) (0.051) (0.028)
Observations 457,541 457,541 461,963 461,963
A. Females
ii. Middle/High
B. Males
i. Elementary
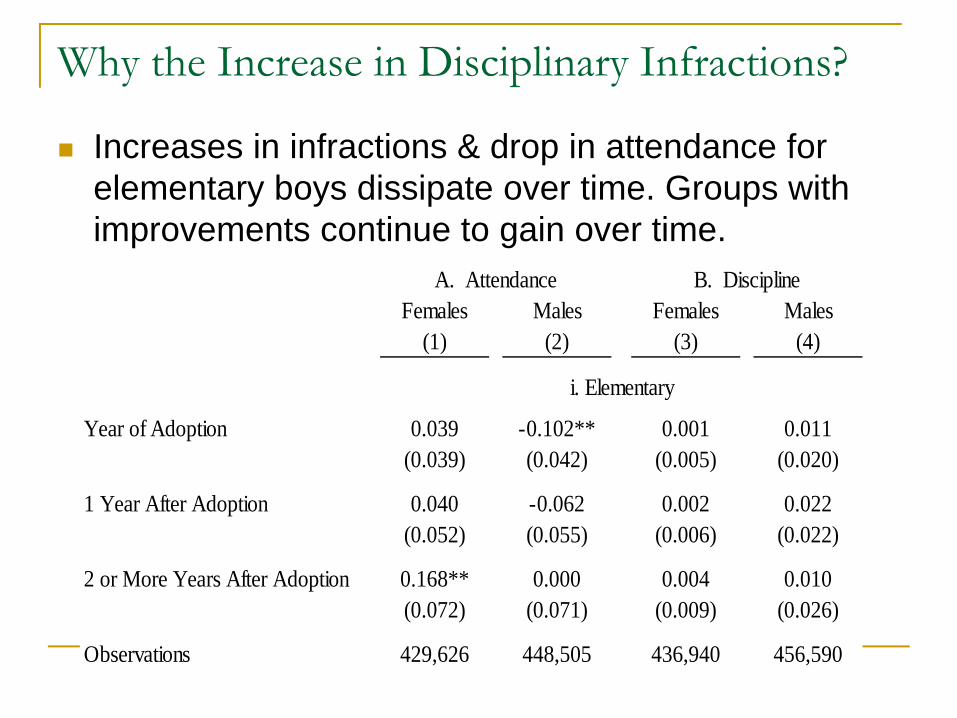
Why the Increase in Disciplinary Infractions?
Increases in infractions & drop in attendance for elementary boys dissipate over time. Groups with improvements continue to gain over time.
Females Males Females Males(1) (2) (3) (4)
Year of Adoption 0.039 -0.102** 0.001 0.011(0.039) (0.042) (0.005) (0.020)
1 Year After Adoption 0.040 -0.062 0.002 0.022(0.052) (0.055) (0.006) (0.022)
2 or More Years After Adoption 0.168** 0.000 0.004 0.010(0.072) (0.071) (0.009) (0.026)
Observations 429,626 448,505 436,940 456,590
i. Elementary
A. Attendance B. Discipline
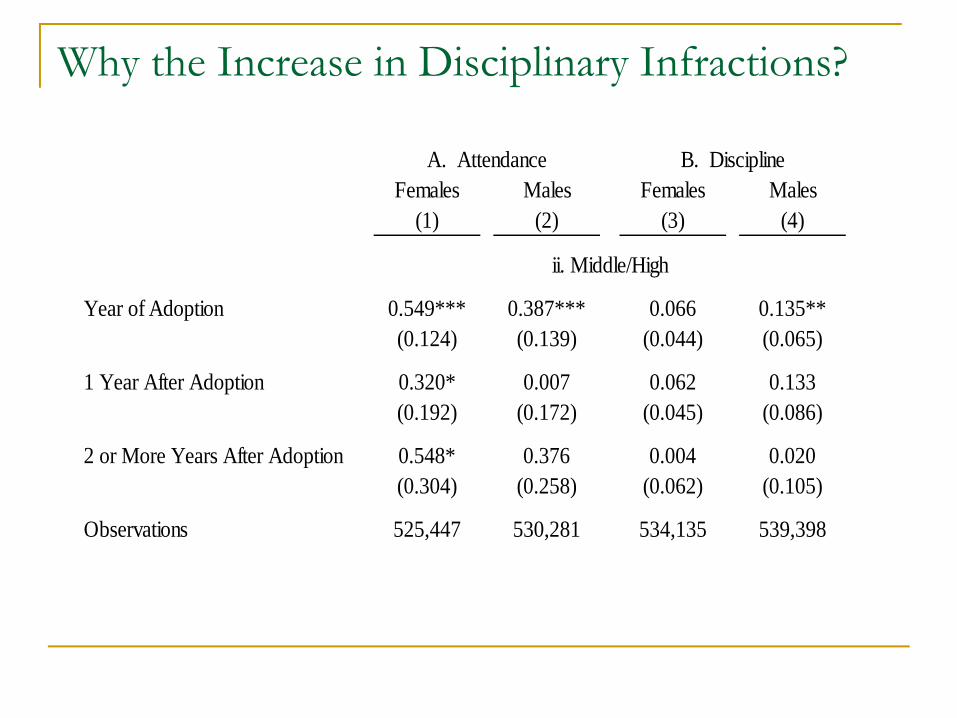
Why the Increase in Disciplinary Infractions?
Females Males Females Males(1) (2) (3) (4)
Year of Adoption 0.549*** 0.387*** 0.066 0.135**(0.124) (0.139) (0.044) (0.065)
1 Year After Adoption 0.320* 0.007 0.062 0.133(0.192) (0.172) (0.045) (0.086)
2 or More Years After Adoption 0.548* 0.376 0.004 0.020(0.304) (0.258) (0.062) (0.105)
Observations 525,447 530,281 534,135 539,398
ii. Middle/High
A. Attendance B. Discipline
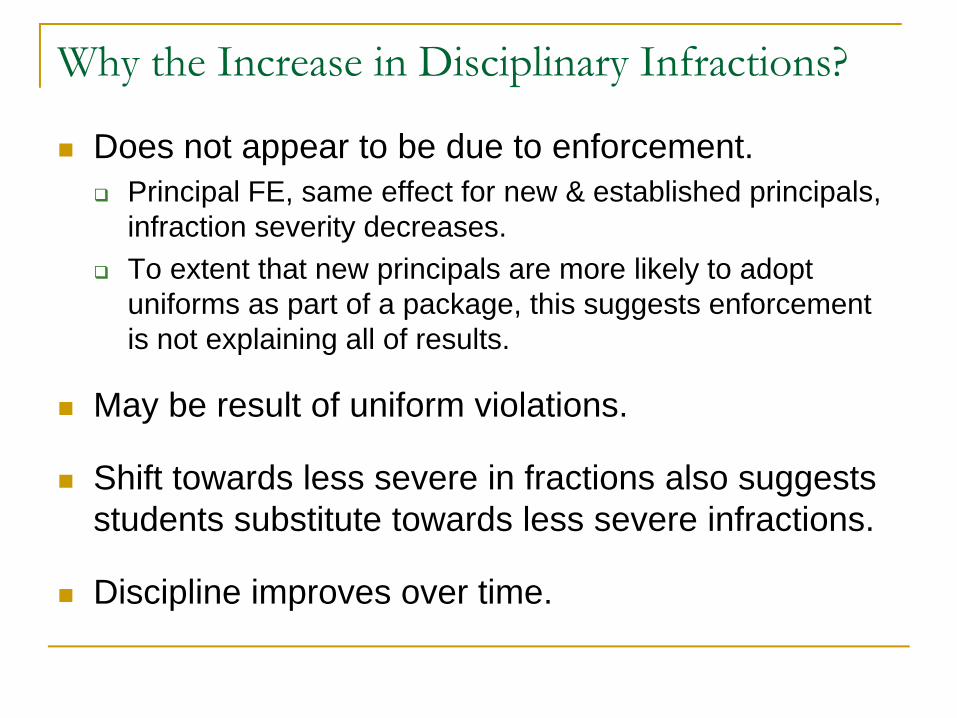
Why the Increase in Disciplinary Infractions?
Does not appear to be due to enforcement.Principal FE, same effect for new & established principals, infraction severity decreases.To extent that new principals are more likely to adopt uniforms as part of a package, this suggests enforcement is not explaining all of results.
May be result of uniform violations.
Shift towards less severe in fractions also suggests students substitute towards less severe infractions.
Discipline improves over time.
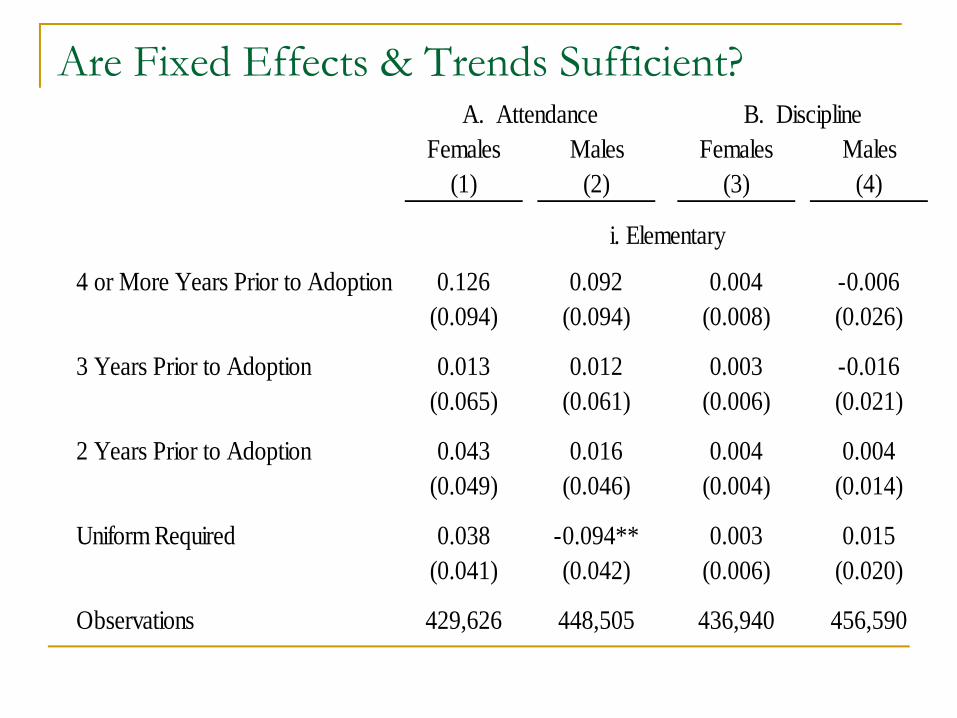
Are Fixed Effects & Trends Sufficient?
(1) (2) (3) (4)
4 or More Years Prior to Adoption 0.126 0.092 0.004 -0.006(0.094) (0.094) (0.008) (0.026)
3 Years Prior to Adoption 0.013 0.012 0.003 -0.016(0.065) (0.061) (0.006) (0.021)
2 Years Prior to Adoption 0.043 0.016 0.004 0.004(0.049) (0.046) (0.004) (0.014)
Uniform Required 0.038 -0.094** 0.003 0.015(0.041) (0.042) (0.006) (0.020)
Observations 429,626 448,505 436,940 456,590
A. Attendance B. DisciplineFemales Males
i. Elementary
Females Males
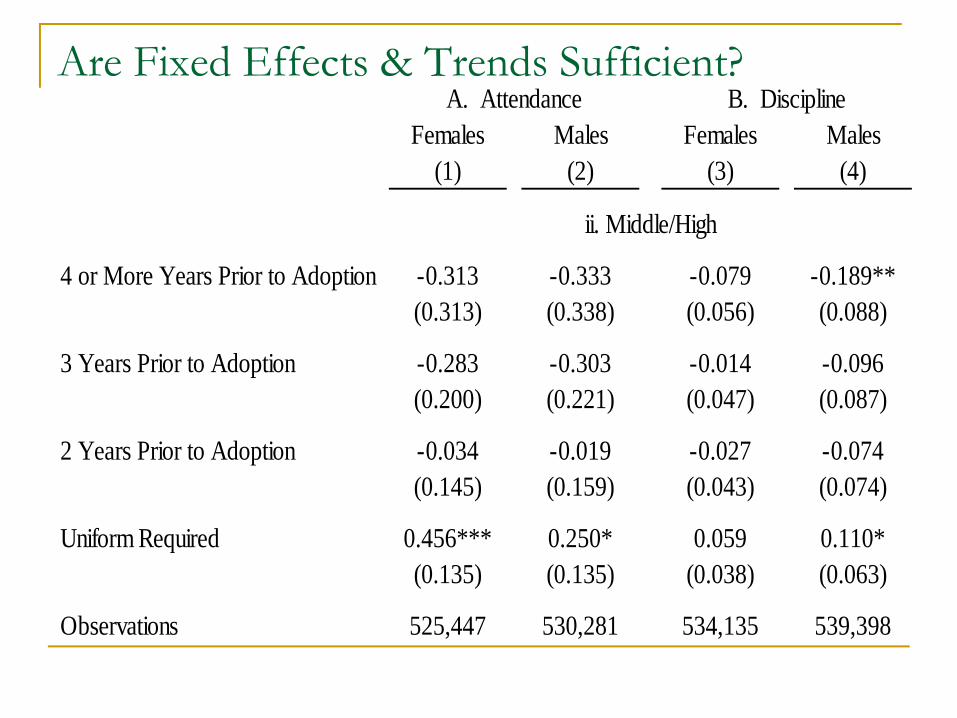
Are Fixed Effects & Trends Sufficient?
(1) (2) (3) (4)
4 or More Years Prior to Adoption -0.313 -0.333 -0.079 -0.189**(0.313) (0.338) (0.056) (0.088)
3 Years Prior to Adoption -0.283 -0.303 -0.014 -0.096(0.200) (0.221) (0.047) (0.087)
2 Years Prior to Adoption -0.034 -0.019 -0.027 -0.074(0.145) (0.159) (0.043) (0.074)
Uniform Required 0.456*** 0.250* 0.059 0.110*(0.135) (0.135) (0.038) (0.063)
Observations 525,447 530,281 534,135 539,398
ii. Middle/High
A. Attendance B. DisciplineFemales MalesFemales Males

Effect of Uniforms on Achievement
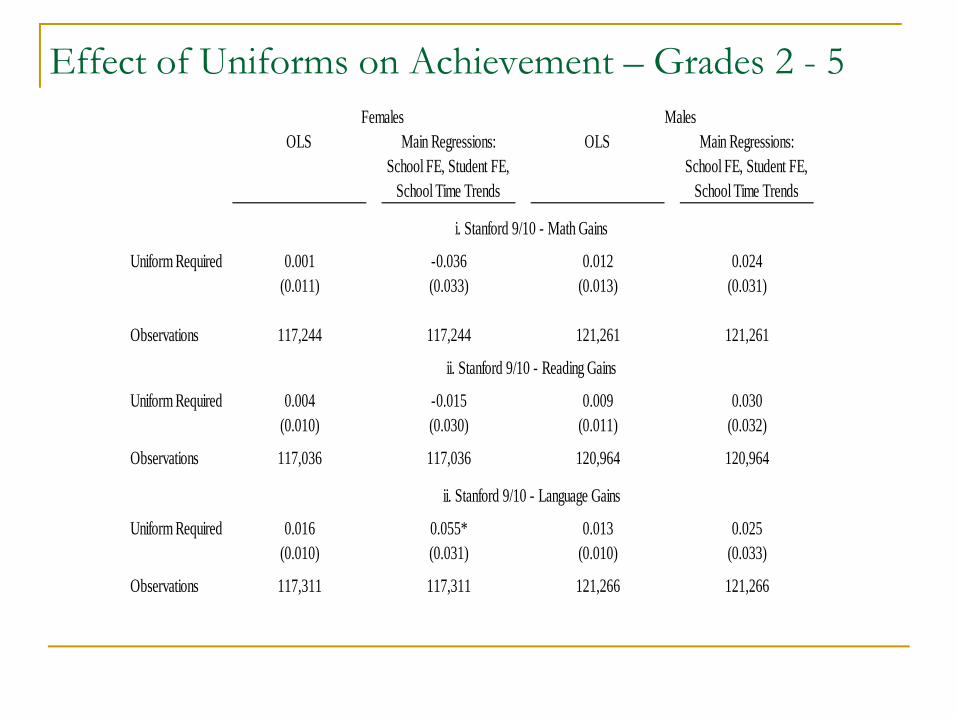
Effect of Uniforms on Achievement – Grades 2 - 5
OLS Main Regressions:School FE, Student FE,
School Time Trends
OLS Main Regressions:School FE, Student FE,
School Time Trends
Uniform Required 0.001 -0.036 0.012 0.024(0.011) (0.033) (0.013) (0.031)
Observations 117,244 117,244 121,261 121,261
Uniform Required 0.004 -0.015 0.009 0.030(0.010) (0.030) (0.011) (0.032)
Observations 117,036 117,036 120,964 120,964
Uniform Required 0.016 0.055* 0.013 0.025(0.010) (0.031) (0.010) (0.033)
Observations 117,311 117,311 121,266 121,266
Females Males
i. Stanford 9/10 - Math Gains
ii. Stanford 9/10 - Reading Gains
ii. Stanford 9/10 - Language Gains
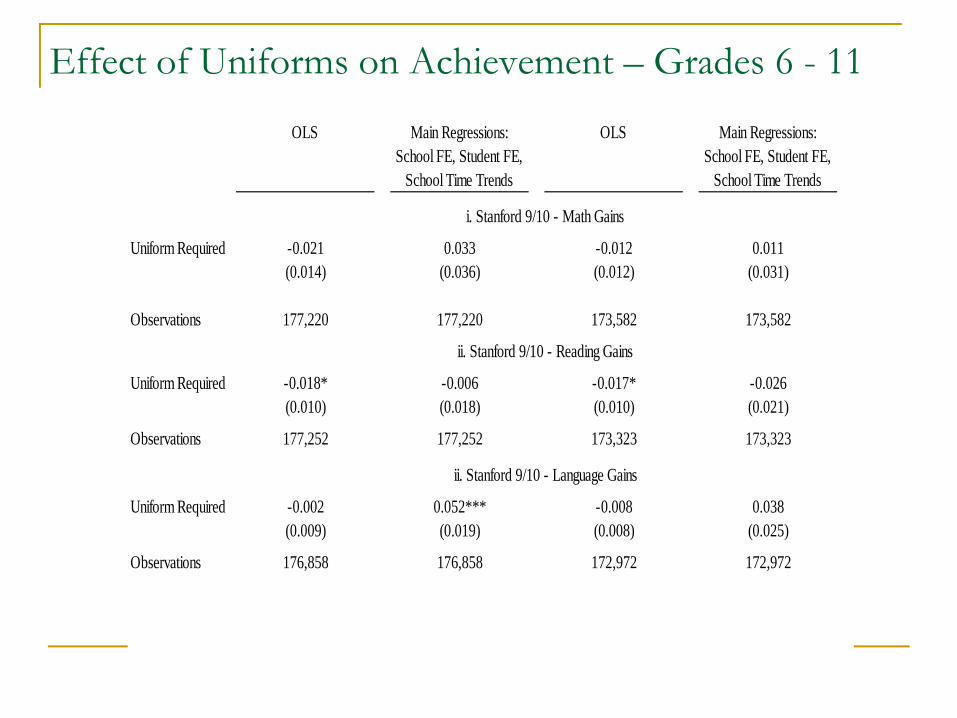
Effect of Uniforms on Achievement – Grades 6 - 11
OLS Main Regressions:School FE, Student FE,
School Time Trends
OLS Main Regressions:School FE, Student FE,
School Time Trends
Uniform Required -0.021 0.033 -0.012 0.011(0.014) (0.036) (0.012) (0.031)
Observations 177,220 177,220 173,582 173,582
Uniform Required -0.018* -0.006 -0.017* -0.026(0.010) (0.018) (0.010) (0.021)
Observations 177,252 177,252 173,323 173,323
Uniform Required -0.002 0.052*** -0.008 0.038(0.009) (0.019) (0.008) (0.025)
Observations 176,858 176,858 172,972 172,972
i. Stanford 9/10 - Math Gains
ii. Stanford 9/10 - Reading Gains
ii. Stanford 9/10 - Language Gains
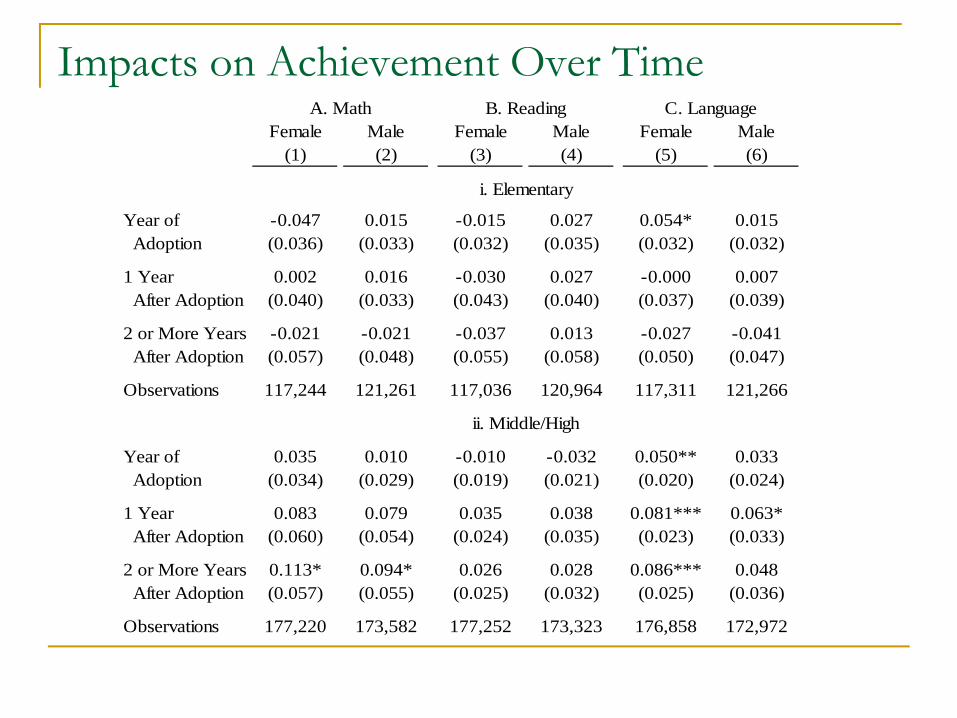
Impacts on Achievement Over TimeFemale Male Female Male Female Male
(1) (2) (3) (4) (5) (6)
Year of -0.047 0.015 -0.015 0.027 0.054* 0.015 Adoption (0.036) (0.033) (0.032) (0.035) (0.032) (0.032)
1 Year 0.002 0.016 -0.030 0.027 -0.000 0.007 After Adoption (0.040) (0.033) (0.043) (0.040) (0.037) (0.039)
2 or More Years -0.021 -0.021 -0.037 0.013 -0.027 -0.041 After Adoption (0.057) (0.048) (0.055) (0.058) (0.050) (0.047)
Observations 117,244 121,261 117,036 120,964 117,311 121,266
Year of 0.035 0.010 -0.010 -0.032 0.050** 0.033 Adoption (0.034) (0.029) (0.019) (0.021) (0.020) (0.024)
1 Year 0.083 0.079 0.035 0.038 0.081*** 0.063* After Adoption (0.060) (0.054) (0.024) (0.035) (0.023) (0.033)
2 or More Years 0.113* 0.094* 0.026 0.028 0.086*** 0.048 After Adoption (0.057) (0.055) (0.025) (0.032) (0.025) (0.036)
Observations 177,220 173,582 177,252 173,323 176,858 172,972
C. Language
i. Elementary
ii. Middle/High
A. Math B. Reading
Specification Tests
Principal fixed-effects provide qualitatively similar, albeit statistically insignificant results.
Some residual trending for middle-high reading, but little otherwise.
Effect of Uniforms on District Leavers
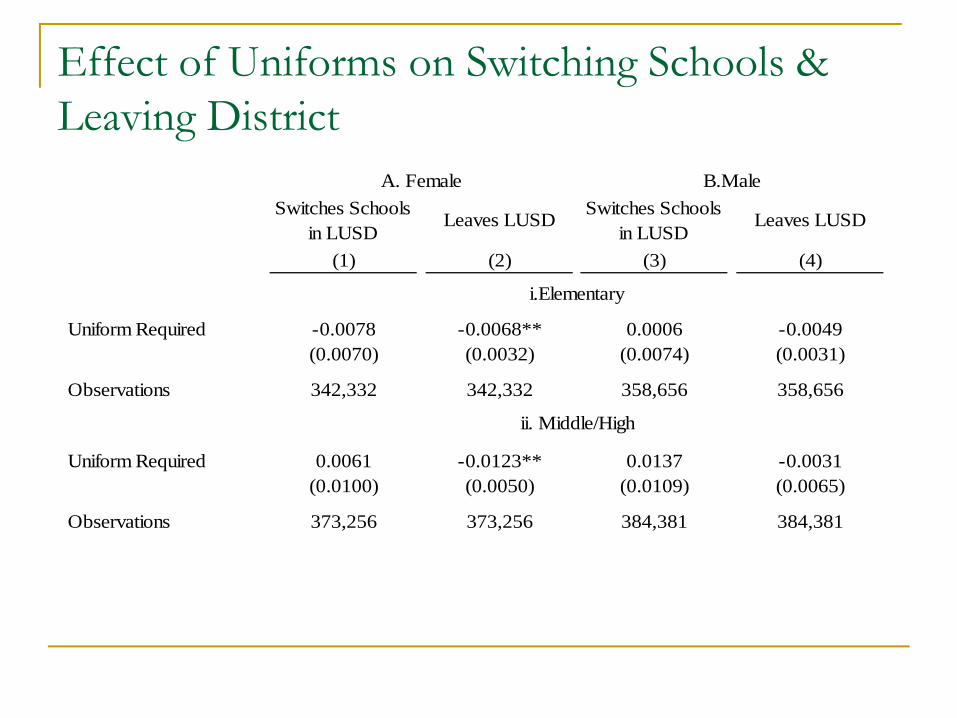
Effect of Uniforms on Switching Schools & Leaving District
Switches Schools in LUSD
Leaves LUSD Switches Schools in LUSD
Leaves LUSD
(1) (2) (3) (4)
Uniform Required -0.0078 -0.0068** 0.0006 -0.0049(0.0070) (0.0032) (0.0074) (0.0031)
Observations 342,332 342,332 358,656 358,656
Uniform Required 0.0061 -0.0123** 0.0137 -0.0031(0.0100) (0.0050) (0.0109) (0.0065)
Observations 373,256 373,256 384,381 384,381
i.Elementary
ii. Middle/High
A. Female B.Male
ConclusionSchool uniforms appear to be effective at improving various aspects of student performance.
The effects are stronger for girls, particularly those in middle & high school.
Most notable is a significant increase in attendance rates for middle/high and, a few years after adoption, improvements in both math and language scores.
Severity of disciplinary infractions also appears to fall for middle/high.
Finally, girls are more likely to remain in the district suggesting that uniforms could possibly help public schools compete against charter & private schools.