Embed Size (px)
Citation preview
Dressed for Success: Do SchoolUniforms Improve Student Behavior,
Attendance, and Achievement?
Elisabetta Gentile1
University of Houston
Scott A. Imberman1
University of Houston
March 4, 2009
Abstract: Concerns about safety in urban schools has led many school districts to requireuniforms for their students. However, we know very little about what impact school uniformshave had on the educational environment. In this paper we use a unique dataset to assesshow uniform adoption affects student achievement and behavior in a large urban schooldistrict int the southwest. Since each school in the district could decide independently aboutwhether or not to adopt uniforms, we are able to use variation across schools and overtime to identify the effects of uniforms. Using student and school fixed-effects along withschool-specific linear time trends to address selection of students and schools into uniformadoption, we find that uniforms had little impact on student outcomes in elementary gradesbut provided modest improvements in language scores and attendance rates in middle andhigh school grades. These effects appear to be concentrated in female students.
1204 McElhinney Hall. Houston, TX 77204-5019. We gratefully acknowledge funding and support fromthe AEFA New Scholars Award. We would also like to thank Mykhailo Sitiuk for excellent research assistance.All correspondence should be made to Scott Imberman at [email protected] and 713-743-3839. c©2009 byElisabetta Gentile and Scott Imberman. All rights reserved.
1 Introduction
As urban schools have become more difficult to manage, administrators have increasingly
turned to uniforms as part of a strategy to maintain student safety and control over schools.
In 1996, the US Department of Education found that only three percent of schools required
uniforms. However, in 2000, a survey of 775 principals by the National Association of
Elementary School Principals found that 21% of schools had uniform policies, though it did
not specify whether they were required. Today, many large school districts have some schools
that require students to wear uniforms. Most notably Philadelphia public schools require
all students to wear uniforms while Long Beach, California and Dallas requires uniforms
in pre-secondary grades. In addition, the nation’s largest school district, New York City,
requires uniforms in elementary grades. Other large school districts, including Miami-Dade,
Houston, Chicago, and Boston, allow schools to require uniforms.
However, the effects of these uniforms on students is unclear. Proponents of uniforms
have argued that they reduce victimization of students, allow administrators and faculty
to differentiate students from trespassers, encourage positive attitudes in students, reduce
bad behavior, and improve attendance. On the other hand, opponents argue that uniforms
restrict students’ rights and impose financial hardships on low-income families (Brunsma
and Rockquemore, 1998).
Despite the large growth in the use of uniforms in public schools, there is very little
empirical research that has been done to assess their effectiveness. Only a handful of papers
have tried to assess the effects of uniforms on student outcomes. this is despite the evidence
that there is a substantial correlation between discipline, which uniforms would most likely
affect, and achievement2.
Brunsma and Rockquemore (1998)look at the differences between students who attend
schools with uniforms and those who attend those without uniforms in a nationally repre-
2See Fergusson and Horwood (1995) Finn, Pannozo and Voelkl (1995), Gottfredson (1981), Hawkins(1997), Hawkins and Lishner (1987), Jensen (1976), Lynam, Moffitt and Stouthamer-Loeber (1993), Maquinand Loeber (1996), Rhodes and Reiss (1969), and Sliberberg and Sliberberg (1971). .
1
sentative sample of high-school students and find little difference in absenteeism, behavior
problems, and substance abuse while uniforms correlate negatively with test scores. How-
ever, this analysis suffers from some fundamental flaws. First of all, as pointed out by Bodine
(2003), much of the Brunsma and Rockquemore results are based on Catholic schools and
thus may not be reflective of uniforms in public schools. Second, even if they had a large
number of public school students in their sample, Brunsma and Rockquemore’s results would
still be biased due to selection of students into schools with uniforms and schools deciding
to require uniforms based on previous discipline problems. For example, parents may send
their children to schools with uniforms in response to improved discipline. If these parents
respond this way because they have misbehaving children, this would bias the uniform im-
pact downwards. At the school level, the potential for selection may be even larger since
schools and districts do not choose whether to require uniforms randomly. In fact, it is likely
that schools and districts that choose to require uniforms already have a substantial problem
with student behavior. Thus, on average, schools with uniforms will have more behavioral
problems and lower test scores than schools without, before we account for the impact of uni-
forms themselves on these outcomes. In this case, the results in Brunsma and Rockquefort
will again be biased downwards, and they will underestimate the impacts of uniforms. Yeung
(Forthcoming) looks at the effect of uniforms on student achievement in two national panels
of students. He finds little impact of uniforms on math and reading scores. Nonetheless,
while he improves upon Brunsma and Rockquefort’s strategy through value-added modeling
there still remains substantial potential for bias if schools choose whether or not to require
uniforms based on student characteristics or trends in student outcomes.
Stanley (1996) uses a change in uniform policy in the Long Beach United School District
(LBUSD) to identify the uniform impacts. In 1994 LBUSD required all schools covering
grades PreK through eight to adopt student uniforms. Thus, Stanley compares student out-
comes before and after the change in policy. However, her analysis is limited to a comparison
of means and she does not provide measures of precision for her results.
2
Rather than look directly at outcomes of students who wear uniforms, Wade and Stafford
(2003) study how uniforms affect students’ perceptions of themselves and of their peers. They
find that students’ score lower on assessments of their self-worth in uniform schools. This
leaves open the possibility that uniforms can actually be detrimental to students by reducing
their self-esteem although, since they look at a cross-section, the concerns about bias raised
above remain. They also found that teachers believed that uniforms reduced the presence of
gangs.
Another unique paper is Evans, Kremer, and Ngatia (2008) who evaluate a random
lottery that gave uniforms to students in Kenya. They find improvements in attendance
and, preliminarily, test scores for students who receive uniforms. While this suggests that
uniforms can be effective tools at improving student outcomes, the context is very different
from the United States. In this case the authors do not evaluate a policy change of imposing
uniforms, rather they measure the impact of providing uniforms for free to students in schools
where they are already required. This reduces the cost of education for those students, who
would have had to purchase the uniforms otherwise. Thus, they are not able to evaluate the
effect of a change in uniform policy.
The sparseness and the identification problems of the prior literature thus leave us with
a very unclear picture of how uniforms affect student outcomes. We seek to address this
gap in the literature in this paper by studying uniform adoption in a large urban school
district in the southwest (LUSD-SW). In the early 1990’s schools in LUSD-SW began to
require uniforms. Each school was permitted to decide on its own whether or not and when
to adopt uniforms. Since our data covers time periods before and after uniform adoption
for many schools we are able to utilize a combination of student fixed-effects, school fixed-
effects, and school-specific time trends to identify the effect of uniforms on student outcomes.
We find that uniforms appear to have little effect on test scores, attendance, or disciplinary
infractions for elementary (grades 1 - 5) students. For middle and high school (grades
6 - 12) students, we find improvement in language scores but not math or reading. We
3
also find improvements in attendance rates. These effects both primarily occur in female
students. Disciplinary infractions increase, but it is unclear whether this is due to the
uniforms themselves, uniform violations, or increased enforcement. Thus, overall it appears
that uniforms have a small but positive impact on student outcomes in higher grades.
2 Uniforms in LUSD-SW
LUSD has permitted its schools to require students to wear uniforms since at least 19923.
Initially, only a handful of schools required uniforms. However, as shown in Figure 1, uni-
form adoption grew substantially over the following 13 years. Of schools that responded to
our survey of uniform policies, which we describe in more detail below, only 10% required
uniforms in 1993. By 2006, 82% of these schools and 80% of students in these schools had
required uniforms.
Schools vary considerably in how they define their uniforms. Schools can require specific
shirt colors and styles and pant styles. In 2008 almost all schools that required uniforms
specified between 1 and 3 colors for shirts, and casual or denim pants in khaki or navy colors.
Some schools also required polo style shirts. Only a handful of school require students to
purchase specific shirts with a school logos. Some middle and high schools also required
different grades to wear specific colors.
Disobeying a mandatory uniform policy is considered a “level II” disciplinary infraction,
which requires intervention by a school administrator. Such a violation can result in a variety
of punishments depending on the severity of the infraction and the student’s prior behavior.
These can range from a call to the student’s parent to in-school suspension, although the
administrator is given discretion to increase or reduce the punishment beyond this range if
necessary.
3We cannot determine when uniforms were first allowed. The earliest any school had required uniformswas in 1968, but this was a school operating under contract with LUSD and not one of LUSD’s schools. OfLUSD’s own schools, the earliest date provided in our survey of uniform policies was 1992.
4
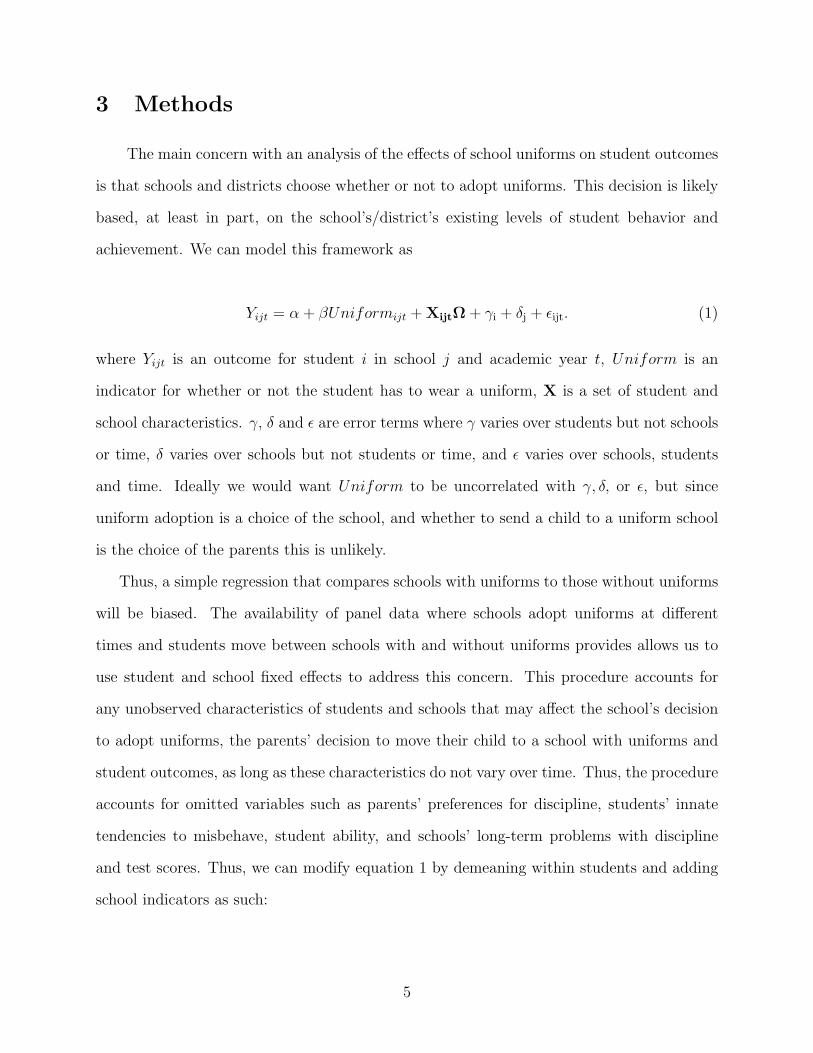
3 Methods
The main concern with an analysis of the effects of school uniforms on student outcomes
is that schools and districts choose whether or not to adopt uniforms. This decision is likely
based, at least in part, on the school’s/district’s existing levels of student behavior and
achievement. We can model this framework as
Yijt = α + βUniformijt + XijtΩ + γi + δj + εijt. (1)
where Yijt is an outcome for student i in school j and academic year t, Uniform is an
indicator for whether or not the student has to wear a uniform, X is a set of student and
school characteristics. γ, δ and ε are error terms where γ varies over students but not schools
or time, δ varies over schools but not students or time, and ε varies over schools, students
and time. Ideally we would want Uniform to be uncorrelated with γ, δ, or ε, but since
uniform adoption is a choice of the school, and whether to send a child to a uniform school
is the choice of the parents this is unlikely.
Thus, a simple regression that compares schools with uniforms to those without uniforms
will be biased. The availability of panel data where schools adopt uniforms at different
times and students move between schools with and without uniforms provides allows us to
use student and school fixed effects to address this concern. This procedure accounts for
any unobserved characteristics of students and schools that may affect the school’s decision
to adopt uniforms, the parents’ decision to move their child to a school with uniforms and
student outcomes, as long as these characteristics do not vary over time. Thus, the procedure
accounts for omitted variables such as parents’ preferences for discipline, students’ innate
tendencies to misbehave, student ability, and schools’ long-term problems with discipline
and test scores. Thus, we can modify equation 1 by demeaning within students and adding
school indicators as such:
5
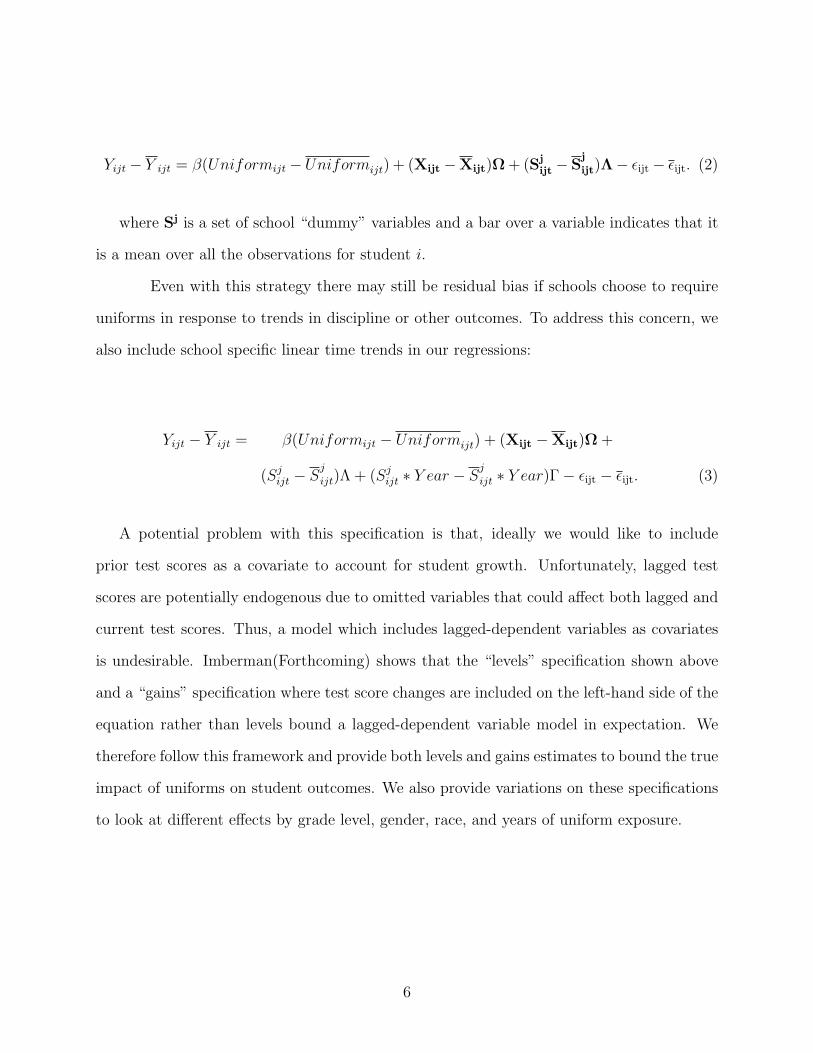
Yijt − Y ijt = β(Uniformijt −Uniformijt) + (Xijt −Xijt)Ω + (Sjijt − S
j
ijt)Λ− εijt − εijt. (2)
where Sj is a set of school “dummy” variables and a bar over a variable indicates that it
is a mean over all the observations for student i.
Even with this strategy there may still be residual bias if schools choose to require
uniforms in response to trends in discipline or other outcomes. To address this concern, we
also include school specific linear time trends in our regressions:
Yijt − Y ijt = β(Uniformijt − Uniformijt) + (Xijt −Xijt)Ω +
(Sjijt − S
j
ijt)Λ + (Sjijt ∗ Y ear − S
j
ijt ∗ Y ear)Γ− εijt − εijt. (3)
A potential problem with this specification is that, ideally we would like to include
prior test scores as a covariate to account for student growth. Unfortunately, lagged test
scores are potentially endogenous due to omitted variables that could affect both lagged and
current test scores. Thus, a model which includes lagged-dependent variables as covariates
is undesirable. Imberman(Forthcoming) shows that the “levels” specification shown above
and a “gains” specification where test score changes are included on the left-hand side of the
equation rather than levels bound a lagged-dependent variable model in expectation. We
therefore follow this framework and provide both levels and gains estimates to bound the true
impact of uniforms on student outcomes. We also provide variations on these specifications
to look at different effects by grade level, gender, race, and years of uniform exposure.
6
4 Data
In this paper we utilize two sources of data from a large urban school district in the south-
west. The first dataset includes administrative records for students in LUSD from 1993
through 2006. This data includes student demographics, test scores, disciplinary records
and attendance records for every student in LUSD. Testing data include students’s scaled
scores on the Standford Achievement Test which we standardized within grade and year
and is available starting in 19984. Discipline data includes any infraction that results in an
in-school suspension or more severe punishment. Attendance records include the attendance
rate for each student.
Unfortunately, LUSD does not keep centralized records of when schools adopted uniforms.
Thus, we emailed and mailed a survey to each school in LUSD with the following questions
in the fall of 2007:
• Does your school currently require students to wear uniforms? Note that I define a
uniform as any outfit where a particular style of shirt (i.e. polo) and bottom (i.e.
khaki, skirt, etc.) and a specified color are required.
• If your school currently requires uniforms, what school year did you first require them?
Were there any years since then when the requirement was suspended?
• If your school currently does not require uniforms, did you ever require them in the
past, and if so, could you please provide the years during which students were required
to wear uniforms?
Schools were also given the option to not provide any information. We then followed up
via telephone with any school that did not respond to the initial survey and to ask for
clarification for schools that did not give specific years of uniform adoption. If the principal
did not know the date then we requested that they ask their staff members. Data collection
4In 2005 LUSD received some evacuees from Hurricanes Katrina and Rita. While we keep these studentsin the data, they do not contribute to the standardization.
7
was completed in October, 2008. For the 292 schools that were in operation in the 2007-08
school year 79% were able to provide dates of uniform adoption while the date could not
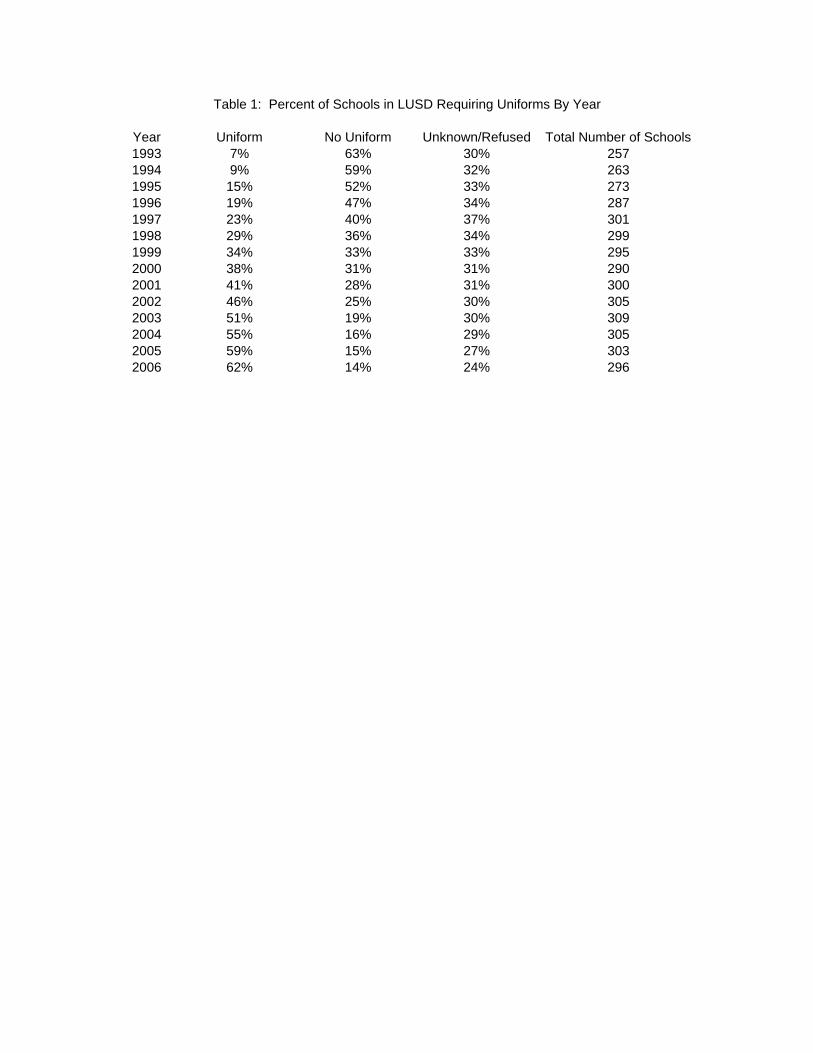
be determined for 14% and 7% of the schools refused to participate in the survey5. Table
1 shows the percent of schools in LUSD which had uniforms, no uniforms, or for which we
do not have information over the time-frame of this study. Since our survey was based on
schools existing in 2007-08 earlier years have higher rates of unknown uniform status than
later years. Nonetheless, it is clear that uniforms gained substantially in popularity over the
course of the sample.
Since we rely on school fixed effects to help identify the uniform impact it is also important
to know how many schools switch to requiring uniforms over the course of the sample. From
1994-05, the second year for which we have discipline and attendance data, to 2006-07 168
schools adopt uniforms. From 1999-00 through 2006-07, the period after the first year of
testing data, 96 schools adopt uniforms. Thus there is substantial variation in policies during
the period for which we have data.
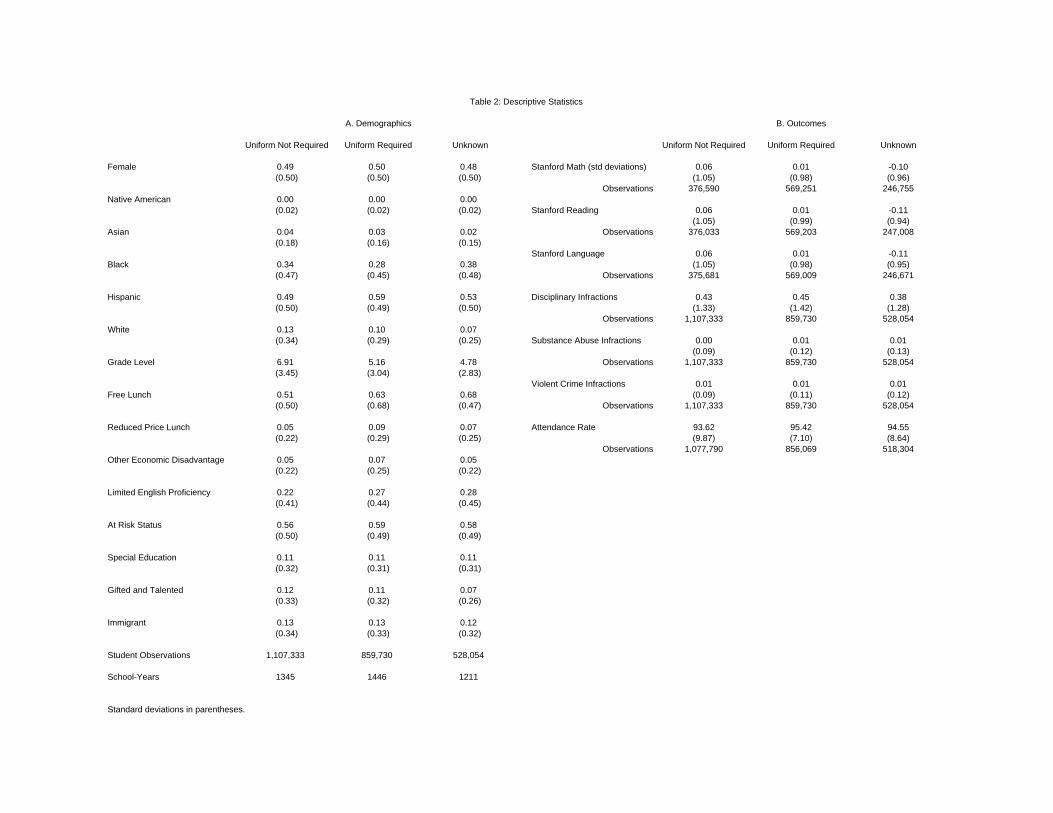
Table 2 provides summary statistics for students who attended schools with required
uniforms, those without, and those where the uniform requirements are unknown. In general,
uniform and non-uniform schools have similar demographics. The most notable differences
is that uniformed schools have ten percentage points more Hispanics and are only 28% black
compared to 34% for non-uniform schools. Uniform schools also have more students who
qualify for free or reduced-price lunch. Schools for which we do not know the uniform status
also have demographics that are generally similar to the schools where uniform status is
known. The notable exception is that these schools appear to have higher rates of free-lunch
eligibility. In terms of outcomes, test scores are higher than in non-uniform schools than
in uniform schools. On the other hand, attendance rates are lower. Schools with unknown
5Some schools responded that the uniform policy was adopted before a certain date. In these cases, unlessthat date was prior to the start of the data sample in 1993, I considered the uniform adoption date for thoseschools to be unknown. This occurs for 13 schools. In addition three schools stated that they recommendedbut did not require uniforms. These schools are considered to not have a uniform for the purposes of thisstudy.
8
status have lower test scores than both uniform and non-uniform schools, however this, and
the higher rates of free lunch eligibility, are likely due to changing demographics of the
district over time.
5 Results
Before moving to the main results, we can get a sense of the potential uniform impact in
Figure 2. This figure shows test scores for math, reading, and language along with attendance
rates and disciplinary infractions both before and after uniform adoption. The graphs show
that uniforms may generate substantial improvements in all measures. Prior to uniform
adoption both test scores and discipline are relatively flat at approximately -0.15 standard
deviations and 0.45 infractions, respectively. After uniform adoption (year 0) test scores start
trending upwards, reaching 0.07 standard deviations in six years. Disciplinary infractions
also trend downwards, albeit after a delay of two years to 0.34 infractions per student, per
year. The only measure showing a clear trend prior to adoption is attendance rates, which
increase in the two years before adoption and then continue thereafter. Five years prior to
adoption attendance rates average 93.8% and rise to 95.6% five years after adoption. The
steep trend in attendance rates highlight the need to include school-specific time trends in our
analysis so that we may account for any pre-existing trends that lead to uniform adoption.
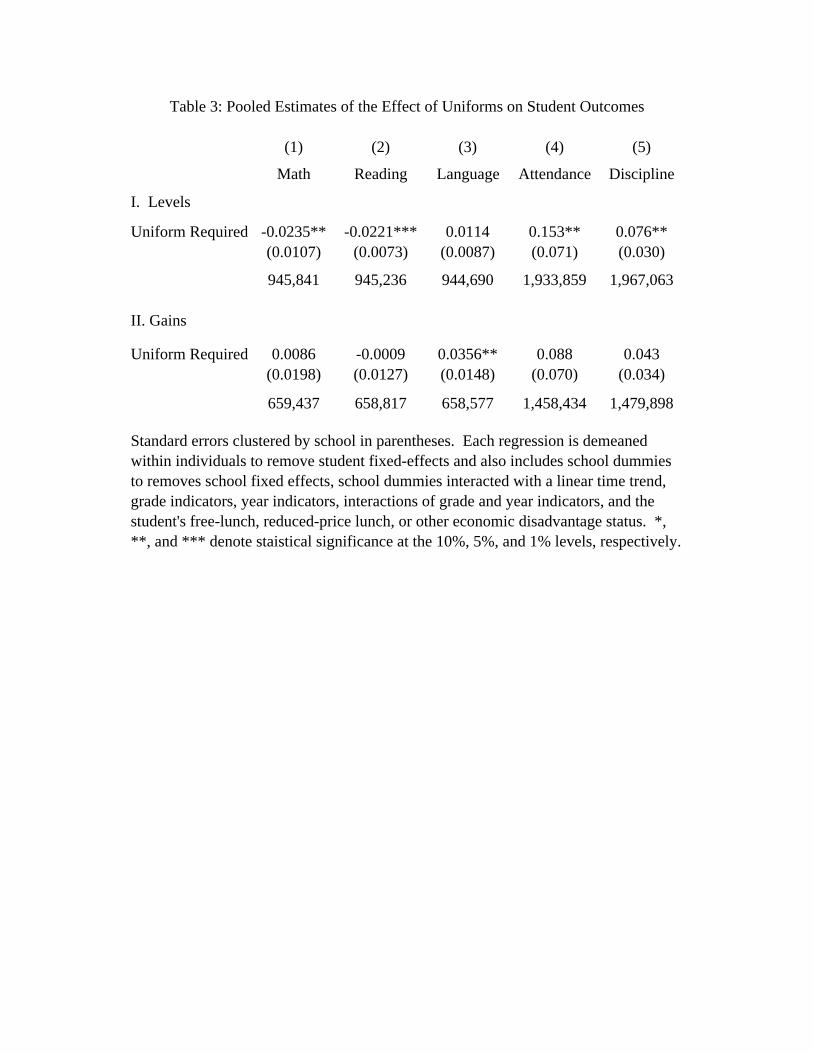
Table 3 provides some pooled estimates of the effect of uniform adoption on student
outcomes. In keeping with Imberman(Forthcoming) we present both levels and gains models
and use them to place bounds on our preferred specification of a lagged dependent variable
model. The results present a mixed picture. In no case are both gains and levels specifications
statistically significant so we cannot say that uniforms have an impact. Nonetheless each
measure is statistically significant in one of the models with math and reading showing
negative impacts, while language is positive. Attendance improves in levels models, but
discipline worsens.
9

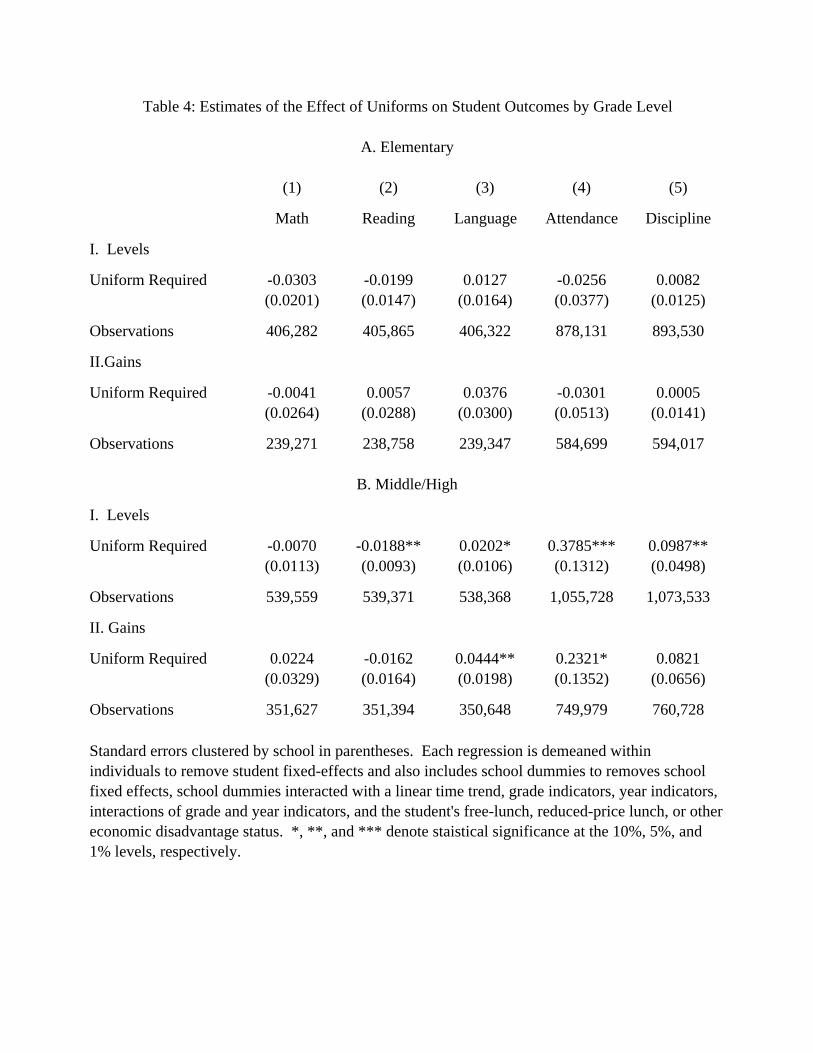
Since the pooled model provides unclear results, in table 4 we consider a model split
by students in elementary grades (grades 1 - 5) and middle/high school grades (grades 6
- 12). It is reasonable to believe that younger students may react differently to uniforms
than older students, and thus compositional differences could be driving the mixed results
in table 3. Indeed, when we split the estimates by grade level, a much clearer picture
emerges. Thus, given these results we will provide regressions split by grade level for the
rest of this paper. Panel A provides the results for elementary students. No estimate is
statistically significant for elementary grades. However, for middle and high school grades
we find statistically significant impacts, at least at the 10% level, in both levels and gains
models for language scores and attendance rates. In both cases the estimates are positive,
albeit modest. Language scores increase by between 0.02 and 0.04 standard deviations while
attendance rates increase by 0.2 to 0.4 percentage points. Reading shows a statistically
significant drop of 0.02 standard deviations in levels models but the gains model is not
statistically significant. Similarly, disciplinary infractions show a small increase of 0.10 per
student. It is possible, however, that the increase in infractions are specific to uniform
violations. Another possibility is that uniform adoption is often commensurate with increased
enforcement and harsher punishments. Unfortunately we are not able to observe whether
either or both of these are true.
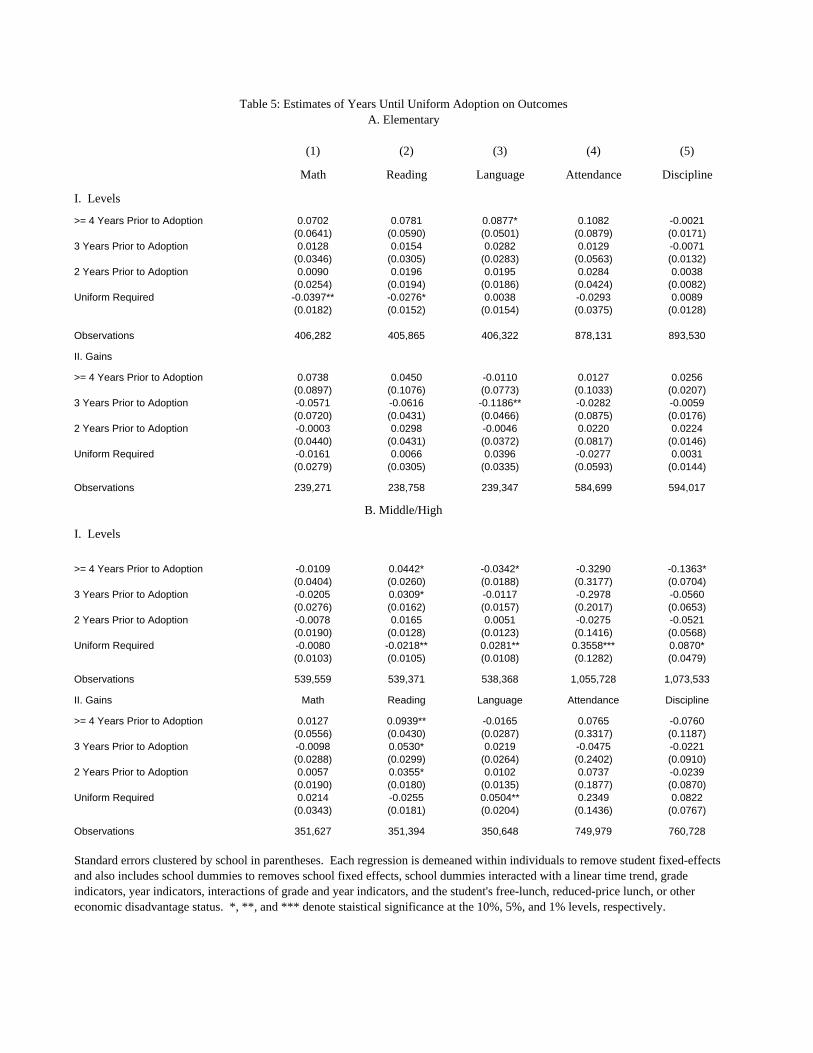
Even though we include school fixed-effects and school specific linear time trends in the
regressions, we may still be concerned that schools choice of uniform adoption may be based
on prior student outcomes in a way that is not captured by the time trends and fixed effects.
To test this, in table 5 we provide estimates of the effect of being in a school two, three,
or four or more years prior to uniform adoption on outcomes relative to being in the school
in the year immediately prior to adoption. If schools select off of trends then we would
expect the estimates on the years prior to adoption to be significantly different from the
year immediately before adoption. Panel A once again shows the results for elementary
schools. There is little evidence of trending as only language three years prior to adoption
10
in the gains model is statistically significant at the 5% level. For middle and high school
students in panel B there also appears to be little evidence of trends for all but one of the
outcomes. The exception is reading which shows some some decrease in scores over time
prior to uniform adoption. However, of these estimates only scores four or more years prior
to adoption in the gains model is statistically significant at the 5% level. Thus, overall,
the results seem to suggest that there is little further selection into uniform adoption off of
trends after controlling for school-specific linear trends and school fixed effects.
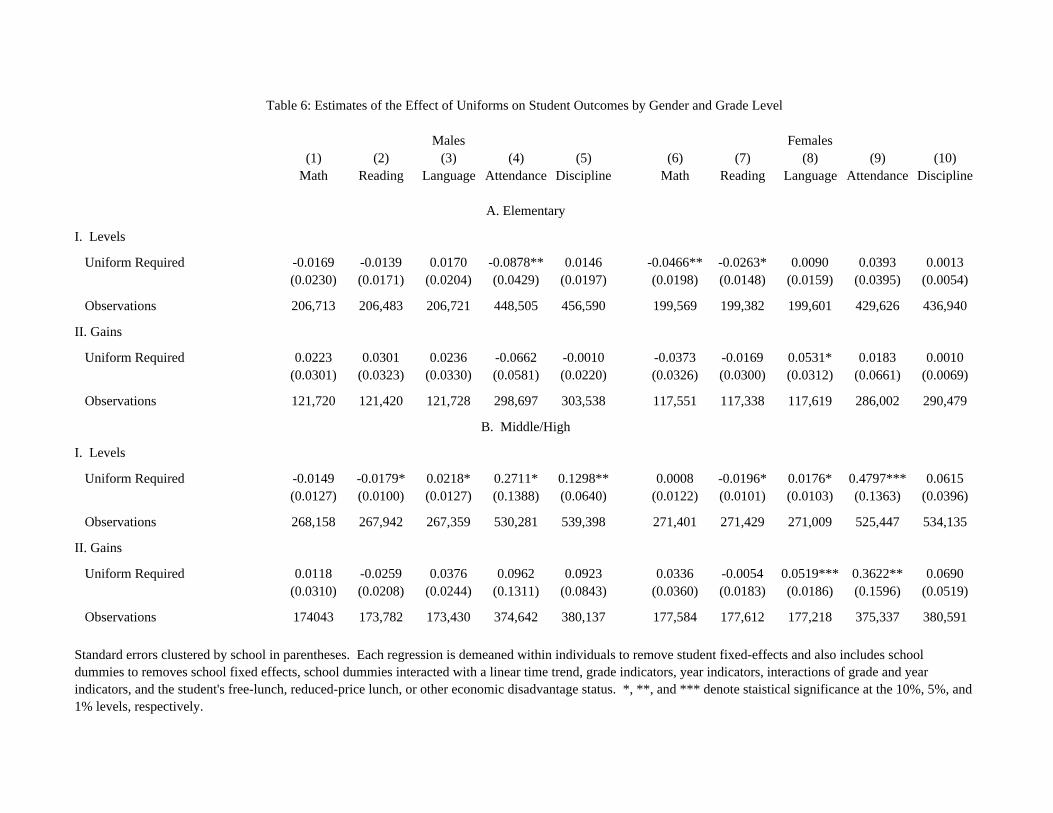
In table 6 we consider whether responses to uniforms vary by gender. Once again,
we cannot definitively say that there are impacts of uniforms on elementary students of
either gender as there is no case where both levels and value-added models are statistically
significant. Similarly, for male students in middle and high school, we se no cases where
both levels and value-added models are statistically significant. However, we do find some
impacts of uniforms on high school females. These students show increases in language scores
of between 0.02 and 0.05 standard deviations and attendance rate improvements of between
0.4 and 0.5 percentage points. Thus it seems that almost all of the improvements in these
outcomes are coming from female students rather than males. In addition, to the extent
that we see disciplinary infractions increase in levels models, most of that increase appears
to be focused in male students. This does provide some suggestive, albeit admittedly weak,
evidence that the possible increase in infractions is not due to more enforcement as we would
expect such policy changes to affect female students as well.
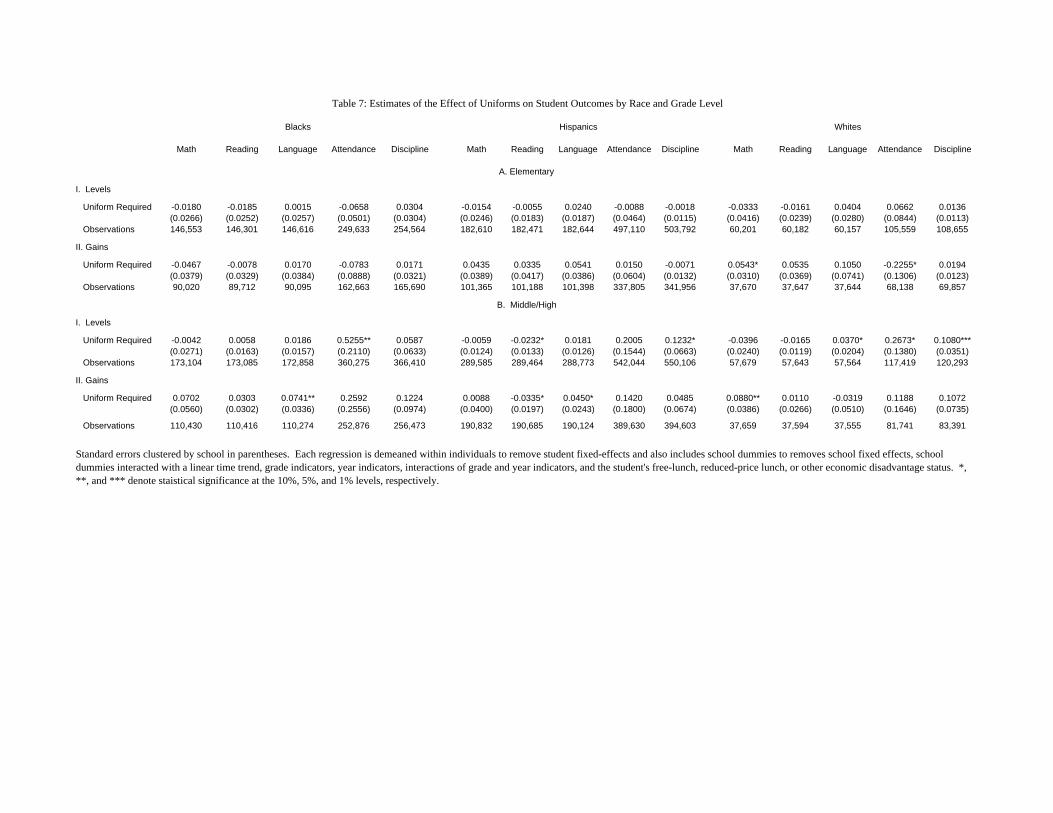
Table 7 shows the main regression results split by whether the student is black, Hispanic,
or white. In no case do we find statistically significant results at the 5% level in both
gains and levels models. With that in mind, the results are suggestive that the increase in
language scores and attendance rates for middle and high schools are concentrated in black
students. Gains models show an increase in language scores of 0.07 standard deviations and
levels models show an increase in attendance rates of 0.5 percentage points for blacks. It
also seems that increases in disciplinary infractions may be concentrated in middle and high
11
school white students as they show a significant increase of 0.11 infractions in levels models.
6 Conclusion
In this paper we assess whether requiring uniforms in schools affects student outcomes using
administrative data from a large urban school district in the southwest. Since schools in
this district individually decided whether or not to adopt uniforms over the time period for
which we have data, we are able to incorporate school fixed-effects, student fixed-effects, and
school specific linear time trends into our regressions. This allows us to account for schools
endogenously deciding to adopt uniforms off of their fixed characteristics and permanent
trends and also to account students’ selection into uniform schools provided that selection
is based on students’ fixed characteristics. Overall, we find that uniforms appear to have
a moderately positive impact on students in middle and high school and little impact on
elementary students. Students in middle and high school grades who are required to wear
uniforms show improvements in scores on language exams of between 0.02 and 0.04 standard
deviations and improvements in attendance rates of between 0.2 and 0.4 percentage points.
These improvements appear to be strong for female students. For all other outcomes we
cannot definitively bound the estimates away from zero using both gains and levels models.
Nonetheless, we do see increases in disciplinary infractions in levels models that are con-
centrated in boys and some small drops in Hispanic reading scores. It is possible that the
increase in disciplinary infractions are due to uniform violations or increased enforcement,
although the lack of a similar increase for girls suggest that the latter is unlikely.
References
Bodine, A., “School Uniforms, Academic Achievement, and Uses of Research,” The Journal of
Educational Research, 2003, 97 (2), 67–73.
12
Brunsma, D.L. and K.A. Rockquemore, “Effects of Student Uniforms on Attendance, Be-
havior Problems, Substance Abuse, and Academic Achievements,” The Journal of Ed-
ucational Research, 1998, 92 (1).
Evans, David, Michael Kremer, and Muthoni Ngatia, “The Impact of Distributing School
Uniforms on Children’s Education in Kenya,” World Bank, mimeo, 2008.
Fergusson, D.M. and L.J. Horwood, “Early Disruptive Behavior, IQ, and Later School
Achievement and Delinquent Behavior,” Journal of Abnormal Child Psychology, 1995,
23 (2), 183–199.
Finn, J.D., G.M. Pannozzo, and K.E. Voelkl, “Disruptive and Inattentive-Withdrawn
Behavior and Achievement among Fourth Graders,” The Elementary School Journal,
1995, 95 (5), 421–434.
Gottfredson, G. D., “Schooling and Delinquency,” in Martin S.E., L. B. Sechrest, and R. Red-
ner, eds., New Directions in the Rehabilitation of Criminal Offenders, National Academy
Press, 1981.
Hawkins, J.D., “Academic Performance and School Success: Sources and Consequences,”
Healthy children, 1997, 2010, 278–305.
and D. M. Lishner, “Schooing and Delinquency,” in E. H. Johnson, ed., Handbook on
Crime and Delinquency Prevention, Greenwood, 1987.
Imberman, Scott A., “Achievement and Behavior of Charter Students: Drawing a More Com-
plete Picture,” Review of Economics and Statistics, Forthcoming.
Jensen, G.F., “Race, Achievement, and Delinquency: A Further Look at Delinquency in a Birth
Cohort,” The American Journal of Sociology, 1976, 82 (2), 379–387.
Lynam, D., T. Moffitt, and M. Stouthamer-Loeber, “Explaining the Relation Between
13
IQ and Delinquency: Class, Race, Test Motivation, School Failure, or Self-Control?,” J
Abnorm Psychol, 1993, 102 (2), 187–96.
Maquin, E and R Loeber, “Academic performance and delinquency,” Crime and Justice: A
Review of Research, 1996, 20, 145–264.
Myers, D.E., A.M. Milne, K. Baker, and A. Ginsburg, “Student Discipline and High
School Performance,” Sociology of Education, 1987, 60 (1), 18–33.
Rhodes, A.L. and A.J. Reiss Jr, “Apathy, Truancy and Delinquency as Adaptations to School
Failure,” Social Forces, 1969, 48 (1), 12–22.
Sliberberg, N. E. and M. C. Silberberg, “School Achievement and Delinquency,” Review of
Educational Research, 1971, 41, 17–33.
Wade, K.K. and M.E. Stafford, “Public School Uniforms: Effect on Perceptions of Gang
Presence, School Climate, and Student Self-Perceptions,” Education and Urban Society,
2003, 35 (4), 399.
14
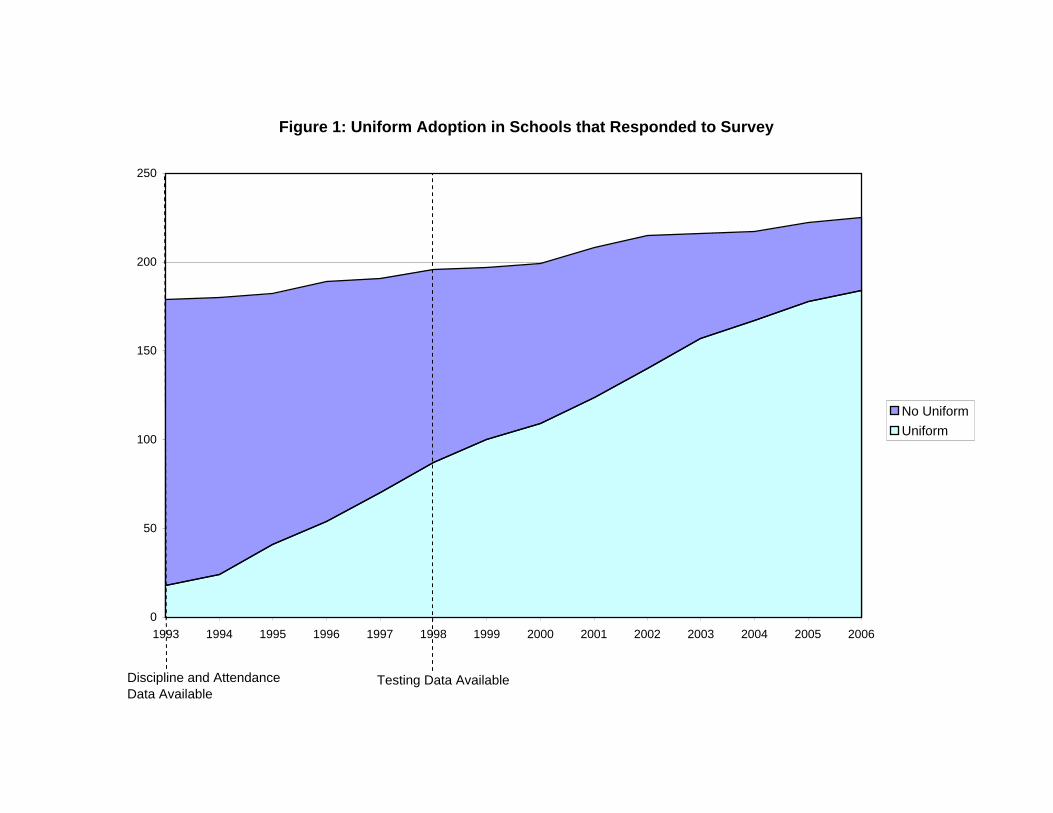
Figure 1: Uniform Adoption in Schools that Responded to Survey
0
50
100
150
200
250
1993 1994 1995 1996 1997 1998 1999 2000 2001 2002 2003 2004 2005 2006
No UniformUniform
Discipline and Attendance Data Available
Testing Data Available
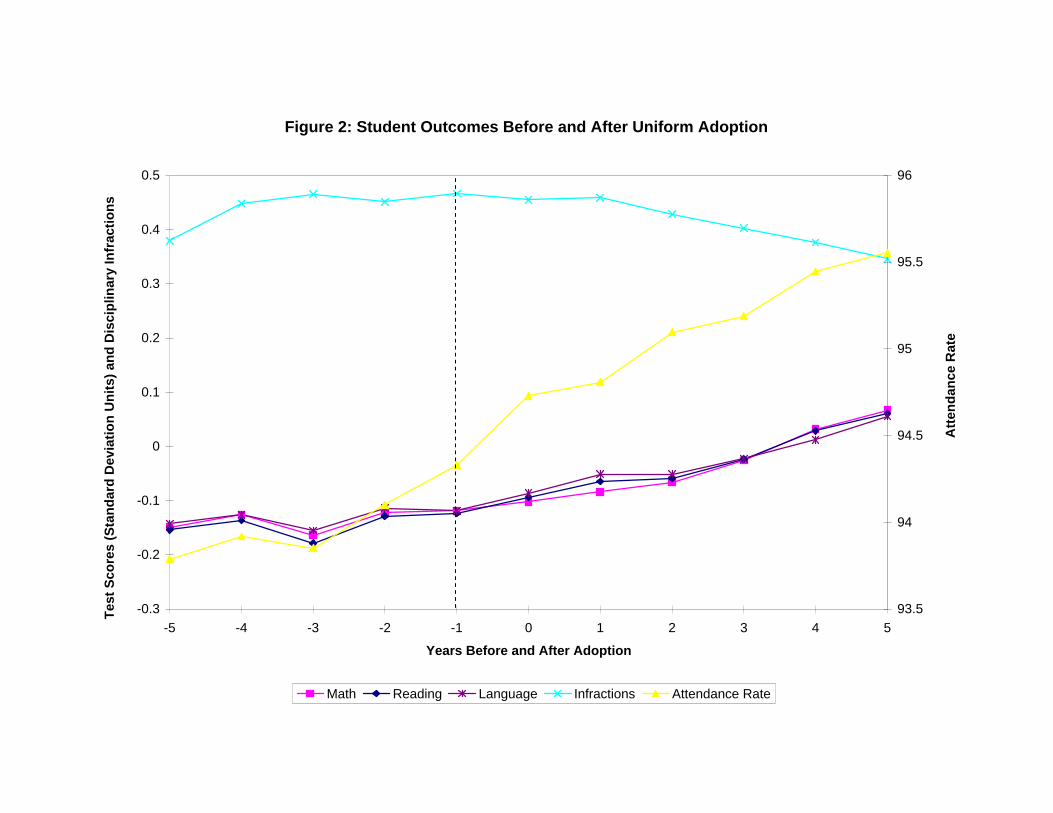
Figure 2: Student Outcomes Before and After Uniform Adoption
-0.3
-0.2
-0.1
0
0.1
0.2
0.3
0.4
0.5
-5 -4 -3 -2 -1 0 1 2 3 4 5
Years Before and After Adoption
93.5
94
94.5
95
95.5
96
Math Reading Language Infractions Attendance Rate
Atte
ndan
ce R
ate
Test
Sco
res
(Sta
ndar
d D
evia
tion
Uni
ts) a
nd D
isci
plin
ary
Infr
actio
ns
Year Uniform No Uniform Unknown/Refused Total Number of Schools1993 7% 63% 30% 2571994 9% 59% 32% 2631995 15% 52% 33% 2731996 19% 47% 34% 2871997 23% 40% 37% 3011998 29% 36% 34% 2991999 34% 33% 33% 2952000 38% 31% 31% 2902001 41% 28% 31% 3002002 46% 25% 30% 3052003 51% 19% 30% 3092004 55% 16% 29% 3052005 59% 15% 27% 3032006 62% 14% 24% 296
Table 1: Percent of Schools in LUSD Requiring Uniforms By Year
Uniform Not Required Uniform Required Unknown Uniform Not Required Uniform Required Unknown
Female 0.49 0.50 0.48 Stanford Math (std deviations) 0.06 0.01 -0.10(0.50) (0.50) (0.50) (1.05) (0.98) (0.96)
Observations 376,590 569,251 246,755Native American 0.00 0.00 0.00
(0.02) (0.02) (0.02) Stanford Reading 0.06 0.01 -0.11(1.05) (0.99) (0.94)
Asian 0.04 0.03 0.02 Observations 376,033 569,203 247,008(0.18) (0.16) (0.15)
Stanford Language 0.06 0.01 -0.11Black 0.34 0.28 0.38 (1.05) (0.98) (0.95)
(0.47) (0.45) (0.48) Observations 375,681 569,009 246,671
Hispanic 0.49 0.59 0.53 Disciplinary Infractions 0.43 0.45 0.38(0.50) (0.49) (0.50) (1.33) (1.42) (1.28)
Observations 1,107,333 859,730 528,054White 0.13 0.10 0.07
(0.34) (0.29) (0.25) Substance Abuse Infractions 0.00 0.01 0.01(0.09) (0.12) (0.13)
Grade Level 6.91 5.16 4.78 Observations 1,107,333 859,730 528,054(3.45) (3.04) (2.83)
Violent Crime Infractions 0.01 0.01 0.01Free Lunch 0.51 0.63 0.68 (0.09) (0.11) (0.12)
(0.50) (0.68) (0.47) Observations 1,107,333 859,730 528,054
Reduced Price Lunch 0.05 0.09 0.07 Attendance Rate 93.62 95.42 94.55(0.22) (0.29) (0.25) (9.87) (7.10) (8.64)
Observations 1,077,790 856,069 518,304Other Economic Disadvantage 0.05 0.07 0.05
(0.22) (0.25) (0.22)
Limited English Proficiency 0.22 0.27 0.28(0.41) (0.44) (0.45)
At Risk Status 0.56 0.59 0.58(0.50) (0.49) (0.49)
Special Education 0.11 0.11 0.11(0.32) (0.31) (0.31)
Gifted and Talented 0.12 0.11 0.07(0.33) (0.32) (0.26)
Immigrant 0.13 0.13 0.12(0.34) (0.33) (0.32)
Student Observations 1,107,333 859,730 528,054
School-Years 1345 1446 1211
Standard deviations in parentheses.
A. Demographics B. Outcomes
Table 2: Descriptive Statistics
(1) (2) (3) (4) (5)
Math Reading Language Attendance Discipline
I. Levels
Uniform Required -0.0235** -0.0221*** 0.0114 0.153** 0.076**(0.0107) (0.0073) (0.0087) (0.071) (0.030)
945,841 945,236 944,690 1,933,859 1,967,063
II. Gains
Uniform Required 0.0086 -0.0009 0.0356** 0.088 0.043(0.0198) (0.0127) (0.0148) (0.070) (0.034)
659,437 658,817 658,577 1,458,434 1,479,898
Table 3: Pooled Estimates of the Effect of Uniforms on Student Outcomes
Standard errors clustered by school in parentheses. Each regression is demeaned within individuals to remove student fixed-effects and also includes school dummies to removes school fixed effects, school dummies interacted with a linear time trend, grade indicators, year indicators, interactions of grade and year indicators, and the student's free-lunch, reduced-price lunch, or other economic disadvantage status. *, **, and *** denote staistical significance at the 10%, 5%, and 1% levels, respectively.
(1) (2) (3) (4) (5)
Math Reading Language Attendance Discipline
I. Levels
Uniform Required -0.0303 -0.0199 0.0127 -0.0256 0.0082(0.0201) (0.0147) (0.0164) (0.0377) (0.0125)
Observations 406,282 405,865 406,322 878,131 893,530
II.Gains
Uniform Required -0.0041 0.0057 0.0376 -0.0301 0.0005(0.0264) (0.0288) (0.0300) (0.0513) (0.0141)
Observations 239,271 238,758 239,347 584,699 594,017
I. Levels
Uniform Required -0.0070 -0.0188** 0.0202* 0.3785*** 0.0987**(0.0113) (0.0093) (0.0106) (0.1312) (0.0498)
Observations 539,559 539,371 538,368 1,055,728 1,073,533
II. Gains
Uniform Required 0.0224 -0.0162 0.0444** 0.2321* 0.0821(0.0329) (0.0164) (0.0198) (0.1352) (0.0656)
Observations 351,627 351,394 350,648 749,979 760,728
Table 4: Estimates of the Effect of Uniforms on Student Outcomes by Grade Level
A. Elementary
B. Middle/High
Standard errors clustered by school in parentheses. Each regression is demeaned within individuals to remove student fixed-effects and also includes school dummies to removes school fixed effects, school dummies interacted with a linear time trend, grade indicators, year indicators, interactions of grade and year indicators, and the student's free-lunch, reduced-price lunch, or other economic disadvantage status. *, **, and *** denote staistical significance at the 10%, 5%, and 1% levels, respectively.
(1) (2) (3) (4) (5)
Math Reading Language Attendance Discipline
I. Levels
>= 4 Years Prior to Adoption 0.0702 0.0781 0.0877* 0.1082 -0.0021(0.0641) (0.0590) (0.0501) (0.0879) (0.0171)
3 Years Prior to Adoption 0.0128 0.0154 0.0282 0.0129 -0.0071(0.0346) (0.0305) (0.0283) (0.0563) (0.0132)
2 Years Prior to Adoption 0.0090 0.0196 0.0195 0.0284 0.0038(0.0254) (0.0194) (0.0186) (0.0424) (0.0082)
Uniform Required -0.0397** -0.0276* 0.0038 -0.0293 0.0089(0.0182) (0.0152) (0.0154) (0.0375) (0.0128)
Observations 406,282 405,865 406,322 878,131 893,530
II. Gains
>= 4 Years Prior to Adoption 0.0738 0.0450 -0.0110 0.0127 0.0256(0.0897) (0.1076) (0.0773) (0.1033) (0.0207)
3 Years Prior to Adoption -0.0571 -0.0616 -0.1186** -0.0282 -0.0059(0.0720) (0.0431) (0.0466) (0.0875) (0.0176)
2 Years Prior to Adoption -0.0003 0.0298 -0.0046 0.0220 0.0224(0.0440) (0.0431) (0.0372) (0.0817) (0.0146)
Uniform Required -0.0161 0.0066 0.0396 -0.0277 0.0031(0.0279) (0.0305) (0.0335) (0.0593) (0.0144)
Observations 239,271 238,758 239,347 584,699 594,017
I. Levels
>= 4 Years Prior to Adoption -0.0109 0.0442* -0.0342* -0.3290 -0.1363*(0.0404) (0.0260) (0.0188) (0.3177) (0.0704)
3 Years Prior to Adoption -0.0205 0.0309* -0.0117 -0.2978 -0.0560(0.0276) (0.0162) (0.0157) (0.2017) (0.0653)
2 Years Prior to Adoption -0.0078 0.0165 0.0051 -0.0275 -0.0521(0.0190) (0.0128) (0.0123) (0.1416) (0.0568)
Uniform Required -0.0080 -0.0218** 0.0281** 0.3558*** 0.0870*(0.0103) (0.0105) (0.0108) (0.1282) (0.0479)
Observations 539,559 539,371 538,368 1,055,728 1,073,533
II. Gains Math Reading Language Attendance Discipline
>= 4 Years Prior to Adoption 0.0127 0.0939** -0.0165 0.0765 -0.0760(0.0556) (0.0430) (0.0287) (0.3317) (0.1187)
3 Years Prior to Adoption -0.0098 0.0530* 0.0219 -0.0475 -0.0221(0.0288) (0.0299) (0.0264) (0.2402) (0.0910)
2 Years Prior to Adoption 0.0057 0.0355* 0.0102 0.0737 -0.0239(0.0190) (0.0180) (0.0135) (0.1877) (0.0870)
Uniform Required 0.0214 -0.0255 0.0504** 0.2349 0.0822(0.0343) (0.0181) (0.0204) (0.1436) (0.0767)
Observations 351,627 351,394 350,648 749,979 760,728
Table 5: Estimates of Years Until Uniform Adoption on OutcomesA. Elementary
B. Middle/High
Standard errors clustered by school in parentheses. Each regression is demeaned within individuals to remove student fixed-effects and also includes school dummies to removes school fixed effects, school dummies interacted with a linear time trend, grade indicators, year indicators, interactions of grade and year indicators, and the student's free-lunch, reduced-price lunch, or other economic disadvantage status. *, **, and *** denote staistical significance at the 10%, 5%, and 1% levels, respectively.
(1) (2) (3) (4) (5) (6) (7) (8) (9) (10)Math Reading Language Attendance Discipline Math Reading Language Attendance Discipline
I. Levels
Uniform Required -0.0169 -0.0139 0.0170 -0.0878** 0.0146 -0.0466** -0.0263* 0.0090 0.0393 0.0013(0.0230) (0.0171) (0.0204) (0.0429) (0.0197) (0.0198) (0.0148) (0.0159) (0.0395) (0.0054)
Observations 206,713 206,483 206,721 448,505 456,590 199,569 199,382 199,601 429,626 436,940
II. Gains
Uniform Required 0.0223 0.0301 0.0236 -0.0662 -0.0010 -0.0373 -0.0169 0.0531* 0.0183 0.0010(0.0301) (0.0323) (0.0330) (0.0581) (0.0220) (0.0326) (0.0300) (0.0312) (0.0661) (0.0069)
Observations 121,720 121,420 121,728 298,697 303,538 117,551 117,338 117,619 286,002 290,479
I. Levels
Uniform Required -0.0149 -0.0179* 0.0218* 0.2711* 0.1298** 0.0008 -0.0196* 0.0176* 0.4797*** 0.0615(0.0127) (0.0100) (0.0127) (0.1388) (0.0640) (0.0122) (0.0101) (0.0103) (0.1363) (0.0396)
Observations 268,158 267,942 267,359 530,281 539,398 271,401 271,429 271,009 525,447 534,135
II. Gains
Uniform Required 0.0118 -0.0259 0.0376 0.0962 0.0923 0.0336 -0.0054 0.0519*** 0.3622** 0.0690(0.0310) (0.0208) (0.0244) (0.1311) (0.0843) (0.0360) (0.0183) (0.0186) (0.1596) (0.0519)
Observations 174043 173,782 173,430 374,642 380,137 177,584 177,612 177,218 375,337 380,591
Table 6: Estimates of the Effect of Uniforms on Student Outcomes by Gender and Grade Level
Standard errors clustered by school in parentheses. Each regression is demeaned within individuals to remove student fixed-effects and also includes school dummies to removes school fixed effects, school dummies interacted with a linear time trend, grade indicators, year indicators, interactions of grade and year indicators, and the student's free-lunch, reduced-price lunch, or other economic disadvantage status. *, **, and *** denote staistical significance at the 10%, 5%, and 1% levels, respectively.
Males Females
A. Elementary
B. Middle/High
Math Reading Language Attendance Discipline Math Reading Language Attendance Discipline Math Reading Language Attendance Discipline
I. Levels
Uniform Required -0.0180 -0.0185 0.0015 -0.0658 0.0304 -0.0154 -0.0055 0.0240 -0.0088 -0.0018 -0.0333 -0.0161 0.0404 0.0662 0.0136(0.0266) (0.0252) (0.0257) (0.0501) (0.0304) (0.0246) (0.0183) (0.0187) (0.0464) (0.0115) (0.0416) (0.0239) (0.0280) (0.0844) (0.0113)
Observations 146,553 146,301 146,616 249,633 254,564 182,610 182,471 182,644 497,110 503,792 60,201 60,182 60,157 105,559 108,655
II. Gains
Uniform Required -0.0467 -0.0078 0.0170 -0.0783 0.0171 0.0435 0.0335 0.0541 0.0150 -0.0071 0.0543* 0.0535 0.1050 -0.2255* 0.0194(0.0379) (0.0329) (0.0384) (0.0888) (0.0321) (0.0389) (0.0417) (0.0386) (0.0604) (0.0132) (0.0310) (0.0369) (0.0741) (0.1306) (0.0123)
Observations 90,020 89,712 90,095 162,663 165,690 101,365 101,188 101,398 337,805 341,956 37,670 37,647 37,644 68,138 69,857
I. Levels
Uniform Required -0.0042 0.0058 0.0186 0.5255** 0.0587 -0.0059 -0.0232* 0.0181 0.2005 0.1232* -0.0396 -0.0165 0.0370* 0.2673* 0.1080***(0.0271) (0.0163) (0.0157) (0.2110) (0.0633) (0.0124) (0.0133) (0.0126) (0.1544) (0.0663) (0.0240) (0.0119) (0.0204) (0.1380) (0.0351)
Observations 173,104 173,085 172,858 360,275 366,410 289,585 289,464 288,773 542,044 550,106 57,679 57,643 57,564 117,419 120,293
II. Gains
Uniform Required 0.0702 0.0303 0.0741** 0.2592 0.1224 0.0088 -0.0335* 0.0450* 0.1420 0.0485 0.0880** 0.0110 -0.0319 0.1188 0.1072(0.0560) (0.0302) (0.0336) (0.2556) (0.0974) (0.0400) (0.0197) (0.0243) (0.1800) (0.0674) (0.0386) (0.0266) (0.0510) (0.1646) (0.0735)
Observations 110,430 110,416 110,274 252,876 256,473 190,832 190,685 190,124 389,630 394,603 37,659 37,594 37,555 81,741 83,391
Standard errors clustered by school in parentheses. Each regression is demeaned within individuals to remove student fixed-effects and also includes school dummies to removes school fixed effects, school dummies interacted with a linear time trend, grade indicators, year indicators, interactions of grade and year indicators, and the student's free-lunch, reduced-price lunch, or other economic disadvantage status. *, **, and *** denote staistical significance at the 10%, 5%, and 1% levels, respectively.
Table 7: Estimates of the Effect of Uniforms on Student Outcomes by Race and Grade Level
Whites
A. Elementary
B. Middle/High
Blacks Hispanics