Embed Size (px)
Citation preview

DRBC CY2012 Water Audit
Program Summary
10/22/2013
DRBC Water Management Advisory Committee
David Sayers
Planning and IT Branch

Water Service area in the Delaware River Basin
• Approx. 21% of Basin covered by service area
• 80% of basin residents (6.7 million customers)
• Total PWS withdrawals:
~865 MGD
• 2nd largest water use sector in the Basin
• Approx. 300 systems subject to Water Audit Requirement
No mapping available for NY

0.0
1.0
2.0
3.0
4.0
5.0
6.0
7.0
8.0
9.0
0
100
200
300
400
500
600
700
800
900
1,000
1,100
Mill
ion
s
Mill
ion
Gal
lon
s /
Day
Aggregated Withdrawals of 40 Public Water Supply Systems in the DRB
(Million Gallons/Day)
Withdrawals DRB Population

Unaccounted for Water
DRBC Rule change
IWA/AWWA Water Audit
Methodology

AWWA Resources
• Recent Water Audit manual published
• Free interactive audit software available
• Data grading capability assesses the validity of the input data
• Instructions, definitions provided in software
• DRBC member of AWWA Water Loss Control Committee
www.awwa.org

Implementation Summary
2006-9: Water Loss Accountability (WMAC)
2009: Resolution 2009-1 Resulting in water code revisions
2009-11: Outreach / Voluntary Implementation DRBC workshop and webpages
2012: DRBC Database preparation
2013: 2012 Calendar year reports received
Initial evaluation of audit results

• Team Effort!
• DRBC Database utilized to:
• Identify regulated entities
• Track docket requirements
• Track contact details for outreach
• Track receipt of audits
• Provided opportunity to clean-up database/dockets
• Electronic reporting required (AWWA audit format)
• Tools developed for audit data management
• Significant staff effort to track down outstanding audits and
provide assistance on completing the audit
Audit Data Collection

• Reporting deadline: March 31, 2013
• ~ 140 audits submitted by deadline
• Significant follow up required by staff
• ~300 water audits required from docket holders
• ~200 water audits received and suitable for analysis
• Audits received account for ~665MGD (77% of total
PWS volume)
Water Audit Program Status:
Oct 2013

Water Audit Data Analysis:
CY2012 Results...

0%
10%
20%
30%
40%
50%
60%
70%
80%
90%
100%
0
50
100
150
200
250
Ph
ilad
elp
hia
Wat
er D
epar
tmen
t
Aq
ua-
PA
: Mai
n S
yste
m
NJA
W (
Del
ran
Inta
ke)
Tren
ton
Wat
er W
oks
Art
esia
n W
ater
Co
mp
any,
Inc…
Un
ited
Wat
er D
elaw
are
Bet
hle
hem
Cit
y
Alle
nto
wn
, PA
PA
Am
eric
an W
ater
/…
No
rth
Pen
n W
ater
Au
tho
rity
Cit
y O
f V
inel
and
Wat
er U
tilit
y
No
rth
Wal
es W
ater
Au
tho
rity
Leh
igh
Co
un
ty A
uth
ori
ty -
…
East
on
Su
bu
rban
Wat
er A
uth
ori
ty
Mer
chan
tvill
e P
enn
sau
ken
…
Haz
leto
n C
ity
Au
tho
rity
Low
er B
uck
s C
ou
nty
Jo
int…
Mo
un
t La
ure
l To
wn
ship
…
Was
hti
ngt
on
Tw
p. M
UA
Cit
y o
f D
ove
r D
E
MG
D
Water Supplied in CY2012 (MGD): Largest 20 systems
Volume (MGD)
Cumulative Pcnt of Total (200 audits)

0%
20%
40%
60%
80%
100%
0
50
100
150
200
250
1 51 101 151 201
MG
D
Water Supplied CY2012 (MGD); n of systems = 204
Volume (MGD)
Cumulative Pcnt of Total (200 audits)

0%
20%
40%
60%
80%
100%
0
1
2
3
4
5
6
7
8
9
10
1 51 101 151 201
MG
D
Water Supplied CY2012 (MGD); n of systems = 204
Volume (MGD)
Cumulative Pcnt of Total (200 audits)
0%
10%
20%
30%
40%
50%
60%
70%
80%
90%
100%
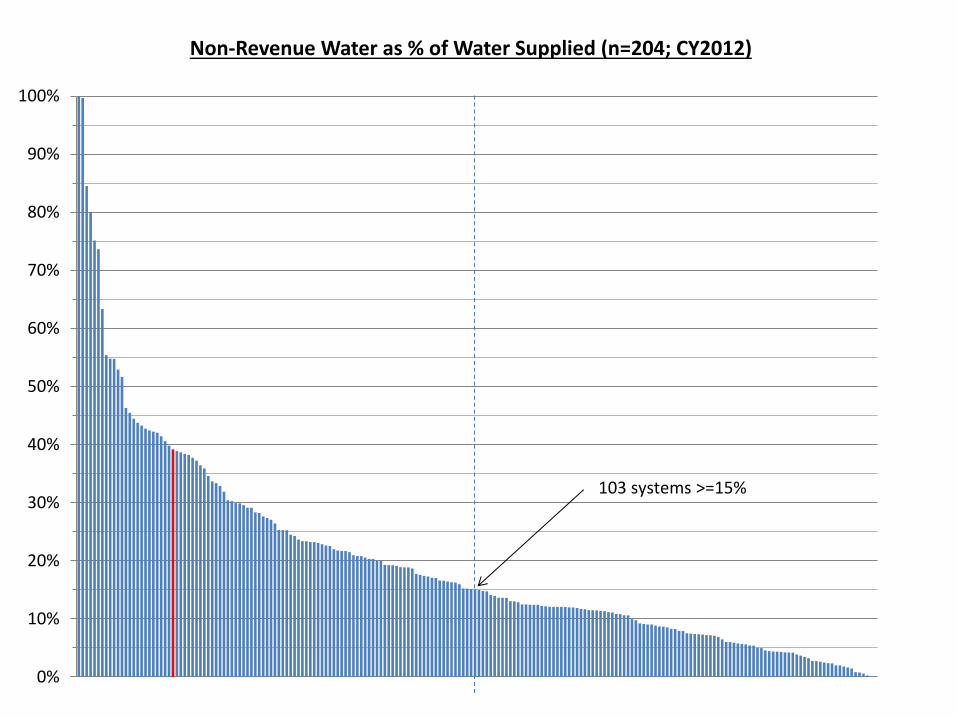
Non-Revenue Water as % of Water Supplied (n=204; CY2012)
103 systems >=15%

0
10
20
30
40
50
60
70
80
90
100
Audit Grading Score (n=204; CY2012) The grading score reflects the kinds of practices that a utility employs to track their data. Low scores indicate a lot of estimation, high scores indicate good metering, calibration and data tracking practices. PWD's score is shown in red.
0
10
20
30
40
50
Import ExportM
GD
19
117
42
26
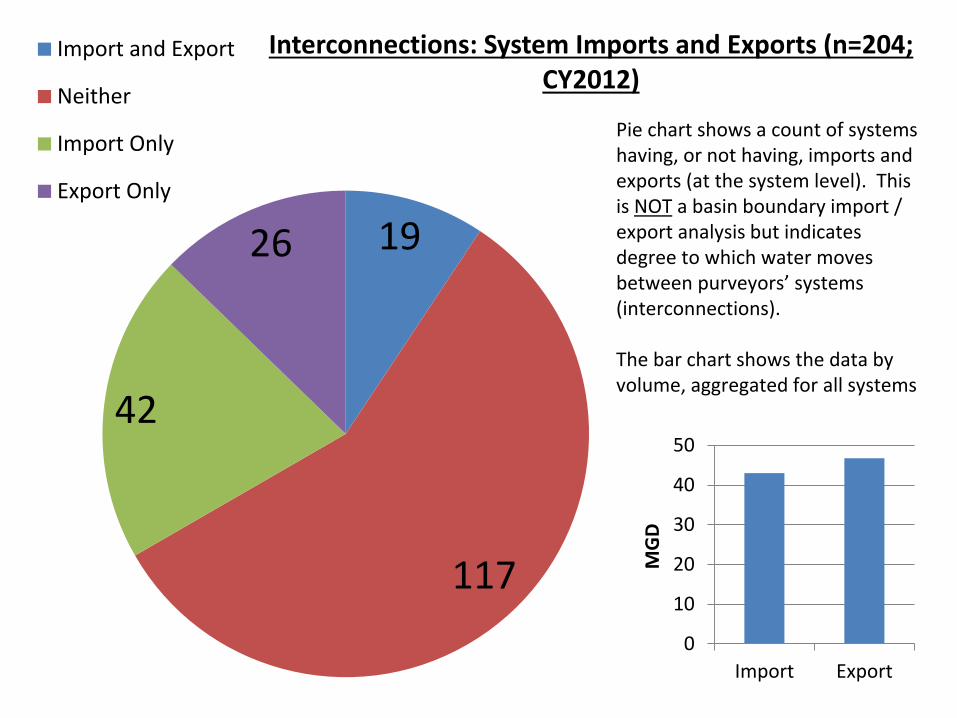
Interconnections: System Imports and Exports (n=204; CY2012)
Import and Export
Neither
Import Only
Export Only
Pie chart shows a count of systems having, or not having, imports and exports (at the system level). This is NOT a basin boundary import / export analysis but indicates degree to which water moves between purveyors’ systems (interconnections). The bar chart shows the data by volume, aggregated for all systems

$1
$10
$100
$1,000
$10,000
$100,000
$1,000,000
$10,000,000
$100,000,000
Annual Cost of Water Losses (n=199; CY2012)
Annual cost of Real Losses
Annual cost of Apparent Losses

$5.35 / 1000 gallons
$0
$2
$4
$6
$8
$10
$12
$14
$16
$18
$20
Average Customer Retail Unit Cost ($/1000gallons) (n=194; CY2012)
Customer retail unit cost /1000 gallons
Median Cost
Costs for 10 systems were excluded as costs presented seemed high (excluded costs ranged: $27.09 - $171,936.00 / 1000 gallons)

Water Exported
Authorized Consumption
Water Losses
0%
10%
20%
30%
40%
50%
60%
70%
80%
90%
100%
Water Exported
Water Imported
Volume From OwnSources
Water Exported
Billed AuthorizedConsumptionUnbilled AuthorizedConsumptionApparent Losses
Real Losses
Water Exported
Revenue Water
Non Revenue Water
WaterExported
WaterSupplied
The CY2012 DRB Water Audit / Water Balance (aggregate of 204 audits)
662 MGD
WATER SUPPLIED
516 MGD
AUTHORIZED CONSUMPTION
146 MGD WATER LOSSES
31 MGD (AL)
115 MGD (RL)
$100 Million
NON-REVENUE WATER

• Evolution not Revolution
• Docket database significantly cleaned up:
- Expired dockets renewed
- Better understanding of multi-system utilities
• Systems are performing the AWWA audit
• Docket holders recognize DRBC is looking at this
issue
• One utility “found a Marina” (apparent loss)
• DRBC implemented a new program with
limited resources
Water Audits Year One: What did we achieve?
• Conclude data collection for CY2012 reporting
• Prepare an article summarizing results/experience
• Data Validation / follow up for anomalies (how to
prioritize?)
• Prepare for CY2013 reporting
• Provide additional guidance for common errors
(enhance FAQs / You Tube?)
• Prioritize systems by size (as per EPA / PUC)?
Next steps (short term)

• Continue annual program / build dataset
• Pursue metrics or best practice?
• WMAC to provide recommendations for cont’d
outreach / regulatory follow up
• Funding??? / SRFs / State Partners
• Coordinate with other programs:
- State Partners
- PAPUC
- Georgia model
Next steps (longer term)


![DRBC Complaint (Final)[1]](https://img.pdfslide.us/doc/110x75/577d29b01a28ab4e1ea78762/drbc-complaint-final1.jpg)