Embed Size (px)
Citation preview
Drawing and using free body diagrams: Why it may be better not to decompose forces
Ivica Aviani,1,* Nataša Erceg,2 and Vanes Mešić31Institute of Physics, Bijenička c. 46, Hr-10002 Zagreb, Croatia and Faculty of Science, University of Split,
Teslina 12, 21000 Split, Croatia2Department of Physics, University of Rijeka, R. Matejčić 2, 51000 Rijeka, Croatia
3Faculty of Science, University of Sarajevo, Zmaja od Bosne 33-35, 71000 Sarajevo,Bosnia and Herzegovina
(Received 4 May 2015; published 29 December 2015)
In this study we investigated how two different approaches to drawing free body diagrams influence thedevelopment of students’ understanding of Newton’s laws, including their ability to identify real forces. Forthis purpose we developed a 12-item two-tier multiple choice survey and conducted a quasiexperiment.This experiment included two groups of first-year physics students from Rijeka (RG) (ne ¼ 27) and Split(SG) (nc ¼ 25) Universities. Students from both groups solved mechanics problems for a period of twoclass hours. The only difference was that RG students used the superposition of forces approach to solvingmechanics problems and in SG the decomposition of forces approach has been used. The ANCOVA(nc ¼ 17, ne ¼ 17) showed a statistically significant difference in favor of RG, whereby the effect sizeswere moderate to large, and the largest differences have been observed in the ability of identifying realforces. Students from the control group (SG) more often exhibited the misconception that forces and theircomponents act on a body independently and simultaneously. Our results support the idea that the practiceof resolving forces into the components may not be the most effective way to develop understanding ofNewton’s laws and the concept of force.
DOI: 10.1103/PhysRevSTPER.11.020137 PACS numbers: 01.40.Fk, 01.40.gb
I. INTRODUCTION
In earlier research it has been shown that students exhibitsignificant difficulties when it comes to using vectors andfree body diagrams (FBDs) [1–4]. Typically, the math-ematical approach to mechanics problem solving is char-acterized by decomposition of forces into the components.In this way additional, nonexistent forces are introduced,which leads to a loss of physical clarity. Konradtyev arguesthat at least for some tasks this conceptual confusion couldbe prevented by using the superposition of forces approachto drawing FBDs and solving mechanics problems [5]. Bythe superposition of forces approach we mean a directaddition of the force vectors, using the tail-to-tip method[6], without resolving the vectors into their components.Although the quoted arguments related to the effective-
ness of the superposition approach seem to be scientificallysound, as far as we know they have not yet been testedthrough implementation of experimental or quasiexperi-mental studies. So we decided to run a quasiexperimentalstudy in order to investigate whether the superposition offorces approach results in better understanding of FBDscompared to the decomposition of forces approach.
The main research question of this study was as follows:“Is the approach to drawing and using FBDs which avoidsspecifying force components more effective than the tradi-tional approach (in which the forces are resolved into thecomponents) when it comes to developing students’ under-standing of Newton’s laws including their ability to identifyreal forces?”By the term “real force” we mean the resultant inter-
action of two bodies in the considered physical situationwhich should be distinguished from mathematical entitiessuch as force components.
II. REVIEW OF RELEVANT LITERATURE
For purposes of reducing the complexity of authenticrepresentations and organizing the process of problemsolving, physicists often use diagrams. One kind of dia-gram traditionally used in physics is the free body diagram(FBD). Rosengrant, van Heuvelen, and Etkina [7] defineFBDs as “diagrammatic representations in which onefocuses only on an object of interest and on the forcesexerted on it by other objects.” Most physics teachersrecognize that FBDs have a high instructional value [8].Their beliefs are supported by empirical findings that showstudents who correctly draw FBDs are significantly moresuccessful in physics problem solving [7].It is not sufficient to develop students’ skills in drawing
diagrams—it is also necessary to develop their abilities ofusing these diagrams for purposes of formulating the
*[email protected]; http://aviani.ifs.hr
Published by the American Physical Society under the terms ofthe Creative Commons Attribution 3.0 License. Further distri-bution of this work must maintain attribution to the author(s) andthe published article’s title, journal citation, and DOI.
PHYSICAL REVIEW SPECIAL TOPICS—PHYSICS EDUCATION RESEARCH 11, 020137 (2015)
1554-9178=15=11(2)=020137(14) 020137-1 Published by the American Physical Society
corresponding equations of motion [9]. According toFlores, Kanim, and Kautz [10] it is very important forthe students to recognize that Newton’s 2nd law is arelationship between vectors. To that end, students shouldpractice the skill of finding the resultant force acting on abody and relating it to the resultant acceleration. Earlierresearch has shown that this task can be difficult even forphysics experts [11].Taking into account the high importance of FBDs for
problem solving in mechanics, as well as the difficulties ofusing them in physics instruction, many researchersattempted to design effective approaches to drawing and(or) using FBDs [12–15]. All these approaches share thecommon characteristic of requiring the student to manipu-late vectors with the final aim of facilitating problemsolving (e.g., determining the acceleration of the systemor some unknown force).The procedure for solving physics problems by using
FBDs usually consists of three essential steps. The first stepis the construction of a free body diagram, the second stepentails the graphical determination of the resultant forcevector, and the third step (if required in the problem) isfinding its magnitude. There are different methods forgraphical vector addition [6]. The most common is thedecomposition method whereby the vectors are resolvedinto the components and the components with the same lineof action are added. Another is the superposition methodwhere the vectors are added such that the tail of eachsubsequent vector is positioned at the tip of the previousvector. In both cases the magnitude of the resultant vector isdetermined using the Pythagorean theorem and trigono-metric methods.Some point out that the decomposition of forces
approach to drawing FBDs can lead to certain difficultiesin students’ conceptual understanding of physics. van denBerg and van Huis [16] point out that force diagrams areoften quite confusing due to a large number of arrowswhich are typically used to denote forces, their compo-nents, resultants, and velocities. According to Kondratyevand Sperry [5] “…activity of separation of the vectorquantities into their perpendicular components adds anunnecessary complication for the student who is trying tomake sense of the physical situation and solve the prob-lem.” Students often tend to “jump to force componentsimmediately” and memorize the meanings of these com-ponents in specific cases “rather than deriving them fromthe geometry of the problem” [1].Some of students’difficulties related to drawing and using
FBDs probably arise due to their difficulties with manipu-lating vectors. Knight [2] considers vectors to be an essentialcomponent of the mathematical language of physics. At thesame time hewarns that, unlike physics teachers, students donot see vector manipulation as obvious. Student difficultiesregarding vector manipulations (algebraic and graphical) inintroductory physics courses have been also reported by
Kanim [3]. Ngyen andMeltzer [4] found that the majority oftheir students in the algebra-based courses were not able tocorrectly carry out two-dimensional vector addition, evenafter a full semester of study. Further, they pointed out thatstudents do not sufficiently understand the concept of“vector direction” and are quite confused regarding thetail-to-tip and parallelogram addition rules. In the study byBarniol and Zavala [17] it has been shown that the students’choice of addition procedure depends on the context—in thecontext of forces students more often use the “tail-to-tail”approach, whereas in the context of displacement vectorsthey prefer the “tail-to-tip” approach. Faced with therelatively low student knowledge of vectors, many research-ers emphasized the necessity for more practice and explicitinstruction on using vectors in physics teaching [2–4].
III. METHODS
A. Test design
For the purposes of this study, we developed the FreeBody Diagram Test (FBDT) which is provided inAppendix A (see Figs. 3 and 4). FBDT is a two-tier testthat is proposed to measure students’ understanding ofNewton’s laws (tier 1), as well as their ability to identifyreal forces in different mechanics contexts (tier 2). It is amultiple choice survey consisting of 12 items based onvisual representation, i.e., on different FBDs. Each itemstem comprises the verbal description of an object in acertain physical situation and students are required tochoose one of the five graphical options that is the bestmatch for the description. The only differences between theoptions are the forces acting on the body. For simplicity andalso to save space we drew the forces directly on the sketchof the object [18]. Please note that such an approach is notcompletely in line with Rosengrant’s [7] definition of FBDsto the point that in most cases the supporting surface,attached rope, or trajectory of the object are also included inthe diagram. The used approach to drawing FBDs iscompatible with the Croatian tradition of physics educa-tion, and in our opinion it facilitates thinking about thephysical origin of forces acting on a body (by reducingcognitive load related to recalling aspects of the physicalsituation at hand). With the aim of excluding the influenceof torques, all the forces were drawn from the object’scenter of mass [16]. The forces were marked by numbers.For each item, participants were required to specify whichof the five diagrams correctly shows real forces acting onthe body in concern (tier 1) and also to write down thenames of the corresponding forces (tier 2). Thus, we couldsay that FBDT measures students’ representational fluency[19] within the context of free body diagrams.Our choice of item distracters was mostly based on the
results of an earlier study in which we required teachers(who taught physics to seventh and eighth grade students inCroatia) to draw FBDs for situations similar to the ones
IVICA AVIANI, NATAŠA ERCEG, and VANES MEŠIĆ PHYS. REV. ST PHYS. EDUC. RES 11, 020137 (2015)
020137-2
chosen in the FBDT. Taking into account the fact thatteachers exhibit similar misconceptions as their students[20] as well as the fact that many of these misconceptionscould be related to the characteristics of traditional physicsinstruction, we could say that our test also checks fordidaktikogenic misconceptions.
B. Content validity of the test
In order to provide evidence regarding the contentvalidity of our test, we used an approach which is similarto the approach taken by Lawshe [21]. Specifically, weasked 33 high school physics teachers to answer thefollowing questions for each of the test items:(1a) Is the knowledge measured by this item an important
part of understanding of Newton’s laws of motionwithin the context of a typical introductory course ofphysics at the university level?
(1b) Is the knowledge measured by this item an importantpart of the ability to identify real forces in variousmechanics phenomena within the context of atypical introductory course of physics at the uni-versity level?
(2) How much do you like the item on a scale from 5(not at all) to 10 (very much)?
(3) How difficult is the item (for an average abilitystudent) on a scale from 1 (below average difficulty)to 3 (above average difficulty)?
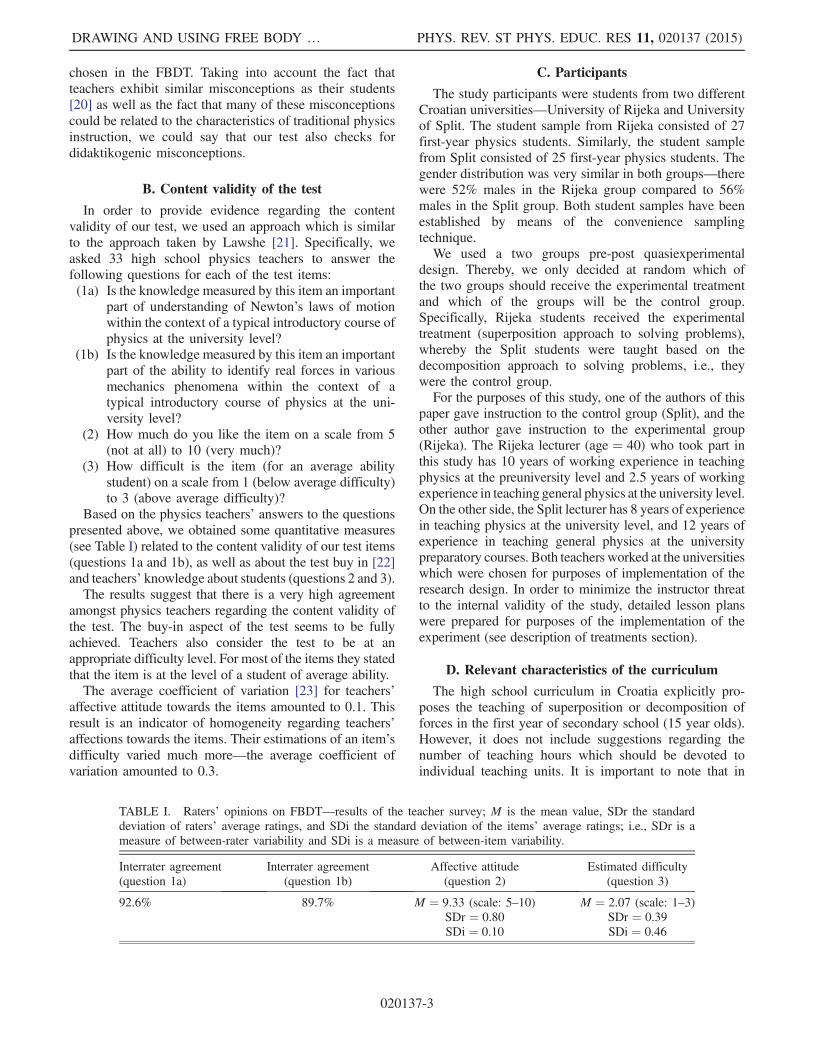
Based on the physics teachers’ answers to the questionspresented above, we obtained some quantitative measures(see Table I) related to the content validity of our test items(questions 1a and 1b), as well as about the test buy in [22]and teachers’ knowledge about students (questions 2 and 3).The results suggest that there is a very high agreement
amongst physics teachers regarding the content validity ofthe test. The buy-in aspect of the test seems to be fullyachieved. Teachers also consider the test to be at anappropriate difficulty level. For most of the items they statedthat the item is at the level of a student of average ability.The average coefficient of variation [23] for teachers’
affective attitude towards the items amounted to 0.1. Thisresult is an indicator of homogeneity regarding teachers’affections towards the items. Their estimations of an item’sdifficulty varied much more—the average coefficient ofvariation amounted to 0.3.
C. Participants
The study participants were students from two differentCroatian universities—University of Rijeka and Universityof Split. The student sample from Rijeka consisted of 27first-year physics students. Similarly, the student samplefrom Split consisted of 25 first-year physics students. Thegender distribution was very similar in both groups—therewere 52% males in the Rijeka group compared to 56%males in the Split group. Both student samples have beenestablished by means of the convenience samplingtechnique.We used a two groups pre-post quasiexperimental
design. Thereby, we only decided at random which ofthe two groups should receive the experimental treatmentand which of the groups will be the control group.Specifically, Rijeka students received the experimentaltreatment (superposition approach to solving problems),whereby the Split students were taught based on thedecomposition approach to solving problems, i.e., theywere the control group.For the purposes of this study, one of the authors of this
paper gave instruction to the control group (Split), and theother author gave instruction to the experimental group(Rijeka). The Rijeka lecturer (age ¼ 40) who took part inthis study has 10 years of working experience in teachingphysics at the preuniversity level and 2.5 years of workingexperience in teaching general physics at the university level.On the other side, the Split lecturer has 8 years of experiencein teaching physics at the university level, and 12 years ofexperience in teaching general physics at the universitypreparatory courses. Both teachers worked at the universitieswhich were chosen for purposes of implementation of theresearch design. In order to minimize the instructor threatto the internal validity of the study, detailed lesson planswere prepared for purposes of the implementation of theexperiment (see description of treatments section).
D. Relevant characteristics of the curriculum
The high school curriculum in Croatia explicitly pro-poses the teaching of superposition or decomposition offorces in the first year of secondary school (15 year olds).However, it does not include suggestions regarding thenumber of teaching hours which should be devoted toindividual teaching units. It is important to note that in
TABLE I. Raters’ opinions on FBDT—results of the teacher survey; M is the mean value, SDr the standarddeviation of raters’ average ratings, and SDi the standard deviation of the items’ average ratings; i.e., SDr is ameasure of between-rater variability and SDi is a measure of between-item variability.
Interrater agreement Interrater agreement Affective attitude Estimated difficulty(question 1a) (question 1b) (question 2) (question 3)
92.6% 89.7% M ¼ 9.33 (scale: 5–10) M ¼ 2.07 (scale: 1–3)SDr ¼ 0.80 SDr ¼ 0.39SDi ¼ 0.10 SDi ¼ 0.46
DRAWING AND USING FREE BODY … PHYS. REV. ST PHYS. EDUC. RES 11, 020137 (2015)
020137-3
Croatia the students are taught about the superposition offorces in primary school (7th grade, 13 year old pupils) forthe first time, whereas they do not learn about decom-position of forces until secondary school (1th grade, 15 yearold pupils). Nevertheless, when faced with mechanicsproblems Croatian secondary school students (and teach-ers) prefer the decomposition of forces approach to thesuperposition approach [24].At the University level, Rijeka students learn explicitly
about superposition or decomposition of forces within thecontext of the Physics I: Mechanics course, wherebytypically 3 hours of instruction are devoted to this teachingunit. Of course, students are expected to apply theirknowledge about superposition or decomposition of forcesin many occasions or courses throughout their study.Similarly, Split students learn about superposition ordecomposition of forces within the general physics 1course. Five hours are devoted to this topic explicitly,but students are required to apply the gained knowledge inmany other courses or occasions.
E. Experimental design
As stated earlier, for purposes of answering our researchquestion a quasiexperimental design has been implemented.Both groups were pre-tested and, after the treatment, post-tested by using FBDT. In this way, we preserved thenaturalistic setting, i.e., the students were in their usualteaching environment. Each student was given a copy ofFBDT and a separate answering sheet (see Appendix A).Testing time was limited to 30 min. It is important to notethat students were asked to choose the diagrams that containonly the real forces and to name the forces not in accord totheir function, but in accord to their physical origin.The whole experiment, including the pretest and post-
test, has been conducted as a part of regular teachingactivities during the first three weeks of the secondsemester. In the first week students were administeredthe pretest. In the subsequent week they have beenreceiving the teaching treatment for two hours, and inthe third week the students wrote the post-test.Our independent (treatment) variable describes the treat-
ment approach taken to handle FBDs. It consists of twolevels (conditions). These conditions reflect the super-position and decomposition of forces approaches, respec-tively. The dependent variable is students’ post-test scoreon FBDT and their pretest score has been used as thecovariate. We attempted to make the two treatment con-ditions as similar as possible, except for the crucial factor,i.e., the approach to handling FBDs. Each of these twoapproaches is thoroughly described within the lesson plansprepared for the purposes of this study and conciselypresented below. The lesson plans which were createdfor the two conditions differed only with respect to thetaken problem solving approach. Special attention has beendevoted to the issue of matching the two conditions with
respect to the taught contents and examples. As emphasizedearlier, the duration of the treatment was set to two teachinghours, in both groups. The students were unaware of theexperimental hypothesis which contributed to minimizingthe reactivity effects, thus potentially increasing the eco-logical validity [25].In order to draw conclusions about the effectiveness of
the teaching treatments, we used a one-way between-groups analysis of covariance (ANCOVA). Our nullhypothesis was that the post-treatment level of dependentvariable, in the experimental group will be the same as inthe control group. The alternative (research) hypothesis wasthat students who got the superposition of forces treatmentwill outperform students who used the decomposition offorces treatment.
F. Description of treatments
In both the experimental and control groups studentswere required to solve the same six physics problems, listedin Appendix B (see Fig. 5). For purposes of solving theproblems, students had to draw and use FBDs. Theinstructors modeled the problem solving process, byexplicitly demonstrating the process of drawing FBDson the blackboard. Thereby, in the control and experimentalgroup different approaches were used. The traditional(decomposition) approach was applied in the control groupand a nontraditional (superposition) approach in the exper-imental group (see Appendix B).The traditional approach to problem solving, which is
typically applied in regular physics classes, most often wasstarted as follows: The real force vector (usually gravity)was resolved into convenient components (that have thesame lines of action as other forces) by using the paral-lelogram rule [26] and the components were added tocorresponding real forces of opposite directions in order tofind the resultant force (tasks 1, 2, 5, and 6). However, insome other tasks forces were directly added to correspond-ing forces of opposite directions in order to find theresultant force (task 3), or forces were directly cancelledwith corresponding forces of opposite directions and thenremaining forces were added to each other by using theparallelogram rule (task 4). The magnitude of the resultantforce has been found from the geometry of the problem.The nontraditional approach involved drawing real
forces acting on the observed object, followed by theiraddition by applying tail-to-tip rule. As a matter of fact, wecan add any two vectors by placing the tail of the secondvector so that it meets the tip of the first vector. The sum isthe vector from the tail of the first vector to the tip of thesecond vector. In our physics problems, such addition ofvectors is reflected as follows: If an object is at rest ormoves uniformly along a straight line, the real forces actingon the object close a polygon (see nonstandard approach inAppendix B, tasks 1 and 3). In other words, a resultantforce on the observed object is zero. If an object
IVICA AVIANI, NATAŠA ERCEG, and VANES MEŠIĆ PHYS. REV. ST PHYS. EDUC. RES 11, 020137 (2015)
020137-4
accelerates, the real forces acting on it do not close thepolygon, and the resultant force extends from the tail of thefirst vector to the tip of the last vector, closing the polygonof forces (see nonstandard approach in Appendix B, tasks2, 4, 5, and 6), in accordance with the tail-to-tip rule. In thiscase the magnitude of the resultant force is calculated fromthe side lengths of the obtained polygon (mostly triangle) offorces.
IV. RESULTS
A. Item statistics and test reliability
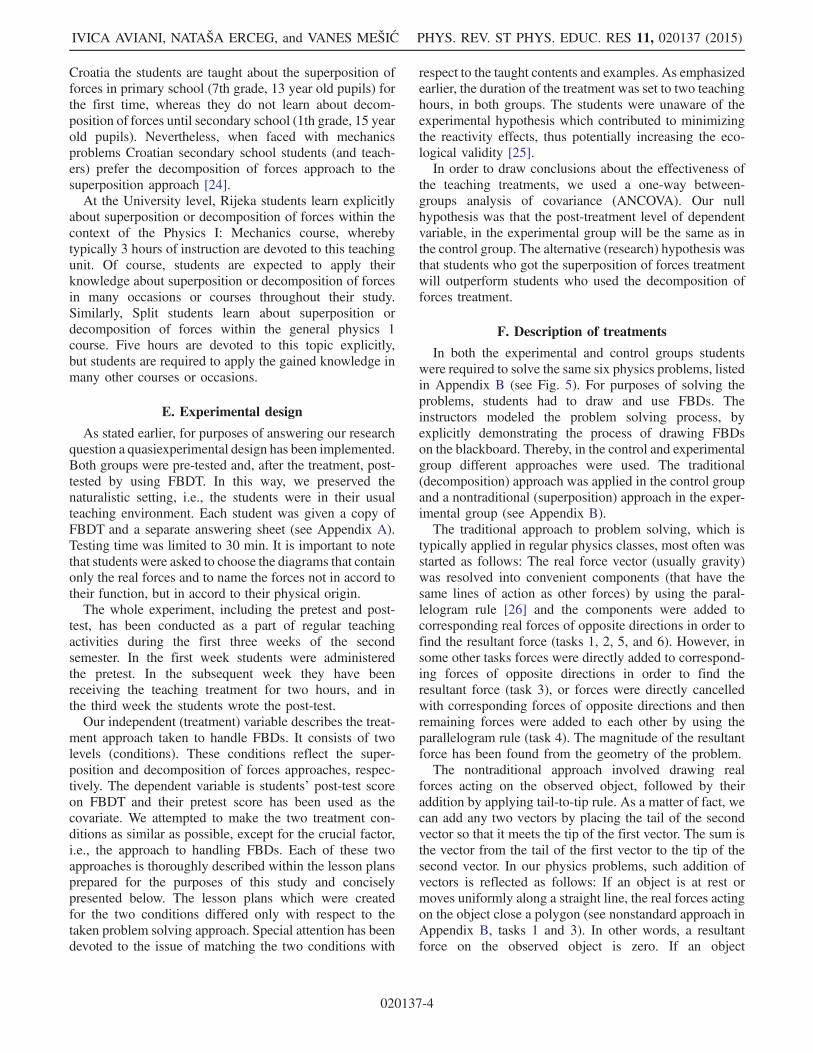
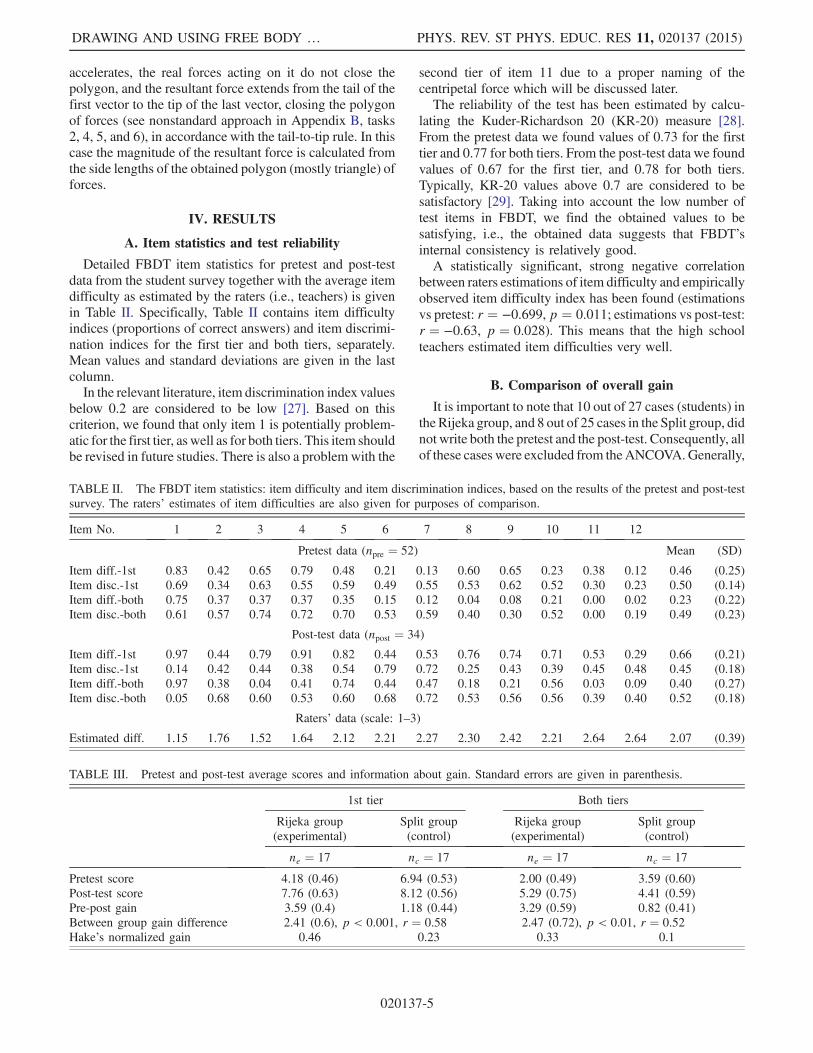
Detailed FBDT item statistics for pretest and post-testdata from the student survey together with the average itemdifficulty as estimated by the raters (i.e., teachers) is givenin Table II. Specifically, Table II contains item difficultyindices (proportions of correct answers) and item discrimi-nation indices for the first tier and both tiers, separately.Mean values and standard deviations are given in the lastcolumn.In the relevant literature, item discrimination index values
below 0.2 are considered to be low [27]. Based on thiscriterion, we found that only item 1 is potentially problem-atic for the first tier, as well as for both tiers. This item shouldbe revised in future studies. There is also a problemwith the
second tier of item 11 due to a proper naming of thecentripetal force which will be discussed later.The reliability of the test has been estimated by calcu-
lating the Kuder-Richardson 20 (KR-20) measure [28].From the pretest data we found values of 0.73 for the firsttier and 0.77 for both tiers. From the post-test data we foundvalues of 0.67 for the first tier, and 0.78 for both tiers.Typically, KR-20 values above 0.7 are considered to besatisfactory [29]. Taking into account the low number oftest items in FBDT, we find the obtained values to besatisfying, i.e., the obtained data suggests that FBDT’sinternal consistency is relatively good.A statistically significant, strong negative correlation
between raters estimations of item difficulty and empiricallyobserved item difficulty index has been found (estimationsvs pretest: r ¼ −0.699, p ¼ 0.011; estimations vs post-test:r ¼ −0.63, p ¼ 0.028). This means that the high schoolteachers estimated item difficulties very well.
B. Comparison of overall gain
It is important to note that 10 out of 27 cases (students) inthe Rijeka group, and 8 out of 25 cases in the Split group, didnot write both the pretest and the post-test. Consequently, allof these cases were excluded from theANCOVA.Generally,
TABLE II. The FBDT item statistics: item difficulty and item discrimination indices, based on the results of the pretest and post-testsurvey. The raters’ estimates of item difficulties are also given for purposes of comparison.
Item No. 1 2 3 4 5 6 7 8 9 10 11 12
Pretest data (npre ¼ 52) Mean (SD)
Item diff.-1st 0.83 0.42 0.65 0.79 0.48 0.21 0.13 0.60 0.65 0.23 0.38 0.12 0.46 (0.25)Item disc.-1st 0.69 0.34 0.63 0.55 0.59 0.49 0.55 0.53 0.62 0.52 0.30 0.23 0.50 (0.14)Item diff.-both 0.75 0.37 0.37 0.37 0.35 0.15 0.12 0.04 0.08 0.21 0.00 0.02 0.23 (0.22)Item disc.-both 0.61 0.57 0.74 0.72 0.70 0.53 0.59 0.40 0.30 0.52 0.00 0.19 0.49 (0.23)
Post-test data (npost ¼ 34)
Item diff.-1st 0.97 0.44 0.79 0.91 0.82 0.44 0.53 0.76 0.74 0.71 0.53 0.29 0.66 (0.21)Item disc.-1st 0.14 0.42 0.44 0.38 0.54 0.79 0.72 0.25 0.43 0.39 0.45 0.48 0.45 (0.18)Item diff.-both 0.97 0.38 0.04 0.41 0.74 0.44 0.47 0.18 0.21 0.56 0.03 0.09 0.40 (0.27)Item disc.-both 0.05 0.68 0.60 0.53 0.60 0.68 0.72 0.53 0.56 0.56 0.39 0.40 0.52 (0.18)
Raters’ data (scale: 1–3)Estimated diff. 1.15 1.76 1.52 1.64 2.12 2.21 2.27 2.30 2.42 2.21 2.64 2.64 2.07 (0.39)
TABLE III. Pretest and post-test average scores and information about gain. Standard errors are given in parenthesis.
1st tier Both tiers
Rijeka group(experimental)
Split group(control)
Rijeka group(experimental)
Split group(control)
ne ¼ 17 nc ¼ 17 ne ¼ 17 nc ¼ 17
Pretest score 4.18 (0.46) 6.94 (0.53) 2.00 (0.49) 3.59 (0.60)Post-test score 7.76 (0.63) 8.12 (0.56) 5.29 (0.75) 4.41 (0.59)Pre-post gain 3.59 (0.4) 1.18 (0.44) 3.29 (0.59) 0.82 (0.41)Between group gain difference 2.41 (0.6), p < 0.001, r ¼ 0.58 2.47 (0.72), p < 0.01, r ¼ 0.52Hake’s normalized gain 0.46 0.23 0.33 0.1
DRAWING AND USING FREE BODY … PHYS. REV. ST PHYS. EDUC. RES 11, 020137 (2015)
020137-5
the existence of baseline differences represented a threat tothe internal validity of our study. In order to alleviate thatthreat we enriched our data analysis by using the normalizedgain measure. Pretest and post-test average scores andinformation about gain are given in Table III.The calculation of the between group gain difference is
based on formulas given by McNemar [30]. The effect sizer is calculated based on the t-test value in line with theinstructions given by Rosnow, Rosenthal, and Rubin [31].In order to explore the relative efficacy of the inter-
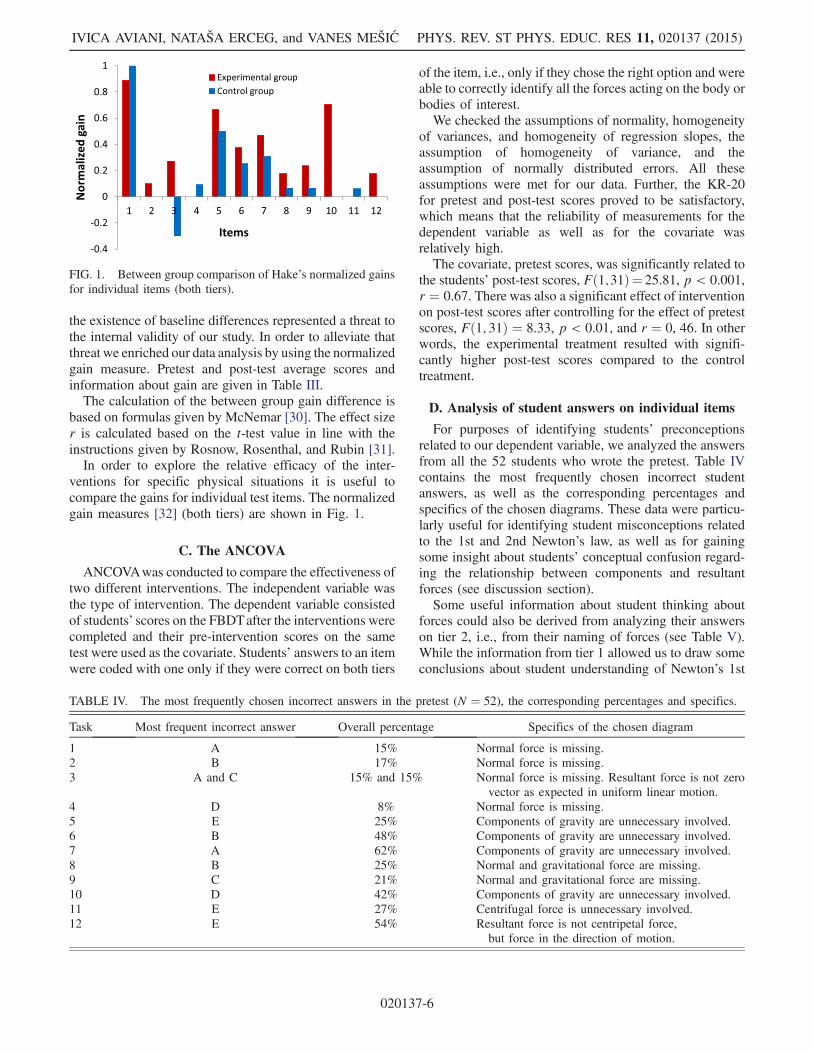
ventions for specific physical situations it is useful tocompare the gains for individual test items. The normalizedgain measures [32] (both tiers) are shown in Fig. 1.
C. The ANCOVA
ANCOVAwas conducted to compare the effectiveness oftwo different interventions. The independent variable wasthe type of intervention. The dependent variable consistedof students’ scores on the FBDTafter the interventions werecompleted and their pre-intervention scores on the sametest were used as the covariate. Students’ answers to an itemwere coded with one only if they were correct on both tiers
of the item, i.e., only if they chose the right option and wereable to correctly identify all the forces acting on the body orbodies of interest.We checked the assumptions of normality, homogeneity
of variances, and homogeneity of regression slopes, theassumption of homogeneity of variance, and theassumption of normally distributed errors. All theseassumptions were met for our data. Further, the KR-20for pretest and post-test scores proved to be satisfactory,which means that the reliability of measurements for thedependent variable as well as for the covariate wasrelatively high.The covariate, pretest scores, was significantly related to
the students’ post-test scores, Fð1;31Þ¼ 25.81, p < 0.001,r ¼ 0.67. There was also a significant effect of interventionon post-test scores after controlling for the effect of pretestscores, Fð1; 31Þ ¼ 8.33, p < 0.01, and r ¼ 0, 46. In otherwords, the experimental treatment resulted with signifi-cantly higher post-test scores compared to the controltreatment.
D. Analysis of student answers on individual items
For purposes of identifying students’ preconceptionsrelated to our dependent variable, we analyzed the answersfrom all the 52 students who wrote the pretest. Table IVcontains the most frequently chosen incorrect studentanswers, as well as the corresponding percentages andspecifics of the chosen diagrams. These data were particu-larly useful for identifying student misconceptions relatedto the 1st and 2nd Newton’s law, as well as for gainingsome insight about students’ conceptual confusion regard-ing the relationship between components and resultantforces (see discussion section).Some useful information about student thinking about
forces could also be derived from analyzing their answerson tier 2, i.e., from their naming of forces (see Table V).While the information from tier 1 allowed us to draw someconclusions about student understanding of Newton’s 1st
FIG. 1. Between group comparison of Hake’s normalized gainsfor individual items (both tiers).
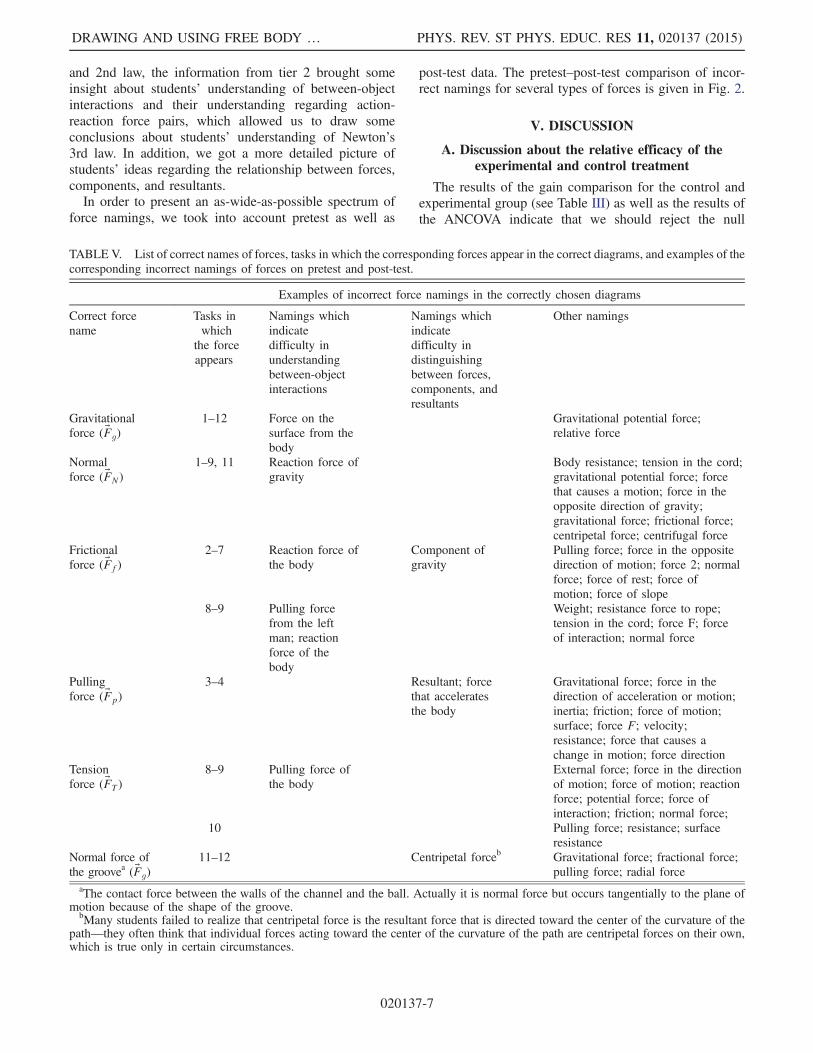
TABLE IV. The most frequently chosen incorrect answers in the pretest (N ¼ 52), the corresponding percentages and specifics.
Task Most frequent incorrect answer Overall percentage Specifics of the chosen diagram
1 A 15% Normal force is missing.2 B 17% Normal force is missing.3 A and C 15% and 15% Normal force is missing. Resultant force is not zero
vector as expected in uniform linear motion.4 D 8% Normal force is missing.5 E 25% Components of gravity are unnecessary involved.6 B 48% Components of gravity are unnecessary involved.7 A 62% Components of gravity are unnecessary involved.8 B 25% Normal and gravitational force are missing.9 C 21% Normal and gravitational force are missing.10 D 42% Components of gravity are unnecessary involved.11 E 27% Centrifugal force is unnecessary involved.12 E 54% Resultant force is not centripetal force,
but force in the direction of motion.
IVICA AVIANI, NATAŠA ERCEG, and VANES MEŠIĆ PHYS. REV. ST PHYS. EDUC. RES 11, 020137 (2015)
020137-6
and 2nd law, the information from tier 2 brought someinsight about students’ understanding of between-objectinteractions and their understanding regarding action-reaction force pairs, which allowed us to draw someconclusions about students’ understanding of Newton’s3rd law. In addition, we got a more detailed picture ofstudents’ ideas regarding the relationship between forces,components, and resultants.In order to present an as-wide-as-possible spectrum of
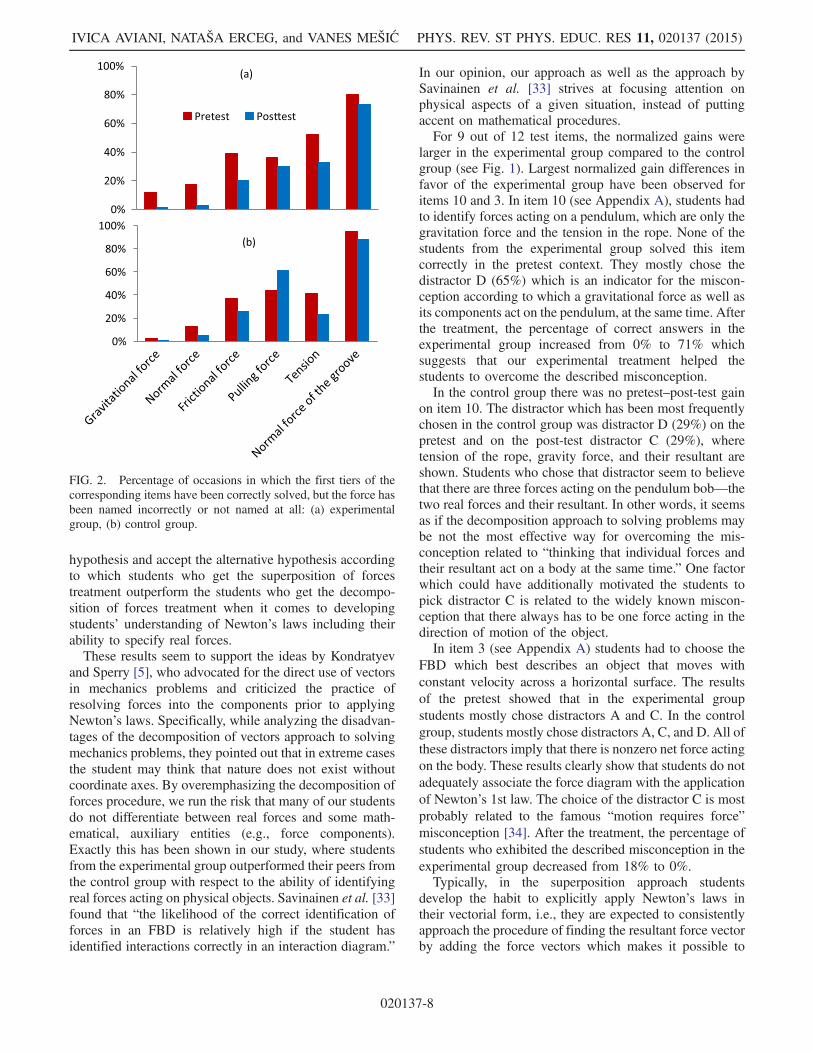
force namings, we took into account pretest as well as
post-test data. The pretest–post-test comparison of incor-rect namings for several types of forces is given in Fig. 2.
V. DISCUSSION
A. Discussion about the relative efficacy of theexperimental and control treatment
The results of the gain comparison for the control andexperimental group (see Table III) as well as the results ofthe ANCOVA indicate that we should reject the null
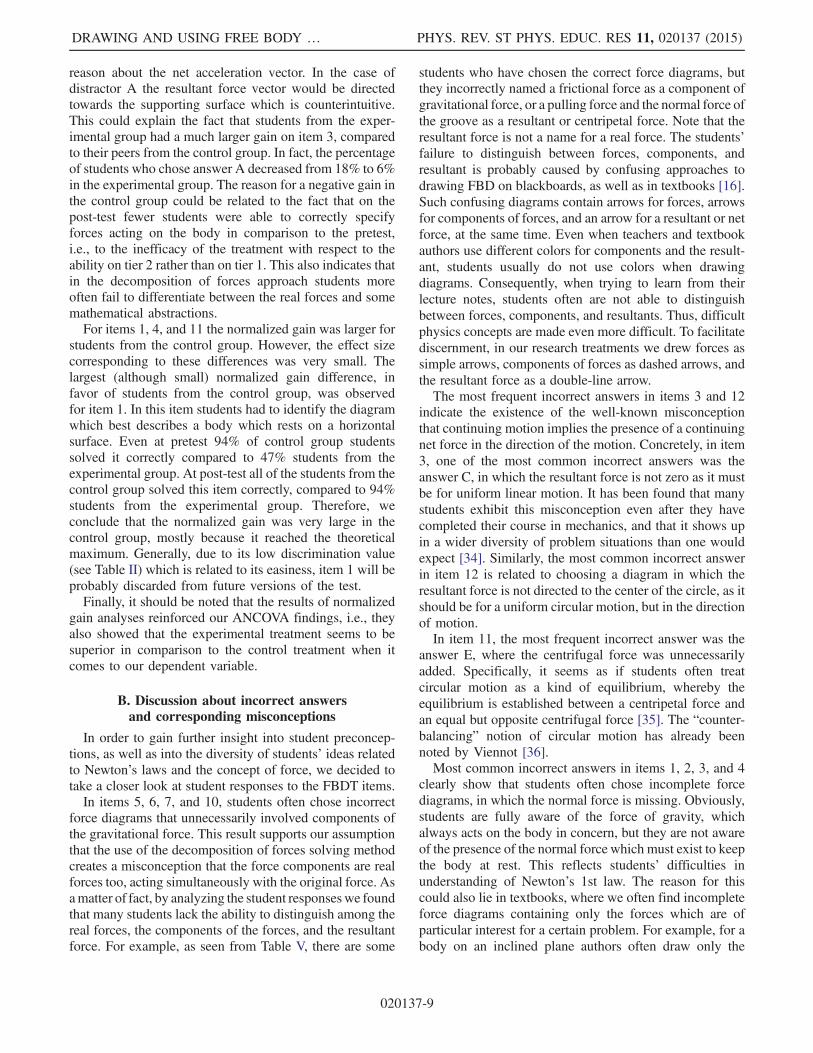
TABLE V. List of correct names of forces, tasks in which the corresponding forces appear in the correct diagrams, and examples of thecorresponding incorrect namings of forces on pretest and post-test.
Examples of incorrect force namings in the correctly chosen diagrams
Correct forcename
Tasks inwhich
the forceappears
Namings whichindicatedifficulty inunderstandingbetween-objectinteractions
Namings whichindicatedifficulty indistinguishingbetween forces,components, andresultants
Other namings
Gravitationalforce (~Fg)
1–12 Force on thesurface from thebody
Gravitational potential force;relative force
Normalforce (~FN)
1–9, 11 Reaction force ofgravity
Body resistance; tension in the cord;gravitational potential force; forcethat causes a motion; force in theopposite direction of gravity;gravitational force; frictional force;centripetal force; centrifugal force
Frictionalforce (~Ff)
2–7 Reaction force ofthe body
Component ofgravity
Pulling force; force in the oppositedirection of motion; force 2; normalforce; force of rest; force ofmotion; force of slope
8–9 Pulling forcefrom the leftman; reactionforce of thebody
Weight; resistance force to rope;tension in the cord; force F; forceof interaction; normal force
Pullingforce (~Fp)
3–4 Resultant; forcethat acceleratesthe body
Gravitational force; force in thedirection of acceleration or motion;inertia; friction; force of motion;surface; force F; velocity;resistance; force that causes achange in motion; force direction
Tensionforce (~FT )
8–9 Pulling force ofthe body
External force; force in the directionof motion; force of motion; reactionforce; potential force; force ofinteraction; friction; normal force;
10 Pulling force; resistance; surfaceresistance
Normal force ofthe groovea (~Fg)
11–12 Centripetal forceb Gravitational force; fractional force;pulling force; radial force
aThe contact force between the walls of the channel and the ball. Actually it is normal force but occurs tangentially to the plane ofmotion because of the shape of the groove.
bMany students failed to realize that centripetal force is the resultant force that is directed toward the center of the curvature of thepath—they often think that individual forces acting toward the center of the curvature of the path are centripetal forces on their own,which is true only in certain circumstances.
DRAWING AND USING FREE BODY … PHYS. REV. ST PHYS. EDUC. RES 11, 020137 (2015)
020137-7
hypothesis and accept the alternative hypothesis accordingto which students who get the superposition of forcestreatment outperform the students who get the decompo-sition of forces treatment when it comes to developingstudents’ understanding of Newton’s laws including theirability to specify real forces.These results seem to support the ideas by Kondratyev
and Sperry [5], who advocated for the direct use of vectorsin mechanics problems and criticized the practice ofresolving forces into the components prior to applyingNewton’s laws. Specifically, while analyzing the disadvan-tages of the decomposition of vectors approach to solvingmechanics problems, they pointed out that in extreme casesthe student may think that nature does not exist withoutcoordinate axes. By overemphasizing the decomposition offorces procedure, we run the risk that many of our studentsdo not differentiate between real forces and some math-ematical, auxiliary entities (e.g., force components).Exactly this has been shown in our study, where studentsfrom the experimental group outperformed their peers fromthe control group with respect to the ability of identifyingreal forces acting on physical objects. Savinainen et al. [33]found that “the likelihood of the correct identification offorces in an FBD is relatively high if the student hasidentified interactions correctly in an interaction diagram.”
In our opinion, our approach as well as the approach bySavinainen et al. [33] strives at focusing attention onphysical aspects of a given situation, instead of puttingaccent on mathematical procedures.For 9 out of 12 test items, the normalized gains were
larger in the experimental group compared to the controlgroup (see Fig. 1). Largest normalized gain differences infavor of the experimental group have been observed foritems 10 and 3. In item 10 (see Appendix A), students hadto identify forces acting on a pendulum, which are only thegravitation force and the tension in the rope. None of thestudents from the experimental group solved this itemcorrectly in the pretest context. They mostly chose thedistractor D (65%) which is an indicator for the miscon-ception according to which a gravitational force as well asits components act on the pendulum, at the same time. Afterthe treatment, the percentage of correct answers in theexperimental group increased from 0% to 71% whichsuggests that our experimental treatment helped thestudents to overcome the described misconception.In the control group there was no pretest–post-test gain
on item 10. The distractor which has been most frequentlychosen in the control group was distractor D (29%) on thepretest and on the post-test distractor C (29%), wheretension of the rope, gravity force, and their resultant areshown. Students who chose that distractor seem to believethat there are three forces acting on the pendulum bob—thetwo real forces and their resultant. In other words, it seemsas if the decomposition approach to solving problems maybe not the most effective way for overcoming the mis-conception related to “thinking that individual forces andtheir resultant act on a body at the same time.” One factorwhich could have additionally motivated the students topick distractor C is related to the widely known miscon-ception that there always has to be one force acting in thedirection of motion of the object.In item 3 (see Appendix A) students had to choose the
FBD which best describes an object that moves withconstant velocity across a horizontal surface. The resultsof the pretest showed that in the experimental groupstudents mostly chose distractors A and C. In the controlgroup, students mostly chose distractors A, C, and D. All ofthese distractors imply that there is nonzero net force actingon the body. These results clearly show that students do notadequately associate the force diagram with the applicationof Newton’s 1st law. The choice of the distractor C is mostprobably related to the famous “motion requires force”misconception [34]. After the treatment, the percentage ofstudents who exhibited the described misconception in theexperimental group decreased from 18% to 0%.Typically, in the superposition approach students
develop the habit to explicitly apply Newton’s laws intheir vectorial form, i.e., they are expected to consistentlyapproach the procedure of finding the resultant force vectorby adding the force vectors which makes it possible to
FIG. 2. Percentage of occasions in which the first tiers of thecorresponding items have been correctly solved, but the force hasbeen named incorrectly or not named at all: (a) experimentalgroup, (b) control group.
IVICA AVIANI, NATAŠA ERCEG, and VANES MEŠIĆ PHYS. REV. ST PHYS. EDUC. RES 11, 020137 (2015)
020137-8
reason about the net acceleration vector. In the case ofdistractor A the resultant force vector would be directedtowards the supporting surface which is counterintuitive.This could explain the fact that students from the exper-imental group had a much larger gain on item 3, comparedto their peers from the control group. In fact, the percentageof students who chose answer A decreased from 18% to 6%in the experimental group. The reason for a negative gain inthe control group could be related to the fact that on thepost-test fewer students were able to correctly specifyforces acting on the body in comparison to the pretest,i.e., to the inefficacy of the treatment with respect to theability on tier 2 rather than on tier 1. This also indicates thatin the decomposition of forces approach students moreoften fail to differentiate between the real forces and somemathematical abstractions.For items 1, 4, and 11 the normalized gain was larger for
students from the control group. However, the effect sizecorresponding to these differences was very small. Thelargest (although small) normalized gain difference, infavor of students from the control group, was observedfor item 1. In this item students had to identify the diagramwhich best describes a body which rests on a horizontalsurface. Even at pretest 94% of control group studentssolved it correctly compared to 47% students from theexperimental group. At post-test all of the students from thecontrol group solved this item correctly, compared to 94%students from the experimental group. Therefore, weconclude that the normalized gain was very large in thecontrol group, mostly because it reached the theoreticalmaximum. Generally, due to its low discrimination value(see Table II) which is related to its easiness, item 1 will beprobably discarded from future versions of the test.Finally, it should be noted that the results of normalized
gain analyses reinforced our ANCOVA findings, i.e., theyalso showed that the experimental treatment seems to besuperior in comparison to the control treatment when itcomes to our dependent variable.
B. Discussion about incorrect answersand corresponding misconceptions
In order to gain further insight into student preconcep-tions, as well as into the diversity of students’ ideas relatedto Newton’s laws and the concept of force, we decided totake a closer look at student responses to the FBDT items.In items 5, 6, 7, and 10, students often chose incorrect
force diagrams that unnecessarily involved components ofthe gravitational force. This result supports our assumptionthat the use of the decomposition of forces solving methodcreates a misconception that the force components are realforces too, acting simultaneously with the original force. Asamatter of fact, by analyzing the student responseswe foundthat many students lack the ability to distinguish among thereal forces, the components of the forces, and the resultantforce. For example, as seen from Table V, there are some
students who have chosen the correct force diagrams, butthey incorrectly named a frictional force as a component ofgravitational force, or a pulling force and the normal force ofthe groove as a resultant or centripetal force. Note that theresultant force is not a name for a real force. The students’failure to distinguish between forces, components, andresultant is probably caused by confusing approaches todrawing FBD on blackboards, as well as in textbooks [16].Such confusing diagrams contain arrows for forces, arrowsfor components of forces, and an arrow for a resultant or netforce, at the same time. Even when teachers and textbookauthors use different colors for components and the result-ant, students usually do not use colors when drawingdiagrams. Consequently, when trying to learn from theirlecture notes, students often are not able to distinguishbetween forces, components, and resultants. Thus, difficultphysics concepts are made even more difficult. To facilitatediscernment, in our research treatments we drew forces assimple arrows, components of forces as dashed arrows, andthe resultant force as a double-line arrow.The most frequent incorrect answers in items 3 and 12
indicate the existence of the well-known misconceptionthat continuing motion implies the presence of a continuingnet force in the direction of the motion. Concretely, in item3, one of the most common incorrect answers was theanswer C, in which the resultant force is not zero as it mustbe for uniform linear motion. It has been found that manystudents exhibit this misconception even after they havecompleted their course in mechanics, and that it shows upin a wider diversity of problem situations than one wouldexpect [34]. Similarly, the most common incorrect answerin item 12 is related to choosing a diagram in which theresultant force is not directed to the center of the circle, as itshould be for a uniform circular motion, but in the directionof motion.In item 11, the most frequent incorrect answer was the
answer E, where the centrifugal force was unnecessarilyadded. Specifically, it seems as if students often treatcircular motion as a kind of equilibrium, whereby theequilibrium is established between a centripetal force andan equal but opposite centrifugal force [35]. The “counter-balancing” notion of circular motion has already beennoted by Viennot [36].Most common incorrect answers in items 1, 2, 3, and 4
clearly show that students often chose incomplete forcediagrams, in which the normal force is missing. Obviously,students are fully aware of the force of gravity, whichalways acts on the body in concern, but they are not awareof the presence of the normal force which must exist to keepthe body at rest. This reflects students’ difficulties inunderstanding of Newton’s 1st law. The reason for thiscould also lie in textbooks, where we often find incompleteforce diagrams containing only the forces which are ofparticular interest for a certain problem. For example, for abody on an inclined plane authors often draw only the
DRAWING AND USING FREE BODY … PHYS. REV. ST PHYS. EDUC. RES 11, 020137 (2015)
020137-9
gravitational force and its components acting on the body.In our opinion such an approach may contribute to thedevelopment of the misconception that gravitational forceand its components act on a body independently at the sametime. By analyzing students’ incorrect namings of forces inthe correctly chosen force diagrams for each physicalsituation (Table V), we also came up with some conclusionsregarding student understanding about between-objectinteractions, as well as about their ability to identifyaction-reaction force pairs, which can be related to studentunderstanding of Newton’s 3rd law. For example, somestudents have mixed up the gravitational force exerted onthe body by the Earth with the contact force by which thebody acts upon the supporting surface due to gravity. As amatter of fact, for a body on a horizontal surface studentsoften chose the correct diagram, which showed two forcesacting on the same body along the vertical axis. However,some students designated the two forces as a “force on thesurface from the body” and “normal force” of the surface.We know that these two contact forces represent an action-reaction pair for the described situation. Consequently, itseems that these results indicate that some of our studentsexhibit the misconception according to which forces ofaction and reaction act on the same body. Similarly, thefrictional force exerted on a man (in items 8 and 9) by thesupporting surface is considered to be his pulling force.Regarding the mentioned names of forces, the graph in
Fig 2 shows the improvement of students’ post-test resultsin comparison to their pretest results, except for the pullingforce. However, the percentage of incorrect namings is stillrelatively high, especially for those forces that are rarelymentioned in class. Trying to eliminate these difficulties,Turner [37] and Savainen et al. [33] suggest applyingsystem schemas or interaction diagrams in physics classes.These visual representations are considered helpful insituations where student misconceptions frequently leadto specifying incorrect numbers of forces, misidentificationof the agents of the forces, or an incorrect application ofNewton’s 3rd law.
VI. SUMMARY AND CONCLUSION
Vector calculus, in most physics courses, is carried outby the traditional algebraic methods, i.e., by resolving theforces into the components and then summing up thecomponents that have the same line of action. This methodhas some advantages, particularly in the treatment of a largenumber of vectors and complicated geometry. After resolv-ing the forces into the components only a simple algebraicoperation of adding numbers is needed for summing up thecomponents with the same line of action and obtaining theresultant. In this way a geometrical problem is transformedto an algebraic problem, which facilitates solving even forthose students who are less talented in geometry. However,in this procedure the number of the vectors appearing in theforce diagram is typically very high.
Although decomposing forces facilitates calculation, theintroduction of additional vectors in the diagram makes itdifficult for the students to grasp the physical aspects whichare at the very core of the corresponding problem. Studentsoften develop a misconception that components are also realforces that can act on objects simultaneously with real forces(resultant interactions between two bodies). In addition, theprocedure of decomposing force vectors can result instudents’ conceptual confusionwhen it comes to applicationof Newton’s laws that commonly state that the motion of thebody is determined by the vector sum of the forces acting onthe body. The question arises: Is the approach to drawingand using FBDs, which avoids specifying force compo-nents, more effective than the traditional approach (in whichthe forces are resolved into the components) when it comesto developing student understanding of Newton’s laws,including their ability to identify real forces?For purposes of answering this question we developed a
multiple choice two-tier questionnaire consisting of 12items that is intended to measure student understanding ofNewton’s laws, including the ability to correctly specifyreal forces. This questionnaire proved to be a valid andreliable instrument.In order to compare the efficacy of the two problem
solving approaches we conducted a quasiexperimentalstudy. Our test was administered to the two groups offirst-year physics students at University of Rijeka (exper-imental group, ne ¼ 27) and University of Split (controlgroup, nc ¼ 25), after the concept of force had beencovered in class. The treatments consisted of solving thesame problems in both groups for a period of two classhours, whereby a similar level of guidance has been used inboth groups. The only difference between the control andexperimental treatment was that in the experimental groupthe teacher’s scaffolding of drawing FBDs and students’problem solving did not include decomposing, but onlysuperposition of forces. We measured student understand-ing before and after the treatments.The normalized average gain in the experimental group
was 0.46, compared with 0.23 in the control group. Theresults of the ANCOVA showed a statistically significantdifference in favor of the experimental group, whereby theeffect size proved to be moderate to large. This result isobviously in line with the argument of Kondratyev andSperry [5] who suggest direct use of vectors in mechanicsproblems instead of resolving forces into the components.It is important to note that the results of our study
indicate that the use of the decomposition of forces methodto drawing and using FBDs may result with the miscon-ception that a force and its components can act on a body atthe same time. Besides that, our results additionallyreinforce the findings from earlier studies regarding theexistence of the robust preconception that motion of a bodyimplies the existence of force acting on that body along thedirection of its motion [34].
IVICA AVIANI, NATAŠA ERCEG, and VANES MEŠIĆ PHYS. REV. ST PHYS. EDUC. RES 11, 020137 (2015)
020137-10
For some FBDs, students named forces which in realityrepresent action-reaction pairs for the corresponding physi-cal situations, showing thereby difficulties in understandingNewton’s 3rd law.We believe that the superposition of forces approach has
the following advantages: (a) using only one rule forsumming vectors, (b) drawing only real forces on FBD,
(c) clearly presentingP
i~Fi ¼ ~0 or
Pi~Fi ¼ m~a for direct
application of Newton’s laws, (d) developing a geometricway of thinking, and (e) preventing the development ofcertain misconceptions.The main limitation of this study is related to the fact that
the teacher who gave the treatment was not the same for thecontrol and experimental group. However, in our opinionthis circumstance was not a serious threat to the internalvalidity of our study, because we created very detailedlesson plans for the two treatment groups, in order to makethe lessons as little as possible dependent on a (individual)teachers’ spontaneous actions. The fact that the instructor ofthe control group had more university teaching experienceand very rich references in popularization of physics furtherdecreases the threat to internal validity.An additional limitation of the study is related to the
relatively small number of students in the treatment groups.However, taking into account the fact that our data did notviolate the assumptions of ANCOVA (homogeneity ofvariance, homogeneity of regression slopes, normalityassumption), we can consider the results of our statistical
testing as reliable. As a matter of fact, the number ofstudents per group is bigger than 15, which is considered tobe a minimum sample size required for experimentalresearch [38].In our future work, we are going to run some think-aloud
studies in order to further improve our understandings ofthe huge differences between groups on certain FBDTitems. This would allow us to get additional insight into thecognitive effects of the described approaches and to planfurther theoretical and practical improvements of theproblem solving approach described in this paper.Besides implementing think-aloud studies, it would bealso be interesting to investigate how the effectiveness ofthe described teaching treatments depends on the partic-ipants’ level of representational fluency.
ACKNOWLEDGMENTS
The authors would like to thank all the participants whotook part in this study. Special thanks to Mladen Buljubašićfor organizing the primary school physics teachers surveyand to Lucija Krce for her help in implementing the FBDT.I. A. was supported by the Ministry of Science of Republicof Croatia, under the bilateral Croatia-USA agreementon the scientific and technological cooperation, ProjectNo. 1/2014. N. E. acknowledges the financial support of theUniversity of Rijeka for scientific research under theProject No. 13.12.1.4.06 “Physical properties of circum-stellar matter in symbiotic stars.”
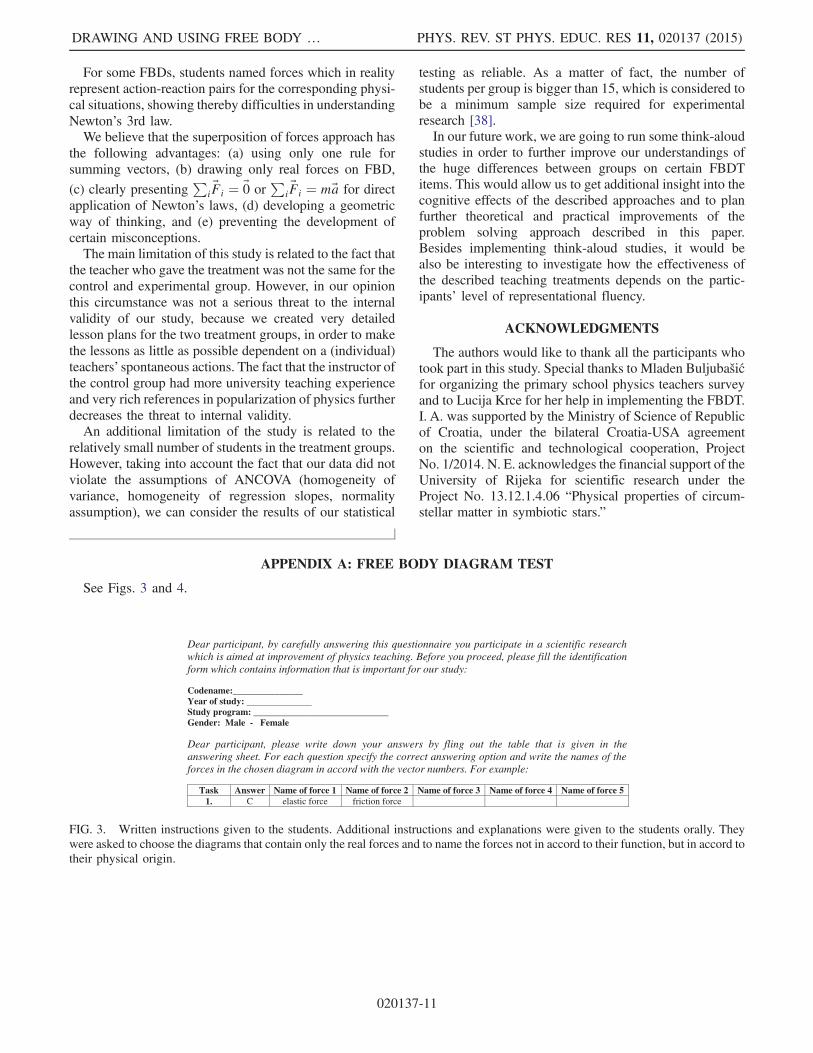
APPENDIX A: FREE BODY DIAGRAM TEST
See Figs. 3 and 4.
Dear participant, by carefully answering this questionnaire you participate in a scientific research which is aimed at improvement of physics teaching. Before you proceed, please fill the identification form which contains information that is important for our study: Codename:_______________ Year of study: ______________ Study program: _____________________________ Gender: Male - Female
Dear participant, please write down your answers by fling out the table that is given in the answering sheet. For each question specify the correct answering option and write the names of the forces in the chosen diagram in accord with the vector numbers. For example:
Task Answer Name of force 1 Name of force 2 Name of force 3 Name of force 4 Name of force 5 1. C elastic force friction force
FIG. 3. Written instructions given to the students. Additional instructions and explanations were given to the students orally. Theywere asked to choose the diagrams that contain only the real forces and to name the forces not in accord to their function, but in accord totheir physical origin.
DRAWING AND USING FREE BODY … PHYS. REV. ST PHYS. EDUC. RES 11, 020137 (2015)
020137-11
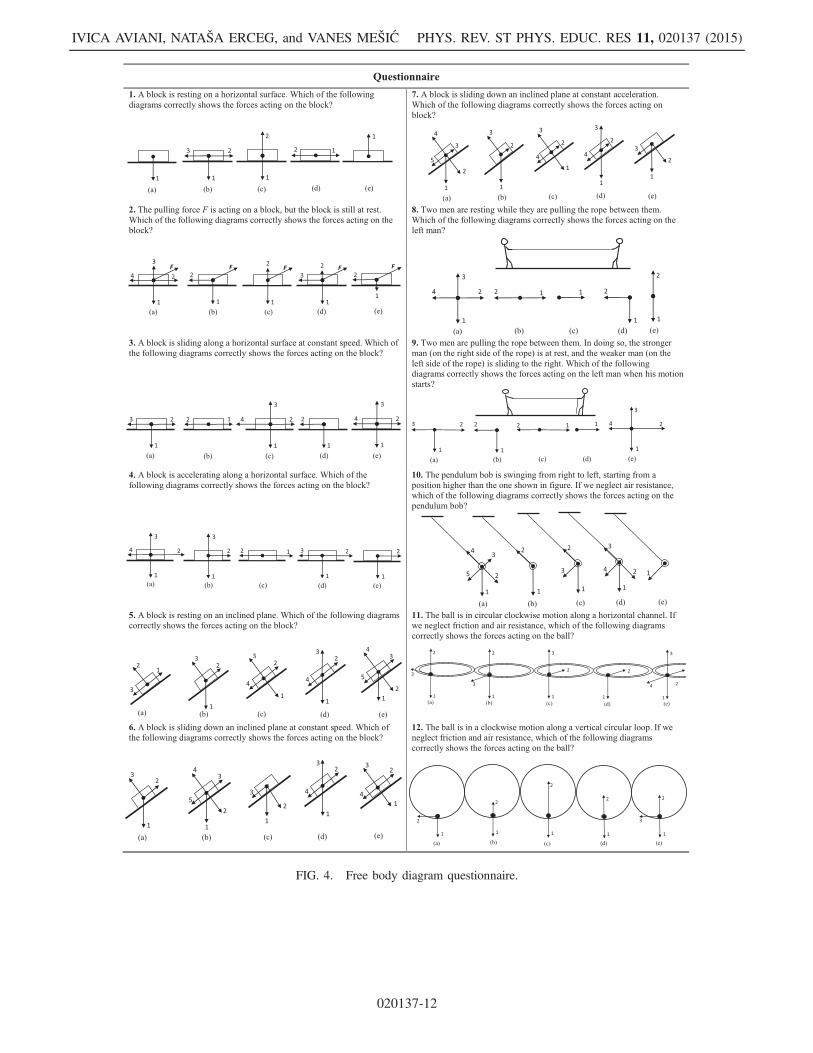
FIG. 4. Free body diagram questionnaire.
IVICA AVIANI, NATAŠA ERCEG, and VANES MEŠIĆ PHYS. REV. ST PHYS. EDUC. RES 11, 020137 (2015)
020137-12
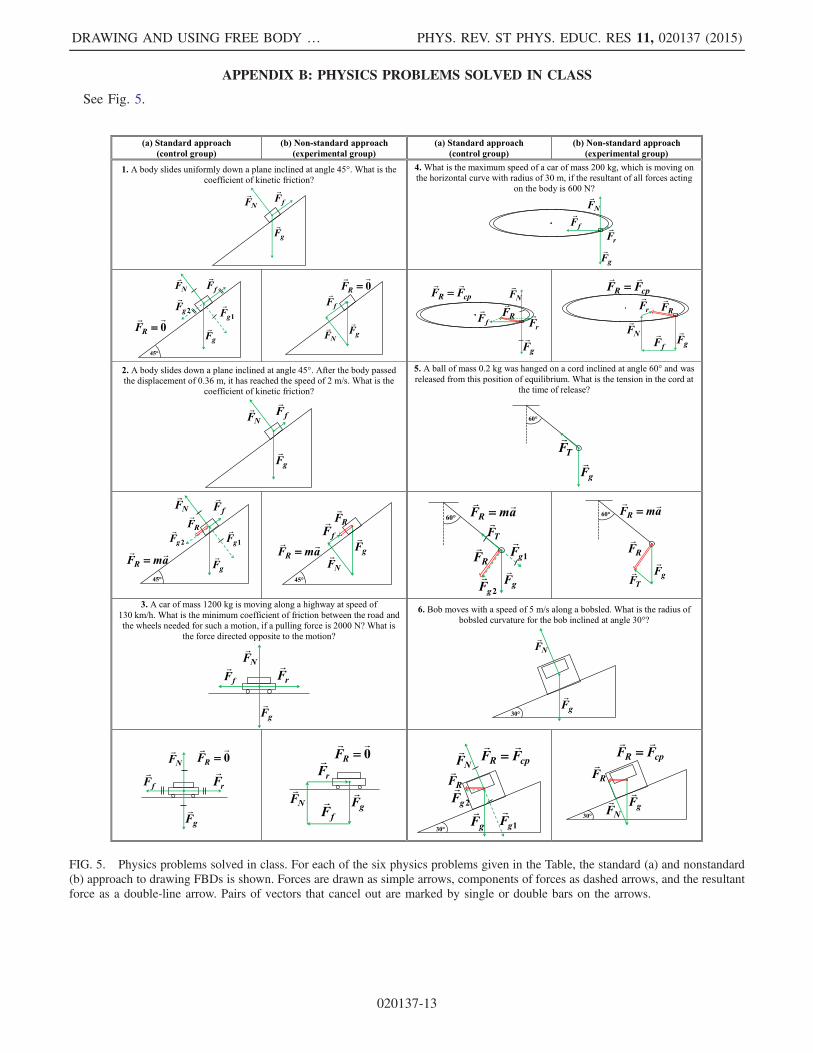
APPENDIX B: PHYSICS PROBLEMS SOLVED IN CLASS
See Fig. 5.
FIG. 5. Physics problems solved in class. For each of the six physics problems given in the Table, the standard (a) and nonstandard(b) approach to drawing FBDs is shown. Forces are drawn as simple arrows, components of forces as dashed arrows, and the resultantforce as a double-line arrow. Pairs of vectors that cancel out are marked by single or double bars on the arrows.
DRAWING AND USING FREE BODY … PHYS. REV. ST PHYS. EDUC. RES 11, 020137 (2015)
020137-13
[1] S. Flores-García, L. L. Alfaro-Avena, J. E. Chávez-Pierce,J. Luna-González, and M. D. González-Quezada, Students’difficulties with tension in massless strings, Am. J. Phys.78, 1412 (2010).
[2] R. D. Knight, The vector knowledge of beginning physicsstudents, Phys. Teach. 33, 74 (1995).
[3] S. E. Kanim, Ph.D. dissertation, University of Washington(1999).
[4] N.-L. Nguyen and D. E. Meltzer, Initial understanding ofvector concepts among students in introductory physicscourses, Am. J. Phys. 71, 630 (2003).
[5] A. S. Kondratyev and W. Sperry, Direct use of vectors inmechanics problems, Phys. Teach. 32, 416 (1994).
[6] D. C. Giancoli, Physics for Scientists and Engineers withModern Physics, 4th ed. (Pearson Education Inc., SAD,2009).
[7] D. Rosengrant, A. van Heuvelen, and E. Etkina, Dostudents use and understand free-body diagrams? Phys.Rev. ST Phys. Educ. Res. 5, 010108 (2009).
[8] P. Wendel, Adding value to force diagrams: Representingrelative force magnitudes, Phys. Teach. 49, 308 (2011).
[9] K. Fisher, Exercises in drawing and utilizing free-bodydiagrams, Phys. Teach. 37, 434 (1999).
[10] S. Flores, S. E. Kanim, and C. H. Kautz, Student use ofvectors in introductory mechanics, Am. J. Phys. 72, 460(2004).
[11] F. Reif and S. Allen, Cognition for interpreting scientificconcepts: A study of acceleration, Cognit. Instr. 9, 1(1992).
[12] M. Mattson, Getting students to provide direction whendrawing free-body diagrams, Phys. Teach. 42, 398 (2004).
[13] D. P. Maloney, Forces as interactions, Phys. Teach. 28, 386(1990).
[14] A. Puri, The art of free-body diagrams, Phys. Educ. 31, 155(1996).
[15] W. Sperry, Placing the forces on free-body diagrams, Phys.Teach. 32, 353 (1994).
[16] E. van den Berg and C. van Huis, Drawing forces, Phys.Teach. 36, 222 (1998).
[17] P. Barniol and G. Zavala, Vector addition: Effect of thecontext and position of the vectors, in Proceedings of the2010 Physics Education Research Conference, Vol. 1289(Portland, Oregon, 2010), pp. 73–76.
[18] J. E. Court, Free-body diagrams revisited—i, Phys. Teach.37, 427 (1999).
[19] M. Hill, M. D. Sharma, J. O’Byrne, and J. Airey, Devel-oping and evaluating a survey for representational fluencyin science, Int. J. Innovation Sci. Math. Educ. 22, 22(2014).
[20] J. J. Mintzes, J. H. Wandersee, and J. D. Novak, Researchon alternative conceptions in science, in Handbook of
Research on Science Teaching and Learning, edited byD. L. Gabel (MacMillan, New York, 1994), pp. 177–210.
[21] C. H. Lawshe, A quantitative approach to content validity,Personnel psychology 28, 563 (1975).
[22] S. B. McKagan, K. K. Perkins, and C. E. Wieman, Designand validation of the quantum mechanics conceptualsurvey, Phys. Rev. ST Phys. Educ. Res. 6, 020121(2010).
[23] D. C. Howell, Statistical Methods for Psychology(Wadsworth, Belmont, CA, 2013).
[24] I. Aviani, Kako možemo pokazati da se sile zbrajaju kaovektori, Matematičko-fizički list LXIII, 189 (2013).
[25] R. B. Johnson and L. B. Christensen, Educational Re-search: Quantitative, Qualitative, and Mixed Approaches(SAGE Publications, Inc., Thousand Oaks, CA, 2012).
[26] To add vectors a and b using the parallelogram method,place the tail of b so that it meets the tail of a. Take thesetwo vectors to be the first two adjacent sides of aparallelogram, and draw in the remaining two sides. Thevector sum, aþ b, extends from the tails of a and b acrossthe diagonal to the opposite corner of the parallelogram.
[27] P. Kline, A Handbook of Test Construction: Introduction toPsychometric Design (Methuen, New York, NY, 1986).
[28] G. F. Kuder and M.W. Richardson, The theory of theestimation of test reliability, Psychometrika 2, 151 (1937).
[29] R. L. Doran, Basic Measurement and Evaluation ofScience Instruction (National Science Teachers Associa-tion, Washington, DC, 1980).
[30] Q. McNemar, Psychological Statistics (John Wiley andSons, Inc., New York, 1966).
[31] R. L. Rosnow, R. Rosenthal, and D. B. Rubin, Contrastsand correlations in effect-size estimation, Psychol. Sci. 11,446 (2000).
[32] R. R. Hake, Interactive-engagement versus traditionalmethods: A six- thousand-student survey of mechanicstest data for introductory physics courses, Am. J. Phys. 66,64 (1998).
[33] A. Savinainen, A. Mkynen, P. Nieminen, and J. Viiri, Doesusing a visual-representation tool foster students ability toidentify forces and construct free-body diagrams? Phys.Rev. ST Phys. Educ. Res. 9, 010104 (2013).
[34] J. Clement, Students preconceptions in introductorymechanics, Am. J. Phys. 50, 66 (1982).
[35] P. Gardner, Circular motion: Some post-instructionalalternative frameworks, Res. Sci. Educ. 14, 136 (1984).
[36] L. Viennot, Spontaneous reasoning in elementarydynamics, Eur. J. Sci. Educ. 1, 205 (1979).
[37] L. Turner, System schemas, Phys. Teach. 41, 404 (2003).[38] M. D. Gall, J. P. Gall, and W. R. Borg, Educational
Research: An Introduction 7th ed. (Pearson Education,Boston, 2003).
IVICA AVIANI, NATAŠA ERCEG, and VANES MEŠIĆ PHYS. REV. ST PHYS. EDUC. RES 11, 020137 (2015)
020137-14