Embed Size (px)
Citation preview

D
rain
age
Serv
ices
Bu
sin
ess
Pla
n
20
14
-20
16

2 Drainage Services 2014 – 2016 Business Plan
TABLE OF CONTENTS
Introduction 3
Organizational Structure 3
Overview of Utilities 4
Strategic Foundation
Vision 5
Mission 5
Values 6
Strategic Directions 7
Key Initiatives 8
Emerging Issues 11
Financial Impacts 12
Conclusion 17
Further Information 19

3 Drainage Services 2014 – 2016 Business Plan
INTRODUCTION
The Drainage Services 2014 to 2016 Business Plan aligns with the City of Edmonton directions and priorities as outlined in The Way Ahead, and with the Financial Services and Utilities Department priorities. This Business Plan will guide the operations of Drainage Services for the three years beginning in 2014. The Business Plan is based on an update of the previous business plan. The key initiatives and strategic directions outlined in the 2013 to 2015 Business Plan have been updated to include an expansion of the Flood Prevention Program. Other changes from the 2013 to 2015 Business Plan include the refining of a number of performance measures as a result of experience over the past year, the inclusion of emerging issues and an update on the financial impacts. Based on these considerations, the leadership team of Drainage Services has developed the following 2014 to 2016 Business Plan.
ORGANIZATIONAL STRUCTURE
Branch Manager
Drainage Operations
Development Services
Drainage Planning
Business Planning
Drainage Design and
Construction
4 Drainage Services 2014 – 2016 Business Plan
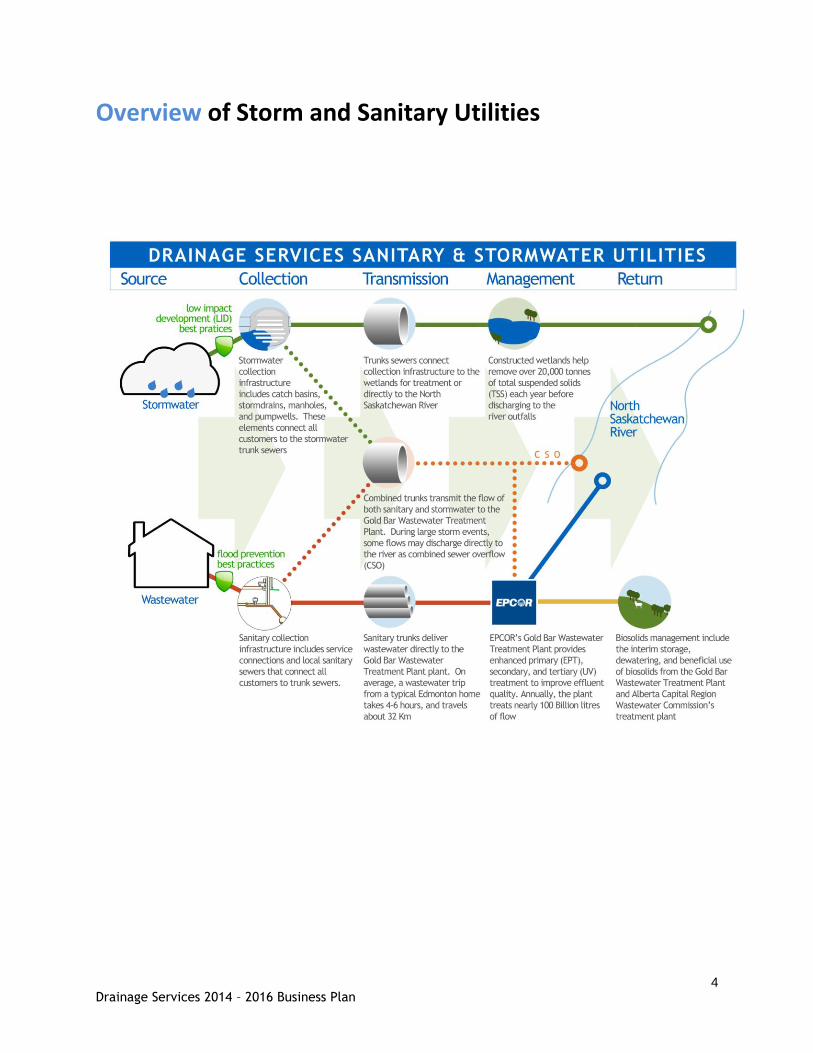
Overview of Storm and Sanitary Utilities
5 Drainage Services 2014 – 2016 Business Plan
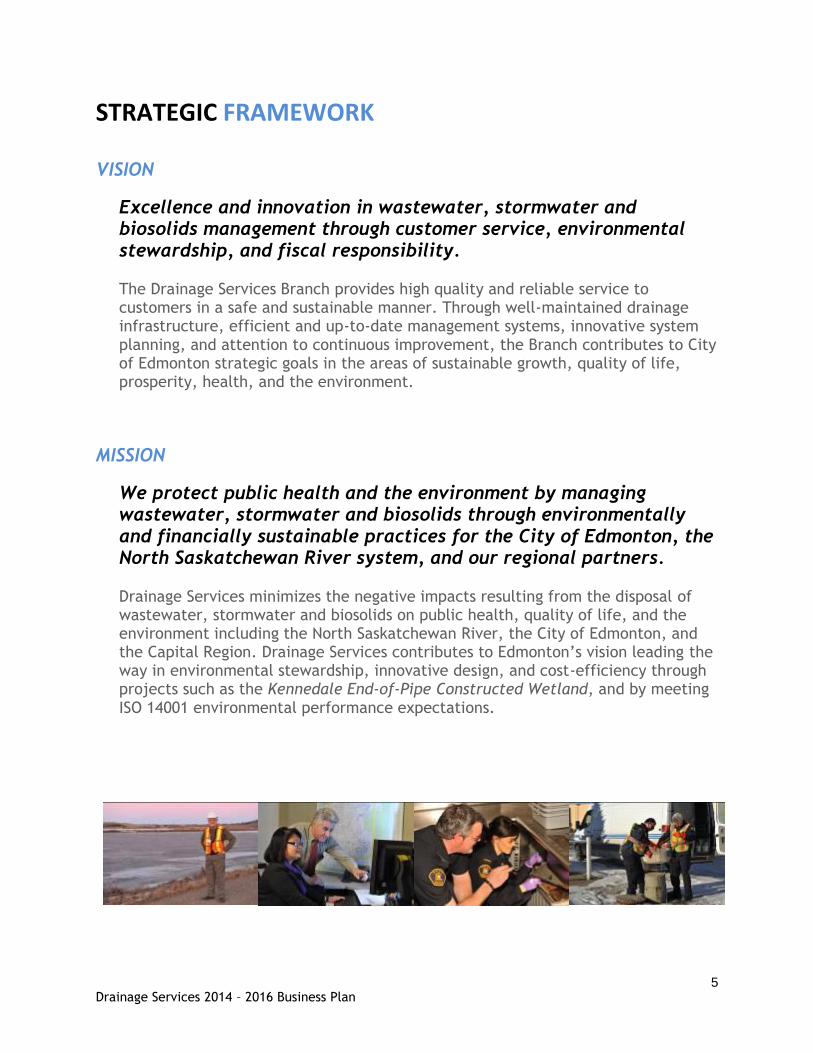
STRATEGIC FRAMEWORK
VISION
Excellence and innovation in wastewater, stormwater and biosolids management through customer service, environmental stewardship, and fiscal responsibility.
The Drainage Services Branch provides high quality and reliable service to customers in a safe and sustainable manner. Through well-maintained drainage infrastructure, efficient and up-to-date management systems, innovative system planning, and attention to continuous improvement, the Branch contributes to City of Edmonton strategic goals in the areas of sustainable growth, quality of life, prosperity, health, and the environment.
MISSION
We protect public health and the environment by managing wastewater, stormwater and biosolids through environmentally and financially sustainable practices for the City of Edmonton, the North Saskatchewan River system, and our regional partners.
Drainage Services minimizes the negative impacts resulting from the disposal of wastewater, stormwater and biosolids on public health, quality of life, and the environment including the North Saskatchewan River, the City of Edmonton, and the Capital Region. Drainage Services contributes to Edmonton’s vision leading the way in environmental stewardship, innovative design, and cost-efficiency through projects such as the Kennedale End-of-Pipe Constructed Wetland, and by meeting ISO 14001 environmental performance expectations.
6 Drainage Services 2014 – 2016 Business Plan
VALUES
The following values for Drainage Services reflect City of Edmonton goals and priorities, our professional values and the nature of our work. Environmental Stewardship & Public Health
Drainage Services continues to be a leader in environmental performance and public health and safety standards. We meet or exceed municipal, provincial and federal requirements for stewardship of the environment, public health, and public safety.
Sustainability
Drainage Services plays a key role in the long-term sustainability of our City. We adopt integrated sustainable practices that benefit citizens and the environment; we repair, replace and build new infrastructure to achieve sustainable urban development goals; and we enable affordable utility rates for the people of Edmonton over the long term.
Excellent Service
Drainage Services achieves excellence in customer service. We are innovative in finding ways to deliver services that are both efficient and effective. We stay current with emerging technology and best practices to provide valued service to customers, partners, and stakeholders.
Engaged and Inspired Employees
Drainage Services is proud of the expertise of its team. Our work environment is innovative, positive, team-oriented and safe. We perform our jobs with integrity and transparency.
Collaboration
Drainage Services recognizes the increasing cross-jurisdictional and cross-functional nature of environmental, asset management, and financial challenges; hence the need for collaborative processes to find solutions. We work collaboratively within the Branch and with others in the Department, the City, our regional partners, EPCOR, other orders of government, other municipalities and related organizations to achieve common goals, efficient use of resources, and innovative solutions to challenges.

7 Drainage Services 2014 – 2016 Business Plan
STRATEGIC DIRECTIONS The following six strategic directions are proposed for Drainage Services and the icons beside each direction indicate the link to the City’s 10-year goals.
The Branch ensures operational efficiencies through innovation and technology adoption to support effective and affordable service over the long term.
Through long-term planning, proactive renewal and engagement in new development, the Branch
provides sustainable infrastructure in support of Edmonton’s urban development.
Proper management of wastewater, stormwater and biosolids contributes to a healthy environment and public health and safety.
The Branch supports Edmonton as it grows into an integrated, holistic urban municipality defined by economic, social, environmental and cultural sustainability. The Branch supports economic growth by offering innovative, efficient and customer-focused drainage services.
Many of the City’s departments and branches share similar goals, such as customer service, public education and environmental stewardship. Drainage Services seeks to be a leader in collaborative approaches and in the pursuit of synergies with key partners both within and outside the City.
Opportunities for innovation and creativity are vast. Through the continuous exploration and adoption of new processes, technologies and best practices, Drainage Services will achieve target
results and positive change, within the framework of fiscal responsibility.
1. MAINTAIN EFFICIENT AND EFFECTIVE SERVICE
2. BUILD AND RENEW DRAINAGE INFRASTRUCTURE
3. IMPROVE ENVIRONMENTAL PROTECTION AND MAINTAIN PUBLIC HEALTH AND SAFETY
4. SUPPORT ECONOMIC GROWTH AND DEVELOPMENT
5. IMPROVE COORDINATION AND COLLABORATION
6. NURTURE INNOVATION AND CREATIVITY
Legend: The Ways
Green Grow Live Finance Prosper Move
8 Drainage Services 2014 – 2016 Business Plan
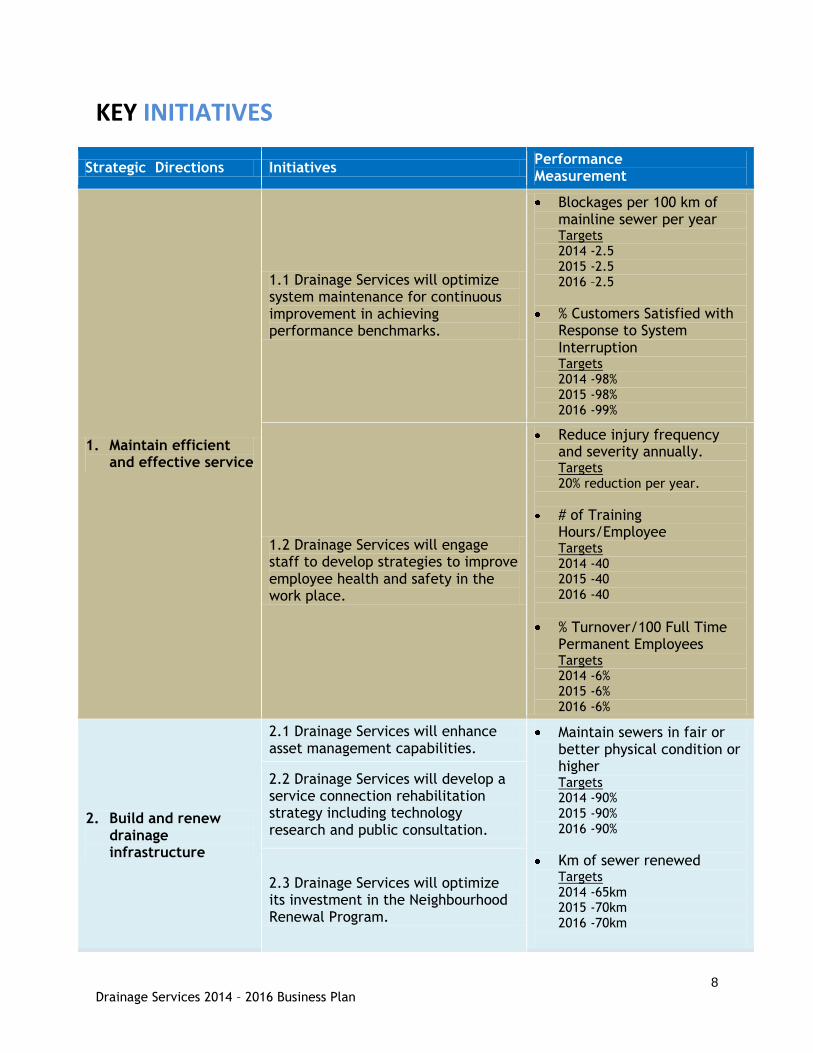
KEY INITIATIVES
Strategic Directions Initiatives Performance Measurement
1. Maintain efficient and effective service
1.1 Drainage Services will optimize system maintenance for continuous improvement in achieving performance benchmarks.
Blockages per 100 km of mainline sewer per year Targets 2014 -2.5 2015 -2.5 2016 –2.5
% Customers Satisfied with Response to System Interruption Targets 2014 -98% 2015 -98% 2016 -99%
1.2 Drainage Services will engage staff to develop strategies to improve employee health and safety in the work place.
Reduce injury frequency and severity annually. Targets 20% reduction per year.
# of Training Hours/Employee Targets 2014 -40 2015 -40 2016 -40
% Turnover/100 Full Time Permanent Employees Targets 2014 -6% 2015 -6% 2016 -6%
2. Build and renew drainage infrastructure
2.1 Drainage Services will enhance asset management capabilities.
Maintain sewers in fair or better physical condition or higher Targets 2014 -90% 2015 -90% 2016 -90%
Km of sewer renewed Targets 2014 -65km 2015 -70km 2016 -70km
2.2 Drainage Services will develop a service connection rehabilitation strategy including technology research and public consultation.
2.3 Drainage Services will optimize its investment in the Neighbourhood Renewal Program.

9 Drainage Services 2014 – 2016 Business Plan
Strategic Directions Initiatives Performance Measurement
3. Improve environmental protection and maintain public health and safety
3.1 Drainage Services will develop and implement a biosolids management strategy to sustainably manage volume of stored biosolids and minimize odour generation.
Increase % of generated biosolids disposal Targets 2014 -96% 2015 -100% 2016 -105%
Odour reduction measures under development
3.2 Drainage Services will promote Low Impact Development best practices.
# of new developments utilizing low impact development principles Targets 2014 -5 2015 -6 2016 -7
3.3 Drainage Services will continue to meet or exceed regulatory requirements.
# of Preliminary Industrial Inspections/Investigator Targets 2014 -360 2015 -360 2016 -360
Renew Approval to Operate by 2015
3.4 Expanded Flood Prevention program
# of neighbourhoods completed as part of the Flood Prevention Program (cumulative). Targets 2014 -19 2015 -20 2016 -23
4. Support economic growth and development
4.1 Drainage Services will develop financial strategies to ensure long-term sustainability of the Drainage Utilities.
Progress towards achieving annual financial targets set in the Drainage Utilities Fiscal Policy- refer to pages 15 and 17.
% Capital Programs Implemented (Non-Contributed) Targets 2014 -85% 2015 -87.5% 2016 -90%
Fiscal Policy reviewed and updated in 2014.
4.2 Drainage Services will develop servicing plans for downtown and industrial areas in coordination with key partners.

10 Drainage Services 2014 – 2016 Business Plan
Strategic Directions Initiatives Performance Measurement
5. Improve coordination and collaboration
5.1 Drainage Services will enter into service level agreements with Drainage Design and Construction, and Waste Management.
# of Dry Tonnes of Biosolids managed through Waste Management Services Targets 2014 -23,000 2015 -25,000 2016 -25,000
5.2 Drainage Services will increase and improve coordination, collaboration and communication internally and with external partners and stakeholders.
6. Nurture innovation and creativity
6.1 Drainage Services’ River for Life Strategy strives to improve the water quality of the North Saskatchewan River.
Edmonton Watershed Contaminant Reduction Index score (5 year rolling average). Targets 2014 -7.0 2015 -7.2 2016 -7.5
6.2 Drainage Services will engage staff in redefining the roles and expectations for how we innovate at all levels of our organization.
Improve employee engagement survey score Targets 2014 -68% 2015 -68% 2016 -70%
# of ISO improvement Initiatives Implemented Targets 2014 -20 2015 -20 2016 -20

11 Drainage Services 2014 – 2016 Business Plan
EMERGING ISSUES EXPANDED FLOOD PREVENTION PROGRAM In 2006, City Council implemented a plan to address flooding issues in at-risk neighbourhoods, approving $146 million for flood prevention. This funding allows projects to be completed with major problem areas being addressed first to ensure severe flood risk is minimized in 31 prioritized neighbourhoods by 2020. Neighbourhood sewer and stormwater system improvements are being worked on simultaneously to hasten the work.
In July 2012 significant rainfall in Edmonton resulted in flooding in Mill Woods and southwest Edmonton communities. In addition to street flooding, over 700 basements flooded. A number of preliminary engineering solutions have been identified to reduce the risk of future flooding in these areas including upgrading existing sewers and stormwater management ponds, building new storage sewers, sealing a number of manholes in trapped low areas, improving overland drainage routes and constructing new stormwater management dry ponds where possible.
Expansion of the Flood Prevention Program is needed to ensure that implementation of the possible solutions is expedited. This program will comprise short-term and long-term plans with capital budget impacts. In the short-term, a limited number of small construction projects are being considered for the impacted communities. Long-term construction plans will impact the 2015 to 2018 Capital Budget. The rate impact of the additional flood prevention works has not yet been incorporated into the business plan.
TRUNK SEWER REHABILITATION As sewers age, it is important to monitor them, replacing and repairing them where necessary. In 2003 to 2005, a section of the storm sewer trunk along Groat Road had deteriorated and needed rehabilitation. Since 2005, further sections of Groat Road trunk sewer have deteriorated and need to be rehabilitated to avoid future sink holes or collapse. The major trunk storm sewer along Groat Road from approximately 118 Avenue to 107 Avenue, and along 118 Avenue from 129 Street to 142 Street requires repair for a total length of 3.9km. Rehabilitation will take two construction seasons. Planning and design needs to be initiated in 2014.

12 Drainage Services 2014 – 2016 Business Plan
FINANCIAL IMPACTS
The financial impact of the Business Plan is presented in the following tables and financial indicators as defined through the approved Drainage Utility Fiscal Policy (C304C). The supporting necessary rate increases reflect the services and processes needed to support the Utility’s mission, values and strategic initiatives.
SANITARY DRAINAGE UTILITY
Increase due to:
Budget Forecast
2013 2014 2015 2016
Return on Rate Base $ 0.21 $ 0.67 $ 0.39 $ 0.40 Biosolids 0.26 0.25 0.94 0.15 Depreciation and Interest 0.19 0.31 0.35 0.43 Local Access Fees 0.07 0.12 0.15 0.10 Operations and Maintenance 0.27 0.33 0.15 0.22
$ 1.00 $ 1.68 $ 1.98 $ 1.30
Return on Rate Base Return on Rate Base is the amount that is deemed to be a fair and reasonable return, on the investments made in capital assets, to provide for future reinvestment in the Utility. The minimum return was set at 4.0% and the maximum return to not exceed 10.0% as per the Utility Fiscal Policy. In 2012, the actual return was 4.9% (compared to a budgeted return of 3.5%) while the budgeted return for 2013 is 3.5%. The increase in 2012 was a one-time occurrence related to lower than anticipated expenditures for labour (due to the timing of hiring’s) and depreciation & interest (due to lower than anticipated capital spending and interest rates). This has already been adjusted in the current 2013 Budget. Council’s direction during the 2013 Budget Process was that the Return on Rate Base be raised to 4.0% in 2014 to achieve the minimum target and maintain this level on a go forward basis. This direction has been reflected in the above table. Biosolids The two primary methods of biosolids disposal are the Nutrigold Program and the Compost Facility (operated by Waste Management Services). As previously identified in the 2011 Cost of Service Study prepared by Grant Thornton, a subsidy between the Waste Utility and Sanitary Utility exists as a result of a long-standing agreement between Drainage Services and the previous owner of the composter. This subsidy is being phased out over the 2012-2014 period. As presented at the May 15, 2012 Utility Committee meeting, the Biosolids Management Strategy is a long-term plan to manage the beneficial use of biosolids in a cost effective and

13 Drainage Services 2014 – 2016 Business Plan
environmentally responsible manner. This Business Plan has been prepared based on a scenario in which disposal and the reduction of inventory levels is maximized. The benefits to residents’ quality of life as well as environmental issues are an important consideration for accelerating biosolids disposal. As such, Drainage Services is targeting disposal rates related to generation of 96% in 2014, 100% in 2015, and 105% in 2016. The 2016 forecast is to maximize available dewatering capacity to drawdown inventory levels in the Clover Bar lagoons. Two limiting factors in reaching Drainage Services’ biosolids disposal targets, however, are dewatering capacity limits and biosolids generation in the region. Dewatering capacity issues can potentially limit the amount of biosolids that Drainage Services will be able to dispose of while any excess annual generation in the wastewater treatment process will become part of inventories stored in the Clover Bar lagoons. To mitigate the limit on dewatering capacity, Drainage Services is building an Enhanced Biosolids Dewatering Facility for $12 million by the middle of 2015. To deal with any potential excess annual generation as well as provide more flexibility in effectively managing any complications in the disposal process, Drainage Services entered into a contract with Beaver Municipal Solutions for approximately 2,300 dry tonnes for a value of up to $1 million in 2013 to deal with meeting disposal targets. Future contracts for the disposal of up to 50,000 dry tonnes over a 10 year period are anticipated starting in 2014. In addition to the above immediate actions, Drainage Services is also looking to address odour issues from the Clover Bar lagoons by maintaining a water cap in the lagoons, reducing odours generated during biosolids transfers, and investigating further odour reduction measures. As new long term options to utilize biosolids and/or reduce odour potential are realized, their resultant impacts on utility rates will be updated in future Business Plans and Budgets. Depreciation and Interest The impact of capital investments on customer rates for the Sanitary Utility has been previously documented in a number of reports to Committees and to City Council. The increases year over year primarily relates to the continued implementation of the Drainage Neighbourhood Renewal, Drainage System Rehabilitation and Flood Prevention programs. Further annual increases are due to the depreciation from the capitalization of Drainage Services’ projects and the related interest from debt financing. In terms of specific changes from the original approved capital budget, see the Capital Supplemental Budget Adjustment section. Local Access Fees The Utility pays 8.0% of rate revenue to the City of Edmonton for exclusive right of way access. As rate revenue increases, the Local Access Fees collected also increases.

14 Drainage Services 2014 – 2016 Business Plan
Operations and Maintenance Operations and Maintenance estimates are based upon the best information available to date. Where applicable, cost increases reflect a corporate Municipal Price Index assumption (3.27% in 2013, 3.23% in 2014 and 3.28% in 2015 and forward). Costs of operating a larger drainage system have also been absorbed within current resources. Impacts to Sanitary Financial Indicators The Sanitary Financial Indicators for 2014-2016 are presented in the following table. This will be extended to 10 years in the 2014 Budget. By applying a Rate of Return increase trending to 4.0% in 2014, the Utility is able to achieve a Debt to Net Assets Ratio of 60% by 2015 while maintaining a cash balance that allows for planned capital investment.
Sanitary Financial Indicators 2013 2014 2015 2016
1 Rate Sufficient to Meet Expense Net Income 18,112 22,523 24,924 27,570
Target: Positive Net Income
2 Fair and reasonable return Return on Rate Base 3.5% 4.0% 4.0% 4.0%
Target: Between 4% and 10%, while balancing between goals, rates and bottom line
Typical Residential Monthly Billing Increase 1.00 $ 1.68 $ 1.98 $ 1.30 $ Impact of Customer Rate 5.2% 8.2% 9.0% 5.4%
3 Financing of Capital Investments Debt Coverage Ratio 1.7 1.7 1.6 1.6 Debt to Net Assets Ratio 57% 59% 60% 60%
Target: Debt Coverage Ratio - 1.3 or higher // Debt to Net Asset Ratio - less than 60%
4 Cash Balance Uncommitted Cash Balance 20,272 37,652 42,535 43,583 Next Year's Capital Financed by RE 5,183 15,413 21,348 17,253
Target: Sufficient cash for planned capital investment to be financed by Retained Earnings

15 Drainage Services 2014 – 2016 Business Plan
STORMWATER DRAINAGE UTILITY
Increase due to:
Budget Forecast
2013 2014 2015 2016
Return on Rate Base $ 0.06 $ 0.66 $ 0.73 $ 0.69 Depreciation and Interest 0.39 0.37 0.40 0.40 Operations and Maintenance 0.27 0.18 0.08 0.11
$ 0.72 $ 1.21 $ 1.21 $ 1.20
Return on Rate Base Return on Rate Base is the amount that is deemed to be a fair and reasonable return on the investments made in capital assets, to provide for future reinvestment in the Utility. The minimum return was set at 4.0% and the maximum return to not exceed 10.0% as per the Utility Fiscal Policy. In 2012, the actual return was 8.5% (compared to a budgeted return of 7.0%) while the budgeted return for 2013 is 7.0%. The increase in 2012 was a one-time occurrence related to lower than anticipated expenditures for labour (due to the timing of hiring’s) and depreciation & interest (due to lower than anticipated capital spending and interest rates). This has already been adjusted in the current 2013 Budget. The Stormwater Utility is in a different financial position than the Sanitary Utility as a higher Return on Rate Base is currently required to provide sufficient cash to essentially maintain the current Debt to Net Assets Ratio while continuing with the Approved Capital Plan. As a result, almost half of the projected monthly increase in 2014 is dedicated to fund the Return on Rate Base. Depreciation and Interest The impact of capital investments on customer rates for the Stormwater Utility has been previously documented in a number of reports to Committees and to City Council. The increases year over year primarily relates to the continued implementation of the Drainage Neighbourhood Renewal, Drainage System Rehabilitation and Flood Prevention programs. Further annual increases are due to the depreciation from the capitalization of Drainage Services’ projects and the related interest from debt financing. In terms of specific changes from the original approved capital budget, see the Capital Supplemental Budget Adjustment section. Operations and Maintenance Operations and Maintenance estimates are based upon the best information available to date. Where applicable, cost increases reflect a corporate Municipal Price Index assumption (3.27% in 2013, 3.23% in 2014 and 3.28% in 2015 and forward). Costs of operating a larger drainage system have also been absorbed within current resources.
16 Drainage Services 2014 – 2016 Business Plan
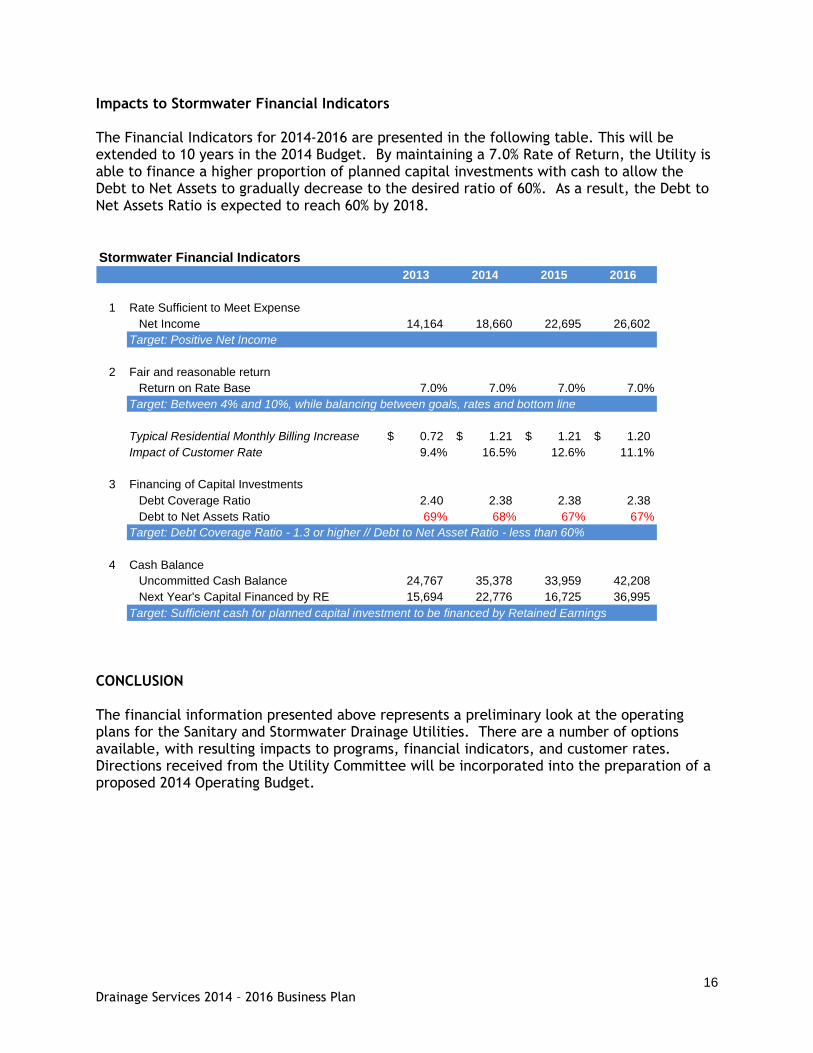
Impacts to Stormwater Financial Indicators The Financial Indicators for 2014-2016 are presented in the following table. This will be extended to 10 years in the 2014 Budget. By maintaining a 7.0% Rate of Return, the Utility is able to finance a higher proportion of planned capital investments with cash to allow the Debt to Net Assets to gradually decrease to the desired ratio of 60%. As a result, the Debt to Net Assets Ratio is expected to reach 60% by 2018.
CONCLUSION The financial information presented above represents a preliminary look at the operating plans for the Sanitary and Stormwater Drainage Utilities. There are a number of options available, with resulting impacts to programs, financial indicators, and customer rates. Directions received from the Utility Committee will be incorporated into the preparation of a proposed 2014 Operating Budget.
Stormwater Financial Indicators
2013 2014 2015 2016
1 Rate Sufficient to Meet Expense
Net Income 14,164 18,660 22,695 26,602 Target: Positive Net Income
2 Fair and reasonable return
Return on Rate Base 7.0% 7.0% 7.0% 7.0%
Target: Between 4% and 10%, while balancing between goals, rates and bottom line
Typical Residential Monthly Billing Increase 0.72 $ 1.21 $ 1.21 $ 1.20 $ Impact of Customer Rate 9.4% 16.5% 12.6% 11.1%
3 Financing of Capital Investments
Debt Coverage Ratio 2.40 2.38 2.38 2.38 Debt to Net Assets Ratio 69% 68% 67% 67%
Target: Debt Coverage Ratio - 1.3 or higher // Debt to Net Asset Ratio - less than 60%
4 Cash Balance
Uncommitted Cash Balance 24,767 35,378 33,959 42,208 Next Year's Capital Financed by RE 15,694 22,776 16,725 36,995
Target: Sufficient cash for planned capital investment to be financed by Retained Earnings

17 Drainage Services 2014 – 2016 Business Plan
Capital Supplemental Budget Adjustment
Drainage Services requires a capital budget adjustment for 2013 in regards to the following projects below:
The budget adjustment above reflects a shift of the current approved budget for 2013 only and will not have any rate impact in the current year or going forward. This is due to the utility rate financed portion related to Millwoods Double Barrel being offset by a reduction in current year requirements for the Drainage Neighbourhood Renewal program. The budget adjustment for WESS W14 (Big Lake) is financed through the Sanitary Sewer Servicing Fund and not utility rates so there is no rate impact. The overall reason for the variances is that original budget estimates were prepared with the most current information available to prepare the 2012-2014 Capital Budget in 2011. The Millwoods Double Barrel project requires an additional $15.5 million due to unforeseen scope changes. The changes were primarily a result of increased tunnel size and scope requirements to handle increased flow, different ground conditions than expected, and compensating for the collapse of the SA1C tunnel. The current year reduction for Drainage Neighbourhood Renewal is primarily due to contractor prices during 2013 being lower than originally expected. Estimates were prepared based on examination of the underground infrastructure through the use of closed circuit cameras. Closed circuit cameras are used to spot check sections of the infrastructure to assess the overall general condition. As such, the total condition and cost to rehabilitate any given neighbourhood is not exactly known until work begins. The additional budget required for WESS W14 (Big Lake) is primarily due to the original budget estimates being based on utilizing open cut construction at the time. As tenders came back, the method of tunnel construction had to be changed to micro-tunneling to deal with expanding sewer requirements and market conditions.
2013 SBA (in $'000's)
Utility Rate Financed
Millwoods Double Barrel 15,500$
Drainage Neighbourhood Renewal (15,500)
Subtotal - Utility Rate Financed -$
Non-Utility Rate Financed
WESS W14 (Big Lake) 15,157$
Subtotal - Non-Utility Rate Financed 15,157$
Total - 2013 SBA 15,157$

18 Drainage Services 2014 – 2016 Business Plan
FURTHER INFORMATION
Visit our website: www.edmonton.ca/drainage Inquiries may also be directed to: The City of Edmonton Drainage Services Main Floor, Century Place 9803 – 102A Avenue NW Edmonton, Alberta T5J 3A3 Phone: 311