Embed Size (px)
Citation preview
City of New Braunfels Drainage and Erosion Control Design Manual
2016
ManualUpdates:
2017‐1,2018‐1,2020‐1


NoticeofManualUpdates2017‐1Manual: City of New Braunfels Drainage and Erosion Control Design Manual (2016) From: Engineering Division | Public Works Department City Council Approval: August 28, 2017 Effective Date: September 1, 2017 Purpose: To provide clarification and implement best practices. Content: The following updates were made to the City of New Braunfels Drainage and Erosion Control Design Manual (2016): Chapter2–DrainagePolicyandCriteria
o Section 2.1.4 – Specify requirements for Preliminary Drainage Report. o Section 2.1.5 – Specify requirements for Master Drainage Plan Report. o Section 2.5 – Specify that the elevation of the lowest floor shall be elevated to 10 inches
above finished grade of the surrounding ground (in previous DCM). o Section 2.5 – Specify that the elevation of the lowest floor shall be elevated to 12 inches
above adjacent stormwater conveyance structures (clarification). o Section 2.5 – Require and specify grading plan required at plat and building permit. o Section 2.5 – Specify that residential lots shall be graded to avoid water flowing over curb
and driveway, and out of right‐of‐way. o Section 2.7 – Specify that if development activity changes runoff characteristics that
creates point discharge or any increase in discharge rates or velocities, the flow shall outfall into right‐of‐way or drainage easement that has capacity and an impact analysis is required to verify capacity and no adverse impact.
o Section 2.7 – Specify engineered retaining walls greater than three feet shall be designed to prevent freefall of stormwater.
o Section 2.11 – Specify pumped drainage facilities design, maintenance and operations requirements.
o Section 2.11 – Require feasibility analysis of pumped detention prior to permit application.
Supersedes: The revised manual supersedes prior versions of the City of New Braunfels Drainage and Erosion Control Design Manual (2016)


NoticeofManualUpdates2018‐1Manual: City of New Braunfels Drainage and Erosion Control Design Manual (2016) From: Engineering Division | Public Works Department City Council Approval: January 22, 2018 Effective Date: February 5, 2018 Purpose: To provide amend and clarify channel and maintenance access requirements. Content: The following updates were made to the City of New Braunfels Drainage and Erosion Control Design Manual (2016):
Chapter2–DrainagePolicyandCriteriao Section 2.3 – Clarify and revise channel definition, design frequency and freeboard. o Section 2.10.2 – Clarify easement and maintenance access criteria.
Chapter8–OpenChannelso Section 8.1 – Clarify easement and maintenance access criteria and specify pilot channel
and channel fencing requirements. AppendixB–DefinitionofTerms
o Redefine channel and define ditch and swale. Supersedes: The revised manual supersedes prior versions of the City of New Braunfels Drainage and Erosion Control Design Manual (2016)


NoticeofManualUpdates2020‐1Manual: City of New Braunfels Drainage and Erosion Control Design Manual (2016) From: Engineering Division | Public Works Department City Council Approval: Month XX, 2021 Effective Date: Month XX, 2021 Purpose: To provide hydrology updates aligning with new statewide NOAA Atlas 14 adoption. To implement floodplain criteria improvements providing better designs in flood prone areas allowing for higher standards of protection for the citizens of New Braunfels. Content: The following updates were made to the City of New Braunfels Drainage and Erosion Control Design Manual (2016):
Chapter2–DrainagePolicyandCriteriao Section 2.3 – Specify Floodplain Development Requirements. o Section 2.3.1 – Establish floodplain regulation to the 1% annual chance ultimate
development flood o Section 2.3.2 – Establish requirements for compensatory excavation in the floodplain. o Section 2.9 – Update of stream bank erosion hazard setbacks to Stream Buffers with
increased buffer requirements Chapter3–DesignRainfall
o Section 3.1 – Update hydrology data to align with NOAA Atlas 14 point precipitation frequencies.
Chapter4–DeterminationofDesignDischargeo Section 4.1 – Update various references for NOAA Atlas 14 point precipitation
frequencies. o Section 4.3 – Update various references for NOAA Atlas 14 point precipitation
frequencies. Chapter10–DetentionandRetentionFacilities
o Section 10.1 – Clarification to the maximum water depths criteria. o Section 10.2 – Update design mitigation to include the 2, 10, 25, 50, and 100‐year o Section 10.3 – Update the outlet structure design requirements to reference 2, 10, 25,
50, and 100‐year AppendixB–DefinitionofTerms
o Add new definitions AppendixC– StreamBankErosionHazardSetbacksExhibit
o Removed.
Supersedes: The revised manual supersedes prior versions of the City of New Braunfels Drainage and Erosion Control Design Manual (2016)


i
TableofContents
Notice of Manual Updates 2017‐1 ............................................................................................................. 1‐2
Notice of Manual Updates 2018‐1 ............................................................................................................. 1‐4
Notice of Manual Updates 2020‐1 ............................................................................................................. 1‐6
Table of Contents ........................................................................................................................................... i
List of Figures ............................................................................................................................................... vi
List of Tables .............................................................................................................................................. viii
List of Appendices ......................................................................................................................................... x
1 Introduction ....................................................................................................................................... 1‐1
1.1 Purpose and Scope ..................................................................................................................... 1‐1
1.2 Applicability ................................................................................................................................ 1‐1
1.3 Computer Programs ................................................................................................................... 1‐1
1.4 References and Definition of Terms .......................................................................................... 1‐1
1.5 Acknowledgements .................................................................................................................... 1‐2
2 Drainage Policy and Criteria ............................................................................................................... 2‐1
2.1 Drainage and Water Quality Design Requirements ................................................................... 2‐1
2.2 Type 3 Drainage and Water Quality Report Criteria .................................................................. 2‐3
2.3 Floodplain Development Requirements .................................................................................... 2‐4
2.4 Freeboard ................................................................................................................................... 2‐6
2.5 Drainage Easements and Rights‐of‐way .................................................................................... 2‐6
2.6 Finished Floor Elevations ........................................................................................................... 2‐6
2.7 Stormwater Mitigation .............................................................................................................. 2‐7
2.8 Drainage Facility Design ............................................................................................................. 2‐8
2.9 Stream Buffers ........................................................................................................................... 2‐9
2.10 Water Quality Controls ............................................................................................................ 2‐10
2.11 Maintenance of Drainage Facilities .......................................................................................... 2‐10
2.12 Pumped Drainage Facilities ...................................................................................................... 2‐11
3 Design Rainfall .................................................................................................................................... 3‐1
3.1 Rainfall Intensity Duration Frequency ....................................................................................... 3‐1
4 Determination of Design Discharge ................................................................................................... 4‐1
4.1 General Requirements ............................................................................................................... 4‐1
4.2 The Rational Method ................................................................................................................. 4‐1
4.3 SCS/NRCS Unit Hydrograph ........................................................................................................ 4‐6
4.4 Hydrologic Computer Programs ................................................................................................. 4‐8
5 Street Flow ......................................................................................................................................... 5‐1
5.1 General Requirements ............................................................................................................... 5‐1
ii
5.2 Positive Overflow ....................................................................................................................... 5‐1
5.3 Street Flow Calculations ............................................................................................................. 5‐1
5.4 Alley Flow Limitations ................................................................................................................ 5‐5
5.5 Alley Flow Calculations............................................................................................................... 5‐5
6 Inlet Design ........................................................................................................................................ 6‐1
6.1 General Requirements ............................................................................................................... 6‐1
6.2 Inlet Types and Descriptions ...................................................................................................... 6‐3
6.3 Inlet Capacity Calculations ......................................................................................................... 6‐4
7 Storm Drain Systems .......................................................................................................................... 7‐1
7.1 General Requirements ............................................................................................................... 7‐1
7.2 Design Criteria ............................................................................................................................ 7‐2
7.3 Calculation of the Hydraulic Grade Line .................................................................................... 7‐3
7.4 Hydraulic Grade Line Computation Sheet ................................................................................ 7‐16
8 Open Channels ................................................................................................................................... 8‐1
8.1 General Requirements ............................................................................................................... 8‐1
8.2 Design Criteria ............................................................................................................................ 8‐2
8.3 Channel Capacity ........................................................................................................................ 8‐3
8.4 Roughness Coefficients .............................................................................................................. 8‐3
8.5 Subdividing Cross‐Sections ........................................................................................................ 8‐6
8.6 Slope Conveyance Method ........................................................................................................ 8‐6
8.7 Standard Step Backwater Method ............................................................................................. 8‐8
8.8 Supercritical Flow ..................................................................................................................... 8‐12
8.9 Flow in Bends ........................................................................................................................... 8‐13
8.10 Shear Stress .............................................................................................................................. 8‐13
8.11 Drop Structures ........................................................................................................................ 8‐16
8.12 Energy Dissipators .................................................................................................................... 8‐17
9 Bridges and Culverts .......................................................................................................................... 9‐1
9.1 General Requirements ............................................................................................................... 9‐1
9.2 Bridge Design Criteria ................................................................................................................ 9‐1
9.3 Culvert Design Criteria ............................................................................................................... 9‐2
9.4 Culvert End Treatments ............................................................................................................. 9‐2
9.5 Culvert Hydraulics ...................................................................................................................... 9‐3
9.6 Debris Fins .................................................................................................................................. 9‐5
9.7 Culvert Outlet Protection ........................................................................................................... 9‐5
9.8 Energy Dissipation ...................................................................................................................... 9‐5
10 Detention and Retention Facilities .................................................................................................. 10‐1
10.1 General Requirements ............................................................................................................. 10‐1
10.2 Design Criteria .......................................................................................................................... 10‐3
10.3 Outlet Structure Design ........................................................................................................... 10‐3
iii
11 Lakes, Dams and Levees ................................................................................................................... 11‐1
11.1 Lakes and Dams ........................................................................................................................ 11‐1
11.2 Levees....................................................................................................................................... 11‐3
12 Site Erosion Control During Construction ........................................................................................ 12‐1
12.1 Applicable Properties or Construction Sites ............................................................................ 12‐1
12.2 General Guidelines for Erosion Control Plan ........................................................................... 12‐1
12.3 Stream Bank Erosion ................................................................................................................ 12‐2
13 Water Quality Controls .................................................................................................................... 13‐1
13.1 Applicability .............................................................................................................................. 13‐1
13.2 Design Criteria .......................................................................................................................... 13‐1
13.3 Treatment Methods ................................................................................................................. 13‐1
13.4 Maintenance ............................................................................................................................ 13‐2
Notice of Manual Updates 2017‐1 ............................................................................................................. 1‐2
Table of Contents ........................................................................................................................................... i
List of Figures ............................................................................................................................................... iv
List of Tables ................................................................................................................................................. v
List of Appendices ........................................................................................................................................ vi
1 Introduction ....................................................................................................................................... 1‐1
1.1 Purpose and Scope ..................................................................................................................... 1‐1
1.2 Applicability ................................................................................................................................ 1‐1
1.3 Computer Programs ................................................................................................................... 1‐1
1.4 References and Definition of Terms .......................................................................................... 1‐1
1.5 Acknowledgements .................................................................................................................... 1‐2
2 Drainage Policy and Criteria ............................................................................................................... 2‐1
2.1 Drainage and Water Quality Design Requirements ................................................................... 2‐1
2.2 Type 3 Drainage and Water Quality Report Criteria .................................................................. 2‐3
2.3 Freeboard ................................................................................................................................... 2‐4
2.4 Drainage Easements and Rights‐of‐way .................................................................................... 2‐4
2.5 Finished Floor Elevations ........................................................................................................... 2‐5
2.6 Stormwater Mitigation .............................................................................................................. 2‐6
2.7 Drainage Facility Design ............................................................................................................. 2‐6
2.8 Stream Bank Erosion Hazard Setbacks ....................................................................................... 2‐7
2.9 Water Quality Controls .............................................................................................................. 2‐8
2.10 Maintenance of Drainage Facilities ............................................................................................ 2‐8
2.11 Pumped Drainage Facilities ........................................................................................................ 2‐8
3 Design Rainfall .................................................................................................................................... 3‐1
3.1 Rainfall Intensity Duration Frequency ....................................................................................... 3‐1
3.2 Rainfall Depth Duration Frequency ............................................................................................ 3‐2

iv
4 Determination of Design Discharge ................................................................................................... 4‐1
4.1 General Requirements ............................................................................................................... 4‐1
4.2 The Rational Method ................................................................................................................. 4‐1
4.3 SCS/NRCS Unit Hydrograph ........................................................................................................ 4‐6
4.4 Hydrologic Computer Programs ................................................................................................. 4‐8
5 Street Flow ......................................................................................................................................... 5‐1
5.1 General Requirements ............................................................................................................... 5‐1
5.2 Positive Overflow ....................................................................................................................... 5‐1
5.3 Street Flow Calculations ............................................................................................................. 5‐1
5.4 Alley Flow Limitations ................................................................................................................ 5‐5
5.5 Alley Flow Calculations............................................................................................................... 5‐5
6 Inlet Design ........................................................................................................................................ 6‐1
6.1 General Requirements ............................................................................................................... 6‐1
6.2 Inlet Types and Descriptions ...................................................................................................... 6‐3
6.3 Inlet Capacity Calculations ......................................................................................................... 6‐4
7 Storm Drain Systems .......................................................................................................................... 7‐1
7.1 General Requirements ............................................................................................................... 7‐1
7.2 Design Criteria ............................................................................................................................ 7‐2
7.3 Calculation of the Hydraulic Grade Line .................................................................................... 7‐3
7.4 Hydraulic Grade Line Computation Sheet ................................................................................ 7‐16
8 Open Channels ................................................................................................................................... 8‐1
8.1 General Requirements ............................................................................................................... 8‐1
8.2 Design Criteria ............................................................................................................................ 8‐2
8.3 Channel Capacity ........................................................................................................................ 8‐3
8.4 Roughness Coefficients .............................................................................................................. 8‐3
8.5 Subdividing Cross‐Sections ........................................................................................................ 8‐6
8.6 Slope Conveyance Method ........................................................................................................ 8‐6
8.7 Standard Step Backwater Method ............................................................................................. 8‐8
8.8 Supercritical Flow ..................................................................................................................... 8‐12
8.9 Flow in Bends ........................................................................................................................... 8‐13
8.10 Shear Stress .............................................................................................................................. 8‐13
8.11 Drop Structures ........................................................................................................................ 8‐16
8.12 Energy Dissipators .................................................................................................................... 8‐17
9 Bridges and Culverts .......................................................................................................................... 9‐1
9.1 General Requirements ............................................................................................................... 9‐1
9.2 Bridge Design Criteria ................................................................................................................ 9‐1
9.3 Culvert Design Criteria ............................................................................................................... 9‐2
9.4 Culvert End Treatments ............................................................................................................. 9‐2
9.5 Culvert Hydraulics ...................................................................................................................... 9‐3
9.6 Debris Fins .................................................................................................................................. 9‐5

v
9.7 Culvert Outlet Protection ........................................................................................................... 9‐5
9.8 Energy Dissipation ...................................................................................................................... 9‐5
10 Detention and Retention Facilities .................................................................................................. 10‐1
10.1 General Requirements ............................................................................................................. 10‐1
10.2 Design Criteria .......................................................................................................................... 10‐3
10.3 Outlet Structure Design ........................................................................................................... 10‐3
11 Lakes, Dams and Levees ................................................................................................................... 11‐1
11.1 Lakes and Dams ........................................................................................................................ 11‐1
11.2 Levees....................................................................................................................................... 11‐3
12 Site Erosion Control During Construction ........................................................................................ 12‐1
12.1 Applicable Properties or Construction Sites ............................................................................ 12‐1
12.2 General Guidelines for Erosion Control Plan ........................................................................... 12‐1
12.3 Stream Bank Erosion ................................................................................................................ 12‐2
13 Water Quality Controls .................................................................................................................... 13‐1
13.1 Applicability .............................................................................................................................. 13‐1
13.2 Design Criteria .......................................................................................................................... 13‐1
13.3 Treatment Methods ................................................................................................................. 13‐1
13.4 Maintenance ............................................................................................................................ 13‐2

vi
ListofFiguresFigure 2‐1: Typical Federal Housing Administration Lot Grading .............................................................. 2‐7
Figure 5‐1: Typical Gutter Sections ............................................................................................................ 5‐2
Figure 5‐2: Chart 1B – Flow in Triangular Gutter Sections ......................................................................... 5‐4
Figure 6‐1: Curb Opening Inlet Examples .................................................................................................. 6‐2
Figure 6‐2: Depressed Curb Opening Inlet ................................................................................................. 6‐2
Figure 6‐3: Inlet Types ................................................................................................................................ 6‐3
Figure 6‐4: Gutter Cross‐Section Diagram ................................................................................................. 6‐5
Figure 6‐5: Slotted Drain Inlet Interception Rate ..................................................................................... 6‐11
Figure 6‐6: Perimeter Length for Grate Inlet in Sag Configuration .......................................................... 6‐14
Figure 6‐7: Relationship between Head and Capacity for Weir and Orifice Flow ................................... 6‐15
Figure 7‐1: Access Hole Energy Level Definitions ...................................................................................... 7‐8
Figure 7‐2: Access hole benching methods ............................................................................................. 7‐11
Figure 7‐3: Access hole angled inflow definition ..................................................................................... 7‐13
Figure 8‐1: EGL for Water Surface Profile .................................................................................................. 8‐9
Figure 9‐1: Typical Culvert End Treatments ............................................................................................... 9‐3
Figure 10‐1: Definition Sketch for Orifice Flow ........................................................................................ 10‐4
Figure 10‐2: Sharp Crested Weirs ............................................................................................................ 10‐5
Figure 10‐3: V‐Notch Weir ....................................................................................................................... 10‐8
Figure 10‐4: Proportional Weir Dimensions ............................................................................................ 10‐9
Figure 10‐5: Emergency Spillway Design Schematic .............................................................................. 10‐10
Figure 10‐6: Discharge Coefficients for Emergency Spillways, English Units ........................................ 10‐11
Figure 2‐1: Typical Federal Housing Administration Lot Grading .............................................................. 2‐5
Figure 5‐1: Typical Gutter Sections ............................................................................................................ 5‐2
Figure 5‐2: Chart 1B – Flow in Triangular Gutter Sections ......................................................................... 5‐4
Figure 6‐1: Curb Opening Inlet Examples .................................................................................................. 6‐2
Figure 6‐2: Depressed Curb Opening Inlet ................................................................................................. 6‐2
Figure 6‐3: Inlet Types ................................................................................................................................ 6‐3
Figure 6‐4: Gutter Cross‐Section Diagram ................................................................................................. 6‐5
Figure 6‐5: Slotted Drain Inlet Interception Rate ..................................................................................... 6‐11
Figure 6‐6: Perimeter Length for Grate Inlet in Sag Configuration .......................................................... 6‐14
Figure 6‐7: Relationship between Head and Capacity for Weir and Orifice Flow ................................... 6‐15
Figure 7‐1: Access Hole Energy Level Definitions ...................................................................................... 7‐8
Figure 7‐2: Access hole benching methods ............................................................................................. 7‐11
Figure 7‐3: Access hole angled inflow definition ..................................................................................... 7‐13
Figure 8‐1: EGL for Water Surface Profile .................................................................................................. 8‐9
Figure 9‐1: Typical Culvert End Treatments ............................................................................................... 9‐3
Figure 10‐1: Definition Sketch for Orifice Flow ........................................................................................ 10‐4
Figure 10‐2: Sharp Crested Weirs ............................................................................................................ 10‐5
Figure 10‐3: V‐Notch Weir ....................................................................................................................... 10‐8
Figure 10‐4: Proportional Weir Dimensions ............................................................................................ 10‐9

vii
Figure 10‐5: Emergency Spillway Design Schematic .............................................................................. 10‐10
Figure 10‐6: Discharge Coefficients for Emergency Spillways, English Units ........................................ 10‐11
viii
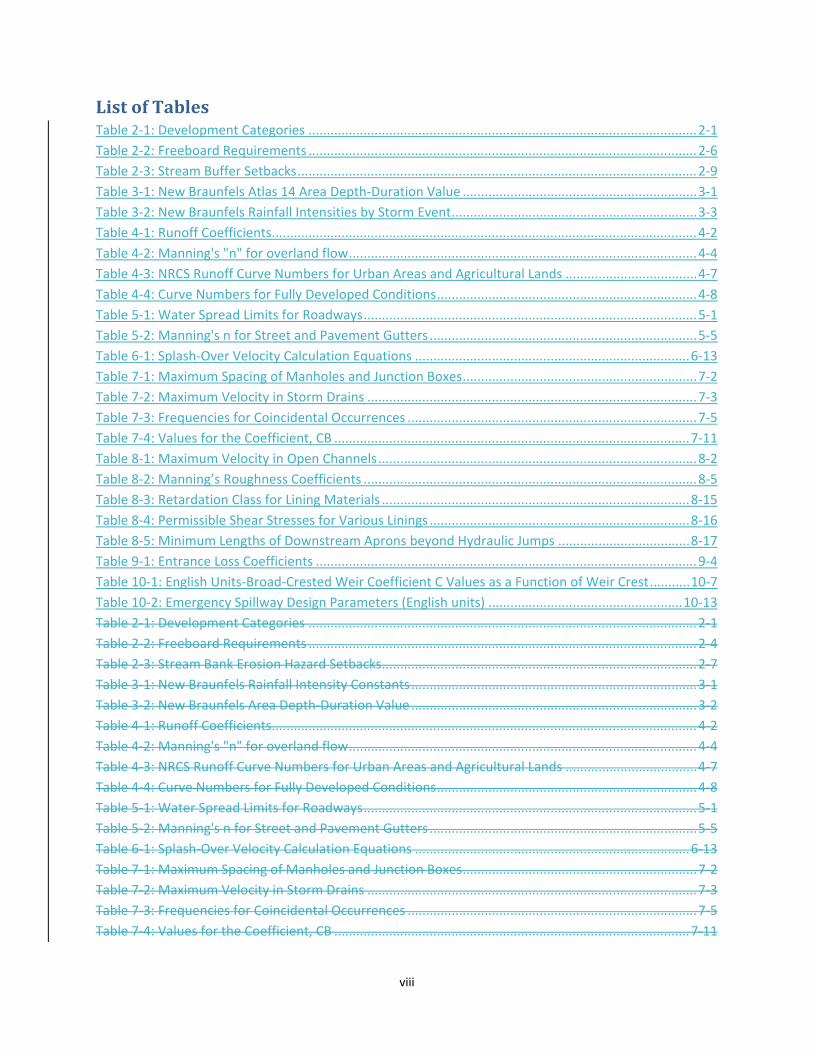
ListofTablesTable 2‐1: Development Categories .......................................................................................................... 2‐1
Table 2‐2: Freeboard Requirements .......................................................................................................... 2‐6
Table 2‐3: Stream Buffer Setbacks ............................................................................................................. 2‐9
Table 3‐1: New Braunfels Atlas 14 Area Depth‐Duration Value ................................................................ 3‐1
Table 3‐2: New Braunfels Rainfall Intensities by Storm Event ................................................................... 3‐3
Table 4‐1: Runoff Coefficients .................................................................................................................... 4‐2
Table 4‐2: Manning's "n" for overland flow ............................................................................................... 4‐4
Table 4‐3: NRCS Runoff Curve Numbers for Urban Areas and Agricultural Lands .................................... 4‐7
Table 4‐4: Curve Numbers for Fully Developed Conditions ....................................................................... 4‐8
Table 5‐1: Water Spread Limits for Roadways ........................................................................................... 5‐1
Table 5‐2: Manning's n for Street and Pavement Gutters ......................................................................... 5‐5
Table 6‐1: Splash‐Over Velocity Calculation Equations ........................................................................... 6‐13
Table 7‐1: Maximum Spacing of Manholes and Junction Boxes ................................................................ 7‐2
Table 7‐2: Maximum Velocity in Storm Drains .......................................................................................... 7‐3
Table 7‐3: Frequencies for Coincidental Occurrences ............................................................................... 7‐5
Table 7‐4: Values for the Coefficient, CB ................................................................................................. 7‐11
Table 8‐1: Maximum Velocity in Open Channels ....................................................................................... 8‐2
Table 8‐2: Manning’s Roughness Coefficients ........................................................................................... 8‐5
Table 8‐3: Retardation Class for Lining Materials .................................................................................... 8‐15
Table 8‐4: Permissible Shear Stresses for Various Linings ....................................................................... 8‐16
Table 8‐5: Minimum Lengths of Downstream Aprons beyond Hydraulic Jumps .................................... 8‐17
Table 9‐1: Entrance Loss Coefficients ........................................................................................................ 9‐4
Table 10‐1: English Units‐Broad‐Crested Weir Coefficient C Values as a Function of Weir Crest ........... 10‐7
Table 10‐2: Emergency Spillway Design Parameters (English units) ..................................................... 10‐13
Table 2‐1: Development Categories .......................................................................................................... 2‐1
Table 2‐2: Freeboard Requirements .......................................................................................................... 2‐4
Table 2‐3: Stream Bank Erosion Hazard Setbacks ...................................................................................... 2‐7
Table 3‐1: New Braunfels Rainfall Intensity Constants .............................................................................. 3‐1
Table 3‐2: New Braunfels Area Depth‐Duration Value .............................................................................. 3‐2
Table 4‐1: Runoff Coefficients .................................................................................................................... 4‐2
Table 4‐2: Manning's "n" for overland flow ............................................................................................... 4‐4
Table 4‐3: NRCS Runoff Curve Numbers for Urban Areas and Agricultural Lands .................................... 4‐7
Table 4‐4: Curve Numbers for Fully Developed Conditions ....................................................................... 4‐8
Table 5‐1: Water Spread Limits for Roadways ........................................................................................... 5‐1
Table 5‐2: Manning's n for Street and Pavement Gutters ......................................................................... 5‐5
Table 6‐1: Splash‐Over Velocity Calculation Equations ........................................................................... 6‐13
Table 7‐1: Maximum Spacing of Manholes and Junction Boxes ................................................................ 7‐2
Table 7‐2: Maximum Velocity in Storm Drains .......................................................................................... 7‐3
Table 7‐3: Frequencies for Coincidental Occurrences ............................................................................... 7‐5
Table 7‐4: Values for the Coefficient, CB ................................................................................................. 7‐11

ix
Table 8‐1: Maximum Velocity in Open Channels ....................................................................................... 8‐2
Table 8‐2: Manning’s Roughness Coefficients ........................................................................................... 8‐5
Table 8‐3: Retardation Class for Lining Materials .................................................................................... 8‐15
Table 8‐4: Permissible Shear Stresses for Various Linings ....................................................................... 8‐16
Table 8‐5: Minimum Lengths of Downstream Aprons beyond Hydraulic Jumps .................................... 8‐17
Table 9‐1: Entrance Loss Coefficients ........................................................................................................ 9‐4
Table 10‐1: English Units‐Broad‐Crested Weir Coefficient C Values as a Function of Weir Crest ........... 10‐7
Table 10‐2: Emergency Spillway Design Parameters (English units) ..................................................... 10‐13

x
ListofAppendicesAppendix A: References Appendix B: Definition of Terms Appendix C: Stream Bank Erosion Hazard Setbacks Exhibit

1‐1
1 Introduction
1.1 PurposeandScopeThe purpose of the Drainage and Erosion Control Design Manual is to establish standard principles and
practices for the design and construction of storm drainage, flood protection, erosion control, and water
quality facilities within the City of New Braunfels, Texas and its extraterritorial jurisdiction (ETJ).
The design factors, formulas, graphs, and procedures described in this manual are intended to serve as
guidelines for the design of drainage improvements and projects involving the volume, rate of flow,
method of collection, storage, conveyance, treatment, and disposal of stormwater and erosion
protection from stormwater flows. Responsibility for actual design remains with the design engineer.
Any variations from the methodology or requirements in this manual must have expressed written
approval of the City Engineer and Engineering Division, as permitted by Ordinance.
This manual and the City of New Braunfels Code of Ordinances contain requirements for the design of
storm drainage, flood protection, water quality, and erosion control facilities. Where there is any conflict
between this manual and the current code, the code shall take precedence. The design engineer is
responsible for complying with the latest version of this manual and code adopted by the City.
Should conflicts occur between policy and criteria in this manual versus other regulatory authorities
with jurisdiction in the same area, such as Texas Commission on Environmental Quality (TCEQ) or Texas
Department of Transportation (TxDOT), then the more stringent requirement will apply and the designer
will need to show how both requirements have been met.
1.2 ApplicabilityCriteria in this manual shall apply to all drainage improvements and projects that may have an impact on
drainage, both publicly and privately funded, within the City of New Braunfels, Texas and within its ETJ.
Criteria in this manual shall apply to any capital improvement or development project, plat, master plan,
or building permit except as otherwise noted in the manual.
1.3 ComputerProgramsThe use of computer programs for calculating and modeling storm data and drainage facilities is
accepted as standard practice. There are a variety of computer programs available and the design
engineer maintains responsibility of selecting the appropriate approach and/or computer program
unless otherwise specified in this manual. Computer programs are not a replacement for sound
engineering judgment and the user must understand how the program performs the calculations and
what assumptions are made.
1.4 ReferencesandDefinitionofTermsAt certain points in the text, the reader will encounter numbers enclosed in brackets, for example [1].
These numbers correspond to the references listed in Appendix A. Figures and tables reproduced from

1‐2
other sources have the source listed beneath each figure or table. Common terms used in this manual
are provided in Appendix B.
1.5 AcknowledgementsThis manual is the result of the dedication and energy of the Drainage Advisory Committee members for
the 2000 edition. For the 2015 update, acknowledgements go to City staff, Watershed Advisory
Committee, Design Workshop, Lockwood Andrews & Newnam, Inc., and input from a wide variety of
stakeholders.

2‐1
2 DrainagePolicyandCriteria
2.1 DrainageandWaterQualityDesignRequirementsAll drainage improvements and projects shall be designed and constructed in accordance with the
current regulations, standards and specifications adopted by the City of New Braunfels. Any capital
improvement or development project within the City of New Braunfels jurisdiction is required to comply
with the requirements outlined in this manual. When necessary, properly sized easements shall be
granted across all contiguous property owned by the property owner.
A drainage report is required to be submitted by the property owner or its agent according to the
requirements of this manual. The Engineering Division prior to issuance of a permit must approve the
report. The type of development and report shall be based on the location and additional impervious
cover of the development as shown in Table 2‐1.
Table 2‐1: Development Categories
Category Criteria
Type 1 Development Less than one acre of land; and < 1,000 SF additional impervious cover
Type 2 Development Less than one acre of land; and 1,000 – 4,999 SF additional impervious cover; or Agricultural development (not including feedlots)
Type 3 Development ≥ 5,000 SF additional impervious cover; or
Development within FEMA designated Special Flood Hazard Area
If any onsite and offsite stormwater structure related to the development is known to be at or above
design capacity, the development will be considered a Type 3 Development.
Drainage report requirements are outlined below. An electronic media copy of the report is required in
addition to a paper copy at time of city acceptance of infrastructure improvements.
2.1.1 Type1DrainageReportA Type 1 Development is any development or redevelopment that disturbs less than one acre of land
and creates less than 1,000 square foot of additional impervious cover. The Type 1 Drainage Report shall
be prepared by the property owner or its agent, and consist of the following:
A. Applicant contact information (e.g. name, address, phone number, and email address)
B. Site location map
C. Detailed site drawing or sketch showing any existing features or infrastructure and proposed
disturbance
D. Temporary erosion control plan
2‐2
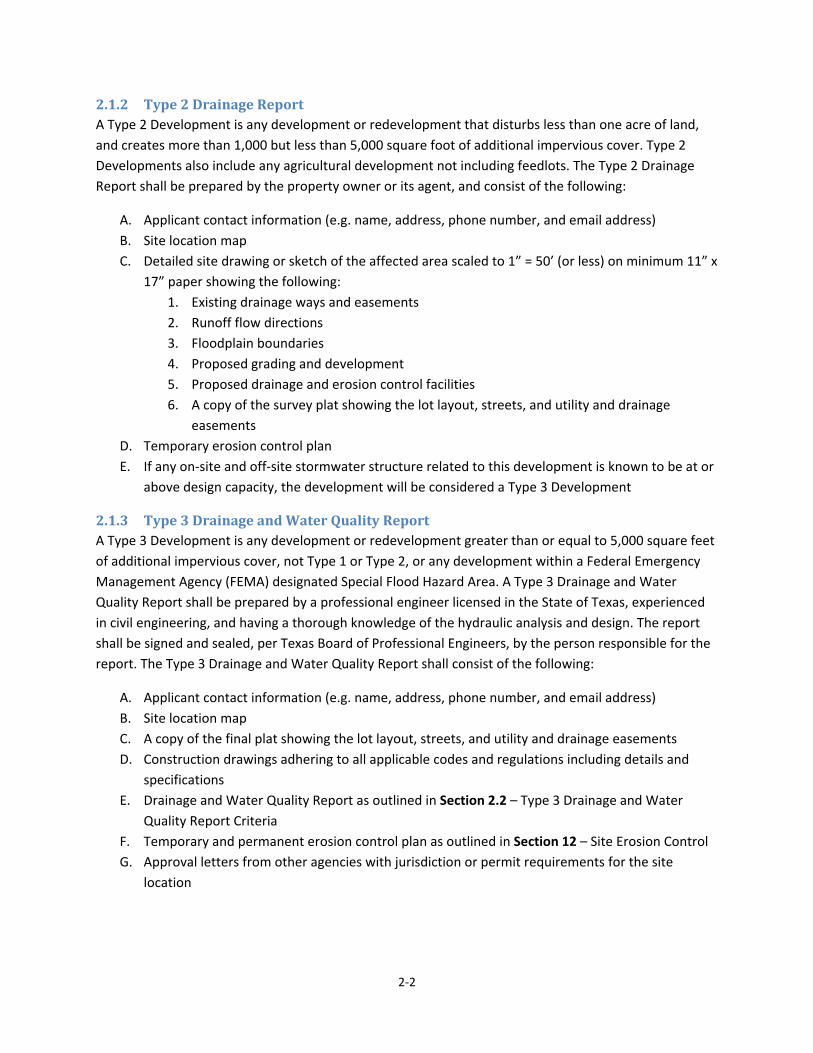
2.1.2 Type2DrainageReportA Type 2 Development is any development or redevelopment that disturbs less than one acre of land,
and creates more than 1,000 but less than 5,000 square foot of additional impervious cover. Type 2
Developments also include any agricultural development not including feedlots. The Type 2 Drainage
Report shall be prepared by the property owner or its agent, and consist of the following:
A. Applicant contact information (e.g. name, address, phone number, and email address)
B. Site location map
C. Detailed site drawing or sketch of the affected area scaled to 1” = 50’ (or less) on minimum 11” x
17” paper showing the following:
1. Existing drainage ways and easements
2. Runoff flow directions
3. Floodplain boundaries
4. Proposed grading and development
5. Proposed drainage and erosion control facilities
6. A copy of the survey plat showing the lot layout, streets, and utility and drainage
easements
D. Temporary erosion control plan
E. If any on‐site and off‐site stormwater structure related to this development is known to be at or
above design capacity, the development will be considered a Type 3 Development
2.1.3 Type3DrainageandWaterQualityReportA Type 3 Development is any development or redevelopment greater than or equal to 5,000 square feet
of additional impervious cover, not Type 1 or Type 2, or any development within a Federal Emergency
Management Agency (FEMA) designated Special Flood Hazard Area. A Type 3 Drainage and Water
Quality Report shall be prepared by a professional engineer licensed in the State of Texas, experienced
in civil engineering, and having a thorough knowledge of the hydraulic analysis and design. The report
shall be signed and sealed, per Texas Board of Professional Engineers, by the person responsible for the
report. The Type 3 Drainage and Water Quality Report shall consist of the following:
A. Applicant contact information (e.g. name, address, phone number, and email address)
B. Site location map
C. A copy of the final plat showing the lot layout, streets, and utility and drainage easements
D. Construction drawings adhering to all applicable codes and regulations including details and
specifications
E. Drainage and Water Quality Report as outlined in Section 2.2 – Type 3 Drainage and Water
Quality Report Criteria
F. Temporary and permanent erosion control plan as outlined in Section 12 – Site Erosion Control
G. Approval letters from other agencies with jurisdiction or permit requirements for the site
location

2‐3
2.1.4 PreliminaryDrainageReportA Preliminary Drainage Report of the storm drainage system is required with a preliminary plat. The
report shall include the following:
A. Preliminary Drainage Site Plan including: plat boundary; existing and proposed drainage
infrastructure, right‐of‐way and easements in and adjacent to the plat; proposed stormwater
connections and point(s) of development discharge; and proposed changes to floodplain and
floodway boundaries. Drainage infrastructure includes inlets, channels, storm sewer, detention,
retention and water quality facilities.
B. Conformance with the Master Drainage Plan Report (if applicable) specified in Section
2.1.52.1.5. The report may require updating for development plat submittals and changes in the
drainage design.
2.1.5 MasterDrainagePlanReportA Master Drainage Plan Report shall be provided with a subdivision master plan and planned
development. The report shall include the following:
A. Existing Drainage Site Plan including: development boundary; existing and proposed drainage
infrastructure, right‐of‐way and easements in and adjacent to the development; and floodplain
and floodway boundaries. Drainage infrastructure includes inlets, channels, storm sewer,
detention, retention and water quality facilities.
B. Existing Watershed Map including: development boundary; existing drainage area and all sub
areas; 2‐foot contours; and existing runoff flow directions.
C. Preliminary Drainage Site Plan including: development boundary; proposed drainage
infrastructure, right‐of‐way and easements in and adjacent to the development; proposed
stormwater connections and point(s) of development discharge; and proposed changes to
floodplain and floodway boundaries.
D. Master Drainage Plan Summary including how drainage and water quality resulting from the
proposed development will be managed and how proposed drainage infrastructure will impact
adjacent property owners.
2.2 Type3DrainageandWaterQualityReportCriteriaThe planning and design of drainage systems should ensure that problems are not transferred from one
location to another. Grading and other construction activities may not change the terrain in such a way
to cause damage to public or private property from drainage or flood problems, increased runoff, or
increased erosion or sediment movement.
Existing drainage between developed lots will remain the responsibility of the affected property owners.
Commercial developments are required to drain surface runoff from an individual lot to a public right‐of‐
way or to a drainage system contained in an easement. Residential lot‐to‐lot drainage of sheet flows
should be avoided, and residential developments are encouraged to direct surface runoff to a public
right‐of‐way or to a drainage system contained in an easement.

2‐4
The Engineering Division shall not approve any drainage report pertaining to proposed construction,
platting or other development where the proposed activity or change in the land would result in post‐
development discharge from the site exceeding discharge under pre‐developed conditions (for new
development) or existing conditions (for re‐development). Downstream capacity shall not be exceeded
as a result of development. Exemptions from this provision are as follows:
A. Additional drainage improvements are not required if drainage improvements have been
provided for the fully developed condition, which includes the proposed development.
B. Prior written approval of a Stormwater Connection Fee from the City Engineer.
No proposed development shall be constructed which impedes or constricts runoff from an upstream
watershed based on fully developed conditions. Therefore drainage computations shall be provided to
verify no adverse impact upstream or downstream.
2.3 FloodplainDevelopmentRequirementsThe purpose of floodplain management is to focus on safety of the citizens, minimize flood loses, avoid
flooding of buildings, preserve floodplain areas and ultimately improve quality of life for the residents of
City of New Braunfels. With this being the primary focus, the City has adopted higher standards than
currently illustrated in FEMA’s general guidance (FEMA Policy Standards for Flood Risk Analysis and
Mapping).
1% Annual Chance (AC) floodplain, also known as the 100‐year floodplain is the area subject to 1% or
greater chance of flooding in any given year, as described in FEMA guidelines. These zones are typically
represented as Zone A, AE, AH or AO on FEMA Flood Insurance Rate Maps (FIRM Panels) and are
classified as High‐Risk flood zones. Based on FEMA guidelines, the Shaded‐X area can be delineated
either using the 0.2% AC storm or 1% AC storm based on Ultimate Development (UD) Conditions, also
known as Future Conditions (FC). The City permits floodplain reclamation if supported by a signed and
sealed study which demonstrates no adverse impacts to any property and demonstrates a no‐rise in the
1% AC UD water surface elevation outside of the requestor’s property limits.
2.3.1 Regulatingtothe1%AnnualChanceUltimateDevelopmentFloodThe City of New Braunfels has adopted the 1% AC UD floodplain mapped using Atlas 14 rainfall data
published in this document, as the regulatory floodplain. Such floodplain is delineated based on flows
developed by assuming the entire watershed is fully developed. The City’s GIS portal provides
information regarding future zoning projections, which can be used to estimate fully developed
conditions. The City requires all new and re‐studied FEMA floodplains to delineate the 1% AC UD
floodplain to be depicted and platted or otherwise secured as a drainage easement.
Once the Flood Insurance Rate Maps (FIRM) for City of New Braunfels are updated with the revised
rainfall data, the 1% AC UD floodplains will be designated as Shaded‐X areas for all FEMA floodplain
establishments or revisions. Until the FEMA FIRM are updated with the revised rainfall data, the City’s
regulatory criteria will require all storm water management facilities or a combination of facilities,
stream crossings, new‐development or re‐development in the floodplain to be designed for Ultimate
Development Conditions. The City requires demonstration of the elevation of fill placed in the 1% AC UD
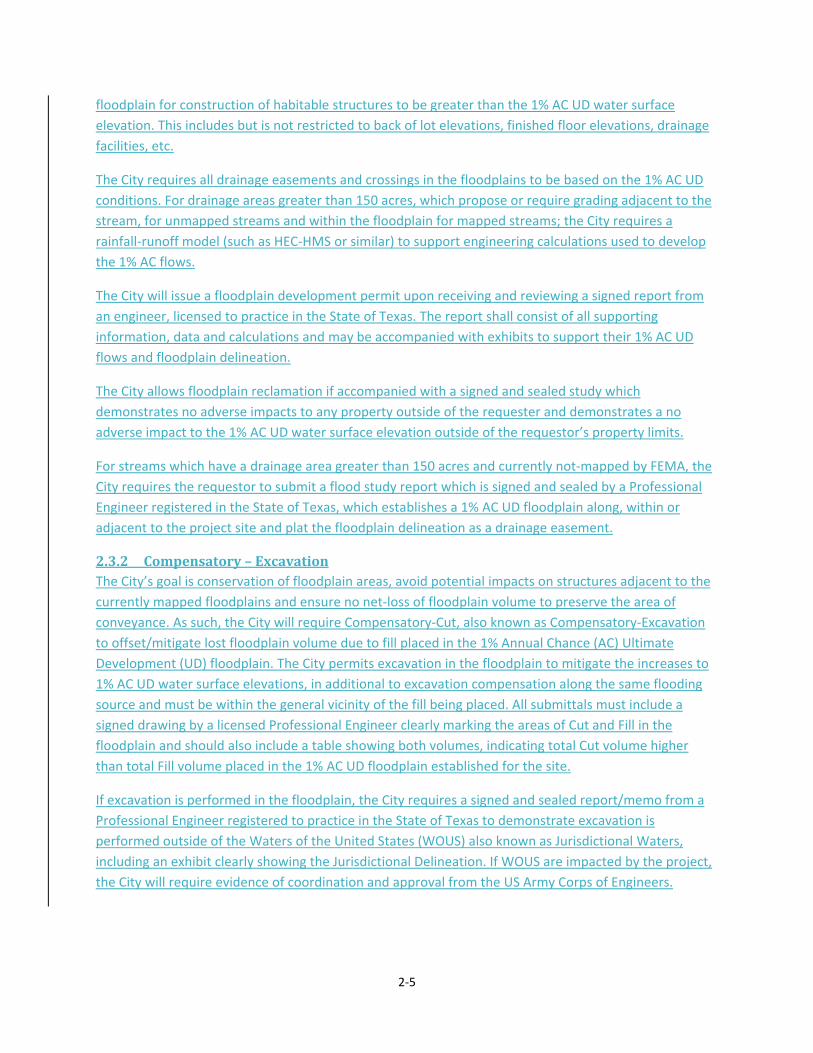
2‐5
floodplain for construction of habitable structures to be greater than the 1% AC UD water surface
elevation. This includes but is not restricted to back of lot elevations, finished floor elevations, drainage
facilities, etc.
The City requires all drainage easements and crossings in the floodplains to be based on the 1% AC UD
conditions. For drainage areas greater than 150 acres, which propose or require grading adjacent to the
stream, for unmapped streams and within the floodplain for mapped streams; the City requires a
rainfall‐runoff model (such as HEC‐HMS or similar) to support engineering calculations used to develop
the 1% AC flows.
The City will issue a floodplain development permit upon receiving and reviewing a signed report from
an engineer, licensed to practice in the State of Texas. The report shall consist of all supporting
information, data and calculations and may be accompanied with exhibits to support their 1% AC UD
flows and floodplain delineation.
The City allows floodplain reclamation if accompanied with a signed and sealed study which
demonstrates no adverse impacts to any property outside of the requester and demonstrates a no
adverse impact to the 1% AC UD water surface elevation outside of the requestor’s property limits.
For streams which have a drainage area greater than 150 acres and currently not‐mapped by FEMA, the
City requires the requestor to submit a flood study report which is signed and sealed by a Professional
Engineer registered in the State of Texas, which establishes a 1% AC UD floodplain along, within or
adjacent to the project site and plat the floodplain delineation as a drainage easement.
2.3.2 Compensatory–ExcavationThe City’s goal is conservation of floodplain areas, avoid potential impacts on structures adjacent to the
currently mapped floodplains and ensure no net‐loss of floodplain volume to preserve the area of
conveyance. As such, the City will require Compensatory‐Cut, also known as Compensatory‐Excavation
to offset/mitigate lost floodplain volume due to fill placed in the 1% Annual Chance (AC) Ultimate
Development (UD) floodplain. The City permits excavation in the floodplain to mitigate the increases to
1% AC UD water surface elevations, in additional to excavation compensation along the same flooding
source and must be within the general vicinity of the fill being placed. All submittals must include a
signed drawing by a licensed Professional Engineer clearly marking the areas of Cut and Fill in the
floodplain and should also include a table showing both volumes, indicating total Cut volume higher
than total Fill volume placed in the 1% AC UD floodplain established for the site.
If excavation is performed in the floodplain, the City requires a signed and sealed report/memo from a
Professional Engineer registered to practice in the State of Texas to demonstrate excavation is
performed outside of the Waters of the United States (WOUS) also known as Jurisdictional Waters,
including an exhibit clearly showing the Jurisdictional Delineation. If WOUS are impacted by the project,
the City will require evidence of coordination and approval from the US Army Corps of Engineers.
2‐6
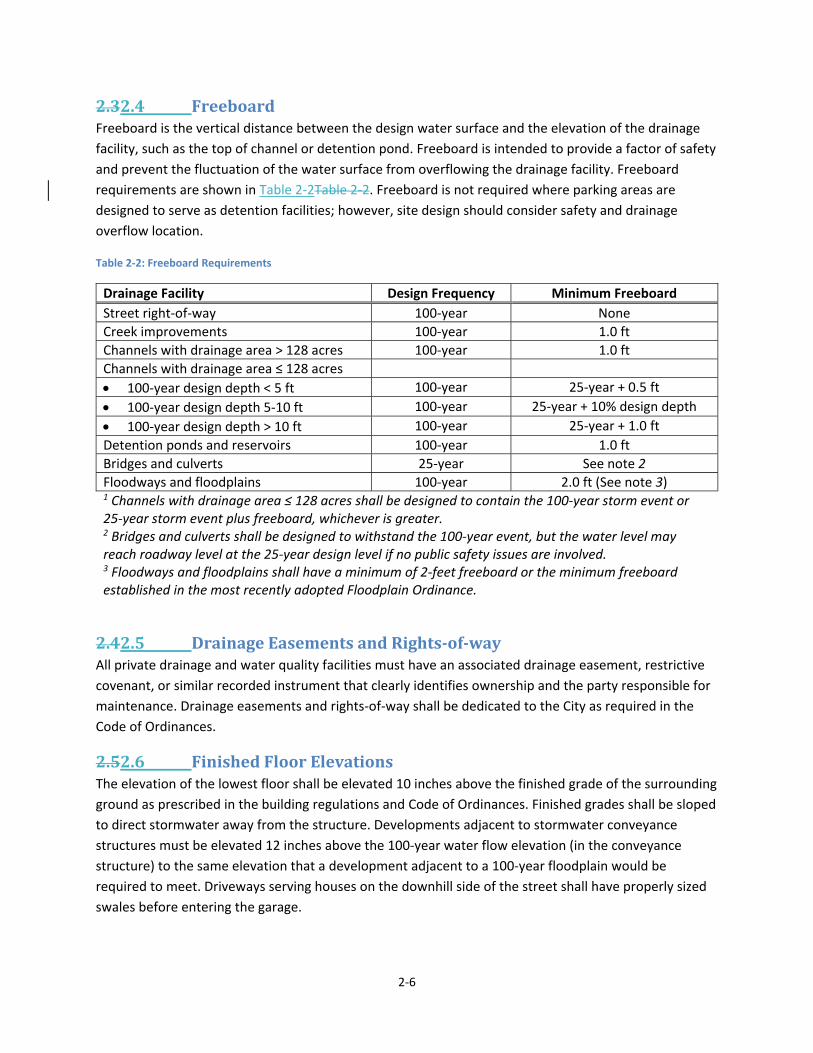
2.32.4 FreeboardFreeboard is the vertical distance between the design water surface and the elevation of the drainage
facility, such as the top of channel or detention pond. Freeboard is intended to provide a factor of safety
and prevent the fluctuation of the water surface from overflowing the drainage facility. Freeboard
requirements are shown in Table 2‐2Table 2‐2. Freeboard is not required where parking areas are
designed to serve as detention facilities; however, site design should consider safety and drainage
overflow location.
Table 2‐2: Freeboard Requirements
Drainage Facility Design Frequency Minimum Freeboard
Street right‐of‐way 100‐year None
Creek improvements 100‐year 1.0 ft
Channels with drainage area > 128 acres 100‐year 1.0 ft
Channels with drainage area ≤ 128 acres
100‐year design depth < 5 ft 100‐year 25‐year + 0.5 ft
100‐year design depth 5‐10 ft 100‐year 25‐year + 10% design depth
100‐year design depth > 10 ft 100‐year 25‐year + 1.0 ft
Detention ponds and reservoirs 100‐year 1.0 ft
Bridges and culverts 25‐year See note 2
Floodways and floodplains 100‐year 2.0 ft (See note 3) 1 Channels with drainage area ≤ 128 acres shall be designed to contain the 100‐year storm event or 25‐year storm event plus freeboard, whichever is greater. 2 Bridges and culverts shall be designed to withstand the 100‐year event, but the water level may reach roadway level at the 25‐year design level if no public safety issues are involved. 3 Floodways and floodplains shall have a minimum of 2‐feet freeboard or the minimum freeboard established in the most recently adopted Floodplain Ordinance.
2.42.5 DrainageEasementsandRights‐of‐wayAll private drainage and water quality facilities must have an associated drainage easement, restrictive
covenant, or similar recorded instrument that clearly identifies ownership and the party responsible for
maintenance. Drainage easements and rights‐of‐way shall be dedicated to the City as required in the
Code of Ordinances.
2.52.6 FinishedFloorElevationsThe elevation of the lowest floor shall be elevated 10 inches above the finished grade of the surrounding
ground as prescribed in the building regulations and Code of Ordinances. Finished grades shall be sloped
to direct stormwater away from the structure. Developments adjacent to stormwater conveyance
structures must be elevated 12 inches above the 100‐year water flow elevation (in the conveyance
structure) to the same elevation that a development adjacent to a 100‐year floodplain would be
required to meet. Driveways serving houses on the downhill side of the street shall have properly sized
swales before entering the garage.
2‐7
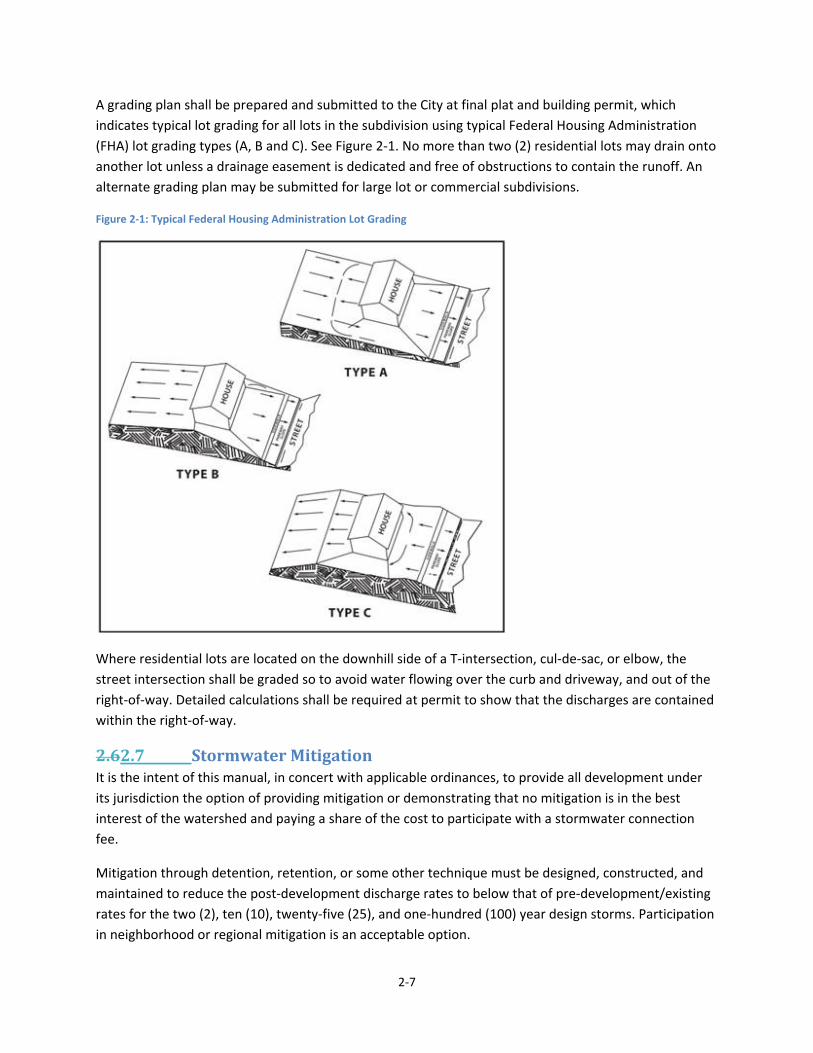
A grading plan shall be prepared and submitted to the City at final plat and building permit, which
indicates typical lot grading for all lots in the subdivision using typical Federal Housing Administration
(FHA) lot grading types (A, B and C). See Figure 2‐1. No more than two (2) residential lots may drain onto
another lot unless a drainage easement is dedicated and free of obstructions to contain the runoff. An
alternate grading plan may be submitted for large lot or commercial subdivisions.
Figure 2‐1: Typical Federal Housing Administration Lot Grading
Where residential lots are located on the downhill side of a T‐intersection, cul‐de‐sac, or elbow, the
street intersection shall be graded so to avoid water flowing over the curb and driveway, and out of the
right‐of‐way. Detailed calculations shall be required at permit to show that the discharges are contained
within the right‐of‐way.
2.62.7 StormwaterMitigationIt is the intent of this manual, in concert with applicable ordinances, to provide all development under
its jurisdiction the option of providing mitigation or demonstrating that no mitigation is in the best
interest of the watershed and paying a share of the cost to participate with a stormwater connection
fee.
Mitigation through detention, retention, or some other technique must be designed, constructed, and
maintained to reduce the post‐development discharge rates to below that of pre‐development/existing
rates for the two (2), ten (10), twenty‐five (25), and one‐hundred (100) year design storms. Participation
in neighborhood or regional mitigation is an acceptable option.

2‐8
Demonstration that no mitigation is in the best interest of the watershed shall be accomplished by
showing no adverse impact due to any increased runoff from the proposed development for the design
storms. Approval of a Stormwater Connection Fee is required in compliance with Chapter 143 of the
Code of Ordinances. The property owner, or his/her designee, shall meet with the Engineering Division
to discuss mitigation and/or Stormwater Connection Fee options prior to commencing the project.
For stormwater mitigation, the following two development conditions shall be analyzed with each
adverse impact analysis:
A. Existing Conditions. This refers to current development conditions in the watershed and on site.
This shall be used as the baseline for determining the impact of the development of the site, or
the watershed, to other properties or drainage systems.
B. Proposed Conditions. This refers to existing conditions with the proposed development added.
This shall be used to determine if the increased runoff from the proposed development results
in an adverse impact to other properties or drainage systems.
2.72.8 DrainageFacilityDesignDrainage design in the urban environment should also consider appearance as an integral part of the
design and structures should generally blend with the natural surroundings as much as possible to
maintain the aesthetics of the natural area.
The City requires preservation of the natural floodplains. The protection of existing trees and vegetation
should be maximized during development of drainage plans. Whenever possible, the replacement of
the trees destroyed by drainage and flood protection procedures is encouraged.
Computations to support all drainage designs shall be submitted to the Engineering Division for review
in an easy to follow format. On‐site pre‐development stormwater runoff computations shall be based
upon conditions representing the existing land conditions with respect to soil type, percentage cover,
and cover type as indicated by current aerial imagery and supporting documentation. Design of
structures shall use fully developed sub‐basin conditions for the prescribed design storms based on the
sub‐basin zoning. If zoning does not exist, then the engineer shall assume the ultimate development
based on the most recently adopted Future Land Use Plan.
If a development activity changes stormwater runoff characteristics in a manner that creates a point or
points of concentrated flow, where previously there was sheet flow or lesser intensity flow pattern, or
any increase in discharge rates or velocities for the 2, 10, 25 and 100‐year frequency storms, the flow
shall outfall into right‐of‐way or drainage easement that has the capacity for the discharge. An impact
analysis is required to verify the capacity and/or required size of the downstream facility clearly
demonstrating no adverse impact.
In development of engineered retaining walls greater than three feet, drainage facilities shall be
designed in such a manner as to prevent the freefall of stormwater from natural drainage patterns and
sheet flow conditions.
2‐9
The design requirements and criteria are specified in following chapters. Modeling and calculations shall
be included in drainage report submittals to ensure the specified criteria are met for all drainage
infrastructure improvements. Infrastructure that is within TxDOT right‐of‐way and requires dual
permitting from both the City and TxDOT shall be designed in compliance with the more conservative
requirements.
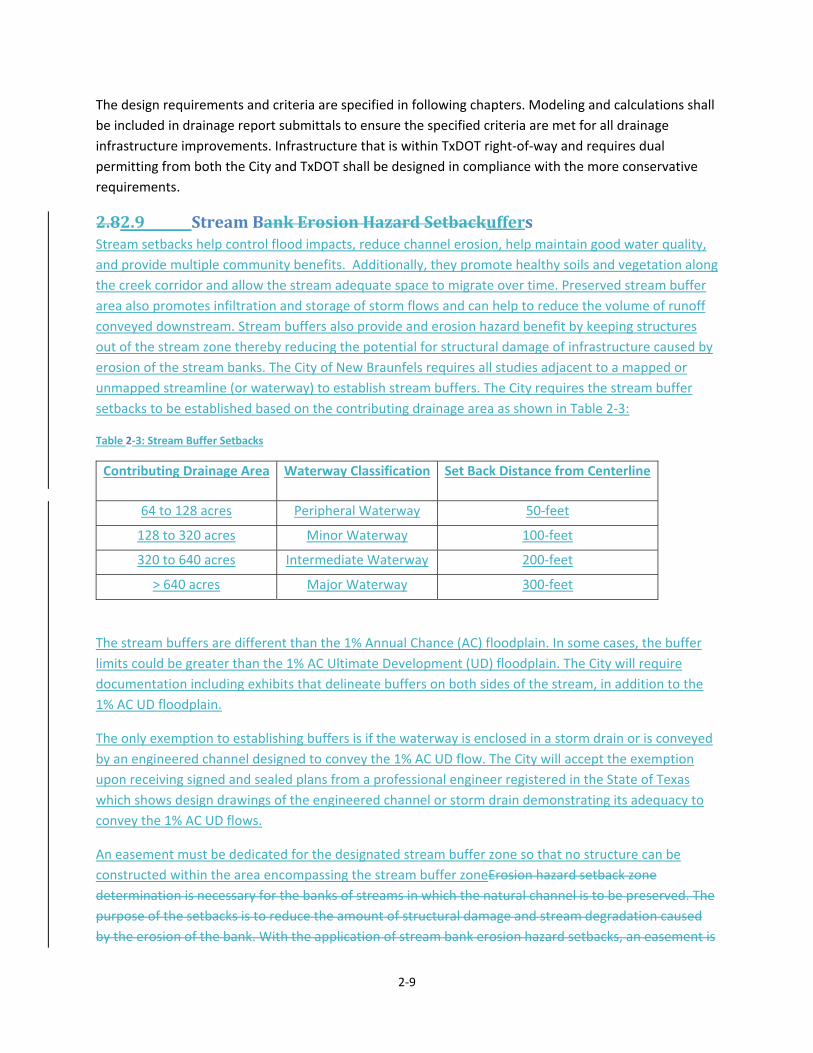
2.82.9 StreamBankErosionHazardSetbackuffersStream setbacks help control flood impacts, reduce channel erosion, help maintain good water quality,
and provide multiple community benefits. Additionally, they promote healthy soils and vegetation along
the creek corridor and allow the stream adequate space to migrate over time. Preserved stream buffer
area also promotes infiltration and storage of storm flows and can help to reduce the volume of runoff
conveyed downstream. Stream buffers also provide and erosion hazard benefit by keeping structures
out of the stream zone thereby reducing the potential for structural damage of infrastructure caused by
erosion of the stream banks. The City of New Braunfels requires all studies adjacent to a mapped or
unmapped streamline (or waterway) to establish stream buffers. The City requires the stream buffer
setbacks to be established based on the contributing drainage area as shown in Table 2‐3:
Table 2‐3: Stream Buffer Setbacks
Contributing Drainage Area Waterway Classification Set Back Distance from Centerline
64 to 128 acres Peripheral Waterway 50‐feet
128 to 320 acres Minor Waterway 100‐feet
320 to 640 acres Intermediate Waterway 200‐feet
> 640 acres Major Waterway 300‐feet
The stream buffers are different than the 1% Annual Chance (AC) floodplain. In some cases, the buffer
limits could be greater than the 1% AC Ultimate Development (UD) floodplain. The City will require
documentation including exhibits that delineate buffers on both sides of the stream, in addition to the
1% AC UD floodplain.
The only exemption to establishing buffers is if the waterway is enclosed in a storm drain or is conveyed
by an engineered channel designed to convey the 1% AC UD flow. The City will accept the exemption
upon receiving signed and sealed plans from a professional engineer registered in the State of Texas
which shows design drawings of the engineered channel or storm drain demonstrating its adequacy to
convey the 1% AC UD flows.
An easement must be dedicated for the designated stream buffer zone so that no structure can be
constructed within the area encompassing the stream buffer zoneErosion hazard setback zone
determination is necessary for the banks of streams in which the natural channel is to be preserved. The
purpose of the setbacks is to reduce the amount of structural damage and stream degradation caused
by the erosion of the bank. With the application of stream bank erosion hazard setbacks, an easement is
2‐10
dedicated to the City such that no structure can be located, constructed, or maintained in the area
encompassing the erosion hazard setback.
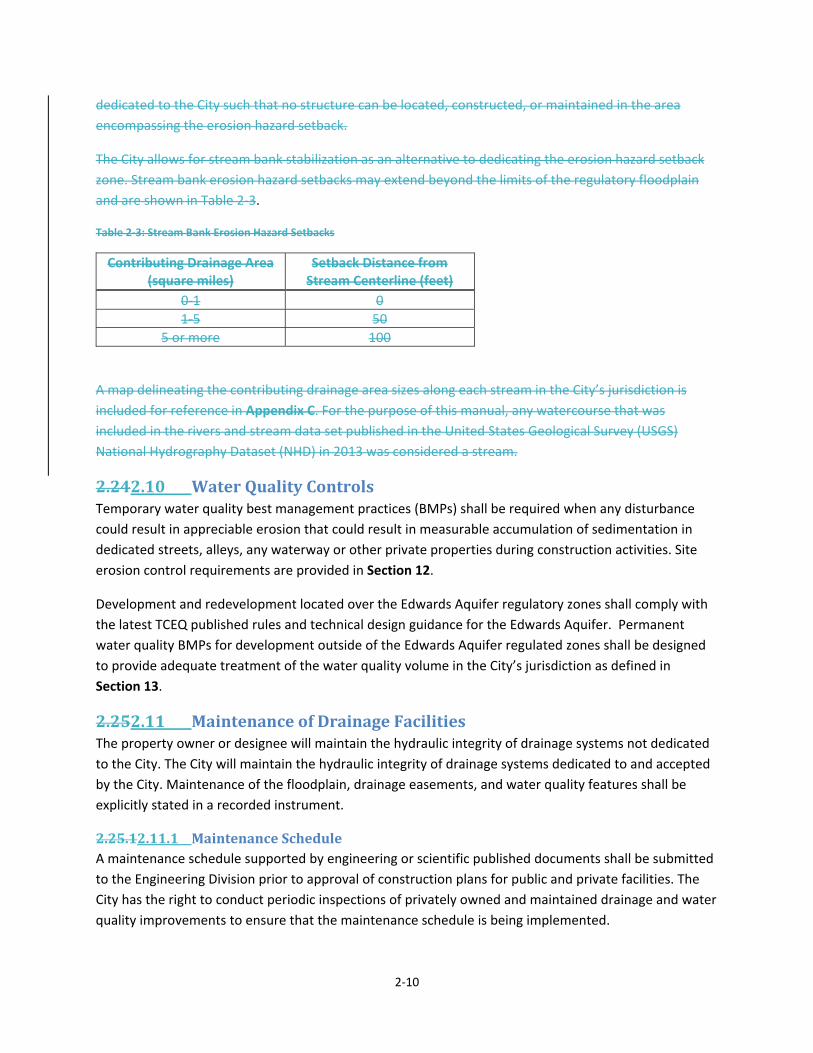
The City allows for stream bank stabilization as an alternative to dedicating the erosion hazard setback
zone. Stream bank erosion hazard setbacks may extend beyond the limits of the regulatory floodplain
and are shown in Table 2‐3.
Table 2‐3: Stream Bank Erosion Hazard Setbacks
Contributing Drainage Area (square miles)
Setback Distance from Stream Centerline (feet)
0‐1 0
1‐5 50
5 or more 100
A map delineating the contributing drainage area sizes along each stream in the City’s jurisdiction is
included for reference in Appendix C. For the purpose of this manual, any watercourse that was
included in the rivers and stream data set published in the United States Geological Survey (USGS)
National Hydrography Dataset (NHD) in 2013 was considered a stream.
2.242.10 WaterQualityControlsTemporary water quality best management practices (BMPs) shall be required when any disturbance
could result in appreciable erosion that could result in measurable accumulation of sedimentation in
dedicated streets, alleys, any waterway or other private properties during construction activities. Site
erosion control requirements are provided in Section 12.
Development and redevelopment located over the Edwards Aquifer regulatory zones shall comply with
the latest TCEQ published rules and technical design guidance for the Edwards Aquifer. Permanent
water quality BMPs for development outside of the Edwards Aquifer regulated zones shall be designed
to provide adequate treatment of the water quality volume in the City’s jurisdiction as defined in
Section 13.
2.252.11 MaintenanceofDrainageFacilitiesThe property owner or designee will maintain the hydraulic integrity of drainage systems not dedicated
to the City. The City will maintain the hydraulic integrity of drainage systems dedicated to and accepted
by the City. Maintenance of the floodplain, drainage easements, and water quality features shall be
explicitly stated in a recorded instrument.
2.25.12.11.1 MaintenanceScheduleA maintenance schedule supported by engineering or scientific published documents shall be submitted
to the Engineering Division prior to approval of construction plans for public and private facilities. The
City has the right to conduct periodic inspections of privately owned and maintained drainage and water
quality improvements to ensure that the maintenance schedule is being implemented.

2‐11
2.25.22.11.2 MaintenanceAccessAccess shall be provided for all channels to allow equipment access for maintenance. Access shall have a
width of at least 12 feet and a cross slope no greater than two percent. Maintenance ramps used for
access shall have a vertical grade no steeper than 6:1. An unobstructed access easement connecting the
channel drainage easement with a roadway parallel to or near the easement shall be provided at a
minimum spacing of one access easement at a minimum of 1,000 feet intervals. Access shall be provided
within dedicated right‐of‐way or within the drainage easement dedicated for the channel. The bottom
of the channel cannot be considered as maintenance access.
2.262.12 PumpedDrainageFacilitiesThe City of New Braunfels discourages the use of Pumped Drainage Facilities. A Pumped Drainage
Facility is defined as any drainage system not wholly utilizing gravity outflow. Facility designs considered
under this section’s guidelines must first demonstrate that a gravity system is not feasible from both an
engineering and economic standpoint. A feasibility analysis is required to be submitted prior to permit
application. The applicant must have expressed written approval from the City Engineer and
Engineering Division with permit application.
Pumped Drainage Facilities will only be acceptable in commercial applications and must meet all other
drainage requirements outlined in this manual. All approved Pumped Drainage Facilities must be
privately owned and maintained. The owner assumes responsibility for any damage to property as a
result of a system’s normal operation or failure.
2.26.12.12.1 DesignRequirementsIf approved by the Engineering Division, Pumped Drainage Facilities design submittals should include the
following items:
A. Pump discharge shall be used for a maximum of 50% of the total required basin capacity, not
including freeboard. The remaining volume must discharge by gravity.
B. A minimum of two (2) pumps will be provided, each of which is sized to pump the designed flow
rate.
C. Provide an emergency power source for the drainage facility pumps.
D. Design should include but not be limited to controls, pumps, cycling and anti‐vandalism
measures.
E. Facility discharge must be into an existing right‐of‐way or drainage easement that has the
capacity for the increase discharge.
F. Provide an armored gravity emergency outflow structure designed to allow the outflow of the
100‐year design storm, assuming the pond is full and the discharge is 100% clogged. At
minimum, the emergency overflow shall engage when ponding exceeds the 100‐year water
surface elevation plus freeboard.
2.26.22.12.2 MaintenanceandOperationsA maintenance and operations plan shall be submitted to the Engineering Division prior to approval of
construction plans for all facilities. The City has the right to conduct periodic inspections of privately

2‐12
owned and maintained drainage improvements to ensure that the maintenance schedule is being
implemented.

2‐13
This page intentionally left blank.
3‐1
3 DesignRainfall
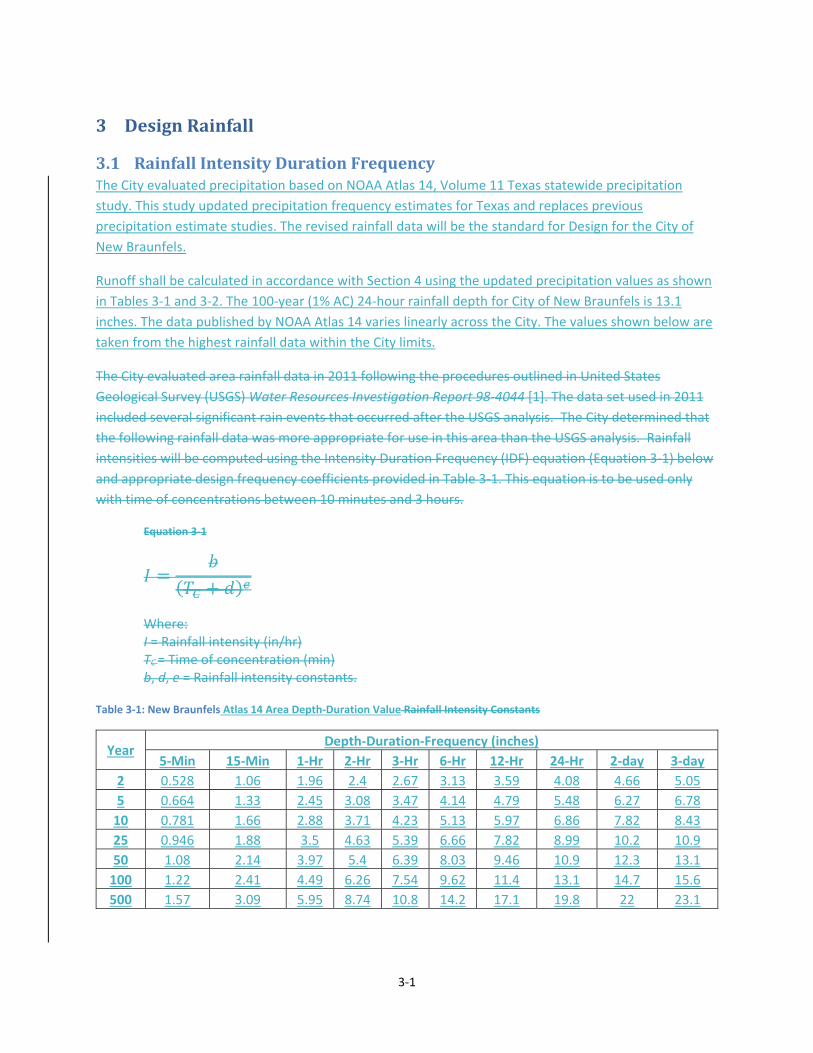
3.1 RainfallIntensityDurationFrequencyThe City evaluated precipitation based on NOAA Atlas 14, Volume 11 Texas statewide precipitation
study. This study updated precipitation frequency estimates for Texas and replaces previous
precipitation estimate studies. The revised rainfall data will be the standard for Design for the City of
New Braunfels.
Runoff shall be calculated in accordance with Section 4 using the updated precipitation values as shown
in Tables 3‐1 and 3‐2. The 100‐year (1% AC) 24‐hour rainfall depth for City of New Braunfels is 13.1
inches. The data published by NOAA Atlas 14 varies linearly across the City. The values shown below are
taken from the highest rainfall data within the City limits.
The City evaluated area rainfall data in 2011 following the procedures outlined in United States
Geological Survey (USGS) Water Resources Investigation Report 98‐4044 [1]. The data set used in 2011
included several significant rain events that occurred after the USGS analysis. The City determined that
the following rainfall data was more appropriate for use in this area than the USGS analysis. Rainfall
intensities will be computed using the Intensity Duration Frequency (IDF) equation (Equation 3‐1) below
and appropriate design frequency coefficients provided in Table 3‐1. This equation is to be used only
with time of concentrations between 10 minutes and 3 hours.
Equation 3‐1
𝐼𝑏
𝑇 𝑑
Where: I = Rainfall intensity (in/hr) TC = Time of concentration (min) b, d, e = Rainfall intensity constants.
Table 3‐1: New Braunfels Atlas 14 Area Depth‐Duration Value Rainfall Intensity Constants
Year Depth‐Duration‐Frequency (inches)
5‐Min 15‐Min 1‐Hr 2‐Hr 3‐Hr 6‐Hr 12‐Hr 24‐Hr 2‐day 3‐day
2 0.528 1.06 1.96 2.4 2.67 3.13 3.59 4.08 4.66 5.05
5 0.664 1.33 2.45 3.08 3.47 4.14 4.79 5.48 6.27 6.78
10 0.781 1.66 2.88 3.71 4.23 5.13 5.97 6.86 7.82 8.43
25 0.946 1.88 3.5 4.63 5.39 6.66 7.82 8.99 10.2 10.9
50 1.08 2.14 3.97 5.4 6.39 8.03 9.46 10.9 12.3 13.1
100 1.22 2.41 4.49 6.26 7.54 9.62 11.4 13.1 14.7 15.6
500 1.57 3.09 5.95 8.74 10.8 14.2 17.1 19.8 22 23.1
3‐2
Table 3‐2 shows rainfall intensities by storm event. The intensities were calculated based off the depth
duration table for each frequency storm. Durations range from 5 minutes up to 1 day for recurrence
intervals from the 2‐year to 500‐year storm events, which will be the standard design for New Braunfels.
The City requires all flood study submittals to be performed using rainfall data presented in the
document. If a FEMA submittal is required for the purpose of a map revision or amendment such as a
Conditional Letter of Map Revision (CLOMR) or Letter of Map Revision (LOMR) or a Letter of Map
Amendment (LOMA), FEMA will require the hydrologic and hydraulic models to be updated based on
the information used for the Current Effective Flood Insurance Study (FIS). In which case, the City
requires two separate submittals. One, which uses FEMA data and will be submitted for FEMA map
revisions and incorporation upon City Floodplain Administrator’s (FPA) approval; another which uses the
guidelines published in this manual and will be submitted for review and approval by the City Engineer
or his/her designee.
Regardless of a FEMA submittal, the City will require a signed and sealed memo or report, summarizing
the hydrologic and hydraulic analysis as illustrated in this manual, for all improvements adjacent to a
mapped or un‐mapped stream with a contributing drainage area greater than 200 acres.
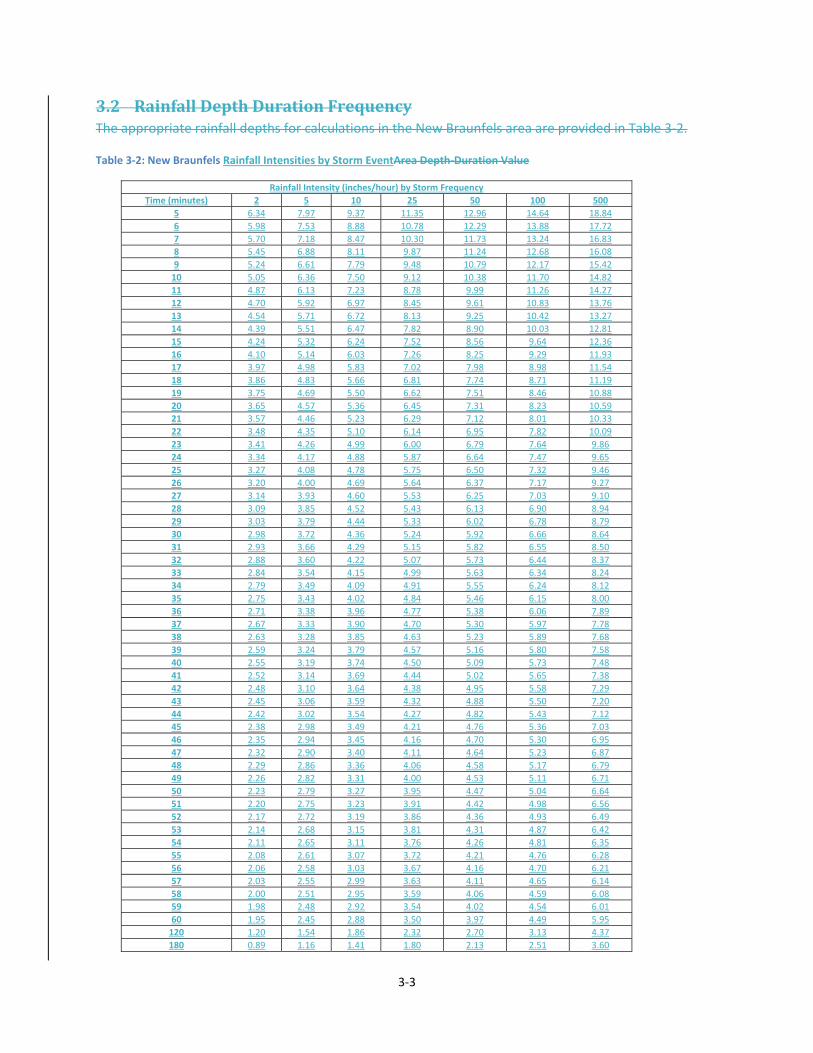
3‐3
3.2 RainfallDepthDurationFrequencyThe appropriate rainfall depths for calculations in the New Braunfels area are provided in Table 3‐2.
Table 3‐2: New Braunfels Rainfall Intensities by Storm EventArea Depth‐Duration Value
Rainfall Intensity (inches/hour) by Storm Frequency
Time (minutes) 2 5 10 25 50 100 500
5 6.34 7.97 9.37 11.35 12.96 14.64 18.84
6 5.98 7.53 8.88 10.78 12.29 13.88 17.72
7 5.70 7.18 8.47 10.30 11.73 13.24 16.83
8 5.45 6.88 8.11 9.87 11.24 12.68 16.08
9 5.24 6.61 7.79 9.48 10.79 12.17 15.42
10 5.05 6.36 7.50 9.12 10.38 11.70 14.82
11 4.87 6.13 7.23 8.78 9.99 11.26 14.27
12 4.70 5.92 6.97 8.45 9.61 10.83 13.76
13 4.54 5.71 6.72 8.13 9.25 10.42 13.27
14 4.39 5.51 6.47 7.82 8.90 10.03 12.81
15 4.24 5.32 6.24 7.52 8.56 9.64 12.36
16 4.10 5.14 6.03 7.26 8.25 9.29 11.93
17 3.97 4.98 5.83 7.02 7.98 8.98 11.54
18 3.86 4.83 5.66 6.81 7.74 8.71 11.19
19 3.75 4.69 5.50 6.62 7.51 8.46 10.88
20 3.65 4.57 5.36 6.45 7.31 8.23 10.59
21 3.57 4.46 5.23 6.29 7.12 8.01 10.33
22 3.48 4.35 5.10 6.14 6.95 7.82 10.09
23 3.41 4.26 4.99 6.00 6.79 7.64 9.86
24 3.34 4.17 4.88 5.87 6.64 7.47 9.65
25 3.27 4.08 4.78 5.75 6.50 7.32 9.46
26 3.20 4.00 4.69 5.64 6.37 7.17 9.27
27 3.14 3.93 4.60 5.53 6.25 7.03 9.10
28 3.09 3.85 4.52 5.43 6.13 6.90 8.94
29 3.03 3.79 4.44 5.33 6.02 6.78 8.79
30 2.98 3.72 4.36 5.24 5.92 6.66 8.64
31 2.93 3.66 4.29 5.15 5.82 6.55 8.50
32 2.88 3.60 4.22 5.07 5.73 6.44 8.37
33 2.84 3.54 4.15 4.99 5.63 6.34 8.24
34 2.79 3.49 4.09 4.91 5.55 6.24 8.12
35 2.75 3.43 4.02 4.84 5.46 6.15 8.00
36 2.71 3.38 3.96 4.77 5.38 6.06 7.89
37 2.67 3.33 3.90 4.70 5.30 5.97 7.78
38 2.63 3.28 3.85 4.63 5.23 5.89 7.68
39 2.59 3.24 3.79 4.57 5.16 5.80 7.58
40 2.55 3.19 3.74 4.50 5.09 5.73 7.48
41 2.52 3.14 3.69 4.44 5.02 5.65 7.38
42 2.48 3.10 3.64 4.38 4.95 5.58 7.29
43 2.45 3.06 3.59 4.32 4.88 5.50 7.20
44 2.42 3.02 3.54 4.27 4.82 5.43 7.12
45 2.38 2.98 3.49 4.21 4.76 5.36 7.03
46 2.35 2.94 3.45 4.16 4.70 5.30 6.95
47 2.32 2.90 3.40 4.11 4.64 5.23 6.87
48 2.29 2.86 3.36 4.06 4.58 5.17 6.79
49 2.26 2.82 3.31 4.00 4.53 5.11 6.71
50 2.23 2.79 3.27 3.95 4.47 5.04 6.64
51 2.20 2.75 3.23 3.91 4.42 4.98 6.56
52 2.17 2.72 3.19 3.86 4.36 4.93 6.49
53 2.14 2.68 3.15 3.81 4.31 4.87 6.42
54 2.11 2.65 3.11 3.76 4.26 4.81 6.35
55 2.08 2.61 3.07 3.72 4.21 4.76 6.28
56 2.06 2.58 3.03 3.67 4.16 4.70 6.21
57 2.03 2.55 2.99 3.63 4.11 4.65 6.14
58 2.00 2.51 2.95 3.59 4.06 4.59 6.08
59 1.98 2.48 2.92 3.54 4.02 4.54 6.01
60 1.95 2.45 2.88 3.50 3.97 4.49 5.95
120 1.20 1.54 1.86 2.32 2.70 3.13 4.37
180 0.89 1.16 1.41 1.80 2.13 2.51 3.60

3‐4
240 0.71 0.93 1.14 1.47 1.75 2.08 3.02
360 0.52 0.69 0.85 1.11 1.34 1.60 2.37
720 0.30 0.40 0.50 0.65 0.79 0.95 1.43
1440 0.17 0.23 0.29 0.37 0.45 0.55 0.83
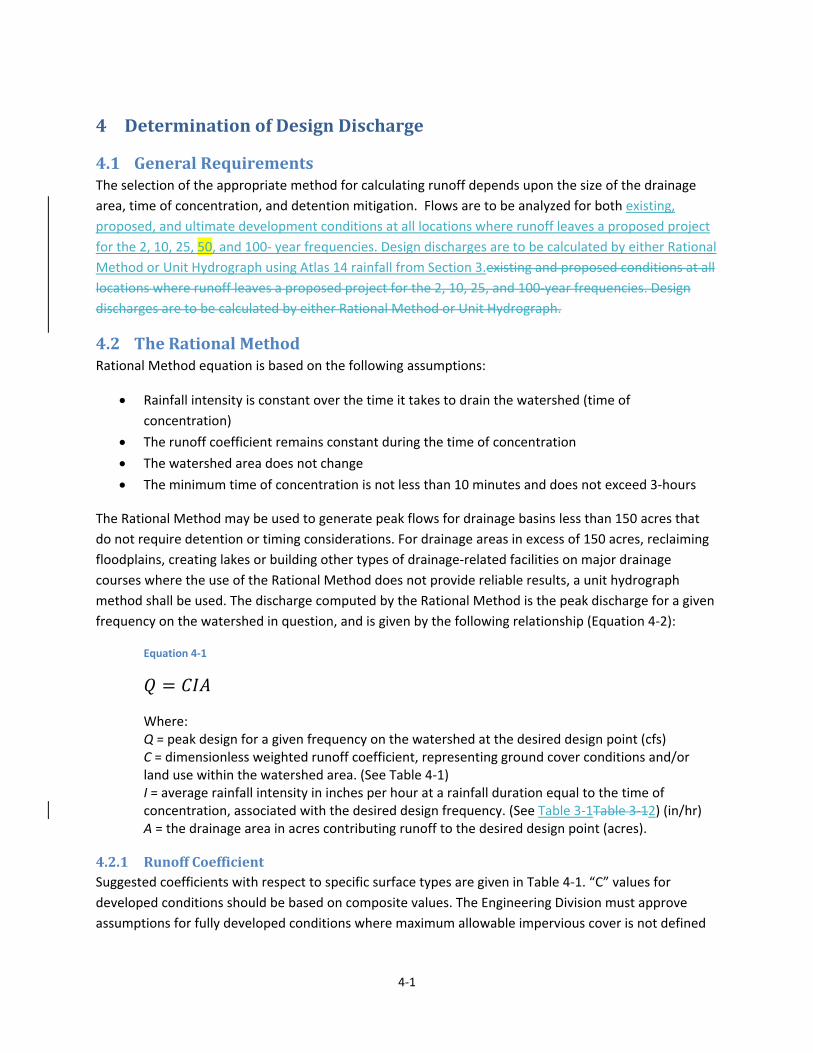
4‐1
4 DeterminationofDesignDischarge
4.1 GeneralRequirementsThe selection of the appropriate method for calculating runoff depends upon the size of the drainage
area, time of concentration, and detention mitigation. Flows are to be analyzed for both existing,
proposed, and ultimate development conditions at all locations where runoff leaves a proposed project
for the 2, 10, 25, 50, and 100‐ year frequencies. Design discharges are to be calculated by either Rational
Method or Unit Hydrograph using Atlas 14 rainfall from Section 3.existing and proposed conditions at all
locations where runoff leaves a proposed project for the 2, 10, 25, and 100‐year frequencies. Design
discharges are to be calculated by either Rational Method or Unit Hydrograph.
4.2 TheRationalMethodRational Method equation is based on the following assumptions:
Rainfall intensity is constant over the time it takes to drain the watershed (time of
concentration)
The runoff coefficient remains constant during the time of concentration
The watershed area does not change
The minimum time of concentration is not less than 10 minutes and does not exceed 3‐hours
The Rational Method may be used to generate peak flows for drainage basins less than 150 acres that
do not require detention or timing considerations. For drainage areas in excess of 150 acres, reclaiming
floodplains, creating lakes or building other types of drainage‐related facilities on major drainage
courses where the use of the Rational Method does not provide reliable results, a unit hydrograph
method shall be used. The discharge computed by the Rational Method is the peak discharge for a given
frequency on the watershed in question, and is given by the following relationship (Equation 4‐2):
Equation 4‐1
𝑄 𝐶𝐼𝐴
Where: Q = peak design for a given frequency on the watershed at the desired design point (cfs) C = dimensionless weighted runoff coefficient, representing ground cover conditions and/or land use within the watershed area. (See Table 4‐1) I = average rainfall intensity in inches per hour at a rainfall duration equal to the time of concentration, associated with the desired design frequency. (See Table 3‐1Table 3‐12) (in/hr) A = the drainage area in acres contributing runoff to the desired design point (acres).
4.2.1 RunoffCoefficientSuggested coefficients with respect to specific surface types are given in Table 4‐1. “C” values for
developed conditions should be based on composite values. The Engineering Division must approve
assumptions for fully developed conditions where maximum allowable impervious cover is not defined
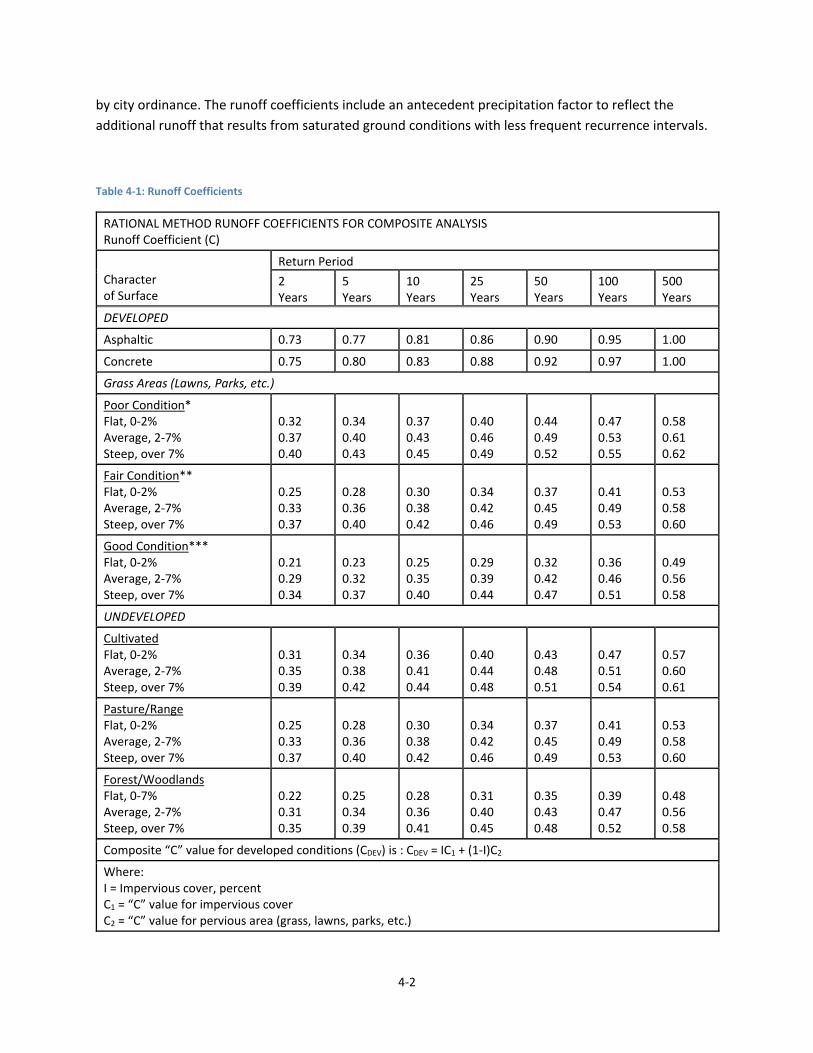
4‐2
by city ordinance. The runoff coefficients include an antecedent precipitation factor to reflect the
additional runoff that results from saturated ground conditions with less frequent recurrence intervals.
Table 4‐1: Runoff Coefficients
RATIONAL METHOD RUNOFF COEFFICIENTS FOR COMPOSITE ANALYSIS Runoff Coefficient (C)
Character of Surface
Return Period
2 Years
5 Years
10 Years
25 Years
50 Years
100 Years
500 Years
DEVELOPED
Asphaltic 0.73 0.77 0.81 0.86 0.90 0.95 1.00
Concrete 0.75 0.80 0.83 0.88 0.92 0.97 1.00
Grass Areas (Lawns, Parks, etc.)
Poor Condition* Flat, 0‐2% Average, 2‐7% Steep, over 7%
0.32 0.37 0.40
0.34 0.40 0.43
0.37 0.43 0.45
0.40 0.46 0.49
0.44 0.49 0.52
0.47 0.53 0.55
0.58 0.61 0.62
Fair Condition** Flat, 0‐2% Average, 2‐7% Steep, over 7%
0.25 0.33 0.37
0.28 0.36 0.40
0.30 0.38 0.42
0.34 0.42 0.46
0.37 0.45 0.49
0.41 0.49 0.53
0.53 0.58 0.60
Good Condition*** Flat, 0‐2% Average, 2‐7% Steep, over 7%
0.21 0.29 0.34
0.23 0.32 0.37
0.25 0.35 0.40
0.29 0.39 0.44
0.32 0.42 0.47
0.36 0.46 0.51
0.49 0.56 0.58
UNDEVELOPED
Cultivated Flat, 0‐2% Average, 2‐7% Steep, over 7%
0.31 0.35 0.39
0.34 0.38 0.42
0.36 0.41 0.44
0.40 0.44 0.48
0.43 0.48 0.51
0.47 0.51 0.54
0.57 0.60 0.61
Pasture/Range Flat, 0‐2% Average, 2‐7% Steep, over 7%
0.25 0.33 0.37
0.28 0.36 0.40
0.30 0.38 0.42
0.34 0.42 0.46
0.37 0.45 0.49
0.41 0.49 0.53
0.53 0.58 0.60
Forest/Woodlands Flat, 0‐7% Average, 2‐7% Steep, over 7%
0.22 0.31 0.35
0.25 0.34 0.39
0.28 0.36 0.41
0.31 0.40 0.45
0.35 0.43 0.48
0.39 0.47 0.52
0.48 0.56 0.58
Composite “C” value for developed conditions (CDEV) is : CDEV = IC1 + (1‐I)C2
Where: I = Impervious cover, percent C1 = “C” value for impervious cover C2 = “C” value for pervious area (grass, lawns, parks, etc.)

4‐3
RATIONAL METHOD RUNOFF COEFFICIENTS FOR COMPOSITE ANALYSIS Runoff Coefficient (C)
Character of Surface
Return Period
2 Years
5 Years
10 Years
25 Years
50 Years
100 Years
500 Years
* Grass cover less than 50 percent of the area. ** Grass cover on 50 to 75 percent of the area. *** Grass cover larger than 75 percent of the area.
Source: City of Austin Drainage Criteria Manual [2]
The drainage area under investigation may consist of several different drainage surfaces or zoning
classifications. In such cases, an average coefficient weighted in accordance with the respective areas
shall be used, as outlined in Equation 4‐2.
Equation 4‐2
𝐶𝐴 𝐶 𝐴 𝐶 ⋯𝐴 𝐶𝐴 𝐴 𝐴 ⋯𝐴
4.2.2 TimeofConcentrationThe time of concentration (TC) is the amount of time required for surface runoff to travel from the most
hydraulically remote point within the drainage basin to the drainage point under consideration. The
most hydraulically remote drainage point refers to the route requiring the longest drainage travel time
and not necessarily the greatest linear distance. Furthermore, the most hydraulically remote point must
be taken from a location that best represents the majority of the contributing area.
The Natural Resources Conservation Service (NRCS) method in Technical Release 55: Urban Hydrology
for Small Watersheds (TR‐55) [3] is the preferred method for estimating time of concentration, unless
the design engineer can justify why an alternative method is more suitable for the watershed under
analysis. Other methodologies can be used but must be approved by the Engineering Division.
The procedure for estimating time of concentration, as described in TR‐55, is outlined below. The overall
time of concentration is calculated as the sum of the sheet, shallow concentrated and channel flow
travel times as shown in Equation 4‐3. Note that there may be multiple shallow concentrated and
channel segments depending on the nature of the flow path.
Equation 4‐3
𝑇 𝑇 𝑇 𝑇
SheetFlowSheet flow is shallow flow over land surfaces, which usually occurs in the headwaters of streams. The
engineer should realize that sheet flow occurs for only very short distances, especially in urbanized
conditions. Sheet flow for both natural (undeveloped) and developed conditions should be limited to a
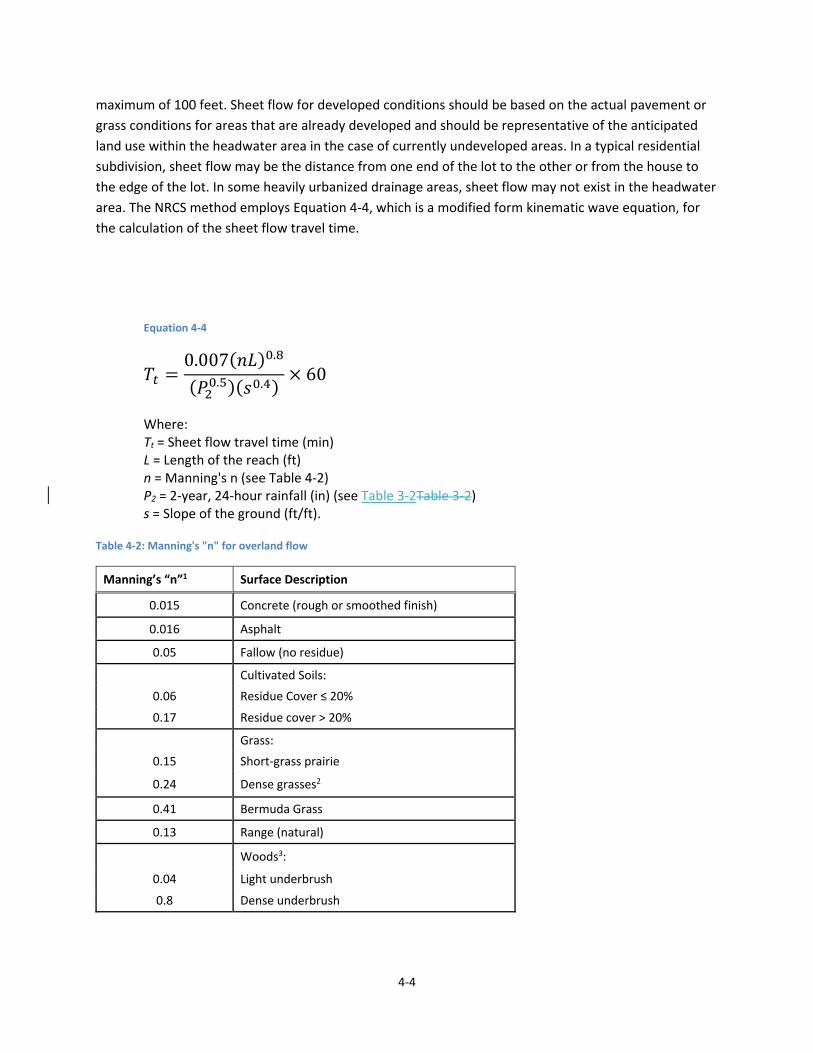
4‐4
maximum of 100 feet. Sheet flow for developed conditions should be based on the actual pavement or
grass conditions for areas that are already developed and should be representative of the anticipated
land use within the headwater area in the case of currently undeveloped areas. In a typical residential
subdivision, sheet flow may be the distance from one end of the lot to the other or from the house to
the edge of the lot. In some heavily urbanized drainage areas, sheet flow may not exist in the headwater
area. The NRCS method employs Equation 4‐4, which is a modified form kinematic wave equation, for
the calculation of the sheet flow travel time.
Equation 4‐4
𝑇0.007 𝑛𝐿 .
𝑃 . 𝑠 .60
Where: Tt = Sheet flow travel time (min) L = Length of the reach (ft) n = Manning's n (see Table 4‐2) P2 = 2‐year, 24‐hour rainfall (in) (see Table 3‐2Table 3‐2) s = Slope of the ground (ft/ft).
Table 4‐2: Manning's "n" for overland flow
Manning’s “n”1 Surface Description
0.015 Concrete (rough or smoothed finish)
0.016 Asphalt
0.05 Fallow (no residue)
Cultivated Soils:
0.06 Residue Cover ≤ 20%
0.17 Residue cover > 20%
Grass:
0.15 Short‐grass prairie
0.24 Dense grasses2
0.41 Bermuda Grass
0.13 Range (natural)
Woods3:
0.04 Light underbrush
0.8 Dense underbrush
4‐5
1 The Manning’s n values are a composite of information compiled by Engman (1986).
2 Includes species such as weeping lovegrass, bluegrass, buffalo grass, blue grama grass, and native grass mixtures.
3 When selecting n, consider cover to a height of about 0.1 ft. This is the only part of the plant cover that will obstruct sheet flow.
Source: City of Austin Drainage Criteria Manual [2] and TR‐55 [3]
ShallowConcentratedFlowAfter a maximum of approximately 100 feet, sheet flow usually becomes shallow concentrated flow
collecting in swales, small rills, and gullies. Shallow concentrated flow is assumed not to have a well‐
defined channel and has flow depths of 0.1 to 0.5 feet. The travel time for shallow concentrated flows
can be computed by Equation 4‐5 and Equation 4‐6. These two equations are based on the solution of
Manning’s Equation with different assumptions for n (Manning’s Roughness Coefficient) and r (hydraulic
radius, ft). For unpaved areas, n is 0.05 and r is 0.4; for paved areas, n is 0.025 and r is 0.2.
Equation 4‐5 : Unpaved
𝑇 𝐿
60 16.1345 𝑠 .
Equation 4‐6: Paved
𝑇 𝐿
60 20.3282 𝑠 .
Where: Tt = Travel time for shallow concentrated flows (min) L = Length of the reach (ft) s = Slope of the ground (ft/ft).
4.2.3 ChannelorStormDrainFlowThe velocity in an open channel or a storm drain not flowing full can be determined by using Manning’s
Equation. Channel velocities can also be determined by using backwater profiles. For open channel flow,
average flow velocity is usually determined by assuming a bank‐full condition. Note that the channel
flow component of the time of concentration may need to be divided into multiple segments in order to
represent significant changes in channel characteristics. The details of using Manning’s Equation and
selecting Manning's "n" values for channels can be obtained from Section 8.
For the storm drain flow under pressure conditions (hydraulic grade line is higher than the lowest crown
of a storm drain) the following equation should be applied:
4‐6
Equation 4‐7
𝑉 𝑄𝐴
Where: V = Average velocity (ft/s) Q = Design discharge (cfs) A = Cross‐sectional area (ft2).
Total travel time through a channel and/or storm drain can be calculated by Equation 4‐8.
Equation 4‐8
𝑇 𝐿
60𝑉
Where: Li = The i‐th channel segment length (ft) Vi = The average flow velocity within the i‐th channel segment (ft/s) Tt = Total flow travel time through the channel (min).
4.3 SCS/NRCSUnitHydrographThe preferred unit hydrograph in general is the Soil Conservation Service (SCS)/Natural Resource
Conservation Service (NRCS) Dimensionless Unit Hydrograph. The runoff curve number(s) used in
calculating the pre‐development/existing condition, the post‐development condition, and the ultimate
development conditioncondition and the post‐development condition shall be documented. Post‐
development conditions, condition of the given site and drainage area after the anticipated
development has taken place, shall be based on the project. A fully developed watershed and the
proposed project shall be assumed for the ultimate development condition based on future zoning
projectionsdrainage area shall be assumed for the post‐development condition. NRCS curve numbers
are to be selected from Table 4‐3. Curve numbers in Table 4‐4 shall be used when performing an
analysis of fully developed conditions. Average antecedent moisture conditions II (AMC II) shall be
assumed.
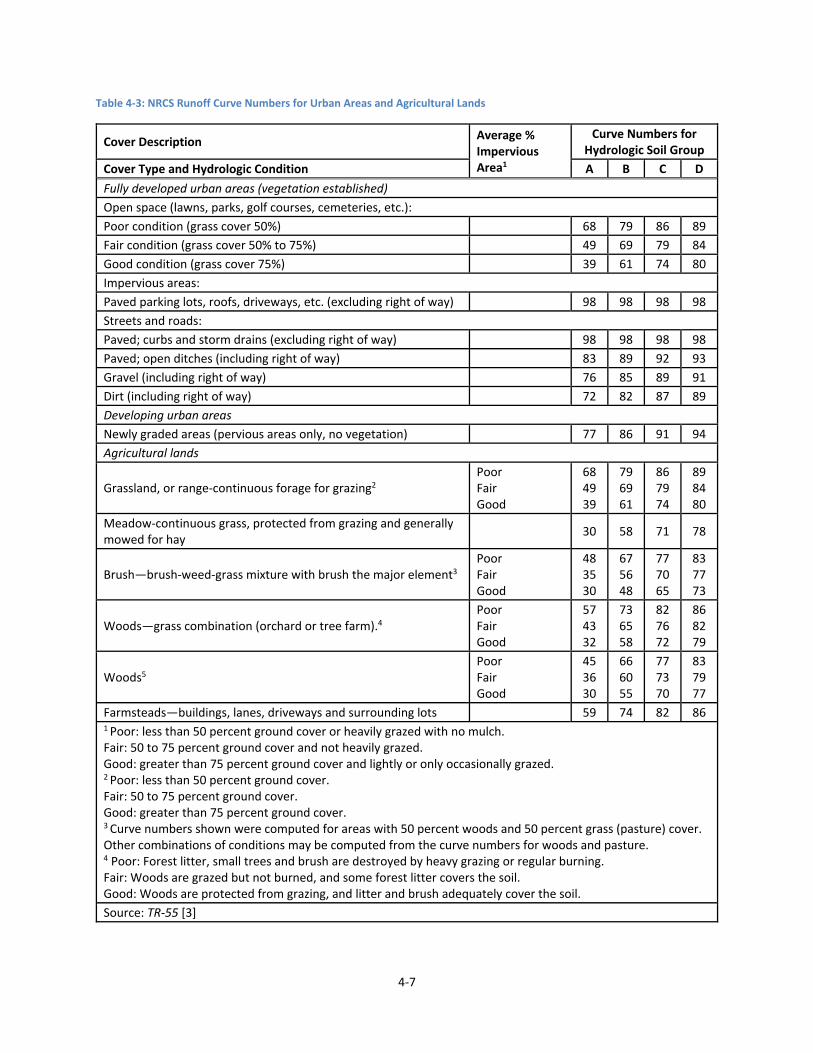
4‐7
Table 4‐3: NRCS Runoff Curve Numbers for Urban Areas and Agricultural Lands
Cover Description Average % Impervious Area1
Curve Numbers for Hydrologic Soil Group
Cover Type and Hydrologic Condition A B C D
Fully developed urban areas (vegetation established)
Open space (lawns, parks, golf courses, cemeteries, etc.):
Poor condition (grass cover 50%) 68 79 86 89
Fair condition (grass cover 50% to 75%) 49 69 79 84
Good condition (grass cover 75%) 39 61 74 80
Impervious areas:
Paved parking lots, roofs, driveways, etc. (excluding right of way) 98 98 98 98
Streets and roads:
Paved; curbs and storm drains (excluding right of way) 98 98 98 98
Paved; open ditches (including right of way) 83 89 92 93
Gravel (including right of way) 76 85 89 91
Dirt (including right of way) 72 82 87 89
Developing urban areas
Newly graded areas (pervious areas only, no vegetation) 77 86 91 94
Agricultural lands
Grassland, or range‐continuous forage for grazing2 Poor Fair Good
68 49 39
79 69 61
86 79 74
89 84 80
Meadow‐continuous grass, protected from grazing and generally mowed for hay
30 58 71 78
Brush—brush‐weed‐grass mixture with brush the major element3 Poor Fair Good
48 35 30
67 56 48
77 70 65
83 77 73
Woods—grass combination (orchard or tree farm).4 Poor Fair Good
57 43 32
73 65 58
82 76 72
86 82 79
Woods5 Poor Fair Good
45 36 30
66 60 55
77 73 70
83 79 77
Farmsteads—buildings, lanes, driveways and surrounding lots 59 74 82 86 1 Poor: less than 50 percent ground cover or heavily grazed with no mulch. Fair: 50 to 75 percent ground cover and not heavily grazed. Good: greater than 75 percent ground cover and lightly or only occasionally grazed. 2 Poor: less than 50 percent ground cover. Fair: 50 to 75 percent ground cover. Good: greater than 75 percent ground cover. 3 Curve numbers shown were computed for areas with 50 percent woods and 50 percent grass (pasture) cover. Other combinations of conditions may be computed from the curve numbers for woods and pasture. 4 Poor: Forest litter, small trees and brush are destroyed by heavy grazing or regular burning. Fair: Woods are grazed but not burned, and some forest litter covers the soil. Good: Woods are protected from grazing, and litter and brush adequately cover the soil.
Source: TR‐55 [3]
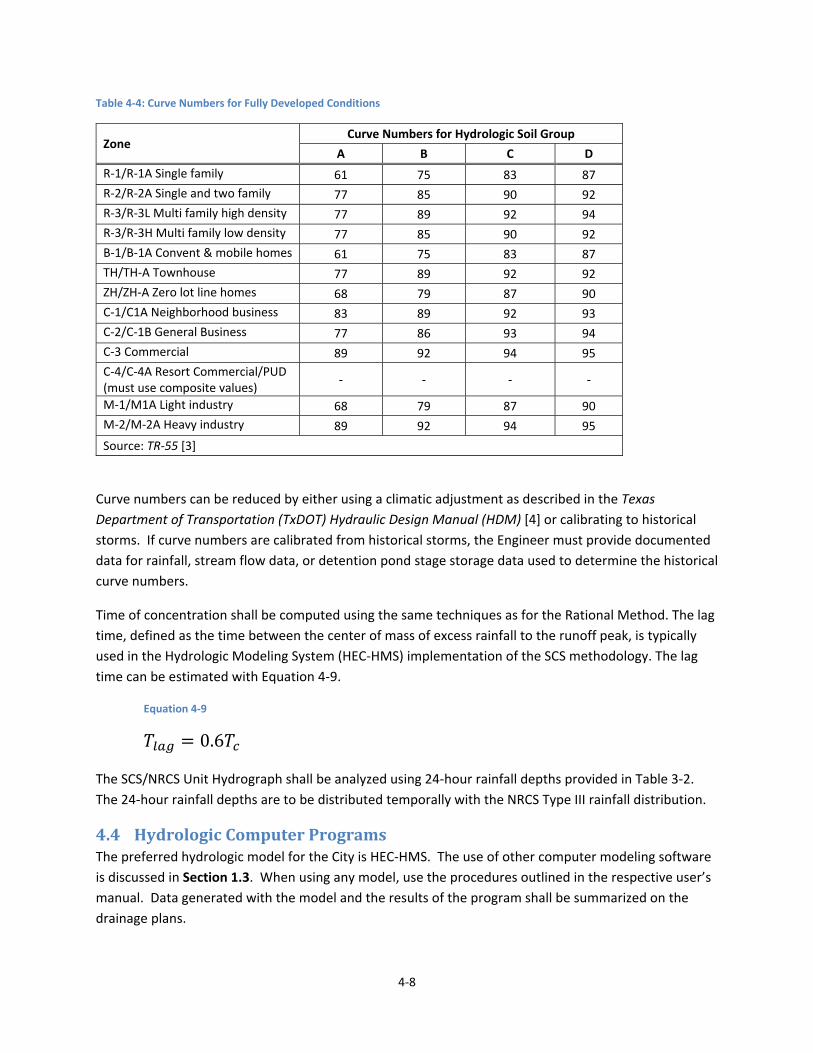
4‐8
Table 4‐4: Curve Numbers for Fully Developed Conditions
Zone Curve Numbers for Hydrologic Soil Group
A B C D
R‐1/R‐1A Single family 61 75 83 87
R‐2/R‐2A Single and two family 77 85 90 92
R‐3/R‐3L Multi family high density 77 89 92 94
R‐3/R‐3H Multi family low density 77 85 90 92
B‐1/B‐1A Convent & mobile homes 61 75 83 87
TH/TH‐A Townhouse 77 89 92 92
ZH/ZH‐A Zero lot line homes 68 79 87 90
C‐1/C1A Neighborhood business 83 89 92 93
C‐2/C‐1B General Business 77 86 93 94
C‐3 Commercial 89 92 94 95
C‐4/C‐4A Resort Commercial/PUD (must use composite values)
‐ ‐ ‐ ‐
M‐1/M1A Light industry 68 79 87 90
M‐2/M‐2A Heavy industry 89 92 94 95
Source: TR‐55 [3]
Curve numbers can be reduced by either using a climatic adjustment as described in the Texas
Department of Transportation (TxDOT) Hydraulic Design Manual (HDM) [4] or calibrating to historical
storms. If curve numbers are calibrated from historical storms, the Engineer must provide documented
data for rainfall, stream flow data, or detention pond stage storage data used to determine the historical
curve numbers.
Time of concentration shall be computed using the same techniques as for the Rational Method. The lag
time, defined as the time between the center of mass of excess rainfall to the runoff peak, is typically
used in the Hydrologic Modeling System (HEC‐HMS) implementation of the SCS methodology. The lag
time can be estimated with Equation 4‐9.
Equation 4‐9
𝑇 0.6𝑇
The SCS/NRCS Unit Hydrograph shall be analyzed using 24‐hour rainfall depths provided in Table 3‐2.
The 24‐hour rainfall depths are to be distributed temporally with the NRCS Type III rainfall distribution.
4.4 HydrologicComputerProgramsThe preferred hydrologic model for the City is HEC‐HMS. The use of other computer modeling software
is discussed in Section 1.3. When using any model, use the procedures outlined in the respective user’s
manual. Data generated with the model and the results of the program shall be summarized on the
drainage plans.
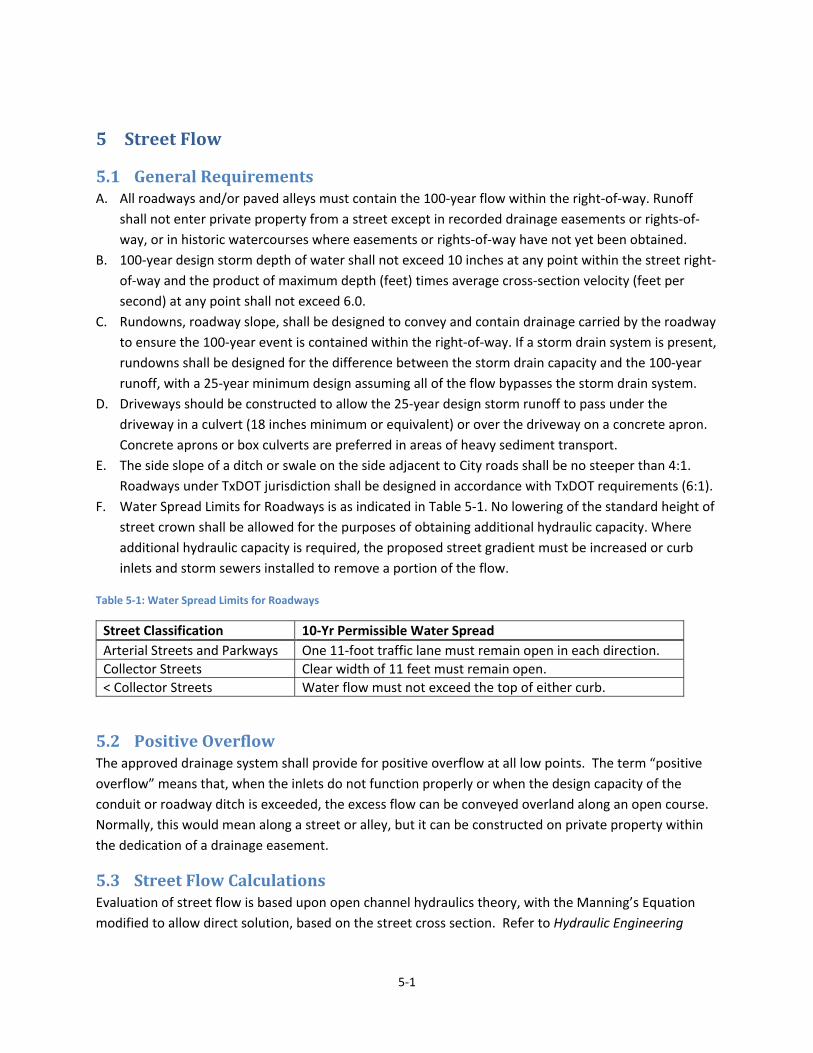
5‐1
5 StreetFlow
5.1 GeneralRequirementsA. All roadways and/or paved alleys must contain the 100‐year flow within the right‐of‐way. Runoff
shall not enter private property from a street except in recorded drainage easements or rights‐of‐
way, or in historic watercourses where easements or rights‐of‐way have not yet been obtained.
B. 100‐year design storm depth of water shall not exceed 10 inches at any point within the street right‐
of‐way and the product of maximum depth (feet) times average cross‐section velocity (feet per
second) at any point shall not exceed 6.0.
C. Rundowns, roadway slope, shall be designed to convey and contain drainage carried by the roadway
to ensure the 100‐year event is contained within the right‐of‐way. If a storm drain system is present,
rundowns shall be designed for the difference between the storm drain capacity and the 100‐year
runoff, with a 25‐year minimum design assuming all of the flow bypasses the storm drain system.
D. Driveways should be constructed to allow the 25‐year design storm runoff to pass under the
driveway in a culvert (18 inches minimum or equivalent) or over the driveway on a concrete apron.
Concrete aprons or box culverts are preferred in areas of heavy sediment transport.
E. The side slope of a ditch or swale on the side adjacent to City roads shall be no steeper than 4:1.
Roadways under TxDOT jurisdiction shall be designed in accordance with TxDOT requirements (6:1).
F. Water Spread Limits for Roadways is as indicated in Table 5‐1. No lowering of the standard height of
street crown shall be allowed for the purposes of obtaining additional hydraulic capacity. Where
additional hydraulic capacity is required, the proposed street gradient must be increased or curb
inlets and storm sewers installed to remove a portion of the flow.
Table 5‐1: Water Spread Limits for Roadways
Street Classification 10‐Yr Permissible Water Spread
Arterial Streets and Parkways One 11‐foot traffic lane must remain open in each direction.
Collector Streets Clear width of 11 feet must remain open.
< Collector Streets Water flow must not exceed the top of either curb.
5.2 PositiveOverflowThe approved drainage system shall provide for positive overflow at all low points. The term “positive
overflow” means that, when the inlets do not function properly or when the design capacity of the
conduit or roadway ditch is exceeded, the excess flow can be conveyed overland along an open course.
Normally, this would mean along a street or alley, but it can be constructed on private property within
the dedication of a drainage easement.
5.3 StreetFlowCalculationsEvaluation of street flow is based upon open channel hydraulics theory, with the Manning’s Equation
modified to allow direct solution, based on the street cross section. Refer to Hydraulic Engineering
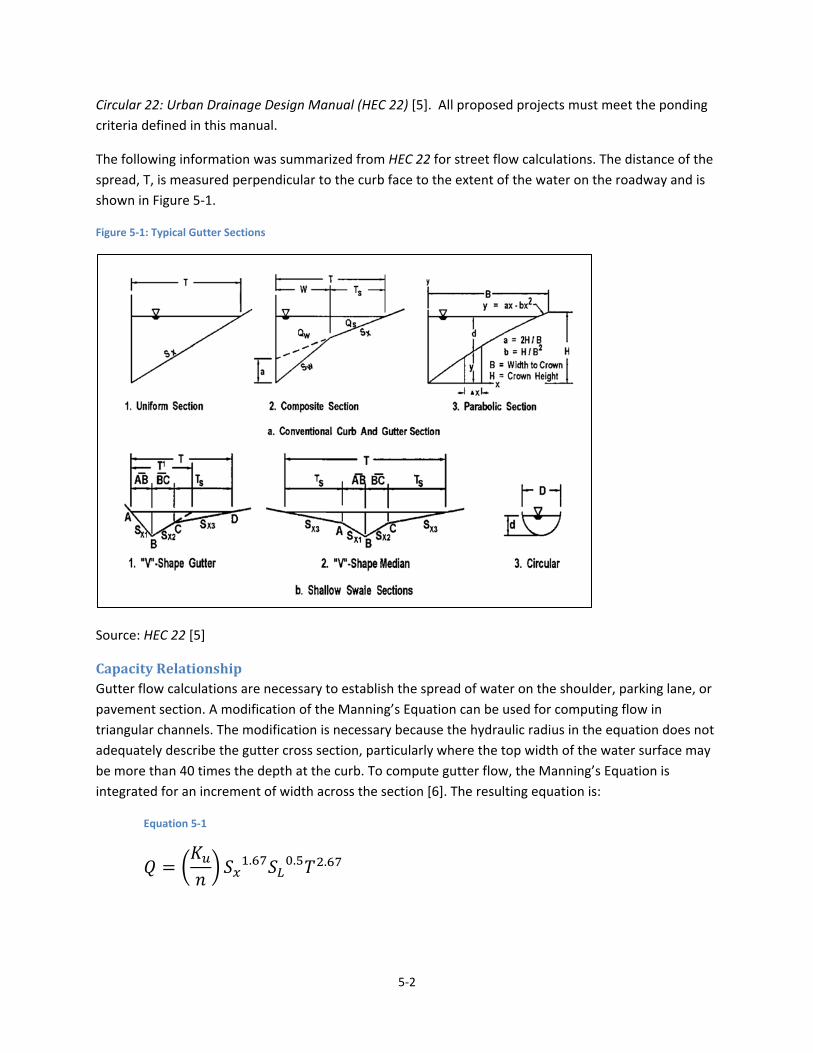
5‐2
Circular 22: Urban Drainage Design Manual (HEC 22) [5]. All proposed projects must meet the ponding
criteria defined in this manual.
The following information was summarized from HEC 22 for street flow calculations. The distance of the
spread, T, is measured perpendicular to the curb face to the extent of the water on the roadway and is
shown in Figure 5‐1.
Figure 5‐1: Typical Gutter Sections
Source: HEC 22 [5]
CapacityRelationshipGutter flow calculations are necessary to establish the spread of water on the shoulder, parking lane, or
pavement section. A modification of the Manning’s Equation can be used for computing flow in
triangular channels. The modification is necessary because the hydraulic radius in the equation does not
adequately describe the gutter cross section, particularly where the top width of the water surface may
be more than 40 times the depth at the curb. To compute gutter flow, the Manning’s Equation is
integrated for an increment of width across the section [6]. The resulting equation is:
Equation 5‐1
𝑄𝐾𝑛
𝑆 . 𝑆 . 𝑇 .
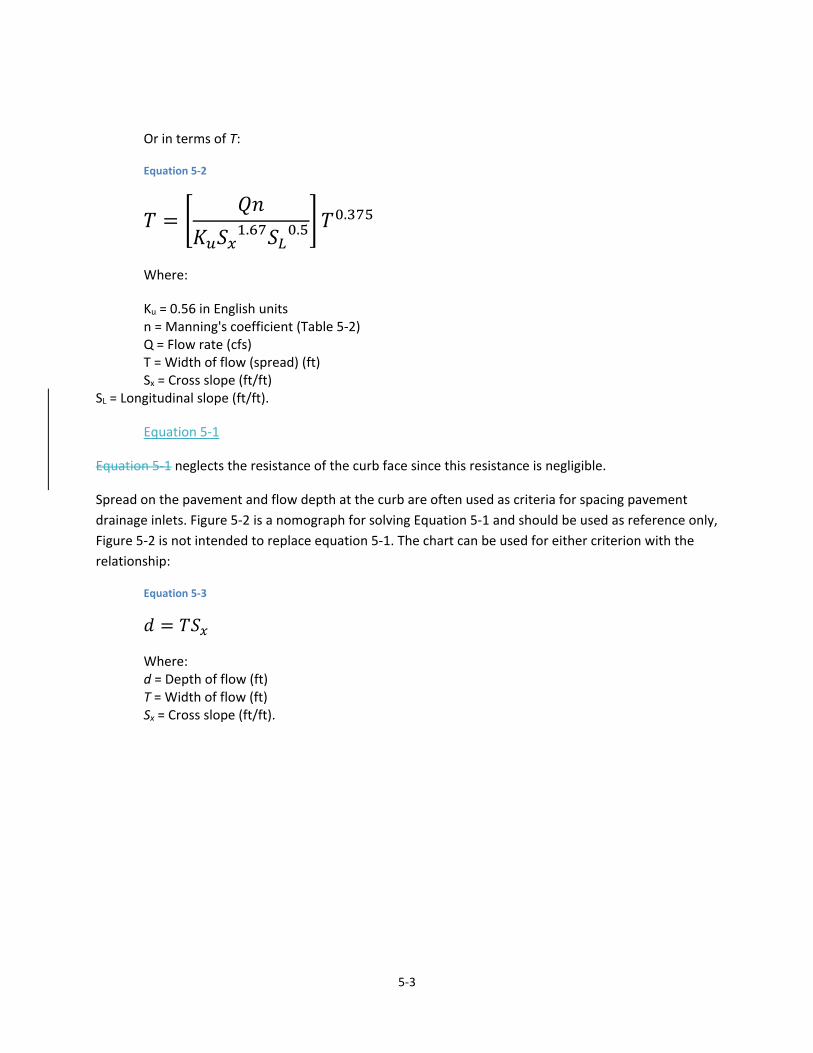
5‐3
Or in terms of T:
Equation 5‐2
𝑇𝑄𝑛
𝐾 𝑆 . 𝑆 . 𝑇 .
Where:
Ku = 0.56 in English units n = Manning's coefficient (Table 5‐2) Q = Flow rate (cfs) T = Width of flow (spread) (ft) Sx = Cross slope (ft/ft)
SL = Longitudinal slope (ft/ft).
Equation 5‐1
Equation 5‐1 neglects the resistance of the curb face since this resistance is negligible.
Spread on the pavement and flow depth at the curb are often used as criteria for spacing pavement
drainage inlets. Figure 5‐2 is a nomograph for solving Equation 5‐1 and should be used as reference only,
Figure 5‐2 is not intended to replace equation 5‐1. The chart can be used for either criterion with the
relationship:
Equation 5‐3
𝑑 𝑇𝑆
Where: d = Depth of flow (ft) T = Width of flow (ft) Sx = Cross slope (ft/ft).
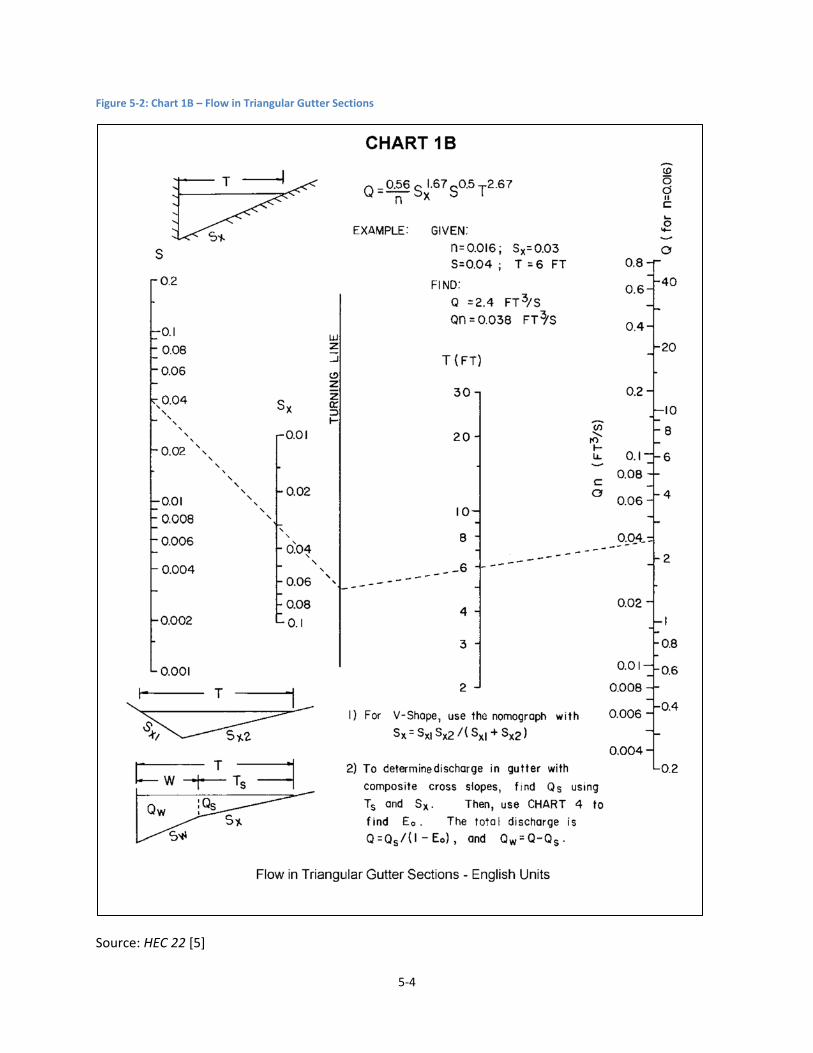
5‐4
Figure 5‐2: Chart 1B – Flow in Triangular Gutter Sections
Source: HEC 22 [5]
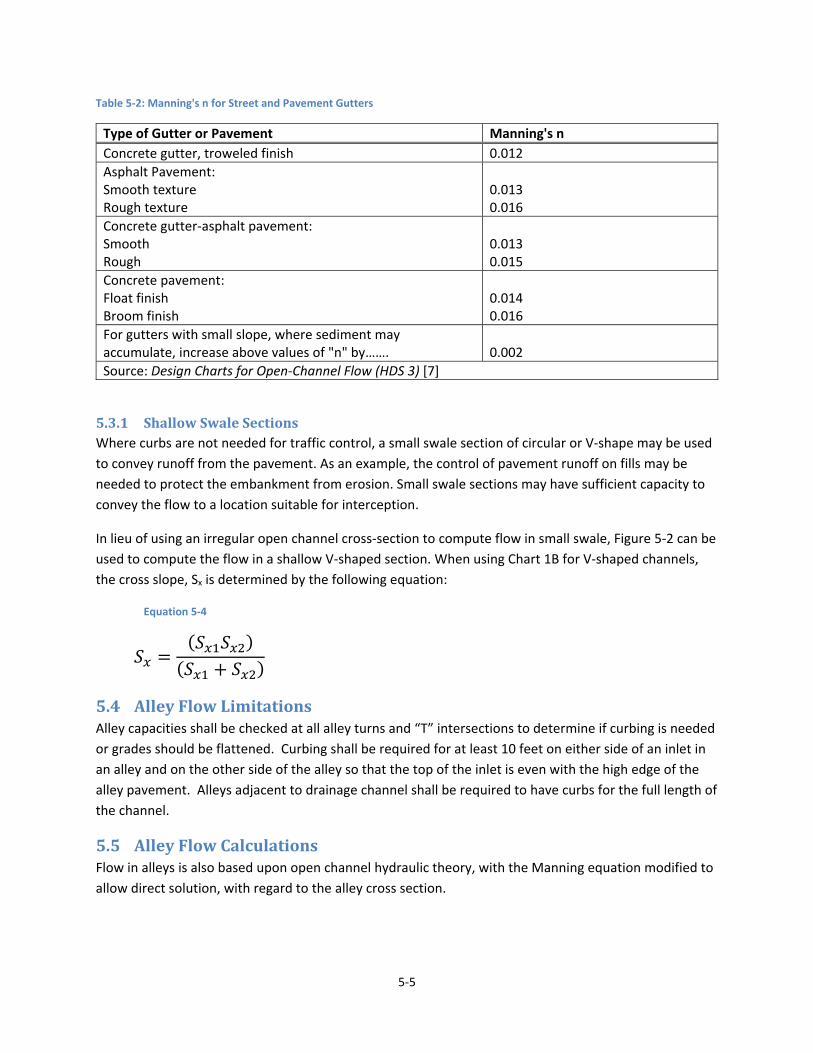
5‐5
Table 5‐2: Manning's n for Street and Pavement Gutters
Type of Gutter or Pavement Manning's n
Concrete gutter, troweled finish 0.012
Asphalt Pavement: Smooth texture Rough texture
0.013 0.016
Concrete gutter‐asphalt pavement: Smooth Rough
0.013 0.015
Concrete pavement: Float finish Broom finish
0.014 0.016
For gutters with small slope, where sediment may accumulate, increase above values of "n" by……. 0.002
Source: Design Charts for Open‐Channel Flow (HDS 3) [7]
5.3.1 ShallowSwaleSectionsWhere curbs are not needed for traffic control, a small swale section of circular or V‐shape may be used
to convey runoff from the pavement. As an example, the control of pavement runoff on fills may be
needed to protect the embankment from erosion. Small swale sections may have sufficient capacity to
convey the flow to a location suitable for interception.
In lieu of using an irregular open channel cross‐section to compute flow in small swale, Figure 5‐2 can be
used to compute the flow in a shallow V‐shaped section. When using Chart 1B for V‐shaped channels,
the cross slope, Sx is determined by the following equation:
Equation 5‐4
𝑆𝑆 𝑆𝑆 𝑆
5.4 AlleyFlowLimitationsAlley capacities shall be checked at all alley turns and “T” intersections to determine if curbing is needed
or grades should be flattened. Curbing shall be required for at least 10 feet on either side of an inlet in
an alley and on the other side of the alley so that the top of the inlet is even with the high edge of the
alley pavement. Alleys adjacent to drainage channel shall be required to have curbs for the full length of
the channel.
5.5 AlleyFlowCalculationsFlow in alleys is also based upon open channel hydraulic theory, with the Manning equation modified to
allow direct solution, with regard to the alley cross section.

5‐6
This page intentionally left blank.

6‐1
6 InletDesign
6.1 GeneralRequirementsInlets shall be located as necessary to remove the flow based on the 25‐year storm and accommodate
ponding widths in streets as defined in Table 5‐1. The hydraulic efficiency of storm drain inlets varies
with the amount of gutter flow, street grade, street crown and the geometry of the inlet opening. The
following are design considerations, which must be given attention during inlet design:
1. Inlets must be located where the allowable street flow capacities are exceeded, at low points
(sumps or sags) and upstream of transition between normal and super‐elevated street sections.
Inlets should be located to intercept stormwater prior to traversing intersections.
2. In super‐elevated sections of divided arterial streets, inlets placed against the center medians
shall have no gutter depression. Interior gutter flow (flow along the median) shall be
intercepted at the point of super‐elevation transition, to prevent pavement cross flow.
3. At bridges with curbed approaches, gutter flow shall be intercepted prior to flowing onto the
bridge, to prevent ice from developing during cold weather.
4. The maximum approved inlet throat opening is seven inches. Openings larger than seven inches
require approval by the Engineering Division and, if approved, must contain a bar or other form
of restraint. For curb opening inlets the throat opening is shown as “h” in Figure 6‐1.
5. The design and location of all inlets must take into consideration pedestrian and bicycle traffic.
Combination curb inlets (with opening in curb and grate opening in gutter) may be used only
where space behind the curb prohibits the use of other inlet types.
6. Where recessed inlets are required, they shall not decrease the width of the sidewalk or
interfere with utilities. Recessed inlets must also be depressed. The depression is measured
from the theoretical gutter flow line, shown as “a” in Figure 6‐2, and shall be one inch minimum.
7. Non‐recessed, depressed inlets shall have a maximum allowable inlet depression of five inches.
8. The use of slotted drains is not allowed except in instances where there is no alternative, in
which case approval must be obtained from the City Engineer. If slotted drains are used, the
inlet capacity shall be the lesser of the calculated capacity from this manual or the
manufacturer’s design guidelines and cleanouts shall be provided.
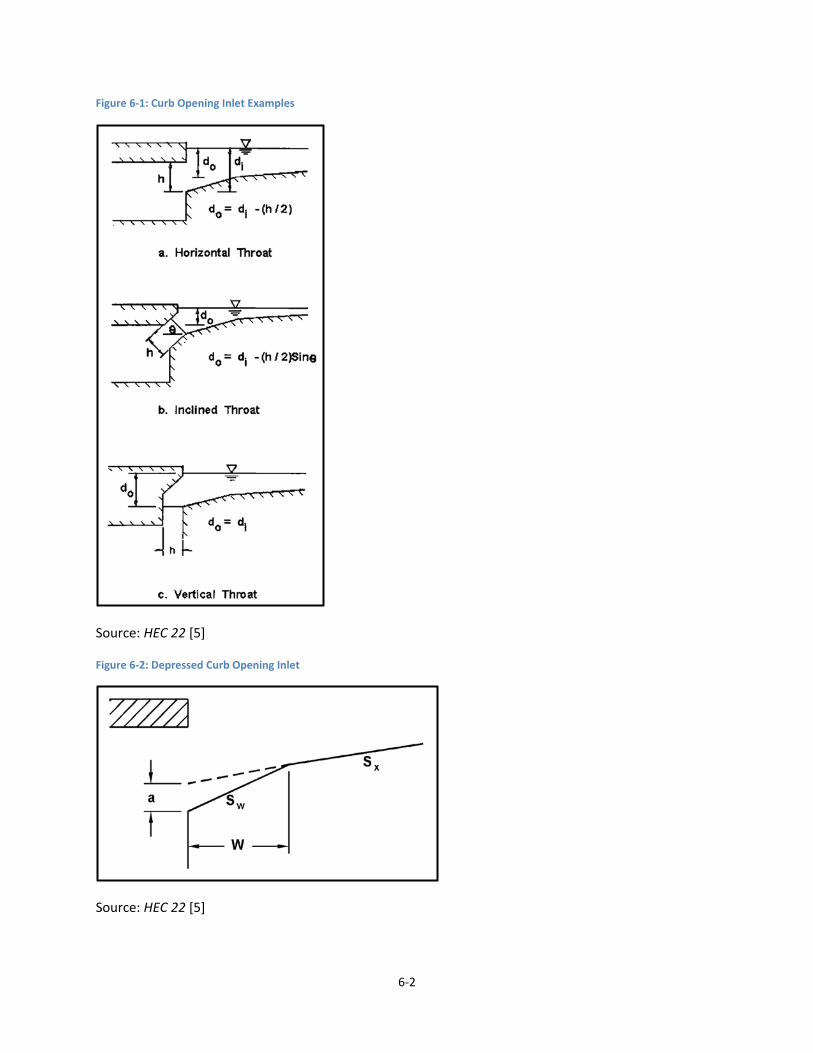
6‐2
Figure 6‐1: Curb Opening Inlet Examples
Source: HEC 22 [5]
Figure 6‐2: Depressed Curb Opening Inlet
Source: HEC 22 [5]
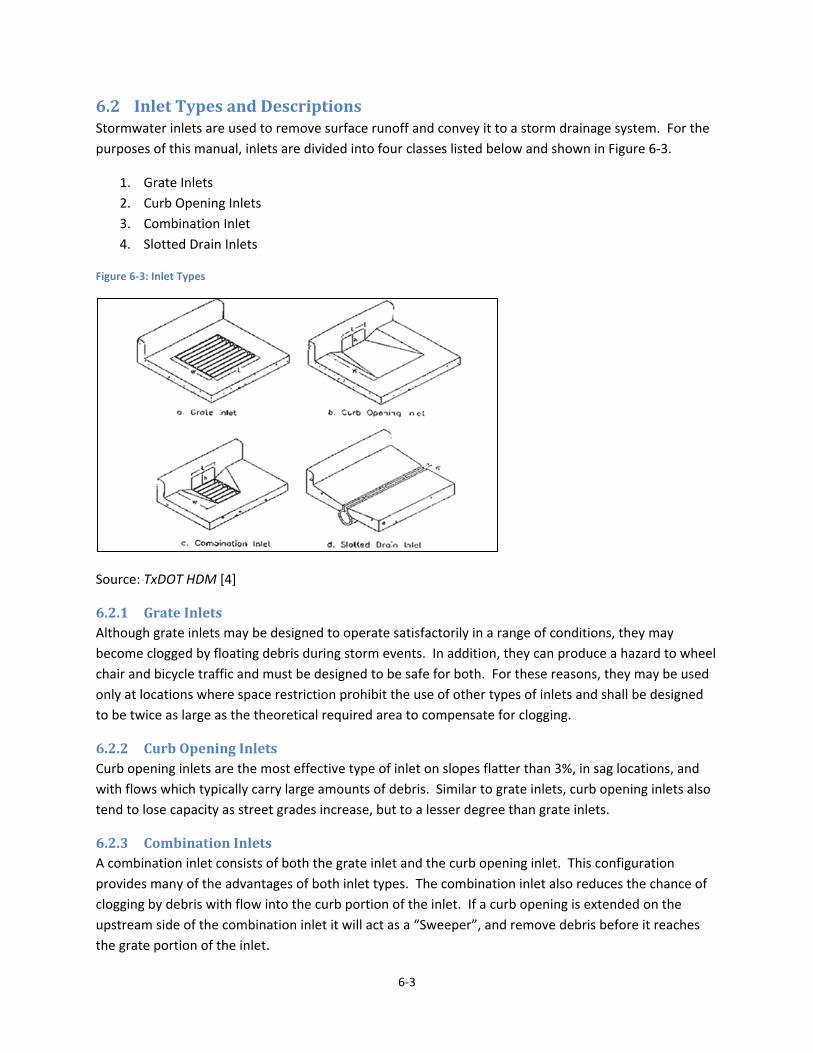
6‐3
6.2 InletTypesandDescriptionsStormwater inlets are used to remove surface runoff and convey it to a storm drainage system. For the
purposes of this manual, inlets are divided into four classes listed below and shown in Figure 6‐3.
1. Grate Inlets
2. Curb Opening Inlets
3. Combination Inlet
4. Slotted Drain Inlets
Figure 6‐3: Inlet Types
Source: TxDOT HDM [4]
6.2.1 GrateInletsAlthough grate inlets may be designed to operate satisfactorily in a range of conditions, they may
become clogged by floating debris during storm events. In addition, they can produce a hazard to wheel
chair and bicycle traffic and must be designed to be safe for both. For these reasons, they may be used
only at locations where space restriction prohibit the use of other types of inlets and shall be designed
to be twice as large as the theoretical required area to compensate for clogging.
6.2.2 CurbOpeningInletsCurb opening inlets are the most effective type of inlet on slopes flatter than 3%, in sag locations, and
with flows which typically carry large amounts of debris. Similar to grate inlets, curb opening inlets also
tend to lose capacity as street grades increase, but to a lesser degree than grate inlets.
6.2.3 CombinationInletsA combination inlet consists of both the grate inlet and the curb opening inlet. This configuration
provides many of the advantages of both inlet types. The combination inlet also reduces the chance of
clogging by debris with flow into the curb portion of the inlet. If a curb opening is extended on the
upstream side of the combination inlet it will act as a “Sweeper”, and remove debris before it reaches
the grate portion of the inlet.
6‐4
6.2.4 SlottedDrainInletsAlthough slotted drain inlets can be used to intercept sheet flow, or flow in wide sections, they are not
recommended for use in the City of New Braunfels since they are very susceptible to clogging from
debris. Slot inlets may only be used with the permission of the City Engineer.
6.3 InletCapacityCalculationsThe inlet capacity calculations provided below are summarized from TxDOT HDM. For additional
information refer to the source document.
6.3.1 CombinationInletsFor a combination curb opening and grate inlet, assume that the capacity of the combination inlet
comprises the sum of the capacity of the grate and the upstream curb opening length. Ignore the
capacity of the curb opening that is combined with the grate opening. Refer to HEC 22 for additional
procedures and examples for computing the interception capacity of combination inlets.
6.3.2 CurbOpeningInletsOn‐GradeThe design of on‐grade curb opening inlets involves determination of length required for total flow
interception, subjective decision about actual length to be provided, and determination of any resulting
carryover rate. For each on‐grade inlet, determine early whether or not carryover is to be a valid design
consideration. In some cases due to a logical location of the inlet, no carryover may be allowed. In other
cases, while carryover is acceptable, there may not be a convenient location to accommodate the
bypass flow. Use the following procedure to design curb inlets on‐grade:
1. Compute depth of flow and ponded width (T) in the gutter section at the inlet.
2. Determine the ratio of the width of flow in the depressed section (W) to the width of total
gutter flow (T) using Equation 6‐1. Figure 6‐4 shows the gutter cross section at an inlet.
Equation 6‐1
𝐸𝐾
𝐾 𝐾
Where: E0 = ratio of depression flow to total flow Kw = conveyance of the depressed gutter section (cfs) K0 = conveyance of the gutter section beyond the depression (cfs).
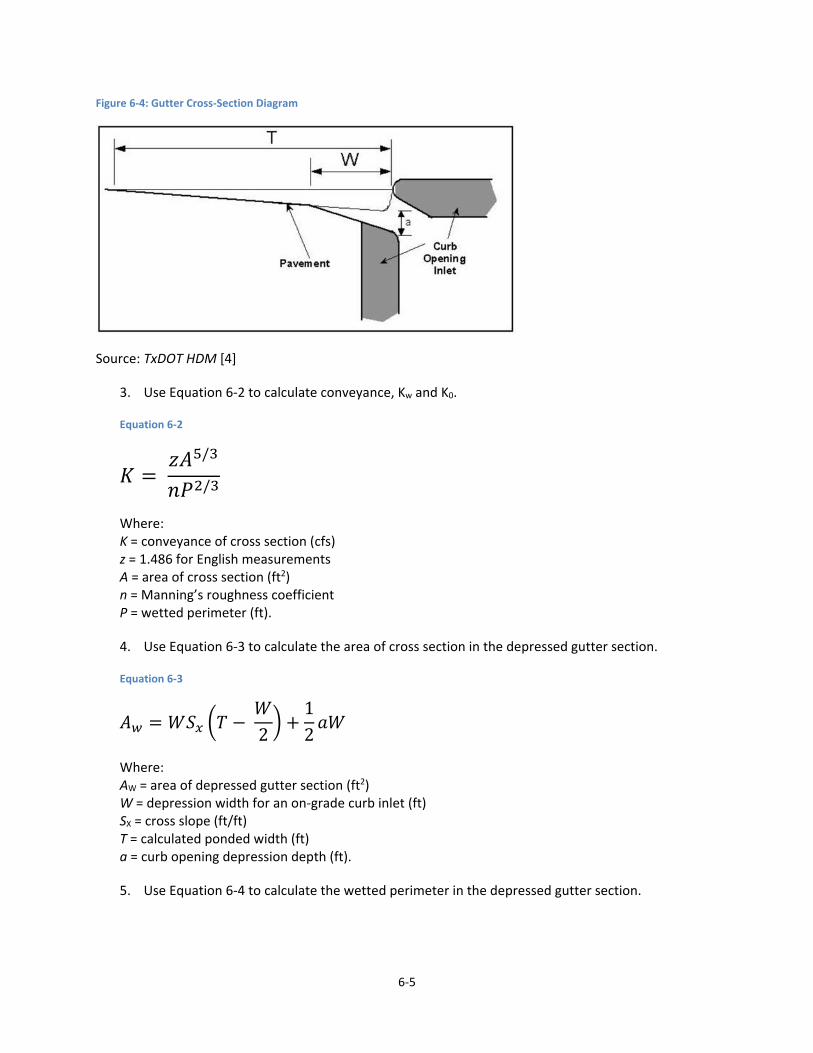
6‐5
Figure 6‐4: Gutter Cross‐Section Diagram
Source: TxDOT HDM [4]
3. Use Equation 6‐2 to calculate conveyance, Kw and K0.
Equation 6‐2
𝐾 𝑧𝐴 /
𝑛𝑃 /
Where: K = conveyance of cross section (cfs) z = 1.486 for English measurements A = area of cross section (ft2) n = Manning’s roughness coefficient P = wetted perimeter (ft).
4. Use Equation 6‐3 to calculate the area of cross section in the depressed gutter section.
Equation 6‐3
𝐴 𝑊𝑆 𝑇 𝑊2
12𝑎𝑊
Where: AW = area of depressed gutter section (ft2) W = depression width for an on‐grade curb inlet (ft) SX = cross slope (ft/ft) T = calculated ponded width (ft) a = curb opening depression depth (ft).
5. Use Equation 6‐4 to calculate the wetted perimeter in the depressed gutter section.
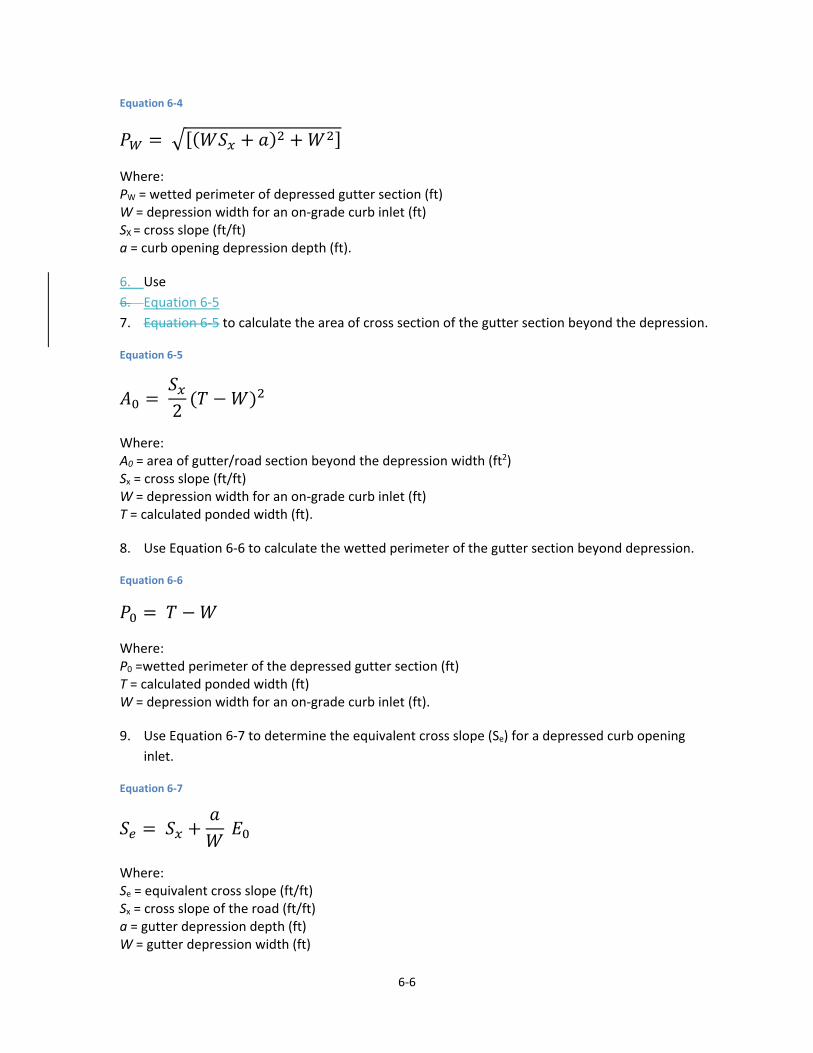
6‐6
Equation 6‐4
𝑃 𝑊𝑆 𝑎 𝑊
Where: PW = wetted perimeter of depressed gutter section (ft) W = depression width for an on‐grade curb inlet (ft) SX = cross slope (ft/ft) a = curb opening depression depth (ft).
6. Use
6. Equation 6‐5
7. Equation 6‐5 to calculate the area of cross section of the gutter section beyond the depression.
Equation 6‐5
𝐴 𝑆2
𝑇 𝑊
Where: A0 = area of gutter/road section beyond the depression width (ft2) Sx = cross slope (ft/ft) W = depression width for an on‐grade curb inlet (ft) T = calculated ponded width (ft).
8. Use Equation 6‐6 to calculate the wetted perimeter of the gutter section beyond depression.
Equation 6‐6
𝑃 𝑇 𝑊
Where: P0 =wetted perimeter of the depressed gutter section (ft) T = calculated ponded width (ft) W = depression width for an on‐grade curb inlet (ft).
9. Use Equation 6‐7 to determine the equivalent cross slope (Se) for a depressed curb opening
inlet.
Equation 6‐7
𝑆 𝑆𝑎𝑊
𝐸
Where: Se = equivalent cross slope (ft/ft) Sx = cross slope of the road (ft/ft) a = gutter depression depth (ft) W = gutter depression width (ft)
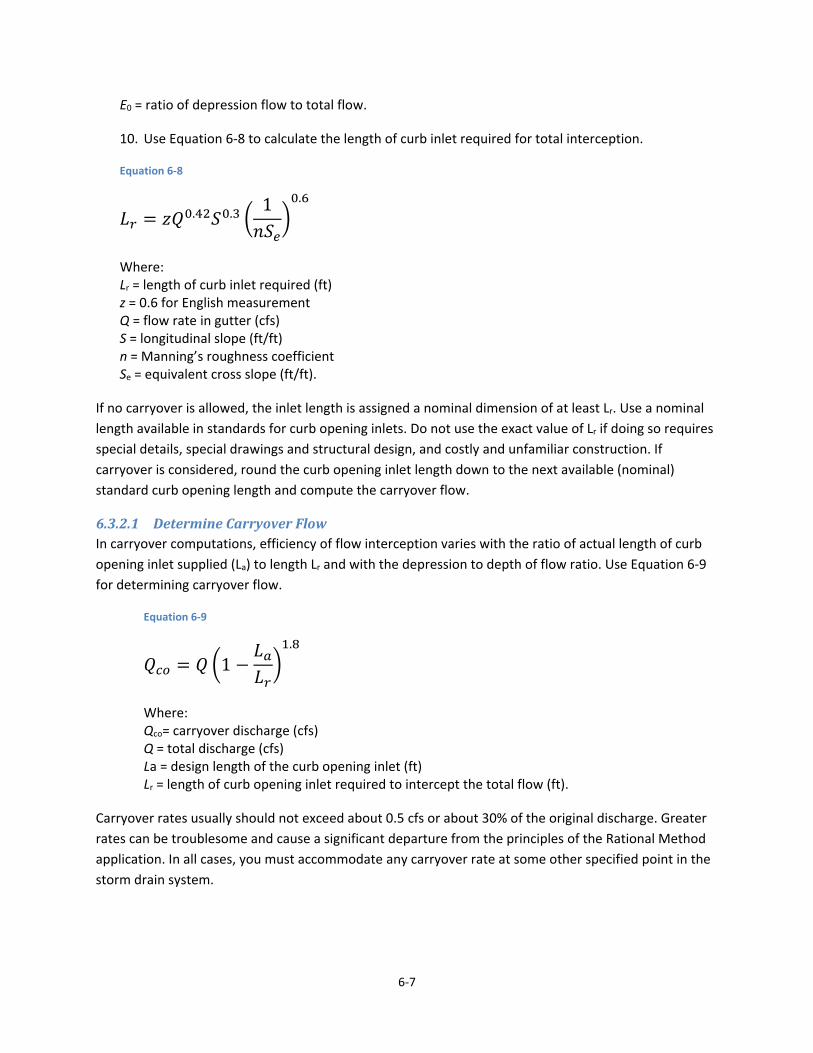
6‐7
E0 = ratio of depression flow to total flow.
10. Use Equation 6‐8 to calculate the length of curb inlet required for total interception.
Equation 6‐8
𝐿 𝑧𝑄 . 𝑆 . 1𝑛𝑆
.
Where: Lr = length of curb inlet required (ft) z = 0.6 for English measurement Q = flow rate in gutter (cfs) S = longitudinal slope (ft/ft) n = Manning’s roughness coefficient Se = equivalent cross slope (ft/ft).
If no carryover is allowed, the inlet length is assigned a nominal dimension of at least Lr. Use a nominal
length available in standards for curb opening inlets. Do not use the exact value of Lr if doing so requires
special details, special drawings and structural design, and costly and unfamiliar construction. If
carryover is considered, round the curb opening inlet length down to the next available (nominal)
standard curb opening length and compute the carryover flow.
6.3.2.1 DetermineCarryoverFlowIn carryover computations, efficiency of flow interception varies with the ratio of actual length of curb
opening inlet supplied (La) to length Lr and with the depression to depth of flow ratio. Use Equation 6‐9
for determining carryover flow.
Equation 6‐9
𝑄 𝑄 1𝐿𝐿
.
Where: Qco= carryover discharge (cfs) Q = total discharge (cfs) La = design length of the curb opening inlet (ft) Lr = length of curb opening inlet required to intercept the total flow (ft).
Carryover rates usually should not exceed about 0.5 cfs or about 30% of the original discharge. Greater
rates can be troublesome and cause a significant departure from the principles of the Rational Method
application. In all cases, you must accommodate any carryover rate at some other specified point in the
storm drain system.
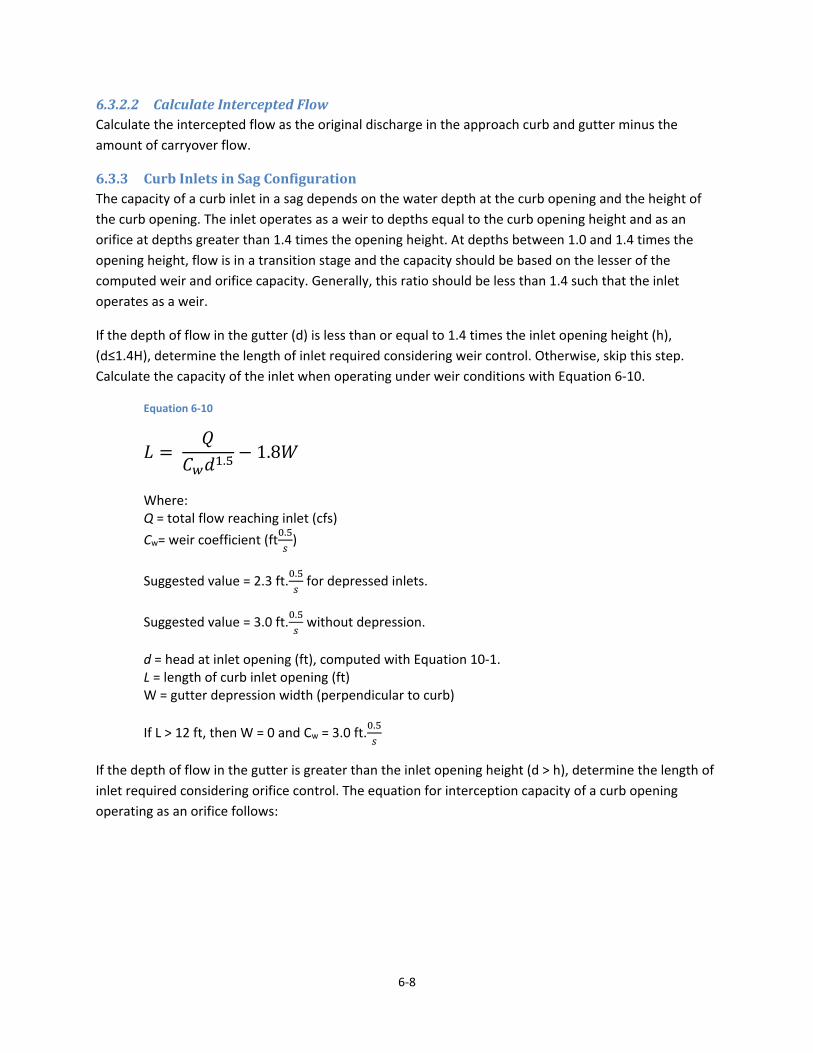
6‐8
6.3.2.2 CalculateInterceptedFlowCalculate the intercepted flow as the original discharge in the approach curb and gutter minus the
amount of carryover flow.
6.3.3 CurbInletsinSagConfigurationThe capacity of a curb inlet in a sag depends on the water depth at the curb opening and the height of
the curb opening. The inlet operates as a weir to depths equal to the curb opening height and as an
orifice at depths greater than 1.4 times the opening height. At depths between 1.0 and 1.4 times the
opening height, flow is in a transition stage and the capacity should be based on the lesser of the
computed weir and orifice capacity. Generally, this ratio should be less than 1.4 such that the inlet
operates as a weir.
If the depth of flow in the gutter (d) is less than or equal to 1.4 times the inlet opening height (h),
(d≤1.4H), determine the length of inlet required considering weir control. Otherwise, skip this step.
Calculate the capacity of the inlet when operating under weir conditions with Equation 6‐10.
Equation 6‐10
𝐿 𝑄
𝐶 𝑑 . 1.8𝑊
Where: Q = total flow reaching inlet (cfs)
Cw= weir coefficient (ft.)
Suggested value = 2.3 ft.. for depressed inlets.
Suggested value = 3.0 ft.. without depression.
d = head at inlet opening (ft), computed with Equation 10‐1. L = length of curb inlet opening (ft) W = gutter depression width (perpendicular to curb)
If L > 12 ft, then W = 0 and Cw = 3.0 ft..
If the depth of flow in the gutter is greater than the inlet opening height (d > h), determine the length of
inlet required considering orifice control. The equation for interception capacity of a curb opening
operating as an orifice follows:
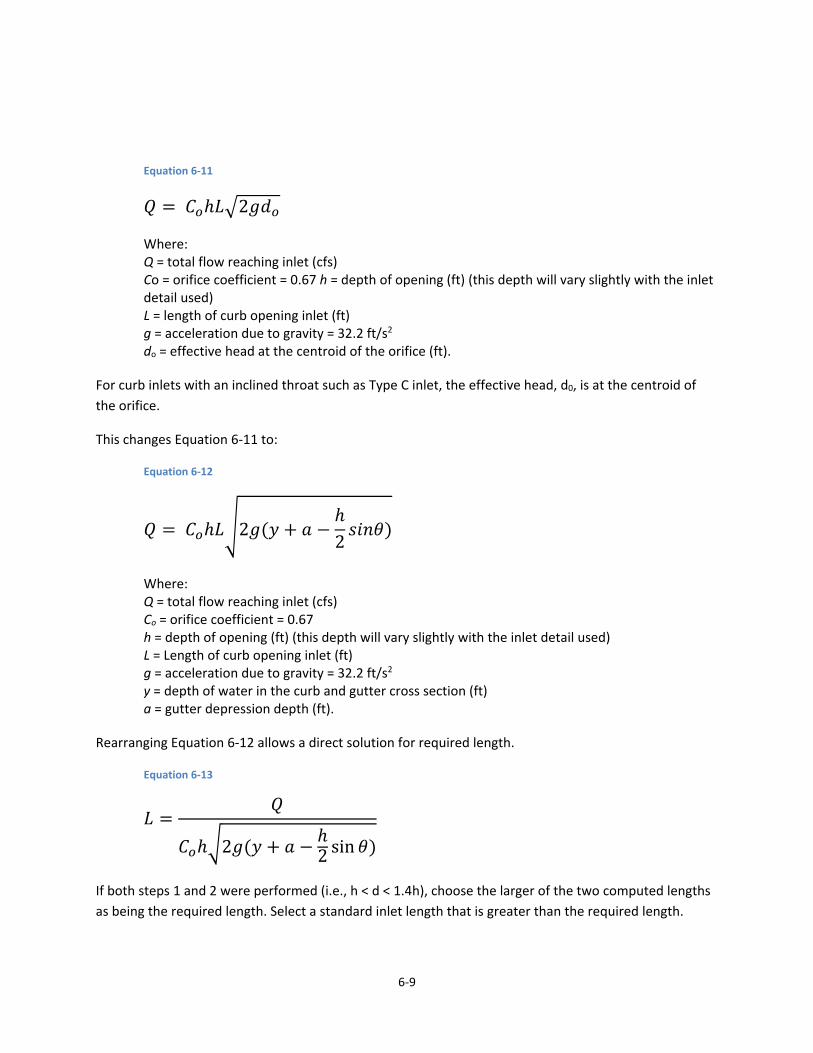
6‐9
Equation 6‐11
𝑄 𝐶 ℎ𝐿 2𝑔𝑑
Where: Q = total flow reaching inlet (cfs) Co = orifice coefficient = 0.67 h = depth of opening (ft) (this depth will vary slightly with the inlet detail used) L = length of curb opening inlet (ft) g = acceleration due to gravity = 32.2 ft/s2
do = effective head at the centroid of the orifice (ft).
For curb inlets with an inclined throat such as Type C inlet, the effective head, d0, is at the centroid of
the orifice.
This changes Equation 6‐11 to:
Equation 6‐12
𝑄 𝐶 ℎ𝐿 2𝑔 𝑦 𝑎ℎ2𝑠𝑖𝑛𝜃
Where: Q = total flow reaching inlet (cfs) Co = orifice coefficient = 0.67 h = depth of opening (ft) (this depth will vary slightly with the inlet detail used) L = Length of curb opening inlet (ft) g = acceleration due to gravity = 32.2 ft/s2
y = depth of water in the curb and gutter cross section (ft) a = gutter depression depth (ft).
Rearranging Equation 6‐12 allows a direct solution for required length.
Equation 6‐13
𝐿𝑄
𝐶 ℎ 2𝑔 𝑦 𝑎ℎ2 sin𝜃
If both steps 1 and 2 were performed (i.e., h < d < 1.4h), choose the larger of the two computed lengths
as being the required length. Select a standard inlet length that is greater than the required length.
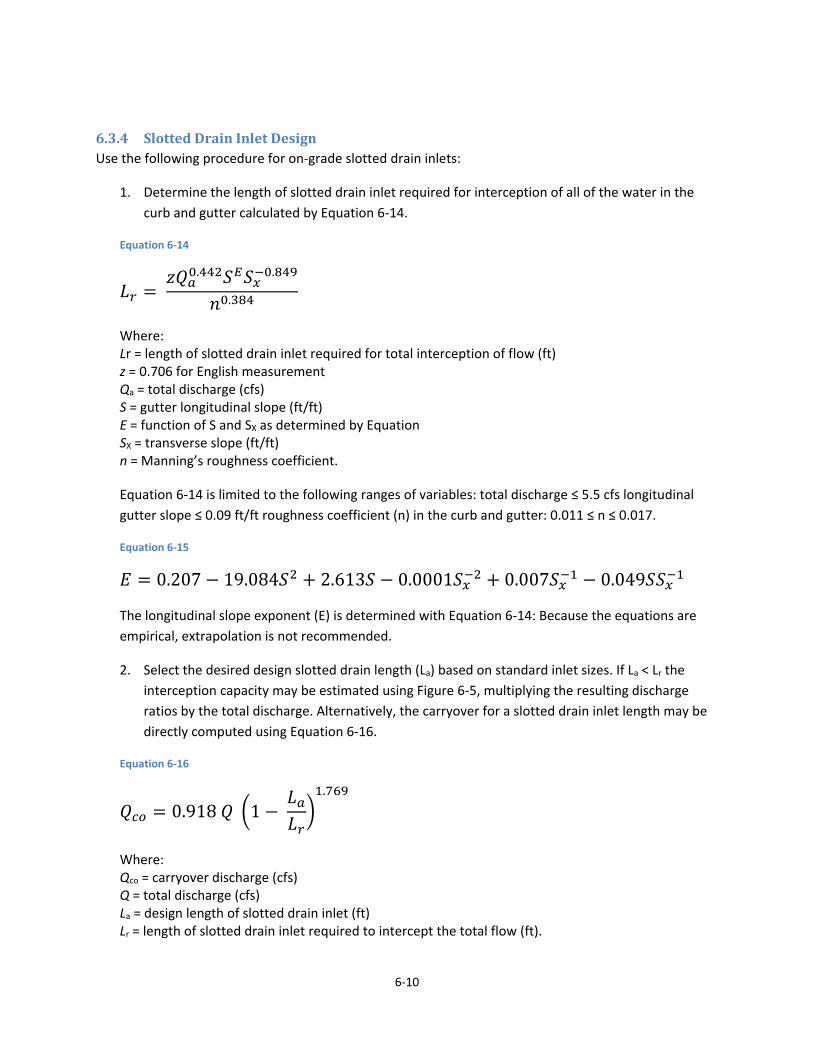
6‐10
6.3.4 SlottedDrainInletDesignUse the following procedure for on‐grade slotted drain inlets:
1. Determine the length of slotted drain inlet required for interception of all of the water in the
curb and gutter calculated by Equation 6‐14.
Equation 6‐14
𝐿 𝑧𝑄 . 𝑆 𝑆 .
𝑛 .
Where: Lr = length of slotted drain inlet required for total interception of flow (ft) z = 0.706 for English measurement Qa = total discharge (cfs) S = gutter longitudinal slope (ft/ft) E = function of S and SX as determined by Equation SX = transverse slope (ft/ft) n = Manning’s roughness coefficient.
Equation 6‐14 is limited to the following ranges of variables: total discharge ≤ 5.5 cfs longitudinal
gutter slope ≤ 0.09 ft/ft roughness coefficient (n) in the curb and gutter: 0.011 ≤ n ≤ 0.017.
Equation 6‐15
𝐸 0.207 19.084𝑆 2.613𝑆 0.0001𝑆 0.007𝑆 0.049𝑆𝑆
The longitudinal slope exponent (E) is determined with Equation 6‐14: Because the equations are
empirical, extrapolation is not recommended.
2. Select the desired design slotted drain length (La) based on standard inlet sizes. If La < Lr the
interception capacity may be estimated using Figure 6‐5, multiplying the resulting discharge
ratios by the total discharge. Alternatively, the carryover for a slotted drain inlet length may be
directly computed using Equation 6‐16.
Equation 6‐16
𝑄 0.918 𝑄 1 𝐿𝐿
.
Where: Qco = carryover discharge (cfs) Q = total discharge (cfs) La = design length of slotted drain inlet (ft) Lr = length of slotted drain inlet required to intercept the total flow (ft).
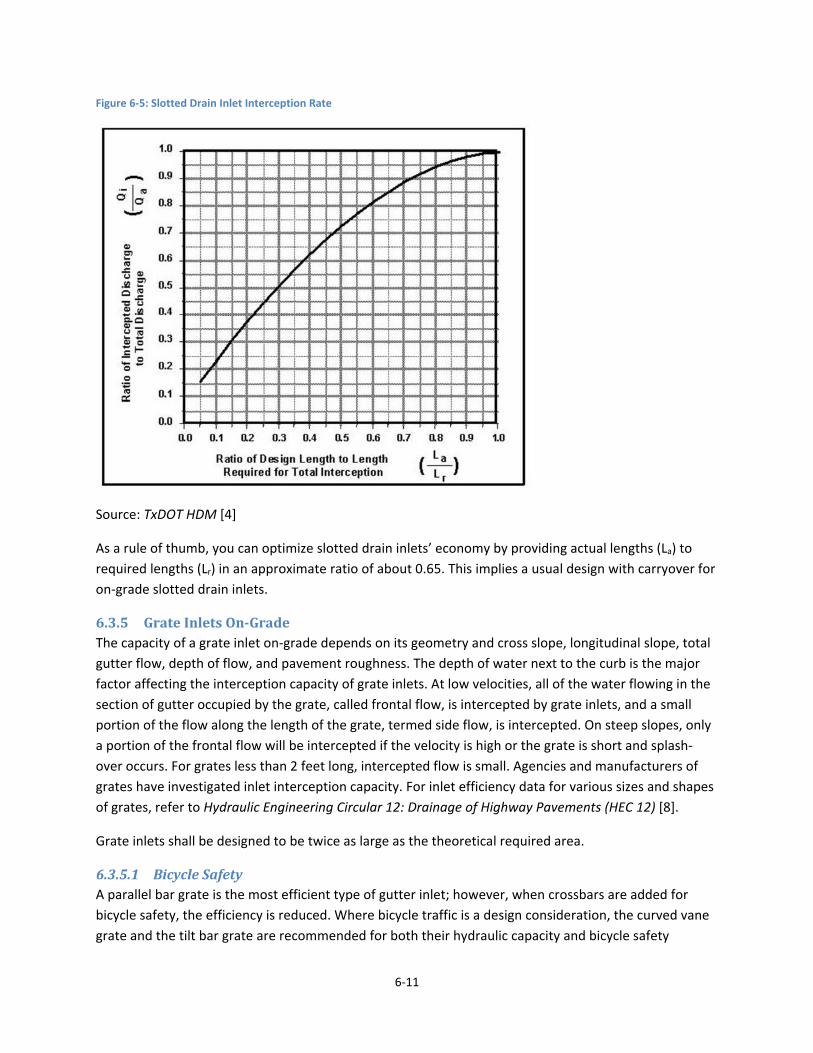
6‐11
Figure 6‐5: Slotted Drain Inlet Interception Rate
Source: TxDOT HDM [4]
As a rule of thumb, you can optimize slotted drain inlets’ economy by providing actual lengths (La) to
required lengths (Lr) in an approximate ratio of about 0.65. This implies a usual design with carryover for
on‐grade slotted drain inlets.
6.3.5 GrateInletsOn‐GradeThe capacity of a grate inlet on‐grade depends on its geometry and cross slope, longitudinal slope, total
gutter flow, depth of flow, and pavement roughness. The depth of water next to the curb is the major
factor affecting the interception capacity of grate inlets. At low velocities, all of the water flowing in the
section of gutter occupied by the grate, called frontal flow, is intercepted by grate inlets, and a small
portion of the flow along the length of the grate, termed side flow, is intercepted. On steep slopes, only
a portion of the frontal flow will be intercepted if the velocity is high or the grate is short and splash‐
over occurs. For grates less than 2 feet long, intercepted flow is small. Agencies and manufacturers of
grates have investigated inlet interception capacity. For inlet efficiency data for various sizes and shapes
of grates, refer to Hydraulic Engineering Circular 12: Drainage of Highway Pavements (HEC 12) [8].
Grate inlets shall be designed to be twice as large as the theoretical required area.
6.3.5.1 BicycleSafetyA parallel bar grate is the most efficient type of gutter inlet; however, when crossbars are added for
bicycle safety, the efficiency is reduced. Where bicycle traffic is a design consideration, the curved vane
grate and the tilt bar grate are recommended for both their hydraulic capacity and bicycle safety
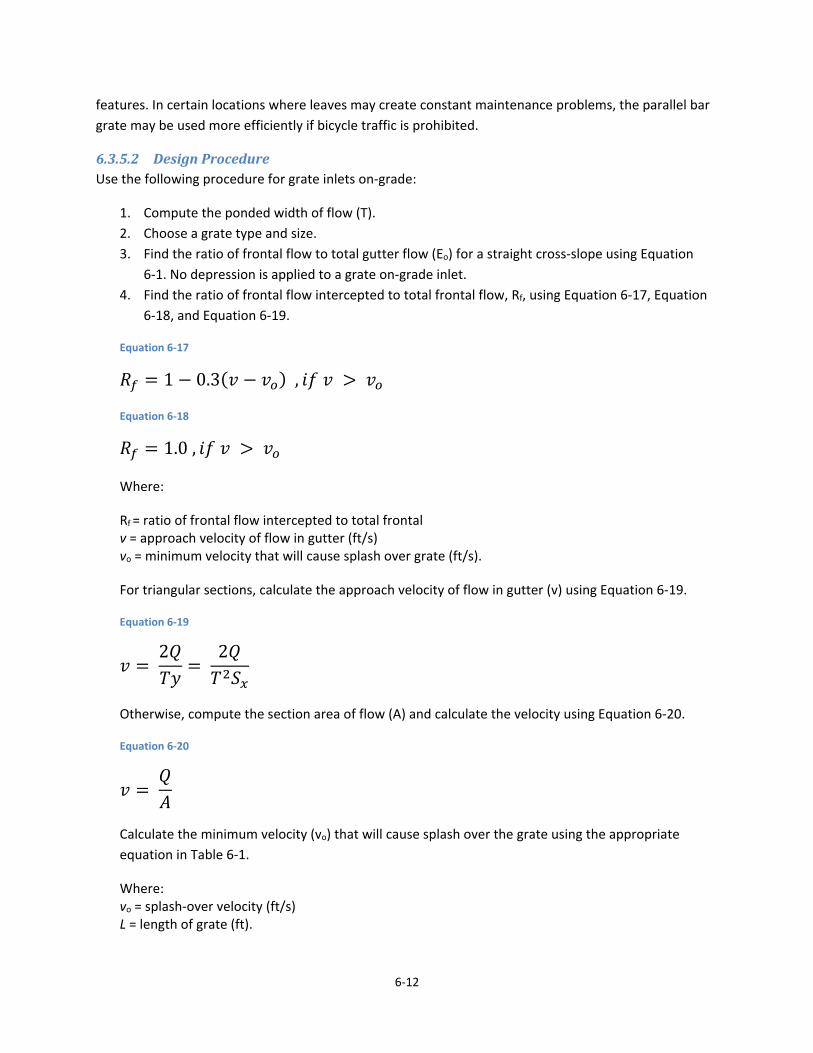
6‐12
features. In certain locations where leaves may create constant maintenance problems, the parallel bar
grate may be used more efficiently if bicycle traffic is prohibited.
6.3.5.2 DesignProcedureUse the following procedure for grate inlets on‐grade:
1. Compute the ponded width of flow (T).
2. Choose a grate type and size.
3. Find the ratio of frontal flow to total gutter flow (Eo) for a straight cross‐slope using Equation
6‐1. No depression is applied to a grate on‐grade inlet.
4. Find the ratio of frontal flow intercepted to total frontal flow, Rf, using Equation 6‐17, Equation
6‐18, and Equation 6‐19.
Equation 6‐17
𝑅 1 0.3 𝑣 𝑣 , 𝑖𝑓 𝑣 𝑣
Equation 6‐18
𝑅 1.0 , 𝑖𝑓 𝑣 𝑣
Where:
Rf = ratio of frontal flow intercepted to total frontal v = approach velocity of flow in gutter (ft/s) vo = minimum velocity that will cause splash over grate (ft/s).
For triangular sections, calculate the approach velocity of flow in gutter (v) using Equation 6‐19.
Equation 6‐19
𝑣 2𝑄𝑇𝑦
2𝑄𝑇 𝑆
Otherwise, compute the section area of flow (A) and calculate the velocity using Equation 6‐20.
Equation 6‐20
𝑣 𝑄𝐴
Calculate the minimum velocity (vo) that will cause splash over the grate using the appropriate
equation in Table 6‐1.
Where: vo = splash‐over velocity (ft/s) L = length of grate (ft).
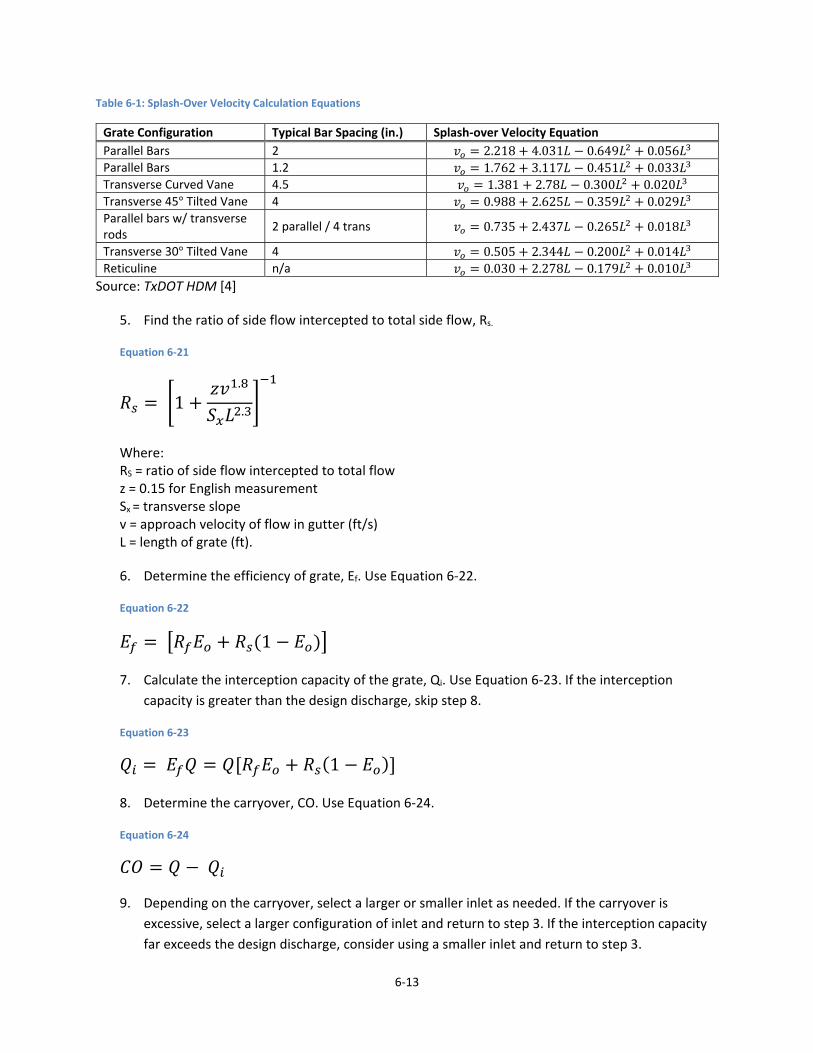
6‐13
Table 6‐1: Splash‐Over Velocity Calculation Equations
Grate Configuration Typical Bar Spacing (in.) Splash‐over Velocity Equation
Parallel Bars 2 𝑣 2.218 4.031𝐿 0.649𝐿 0.056𝐿 Parallel Bars 1.2 𝑣 1.762 3.117𝐿 0.451𝐿 0.033𝐿 Transverse Curved Vane 4.5 𝑣 1.381 2.78𝐿 0.300𝐿 0.020𝐿 Transverse 45° Tilted Vane 4 𝑣 0.988 2.625𝐿 0.359𝐿 0.029𝐿 Parallel bars w/ transverse rods
2 parallel / 4 trans 𝑣 0.735 2.437𝐿 0.265𝐿 0.018𝐿
Transverse 30° Tilted Vane 4 𝑣 0.505 2.344𝐿 0.200𝐿 0.014𝐿 Reticuline n/a 𝑣 0.030 2.278𝐿 0.179𝐿 0.010𝐿
Source: TxDOT HDM [4]
5. Find the ratio of side flow intercepted to total side flow, Rs.
Equation 6‐21
𝑅 1𝑧𝑣 .
𝑆 𝐿 .
Where: RS = ratio of side flow intercepted to total flow z = 0.15 for English measurement Sx = transverse slope v = approach velocity of flow in gutter (ft/s) L = length of grate (ft).
6. Determine the efficiency of grate, Ef. Use Equation 6‐22.
Equation 6‐22
𝐸 𝑅 𝐸 𝑅 1 𝐸
7. Calculate the interception capacity of the grate, Qi. Use Equation 6‐23. If the interception
capacity is greater than the design discharge, skip step 8.
Equation 6‐23
𝑄 𝐸 𝑄 𝑄 𝑅 𝐸 𝑅 1 𝐸
8. Determine the carryover, CO. Use Equation 6‐24.
Equation 6‐24
𝐶𝑂 𝑄 𝑄
9. Depending on the carryover, select a larger or smaller inlet as needed. If the carryover is
excessive, select a larger configuration of inlet and return to step 3. If the interception capacity
far exceeds the design discharge, consider using a smaller inlet and return to step 3.

6‐14
6.3.6 DesignProcedureforGrateInletsinSagConfigurationsA grate inlet in sag configuration operates in weir flow at low ponding depths. A transition to orifice flow
begins as the ponded depth increases. Use the following procedure for calculating the inlet capacity:
1. Choose a grate of standard dimensions to use as a basis for calculations.
2. Determine an allowable head (h) for the inlet location. This should be the lower of the curb
height and the depth associated with the allowable ponded width. No gutter depression is
applied at grate inlets.
3. Determine the capacity of a grate inlet operating as a weir. Under weir conditions, the grate
perimeter controls the capacity. Figure 6‐6Figure 6‐6 shows the perimeter length for a grate
inlet located next to and away from a curb. The capacity of a grate inlet operating as a weir is
determined using Equation 6‐25.
Equation 6‐25
𝑄 𝐶 𝑃 .
Where: Qw = weir capacity of grate (cfs) Cw = weir coefficient = 3 for English measurement P = perimeter of the grate (ft) as shown in Figure 6‐6Figure 6‐6: A multiplier of 0.5 is required to be applied to the measured perimeter as a safety factor.
h = allowable head on grate (ft).
Figure 6‐6: Perimeter Length for Grate Inlet in Sag Configuration
Source: TxDOT HDM [4]
4. Determine the capacity of a grate inlet operating under orifice flow. Under orifice conditions,
the grate area controls the capacity. The capacity of a grate inlet operating under orifice flow is
computed with Equation 6‐26.

6‐15
Equation 6‐26
𝑄 𝐶 𝐴 2 𝑔 ℎ
Where: Qo = orifice capacity of grate (cfs) Co = orifice flow coefficient = 0.67 A = clear opening area (ft2) of the grate (the total area available for flow). A multiplier of 0.5 is required to be applied to the measured area as a safety factor g = acceleration due to gravity = 32.2 ft/s2
h = allowable head on grate (ft).
5. Compare the calculated capacities from steps 3 and 4 and choose the lower value as the design
capacity. The design capacity of a grated inlet in a sag is based on the minimum flow calculated
from weir and orifice conditions. Figure 6‐7 demonstrates the relationship between weir and
orifice flow. If Qo is greater than Qw (to the left of the intersection in Figure 6‐7), then the
designer would use the capacity calculated with the weir equation. If, however, Qo is less than
Qw (to the right of the intersection), then the capacity as determined with the orifice equation
would be used.
Figure 6‐7: Relationship between Head and Capacity for Weir and Orifice Flow
Source: TxDOT HDM [4]

6‐16
This page intentionally left blank.
7‐1
7 StormDrainSystems
7.1 GeneralRequirementsA. Storm drain systems shall be designed for the 25‐year design storm with the design hydraulic grade
line (HGL) of the system located a minimum of 2 feet below the theoretical gutter flow line of inlets.
B. Storm drain pipe shall be reinforced concrete pipe (AASHTO M170 Class III). Corrugated metal pipe
or plastic pipe shall not be permitted for storm drain systems in the public right‐of‐way.
C. Concrete pipe collars or manufactured transition pieces must be used at all pipe size changes on
trunk lines. For all pipe junctions other than manholes and junction boxes, manufactured wye
connections should be used, and the angle of intersection shall not be greater than 45 degrees. This
includes discharges into box culverts and channels. Laterals shall be connected to trunk lines using
manholes or manufactured wye connections. Inlet laterals will connect only one inlet to the trunk
line. Vertical curves in the conduit will not be permitted, and horizontal curves must meet
manufacturer's requirements for offsetting of the joints.
D. The maximum manhole and junction box spacing for storm drain systems are shown in Table 7‐1.
Manholes or junction boxes shall also be place at: pick up points having three or more laterals; trunk
line size changes for pipes with diameter differences greater than 24 inches; vertical alignment
changes; and, future collection points. The requirement for manholes may be waived if the pipe size
allows direct access into the pipe by maintenance personnel and equipment.
E. The cover over the crown of circular pipe should be at least three feet and should be based on the
type of pipe used, the expected loads and the supporting strength of the pipe. Box sections should
normally have a minimum of one foot of cover; however, box sections may be designed for direct
traffic in special situations with approval.
F. Grates for drop inlets should be designed to facilitate removal for maintenance, but minimize
vandalism. Design shall consider traffic loading, bicycle and pedestrian safety, and a means to secure
grate.
G. The minimum lateral and trunk line pipe shall be 24 inches.
H. At no time shall bypass flow exceed the water spread limits for roadways as defined by Table 5‐1.
Inlets shall be located to prevent water convergence and/or excessive flows through intersections.
I. For arterial or collector streets with super‐elevated sections, no more than 3 cubic feet per second
of the 25‐year flow will be allowed to cross flow from the higher elevation to the lower elevation.
J. All storm sewer conduits to be dedicated to the City of New Braunfels, and outside of the right‐of‐
way, shall be located in drainage easements dedicated to the City of New Braunfels at the time of
final platting of the property. Storm sewer easements shall be at least 15 feet wide. Wider
easements may be required to accommodate larger storm drain systems.

7‐2
Table 7‐1: Maximum Spacing of Manholes and Junction Boxes
Pipe Diameter (in) Max. Spacing (ft)
24 400
27‐39 800
42‐60 1,000
Larger than 60 1,200
7.2 DesignCriteriaA. Storm drain systems shall be designed for the 25‐year design storm and evaluated for the 100‐year
design storm. Systems shall be designed with Manning’s Equation and step backwater methodology
outlined in the TxDOT HDM and summarized in this section. The minimum coefficient of roughness
for concrete storm drain pipe is 0.013.
B. The minimum velocity in a conduit shall be 2.5 feet per second for the 25‐year design storm. This
minimum velocity is required to minimize or prevent the accumulation of sediment in the system.
Such sediment accumulation can severely reduce to ability of the system to convey the design flow.
C. Maximum velocities in conduits are important because of the possibility of excessive erosion of the
storm drainpipe material. Table 7‐2 lists the maximum velocities allowed. Maximum flow velocities
at the downstream end of pipe systems shall be consistent with the maximum allowable velocities
for the receiving channel (refer to Section 8). Erosion protection is required for outfalls into natural
channels.
D. The maximum discharge velocities in the pipe shall not exceed the design velocity of the receiving
channel or conduit at the outfall. The maximum outfall velocity of a conduit in partial flow shall be
computed for partial depth and shall not exceed the maximum permissible velocity of the receiving
channel unless controlled by an appropriate energy dissipater.
E. When establishing the hydraulic gradient of a storm sewer, entrance and exit losses, expansion
losses, manhole and bend losses, junction losses, and minor head losses at points of turbulence shall
be calculated and included in the computation of the hydraulic gradient.
F. The flow lines of storm sewer conduits that discharge into open channels shall be higher than or
equal to the flow line of the channel. Storm sewer outfall pipes shall not be at sump with the
receiving channel.
G. Pipe diameters shall increase downstream. Pipe size and slope shall be designed so that the velocity
of flow will increase progressively down the system or at least will not appreciably decrease at
inlets, bends or other changes in geometry or configuration to prevent sedimentation.
H. At points of change in storm drain size, pipe crowns (soffits) shall be set at the same elevation.
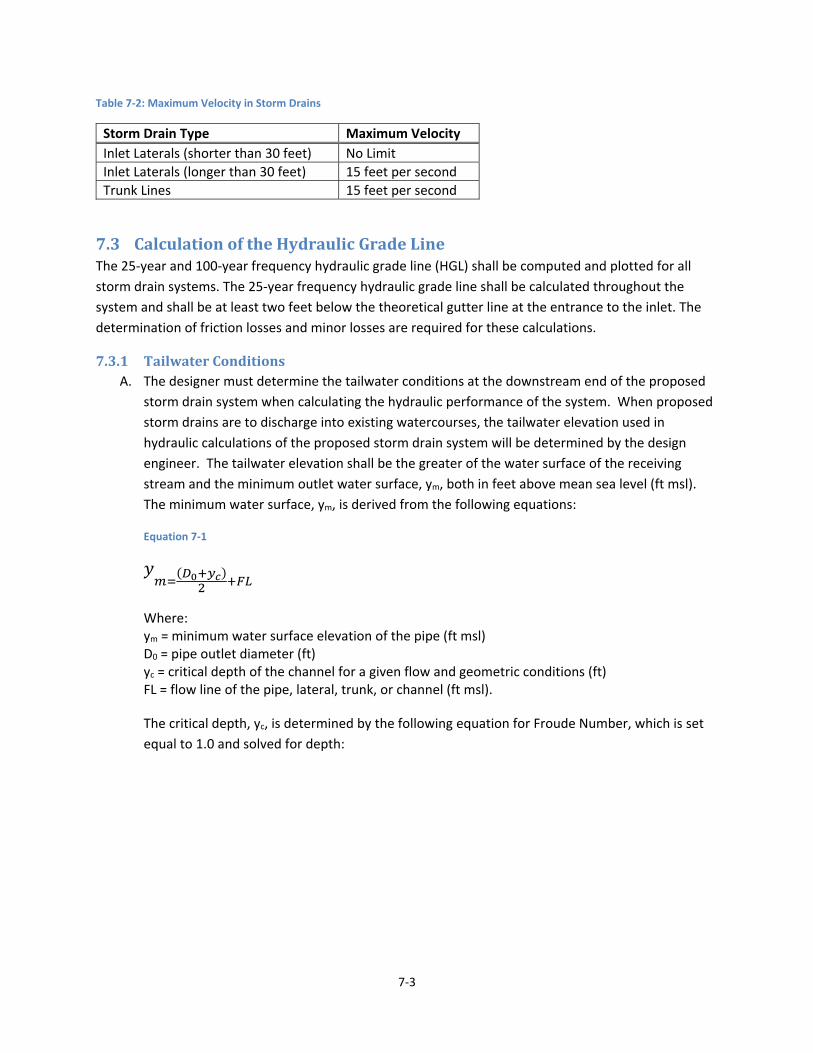
7‐3
Table 7‐2: Maximum Velocity in Storm Drains
Storm Drain Type Maximum Velocity
Inlet Laterals (shorter than 30 feet) No Limit
Inlet Laterals (longer than 30 feet) 15 feet per second
Trunk Lines 15 feet per second
7.3 CalculationoftheHydraulicGradeLineThe 25‐year and 100‐year frequency hydraulic grade line (HGL) shall be computed and plotted for all
storm drain systems. The 25‐year frequency hydraulic grade line shall be calculated throughout the
system and shall be at least two feet below the theoretical gutter line at the entrance to the inlet. The
determination of friction losses and minor losses are required for these calculations.
7.3.1 TailwaterConditionsA. The designer must determine the tailwater conditions at the downstream end of the proposed
storm drain system when calculating the hydraulic performance of the system. When proposed
storm drains are to discharge into existing watercourses, the tailwater elevation used in
hydraulic calculations of the proposed storm drain system will be determined by the design
engineer. The tailwater elevation shall be the greater of the water surface of the receiving
stream and the minimum outlet water surface, ym, both in feet above mean sea level (ft msl).
The minimum water surface, ym, is derived from the following equations:
Equation 7‐1
𝑦
Where: ym = minimum water surface elevation of the pipe (ft msl) D0 = pipe outlet diameter (ft) yc = critical depth of the channel for a given flow and geometric conditions (ft) FL = flow line of the pipe, lateral, trunk, or channel (ft msl).
The critical depth, yc, is determined by the following equation for Froude Number, which is set
equal to 1.0 and solved for depth:
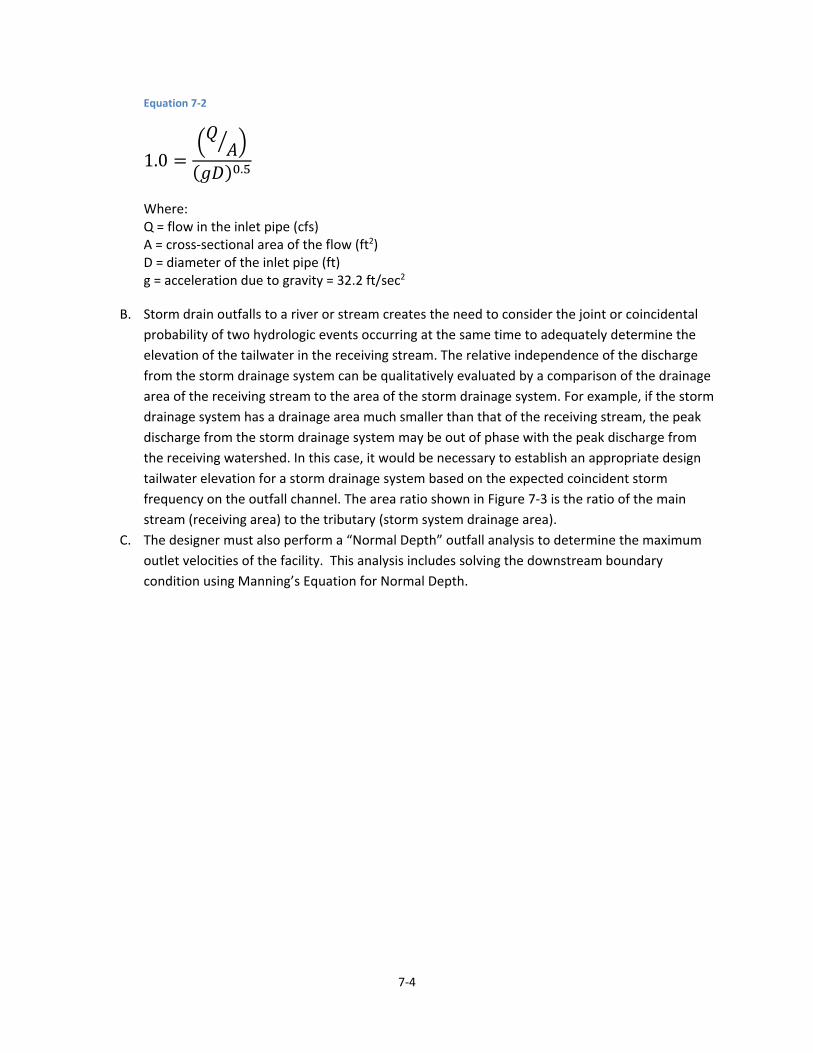
7‐4
Equation 7‐2
1.0
𝑄𝐴
𝑔𝐷 .
Where: Q = flow in the inlet pipe (cfs) A = cross‐sectional area of the flow (ft2) D = diameter of the inlet pipe (ft) g = acceleration due to gravity = 32.2 ft/sec2
B. Storm drain outfalls to a river or stream creates the need to consider the joint or coincidental
probability of two hydrologic events occurring at the same time to adequately determine the
elevation of the tailwater in the receiving stream. The relative independence of the discharge
from the storm drainage system can be qualitatively evaluated by a comparison of the drainage
area of the receiving stream to the area of the storm drainage system. For example, if the storm
drainage system has a drainage area much smaller than that of the receiving stream, the peak
discharge from the storm drainage system may be out of phase with the peak discharge from
the receiving watershed. In this case, it would be necessary to establish an appropriate design
tailwater elevation for a storm drainage system based on the expected coincident storm
frequency on the outfall channel. The area ratio shown in Figure 7‐3 is the ratio of the main
stream (receiving area) to the tributary (storm system drainage area).
C. The designer must also perform a “Normal Depth” outfall analysis to determine the maximum
outlet velocities of the facility. This analysis includes solving the downstream boundary
condition using Manning’s Equation for Normal Depth.
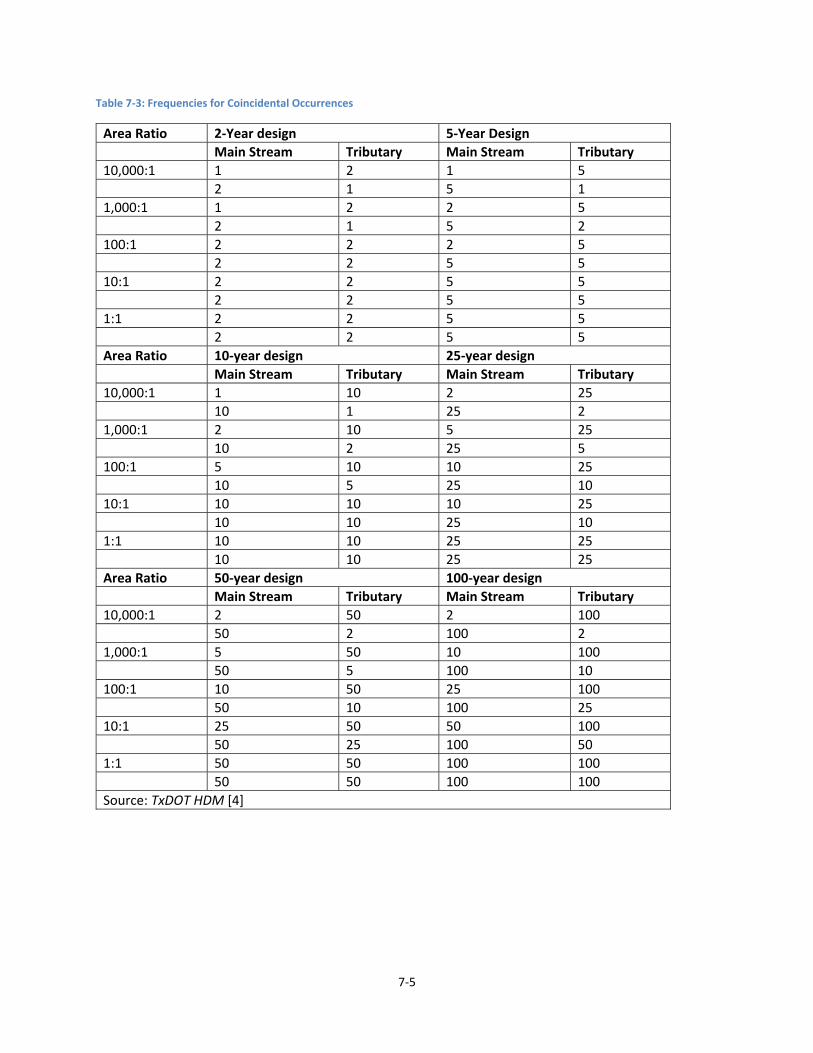
7‐5
Table 7‐3: Frequencies for Coincidental Occurrences
Area Ratio 2‐Year design 5‐Year Design
Main Stream Tributary Main Stream Tributary
10,000:1 1 2 1 5
2 1 5 1
1,000:1 1 2 2 5
2 1 5 2
100:1 2 2 2 5
2 2 5 5
10:1 2 2 5 5
2 2 5 5
1:1 2 2 5 5
2 2 5 5
Area Ratio 10‐year design 25‐year design
Main Stream Tributary Main Stream Tributary
10,000:1 1 10 2 25
10 1 25 2
1,000:1 2 10 5 25
10 2 25 5
100:1 5 10 10 25
10 5 25 10
10:1 10 10 10 25
10 10 25 10
1:1 10 10 25 25
10 10 25 25
Area Ratio 50‐year design 100‐year design
Main Stream Tributary Main Stream Tributary
10,000:1 2 50 2 100
50 2 100 2
1,000:1 5 50 10 100
50 5 100 10
100:1 10 50 25 100
50 10 100 25
10:1 25 50 50 100
50 25 100 50
1:1 50 50 100 100
50 50 100 100
Source: TxDOT HDM [4]
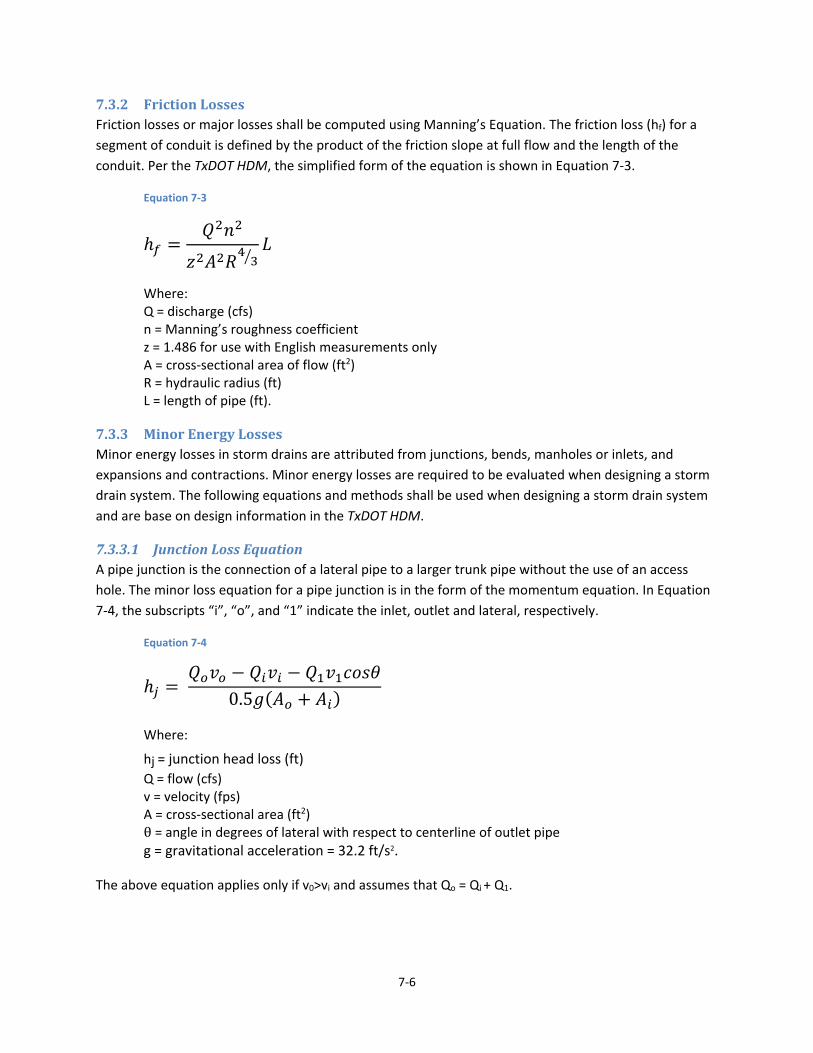
7‐6
7.3.2 FrictionLossesFriction losses or major losses shall be computed using Manning’s Equation. The friction loss (hf) for a
segment of conduit is defined by the product of the friction slope at full flow and the length of the
conduit. Per the TxDOT HDM, the simplified form of the equation is shown in Equation 7‐3.
Equation 7‐3
ℎ𝑄 𝑛
𝑧 𝐴 𝑅𝐿
Where: Q = discharge (cfs) n = Manning’s roughness coefficient z = 1.486 for use with English measurements only A = cross‐sectional area of flow (ft2) R = hydraulic radius (ft) L = length of pipe (ft).
7.3.3 MinorEnergyLossesMinor energy losses in storm drains are attributed from junctions, bends, manholes or inlets, and
expansions and contractions. Minor energy losses are required to be evaluated when designing a storm
drain system. The following equations and methods shall be used when designing a storm drain system
and are base on design information in the TxDOT HDM.
7.3.3.1 JunctionLossEquationA pipe junction is the connection of a lateral pipe to a larger trunk pipe without the use of an access
hole. The minor loss equation for a pipe junction is in the form of the momentum equation. In Equation
7‐4, the subscripts “i”, “o”, and “1” indicate the inlet, outlet and lateral, respectively.
Equation 7‐4
ℎ 𝑄 𝑣 𝑄 𝑣 𝑄 𝑣 𝑐𝑜𝑠𝜃
0.5𝑔 𝐴 𝐴
Where:
hj = junction head loss (ft)
Q = flow (cfs) v = velocity (fps) A = cross‐sectional area (ft2)
θ = angle in degrees of lateral with respect to centerline of outlet pipe g = gravitational acceleration = 32.2 ft/s2.
The above equation applies only if v0>vi and assumes that Qo = Qi + Q1.
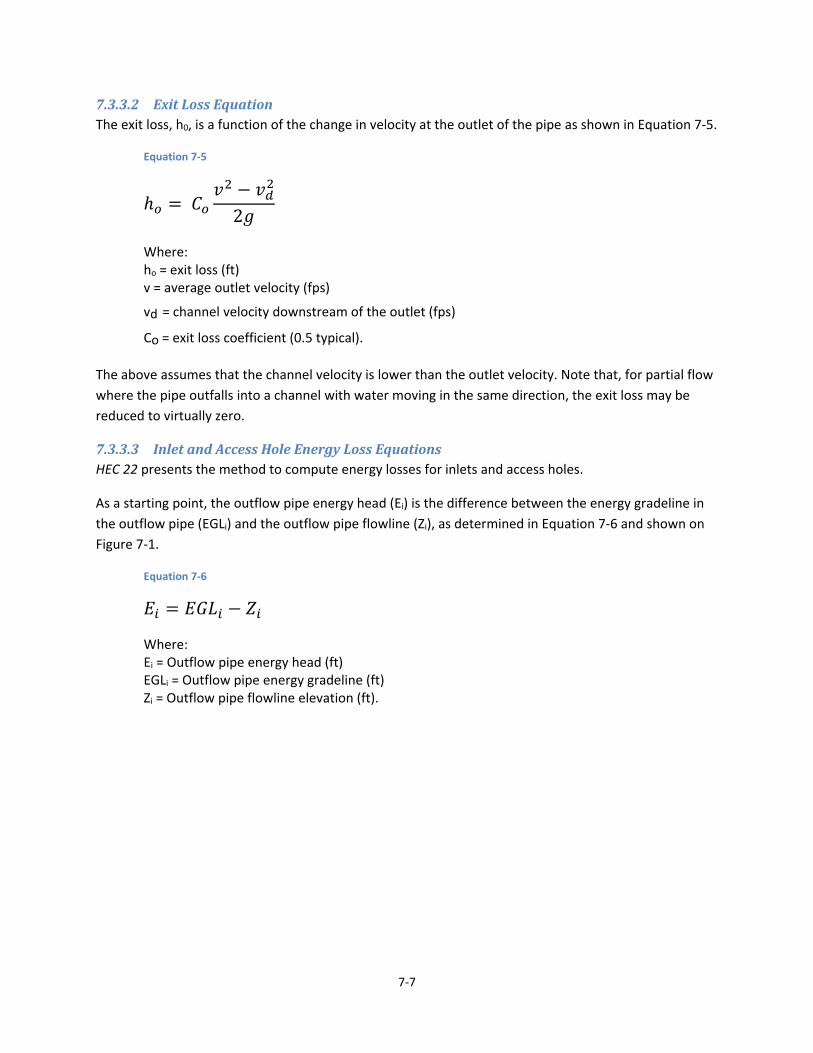
7‐7
7.3.3.2 ExitLossEquationThe exit loss, h0, is a function of the change in velocity at the outlet of the pipe as shown in Equation 7‐5.
Equation 7‐5
ℎ 𝐶𝑣 𝑣
2𝑔
Where: ho = exit loss (ft) v = average outlet velocity (fps)
vd = channel velocity downstream of the outlet (fps)
Co = exit loss coefficient (0.5 typical).
The above assumes that the channel velocity is lower than the outlet velocity. Note that, for partial flow
where the pipe outfalls into a channel with water moving in the same direction, the exit loss may be
reduced to virtually zero.
7.3.3.3 InletandAccessHoleEnergyLossEquationsHEC 22 presents the method to compute energy losses for inlets and access holes.
As a starting point, the outflow pipe energy head (Ei) is the difference between the energy gradeline in
the outflow pipe (EGLi) and the outflow pipe flowline (Zi), as determined in Equation 7‐6 and shown on
Figure 7‐1.
Equation 7‐6
𝐸 𝐸𝐺𝐿 𝑍
Where: Ei = Outflow pipe energy head (ft) EGLi = Outflow pipe energy gradeline (ft) Zi = Outflow pipe flowline elevation (ft).
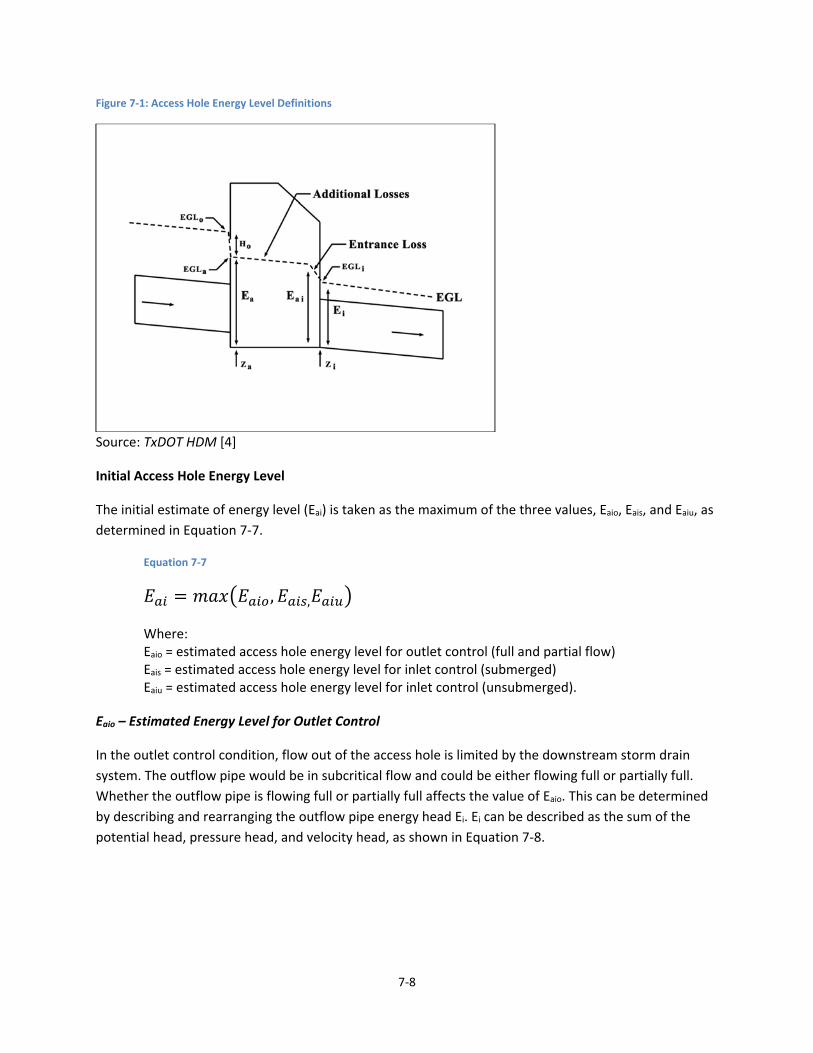
7‐8
Figure 7‐1: Access Hole Energy Level Definitions
Source: TxDOT HDM [4]
Initial Access Hole Energy Level
The initial estimate of energy level (Eai) is taken as the maximum of the three values, Eaio, Eais, and Eaiu, as
determined in Equation 7‐7.
Equation 7‐7
𝐸 𝑚𝑎𝑥 𝐸 ,𝐸 ,𝐸
Where: Eaio = estimated access hole energy level for outlet control (full and partial flow) Eais = estimated access hole energy level for inlet control (submerged) Eaiu = estimated access hole energy level for inlet control (unsubmerged).
Eaio – Estimated Energy Level for Outlet Control
In the outlet control condition, flow out of the access hole is limited by the downstream storm drain
system. The outflow pipe would be in subcritical flow and could be either flowing full or partially full.
Whether the outflow pipe is flowing full or partially full affects the value of Eaio. This can be determined
by describing and rearranging the outflow pipe energy head Ei. Ei can be described as the sum of the
potential head, pressure head, and velocity head, as shown in Equation 7‐8.
7‐9
Equation 7‐8
𝐸 𝑦 𝑃 γ𝑉2𝑔
Where: y = Outflow pipe depth (potential head) (ft) (P/γ) = Outflow pipe pressure head (ft) V2/2g = Outflow pipe velocity head (ft).
Rearranging Equation 7‐8 to isolate the potential head and pressure head gives Equation 7‐9.
Equation 7‐9
𝑦 𝑃 γ 𝐸𝑉2𝑔
If y + (P/ γ) is less than the diameter of the outflow pipe, then the pipe is in partial flow and the
estimated initial structure energy level (Eaio) is equal to zero (Eaio = 0).
If y + (P/ γ) is greater than the diameter of the outflow pipe, then the pipe is in full flow, and the
estimated initial structure energy level (Eaio) is calculated using Equation 7‐10:
Equation 7‐10
𝐸 𝐸 𝐻
Where: Ei = Outflow pipe energy head (ft) Hi = entrance loss assuming outlet control, using Equation 7‐11.
Equation 7‐11
𝐻 0.2𝑉2𝑔
Where: V2/2g = Outflow pipe velocity head (ft).
Eais – Estimated Energy Level for Inlet Control: Submerged
The submerged inlet control energy level (Eais) checks the orifice condition and is estimated using
Equation 7‐12:
7‐10
Equation 7‐12
𝐸 𝐷 𝐷𝐼
Where: Do = Diameter of outflow pipe (ft) DI = Discharge Intensity parameter, calculated by Equation 7‐13:
Equation 7‐13
𝐷𝐼𝑄
𝐴 𝑔𝐷 .
Where: DI = discharge Intensity parameter Q = flow in outfall pipe (cfs) A = area of outflow pipe (ft2) Do = diameter of outflow pipe (ft).
Eaiu – Estimated Energy Level for Inlet Control: Unsubmerged
The unsubmerged inlet control energy level (Eaiu) checks the weir condition and is estimated using
Equation 7‐14:
Equation 7‐14
𝐸 1.6𝐷 𝐷𝐼 .
Adjustments for Benching, Angled Flow, and Plunging Flow
The revised access hole energy level (Ea) is determined by adding three loss factors for: (1) benching
configurations; (2) flows entering the structure at an angle; and (3) plunging flows. Flows entering a
structure from an inlet can be treated as plunging flows and determined by Equation 7‐15.
Equation 7‐15
𝐸 𝐸 𝐻
Where: Ea = the revised access hole energy level Eai = the initial estimate of access hole energy level, calculated using Equation 7‐7 Ha = additional energy loss due to benching, angled inflow and plunging inflow, calculated using
Equation 7‐16.
If Ea is calculated to be less than the outflow pipe energy head (Ei), then Ea should be set equal to Ei.
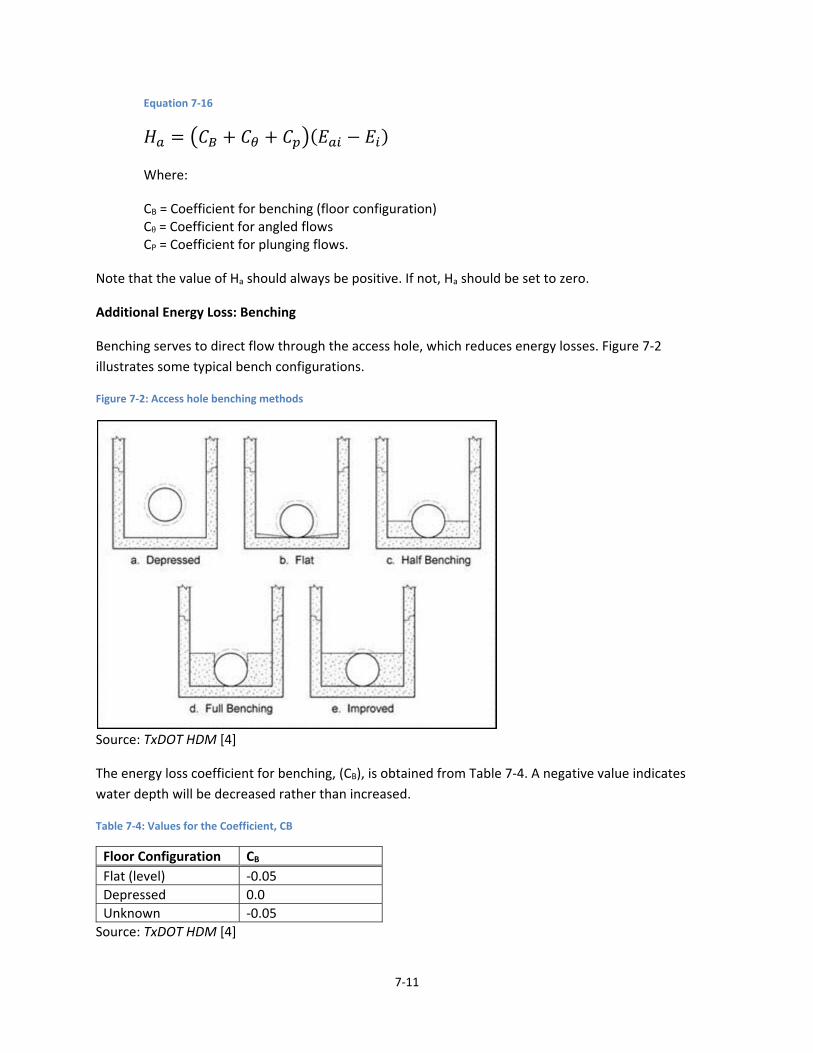
7‐11
Equation 7‐16
𝐻 𝐶 𝐶 𝐶 𝐸 𝐸
Where:
CB = Coefficient for benching (floor configuration) Cθ = Coefficient for angled flows CP = Coefficient for plunging flows.
Note that the value of Ha should always be positive. If not, Ha should be set to zero.
Additional Energy Loss: Benching
Benching serves to direct flow through the access hole, which reduces energy losses. Figure 7‐2
illustrates some typical bench configurations.
Figure 7‐2: Access hole benching methods
Source: TxDOT HDM [4]
The energy loss coefficient for benching, (CB), is obtained from Table 7‐4. A negative value indicates
water depth will be decreased rather than increased.
Table 7‐4: Values for the Coefficient, CB
Floor Configuration CB
Flat (level) ‐0.05
Depressed 0.0
Unknown ‐0.05
Source: TxDOT HDM [4]
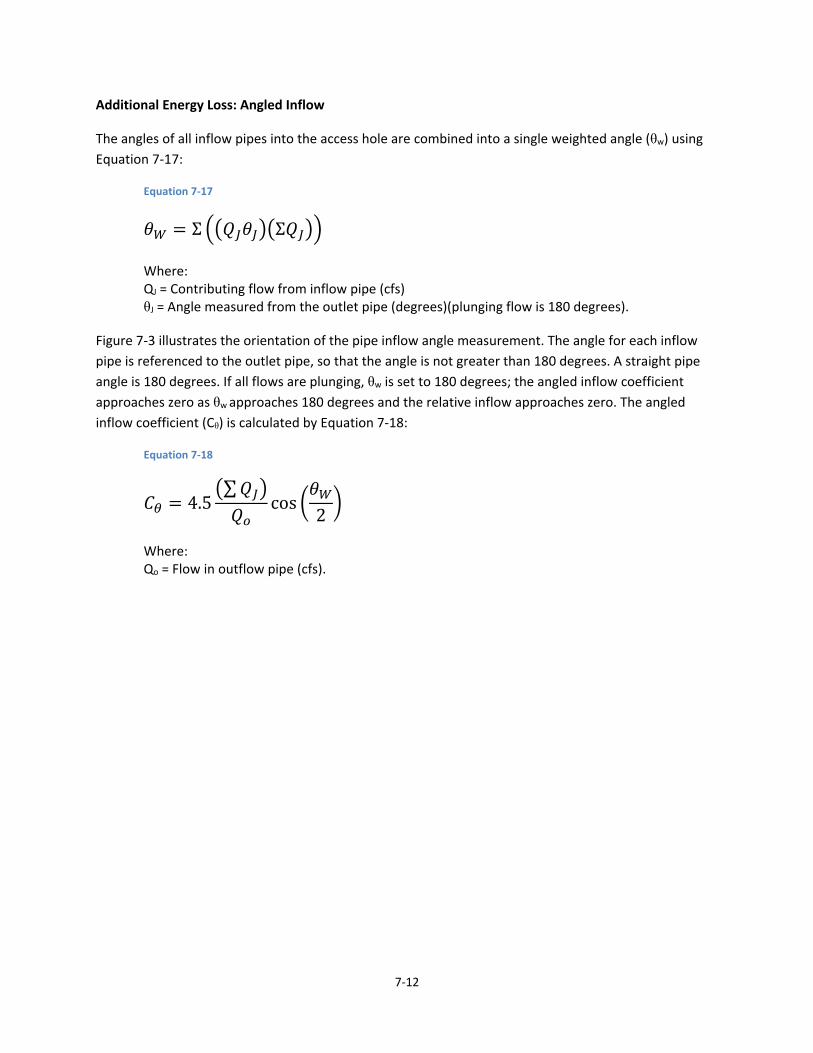
7‐12
Additional Energy Loss: Angled Inflow
The angles of all inflow pipes into the access hole are combined into a single weighted angle (θw) using
Equation 7‐17:
Equation 7‐17
𝜃 Σ 𝑄 𝜃 Σ𝑄
Where: QJ = Contributing flow from inflow pipe (cfs) θJ = Angle measured from the outlet pipe (degrees)(plunging flow is 180 degrees).
Figure 7‐3 illustrates the orientation of the pipe inflow angle measurement. The angle for each inflow
pipe is referenced to the outlet pipe, so that the angle is not greater than 180 degrees. A straight pipe
angle is 180 degrees. If all flows are plunging, θw is set to 180 degrees; the angled inflow coefficient
approaches zero as θw approaches 180 degrees and the relative inflow approaches zero. The angled
inflow coefficient (Cθ) is calculated by Equation 7‐18:
Equation 7‐18
𝐶 4.5∑𝑄𝑄
cos𝜃2
Where: Qo = Flow in outflow pipe (cfs).
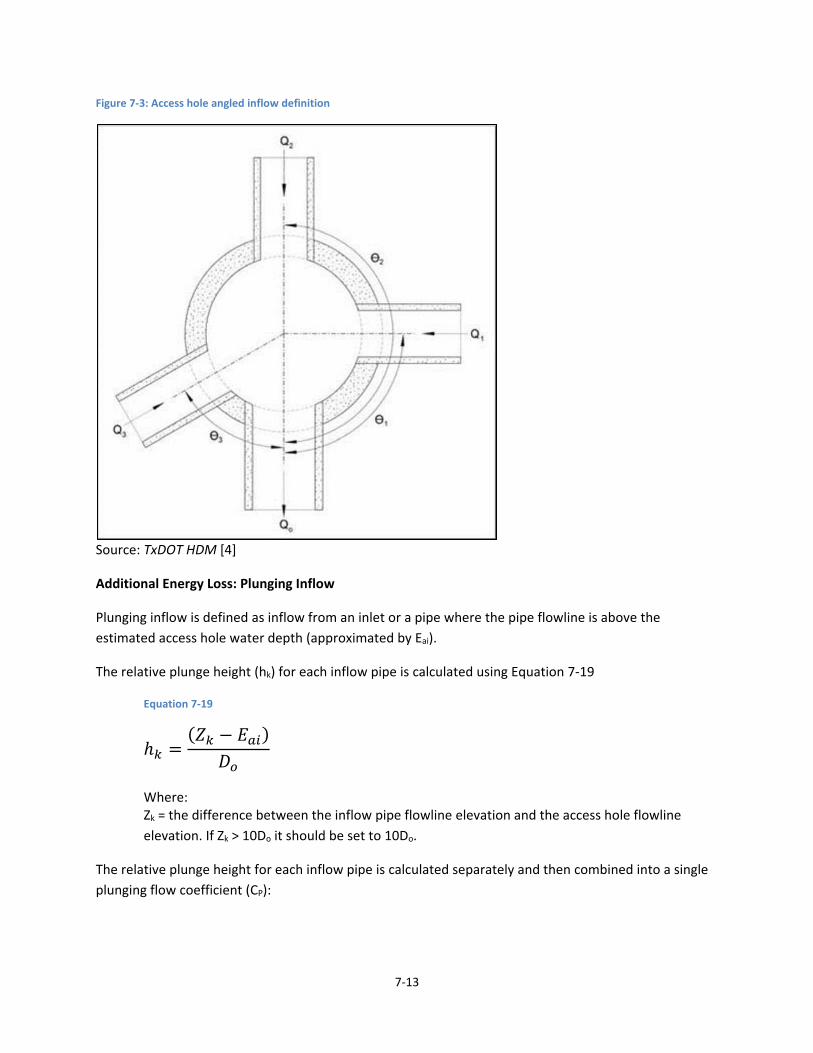
7‐13
Figure 7‐3: Access hole angled inflow definition
Source: TxDOT HDM [4]
Additional Energy Loss: Plunging Inflow
Plunging inflow is defined as inflow from an inlet or a pipe where the pipe flowline is above the
estimated access hole water depth (approximated by Eai).
The relative plunge height (hk) for each inflow pipe is calculated using Equation 7‐19
Equation 7‐19
ℎ𝑍 𝐸𝐷
Where: Zk = the difference between the inflow pipe flowline elevation and the access hole flowline
elevation. If Zk > 10Do it should be set to 10Do.
The relative plunge height for each inflow pipe is calculated separately and then combined into a single
plunging flow coefficient (CP):
7‐14
Equation 7‐20
𝐶∑ 𝑄 𝐻
𝑄
As the proportion of plunging flows approaches zero, CP also approaches zero.
Access Hole Energy Gradeline
Knowing the access hole energy level (Ea) and assuming that the access hole flowline (Za) is the same
elevation as the outflow pipe flowline (Zi) allows determination of the access hole energy gradeline
(EGLa):
Equation 7‐21
𝐸𝐺𝐿 𝐸 𝑍
As described earlier, the potentially highly turbulent nature of flow within the access hole makes
determination of water depth problematic. Research has shown that determining velocity head within
the access hole is very difficult, even in controlled laboratory conditions. However, a reasonable
assumption is to use the EGLa as a comparison elevation to check for potential surcharging of the
system.
Inflow Pipe Exit Losses
The final step is to calculate the energy gradeline into each inflow pipe, whether plunging or non‐
plunging.
Non‐Plunging Inflow Pipe
Non‐plunging inflow pipes are those pipes with a hydraulic connection to the water in the access hole.
Inflow pipes operating under this condition are identified when the revised access hole energy gradeline
(Ea) is greater than the inflow pipe flowline elevation (Zo). In this case, the inflow pipe energy head
(EGLo) is equal to:
Equation 7‐22
𝐸𝐺𝐿 𝐸𝐺𝐿 𝐻
Where: Ho = 0.4(V2/2g) = Inflow pipe exit loss.
Exit loss is calculated in the traditional manner using the inflow pipe velocity head since a condition of
supercritical flow is not a concern on the inflow pipe.

7‐15
Plunging Inflow Pipe
For plunging inflow pipes, the inflow pipe energy gradeline (EGLo) is logically independent of access hole
water depth and losses.
Continuing Computations Upstream
For either the nonplunging or plunging flows, the resulting energy gradeline is used to continue
computations upstream to the next access hole. The procedure of estimating entrance losses, additional
losses, and exit losses is repeated at each access hole.
7.3.4 EnergyGradelineProcedure1. Determine the EGLi and HGLi downstream of the access hole. The EGL and HGL will most likely
need to be followed all the way from the outfall. If the system is being connected to an existing
storm drain, the EGL and HGL will be that of the existing storm drain.
2. Verify flow conditions at the outflow pipe.
a. If HGLi is greater or equal to the soffit of the outflow pipe, the pipe is in full flow.
b. If HGLi is less than the soffit of the outflow pipe but greater than critical depth, the pipe
is not in full flow but downstream conditions still control.
c. If HGLi is less than the soffit of the outflow pipe but greater than critical depth and less
than or equal to normal depth, the pipe is in subcritical partial flow. EGLi becomes the
flowline elevation plus normal depth plus the velocity head.
d. If HGLi is less than critical depth, the pipe is in super‐critical partial flow conditions. Pipe
losses in a supercritical pipe section are not carried upstream.
3. Estimate Ei (outflow pipe energy head) by subtracting Zi (pipe flowline elevation) from the EGLi
using Equation 7‐6. Calculate y + P/γ using Equation 7‐9. Compute DI using Equation 7‐13.
4. Calculate Eai as maximum of Eaio, Eais, and Eaiu as below:
a. If (y + P/γ)>D, then the pipe is in full flow and Eaio = Ei + Hi (Equation 7‐10). If (y + P/γ) < D,
then the pipe is in partial flow and Eaio = 0.
b. Eais = Do(DI)2 (Equation 7‐12)
c. Eaiu = 1.6 Do(DI)0.67 (Equation 7‐14)
If Eai < Ei, the head loss through the access hole will be zero, and Eai = Ei. Go to Step 10.
5. Determine the benching coefficient (CB) using Table 7‐4. The values are the same whether the
bench is submerged or unsubmerged.
6. Determine the energy loss coefficient for angle flow (Cθ) by determining θW for every pipe into
the access hole.
a. Is Ei < inflow pipe flowline? If so, then the flow is plunging and θW for that pipe is 180
degrees.
b. If the pipe angle is straight, then θW for that pipe is 180 degrees.
c. Otherwise, θW is the angle of the inflow pipe relevant to the outflow pipe. Maximum
angle is 180 degrees (straight).
7‐16
Use Equation 7‐17 and Equation 7‐18 to calculate θW and Cθ.
7. Determine the plunging flow coefficient (CP) for every pipe into the access hole using Equation
7‐20. The relative plunge height (hk) is calculated using Equation 7‐19. Zk is the difference
between the access hole flowline elevation and the inflow pipe flowline elevation. If Zk > 10Do, Zk
should be set to 10Do.
8. If the initial estimate of the access hole energy level is greater than the outflow pipe energy
head (Eai > Ei), then Ea = Ei. If Eai < Ei, then Ha = (Eai ‐ Ei)(CB + Cθ + CP). If Ha < 0, set Ha = 0.
9. Calculate the revised access hole energy level (Ea) Equation 7‐15. If Ea < Ei, set Ea = Ei.
10. Compute EGLa by adding Ea to the outflow pipe flowline elevation. Assume HGLa at the access
hole structure is equal to EGLa.
11. Compare EGLa with the critical elevation (ground surface, top of grate, gutter elevation, or other
limits). If EGLa exceeds the critical elevation, modifications must be made to the design.
7.4 HydraulicGradeLineComputationSheetThe design engineer shall provide a HGL computation sheet that depicts all forms or energy loss for each
junction and pipe connection and identifies the upstream and downstream HGL and EGL elevations.
These computations shall be provided for the design storm and 100‐year assessment.

8‐1
8 OpenChannels
8.1 GeneralRequirementsThe general classifications for open channels are: (1) Natural channels, which include all watercourses
that have been carved by nature through erosion; and (2) Engineered channels, which are constructed
or existing channels that have been significantly altered by human effort.
A. The City of New Braunfels encourages the preservation of natural channels and drainage patterns.
Developed drainage flows must enter and depart from a developed area in the same manner and
location as under pre‐development conditions. Any concentration of previous over‐land flow is
required to leave the developed site into a receivable body such as a drainage easement or city
right‐of‐way in a manner so as to not impact downstream properties and/or facilities.
B. Easements or drainage rights‐of‐way shall be provided for all open channels such that the 100‐year
runoff and maintenance access are contained within drainage easements and/or right‐of‐way.
Drainage easements shall be designated on plats for recording. For properties with existing
structural development on previously platted lots, additional drainage easements shall be dedicated
by separate recorded instrument or an amended plat. Easements and FEMA floodways shall not be
encroached upon with fill materials or structures, which would reduce the channel's ability to carry
the 100‐year flood.
a. Easement width shall be at least the width of the water surface from the 100‐year design
storm runoff under post‐development conditions plus maintenance access. Maintenance
access shall extend 2 feet from one side of the channel and 12 feet on the other side of the
channel. If a channel is located parallel and adjoining a roadway, maintenance access shall
extend 2 feet from both sides of the channel.
b. Additional easement width should be provided to allow for channel meandering near bends
of channels
C. Engineered channels shall be designed to meet the applicable design, freeboard and easement
requirements. Freeboard along the outside of channel bends shall include the increased water
surface due to superelevation.
D. Fencing and/or warning signs should be required to prevent public access where flowing water
would pose a safety hazard. Fencing shall be designed in such a way as to not pose a drainage
obstruction.
E. Shear stress shall be computed for all open channels and adequate protection provided in
accordance with Hydraulic Engineering Circular 15: Design of Roadway Channels with Flexible Linings
(HEC 15) [9]. Channels shall be designed to be stable and to not create safety hazards. Side slopes of
vegetative lined channels should be 3:1 or flatter (4:1 or flatter along roadways) in channels with
depths greater than 2 feet. Recommended maximum water velocities for earthen channels are given
in Table 8‐1. Erosion control or energy dissipation devices should be used to control velocities such
that channel degradation does not occur. Bank stabilization measures shall not reduce channel
capacity and shall follow sound engineering practices

8‐2
Table 8‐1: Maximum Velocity in Open Channels
Channel Lining Material1 Channel Slope (%) Maximum Velocity (fps)
Earthen Channels
0 – 5 6
5 – 10 5
> 10 4
Rock (native subgrades) 10
Gabion Lined 12
Reinforced concrete lining 20
Rock Riprap (placed rock) 12
Prefabricated lining products Use 90% of manufacturer’s recommended velocity limits
1 Uniform, in well‐maintained condition.
F. Should diversion of a natural drainage way be required, sufficient work shall be done upstream
and/or downstream to provide all affected properties at least the same level of flood protection and
erosion control that existed prior to the diversion. The time length of a diversion channel must be at
least as long as the segment of natural channel being replaced so that velocity is not increased.
G. Fencing shall be required adjacent to the channel where channel vertical wall heights exceed 30
inches and where channel side slopes exceed 2:1 and the depth is greater than 30 inches. Fencing
shall be a minimum of 42 inches high, provide for maintenance access and not hinder sight distance
for traffic. Fence type and location shall be determined by the design engineer.
H. Concrete pilot channels shall be provided for channels with longitudinal slopes less than 0.5 percent
or bottom widths greater than 30 feet. The minimum bottom width of the pilot channel shall be 4
feet and the minimum earthen slope draining toward the pilot channel shall be 1 percent.
8.2 DesignCriteriaA. The depth and velocity of flow are necessary for the design and analysis of channel linings and
structures. The depth and velocity at which a given discharge flows in a channel of known geometry,
roughness, and slope can be determined through hydraulic analysis. The following two methods are
commonly used in the hydraulic analysis of open channels:
1. Slope Conveyance Method
2. Standard Step Backwater Method
The Slope Conveyance and Standard Step Backwater Methods have been summarized from the
TxDOT HDM.
B. Channels should have sufficient gradient, depending upon the type of soil or channel lining material,
to provide velocities that will be self‐cleaning (greater than 2 feet per second for the 2‐year storm
event) but not cause erosion due to excessive shear stress.
C. Appropriate energy dissipating structures may be used to control erosion due to high velocities at
pipe system outfalls and steep grades and shall be designed in accordance with accepted design
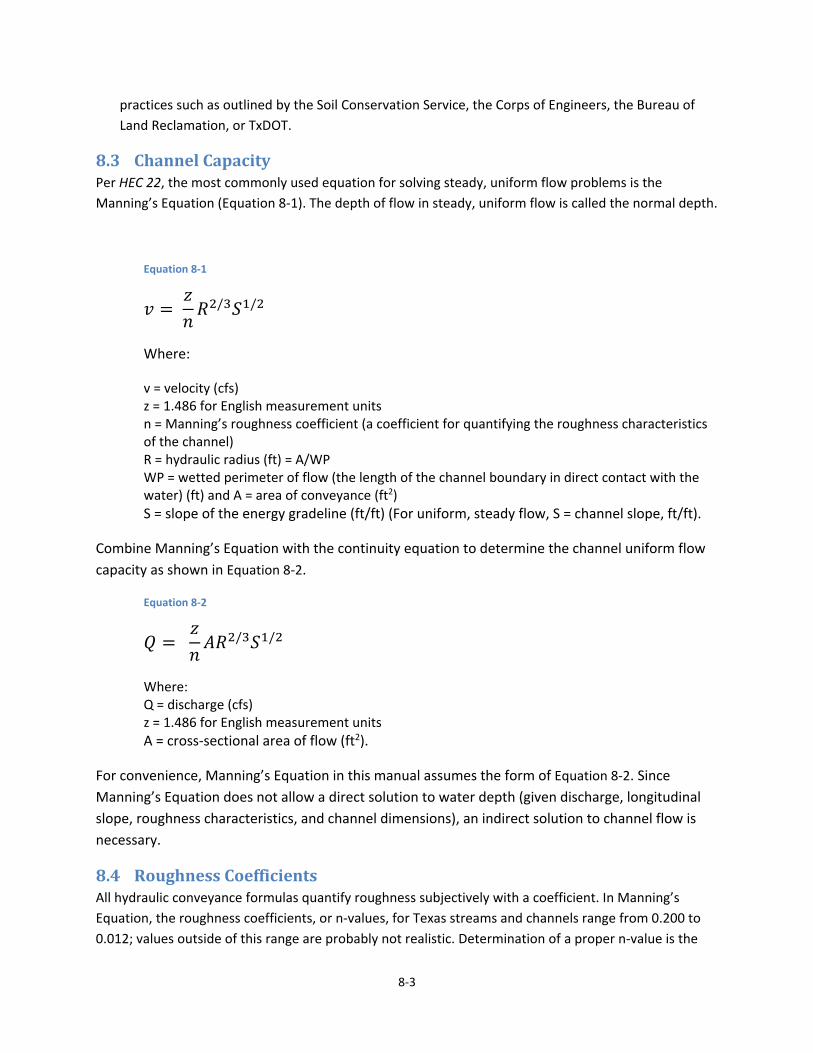
8‐3
practices such as outlined by the Soil Conservation Service, the Corps of Engineers, the Bureau of
Land Reclamation, or TxDOT.
8.3 ChannelCapacityPer HEC 22, the most commonly used equation for solving steady, uniform flow problems is the
Manning’s Equation (Equation 8‐1). The depth of flow in steady, uniform flow is called the normal depth.
Equation 8‐1
𝑣 𝑧𝑛𝑅 / 𝑆 /
Where:
v = velocity (cfs) z = 1.486 for English measurement units n = Manning’s roughness coefficient (a coefficient for quantifying the roughness characteristics of the channel) R = hydraulic radius (ft) = A/WP WP = wetted perimeter of flow (the length of the channel boundary in direct contact with the water) (ft) and A = area of conveyance (ft2)
S = slope of the energy gradeline (ft/ft) (For uniform, steady flow, S = channel slope, ft/ft).
Combine Manning’s Equation with the continuity equation to determine the channel uniform flow
capacity as shown in Equation 8‐2.
Equation 8‐2
𝑄 𝑧𝑛𝐴𝑅 / 𝑆 /
Where: Q = discharge (cfs) z = 1.486 for English measurement units
A = cross‐sectional area of flow (ft2).
For convenience, Manning’s Equation in this manual assumes the form of Equation 8‐2. Since
Manning’s Equation does not allow a direct solution to water depth (given discharge, longitudinal
slope, roughness characteristics, and channel dimensions), an indirect solution to channel flow is
necessary.
8.4 RoughnessCoefficientsAll hydraulic conveyance formulas quantify roughness subjectively with a coefficient. In Manning’s
Equation, the roughness coefficients, or n‐values, for Texas streams and channels range from 0.200 to
0.012; values outside of this range are probably not realistic. Determination of a proper n‐value is the

8‐4
most difficult and critical of the engineering judgments required when using the Manning’s Equation.
The recommended Manning's roughness coefficients ("N" values) for use in open channel hydraulic
calculations are listed in Table 8‐2.
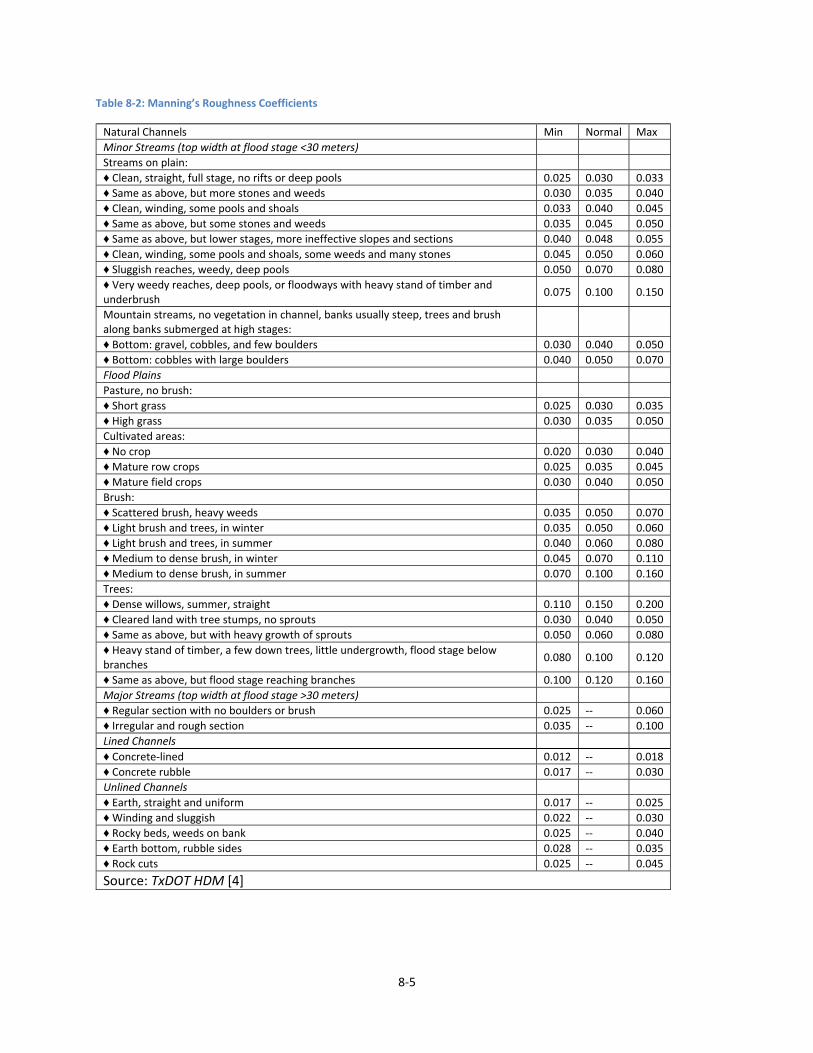
8‐5
Table 8‐2: Manning’s Roughness Coefficients
Natural Channels Min Normal Max
Minor Streams (top width at flood stage <30 meters)
Streams on plain:
♦ Clean, straight, full stage, no rifts or deep pools 0.025 0.030 0.033
♦ Same as above, but more stones and weeds 0.030 0.035 0.040
♦ Clean, winding, some pools and shoals 0.033 0.040 0.045
♦ Same as above, but some stones and weeds 0.035 0.045 0.050
♦ Same as above, but lower stages, more ineffective slopes and sections 0.040 0.048 0.055
♦ Clean, winding, some pools and shoals, some weeds and many stones 0.045 0.050 0.060
♦ Sluggish reaches, weedy, deep pools 0.050 0.070 0.080
♦ Very weedy reaches, deep pools, or floodways with heavy stand of timber and underbrush
0.075 0.100 0.150
Mountain streams, no vegetation in channel, banks usually steep, trees and brush along banks submerged at high stages:
♦ Bottom: gravel, cobbles, and few boulders 0.030 0.040 0.050
♦ Bottom: cobbles with large boulders 0.040 0.050 0.070
Flood Plains
Pasture, no brush:
♦ Short grass 0.025 0.030 0.035
♦ High grass 0.030 0.035 0.050
Cultivated areas:
♦ No crop 0.020 0.030 0.040
♦ Mature row crops 0.025 0.035 0.045
♦ Mature field crops 0.030 0.040 0.050
Brush:
♦ Scattered brush, heavy weeds 0.035 0.050 0.070
♦ Light brush and trees, in winter 0.035 0.050 0.060
♦ Light brush and trees, in summer 0.040 0.060 0.080
♦ Medium to dense brush, in winter 0.045 0.070 0.110
♦ Medium to dense brush, in summer 0.070 0.100 0.160
Trees:
♦ Dense willows, summer, straight 0.110 0.150 0.200
♦ Cleared land with tree stumps, no sprouts 0.030 0.040 0.050
♦ Same as above, but with heavy growth of sprouts 0.050 0.060 0.080
♦ Heavy stand of timber, a few down trees, little undergrowth, flood stage below branches
0.080 0.100 0.120
♦ Same as above, but flood stage reaching branches 0.100 0.120 0.160
Major Streams (top width at flood stage >30 meters)
♦ Regular section with no boulders or brush 0.025 ‐‐ 0.060
♦ Irregular and rough section 0.035 ‐‐ 0.100
Lined Channels
♦ Concrete‐lined 0.012 ‐‐ 0.018
♦ Concrete rubble 0.017 ‐‐ 0.030
Unlined Channels
♦ Earth, straight and uniform 0.017 ‐‐ 0.025
♦ Winding and sluggish 0.022 ‐‐ 0.030
♦ Rocky beds, weeds on bank 0.025 ‐‐ 0.040
♦ Earth bottom, rubble sides 0.028 ‐‐ 0.035
♦ Rock cuts 0.025 ‐‐ 0.045
Source: TxDOT HDM [4]

8‐6
In some instances, such as a trapezoidal section under a bridge, the n‐value may vary drastically within a
section, but the section should not be sub‐divided. If the n‐value varies as such, use a weighted n‐value
(nw). This procedure is defined by Equation 8‐3 as follows:
Equation 8‐3
𝑛∑ 𝑛 𝑊𝑃∑𝑊𝑃
Where: WP = subsection wetted perimeter n = subsection n‐value.
8.5 SubdividingCross‐SectionsBecause any estimating method involves the calculation of a series of hydraulic characteristics of the
cross section, arbitrary water‐surface elevations are applied to the cross section. The computation of
flow or conveyance for each water‐surface application requires a hydraulic radius. The hydraulic radius
is intended as an average depth of a conveyance. A hydraulic radius and subsequent conveyance is
calculated under each arbitrary water surface elevation. If there is significant irregularity in the depth
across the section, the hydraulic radius may not accurately represent the flow conditions. Divide the
cross section into sufficient subsections so that realistic hydraulic radii are derived.
Subdivide cross sections primarily at major breaks in geometry. Additionally, major changes in
roughness may call for additional subdivisions. Subdivisions for major breaks in geometry or for major
changes in roughness should maintain these approximate basic shapes so that the distribution of flow or
conveyance is nearly uniform in a subsection.
Documentation must be submitted by the design engineer describing the methodology used to
subdivide cross sections for review and approval by the City Engineer.
8.6 SlopeConveyanceMethodThe Slope Conveyance Method requires more judgment and assumptions than the Standard Step
Method. In many situations, however, use of the Slope Conveyance Method is justified, as in the
following conditions:
Standard roadway ditches
Culverts
Storm drain outfalls
The procedure involves an iterative development of calculated discharges associated with assumed
water surface elevations in a typical section. The series of assumed water surface elevations and
associated discharges comprise the stage‐discharge relationship. When stream gauge information exists,
a measured relationship (usually termed a “rating curve”) may be available.

8‐7
A channel cross section and associated roughness and slope data considered typical of the stream reach
are required for this analysis. A typical section is one that represents the average characteristics of the
stream near the point of interest. This cross section should be located downstream of and as close as
reasonably possible to the proposed drainage facility discharge site. The closer to the proposed site a
typical cross section is taken, the less error in the final water surface elevation
A typical cross section should be used for the analysis. If a cross section does not exist, then a “control”
cross section (also downstream) should be used. The depth of flow in a control cross section is
controlled by a constriction of the channel, a damming effect across the channel, or possibly an area
with extreme roughness coefficients. The cross section should be normal to the direction of stream flow
under flood conditions.
After identifying the cross section, apply Manning’s roughness coefficients (n‐values). Divide the cross
section with vertical boundaries at significant changes in cross‐section shape or at changes in vegetation
cover and roughness components. Determine the average bed slope near the site.
8.6.1 SlopeConveyanceProcedureThe calculation of the stage‐discharge relationship should proceed as described in this section.
1. Select a trial starting depth and apply it to a plot of the cross section.
2. Compute the area and wetted perimeter weighted n‐value for each submerged subsection.
3. Compute the subsection discharges with Manning’s Equation. Use the subsection values for
roughness, area, wetted perimeter, and slope. The sum of all of the incremental discharges
represents the total discharge for each assumed water surface elevation. NOTE: Compute the
average velocity for the section by substituting the total section area and total discharge into
the continuity equation (Equation 8‐4).
4. Tabulate or plot the water surface elevation and resulting discharge (stage versus discharge).
5. Repeat the above steps with a new channel depth, or add a depth increment to the trial depth.
The choice of elevation increment is somewhat subjective. However, if the increments are less
than about 0.25 feet, considerable calculation is required. On the other hand, if the increments
are greater than 1.5 feet, the resulting stage‐discharge relationship may not be detailed enough
for use in design.
6. Determine the depth for a given discharge by interpolation of the stage versus discharge table
or plot.
Equation 8‐4
𝑉 𝑄𝐴
8‐8
8.7 StandardStepBackwaterMethodCalculations of water surface profiles can be accomplished by using the Standard Step Method. Water
surface profiles for the design frequency floods shall be computed for all channels and shown on all final
drawings.
The Corps of Engineers HEC‐RAS Water Surface Profile Programs may also be used to perform standard
step backwater calculations, and if used, a summary table shall be submitted to the City. In addition, the
design engineer shall provide documentation that justifies the flow regime (subcritical, supercritical, or
mixed) used in the analysis. Losses due to changes in velocity, drops, bridge openings, and other
obstructions shall be considered in the backwater computations, as described in the HEC‐RAS User’s
Manuals.
Use the Standard Step Method for analysis in the following instances:
Results from the Slope‐Conveyance Method may not be accurate enough
The drainage facility’s level of importance deserves a more sophisticated channel analysis
The channel is highly irregular with numerous or significant variations of geometry, roughness
characteristics, or stream confluences
A controlling structure affects backwater.
This procedure applies to most open channel flow, including streams having an irregular channel with
the cross section consisting of a main channel and separate overbank areas with individual n‐values. Use
this method either for supercritical flow or for subcritical flow.
8.7.1 StandardStepDataRequirementsAt least four cross sections are required to complete this procedure. The number and frequency of cross
sections required is a direct function of the irregularity of the stream reach. The cross sections should
represent the reach between them. A system of measurement or stationing between cross sections is
also required. Evaluate roughness characteristics (n‐values) and associated sub‐section boundaries for
all of the cross sections.
The selection of cross sections used in this method is critical. As the irregularities of a stream vary along
a natural stream reach, accommodate the influence of the varying cross‐sectional geometry.
Incorporate transitional cross sections into the series of cross sections making up the stream reach.
8.7.2 StandardStepProcedureThe Standard Step Method uses the Energy Balance Equation, Equation 8‐5, which allows the water
surface elevation at the upstream section (noted as subscript 2) to be found from a known water surface
elevation at the downstream section (noted as subscript 1). The following procedure assumes that cross
sections, stationing, discharges, and n‐values have already been established. Generally, for Texas, the
assumption of subcritical flow will be appropriate to start the process. Subsequent calculations will
check this assumption.

8‐9
Equation 8‐5
𝑧 𝑑 𝛼𝑣2𝑔
𝑧 𝑑 𝛼𝑣2𝑔
ℎ 𝑜𝑡ℎ𝑒𝑟 𝑙𝑜𝑠𝑠𝑒𝑠
Where: z = elevation of the streambed (ft) d = depth of flow (ft) α = kinetic energy coefficient v = average velocity of flow (fps)
hf = friction head loss from upstream to downstream (ft)
g = acceleration due to gravity = 32.2 ft/ s2.
1. Select the discharge to be used. Determine a starting water surface elevation. For subcritical
flow, begin at the most downstream cross section. Use one of the following methods to
establish a starting water surface elevation for the selected discharge: a measured elevation, the
Slope‐Conveyance Method to determine the stage for an appropriate discharge, or an existing
(verified) rating curve.
2. Referring to Figure 8‐1 and Equation 8‐5, consider the downstream water surface to be section 1
and calculate the following variables:
z1 = flowline elevation at section 1 y1 = tailwater minus flowline elevation α= kinetic energy coefficient (For simple cases or where conveyance does not vary significantly,
it may be possible to ignore this coefficient).
Figure 8‐1: EGL for Water Surface Profile
Source: TxDOT HDM [4]
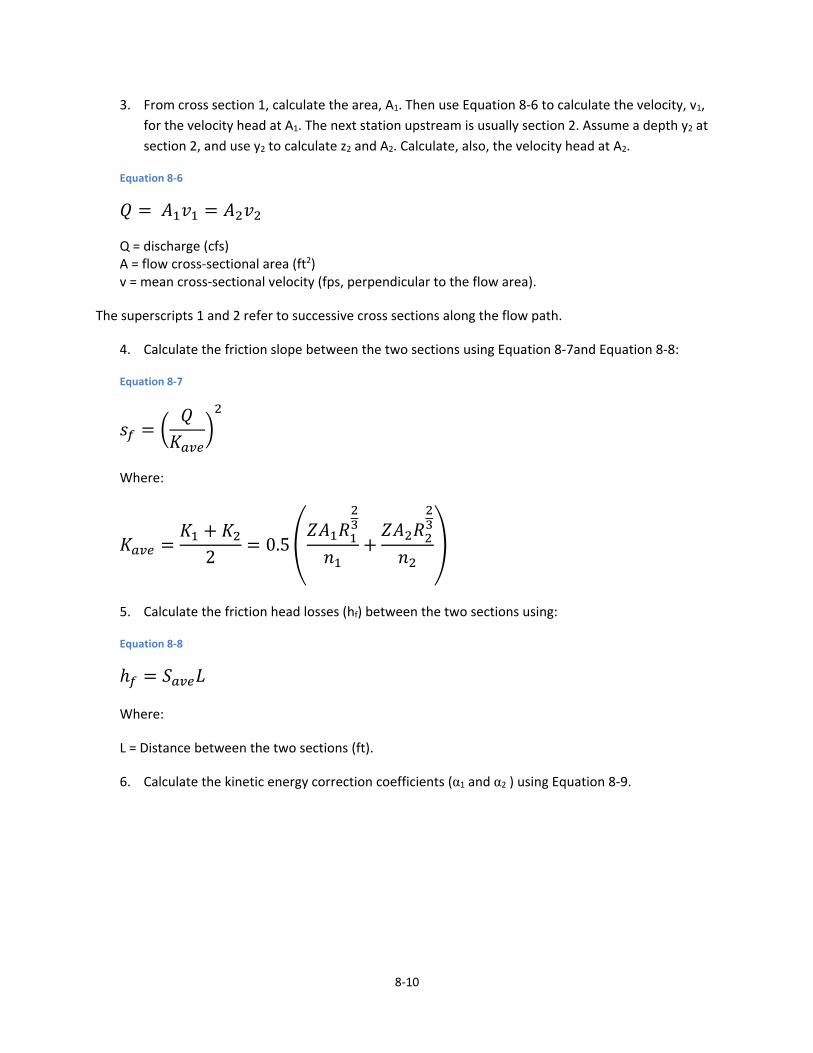
8‐10
3. From cross section 1, calculate the area, A1. Then use Equation 8‐6 to calculate the velocity, v1,
for the velocity head at A1. The next station upstream is usually section 2. Assume a depth y2 at
section 2, and use y2 to calculate z2 and A2. Calculate, also, the velocity head at A2.
Equation 8‐6
𝑄 𝐴 𝑣 𝐴 𝑣
Q = discharge (cfs) A = flow cross‐sectional area (ft2) v = mean cross‐sectional velocity (fps, perpendicular to the flow area).
The superscripts 1 and 2 refer to successive cross sections along the flow path.
4. Calculate the friction slope between the two sections using Equation 8‐7and Equation 8‐8:
Equation 8‐7
𝑠𝑄𝐾
Where:
𝐾𝐾 𝐾
20.5
𝑍𝐴 𝑅𝑛
𝑍𝐴 𝑅𝑛
5. Calculate the friction head losses (hf) between the two sections using:
Equation 8‐8
ℎ 𝑆 𝐿
Where:
L = Distance between the two sections (ft).
6. Calculate the kinetic energy correction coefficients (α1 and α2 ) using Equation 8‐9.
8‐11
Equation 8‐9
𝛼∑ 𝑄 𝑣𝑄𝑣
∑ 𝐾 𝐾 /𝐴𝐾 𝐾 /𝐴
Where:
vi = average velocity in subsection (fps) (see Continuity Equation section)
Qi = discharge in same subsection (cfs) (see Continuity Equation section)
Q = total discharge in channel (cfs) v = average velocity in river at section or Q/A (ft/s)
Ki = conveyance in subsection (cfs) (see Conveyance section) Ai = flow area of same subsection (ft2)
Kt = total conveyance for cross‐section (cfs)
At = total flow area of cross‐section (ft2).
7. Where appropriate, calculate expansion losses (he) using Equation 8‐10 and contraction losses
(hc) using Equation 8‐11 (Other losses, such as bend losses, are often disregarded as an
unnecessary refinement.)
Equation 8‐10
ℎ 𝐾∆𝑉2𝑔
Where: Ke = 0.1 for a gentle contraction Ke = 0.5 for a sudden contraction
Equation 8‐11
ℎ 𝐾∆𝑉2𝑔
Where:
Kc = 0.1 for a gentle contraction
Kc = 0.5 for a sudden contraction
8. Check the energy equation for balance using Equation 8‐12 and Equation 8‐13.
8‐12
Equation 8‐12
𝐿 𝑧 𝑦 𝛼𝑣2𝑔
Equation 8‐13
𝑅 𝑧 𝑦 𝛼𝑣2𝑔
ℎ ℎ ℎ
The following considerations apply:
if L=R within a reasonable tolerance, then the assumed depth at Section 1 is okay. This will be
the calculated water surface depth at Section 1; proceed to step (9)
if L≠R, go back to step (3) using a different assumed depth.
9. Determine the critical depth (dc) at the cross section and find the uniform depth (du) by
iteration. If, when running a supercritical profile, the results indicate that critical depth is greater
than uniform depth, then it is possible the profile at that cross section is supercritical. For sub‐
critical flow, the process is similar but the calculations must begin at the upstream section and
proceed downstream.
10. Assign the calculated depth from step (8) as the downstream elevation (Section 1) and the next
section upstream as Section 2, and repeat steps (2) through (10).
11. Repeat these steps until all of the sections along the reach have been addressed.
8.8 SupercriticalFlowThe Froude Number provides a relationship between flow velocity and the hydraulic depth of flow, and
gravitational action, and shall be calculated for all channel improvements designs. Subcritical flow
conditions occur when the Froude Number is less than 1.0 and supercritical flow conditions exist in lined
channels when the Froude Number exceeds 1.0.
If a channel’s normal depth is supercritical, its alternate depth is a deeper subcritical depth.
Obstructions that may enter a stream during a storm event may cause supercritical flows to experience
a hydraulic jump and become subcritical flows. When it is calculated that supercritical conditions could
occur for the design storm, the depth of the channel must be at least the alternate depth plus the
required freeboard. Adequate protection of the channel must be provided to protect against
supercritical flow.
Subcritical flow conditions are recommended for all channel designs, as supercritical flow tends to have
high velocities and high potential for channel erosion. Supercritical flow conditions will not be allowed
in channels with a vegetative lining. Subcritical flow conditions may be achieved by using energy
dissipators in areas where the existing topography will not allow subcritical flow conditions to occur
8‐13
naturally. In all cases, the channel improvements shall be designed to avoid the unstable transitional
flow conditions that occur when the Froude Number is between 0.9 and 1.1.
8.9 FlowinBendsAdequate freeboard must be provided for a channel, ditch and swales as shown in Table 2‐2Table 2‐2.
Flow around a bend in an open channel induces centrifugal forces because of the change in flow
direction. This results in a superelevation of the water surface at the outside of bends and can cause the
flow to splash over the side of the channel if adequate freeboard is not provided. This superelevation
can be estimated by equation using Equation 8‐14 from HEC‐15.
Equation 8‐14
Δ𝐻𝑉 𝑇𝑔𝑅
Where:
∆H = Difference in water surface elevation between the inner and outer banks of the channel in the bend, (ft) V = Average velocity (fps) T = Surface width of the channel (ft) Rc = Radius to the centerline of the channel (ft) g = Gravitational acceleration = 32.2 ft/s2.
Equation 8‐14 is valid for subcritical flow conditions. The elevation of the water surface at the outer
channel bank will be Δd/2 higher than the centerline water surface elevation (the average water surface
elevation immediately before the bend) and the elevation of the water surface at the inner channel
bank will be Δd/2 lower than the centerline water surface elevation.
Flow around a channel bend also imposes higher shear stress on the channel bottom and banks and may
impact channel stability. Refer to HEC 15 for further guidance if shear stress around a channel bend is
anticipated to cause channel erosion.
8.10 ShearStressShear stress shall be computed for all open channels and adequate protection shall be provided based
on the tractive force method described in HEC 15 and the permissible shear stresses reported in the
TxDOT HDM.
A. The hydrodynamic force of water flowing in a channel is known as the tractive force. The basis
for stable channel design with flexible lining materials is that flow‐induced tractive force should
not exceed the permissible or critical shear stress of the lining materials. In a uniform flow, the
tractive force is equal to the effective component of the drag force acting on the body of water,
parallel to the channel bottom [10]. The mean boundary shear stress applied to the wetted
perimeter is computed with Equation 8‐15.
8‐14
Equation 8‐15
𝜏 𝛾𝑅𝑆
Where: τo = mean boundary shear stress (lb/ft2) γ = unit weight of water (62.4 lb/ft3) R = hydraulic radius (ft) So = average bottom slope (equal to energy slope for uniform flow) (ft/ft).
B. The maximum shear stress on a channel bottom, τd, and on the channel side, τs, in a straight
channel depends on the channel shape. To simplify the design process, the maximum channel
bottom shear stress is computed with Equation 8‐16.
Equation 8‐16
𝜏 𝛾𝑑𝑆
Where: τd = shear stress in channel at maximum depth (lb/ft2)
d = maximum depth of flow in the channel for the design discharge (ft).
C. Determine channel lining or protection needed. Calculate uniform flow depth (ym in ft or m) at
design discharge using the Slope Conveyance Method. Compute maximum shear stress at
normal depth using Equation 8‐16. Select a lining and determine the permissible shear stress (in
lbs/ft2 or N/m2) using Table 8‐3 and Table 8‐4. If τd < τp, then the lining is acceptable.
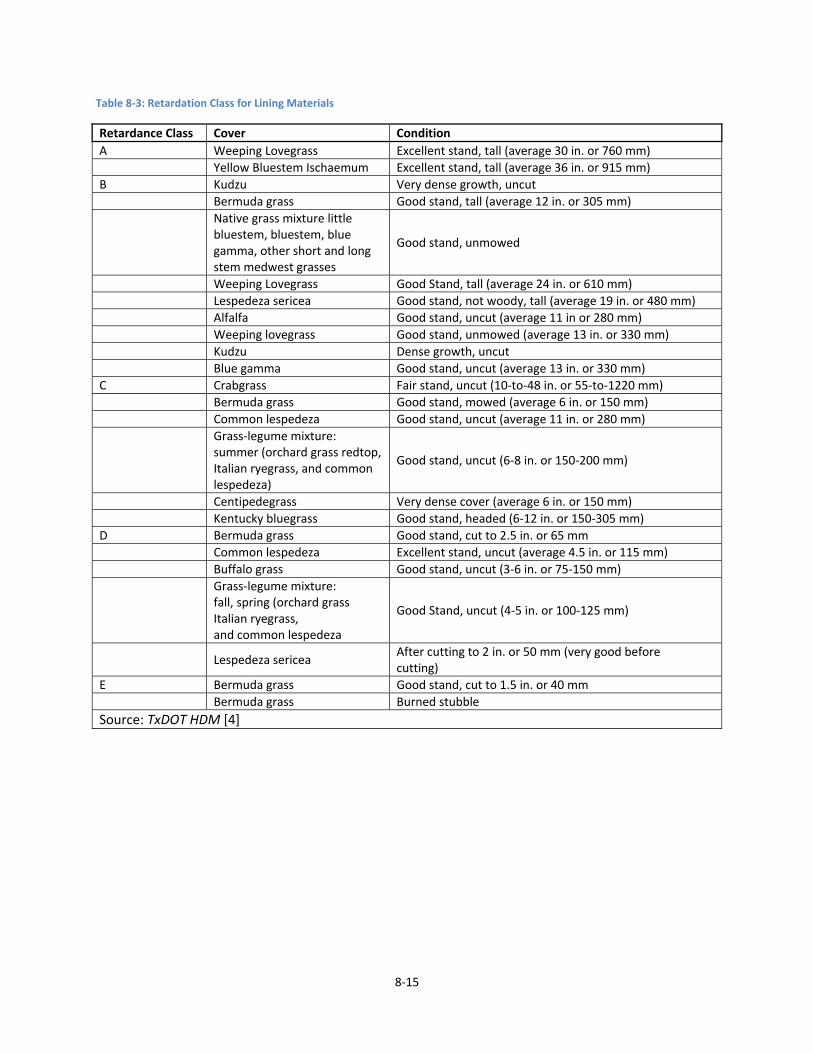
8‐15
Table 8‐3: Retardation Class for Lining Materials
Retardance Class Cover Condition
A Weeping Lovegrass Excellent stand, tall (average 30 in. or 760 mm)
Yellow Bluestem Ischaemum Excellent stand, tall (average 36 in. or 915 mm)
B Kudzu Very dense growth, uncut
Bermuda grass Good stand, tall (average 12 in. or 305 mm)
Native grass mixture little bluestem, bluestem, blue gamma, other short and long stem medwest grasses
Good stand, unmowed
Weeping Lovegrass Good Stand, tall (average 24 in. or 610 mm)
Lespedeza sericea Good stand, not woody, tall (average 19 in. or 480 mm)
Alfalfa Good stand, uncut (average 11 in or 280 mm)
Weeping lovegrass Good stand, unmowed (average 13 in. or 330 mm)
Kudzu Dense growth, uncut
Blue gamma Good stand, uncut (average 13 in. or 330 mm)
C Crabgrass Fair stand, uncut (10‐to‐48 in. or 55‐to‐1220 mm)
Bermuda grass Good stand, mowed (average 6 in. or 150 mm)
Common lespedeza Good stand, uncut (average 11 in. or 280 mm)
Grass‐legume mixture: summer (orchard grass redtop, Italian ryegrass, and common lespedeza)
Good stand, uncut (6‐8 in. or 150‐200 mm)
Centipedegrass Very dense cover (average 6 in. or 150 mm)
Kentucky bluegrass Good stand, headed (6‐12 in. or 150‐305 mm)
D Bermuda grass Good stand, cut to 2.5 in. or 65 mm
Common lespedeza Excellent stand, uncut (average 4.5 in. or 115 mm)
Buffalo grass Good stand, uncut (3‐6 in. or 75‐150 mm)
Grass‐legume mixture: fall, spring (orchard grass Italian ryegrass, and common lespedeza
Good Stand, uncut (4‐5 in. or 100‐125 mm)
Lespedeza sericea After cutting to 2 in. or 50 mm (very good before cutting)
E Bermuda grass Good stand, cut to 1.5 in. or 40 mm
Bermuda grass Burned stubble
Source: TxDOT HDM [4]
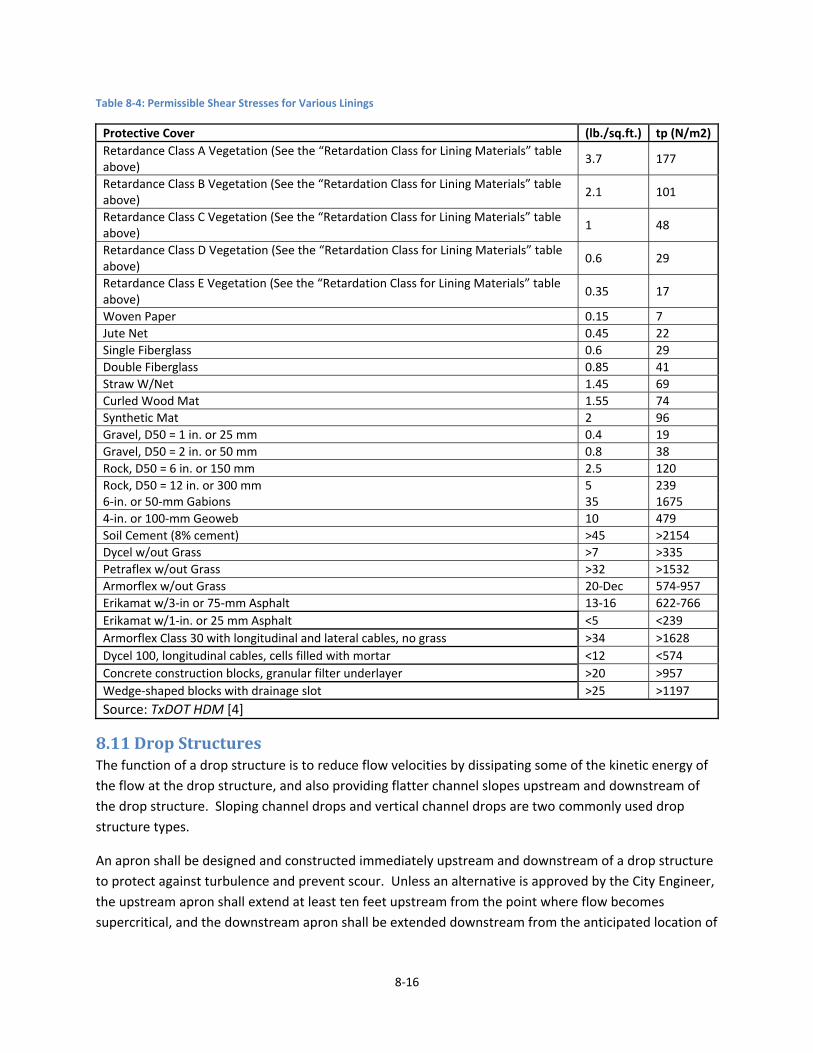
8‐16
Table 8‐4: Permissible Shear Stresses for Various Linings
Protective Cover (lb./sq.ft.) tp (N/m2)
Retardance Class A Vegetation (See the “Retardation Class for Lining Materials” table above)
3.7 177
Retardance Class B Vegetation (See the “Retardation Class for Lining Materials” table above)
2.1 101
Retardance Class C Vegetation (See the “Retardation Class for Lining Materials” table above)
1 48
Retardance Class D Vegetation (See the “Retardation Class for Lining Materials” table above)
0.6 29
Retardance Class E Vegetation (See the “Retardation Class for Lining Materials” table above)
0.35 17
Woven Paper 0.15 7
Jute Net 0.45 22
Single Fiberglass 0.6 29
Double Fiberglass 0.85 41
Straw W/Net 1.45 69
Curled Wood Mat 1.55 74
Synthetic Mat 2 96
Gravel, D50 = 1 in. or 25 mm 0.4 19
Gravel, D50 = 2 in. or 50 mm 0.8 38
Rock, D50 = 6 in. or 150 mm 2.5 120
Rock, D50 = 12 in. or 300 mm 5 239 6‐in. or 50‐mm Gabions 35 1675
4‐in. or 100‐mm Geoweb 10 479
Soil Cement (8% cement) >45 >2154
Dycel w/out Grass >7 >335
Petraflex w/out Grass >32 >1532
Armorflex w/out Grass 20‐Dec 574‐957
Erikamat w/3‐in or 75‐mm Asphalt 13‐16 622‐766
Erikamat w/1‐in. or 25 mm Asphalt <5 <239
Armorflex Class 30 with longitudinal and lateral cables, no grass >34 >1628
Dycel 100, longitudinal cables, cells filled with mortar <12 <574
Concrete construction blocks, granular filter underlayer >20 >957
Wedge‐shaped blocks with drainage slot >25 >1197
Source: TxDOT HDM [4]
8.11 DropStructuresThe function of a drop structure is to reduce flow velocities by dissipating some of the kinetic energy of
the flow at the drop structure, and also providing flatter channel slopes upstream and downstream of
the drop structure. Sloping channel drops and vertical channel drops are two commonly used drop
structure types.
An apron shall be designed and constructed immediately upstream and downstream of a drop structure
to protect against turbulence and prevent scour. Unless an alternative is approved by the City Engineer,
the upstream apron shall extend at least ten feet upstream from the point where flow becomes
supercritical, and the downstream apron shall be extended downstream from the anticipated location of
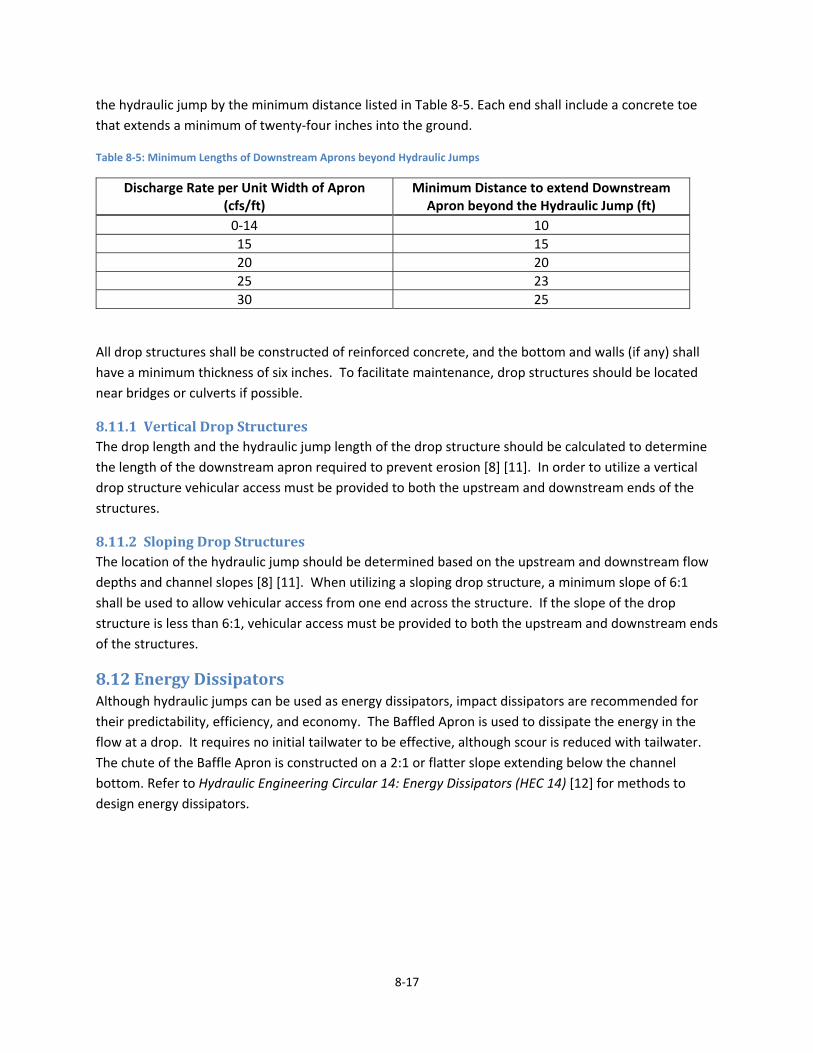
8‐17
the hydraulic jump by the minimum distance listed in Table 8‐5. Each end shall include a concrete toe
that extends a minimum of twenty‐four inches into the ground.
Table 8‐5: Minimum Lengths of Downstream Aprons beyond Hydraulic Jumps
Discharge Rate per Unit Width of Apron (cfs/ft)
Minimum Distance to extend Downstream Apron beyond the Hydraulic Jump (ft)
0‐14 10
15 15
20 20
25 23
30 25
All drop structures shall be constructed of reinforced concrete, and the bottom and walls (if any) shall
have a minimum thickness of six inches. To facilitate maintenance, drop structures should be located
near bridges or culverts if possible.
8.11.1 VerticalDropStructuresThe drop length and the hydraulic jump length of the drop structure should be calculated to determine
the length of the downstream apron required to prevent erosion [8] [11]. In order to utilize a vertical
drop structure vehicular access must be provided to both the upstream and downstream ends of the
structures.
8.11.2 SlopingDropStructuresThe location of the hydraulic jump should be determined based on the upstream and downstream flow
depths and channel slopes [8] [11]. When utilizing a sloping drop structure, a minimum slope of 6:1
shall be used to allow vehicular access from one end across the structure. If the slope of the drop
structure is less than 6:1, vehicular access must be provided to both the upstream and downstream ends
of the structures.
8.12 EnergyDissipatorsAlthough hydraulic jumps can be used as energy dissipators, impact dissipators are recommended for
their predictability, efficiency, and economy. The Baffled Apron is used to dissipate the energy in the
flow at a drop. It requires no initial tailwater to be effective, although scour is reduced with tailwater.
The chute of the Baffle Apron is constructed on a 2:1 or flatter slope extending below the channel
bottom. Refer to Hydraulic Engineering Circular 14: Energy Dissipators (HEC 14) [12] for methods to
design energy dissipators.

8‐18
This page intentionally left blank.

9‐1
9 BridgesandCulverts
9.1 GeneralRequirementsA bridge is defined as a structure, including supports, erected over a depression or an obstruction (e.g.,
water, highway or railway) having a roadway for carrying traffic or other moving loads, and having an
opening measured along the center of the roadway of more than 20 feet between faces of abutments,
spring lines of arches, or extreme ends of openings for multiple box culverts. Culverts convey surface
water through a roadway embankment or away from the roadway right‐of‐way or into a channel along
the right‐of‐way.
A. Bridges and culverts shall be designed to withstand the 100‐year design storm.
B. Bridges and culverts on arterial streets and parkways shall meet the following requirements:
1. 50‐year design storm runoff with headwater one foot below the top of the culvert
structure.
2. 100‐year water surface shall not encroach through half of roadway lanes.
3. Minimum culvert size of a 24‐inch circular pipe or equivalent for alternate shapes.
C. Bridges and culverts on all other streets shall meet the following requirements:
1. 25‐year design storm runoff with headwater one foot below the top embankment.
2. 25‐year water surface shall leave at least one lane open.
3. 50‐year design storm runoff no more than 6 inches over top of roadway.
4. Allowance shall be made for conveyance of the 100‐year runoff across the road and into
the downstream channel without damage to the road or adjacent property.
5. Minimum culvert size of an 18‐inch circular pipe or equivalent for alternate shapes.
D. Temporary crossings shall be designed to safely pass the 2‐year design storm runoff.
E. The backwater created by a culvert or bridge during the 100‐year design storm runoff shall not
cause damage to public or private property.
F. Culvert outlets shall be designed to minimize damage caused by erosion.
G. Culverts and bridges shall be aligned with natural drainage ways in grade and direction
whenever practical. Culverts shall have a minimum design storm velocity of 2.5 feet per second
for the 2‐year storm to reduce sediment accumulation.
H. Larger culvert sizes, bridges, box culverts, and/or smooth‐walled pipes are recommended for
crossings where heavy debris or sediment accumulations are anticipated. Trash racks may be
required.
I. All headwalls shall be constructed of reinforced concrete.
J. Plastic pipe is prohibited for use as a culvert pipe material in the public right‐of‐way.
K. Corrugated metal pipe will not be allowed in the public right‐of‐way except beneath driveways.
9.2 BridgeDesignCriteriaDesign criteria for all bridges shall be on a case‐by‐case basis as determined by the City Engineer.

9‐2
9.3 CulvertDesignCriteriaA. Headwalls and necessary erosion protection shall be provided at all culverts and shall comply
with TxDOT standard details. All culverts and bridges are to be analyzed at both the design flow
and 100‐year check flow.
B. Alignment, location and grade of proposed culverts must be consistent with planned
development of the drainage system for that watershed. In the event the particular watershed
or waterway is not covered by a planned storm drainage system, the designer should proceed
with the design from the nearest downstream control (i.e. bridge, culvert dam, etc.) and design
the proposed drainage system improvements anticipating future system expansion due to fully
developed watershed conditions.
C. Wingwalls, if used, may be either straight parallel, flared, or tapered. Approach and discharge
aprons shall be provided for all culvert headwall designs. Precast headwalls and end walls may
be used if all other criteria are satisfied.
9.4 CulvertEndTreatmentsFigure 9‐1 shows sketches of various end treatment types. The TxDOT Bridge Division maintains
standard details of culvert end treatments. Safety End Treatment (SET) of a culvert provides a method of
mitigating a less safe condition with‐out interfering with the hydraulic function of the culvert. SETs such
as those used with driveway and other small diameter culverts may be more hydraulically efficient by
providing both tapered wingwalls and a beveled edge instead of using a mitered section. SETs for larger
culverts that are not protected by a railing or guard fence use pipe runners arranged either horizontally
or vertically.

9‐3
Figure 9‐1: Typical Culvert End Treatments
Source: TxDOT HDM [4]
The pipes of pipe runner SETs have been proven to be within the tolerance of the entrance loss
equations. Therefore, the entrance should be evaluated solely for its shape and the effect of the pipes
should be ignored.
9.5 CulvertHydraulicsThe hydraulic design of culverts shall be based upon design guidelines set forth by TxDOT, the U.S.
Department of Transportation, or other suitable material as approved by the City Engineer. Computer
programs such as FHWA’s “HY‐8” may be used, provided that the design engineer provides output tables
showing models results and input data.
Values of entrance loss coefficients (Ce) are shown in Table 9‐1 based on culvert shape and entrance
condition.

9‐4
Table 9‐1: Entrance Loss Coefficients
Concrete Pipe Ce
Projecting from fill, socket end (groove end) 0.2
Projecting from fill, square cut end 0.5
Headwall or headwall and wingwalls: ‐
Socket end of pipe (groove end) 0.2
Square‐edge 0.5
Rounded (radius 1/12 D) 0.2
Mitered to conform to fill slope 0.7
End section conforming to fill slope 0.5
Beveled edges, 33.7º or 45º bevels 0.2
Side‐ or slope‐tapered inlet 0.2
Corrugated Metal Pipe or Pipe Arch ‐
Projecting from fill (no headwall) 0.9
Headwall or headwall and wingwalls square‐edge 0.5
Mitered to conform to fill slope, paved or unpaved slope 0.7
End section conforming to fill slope 0.5
Beveled edges, 33.7º or 45º bevels 0.2
Side‐ or slope‐tapered inlet 0.2
Reinforced Concrete Box ‐
Headwall parallel to embankment (no wingwalls): ‐
Square‐edged on 3 edges 0.5
Rounded on 3 edges to radius of 1/12 barrel dimension, or beveled edges on 3 sides
0.2
Wingwalls at 30º to 75º to barrel: ‐
Square‐edged at crown 0.4
Crown edge rounded to radius of 1/12 barrel dimension, or beveled top edge
0.2
Wingwall at 10º to 25º to barrel: square‐edged at crown 0.5
Wingwalls parallel (extension of sides): square‐edged at crown 0.7
Side‐ or slope‐tapered inlet 0.2
Source: TxDOT HDM [4]
There are two categories of flow through culverts: inlet control and outlet control.
1. Inlet Control. The flow is controlled by the cross‐sectional area of the culvert, inlet
configuration, and headwater depth. Slope, roughness and length of culvert are of no
importance. Nomographs are available for inlet control estimations as proved in Hydraulic
Design of Highway Culverts [13].
2. Outlet control. The flow is controlled by the cross‐section area of the culvert, inlet
configuration, and headwater depth and, slope, roughness and length of culvert. Culverts will
be outlet controlled if the culvert slope is relatively flat, the tailwater sufficiently deep or the
culvert is quite long. It is also possible, where the water enters the culvert under inlet control,
but the culvert slope or tailwater conditions cause a hydraulic jump near the outlet. This
situation should be avoided because damage can occur to the culvert pipe. Unstable conditions
are most likely when the culvert is placed at a near‐critical slope.

9‐5
The design engineer shall calculate both outlet and inlet control conditions and use the more
conservative of the two as the design condition.
9.6 DebrisFinsFor conditions where more than one box culvert is required, the upstream face of the structure may
incorporate debris deflector fins to prevent debris buildup. For multiple‐pipe, or single box in critical
situations, installations of debris fins may be used but are not required unless the Engineering Division
requires upon review of the design situation. The engineer of record should analyze the situation for
the applicability of debris fins.
The debris fin is an extension of the interior walls of a multiple‐box culvert. The wall thickness shall be
designed to satisfy structural requirements and reduce impact and turbulence to the flow.
A debris fin is constructed to the height of the culvert with a fin length of one and one‐half times the
height of the box culvert. Since the debris fins are subject to the same erosive forces as bridge piers,
care must be taken in the design of the footing. A reinforced toewall at the upstream end of the debris
fin and the apron is required. The reinforced toewall shall include a toe that extends a minimum of
twenty‐four inches into the ground.
9.7 CulvertOutletProtectionHigh discharge velocities from culverts can cause eddies or other turbulence which could damage
unprotected downstream channel banks and roadway embankments. To prevent damage from scour
and erosion in these conditions, culvert outlet protection is needed. The outlet protection should
extend downstream to a point where non‐erosive channel velocities or shear stress are established in
accordance with Section 8.10 of this manual. The outlet protection should be placed sufficiently high on
the adjacent banks to extend 1’ above the design WSEL. All outlet protection shall be designed with an
appropriate toe depth. All toes shall be no less than twenty‐four inches.
9.8 EnergyDissipationDesign of riprap stone protection shall be done in accordance to HEC 22. Design of concrete baffles and
stilling basins shall be done in accordance with HEC 14.

9‐6
This page intentionally left blank.
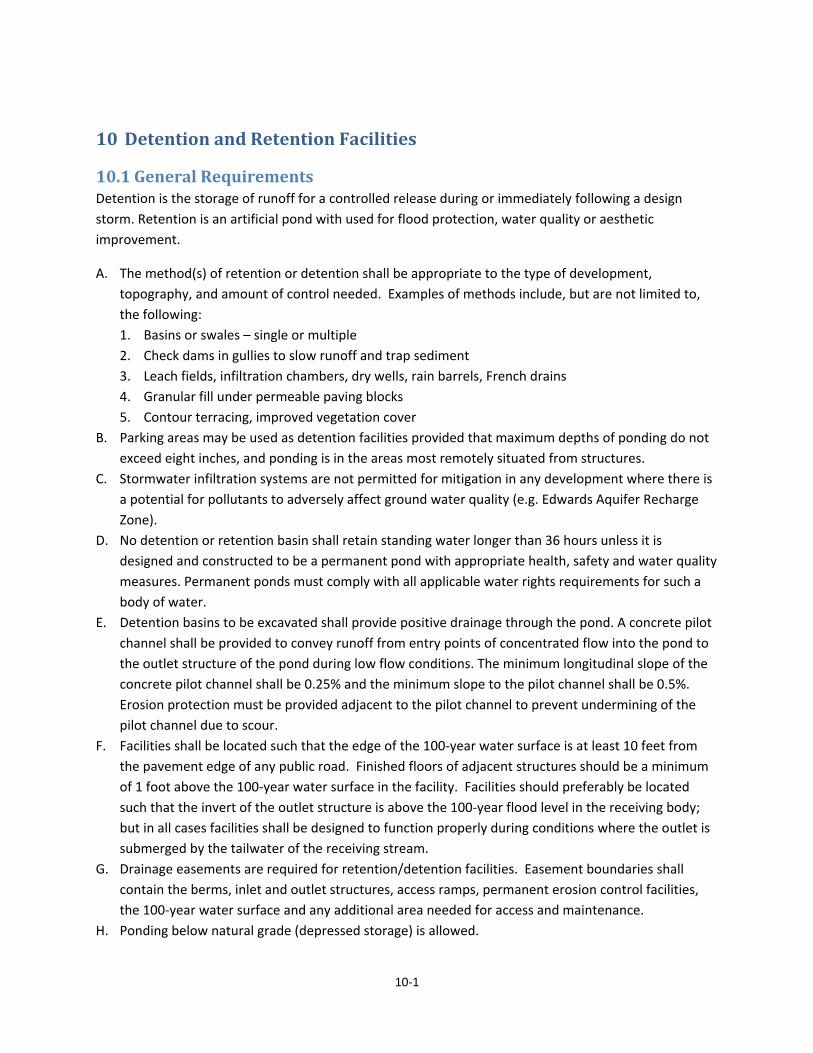
10‐1
10 DetentionandRetentionFacilities
10.1 GeneralRequirementsDetention is the storage of runoff for a controlled release during or immediately following a design
storm. Retention is an artificial pond with used for flood protection, water quality or aesthetic
improvement.
A. The method(s) of retention or detention shall be appropriate to the type of development,
topography, and amount of control needed. Examples of methods include, but are not limited to,
the following:
1. Basins or swales – single or multiple
2. Check dams in gullies to slow runoff and trap sediment
3. Leach fields, infiltration chambers, dry wells, rain barrels, French drains
4. Granular fill under permeable paving blocks
5. Contour terracing, improved vegetation cover
B. Parking areas may be used as detention facilities provided that maximum depths of ponding do not
exceed eight inches, and ponding is in the areas most remotely situated from structures.
C. Stormwater infiltration systems are not permitted for mitigation in any development where there is
a potential for pollutants to adversely affect ground water quality (e.g. Edwards Aquifer Recharge
Zone).
D. No detention or retention basin shall retain standing water longer than 36 hours unless it is
designed and constructed to be a permanent pond with appropriate health, safety and water quality
measures. Permanent ponds must comply with all applicable water rights requirements for such a
body of water.
E. Detention basins to be excavated shall provide positive drainage through the pond. A concrete pilot
channel shall be provided to convey runoff from entry points of concentrated flow into the pond to
the outlet structure of the pond during low flow conditions. The minimum longitudinal slope of the
concrete pilot channel shall be 0.25% and the minimum slope to the pilot channel shall be 0.5%.
Erosion protection must be provided adjacent to the pilot channel to prevent undermining of the
pilot channel due to scour.
F. Facilities shall be located such that the edge of the 100‐year water surface is at least 10 feet from
the pavement edge of any public road. Finished floors of adjacent structures should be a minimum
of 1 foot above the 100‐year water surface in the facility. Facilities should preferably be located
such that the invert of the outlet structure is above the 100‐year flood level in the receiving body;
but in all cases facilities shall be designed to function properly during conditions where the outlet is
submerged by the tailwater of the receiving stream.
G. Drainage easements are required for retention/detention facilities. Easement boundaries shall
contain the berms, inlet and outlet structures, access ramps, permanent erosion control facilities,
the 100‐year water surface and any additional area needed for access and maintenance.
H. Ponding below natural grade (depressed storage) is allowed.
10‐2
I. Detention facilities shall be designed with one or more outlet structures to allow safe passage of the
100‐year post‐development design storm runoff. If an overflow weir is not incorporated into the
design of the outlet structure, then an emergency overflow weir or spillway shall be provided with
sufficient capacity to pass at least the 25‐year design storm runoff, assuming the pond is full and the
discharge pipe in the outfall structure is 100% clogged. At minimum, the emergency overflow weir
should engage when ponding exceeds the 100‐year water surface elevation.
J. Weirs, spillways and outlets shall be protected from erosion with riprap, grouted riprap, or other
method of erosion control to adequately protect the structure and downstream channel. Outflows
shall be conveyed within proposed property limits to an appropriate receiving drainage facility in a
manner such that roadways, private property, buildings, etc. are not damaged.
K. Best management practices shall be used in the event a detention facility empties into another
storage facility downstream. The timing of the hydrograph from the detention facility shall be
checked against the timing of the receiving storage facility to prevent any increase in the flow rate
from the downstream facility.
L. Side slopes of earthen embankments shall be designed for stability and safety, with the following
minimum requirements for facilities with unrestricted access: side slopes of earthen banks shall be
3:1 or flatter; a benched configuration is required for facilities with ponding depths over 6 feet.
Bench widths shall be at least 4 feet, spaced at least every 3 feet vertically. The above slope criteria
may be waived if security barriers are provided. Barriers may consist of chain‐link, masonry, wood,
vegetation or other materials, but must not restrict the hydraulic capacity of drainage facilities.
Minimum barrier height is 48”. Vegetative barriers must be of a width equal to or greater than the
greatest interior embankment height/depth, with density sufficient to restrict access. All
constructed stormwater structures of earthen material shall be re‐vegetated to mature growth.
M. Maximum water depths over 6 feet shall not be allowed. In cases where design limitations require
excess depths, due hardship shall be presented for consideration to the Engineering Division,
consideration for exception approval will require additional safety measures of the design.
Additional safety measures can include but shall not be limited to:
a. Fencing,
b. Benching,
c. And/or other forms of access restriction.
M.N. without prior approval from the City Engineer. Any detention facility that is classified as a dam
by the State of Texas shall conform to the more stringent of rules listed in this manual or the dam
safety rules adopted by the State of Texas.
N.O. Earthen embankments of a height greater than 3 feet used to impound a required detention
volume must have a minimum top‐width of 4 feet, shall contain a non‐permeable core, and shall be
based on a geotechnical investigation for the site. Compaction of all earthen drainage structures
shall be to 90% standard proctor.
O.P. A maintenance ramp shall be provided for vehicular access in detention basin design for periodic
de‐silting and debris removal. The slope of the ramp shall not exceed 6:1 and the minimum width
shall be 12 feet.
P.Q. Basins with permanent storage must include dewatering facilities to provide for maintenance.

10‐3
Q.R. The design of detention facilities shall include provisions for collecting and removing sediment
deposited after collecting and releasing stormwater.
R.S. Detention ponds and reservoirs shall provide at least 1‐foot of freeboard for the 100‐year storm
event measured from top of berm to the 100‐year water surface elevation of the pond.
10.2 DesignCriteriaA. Stormwater detention basins are used to temporarily impound (detain) excess stormwater, thereby
reducing peak discharge rates.
B. All detention ponds are to be designed to prevent an increase in flow to the existing 2, 10, 25, 50,
and 100‐year peak runoff leaving a proposed site.
C. Detention ponds will be sized using the NRCS synthetic hydrograph as outlined in Section 4 of this
manual.
10.3 OutletStructureDesignA. Multi‐level outlet structures may be necessary to reduce the 2, 10, 25, 50, and 100‐year developed
design storm runoff to pre‐development levels. See publication Stormwater Detention Outlet
Control Structures [14] for further outlet design and construction guidance not presented below.
B. Documentation on retention or detention structures should include design hydrographs, calculation
of stage‐storage‐discharge tables, drawings of the basin, spillway, weir and outlet size and location,
and erosion control measures.
C. Development of a composite stage‐discharge curve requires consideration of the discharge rating
relationships for each component of the outlet structure. The following sections are design
relationships for typical outlet controls summarized from HEC 22.
10.3.1 OrificesFor a single orifice as illustrated in Figure 10‐1 (a), orifice flow can be determined using Equation 10‐1.
Equation 10‐1
𝑄 𝐶 𝐴 2𝑔𝐻 .
Where: Q = Orifice flow rate (cfs) Co = Discharge coefficient 0.40 – 0.60 Ao = Area of orifice (ft2) Ho = Effective head on the orifice measured from the centroid of the opening (ft) g = Gravitational acceleration = 32.2 ft/s2.

10‐4
Figure 10‐1: Definition Sketch for Orifice Flow
Source: HEC 22 [5]
If the orifice discharges as a free outfall, then the effective head is measured from the centerline of the
orifice to the upstream water surface elevation. If the orifice discharge is submerged, then the effective
head is the difference in elevation of the upstream and downstream water surfaces. This latter condition
of a submerged discharge is shown in Figure 10‐1(b).
For square‐edged, uniform orifice entrance conditions, a discharge coefficient of 0.6 should be used. For
ragged edged orifices, such as those resulting from the use of an acetylene torch to cut orifice openings
in corrugated pipe, a value of 0.4 should be used.
For circular orifices with Co set equal to 0.6, the following equation results:
Equation 10‐2
𝑄 𝐾 𝐷 𝐻 .
Where:
Kor = 3.78 (English units)
D = Orifice diameter (ft).
Pipes smaller than 1 foot in diameter may be analyzed as a submerged orifice as long as Ho/D is greater
than 1.5. Pipes greater than 1 foot in diameter should be analyzed as a discharge pipe with headwater
and tailwater effects taken into account, not just as an orifice.
Flow through multiple orifices (see Figure 10‐1 (c)) can be computed by summing the flow through
individual orifices. For multiple orifices of the same size and under the influence of the same effective
head, the total flow can be determined by multiplying the discharge for a single orifice by the number of
openings.

10‐5
10.3.2 WeirsRelationships for sharp‐crested, broad‐crested, V‐notch, and proportional weirs are provided in the
following sections.
10.3.2.1 SharpCrestedWeirsTypical sharp crested weirs are illustrated in Figure 10‐2. Equation 10‐3 provides the discharge
relationship for sharp crested weirs with no end contractions (illustrated in Figure 10‐2 (a)).
Equation 10‐3
𝑄 𝐶 𝐿𝐻 .
Where: Q = Discharge (cfs) L = Horizontal weir length (ft) H = Head above weir crest excluding velocity head (ft)
Cscw = 3.27 + 0.4 (H/Hc).
As indicated above, the value of the coefficient CSCW is known to vary with the ratio H/Hc (see Figure 10‐2
(c) for definition of terms). For values of the ratio H/Hc less than 0.3, a constant CSCW of 3.33 (in English
units) is often used.
Equation 10‐4 provides the discharge equation for sharp‐crested weirs with end contractions (illustrated
in Figure 10‐2 (b)). As indicated above, the value of the coefficient CSCW is known to vary with the ratio
H/Hc (see Figure 10‐2 (c) for definition of terms). For values of the ratio H/Hc less than 0.3, a constant
CSCW of 3.33 (in English units) is often used.
Figure 10‐2: Sharp Crested Weirs
Source: HEC 22 [5]

10‐6
Equation 10‐4
𝑄 𝐶 𝐿 0.2𝐻 𝐻 .
Sharp crested weirs will be effected by submergence when the tailwater rises above the weir crest
elevation, as shown in Figure 10‐2 (d). The result will be that the discharge over the weir will be
reduced. The discharge equation for a submerged sharp‐crested weir is:
Equation 10‐5
𝑄 𝑄 1 𝐻𝐻
. .
Where: Qs = Submerged flow (cfs) Qr = Unsubmerged weir flow from Equation 10 3 or Equation 10 4 (cfs) H1 = Upstream head above crest (ft) H2 = Downstream head above crest (ft).
Flow over the top edge of a riser pipe is typically treated as flow over a sharp crested weir with no end
constrictions. Equation 10‐3 should be used for this case.
10.3.2.2 Broad‐CrestedWeirThe equation typically used for a broad‐crested weir is:
Equation 10‐6
𝑄 𝐶 𝐿𝐻 .
Where:
Q = Discharge, (ft3/s) CBCW = Broad‐crested weir coefficient, 2.34 to 3.32 (English units) L = Broad‐Crested weir length, (ft) H = Head above weir crest (ft).
If the upstream edge of a broad‐crested weir is so rounded as to prevent contraction and if the slope of
the crest is as great as the loss of head due to friction, flow will pass through critical depth at the weir
crest; this gives the maximum C value of 3.09 (in English units). For sharp corners on the broad crested
weir, a minimum value of 2.62 (in English units) should be used. Additional information on C values as a
function of weir crest breadth and head is given in Table 10‐1.
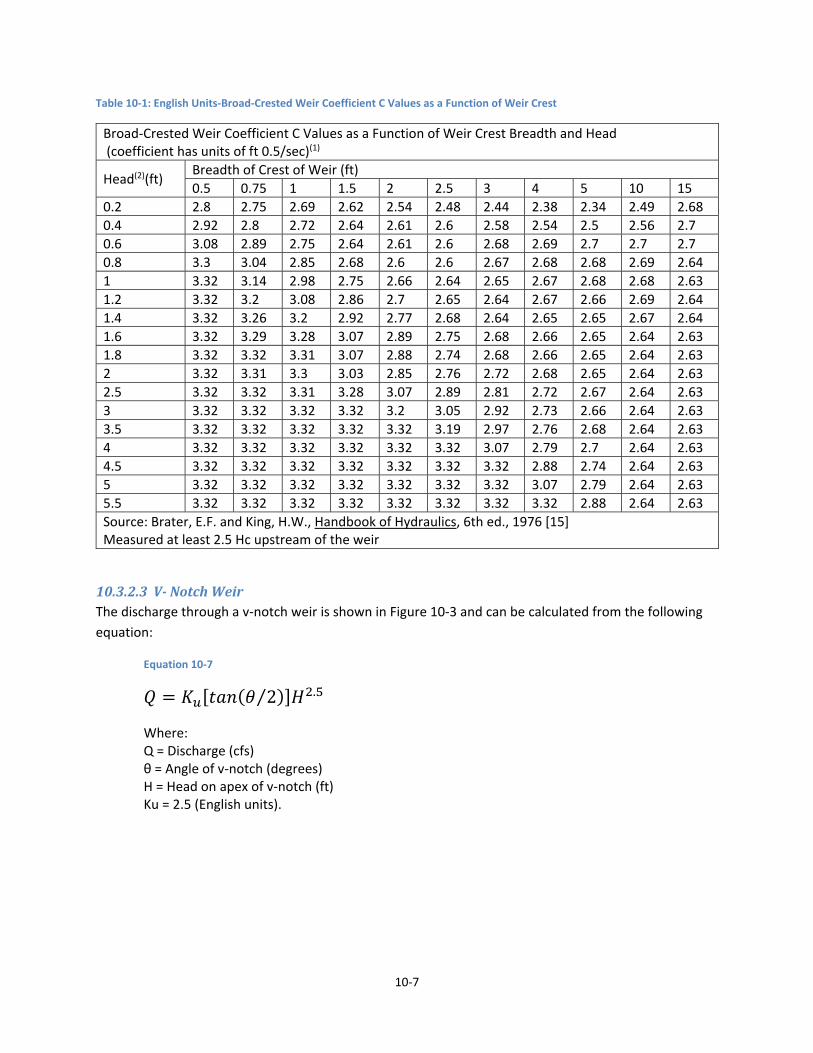
10‐7
Table 10‐1: English Units‐Broad‐Crested Weir Coefficient C Values as a Function of Weir Crest
Broad‐Crested Weir Coefficient C Values as a Function of Weir Crest Breadth and Head (coefficient has units of ft 0.5/sec)(1)
Head(2)(ft) Breadth of Crest of Weir (ft)
0.5 0.75 1 1.5 2 2.5 3 4 5 10 15
0.2 2.8 2.75 2.69 2.62 2.54 2.48 2.44 2.38 2.34 2.49 2.68
0.4 2.92 2.8 2.72 2.64 2.61 2.6 2.58 2.54 2.5 2.56 2.7
0.6 3.08 2.89 2.75 2.64 2.61 2.6 2.68 2.69 2.7 2.7 2.7
0.8 3.3 3.04 2.85 2.68 2.6 2.6 2.67 2.68 2.68 2.69 2.64
1 3.32 3.14 2.98 2.75 2.66 2.64 2.65 2.67 2.68 2.68 2.63
1.2 3.32 3.2 3.08 2.86 2.7 2.65 2.64 2.67 2.66 2.69 2.64
1.4 3.32 3.26 3.2 2.92 2.77 2.68 2.64 2.65 2.65 2.67 2.64
1.6 3.32 3.29 3.28 3.07 2.89 2.75 2.68 2.66 2.65 2.64 2.63
1.8 3.32 3.32 3.31 3.07 2.88 2.74 2.68 2.66 2.65 2.64 2.63
2 3.32 3.31 3.3 3.03 2.85 2.76 2.72 2.68 2.65 2.64 2.63
2.5 3.32 3.32 3.31 3.28 3.07 2.89 2.81 2.72 2.67 2.64 2.63
3 3.32 3.32 3.32 3.32 3.2 3.05 2.92 2.73 2.66 2.64 2.63
3.5 3.32 3.32 3.32 3.32 3.32 3.19 2.97 2.76 2.68 2.64 2.63
4 3.32 3.32 3.32 3.32 3.32 3.32 3.07 2.79 2.7 2.64 2.63
4.5 3.32 3.32 3.32 3.32 3.32 3.32 3.32 2.88 2.74 2.64 2.63
5 3.32 3.32 3.32 3.32 3.32 3.32 3.32 3.07 2.79 2.64 2.63
5.5 3.32 3.32 3.32 3.32 3.32 3.32 3.32 3.32 2.88 2.64 2.63
Source: Brater, E.F. and King, H.W., Handbook of Hydraulics, 6th ed., 1976 [15] Measured at least 2.5 Hc upstream of the weir
10.3.2.3 V‐NotchWeirThe discharge through a v‐notch weir is shown in Figure 10‐3 and can be calculated from the following
equation:
Equation 10‐7
𝑄 𝐾 𝑡𝑎𝑛 𝜃 2⁄ 𝐻 .
Where: Q = Discharge (cfs) θ = Angle of v‐notch (degrees) H = Head on apex of v‐notch (ft) Ku = 2.5 (English units).

10‐8
Figure 10‐3: V‐Notch Weir
Source: HEC 22 [5]
10.3.2.4 ProportionalWeirAlthough more complex to design and construct, a proportional weir may significantly reduce the
required storage volume for a given site. The proportional weir is distinguished from other control
devices by having a linear head‐discharge relationship. This relationship is achieved by allowing the
discharge area to vary nonlinearly with head. Design equations for proportional weirs are as follows:
[16]
Equation 10‐8
𝑄 𝐾 𝑎 . 𝑏 𝐻 𝑎 3⁄
Where: KU = 4.96 (English units) Q = Discharge (cfs) H = Head above horizontal sill (ft).
Dimensions a, b, x, and y are shown in Figure 10‐4.

10‐9
Figure 10‐4: Proportional Weir Dimensions
Source: HEC 22 [5]
10.3.3 DischargePipesDischarge pipes are often used as outlet structures for detention facilities. The design of these pipes can
be for either single or multistage discharges. A single step discharge system would consist of a single
culvert entrance system and would not be designed to carry emergency flows. A multistage inlet would
involve the placement of a control structure at the inlet end of the pipe.
For single stage systems, the facility would be designed as if it were a simple culvert. Downstream
boundary conditions are to be applied in the same manner as discussed in Section 9 of this manual. A
stage‐discharge curve would be developed for the full range of flows that the structure would
experience.
For multistage control structures, the inlet control structure would be designed considering the full
range of flows. A stage‐discharge curve would be developed for the full range of flows that the structure
would experience. The design flows will typically be orifice flow through whatever shape the designer
has chosen while the higher flows will typically be weir flow over the top of the control structure.
Orifices can be designed using the equations in Section 10.3.1 and weirs can be designed using the
equations in Section 10.3.2. The pipe must be designed to carry all flows considered in the design of the
control structure.
In designing a multistage structure, the designer would first develop peak discharges that must be
passed through the facility. The second step would be to select a pipe that will pass the peak flow within
the allowable headwater and develop a performance curve for the pipe. Thirdly, the designer would
develop a stage‐discharge curve for the inlet control structure, recognizing that the headwater for the
discharge pipe will be the tailwater that needs to be considered in designing the inlet structure. Last, the
designer would use the stage‐discharge curve in the basin routing procedure.
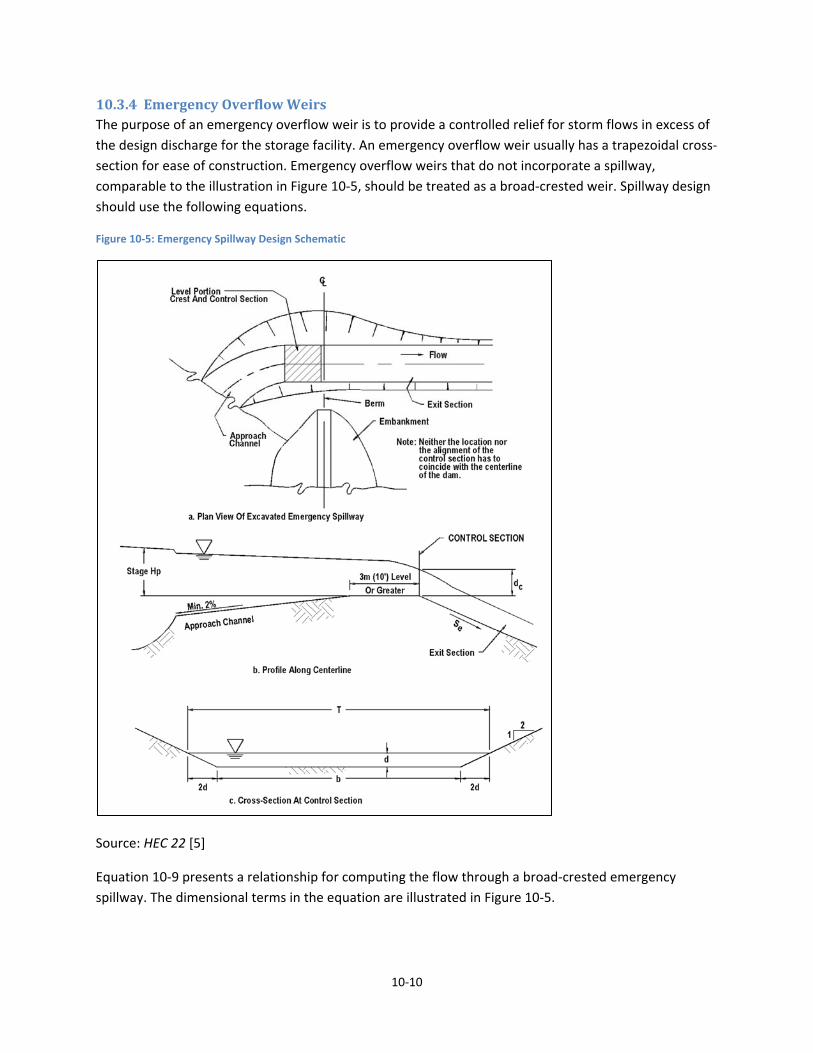
10‐10
10.3.4 EmergencyOverflowWeirsThe purpose of an emergency overflow weir is to provide a controlled relief for storm flows in excess of
the design discharge for the storage facility. An emergency overflow weir usually has a trapezoidal cross‐
section for ease of construction. Emergency overflow weirs that do not incorporate a spillway,
comparable to the illustration in Figure 10‐5, should be treated as a broad‐crested weir. Spillway design
should use the following equations.
Figure 10‐5: Emergency Spillway Design Schematic
Source: HEC 22 [5]
Equation 10‐9 presents a relationship for computing the flow through a broad‐crested emergency
spillway. The dimensional terms in the equation are illustrated in Figure 10‐5.
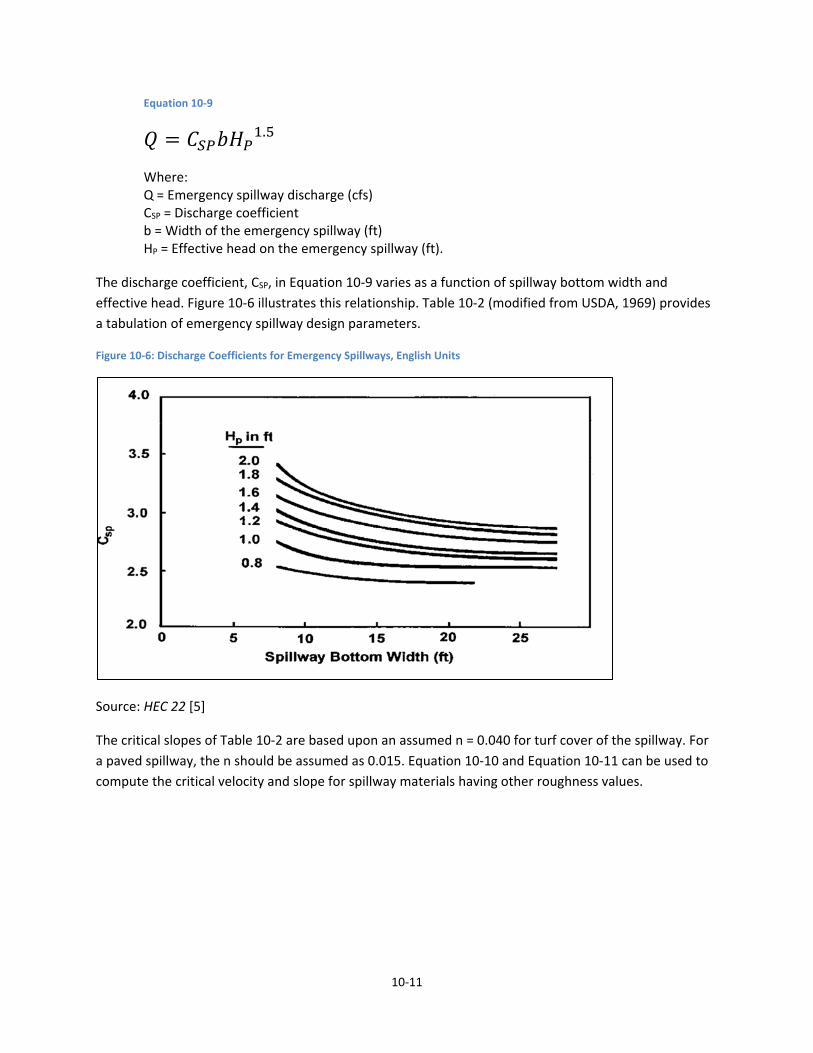
10‐11
Equation 10‐9
𝑄 𝐶 𝑏𝐻 .
Where: Q = Emergency spillway discharge (cfs) CSP = Discharge coefficient b = Width of the emergency spillway (ft) HP = Effective head on the emergency spillway (ft).
The discharge coefficient, CSP, in Equation 10‐9 varies as a function of spillway bottom width and
effective head. Figure 10‐6 illustrates this relationship. Table 10‐2 (modified from USDA, 1969) provides
a tabulation of emergency spillway design parameters.
Figure 10‐6: Discharge Coefficients for Emergency Spillways, English Units
Source: HEC 22 [5]
The critical slopes of Table 10‐2 are based upon an assumed n = 0.040 for turf cover of the spillway. For
a paved spillway, the n should be assumed as 0.015. Equation 10‐10 and Equation 10‐11 can be used to
compute the critical velocity and slope for spillway materials having other roughness values.

10‐12
Equation 10‐10
𝑉 𝐾 𝑄 𝑏⁄ .
Where: Vc = Critical velocity at emergency spillway control section (ft/s) Q = Emergency spillway discharge (cfs) b = Width of the emergency spillway (ft) KSP = 3.18 (English units).
Equation 10‐11
𝑆 𝐾′ 𝑛 𝑉 𝑏 𝑄⁄ .
Where: Sc = Critical slope (ft/ft) n = Manning's coefficient Vc = Critical velocity at emergency spillway control section (ft/s) Q = Emergency spillway discharge (cfs) b = Width of the emergency spillway (ft) K'SP = 14.6 (English units).
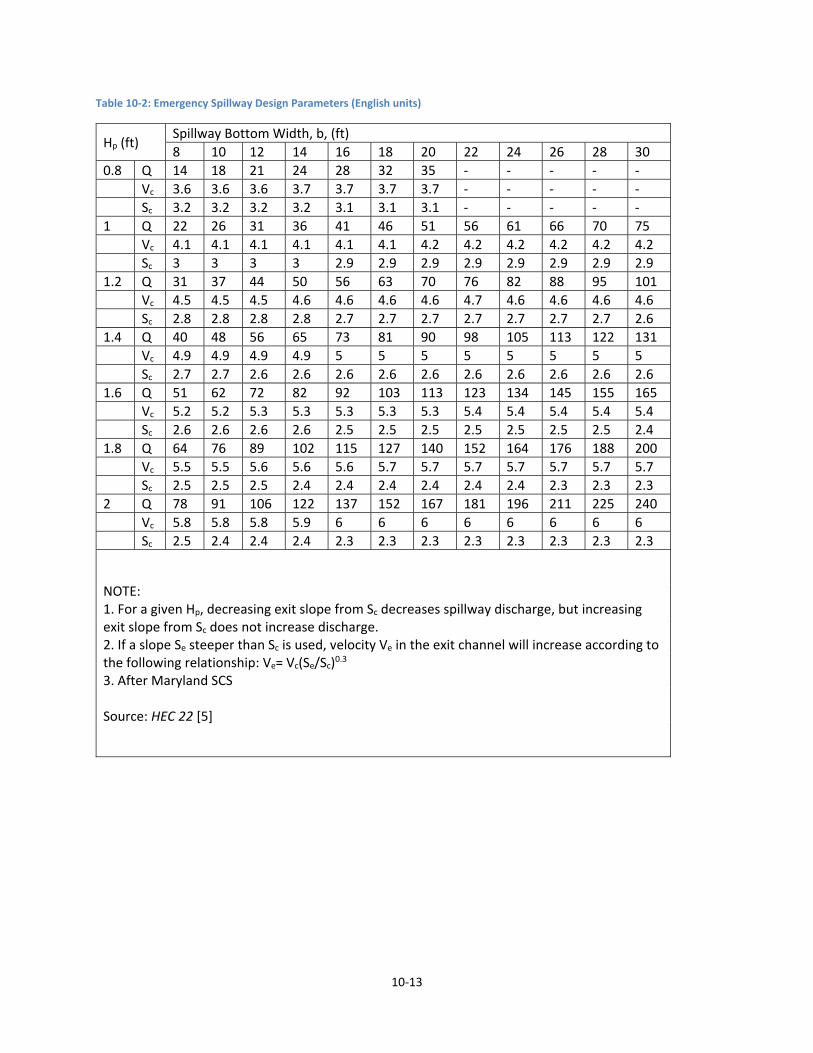
10‐13
Table 10‐2: Emergency Spillway Design Parameters (English units)
Hp (ft) Spillway Bottom Width, b, (ft)
8 10 12 14 16 18 20 22 24 26 28 30
0.8 Q 14 18 21 24 28 32 35 ‐ ‐ ‐ ‐ ‐
Vc 3.6 3.6 3.6 3.7 3.7 3.7 3.7 ‐ ‐ ‐ ‐ ‐
Sc 3.2 3.2 3.2 3.2 3.1 3.1 3.1 ‐ ‐ ‐ ‐ ‐
1 Q 22 26 31 36 41 46 51 56 61 66 70 75
Vc 4.1 4.1 4.1 4.1 4.1 4.1 4.2 4.2 4.2 4.2 4.2 4.2
Sc 3 3 3 3 2.9 2.9 2.9 2.9 2.9 2.9 2.9 2.9
1.2 Q 31 37 44 50 56 63 70 76 82 88 95 101
Vc 4.5 4.5 4.5 4.6 4.6 4.6 4.6 4.7 4.6 4.6 4.6 4.6
Sc 2.8 2.8 2.8 2.8 2.7 2.7 2.7 2.7 2.7 2.7 2.7 2.6
1.4 Q 40 48 56 65 73 81 90 98 105 113 122 131
Vc 4.9 4.9 4.9 4.9 5 5 5 5 5 5 5 5
Sc 2.7 2.7 2.6 2.6 2.6 2.6 2.6 2.6 2.6 2.6 2.6 2.6
1.6 Q 51 62 72 82 92 103 113 123 134 145 155 165
Vc 5.2 5.2 5.3 5.3 5.3 5.3 5.3 5.4 5.4 5.4 5.4 5.4
Sc 2.6 2.6 2.6 2.6 2.5 2.5 2.5 2.5 2.5 2.5 2.5 2.4
1.8 Q 64 76 89 102 115 127 140 152 164 176 188 200
Vc 5.5 5.5 5.6 5.6 5.6 5.7 5.7 5.7 5.7 5.7 5.7 5.7
Sc 2.5 2.5 2.5 2.4 2.4 2.4 2.4 2.4 2.4 2.3 2.3 2.3
2 Q 78 91 106 122 137 152 167 181 196 211 225 240
Vc 5.8 5.8 5.8 5.9 6 6 6 6 6 6 6 6
Sc 2.5 2.4 2.4 2.4 2.3 2.3 2.3 2.3 2.3 2.3 2.3 2.3
NOTE: 1. For a given Hp, decreasing exit slope from Sc decreases spillway discharge, but increasing exit slope from Sc does not increase discharge. 2. If a slope Se steeper than Sc is used, velocity Ve in the exit channel will increase according to the following relationship: Ve= Vc(Se/Sc)0.3 3. After Maryland SCS Source: HEC 22 [5]

10‐14
This page intentionally left blank.

11‐1
11 Lakes,DamsandLevees
11.1 LakesandDams
11.1.1 GeneralRequirementsIn the event that a property owner or developer desires to modify an existing pond or lake or desires to
impound stormwater by filling or constructing an aboveground dam, thereby creating a lake, pond,
lagoon or basin as part of the planned development of that property, the criteria listed below shall be
met before city approval of the impoundment can be given. Ponds or lakes created by excavation of a
channel area without erecting a dam above natural ground elevation or instream low water check dams
are also subject to the criteria listed below, with the exception of spillway capacity requirements. The
City Engineer has the final authority to determine the design criteria for a proposed dam, check dam or
excavated lake. The dam safety requirements of the Texas Commission on Environmental Quality
(TCEQ) and Federal Emergency Management Agency (FEMA) must also be met for the construction of
dams, lakes, and other improvements.
11.1.2 DamDesignCriteriaA. The design criteria for a dam are dependent on the size and hazard classification of the dam. The
size and hazard classification will be based on the recommended guidelines adopted by the TCEQ
under Texas Water Code 12.052, which provides for the safe construction, maintenance, repair and
removal of dams located in the State of Texas, and will be determined by the City Engineer based on
information furnished by the owner. The following criteria will be used to classify a dam:
1. Size. The classification for size is based on the height of the dam and storage capacity,
whichever gives the larger size category. “Height” is defined as the distance between the top of
the dam (minus the freeboard) and the existing streambed at the downstream toe. Storage is
defined as the maximum water volume impounded at the top of the dam (minus the freeboard).
2. Hazard potential. The hazard potential for a dam is based on the potential for loss of human life
and property damage downstream from a dam in the event of failure. Hazard Potential
Classifications are based on the potential for loss of life and for the extent of economic loss
based on existing and potential development downstream of the dam.
3. Spillway Design Flood. The classification of a dam based on the above criteria will be used to
determine the Spillway Design Flood (SDF). The total capacity of a dam structure, including
principal and emergency spillways, shall be adequate to pass the SDF without exceeding the top
dam elevation. The SDF’s for various dam classifications are described by TCEQ Dam Safety
Guidelines.
B. All design will be for the fully developed watershed contributing to the structure.
C. In all cases, the minimum principal spillway design capacity is a minimum of the 100‐year design
flood. In certain cases, a dam breach analysis may be required to determine the proper
classification of the structure. For all structures requiring a spillway design flood equal to the
Probable Maximum Flood (PMF), a dam breach analysis is required to determine the downstream
consequences of a failure. All dams shall be constructed with a minimum freeboard of two feet

11‐2
above SDF elevation and upstream development within the contour line determined by the
emergency spillway crest elevation plus 2‐feet, or the 100‐year flood elevation (based on fully
developed watershed conditions) plus 2‐feet, whichever is greater.
D. Owners of significant and high hazard dams were required to submit an Emergency Action Plan in
accordance with Title 30 Texas Administrative Code (TAC) Chapter 299, Dams and Reservoirs,
§299.61(b).
11.1.3 MaintenanceandLiabilityCriteriaThe owner or developer shall retain their private ownership of the constructed lake, pond or lagoon or
basin and shall assume full responsibility for the protection of the general public from any health or
safety hazards related to the lake, pond or lagoon constructed. The owner or developer shall assume
full responsibility for the maintenance of the lake, pond or lagoon or basin constructed. The owner or
developer shall keep TCEQ advised of the currently responsible agent for this maintenance. All dams are
required to be registered with TCEQ in accordance with the TCEQ Dam Safety Regulations.
11.1.4 NaturalResourceConservationServiceLakesA. There are a number of NRCS (previously Soil Conservation Service) lakes within the City limits and
extraterritorial jurisdiction of the City of New Braunfels. These lakes present complex issues of flood
control, erosion control, maintenance, and floodplain management. These lakes were constructed
to NRCS standards. The lakes are in private ownership, with maintenance provided by Comal
County. Operation of the lakes is the responsibility of Comal County. The City of New Braunfels is
responsible for floodplain management of those areas upstream, downstream and adjacent to the
lakes. Operation and maintenance of the NRCS lakes shall remain the responsibility of others.
B. The City of New Braunfels shall control future development upstream, downstream and adjacent to
all NRCS lakes. Planning for future development which impacts on, or is impacted by, NRCS lakes
shall require that a detailed engineering study be performed to provide a technical basis for
development and that the dam be upgraded as follows:
1. Provide principal spillway capacity adequate to discharge the 100‐year flood event based on
fully developed watershed conditions.
2. Provide total capacity of the dam structure, including principal and emergency spillways to
accommodate the PMF.
3. Manage existing flood storage capacity.
4. Prohibit upstream development within the contour line determine by the emergency spillway
crest elevation plus 2‐feet, or the 100‐year flood elevation (based on fully developed watershed
conditions) plus 2‐feet, whichever is greater.
5. Restrict development and improvements within the floodplain established by a breach flow
analysis from the dam to the downstream limits of the dam breach impact.
11.1.5 AdditionalDesignRequirementsA. An engineering plan for such construction accomplished by complete drainage design information
and sealed by a licensed professional engineer, shall be approved by the City of New Braunfels.
B. The spillway and any emergency overflow areas shall be located so that floodwaters will not
inundate any permanent habitable structures.
11‐3
C. The minimum SDF should be the 100‐year, 24‐hour storm regardless of critical inflow design storm
peaks.
D. The design shall comply with all federal, state and county laws pertaining to the impoundment of
surface water, including the design, construction, and safety of the impounding structure. Copies of
any federal, state or county permits issued for proposed impoundments shall be submitted to the
City Engineer.
E. Any existing NRCS structure or other dams which are included in the project drainage area shall
comply with the applicable federal, state, county and city safety requirements for structures.
Improvements may be required to upgrade the structure to the currently adopted guidelines.
Before removing, enlarging or altering any existing lake, the applicant will furnish a study of the
effects of the alteration upon flooding conditions both upstream and downstream. The study shall
be prepared by a professional engineer and submitted to the City Engineer for approval prior to
making the proposed alteration.
F. Any improvements to existing dams or lakes or construction of new impoundments shall be made at
the expense of the developer, prior to completion of the adjacent street, utilities and drainage
improvements, as provided for under the subdivision regulations.
11.2 LeveesIn the event that developers or owners wish to build levees to protect an area from flooding, all
applicable FEMA guidelines, State of Texas Dam Safety Guideline, and the following criteria apply:
A. Levees shall be designed to have freeboard requirements as specified by FEMA.
B. Levees shall be designed according to the Corps of Engineers’ design criteria used for federally
authorized levees, whether or not they are federally authorized.
C. Ring levees shall not be permitted.
D. If possible, provision shall be made to provide the permanent maintenance of levees either by a
flood control district or similar governmental organization of by the existing property owner and all
future owners, heirs or assigns, through the use of a maintenance agreement.
E. Levee systems shall be designed with interior drainage system to prevent flooding from local runoff
contained within the system for the 100‐year design flood.
F. Levee system shall have written operation procedures that address gate‐closure conditions and an
emergency warning plan. A copy of these procedures shall be furnished to the City Engineer.
G. Automated gate‐closure systems shall have power from two independent sources and shall be
capable of being operated manually.
H. All new levee systems shall have permanent positive closures to the required design elevation.
Temporary closures involving sandbagging or other procedures requiring manual operations shall
not be permitted.
I. Additional plan requirements including water surface profiles for the design flood and standard
project flood; the top of the levee profile, definition of interior drainage facilities, including pump
station and ponding areas; location of gravity outlets, gatewells and closure structures; and
elevation‐duration data on the receiving system.

11‐4
This page intentionally left blank.

12‐1
12 SiteErosionControlDuringConstruction
12.1 ApplicablePropertiesorConstructionSitesPrivate property owners, developers or builders shall be accountable for any erosion of their property or
construction site which results in measurable accumulation of sedimentation in dedicated streets, alleys,
any waterway or other private properties. Any accumulation or deposit of soil material beyond the
limits of the property or in City streets, alleys or drainage facilities in an amount sufficient to constitute a
threat to public safety and comfort as determined by the City Engineer shall constitute a violation.
Sediment carried by stormwater runoff through these acres shall be prevented from entering storm
drain systems and natural watercourses.
12.2 GeneralGuidelinesforErosionControlPlanA. Maximum use shall be made of vegetation to minimize soil loss. At a minimum, 70% established re‐
vegetation is required for residential subdivision developments that do not retain the natural
vegetation. Vegetation measures should begin as soon as possible during construction in order to
allow for establishment at construction termination.
B. Natural vegetation should be retained wherever possible.
C. Where inadequate natural vegetation exists or where it becomes necessary to remove existing
natural vegetation, temporary controls should be installed promptly to minimize soil loss and ensure
that erosion and sedimentation does not occur. The developer is responsible for maintenance of
site erosion control devices until a sufficient vegetation cover has been provided or replaced as
determined by the City Engineer. Periodic maintenance shall be performed by the developer to
remove accumulated sediment that would otherwise inhibit the proper functioning of the erosion
control devices. Storm Water Pollution Prevention Plans (SWPPP) are required to maintained on all
permitted construction sites at all times.
D. During construction, erosion controls shall be used to slow drainage flow rate and prevent
downstream sedimentation.
E. Erosion control elements should be implemented as soon as practical in the development process.
F. Waste or disposal areas and construction roads should be located and constructed in a manner that
will minimize the amount of sediment entering streams.
G. Frequent fording of live streams will not be permitted; therefore, temporary bridges or other
structures shall be used wherever an appreciable number of crossings of a stream are necessary.
H. When work areas or material sources are located in or adjacent to live streams, such areas shall be
separated from the stream by a dike or other barrier to keep sediment from entering a flowing
stream. Care shall be taken during the construction and removal of such barriers to minimize the
sediment transport into a stream.
I. Should preventative measures fail to function effectively, the applicant shall act immediately to
bring the erosion and/or siltation under control by whatever additional means are necessary.
J. Erosion control devices shall be placed to trap any losses from stockpiled topsoil. Some acceptable
forms of site erosion control devices include, but are not limited to, silt fences, silt traps, geonetting
and geotextiles. Hay bales are not permitted.
12‐2
K. The selection and timing of the installation of erosion controls shall be based upon weather and
seasonal conditions that could make certain controls not practicable.
L. Vegetation used for vegetative cover shall be suitable for local soil and weather conditions. Ground
cover plants shall comply with listings from the Texas Agricultural Extension Service.
M. Runoff shall be diverted away from construction areas as much as possible.
N. Stripping of vegetation from project sites shall be phased so as to expose the minimum amount of
area to soil erosion for the shortest possible period of time. Phasing shall also consider the varying
requirements of an erosion control plan at different stages of construction and shall include the
establishment of new vegetation or permanent erosion control measures.
O. Developers, builders, or owners of property shall install all utilities, including franchise utilities,
before final acceptance of a subdivision, property and/or structure. Final acceptance will also be
contingent upon having all necessary erosion control measures installed to minimize off‐site
sediment. At the discretion of the City Engineer; a site may be accepted without erosion control
measures if perennial vegetative cover is actively growing.
P. SWPPP shall follow TCEQ rules.
12.3 StreamBankErosionErosion control will be provided along streams and drainage channels. Where bank stabilization or
other erosion protection measures are required to protect streams and channels, the stream bank
protection and erosion damage mitigation measures provided in this manual shall be utilized.

13‐1
13 WaterQualityControls
13.1 ApplicabilityPermanent water quality controls for development located over Edwards Aquifer regulated zones shall
comply with the latest Texas Commission on Environmental Quality (TCEQ) published rules and technical
design guidance. Permanent water quality controls for new development outside of the Edwards
Aquifer regulated zones shall meet the criteria in this manual if the following are met:
1. The development is located in the City’s Jurisdiction; and,
2. The development is defined as Type 3; and,
3. The total impervious cover for the development will exceed 30% of the contiguous property as
a result of the development.
13.2 DesignCriteriaPermanent water quality best management practices (BMPs) shall be designed to provide adequate
treatment of the water quality volume (WQV) in the City’s Jurisdiction. The WQV is defined as the first
one‐half inch of runoff from all new impervious surfaces added to a site that does not replace existing
impervious surfaces (Equation 13‐1).
Equation 13‐1
𝑊𝑄𝑉 𝑐𝑢𝑏𝑖𝑐 𝑓𝑒𝑒𝑡.
𝐼𝐶 𝐴𝑟𝑒𝑎 𝑃𝑜𝑠𝑡 𝐶𝑜𝑛𝑠𝑡𝑟𝑢𝑐𝑡𝑖𝑜𝑛 𝐼𝐶 𝐴𝑟𝑒𝑎 𝑃𝑟𝑒 𝐶𝑜𝑛𝑠𝑡𝑟𝑢𝑐𝑡𝑖𝑜𝑛 𝑠𝑞. 𝑓𝑡.
13.3 TreatmentMethodsIn order to provide adequate treatment, one of the following methods must be followed:
1. Detention Filtration: Detain the WQV in an earthen basin for at least 24 hours as described in
this Section
2. Provide one or more BMPs that meet the requirements in TCEQ report publication RG‐348
and/or subsequent addenda
3. Provide BMPs that are approved by the Engineering Division prior to submission of a
development application.
The WQV may be reduced by applying for impervious cover credits and/or the use of Low Impact
Development (LID) strategies. Impervious cover credits and LID strategies are defined in the City of New
Braunfels LID Manual.
13.3.1 DetentionFiltrationThe following process determines detention filtration requirements:
1. Calculate the minimum extended detention volume using Equation 13‐2. The water quality
volume shall be increased by a safety factor of 20% to account for deposition of solids over time.
A fixed vertical sediment depth marker shall be installed in the basin to indicate when sediment
13‐2
accumulation meets or exceeds 20% of the water quality volume and sediment removal is
required.
Equation 13‐2
𝑉 𝑊𝑄𝑉 ∗ 1.2
2. The flow path from the inlet to the outlet of the extended detention basin should be twice as
long as the width of the extended detention basin.
3. The 24‐hour draw‐down time should be achieved by installing the appropriate sized orifice on
the outlet structure. No more than 50% of the extended detention volume shall drain from the
facility within the first 12 hours. Outlet pipes shall be designed to prevent accumulated
sediment from discharging from extended detention basin.
a. If perforated pipe is used, then the size of the perforations should not be used for draw‐
down time design purposes, and a filter should be installed to prevent the perforations
from clogging.
b. If the discharge pipe extends through a concrete wall, then a sleeve is required in the
wall, and a water proof sealant should be used to prevent leaks around the sleeve.
4. The extended detention basin may be installed offline from peak flow attenuating detention
basins or incorporated into a detention basin
13.3.2 TCEQMethodWhen a treatment method approved by TCEQ is utilized outside of the Edwards regulatory zones, the
increase in TSS load resulting from all new impervious surfaces must be reduced by at least 70%.
Calculation of the capture volume or minimum flow rate shall follow the method in the latest technical
guidance on BMPs for the Edwards Aquifer Rules.
13.3.3 AlternativeMethodsThe Engineering Division prior to submitting a development application must approve all other methods.
Alternative methods must show comparable treatment levels as the Detention Filtration or TCEQ
Methods.
13.4 MaintenanceA maintenance schedule and plan for water quality controls shall be submitted to the Engineering
Division prior to approval of construction plans. When included as part of a subdivided development, a
maintenance bond shall be provided in accordance with Section 118‐38 of the New Braunfels Code of
Ordinances. Alternate methods may require additional monitoring and engineering studies to ensure
compliance.