Embed Size (px)
Citation preview

Drag and Drag Cost:
The Missing Critical Path Metrics*****
A One Hour Presentation
for
PMI Baltimore Lunch Meeting,
Columbia, MD
by
Stephen A. Devaux
10/28/2013
Copyright 2013, Analytic Project Management, Swampscott, MA 1
A
P
M
Analytic Project Management
72 Blodgett Ave.
Swampscott, MA 01907
(781) 598-1222

2
What Is Critical Path Drag?Critical path drag is a critical (literally!) new
CPM metric that was introduced in my 1999 book Total Project Control (TPC).
It is NOT the only, or even the most important technique or metric of TPC.
But it IS the one whose value is most intuitively obvious.
Copyright 2013, Analytic Project Management, Swampscott, MA

What Critical Path Drag is NOT!It is NOT Steve Devaux’s invention!
3
It’s not an invention at all! EVERY project has a critical path and therefore EVERY
project has activities with drag!
I just identified the importance of critical path drag and how to compute it.
Copyright 2013, Analytic Project Management, Swampscott, MA

All Projects Are Investments.
“An investment in work to create a unique product, service or result.”
4
(http://dictionary.reference.com/browse/value)
“Value: n; relative worth, merit or importance.”
In any investment, “value” means value to the investor!
Copyright 2013, Analytic Project Management, Swampscott, MA

5
Externalities
(A)n externality is a cost or benefit… incurred by a party who did not agree to the action causing the cost or benefit… (P)rices do not reflect the full costs or benefits of producing or consuming a product or service.
http://en.wikipedia.org/wiki/Externalities
Copyright 2013, Analytic Project Management, Swampscott, MA
Items which are left as externalities are measured at zero!

6
The Two Externalities in Projects
Externalities!
SCOPE
COST TIME
If two sides of the project investment
triangle are left unmonetized, and the third side is COST, is it any
wonder that justifying additional resources is almost
impossible?
Copyright 2013, Analytic Project Management, Swampscott, MA

Integrating the Project Investment
$ Invested forResources
7
SCOPE
COST TIME
Copyright 2013, Analytic Project Management, Swampscott, MA
SCOPE generates the project’s value!
If invested resources are measured in dollars, the other sides of the triangle should be, too.
Otherwise, how can we justify spending even one dollar on resources?
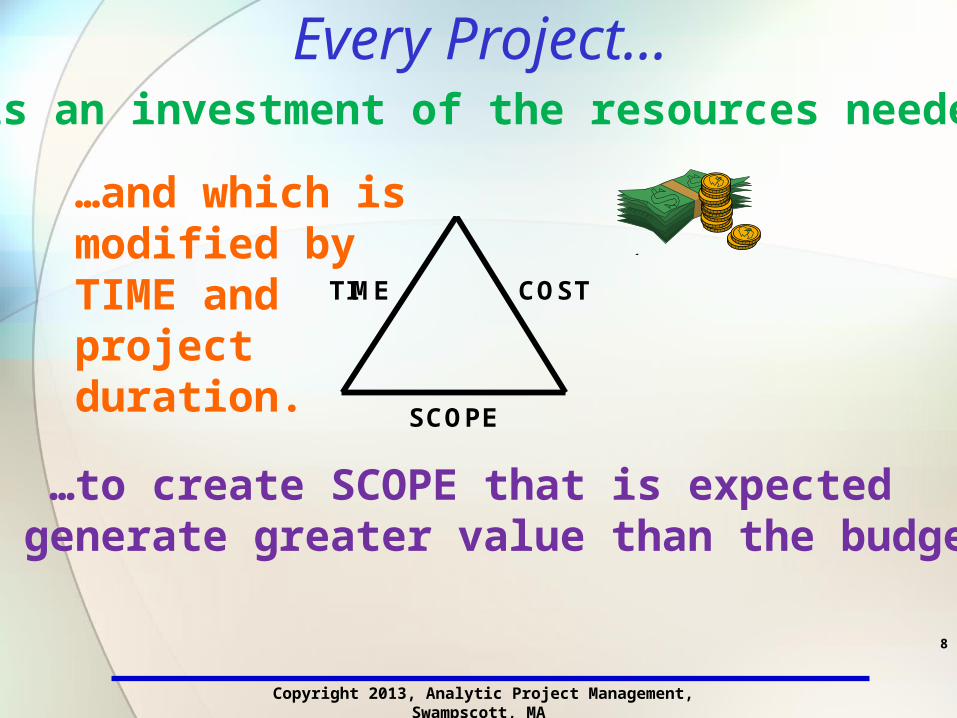
Every Project……is an investment of the resources needed…
8
SCOPE
COST TIME
Copyright 2013, Analytic Project Management, Swampscott, MA
…to create SCOPE that is expected to generate greater value than the budget…
…and which is modified by TIME andprojectduration.

SCOPE Generates the Project’s Value
EXP. PROJECT PROFIT = $EMV of SCOPE - $COST of resources
SCOPE
COST TIME
$Expected Monetary Value (EMV)
$BUDGET
If a project is an investment, then every project is performed for the difference between its expected value and its cost.
Copyright 2013, Analytic Project Management, Swampscott, MA
9
What about TIME?
TIME modifiesthe value ofthe SCOPE.
TIME also can impactresource usage and COST.

The Impact of TIME on EMV
Typically, the sooner the delivery, the greater the $EMV.The later the delivery, the lower the $EMV.
SCOPE
COST TIME
$EMV
($+ or $- per time unit against...)
Delivering the product generates almost all the value.
(as of a given completion date.)
10
Copyright 2013, Analytic Project Management, Swampscott, MA
$BUDGET

Planning Value thru the DIPP
PROJECT PROFIT = ($EMV of SCOPE $Accel/Delay) – ($BUDGET COST Variance)
SCOPE
COST TIME
$Expected Monetary Value (EMV)
$BUDGET
Copyright 2013, Analytic Project Management, Swampscott, MA
11
($+ or $- per time unit against...)
* See “When the DIPP Dips”, Project Management Journal, Sep-Oct 1992.
Planned Simple DIPP * = $EMV of SCOPE
$Planned Cost ETC

Tracking Value thru the DIPP
SCOPE
COST TIME
$EMV
$BUDGET
Copyright 2013, Analytic Project Management, Swampscott, MA
12
($+ or $- per time unit against...)
Actual Simple DIPP = ($EMV of SCOPE $Accel/Delay)
($BUDGET COST Variance)
Planned Simple DIPP = $EMV of SCOPE
$Planned Cost ETC
DIPP Progress Index (DPI) = Actual DIPP
Planned DIPP

The DIPP and the DPI The following 26 week project has an EMV of $240,000 and an initial budget of $90,560:
DIPP Progress Index (DPI) = Actual DIPP ÷ Planned DIPP
What is the DPI at Week 18 if the Actual DIPP is 5.43?
What events could cause an Actual DIPP that’s lower or higher than planned?
5.43 / 6.03 = .90
What is the DPI at Week 18 if the Actual DIPP is 6.33? 6.33 / 6.03 = 1.05
Copyright 2013, Analytic Project Management, Swampscott, MA
*

14
Estimating the Cost/Value of Time is ESSENTIAL to Good
Project Management!Otherwise it will be an externality – worth zero!
Copyright 2013, Analytic Project Management, Swampscott, MA
In many project schedules, the cost of resources is often less than the cost of the time that they would save!
This is especially true on enabler projects within a program, i.e., projects that enable other valuable projects.

Introducing:Paradise Island!
A luxury Resort Island for YOUR Investment,
And for YOUR Exquisite Pleasure!
Grand Opening Jan 1, 2017!Copyright 2013, Analytic Project Management, Swampscott, MA

With magnificent golf courses…
PROFITS:
$104M/year
…And a marina…PROFITS:
$156M/year
…And luxury hotels and restaurants!
PROFITS:
$258M/year!
All construction scheduled to begin Jan 1, 2014!Copyright 2013, Analytic Project Management, Swampscott, MA

Guest Privacy Guaranteed!
Access to island ONLY via Garden of Eden Bridge!(Under construction, scheduled completion Dec 31, 2013)
(EXPECTED PROFITS from TOLLS: $2M/year.) Copyright 2013, Analytic Project Management, Swampscott, MA

Five Key Milestones!Bridge scheduled completion Dec 31, 2013
PROFITS: $104M/year ($2,000,000/week)
Golf course construction scheduled to begin Jan 1, 2014
PROFITS: $156M/year ($3,000,000/weekMarina construction scheduled to begin Jan 1, 2014
PROFITS: $2M/year ($40,000/week)
PROFITS: $258M/year ($5,000,000/week)Hotel/Restaurant construction scheduled to begin Jan 1, 2014
PROFITS: $520M/year ($10,000,000/week)Grand Opening scheduled for Jan 1, 2017
WEEKLY COST OF DELAY: $10,000,000/week
WEEKLY COST OF DELAY: $5,000,000/week
WEEKLY COST OF DELAY: $3,000,000/week
WEEKLY COST OF DELAY: $2,000,000/week
WEEKLY COST OF DELAY: $10,000,000/week!
Copyright 2013, Analytic Project Management, Swampscott, MA

19
Enabler Projects
The value of an enabler project is multiplied by the value of the projects it enables.
Copyright 2013, Analytic Project Management, Swampscott, MA
Additionally, the value/cost of time on an enabler project is often multiplied by the value of the projects it enables.

20Copyright 2013, Analytic Project Management, Swampscott, MA
The Drag Efficient
And So To Critical Path Drag Every project is as long as its
longest path of activities.
We can choose to plan and optimize that path, or we can ignore it.
But the project will STILL be as long as its actual longest path!
What impacts a project’s delivery date?
Failure to manage the critical path properly means failure to control the impact of duration on the investment.
The work, delays, constraints, and bottlenecks that comprise a project’s critical path (and have drag!).
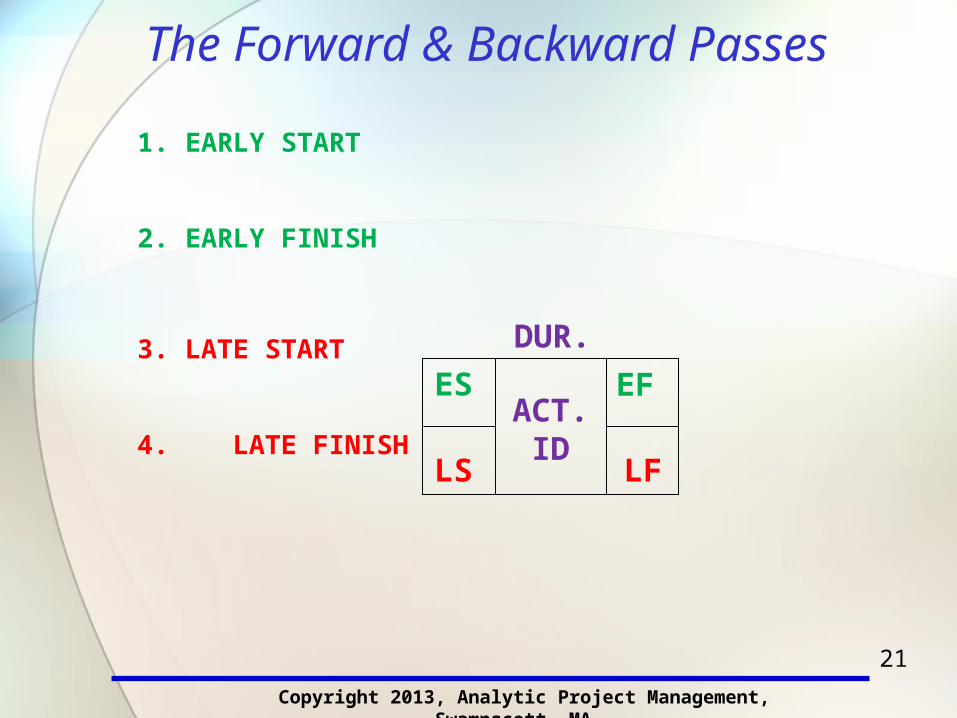
The Forward & Backward Passes
1. EARLY START
2. EARLY FINISH
3. LATE START
4. LATE FINISH
Copyright 2013, Analytic Project Management, Swampscott, MA
LFLS
ES EF
DUR.
ACT.ID
21

What Does CPM Say?
Total float = amount of time an activity can slip without delaying the end of the project.
TF=6
But what about ON the critical path? What does CP analysis say about critical activities?
22Answer: ZERO (Float = 0)!Copyright 2013, Analytic Project Management, Swampscott, MA
A
15
C
24
D
20
E
B
30
12
1 15
16
16 40
45
39 51
52 71

But about stuff that’s ON the critical path, traditional CPM (and CPM software) says “ZERO!
TF=3.5M
TF=3M
TF=2M
Traditional CPM Quantifies…
Off the critical path On the critical path ¨ Total Float ¨ Total Float = ¨ Free Float
23
0
Copyright 2013, Analytic Project Management, Swampscott, MA

24
Where to Shorten?
A
15
C
24
D
20
E
B
30
12
1 15
16
16 40
45
39 51
52 711 15
40
51
39 5116
22
52 71
Suppose each unit of duration cuts ROI by $5,000?Of the four activities on the CP (A, C, D, E),
which TWO should we look at first to shorten?
TF=0
TF=6
TF=0TF=0
TF=0
1. A & C? 2. A & D? 3. A & E? 4. C & D? 5. C & E?
Copyright 2013, Analytic Project Management, Swampscott, MA
25
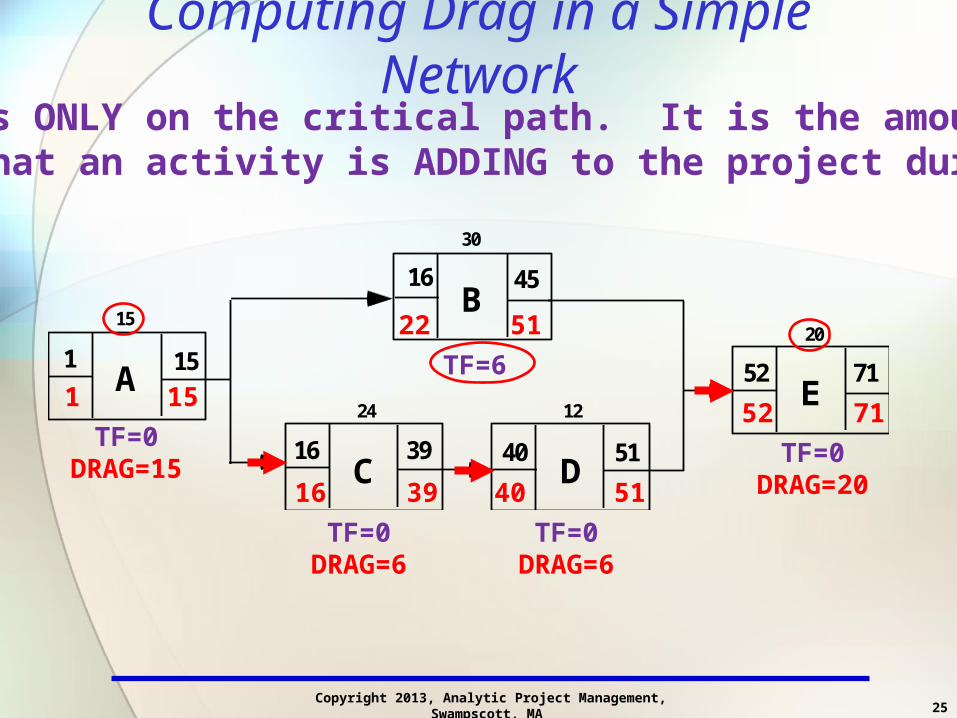
Computing Drag in a Simple Network
A
15
C
24
D
20
E
B
30
12
1 15
16
16 40
45
39 51
52 711 15
40
51
39 5116
22
52 71TF=0
DRAG=15
TF=6
TF=0DRAG=6
TF=0DRAG=6
TF=0DRAG=20
Drag is ONLY on the critical path. It is the amount of time that an activity is ADDING to the project duration.
Copyright 2013, Analytic Project Management, Swampscott, MA

A
15
C
24
D
20
E
B
30
12
1 15
16
16 40
45
39 51
52 711 15
40
51
39 5116
22
52 71TF=0
DRAG=15
TF=6
TF=0DRAG=4
TF=0DRAG=4
TF=0DRAG=20
20
16 47
51
32
F
TF=4
Computing DRAG in a Simple Network (cont.)
Copyright 2013, Analytic Project Management, Swampscott, MA

27
Computing DRAG in a Simple Network (cont.)
A
15
C
24
D
20
E
B
30
12
1 15
16
16 40
45
39 51
52 711 15
40
51
39 5116
22
52 71TF=0
DRAG=15
TF=6
TF=0DRAG=4
TF=0DRAG=4
TF=0DRAG=20
20
16 47
51
32
F
TF=4
16
16 37
37
22
C38
38 39
39
2
G
TF=0DRAG=2
Copyright 2013, Analytic Project Management, Swampscott, MA

28
Formula for Computing DRAG
1. If it has no parallel path activities:DRAG of Activity X = its duration.
• Sumatra.com’s Project Optimizer software, an add-on to MS Project.
• Spider Project released a version in April 2009 that computes drag.
• InterPlan Systems is releasing a drag-computing version this year
2. If there are parallel paths:DRAG of Activity X = whichever is LESS:
Its duration OR
the TF of the parallel activity with the least TF.
Copyright 2013, Analytic Project Management, Swampscott, MA

Drag Exercise 1
Copyright 2013, Analytic Project Management, Swampscott, MA
10 15 5 5
20
29

Computing DRAG Cost
A
15
C
24
D
20
E
B
30
12
1 15
16
16 40
45
39 51
52 711 15
40
51
39 5116
22
52 71DRAG=15
DRAG=4DRAG=4
DRAG=20
20
16 47
51
32
F
16
16 37
37
22
C38
38 39
39
2
C’
DRAG=2
30
If every unit of time reduces project profit by $10,000:
Copyright 2013, Analytic Project Management, Swampscott, MA
DC=$150K
DC=$40KDC=$40K DC=$20K
DC=$200K
The drag cost metric is what you use tojustify the additional resources you need!

What is the True Cost of an Activity?
A
15
C
24
D
20
E
B
30
12
1 15
16
16 40
45
39 51
52 711 15
40
51
39 5116
22
52 71
20
16 47
51
32
F
16
16 37
37
22
C38
38 39
39
2
G
Imagine that this project has a budget of $300,000, allotted as follows:
BUDG=$30,000
31
BUDG=$65,000
BUDG=$50,000
BUDG=$75,000
BUDG=$40,000BUDG=$5,000
BUDG=$35,000
Which two work activities TRULY cost the most?
Copyright 2013, Analytic Project Management, Swampscott, MA
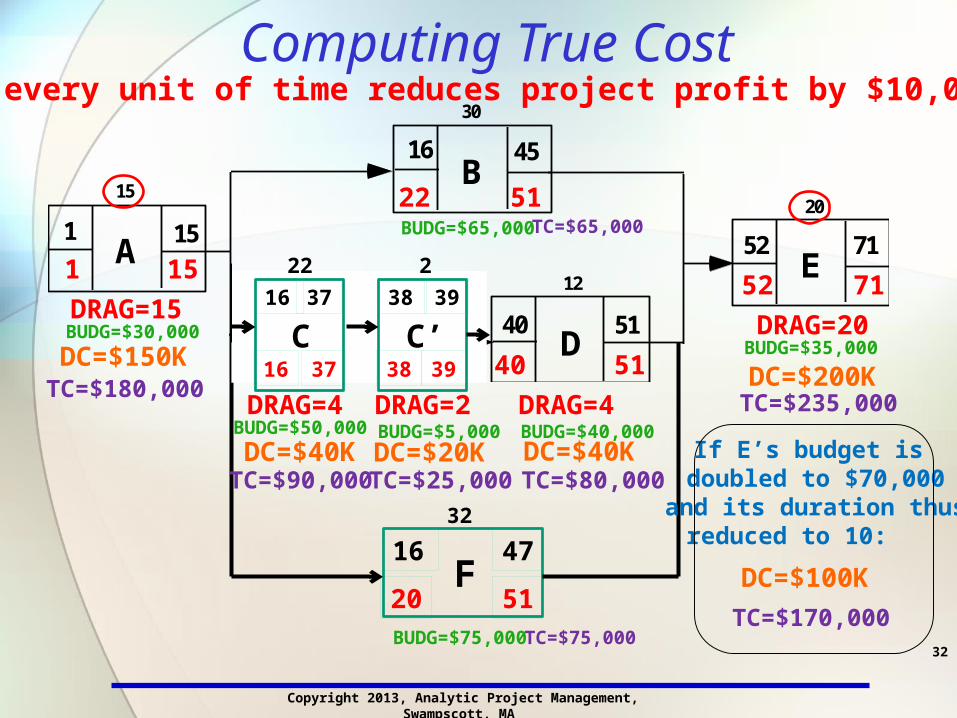
Computing True Cost
A
15
C
24
D
20
E
B
30
12
1 15
16
16 40
45
39 51
52 711 15
40
51
39 5116
22
52 71DRAG=15
DRAG=4DRAG=4
DRAG=20
20
16 47
51
32
F
16
16 37
37
22
C38
38 39
39
2
C’
DRAG=2
BUDG=$30,000
32
BUDG=$65,000
BUDG=$50,000
BUDG=$75,000
BUDG=$40,000BUDG=$5,000
BUDG=$35,000
If every unit of time reduces project profit by $10,000:
Copyright 2013, Analytic Project Management, Swampscott, MA
DC=$150K
DC=$40KDC=$40K DC=$20K
DC=$200K
TC=$25,000 TC=$80,000TC=$90,000
TC=$180,000TC=$235,000
TC=$75,000
TC=$65,000
If E’s budget is doubled to $70,000
and its duration thusreduced to 10:
DC=$100K
TC=$170,000

Adding Resources to Reduce Drag
33
1. Drag shows which activities will benefit the project most by being shortened – both up front and when things slip!
2. Drag Cost justifies resources -- if an activity has a DRAG Cost of $10,000 per week, that justifies up to $30,000 to lessen its DRAG by three weeks.
4. Each good decision displays its worth by increasing the project ROI, DIPP and DPI, the whole reason for the project investment!
3. If a CP activity has significant drag and is resource elastic, why does it have part-time resources?
Copyright 2013, Analytic Project Management, Swampscott, MA

DRAG Puts the Focus…
34
DRAG=2MDRAG=2M
DRAG=2M D=1.5M
…where it belongs: ON the critical path!
Copyright 2013, Analytic Project Management, Swampscott, MA

It’s NOT Always That Simple……Larger projects and complex dependencies makecomputing DRAG more problematic.
35
Start-to-Start (SS)
Finish-to-Finish (FF)
Start-to-Finish (SF)
Start-to-Start (SS)with lag
Finish-to-Finish (FF)with lag
Start-to-Finish (SF)with lag
Copyright 2013, Analytic Project Management, Swampscott, MA

1. SS with lag
2. FF with lag
3. SF with lag
Decomposition With Lags
36
Relationship Decomposition
TF=2D=4TF=0
D=2TF=0D=4+2=6
TF=3
D=3TF=0
D=3
TF=3
D=3TF=0
D=3
D=3
TF=1
D=1TF=0D=4
Copyright 2013, Analytic Project Management, Swampscott, MA
N
10

Eight Points in Conclusion
37
1. All projects are investments.
Copyright 2013, Analytic Project Management, Swampscott, MA
2. Almost all project investments are very time sensitive – shorter adds to ROI, longer subtracts.
3. We MUST start estimating the value/cost of time!
4. Project durations are driven by the critical path.
5. Traditional CPM metrics quantify non-CP work.
6. CP drag tells us what is costing how much time!
7. That time can be human lives. And pain. And MONEY!
8. That money can justify both resources and the value that a good scheduler can bring to a project.

Stephen A. Devaux, MSPM, PMPPresident, Analytic Project Management72 Blodgett Ave., Swampscott, MA 01907
Office: 781-598-1222 Cell: 617-763-3067 Email: [email protected]
38
PUBLICATIONS• Total Project Control: A Manager’s Guide to Integrated Project Planning, Measuring, and Tracking ,
May 1999, John Wiley & Sons.
• “The Drag Efficient,” article in Jan/Feb 2012 issue of Defense AT&L Magazine . Reprinted in CRC Press’s book Project Management in the Oil and Gas Industry.
• “Time is a Murderer,” chapter in CRC Press’s 2013 book Handbook of Emergency Response.
•Six-part series on TPC methods, published in Projects@Work on-line magazine, Oct-Dec 2006:“The Value-abled Project” “Moneyproject” “Time is a Crook”“Delay Tactics” “Drag Racing on the Critical Path” “Paving the Critical Path”
“Scheduling is a Drag, “published in Projects@Work on-line magazine, Jan 2009, (co-author with William Duncan, author of the 1996 PMBOK Guide).
•“When the DIPP Dips,” Project Management Journal, September 1992. Reprinted in PMI’s book
Essentials of Project Control, 1999, Pinto & Trailer, ed.
•“Moneyproject: Metrics, Baseball, and PM”, webinar for PMI’s Metrics SIG, 2005. •“Total Project Control in IS Projects: Managing Projects and Portfolios for Maximum Value”,
webinar for PMI’s Information Systems SIG (IS-SIG), 2003.
Copyright 2013, Analytic Project Management, Swampscott, MA