Embed Size (px)
Citation preview
DRAFT—PLEASE DO NOT CITE WITHOUT PERMISSION FROM AUTHORS
Does Gentrification Increase Employment Opportunities
in Low-Income Neighborhoods?
Rachel Meltzer (The New School)*
Pooya Ghorbani (The New School)
Updated March 24, 2015
*Corresponding author: 72 Fifth Avenue, Room 616, New York, NY 10011, [email protected].
1
DRAFT—PLEASE DO NOT CITE WITHOUT PERMISSION FROM AUTHORS
Abstract
Gentrification is a term often associated with displacement and other negative byproducts of affluent in-movers altering the economic and demographic composition of a neighborhood. Empirical research on neighborhood change, however, has produced no conclusive evidence that incumbent residents are in fact displaced under circumstances of gentrification. The question is then, do these incumbent residents benefit from the economic and social changes that accompany gentrification? In this paper, we focus on low-income neighborhoods undergoing economic transitions (i.e. gentrification) and test whether or not the potential benefits from these changes stay within the community, in the form of employment opportunities for local residents. Our preliminary results suggest that gentrifying neighborhoods on average do not experience consistent, meaningful gains in local employment, compared to other comparable low-income neighborhoods that are not undergoing economic upgrading. In fact, there is some evidence that, as a share of all jobs in the census tract, the number of local jobs decreases under circumstances of gentrification; this appears to be driven by neighborhoods with higher shares of newer residents. That said, businesses that stay in place do tend to hire locally, compared to new businesses. At larger geographies (i.e. ZIP codes), however, the number of jobs going to local residents increases, and these jobs are primarily going to service sector, low-earners. Stratified models indicate that any local job gains are concentrated in larger neighborhoods with initially longer commute times for their workers (for both tract and ZIP analyses) and are weakly associated with higher unemployment rates; both of these findings suggest that gentrification is perhaps helping to fill an initial employment gap.
2
DRAFT—PLEASE DO NOT CITE WITHOUT PERMISSION FROM AUTHORS
I. Introduction
Gentrification is a term often associated with displacement and other negative byproducts of
affluent in-movers altering the economic and demographic composition of a neighborhood.
Indeed, new investment in a community can bring increased pressure on rents and prices and
niche services that cater more to the relatively new residents than the incumbent ones; these
kinds of outcomes do not always bode well for longstanding community members. However,
there is another side to gentrification, and one that can bring opportunity and quality of life to
areas that were otherwise neglected (either by the market or public sector). These upsides have
become increasingly more relevant, as the empirical research has produced no conclusive
evidence that incumbent residents are in fact displaced under circumstances of gentrification.
The question is then, do these incumbent residents benefit from the economic and social changes
that accompany gentrification? In this paper, we focus on low-income neighborhoods
undergoing economic transitions (i.e. gentrification) and test whether or not the potential benefits
from these changes stay within the community, in the form of employment opportunities. The
findings from this research can inform local economic development strategies on how to grow
small businesses, generate accessible employment opportunities for local residents and ensure
that the benefits of neighborhood change reach incumbent, often lower-income, households.
The theoretical impact on employment opportunities for local residents is ambiguous. In the
case where economic change brings in new and/or more local businesses, nearby existing
residents will have the benefit of more information and lower search costs. All else equal, they
should see more local employment opportunities—essentially a reversal of the spatial mismatch
phenomenon. On the other hand, should neighborhood economic upgrading bring in new
retailers that more productively use the existing commercial space or who exploit farther-
reaching hiring networks (chains, for example), local existing residents, with potentially lower
skill sets and smaller networks, will not be as competitively positioned for these jobs.
In order to test these predictions, we build a dataset that tracks the universe of neighborhoods in
New York City for nearly a decade (2002-2011) with information on retail turnover and
contraction/expansion over time, demographic, economic, fiscal and built environment
3
DRAFT—PLEASE DO NOT CITE WITHOUT PERMISSION FROM AUTHORS
characteristics, and employment and demographics of the local resident labor pool. We compare
changes in local employment across low-income neighborhoods experiencing gentrification and
those that are more stagnant or economically declining. Preliminary results suggest that
gentrifying neighborhoods on average do not experience consistent, meaningful gains in local
employment, compared to other comparable low-income neighborhoods that are not undergoing
economic upgrading. In fact, there is some evidence that, as a share of all jobs in the census
tract, the number of local jobs decreases under circumstances of gentrification. At larger
geographies (i.e. ZIP codes), however, the number of jobs going to local residents increases (by
between 52 and 77 per year), and these jobs are primarily in service sectors and going to low-
and moderate-earners (i.e. those earning less than $3,333 per month). Stratified models indicate a
more pronounced negative effect on local jobs in neighborhoods with newer resident populations
and more business churn. There is weak evidence to suggest that local jobs increase in the
presence of businesses that stay in place and within the context of larger ZIP neighborhoods,
perhaps suggesting stronger ties to the community and/or the ability to find jobs within a larger
proximate market (and not immediately close to home). Local job gains are also concentrated in
ZIP neighborhoods with initially longer commute times for their workers and are weakly
associated with higher unemployment rates; both of these findings suggest that gentrification is
perhaps helping to fill an initial employment gap.
The paper proceeds in the following way. Section II sets up the theoretical framework for the
analysis and Section III summarizes the relevant empirical work to date. Section IV describes
the data for the analysis and Section V the empirical strategy. Section VI presents the
preliminary results from the analysis. Finally, Section VII concludes and discusses next steps in
the analysis.
II. Theoretical motivation
While the entry of new money and investment into a community can “price out” incumbent,
typically lower-income residents, this increased economic activity can also bring new
opportunities for local residents. One potential upside to gentrification is increased local
employment opportunities; the extent of this benefit will depend on whether or not and to what
degree these new jobs actually go to local residents. However, the impact of neighborhood
4
DRAFT—PLEASE DO NOT CITE WITHOUT PERMISSION FROM AUTHORS
economic upgrading on employment opportunities for local residents is theoretically ambiguous.
Here we assume that both potential outcomes, of increased or decreased/stagnant opportunity,
rely on the baseline assumption of some degree of spatial mismatch (holding all else equal).
Specifically, lower-income communities, prior to any gentrification processes, should be
experiencing either social or spatial isolation from job opportunities and the question is how an
injection of affluence and overall investment can help to localize those employment
opportunities.
Economic upgrading not only brings in a different, more affluent and educated, resident profile,
but it also ushers in services that did not previously enter those markets (Meltzer and Schuetz
2012; Meltzer and Capperis 2014). Both of these additions to the community can facilitate
access to localized employment opportunities. First, it is possible that the residential integration
of relatively more affluent and educated households could impose both direct and indirect
positive externalities on incumbent residents, who also tend to be lower-income and less
educated. Indirect effects, akin to peer effects, would come simply out of exposure to this new
population, whether or not any direct interaction took place (Ellen and Turner 1997). More
likely is the employment opportunity that comes out of direct contact with a new, perhaps more
networked or more enterprising neighbors (Ioannides and Loury 2004). Both would result in a
positive impact on access to employment opportunities, the direct more significantly than the
indirect. Whether or not the employment opportunity is local remains ambiguous, unless the
new neighbor is also more likely to personally hire in his or her home.
A perhaps more convincing scenario is where economic change brings in new and/or more local
business establishments, i.e. those entities that actually hire. The hiring of local residents by
these businesses may be more likely for various reasons. First, the likelihood to hire locally will
depend on the type of business. More service-oriented businesses, or those that do not require
technical or more advanced skill training, will more likely be able to hire from a local pool that
may not have higher or more technical levels of educational attainment. Second, the search costs
for both the businesses and local residents are lower; information about the employment
opportunities is accessible and transparent (i.e. local residents can see when a new business is
opening up) and advertising for available positions can penetrate the local community
immediately. Finally, government policies may require local hiring for new businesses,
5

DRAFT—PLEASE DO NOT CITE WITHOUT PERMISSION FROM AUTHORS
especially those in brand new developments or renovations (that are also more likely to receive
public subsidies or permitting). All else equal, these mechanisms predict increased local
employment opportunities—essentially a reversal of the spatial mismatch phenomenon.
On the other hand, physical integration may not translate to economic integration. Should
neighborhood economic upgrading bring in new retailers that more productively use the existing
commercial space (i.e. hire those with more technical training) or who exploit farther-reaching
hiring networks (chain establishments, for example), local existing residents, with potentially
lower skill sets and smaller networks, will not be as competitively positioned for these jobs. In
addition, local businesses may simply discriminate against potential local hires, based on race or
class, which would lower the chances of local employment (Lang and Lehmann 2012).
III. Empirical Literature Review
The literature on spatial mismatch and the geography of employment is rich and documents, for
various races and ethnicities, the importance of not just spatial proximity to employment (for
example, Kain 1968; Holzer 1991; Ihlanfeldt and Sjoquist. 1998; Raphael and Stoll 2002; Liu
and Painter 2011), but social proximity (i.e. networks) as well (see Ioannides and Loury 2004 for
a comprehensive critical summary). Fewer studies, however, have examined these relationships
over time and, in particular, under circumstances of dramatic economic and demographic
change. We discuss here the small body of work that relates directly to the current analysis.
The localized effects of gentrification
Gentrification, typically characterized as the arrival of relatively more affluent and educated
households into neighborhoods that have historically been occupied by lower income and often
minority households. This process is also usually accompanied by investment in the housing
stock and local infrastructure. These physical changes, however, are usually not apace with the
increased demand for occupying the space, placing pressure on prices and making it attractive
for landlords to increase rents. Incumbent residents are immediately at risk of displacement,
especially those who are renting, and this threat has been the focus of most of the gentrification
literature thus far. Earlier investigations, whether they relied on case studies or microdata
6
DRAFT—PLEASE DO NOT CITE WITHOUT PERMISSION FROM AUTHORS
(Vigdor 2002; Freeman and Braconi 2004), found no evidence of displacement for poor or
minority households. Studies that were able to exploit even more comprehensive micro-level
panel data corroborated these findings. McKinnish et. al. (2008) find no evidence of
displacement of non-white households and that a disproportionate number of black householders,
with no college education, remain in upgrading low-income neighborhoods. Ellen and O’Regan
(2011) account for both in- and out-flows of residents, and still find no evidence of negative
displacement effects. In fact, incumbent residents, under certain circumstances, experienced
gains in income and reported higher levels of satisfaction with their neighborhoods, compared to
other non-gentrifying low-income neighborhoods. This is also consistent with the findings from
Sullivan and Shaw’s (2011) study of retail gentrification in Portland, Oregon: black residents of
the studied gentrifying neighborhood appreciated the convenience of the nearby retail (even
though the satisfaction with the type of services provided was less enthusiastic).
Localized economic opportunity and gentrification
Even though the empirical evidence indicates that incumbent residents tend to stay in their
gentrifying neighborhoods, we know very little about how they experience the potential
opportunities that accompany neighborhood change. Do existing residents benefit from local
gains in services and employment opportunities? A handful of studies focus on changes in
commercial services (i.e. retail), in neighborhoods undergoing economic and demographic
transitions. The economically upgrading neighborhoods tend to experience higher growth rates
in local retail establishments and employment (Meltzer and Schuetz 2012; Schuetz, Kolko and
Meltzer 2012). In their case-study analysis of gentrifying neighborhoods in New York City,
Zukin et al. (2009) also observe retail growth, but moreso for independently owned
establishments compared to chain ones. Immergluck (1999) finds that neighborhoods that are
relatively more minority and less affluent experience declines in commercial investment, as
measured by changes in permit activity. Chapple and Jacobus (2009) observe retail revitalization
most significantly in middle-income neighborhoods that are economically upgrading. Therefore,
the literature implies that gentrifying neighborhoods do tend to witness an increase in retail
services, likely due to the changing consumer population and the (perceived) increase in demand
for goods and services in areas that were not previously seen as viable investments (Carree and
Thurik 1996).
7
DRAFT—PLEASE DO NOT CITE WITHOUT PERMISSION FROM AUTHORS
Other studies have taken a different perspective, focusing instead on the production side of these
economic outcomes. Curran (2004) conducts a case-study analysis in the Williamsburg
neighborhood of Brooklyn, a historically manufacturing and blue-collar neighborhood that has,
in recent years, undergone extensive gentrification. She finds evidence of gentrification-induced
industrial displacement that has degraded local blue-collar work and forced much of it into the
informal sector. Lester and Hartley (2014) also observe industrial restructuring in gentrifying
neighborhoods, such that jobs in restaurants and retail services tend to replace those in goods
producing industries. Furthermore, gentrifying neighborhoods experienced both more rapid
employment growth and more rapid industrial restructuring than other, non-gentrifying
neighborhoods. While Lester and Hartley conclude that gentrification is itself a catalyst for
localized industrial restructuring, Kolko (2009) raises the important point that gentrification is
also induced (and perpetuated) by the influx of affluent households who are presumably
following higher paying jobs. In his study, Kolko focuses on neighborhoods located in or near
the central business district and estimates the impact of changes in job pay on the average
neighborhood income (his proxy for gentrification). His analysis sheds light on the influence of
“newcomers” on local labor markets and how they too might be competing for neighborhood-
based employment opportunities. No study to date tests whether or not these employment
benefits are realized by incumbent residents, and how access to employment might vary by job
type or broader neighborhood conditions. This link is crucial, as it more directly measures how
the benefits of gentrification are retained by local community members, or simply exported to
those without any longstanding community ties.
IV. Data
The data for this project are compiled from a number of sources. The core component is derived
from the LEHD Origin-Destination Employment Statistics (LODES) dataset, which is publicly
available from the Census Bureau. The LODES data contains information on the employment
counts and live-work patterns of employees for every census block in New York City dating
from 2002 to 2011. Since the census block is quite small and not consistent with a
neighborhood’s span, we aggregate up this information into census tract and ZIP code counts for
the analysis. We supplement this data with two other datasets. First, we attach neighborhood
8
DRAFT—PLEASE DO NOT CITE WITHOUT PERMISSION FROM AUTHORS
(operationalized as either the census tract or ZIP code) characteristics from the Neighborhood
Change Database. Geolytics’ Neighborhood Change Database provides data for 1970 through
2010, normalized to consistent census tracts as defined in the 2010 census. We supplement these
data with indicators from the Census and the American Community Survey’s three-year
estimates for larger geographies.1 Second, we plan to merge in information from a proprietary
data set, the National Establishment Time Series (NETS), which allows us to follow the universe
of business establishments in New York City (including their sales revenues, employment and
organizational structure) over two decades until the present time. This database is constructed by
Walls and Associates, using information from the Dun & Bradstreet business register. Unlike
publicly available government data on employment, the NETS dataset includes no suppression of
employment in small industry or geographic cells and provides full street address information for
each establishment. We geocode these businesses’ addresses to tax parcels so that we can
accurately attach census tracts and ZIP codes and then aggregate establishment and employment
counts to obtain census tract and ZIP totals. In addition, industry is reported at the 6-digit North
American Industry Classification System (NAICS) level to allow for a fine-grained distinction
across retail and food services, and several variables, including one that indicates establishments
as headquarters, branches, or standalone outlets, permit classification of establishments
according to firm structure. Finally, because the NETS data are longitudinal and establishment-
specific, we can measure gross changes in the number of establishments and their employment
(versus just net employment changes, which is what the publicly available ZIP code aggregates
provide). We note that this data is not going to pick up informal hires and employment
opportunities that are not recorded by the business establishment (and therefore by the
government). Therefore, any count of employment or business enterprise is admittedly an
undercount. We hope to mitigate any systematic tendency of such activity, i.e. across gentrifying
neighborhood compared to those not upgrading as rapidly or at all, by controlling for other
socioeconomic characteristics at the neighborhood level that are likely correlated with the
likelihood of these informal activities.
We identify our study area as the New York-Newark, NY-NJ-CT-PA Combined Statistical Area
and run analyses on both census tracts and ZIP codes that are populated as of 2000 and with
1 Since the LODES data and Census data do not line up exactly with respect to timing, we assign proximate values as best as possible. For example, any LODES data point between 2006 and 2011 would be assigned to Census or
9
DRAFT—PLEASE DO NOT CITE WITHOUT PERMISSION FROM AUTHORS
valid income values throughout the study period. Ultimately, we end up with 50,889 tract-year
observations and 11,079 ZIP-year observations, which span 10 years (2002-2011) and over 800
municipalities. This larger sample includes both low- and moderate/high-income neighborhoods,
while we restrict the sample for the analysis to low-income neighborhoods only. This process is
described in the next section.
V. Empirical Strategy
Identification of gentrifying neighborhoods
In our analysis, we operationalize neighborhoods in two ways: as census tracts and as ZIP codes.
The intuition behind using these two geographies is that they will constitute both smaller and
larger definitions of live-work markets. We imagine that the ability to find work in the
immediate neighborhood will vary by distance, and the implementation of both geographies is an
attempt to capture this variation.2 All of the results from the analysis will be presented for
census tract and ZIP code geographies.
We prioritize the economic dimension of gentrification in our measurement of it, and identify
neighborhoods as gentrifying if they improve in their relative economic position over the course
the of the study period. This is consistent with previous implementations (see Ellen and
O’Regan 2008; McKinnish et.al. 2010; Meltzer and Schuetz 2012). We also note here that we
will include other variables, such as education, housing values and housing production, which
have been used to proxy for gentrifying neighborhoods in prior studies (see Freeman 2005;
Lester and Hartley 2014), as covariates in our analysis; therefore, while they are not instrumental
in identifying the gentrifying neighborhoods, they are accounted for as important correlates of
neighborhood change. Specifically, we (i) identify neighborhoods as ”low-income” if they have
average household incomes that are in the bottom quintile of the neighborhood income
distribution in 2000 (ii) out of those low-income neighborhoods, identify those whose relative
average household income (compared to the broader MSA) has increased by the end of the study
2 Ideally, we would construct a more flexible definition of “neighborhood” by drawing rings around the census tract centroids to pick up employment activity in geographically proximate tracts. We intend to do this in the next analytical iterations, but opted for the more crude approach presented here to see if any variation exists in the first place.
10
DRAFT—PLEASE DO NOT CITE WITHOUT PERMISSION FROM AUTHORS
period, 2008.3 We also replicate all analyses with a less stringent definition of “low-income”
and retain all neighborhoods with average household incomes in the bottom two quintiles of the
sample distribution. We rely on relative measures of income, and how those change over time,
to account for costs of living in a particular locality and the fact that macro metro area economic
shifts may or may not be reflected equally at the neighborhood level (this is consistent with other
studies such as Rosenthal 2008 and Ellen and O’Regan 2008). Out of all of the census tracts in
the study area, just under 880 are designated as very low-income (i.e. bottom 20th percent) and
1,756 are low-income (i.e. bottom 40th percent); out of those low-income tracts, about 40 percent
are identified as gentrifying over the study period. For ZIPS, 122 are designated as very low-
income (i.e. bottom 20th percent) and 244 are low-income (i.e. bottom 40th percent); out of those
low-income tracts about 74 percent are identified as gentrifying over the study period. We also
see that this income-based designation reflects other demographic disparities across low- and
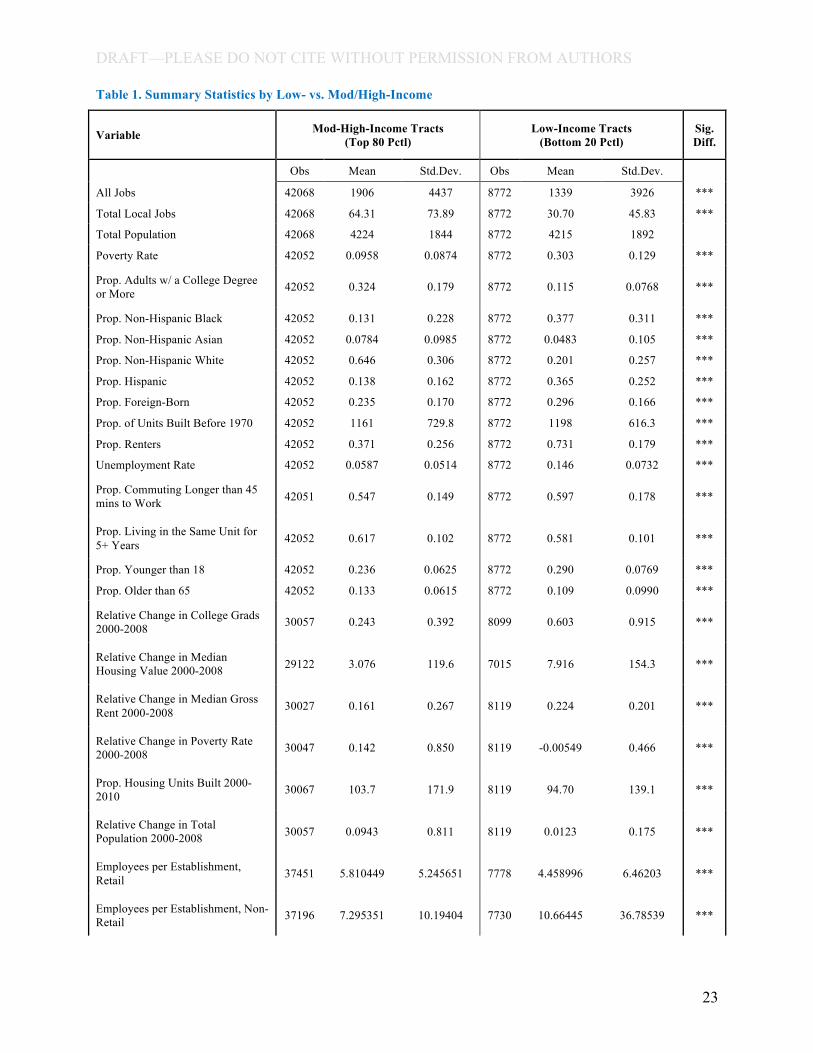
moderate/high-income neighborhoods. For example, in Table 1, we display demographics for
low-income tracts against those same variables for higher-income tracts, as of 2000. Using the
very low-income tracts as an example, we see that relatively higher income tracts have more
local jobs, which is consistent with a spatial mismatch narrative for lower-income tracts. The
higher income tracts also have more educated and older populations, fewer non-white
households, fewer residents in poverty, lower unemployment rates and newer housing stock that
tends to be owner-occupied. The residential population was more stable as of 2008 (with a lower
share that had moved in the previous five years) and a workforce that tends to commute slightly
less than that in the poorer neighborhoods. While the relatively higher income tracts experienced
more growth in population between 2000 and 2008, the lower income neighborhoods saw higher
rent and housing value increases over that same time period. Relatively higher income tracts
tend to have more retail establishments and fewer non-retail establishments (like, professional
services or goods-producing enterprises); they also have more businesses that stay in place over
the course of the study period. The movement of businesses into and out of the neighborhoods is
comparable, however. These are all characteristics that will be controlled for, at baseline, in the
regression analyses that follow.
3 We opt for average-income metrics, instead of median-income ones, for two main reasons: (1) unlike median income, average income for the ZIP code can be constructed from the census tract components in the NCDB database; since we want to compare results from models using census tracts to those using ZIP codes, this feature is important; (2) due to the normalized boundaries in the NCDB database, median values are constructed through a series of interpolations, introducing additional noise into that metric.
11
DRAFT—PLEASE DO NOT CITE WITHOUT PERMISSION FROM AUTHORS
Estimation
We run regressions only on those neighborhoods designated as “low-income” (based on their
relative household income position in 2000) and our estimation model generally takes the
following form:
Local_Jobsi,t= β0 + β1(Gentrifyi) + β2(Businessi,t) + β3(Nhoodi)
+ β4(Nhood_00_08i) + dm + ds,t + εit
Here, Local_Jobs measures the extent to which jobs in neighborhood i go to residents who live
in that same neighborhood i at time t and is specified in two ways: (i) a count of the number of
local jobs, Total_Local_Jobs, (in this specification, we also include on the right-hand-side a
measure of total jobs, including those occupied by local and non-local residents, to control for
overall employment activity); and (ii) local jobs as a share all of neighborhood jobs,
Local_Jobs_Share.4 Gentrify takes on the value of 1 if neighborhood i experiences an increase
in relative income between 2000 and 2008 and 0 otherwise.5 Businessi,t controls for changes in
local business activity, including the number of establishments that, over the prior 5-year period,
have stayed in the neighborhood (Stay), have moved into the neighborhood (Inmove), and have
left the neighborhood either due to permanent shutdown or relocation (Outmove). We also
control for the number of total establishments at the start of the study period, to distinguish
among neighborhoods that may be generally more or less likely to house commercial
establishments (and therefore experience such changes). The vector, Nhoodi, includes a number
of variables to control for the demographic and economic conditions at the start of the study
period, 2000. Specifically, we include baseline population, poverty rate, share of the population
with a college degree or higher, share non-Hispanic black, white and Asian, share Hispanic,
4 We also run models using a dependent variable which calculates local jobs as a share of the local residential population; the results are persistently insignificant and do not offer any additional insight. This is likely due to the fact that population is no reported regularly during the study period and is therefore interpolated across inter-centennial years.5 We also run specifications where we control for gentrification during the prior decade, 1990-2000, and the results for the Gentrify coefficient are substantively the same. Furthermore, the coefficient on the covariate Gentrify 90_00 is never significant, with the exception of a marginally significant, negative coefficient in the model estimating Total Local Jobs.
12
DRAFT—PLEASE DO NOT CITE WITHOUT PERMISSION FROM AUTHORS
unemployment rate, age and share foreign born to capture other resident characteristics that
could be correlated with income and employment-readiness. We also include indicators of
housing investment and tenures, such as age of the housing stock and share of the units occupied
by renters, and mobility of the local population, such as the share of the working population
whose travel time to work is more than 25 minutes and the share of residents that have not
moved in the past five years. Likewise, Nhood_00_08i controls for changes between 2000 and
2008 for a subset of neighborhood characteristics (relative to changes in those same variables at
the MSA level), such as education, median housing values and rents, poverty rate, population
and housing units.6 Again, we include these to control for other neighborhood changes that
could be correlated with economic upgrading and changes in localized employment
opportunities. Finally, we also include MSA and state-year dummy variables to control for
unobserved heterogeneity across metro areas and any macro changes over time that could be
correlated with neighborhood economic shifts and employment activity.7
VI. Preliminary Results
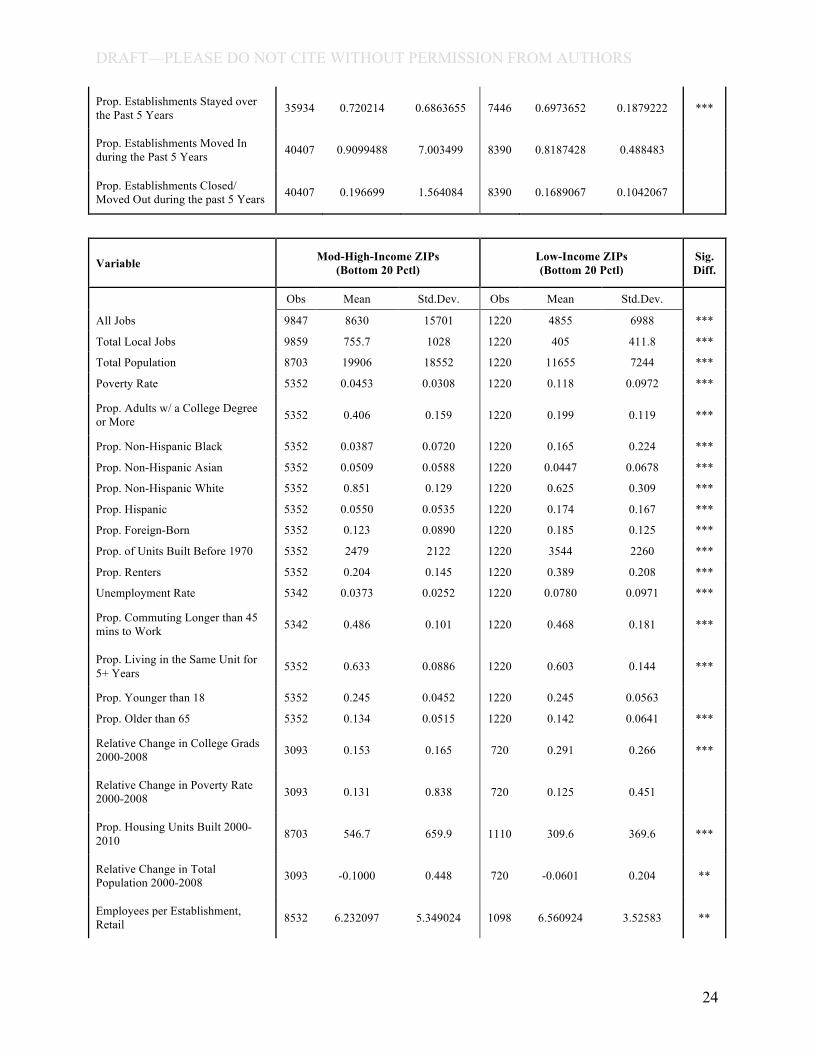
Comparing “low-income” definitions
Recall that we define “low-income” in two ways: once based on whether or not the
neighborhood has an average household income in the bottom quintile of the sample distribution
and once based on whether or not the neighborhood’s income is in the bottom two quintiles. To
provide some context for the importance of this difference, the average tract in the bottom
quintile of our sample distribution has an income that is .63 of its MSA average income at the
start of the study period, 2000. This same ratio for the average tract in the bottom 40th percentile
is .78. These amount to about $64,000 and $79,400, respectively—a meaningful difference.
Otherwise, the differences across neighborhoods classified in either way are generally slight (and
this pattern is consistent across tract- and ZIP-level analyses). The very low-income
6 We also run similar models that are more parsimoniously specified, to avoid multicollinearity across some of the covariates. The correlations are not strong and the results are substantively the same; these are available from the authors upon request.7 We also run models with county dummies, instead of MSA dummies, and the results are substantively the same. Ideally, we would like to include finer controls at the neighborhood level, but since the Census-based variables do not vary across the inter-census years, we would lose those covariates in the presence of neighborhood-level fixed effects.
13
DRAFT—PLEASE DO NOT CITE WITHOUT PERMISSION FROM AUTHORS
neighborhoods tend to be occupied by fewer white households and more renters. The very low-
income neighborhoods also tend to have slightly more jobs overall, but fewer jobs employed to
local residents; and this ratio is persistent over the course of the study period. The very low-
income neighborhoods also tend to have slightly more non-retail establishments, in the case of
tracts. However, the two low-income samples are otherwise comparable with respect to business
activity and the other baseline characteristics (see Table 2).
Regressions: Baseline
For all of the regression models, we display results for each of the “low-income” definitions (i.e.
those neighborhoods in the bottom quintile versus two quintiles of the distribution), and for tract-
level and ZIP-level analyses. We will address both the consistencies and discrepancies across
the findings for these sub-samples. First, we discuss the results from the baseline specification;
we display results for the three dependent variables separately, for tract- and ZIP-level models.
Table 3 displays the results for tract level analyses using Total_Local_Jobs as the dependent
variable. The first column is the most parsimonious model, controlling only for total overall jobs
in the tract (since the number of jobs going to local residents will no doubt be a function of the
number of job opportunities overall). We see that in low-income neighborhoods that gentrify
(i.e. experience an increase in their relative average household income), the number of local jobs
increases, by about 7 jobs on average over the course of the study period. However, when we
add in tract-level neighborhood controls (for both baseline characteristics and changes over the
study period) the magnitude on the Gentrify coefficient goes down by about one-third and loses
significance. When we add in year dummies and state-year controls, the sign on the coefficient
changes to negative and shrinks down under 1, although it remains insignificant. Finally, we
include three variables to capture annual changes in business activity (i.e. the nature of
employment opportunities), Stay, Inmove and Outmove. While the coefficient on Gentrify
remains insignificant, the magnitude increases substantially. A similar pattern emerges when the
regression sample relies on a more inclusive definition of “low-income”; these results are
displayed in the next panel and, once again, when neighborhood, business and temporal-spatial
controls are included, the coefficient on Gentrify reduces in magnitude and loses any significance
(it does not, however, flip to a negative sign).
14
DRAFT—PLEASE DO NOT CITE WITHOUT PERMISSION FROM AUTHORS
We turn our attention for a moment to the coefficients on the business activity variables, and
observe that for both low-income samples, the coefficient on Stay is positive, while the
coefficients on Inmove and Outmove are negative (the coefficients are generally more significant
for the more inclusive definition of low-income, displayed in the right-hand vertical panel).
These findings suggest that the number of local jobs increases in cases where more businesses
stay, as compared to a loss in local jobs under conditions of both business exit and entry. This
evidence is consistent with the expectation that incumbent businesses will either already have
hired local residents or be more likely to have ties to the community and therefore hire locally.
Businesses that close obviously also take with them jobs, and new businesses are either hiring
fewer people more generally or looking elsewhere to fill positions.
Table 4 displays the results from ZIP-level models and we see that, not surprisingly, the
magnitudes on Gentrify are much larger. This makes sense, as the live-work market is defined as
a larger area. The fully specified models, displayed in the fourth and eighth columns, show
significant coefficients on Gentrify. This indicates that for neighborhoods undergoing
gentrification, the number of jobs going to local residents increases by between 52 and 77 per
year, depending on the definition of “low-income.” Based on the mean number of local jobs per
ZIP, this amounts to between a 12.5 and 19 percent increase.
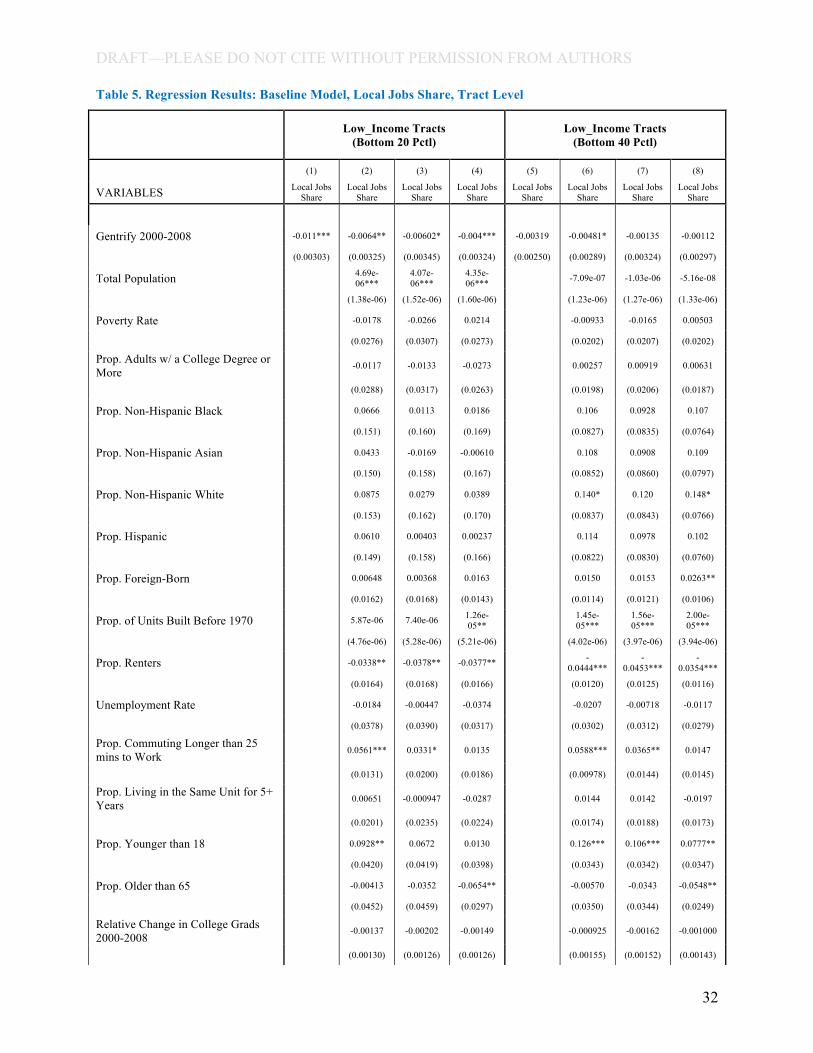
Next we turn to results for models using the alternative dependent variable. Table 5 displays
results for tract-level analyses using Local_Jobs_Share as the dependent variable; this dependent
variable measures the degree of local jobs relative to overall employment activity. As a share of
all jobs, those going to local residents consistently declines over time; the coefficient on Gentrify
is initially highly significant, and becomes even more significant and slightly larger in magnitude
in the fully specified model. This result indicates that for very low-income neighborhoods (i.e.
those in the lower 20th percentile of the income distribution) undergoing gentrification, the share
of jobs going to local residents goes down by about .01). While negative, the coefficient on
Gentrify for the models using the more inclusive definition of low-income is not significant and
is smaller in magnitude. This suggests that any reduction in the share of localized jobs is
concentrated in the very low-income neighborhoods. The parallel results for the ZIP-level
models are displayed in Table 6, and the Gentrify coefficient is positive and insignificant in the
fully specified model. Therefore, the results so far suggest that, once controlling for extensive
15

DRAFT—PLEASE DO NOT CITE WITHOUT PERMISSION FROM AUTHORS
neighborhood and temporal-spatial factors, the effect of gentrification on local employment
opportunities is present, but inconsistently identified. There is some evidence that at larger
geographies the number of local jobs increases under circumstances of gentrification, and that
local jobs, as a share of total jobs, goes down in tracts undergoing gentrification.
Regressions: Type of Job
We have information not just on the aggregate number of local jobs, but also on the types of jobs
that make up this total. We have information on the type of job with respect to sector
(specifically goods producing or service-based) and to earnings (low are those earning $1,250
per month or less; moderate are those earning $1,251 to $3,333 per month; high are those earning
more than $3,333 per month) We hypothesize that most local residents in lower-income
neighborhoods will have access to jobs that require less high-skill or technical training; therefore,
estimating the impact of gentrification on different types of jobs will provide a better sense of
who is getting the jobs (based on their sector and earnings bracket). Tables 7(a) and 7(b) display
these results for both tract- and ZIP-level analyses; we display only models for the low-income
neighborhoods classified as the bottom quintile.8 In very low-income tracts, there is a loss in
local jobs for both goods producing and service jobs, but the magnitude of the drop in
gentrifying areas is larger for service jobs (by nearly six fold). The decrease in local jobs is also
most profound for lower-wage positions; jobs with higher wages did not see any significant
change under conditions of gentrification (although the coefficient is negative like the others).
For the ZIP-level analyses, gentrifying neighborhoods see a significant increase in service jobs,
but not goods producing jobs. And while local jobs of all earnings levels see an increase under
conditions of ZIP-wide gentrification, the magnitude of the gain is largest for moderate- and low-
earning jobs. These would more likely go to incumbent lower-income households than more
affluent or well-educated in-movers.
Regressions: Stratifications
8 We run similar regressions on the more inclusive low-income sample (based off of the bottom two quintiles) and the results are substantively the same with the exception of the positive and significant coefficients for gentrification’s effect on goods-producing jobs and moderate-income jobs. These results are available from the authors upon request.
16
DRAFT—PLEASE DO NOT CITE WITHOUT PERMISSION FROM AUTHORS
We stratify the models in several ways to check whether or not the overall average effects are
obscuring more fine-grained patterns of employment change. For these models, we only display
the results for the dependent variable, Local_Jobs_Share, and for the more restrictive low-
income sample (i.e. those neighborhoods with average household incomes in the bottom quintile
of the distribution); we do run the same models for the more inclusive low-income sample and
the results are substantively the same.9 First, in order to test whether or not any effect on
employment is driven by incumbent versus new (perhaps more affluent or more educated) in-
movers, we stratify the model by the share of residents, as of 2008, that had, since 2000, moved
into their current housing. Specifically, we separate the sample into those neighborhoods with
more or less than the 75th percentile share of households that had moved into their unit since
2000; the results for this are displayed in the first two columns of Table 8(a). While the
coefficients on Gentrify for all of the strata are negative, it is significant only for the sub-sample
with predominantly new residents. Therefore, any loss in employment (as exhibited in the un-
stratified baseline regressions) is concentrated in neighborhoods with relatively fewer incumbent
residents. This indicates that the newer residents are not getting hired locally and that, in
neighborhoods with more longtime residents, there are no significant employment effects in
either direction (although the sign on the coefficient is negative as well). The opposite pattern
holds for ZIP neighborhoods with predominantly incumbent residents: these areas see significant
gains in local jobs. Together, these results might suggest that incumbent residents are not
necessarily gaining jobs in their immediate residential vicinity, but within the larger ZIP code
area.
We also test to see if the gentrification effect might differ based on baseline workforce
differences. To do this we stratify the models by (i) the initial share of workers who commute
more than 25 minutes, and (ii) the initial unemployment rate. These results are displayed in the
subsequent four columns of Table 8(a). They show that any positive employment effect for local
residents is driven by ZIP neighborhoods with initially long-distance commuters; this coefficient
is positive and significant, whereas the coefficient on Gentrify for neighborhoods with
households that predominantly travel less than 25 minutes to work is negative and highly
significant. Neither coefficient is significant for the tract-level strata. This evidence weakly
9 We replicate the stratified analyses for models with the Total Local Jobs dependent variable, and there are no meaningful differences across the strata that add insight to the non-stratified regression results.
17
DRAFT—PLEASE DO NOT CITE WITHOUT PERMISSION FROM AUTHORS
suggests that gentrification could be making economic opportunity more accessible for
neighborhoods that were otherwise more physically removed from employment; alternatively,
those with jobs close by could be moving to these neighborhoods (perhaps to be closer to their
pre-existing employment). However, at the same time, neighborhoods where residents initially
had shorter commute times are losing localized jobs under conditions of gentrification. Since the
business activity data shows only increases in activity in areas undergoing gentrification, this is
more likely due to non-neighborhood residents obtaining the local jobs. At the tract level, there
is no differential pattern in local job access across neighborhoods of relatively higher and lower
unemployment rates. At the ZIP level, neighborhoods with relatively lower initial
unemployment rates experience more pronounced local job gains, although high unemployment
neighborhoods also see job gains (by about half as many per year). The ZIP level results weakly
suggest that gentrification could contribute to bringing jobs to areas that had previously been
physically and economically isolated.
VII. Conclusion and policy implications
Since the dark days of the 1970’s and 1980’s, urban cores have, in general, experienced a
dramatic resurgence. This turn around has brought economic prosperity to places that had not
tasted it in quite some time, as well as concern over those who could not afford to sustain the
rising rents and costs of living that tend to accompany gentrification. The empirical research on
neighborhood change, however, has not supported the displacement hypothesis and in fact shows
that some residents stay and benefit from improved quality of life. With gentrification comes
increased investment and economic activity more generally, and in this paper we test whether or
not local residents, in low-income neighborhoods undergoing economic upgrading, benefit from
newly-created nearby employment opportunities.
We find that, in these preliminary results, gentrifying neighborhoods on average do not
experience consistent, meaningful gains in local employment, compared to other comparable
low-income neighborhoods that are not undergoing economic upgrading. In fact, there is some
evidence that, as a share of all jobs in the census tract, the number of local jobs (particularly
those in the service sector and low- and moderate-earnings tiers) decreases under circumstances
of gentrification. At larger geographies (i.e. ZIP codes), however, the number of jobs going to
18

DRAFT—PLEASE DO NOT CITE WITHOUT PERMISSION FROM AUTHORS
local residents increases (by between 52 and 77 per year), and these jobs are primarily in service
sectors and going to low- and moderate-earners (i.e. those earning less than $3,333 per month).
This is consistent with the expectation that the number of job opportunities will increase as the
live-work market grows. In an attempt to better understand whether or not incumbent residents
are experiencing the job losses or gains, we stratify the sample by the prevalence of new
residents and find a more pronounced negative effect in neighborhoods with less established
resident populations and more business churn. Therefore, local jobs are likely lost to both
residential and business exits, and those residents who stay in the neighborhood don’t seem to
experience job effects in either direction. There is weak evidence to suggest that local jobs
increase in the presence of businesses that stay in place and within the context of larger ZIP
neighborhoods, perhaps suggesting stronger ties to the community and/or the ability to find jobs
within a larger proximate market (and not immediately close to home). Stratified models
indicate that any local job gains are concentrated in ZIP neighborhoods with initially longer
commute times for their workers and are weakly associated with higher unemployment rates;
both of these findings suggest that gentrification is perhaps helping to fill an initial employment
gap.
One of the most significant take-aways from the analysis thus far is the importance of defining
the geographic span of the live-work market. It appears that either the tract is too small to pick
up (or expect) variation in localized employment or that opportunities are indeed eluding local
incumbent residents in areas undergoing gentrification. The fact that we observe (mostly) job
gains at the ZIP code level suggests that a larger radius for work-live markets picks up different
employment patterns; we interpret this to mean that a more flexible measure of distance-to-work
would improve the precision of our estimates. The findings do indicate that where job gains
occur, they tend to be in larger neighborhoods that initially are more removed from the
workforce (both spatially, in terms of longer commute times, and economically, in terms of
unemployment rates); this is encouraging in that any change in local economic conditions could
be a remedy for employment mismatches. The lack of consistent positive effects, however,
raises concerns that incumbent lower-income residents are not reaping enough benefits from
changing economic circumstances.
19

DRAFT—PLEASE DO NOT CITE WITHOUT PERMISSION FROM AUTHORS
This analysis is a first step in trying to disentangle the relationship between gentrification and
employment opportunities, and we plan to refine the empirics to better isolate the nature and
cause of any localized employment shifts. We acknowledge that the geographies for this
analysis are crude and we intend to tailor the neighborhood definition to comprise a collection of
census tracts that are within one mile (or thereabouts) of one another. This should broaden the
live-work market beyond the restrictively small singular census tract, but keep it fine-grained
enough to pick up localized variations that the ZIP code is likely obscuring. This strategy will go
a long way in better identifying whether or not the incumbent residents are actually the ones who
are benefitting (or missing out) from changes in local economic conditions.
20
DRAFT—PLEASE DO NOT CITE WITHOUT PERMISSION FROM AUTHORS
VIII. References
Carree, Martin, and Roy Thurik. 1996. "Entry and exit in retailing: incentives, barriers, displacement and replacement." Review of Industrial Organization, 11(2): 155-172.
Chapple, Karen and Rick Jacobus. 2009. “Retail Trade as a Route to Neighborhood Revitalization” In H. Wial, N. Pindus, & H. Wolman (Eds.), Urban and Regional Policy and its Effects. Washington D.C.: Brookings Institution-Urban Institute.
Curran, Winifred. "Gentrification and the nature of work: exploring the links in Williamsburg, Brooklyn." ENVIRONMENT AND PLANNING A. 36 (2004): 1243-1258.
Freeman, L., 2005. “Displacement or succession?” Urban Affairs Review, 40(4): 463–491.
Freeman, Lance, and Frank Braconi. 2004. "Gentrification and displacement New York City in the 1990s." Journal of the American Planning Association, 70(1): 39-52.
Ellen, Ingrid Gould and Katherine O’Regan. 2008. “Reversal of Fortunes: Low Income Neighborhoods in the 1990s.” Urban Studies, 45: 845-869
Ellen, Ingrid Gould, and Katherine M. O'Regan. 2011. "How low income neighborhoods change: Entry, exit, and enhancement." Regional Science and Urban Economics, 41(2): 89-97.
Ellen, Ingrid Gould, and Margery Austin Turner. 1997. "Does neighborhood matter? Assessing recent evidence." Housing Policy Debate, 8(4): 833-866.
Holzer, H. J. 1991. The spatial mismatch hypothesis: What has the evidence shown?. Urban Studies, 28(1), 105-122.
Ihlanfeldt, K. R., & Sjoquist, D. L. 1998. “The spatial mismatch hypothesis: a review of recent studies and their implications for welfare reform.” Housing Policy Debate, 9(4): 849-892.
Immergluck, Daniel. 1999. "Neighborhoods, Race, and Capital The Effects of Residential Change on Commercial Investment Patterns." Urban Affairs Review, 34(3): 397-411.
Ioannides, Yannis M., and Linda Datcher Loury. 2004. "Job information networks, neighborhood effects, and inequality." Journal of Economic Literature: 1056-1093.
Kain, John F. 1968. "Housing segregation, negro employment, and metropolitan decentralization." The Quarterly Journal of Economics: 175-197.
Kolko, J., 2009. Job Location, Neighborhood Change, and Gentrification. Public Policy Institute of California working paper.
Lang, Kevin and Jee-Yeon K. Lehmann. 2012. “Racial Discrimination in the Labor Market: Theory and Empirics.” Journal of Economic Literature, 50(4): 1-48.
21
DRAFT—PLEASE DO NOT CITE WITHOUT PERMISSION FROM AUTHORS
Lester, T. William, and Daniel A. Hartley. 2014. "The long term employment impacts of gentrification in the 1990s." Regional Science and Urban Economics, 45: 80-89.
Liu, Cathy Yang, and Gary Painter. 2011. "Immigrant settlement and employment suburbanisation in the US: Is there a spatial mismatch?." Urban Studies: 0042098011405695.
Meltzer, Rachel and Sean Capperis. 2014. Neighborhood Differences in Retail Turnover: Evidence from New York City. Working paper.
McKinnish, T., Walsh, R., White, K.T. 2010. Who gentrifies low-income neighborhoods? Journal of Urban Economics, 67(2), 180–193.
Meltzer, R., Schuetz, J., 2012. Bodegas or Bagel Shops? Neighborhood Differences in Retail & Household Services. Economic Development Quarterly 26: 0891242411430328.
Raphael, S., and M. A. Stoll. 2002. Modest Progress: The Narrowing Spatial Mismatch between Blacks and Jobs in the 1990s. The Brookings Institution, Living Cities Census Series.
Rosenthal, Stuart S. 2008 "Old homes, externalities, and poor neighborhoods. A model of urban decline and renewal." Journal of Urban Economics, 63(3): 816-840.
Schuetz, Jenny, Jed Kolko and Rachel Meltzer. 2012. “Are Poor Neighborhoods ‘Retail Deserts’?” Regional Science and Urban Economics, 42(1): 269-285.
Sullivan, Daniel Monroe, and Samuel C. Shaw. 2011. "Retail gentrification and race: The case of Alberta Street in Portland, Oregon." Urban Affairs Review, 47(3): 413-432.
Vigdor, Jacob L., Douglas S. Massey, and Alice M. Rivlin. 2002. "Does gentrification harm the poor?[with Comments]." Brookings-Wharton Papers on Urban Affairs: 133-182.
Zukin, S., Trujillo, V., Frase, P., Jackson, D., Recuber, T., Walker, A., 2009. New retail capital and neighborhood change: boutiques and gentrification in New York City. City and Community, 8(1): 47–64.
22
All Jobs 42068 1906 4437 8772 1339 3926 ***
Total Local Jobs 42068 64.31 73.89 8772 30.70 45.83 ***
Total Population 42068 4224 1844 8772 4215 1892
Poverty Rate 42052 0.0958 0.0874 8772 0.303 0.129 ***
Prop. Adults w/ a College Degree or More 42052 0.324 0.179 8772 0.115 0.0768 ***
Prop. Non-Hispanic Black 42052 0.131 0.228 8772 0.377 0.311 ***
Prop. Non-Hispanic Asian 42052 0.0784 0.0985 8772 0.0483 0.105 ***
Prop. Non-Hispanic White 42052 0.646 0.306 8772 0.201 0.257 ***
Prop. Hispanic 42052 0.138 0.162 8772 0.365 0.252 ***
Prop. Foreign-Born 42052 0.235 0.170 8772 0.296 0.166 ***
Prop. of Units Built Before 1970 42052 1161 729.8 8772 1198 616.3 ***
Prop. Renters 42052 0.371 0.256 8772 0.731 0.179 ***
Unemployment Rate 42052 0.0587 0.0514 8772 0.146 0.0732 ***
Obs Mean Std.Dev. Obs Mean Std.Dev.
Prop. Commuting Longer than 45 mins to Work 42051 0.547 0.149 8772 0.597 0.178 ***
Prop. Living in the Same Unit for 5+ Years 42052 0.617 0.102 8772 0.581 0.101 ***
Prop. Younger than 18 42052 0.236 0.0625 8772 0.290 0.0769 ***
Prop. Older than 65 42052 0.133 0.0615 8772 0.109 0.0990 ***
Relative Change in College Grads 2000-2008 30057 0.243 0.392 8099 0.603 0.915 ***
Relative Change in Median Housing Value 2000-2008 29122 3.076 119.6 7015 7.916 154.3 ***
Relative Change in Median Gross Rent 2000-2008 30027 0.161 0.267 8119 0.224 0.201 ***
Relative Change in Poverty Rate 2000-2008 30047 0.142 0.850 8119 -0.00549 0.466 ***
Prop. Housing Units Built 2000-2010 30067 103.7 171.9 8119 94.70 139.1 ***
Relative Change in Total Population 2000-2008 30057 0.0943 0.811 8119 0.0123 0.175 ***
Employees per Establishment, Retail 37451 5.810449 5.245651 7778 4.458996 6.46203 ***
Employees per Establishment, Non- Retail 37196 7.295351 10.19404 7730 10.66445 36.78539 ***
DRAFT—PLEASE DO NOT CITE WITHOUT PERMISSION FROM AUTHORS
Table 1. Summary Statistics by Low- vs. Mod/High-Income
Variable Mod-High-Income Tracts (Top 80 Pctl)
Low-Income Tracts (Bottom 20 Pctl)
Sig. Diff.
23
Prop. Establishments Stayed over the Past 5 Years 35934 0.720214 0.6863655 7446 0.6973652 0.1879222 ***
Prop. Establishments Moved In during the Past 5 Years 40407 0.9099488 7.003499 8390 0.8187428 0.488483
Prop. Establishments Closed/ Moved Out during the past 5 Years 40407 0.196699 1.564084 8390 0.1689067 0.1042067
All Jobs
Obs Mean Std.Dev. Obs Mean Std.Dev.
***9847 8630 15701 1220 4855 6988
Total Local Jobs 9859 755.7 1028 1220 405 411.8 ***
Total Population 8703 19906 18552 1220 11655 7244 ***
Poverty Rate 5352 0.0453 0.0308 1220 0.118 0.0972 ***
Prop. Adults w/ a College Degree or More 5352 0.406 0.159 1220 0.199 0.119 ***
Prop. Non-Hispanic Black 5352 0.0387 0.0720 1220 0.165 0.224 ***
Prop. Non-Hispanic Asian 5352 0.0509 0.0588 1220 0.0447 0.0678 ***
Prop. Non-Hispanic White 5352 0.851 0.129 1220 0.625 0.309 ***
Prop. Hispanic 5352 0.0550 0.0535 1220 0.174 0.167 ***
Prop. Foreign-Born 5352 0.123 0.0890 1220 0.185 0.125 ***
Prop. of Units Built Before 1970 5352 2479 2122 1220 3544 2260 ***
Prop. Renters 5352 0.204 0.145 1220 0.389 0.208 ***
Unemployment Rate 5342 0.0373 0.0252 1220 0.0780 0.0971 ***
Prop. Commuting Longer than 45 mins to Work 5342 0.486 0.101 1220 0.468 0.181 ***
Prop. Living in the Same Unit for 5+ Years 5352 0.633 0.0886 1220 0.603 0.144 ***
Prop. Younger than 18 5352 0.245 0.0452 1220 0.245 0.0563
Prop. Older than 65 5352 0.134 0.0515 1220 0.142 0.0641 ***
Relative Change in College Grads 2000-2008 3093 0.153 0.165 720 0.291 0.266 ***
Relative Change in Poverty Rate 2000-2008 3093 0.131 0.838 720 0.125 0.451
Prop. Housing Units Built 2000-2010 8703 546.7 659.9 1110 309.6 369.6 ***
Relative Change in Total Population 2000-2008 3093 -0.1000 0.448 720 -0.0601 0.204 **
Employees per Establishment, Retail 8532 6.232097 5.349024 1098 6.560924 3.52583 **
DRAFT—PLEASE DO NOT CITE WITHOUT PERMISSION FROM AUTHORS
Variable Mod-High-Income ZIPs (Bottom 20 Pctl)
Low-Income ZIPs (Bottom 20 Pctl)
Sig. Diff.
24

DRAFT—PLEASE DO NOT CITE WITHOUT PERMISSION FROM AUTHORS
Employees per Establishment, Non-Retail 8159 8.916173 34.16012 1066 8.079621 5.249776
Prop. Establishments Stayed over the Past 5 Years 7827 0.6802789 0.0553133 1062 0.6717079 0.0496938 ***
Prop. Establishments Moved In during the Past 5 Years 8972 0.6692538 0.3195911 1188 0.6594964 0.2855166
Prop. Establishments Closed/ Moved Out during the past 5 Years 8972 0.1694618 0.0765898 1188 0.1753175 0.0746199 **
25
All Jobs 8772 1339 3926 17569 1264 3222 Total Local Jobs 8772 30.70 45.83 17569 37.56 53.82 Total Population 8772 4215 1892 17569 4216 1908
Poverty Rate 8772 0.303 0.129 17569 0.228 0.131
Prop. Adults w/ a College Degree or More 8772 0.115 0.0768 17569 0.155 0.0930
Prop. Non-Hispanic Black 8772 0.377 0.311 17569 0.292 0.306 Prop. Non-Hispanic Asian 8772 0.0483 0.105 17569 0.0708 0.114 Prop. Non-Hispanic White 8772 0.201 0.257 17569 0.332 0.316 Prop. Hispanic 8772 0.365 0.252 17569 0.296 0.239 Prop. Foreign-Born 8772 0.296 0.166 17569 0.315 0.180 Prop. of Units Built Before 1970 8772 1198 616.3 17569 1221 638.5 Prop. Renters 8772 0.731 0.179 17569 0.637 0.216
Unemployment Rate 8772 0.146 0.0732 17569 0.112 0.0693
Prop. Commuting Longer than 45 mins to Work 8772 0.597 0.178 17569 0.588 0.173
Prop. Living in the Same Unit for 5+ Years 8772 0.581 0.101 17569 0.585 0.0934
Prop. Younger than 18 8772 0.290 0.0769 17569 0.267 0.0717 Prop. Older than 65 8772 0.109 0.0990 17569 0.118 0.0843
Employees per Establishment, Retail 7778 4.458996 6.46203 15625 4.662688 5.143249
Employees per Establishment, Non- Retail 7730 10.66445 36.78539 15558 8.800557 26.47163
Prop. Establishments Stayed over the Past 5 Years 7446 0.6973652 0.1879222 15085 0.6884355 0.1738526
Prop. Establishments Moved In during the Past 5 Years 8390 0.8187428 0.488483 16953 0.8079267 0.4721724
Obs Mean Std. Dev. Obs Mean Std. Dev.
Prop. Establishments Closed/Moved Out during the past 5 Years 8390 0.1689067 0.1042067 16953 0.1705207 0.1005457
All Jobs Obs Mean Std.Dev. Obs Mean Std.Dev.
1220 4855 6988 2447 4756 6762
Total Local Jobs 1220 405 411.8 2447 416.8 433.0
DRAFT—PLEASE DO NOT CITE WITHOUT PERMISSION FROM AUTHORS
Table 2. Summary Statistics by Low Income Definition
Variable Low-Income Tracts (Bottom 20 Pctl)
Low-Income Tracts (Bottom 40 Pctl)
Variable Low_Income ZIPs (Bottom 20 Pctl)
Low_Income ZIPs (Bottom 40 Pctl)
26
DRAFT—PLEASE DO NOT CITE WITHOUT PERMISSION FROM AUTHORS
Total Population 1220 11655 7244 2447 10366 6874
Poverty Rate 1220 0.118 0.0972 2447 0.0878 0.0791
Prop. Adults w/ a College Degree or More 1220 0.199 0.119 2447 0.229 0.104
Prop. Non-Hispanic Black 1220 0.165 0.224 2447 0.109 0.183
Prop. Non-Hispanic Asian 1220 0.0447 0.0678 2447 0.0419 0.0602
Prop. Non-Hispanic White 1220 0.625 0.309 2447 0.726 0.265
Prop. Hispanic 1220 0.174 0.167 2447 0.124 0.137
Prop. Foreign-Born 1220 0.185 0.125 2447 0.150 0.112
Prop. of Units Built Before 1970 1220 3544 2260 2447 3160 2170
Prop. Renters 1220 0.389 0.208 2447 0.316 0.188
Unemployment Rate 1220 0.0780 0.0971 2447 0.0620 0.0736
Prop. Commuting Longer than 45 mins to Work 1220 0.468 0.181 2447 0.468 0.146
Prop. Living in the Same Unit for 5+ Years 1220 0.603 0.144 2447 0.619 0.113
Prop. Younger than 18 1220 0.245 0.0563 2447 0.242 0.0463
Prop. Older than 65 1220 0.142 0.0641 2447 0.139 0.0547
Employees per Establishment, Retail 1098 6.560924 3.52583 2188 6.308049 3.418425
Employees per Establishment, Non-Retail 1066 8.079621 5.249776 2157 8.434451 14.43981
Prop. Establishments Stayed over the Past 5 Years 1062 0.6717079 0.0496938 2141 0.6760515 0.0471604
Prop. Establishments Moved In during the Past 5 Years 1188 0.6594964 0.2855166 2393 0.6543791 0.2768929
Prop. Establishments Closed/Moved Out during the past 5 Years 1188 0.1753175 0.0746199 2393 0.1725621 0.074474
27
Gentrify 2000-2008 6.967**
(2.918)
2.368
(2.557)
-0.290
(2.465)
-4.567
(3.142)
13.18***
(2.348)
3.175
(2.115)
3.220
(2.306)
1.647
(2.690)
All Jobs 0.00444* **
(0.00118)
0.00735* **
(0.00245)
0.00693* **
(0.00229)
0.00199
(0.00144)
0.00666* **
(0.00153)
0.00986* **
(0.00227)
0.00952* **
(0.00224)
0.00502* *
(0.00214)
Total Population 0.00831* **
(0.00145)
0.00476* **
(0.00150)
0.00392* *
(0.00152)
0.00598* **
(0.00157)
0.00360* *
(0.00173)
0.00455* *
(0.00185)
Poverty Rate -10.03
(17.73)
12.95
(18.23)
2.784
(21.22)
-26.22
(18.54)
-26.39
(17.62)
-27.34
(17.05)
Prop. Adults w/ a College Degree or More -0.320
(28.08)
0.944
(29.13)
4.709
(27.07)
-2.845
(21.86)
-7.650
(22.19)
-5.603
(21.54)
Prop. Non-Hispanic Black -83.23
(143.1)
-58.07
(147.1)
-25.45
(169.4)
-53.51
(62.59)
-65.31
(64.32)
-45.06
(71.21)
Prop. Non-Hispanic Asian -100.1
(147.6)
-68.86
(149.3)
-30.23
(168.7)
-63.18
(70.34)
-67.13
(71.60)
-36.39
(75.60)
Prop. Non-Hispanic White -42.32
(141.5)
-25.14
(145.2)
3.503
(167.6)
-11.55
(61.18)
-30.21
(62.82)
-15.22
(70.13)
Prop. Hispanic -87.54
(143.9)
-62.34
(147.7)
-20.48
(170.0)
-49.78
(62.81)
-63.66
(64.46)
-41.09
(71.62)
Prop. Foreign-Born 7.703
(10.09)
15.67
(10.09)
7.761
(9.961)
-1.901
(7.629)
-2.974
(7.536)
-3.620
(8.550)
Prop. of Units Built Before 1970 -0.00318
(0.00459)
0.00378
(0.00465)
0.00494
(0.00447)
0.0100**
(0.00496)
0.0155** *
(0.00483)
0.0136** *
(0.00460)
Prop. Renters -9.141
(17.15)
8.447
(16.61)
-21.21
(18.59)
-12.36
(10.90)
-0.960
(10.51)
-20.71*
(11.68)
Unemployment Rate -31.75
(19.47)
-22.64
(18.32)
8.441
(24.65)
-26.69
(19.94)
-7.471
(20.28)
18.85
(25.59)
Prop. Commuting Longer than 25 mins to Work
- 44.64***
(12.44)
- 47.60***
(16.70)
-22.48
(15.04)
- 33.27***
(9.543)
- 48.93***
(14.86)
-33.61**
(16.53)
Prop. Living in the Same Unit for 5+ Years 2.248
(13.87)
1.618
(16.23)
-1.767
(19.48)
-1.999
(12.44)
-4.882
(12.99)
-9.922
(14.85)
Prop. Younger than 18 -9.430
(28.10)
5.680
(28.66)
65.71**
(31.50)
66.73**
(31.13)
65.20**
(29.55)
103.2***
(30.60)
Prop. Older than 65 -55.50** -23.46 4.203 -15.89 -7.494 24.40
DRAFT—PLEASE DO NOT CITE WITHOUT PERMISSION FROM AUTHORS
Table 3. Regression Results: Baseline Model, Total Local Jobs, Tract Level
Low-Income Tracts (Bottom 20 Pctl)
Low-Income Tracts (Bottom 40 Pctl)
VARIABLES
(1) Total Local Jobs
(2) Total Local Jobs
(3) Total Local Jobs
(4) Total Local Jobs
(5) Total Local Jobs
(6) Total Local Jobs
(7) Total Local Jobs
(8) Total Local Jobs
28
Relative Change in College Grads 2000-2008 0.910
(0.723) -
0.00302* *
(0.00129)
0.356
(0.702) -
0.00365* *
(0.00166)
1.288
(0.847)
0.708
(0.832)
0.0871
(0.865)
0.982
(1.014)
Relative Change in Median Housing Value 2000-2008 -6.81e-05
(0.00130)
- 0.000694
(0.00093 0)
- 0.000309
(0.00125)
0.00232* *
(0.00118)
Relative Change in Median Gross Rent 2000-2008 1.633
(5.315)
6.308
(4.685)
6.580
(6.348)
-9.014*
(5.333)
-10.39*
(5.475)
-9.754
(5.998)
Relative Change in Poverty Rate 2000-2008 -0.492
(3.083)
0.273
(2.908)
2.316
(2.929)
-1.322
(1.494)
0.323
(1.545)
0.969
(1.542)
Prop. Housing Units Built 2000-2010
0.0432** *
(0.0131)
0.0375** *
(0.0110)
0.0254**
(0.0114)
0.0541** *
(0.0165)
0.0481** *
(0.0156)
0.0442** *
(0.0161)
Relative Change in Total Population 2000-2008 -14.74**
(6.697)
-13.03**
(5.800)
-10.92
(7.971)
-6.129
(4.680)
-2.445
(4.180)
-0.542
(4.421)
Establishments Stayed over the Past 5 Years 0.159*
(0.0955)
0.182**
(0.0822)
Establishments Moved In during the Past 5 Years -0.122**
(0.0538)
- 0.161***
(0.0463)
Establishments Closed/Moved Out during the Past 5 Years -0.147
(0.101)
- 0.174***
(0.0557)
Total Establishments in 2002 0.154
(0.0965)
0.131**
(0.0539)
Constant 21.98***
(1.572)
107.6
(138.5)
79.70
(139.1)
-8.941
(157.6)
23.62***
(1.648)
45.60
(62.66)
92.24
(64.21)
41.39
(67.65)
(24.68) (26.22) (27.25) (24.61) (26.35) (30.02)
Clustered S.E.'s? Y Y Y Y Y Y Y Y
MSA and State-Yr Dummies? N N Y Y N N Y Y
Observations 8,772 7,005 7,005 4,553 17,569 14,458 14,458 10,149
R-squared 0.158 0.498 0.577 0.688 0.186 0.533 0.570 0.625
DRAFT—PLEASE DO NOT CITE WITHOUT PERMISSION FROM AUTHORS
Robust standard errors in parentheses *** p<0.01, ** p<0.05, * p<0.1
29
Gentrify 2000-2008 240.6***
(50.39)
72.00*
(42.16)
87.42*
(51.52)
77.21**
(30.39)
204.8***
(37.80)
34.65
(31.51)
70.36*
(39.96)
52.26*
(27.72)
All Jobs 0.0186**
(0.00804)
0.0260***
(0.00275)
0.0265***
(0.00305)
-0.0207**
(0.00859)
0.0244***
(0.00711)
0.0239***
(0.00347)
0.0247***
(0.00376)
-0.0207**
(0.0101)
Total Population 0.0226***
(0.00735)
0.0239***
(0.00649)
0.0241***
(0.00493)
0.0164**
(0.00769)
0.0228***
(0.00723)
0.0140
(0.00971)
Poverty Rate -569.0
(674.3)
-180.1
(636.0)
56.28
(547.2)
1,210
(1,062)
1,926*
(1,059)
448.9
(695.1)
Prop. Adults w/ a College Degree or More 144.9
(254.8)
372.3
(230.4)
-261.3
(202.4)
477.8
(373.3)
693.3**
(344.2)
-345.6*
(203.2)
Prop. Non-Hispanic Black 5,088*
(2,919)
6,929**
(3,199)
8,122**
(3,374)
-11,062**
(4,918)
-9,740**
(4,608)
1,149
(3,411)
Prop. Non-Hispanic Asian 3,467
(2,939)
5,220
(3,183)
7,228**
(3,385)
-12,818**
(4,918)
-11,835**
(4,596)
175.6
(3,453)
Prop. Non-Hispanic White 5,539*
(2,891)
7,307**
(3,201)
8,289**
(3,383)
-10,608**
(4,918)
-9,367**
(4,598)
1,193
(3,365)
Prop. Hispanic 5,082*
(2,851)
6,878**
(3,177)
8,212**
(3,408)
-11,155**
(4,885)
-9,921**
(4,553)
899.1
(3,367)
Prop. Foreign-Born 567.7**
(238.2)
765.0***
(258.5)
431.2*
(216.4)
902.9***
(312.7)
1,083***
(331.8)
715.2***
(247.1)
Prop. of Units Built Before 1970 0.00486
(0.0190)
-0.00629
(0.0154)
-0.031***
(0.0102)
0.0489*
(0.0271)
0.0313
(0.0233)
0.00546
(0.0218)
Prop. Renters -10.48
(202.7)
-133.5
(167.4)
-182.3
(115.7)
-447.9*
(244.7)
-567.6**
(244.6)
-412.1***
(156.7)
Unemployment Rate 878.1
(658.3)
707.4
(609.6)
37.74
(704.0)
-681.7
(1,062)
-1,204
(979.0)
-707.3
(664.9)
Prop. Commuting Longer than 25 mins to Work -287.3*
(159.9)
-260.0
(259.9)
-69.05
(177.9)
-669.5**
(294.1)
-858.4**
(354.2)
-298.6
(188.4)
Prop. Living in the Same Unit for 5+ Years
-80.16
(225.0)
-150.0
(351.3)
425.9
(267.7)
164.8
(338.2)
26.34
(336.3)
-15.97
(260.3)
Prop. Younger than 18 1,893***
(708.7)
1,627**
(815.8)
-656.6
(720.0)
474.6
(679.8)
131.7
(851.4)
-645.5
(599.0)
Prop. Older than 65 584.5
(488.8)
561.4
(612.3)
-4.600
(488.7)
-516.7
(690.7)
-390.0
(779.5)
-78.78
(535.6)
DRAFT—PLEASE DO NOT CITE WITHOUT PERMISSION FROM AUTHORS
Table 4. Regression Results: Baseline Model, Total Local Jobs, ZIP Level
Low-Income ZIPs (Bottom 20 Pctl)
Low-Income ZIPs (Bottom 40 Pctl)
VARIABLES
(1)
Total Local Jobs
(2)
Total Local Jobs
(3)
Total Local Jobs
(4)
Total Local Jobs
(5)
Total Local Jobs
(6)
Total Local Jobs
(7)
Total Local Jobs
(8)
Total Local Jobs
30
Relative Change in College Grads 2000-2008
-22.55
(48.10)
62.44
(53.59)
84.55*
(46.42)
72.07
(54.14)
142.8**
(71.05)
81.52*
(43.46)
Relative Change in Poverty Rate 2000-2008
-5.396
(48.32)
14.60
(52.35)
16.80
(31.44)
-17.08
(22.24)
2.849
(20.02)
23.47
(16.02)
Prop. Housing Units Built 2000-2010 0.128***
(0.0377)
0.131***
(0.0471)
0.0985***
(0.0310)
0.177*
(0.0962)
0.190*
(0.0980)
0.146**
(0.0579)
Relative Change in Total Population 2000-2008
-180.7
(149.0)
-234.6*
(136.0)
-92.23
(78.58)
38.31
(24.27)
35.06
(24.33)
39.02***
(14.87)
Establishments Stayed over the Past 5 Years
0.734**
(0.330)
1.059***
(0.261)
Establishments Moved In during the Past 5 Years
-0.422***
(0.128)
-0.533***
(0.134)
Establishments Closed/Moved Out during the Past 5 Years
-0.621***
(0.211)
-1.340***
(0.233)
Total Establishments in 2002 0.558***
(0.207)
0.672***
(0.160)
Constant 135.3***
(42.26)
-5,876**
(2,927)
-7,641**
(3,207)
-8,230**
(3,414)
142.5***
(33.86)
10,643**
(4,904)
9,512**
(4,554)
-769.0
(3,246)
Clustered S.E.'s? Y Y Y Y Y Y Y Y
MSA and State-Yr Dummies? N N Y Y N N Y Y
Observations 1,220 720 720 617 2,447 1,468 1,468 1,250
R-squared 0.179 0.656 0.740 0.863 0.196 0.630 0.683 0.841
DRAFT—PLEASE DO NOT CITE WITHOUT PERMISSION FROM AUTHORS
Robust standard errors in parentheses
*** p<0.01, ** p<0.05, * p<0.1
31
Gentrify 2000-2008 -0.011***
(0.00303)
-0.0064**
(0.00325)
-0.00602*
(0.00345)
-0.004***
(0.00324)
-0.00319
(0.00250)
-0.00481*
(0.00289)
-0.00135
(0.00324)
-0.00112
(0.00297)
Total Population 4.69e- 06***
(1.38e-06)
4.07e- 06***
(1.52e-06)
4.35e- 06***
(1.60e-06)
-7.09e-07
(1.23e-06)
-1.03e-06
(1.27e-06)
-5.16e-08
(1.33e-06)
Poverty Rate -0.0178
(0.0276)
-0.0266
(0.0307)
0.0214
(0.0273)
-0.00933
(0.0202)
-0.0165
(0.0207)
0.00503
(0.0202)
Prop. Adults w/ a College Degree or More
-0.0117
(0.0288)
-0.0133
(0.0317)
-0.0273
(0.0263)
0.00257
(0.0198)
0.00919
(0.0206)
0.00631
(0.0187)
Prop. Non-Hispanic Black 0.0666
(0.151)
0.0113
(0.160)
0.0186
(0.169)
0.106
(0.0827)
0.0928
(0.0835)
0.107
(0.0764)
Prop. Non-Hispanic Asian 0.0433
(0.150)
-0.0169
(0.158)
-0.00610
(0.167)
0.108
(0.0852)
0.0908
(0.0860)
0.109
(0.0797)
Prop. Non-Hispanic White 0.0875
(0.153)
0.0279
(0.162)
0.0389
(0.170)
0.140*
(0.0837)
0.120
(0.0843)
0.148*
(0.0766)
Prop. Hispanic 0.0610
(0.149)
0.00403
(0.158)
0.00237
(0.166)
0.114
(0.0822)
0.0978
(0.0830)
0.102
(0.0760)
Prop. Foreign-Born 0.00648
(0.0162)
0.00368
(0.0168)
0.0163
(0.0143)
0.0150
(0.0114)
0.0153
(0.0121)
0.0263**
(0.0106)
Prop. of Units Built Before 1970 5.87e-06
(4.76e-06)
7.40e-06
(5.28e-06)
1.26e- 05**
(5.21e-06)
1.45e- 05***
(4.02e-06)
-
1.56e- 05***
(3.97e-06)
-
2.00e- 05***
(3.94e-06)
- Prop. Renters -0.0338**
(0.0164)
-0.0378**
(0.0168)
-0.0377**
(0.0166)
0.0444***
(0.0120)
0.0453***
(0.0125)
0.0354***
(0.0116)
Unemployment Rate -0.0184
(0.0378)
-0.00447
(0.0390)
-0.0374
(0.0317)
-0.0207
(0.0302)
-0.00718
(0.0312)
-0.0117
(0.0279)
Prop. Commuting Longer than 25 mins to Work 0.0561***
(0.0131)
0.0331*
(0.0200)
0.0135
(0.0186)
0.0588***
(0.00978)
0.0365**
(0.0144)
0.0147
(0.0145)
Prop. Living in the Same Unit for 5+ Years 0.00651
(0.0201)
-0.000947
(0.0235)
-0.0287
(0.0224)
0.0144
(0.0174)
0.0142
(0.0188)
-0.0197
(0.0173)
Prop. Younger than 18 0.0928**
(0.0420)
0.0672
(0.0419)
0.0130
(0.0398)
0.126***
(0.0343)
0.106***
(0.0342)
0.0777**
(0.0347)
Prop. Older than 65 -0.00413
(0.0452)
-0.0352
(0.0459)
-0.0654**
(0.0297)
-0.00570
(0.0350)
-0.0343
(0.0344)
-0.0548**
(0.0249)
Relative Change in College Grads 2000-2008
-0.00137
(0.00130)
-0.00202
(0.00126)
-0.00149
(0.00126)
-0.000925
(0.00155)
-0.00162
(0.00152)
-0.001000
(0.00143)
DRAFT—PLEASE DO NOT CITE WITHOUT PERMISSION FROM AUTHORS
Table 5. Regression Results: Baseline Model, Local Jobs Share, Tract Level
Low_Income Tracts (Bottom 20 Pctl)
Low_Income Tracts (Bottom 40 Pctl)
VARIABLES
(1)
Local Jobs Share
(2)
Local Jobs Share
(3)
Local Jobs Share
(4)
Local Jobs Share
(5)
Local Jobs Share
(6)
Local Jobs Share
(7)
Local Jobs Share
(8)
Local Jobs Share
32
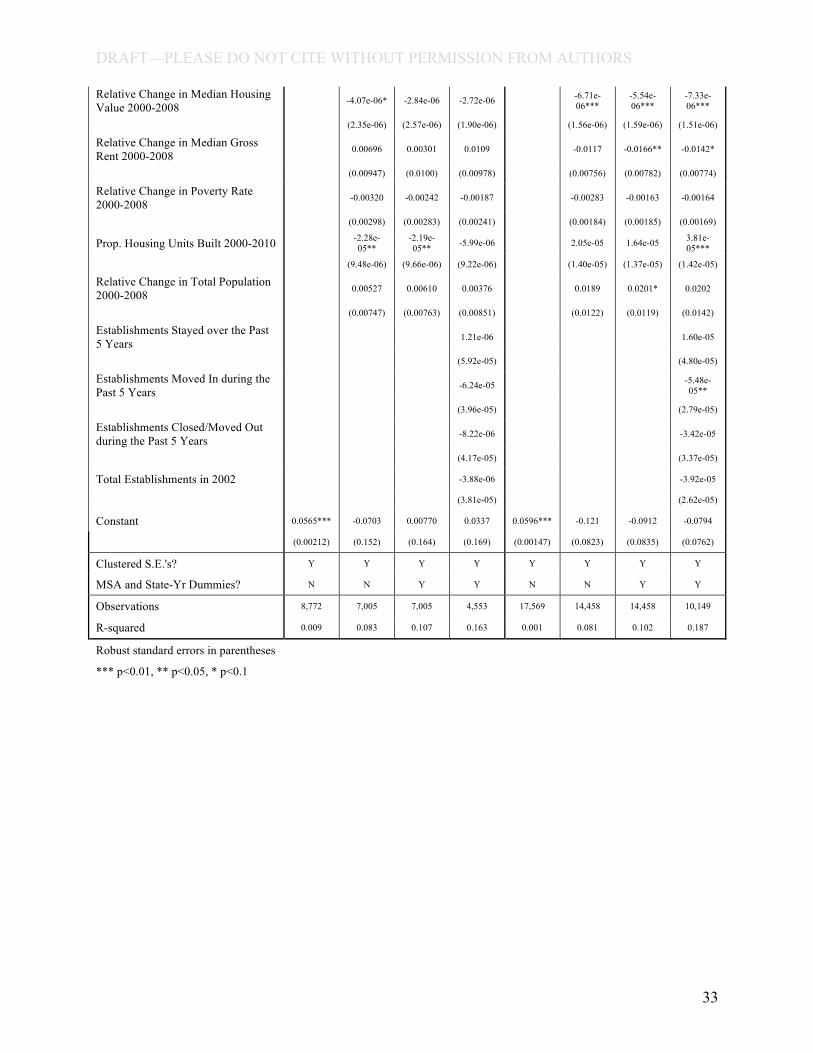
Relative Change in Median Housing Value 2000-2008
-4.07e-06*
(2.35e-06)
-2.84e-06
(2.57e-06)
-2.72e-06
(1.90e-06)
-6.71e- 06***
(1.56e-06)
-5.54e- 06***
(1.59e-06)
-7.33e- 06***
(1.51e-06)
Relative Change in Median Gross Rent 2000-2008
0.00696
(0.00947)
0.00301
(0.0100)
0.0109
(0.00978)
-0.0117
(0.00756)
-0.0166**
(0.00782)
-0.0142*
(0.00774)
Relative Change in Poverty Rate 2000-2008
-0.00320
(0.00298)
-0.00242
(0.00283)
-0.00187
(0.00241)
-0.00283
(0.00184)
-0.00163
(0.00185)
-0.00164
(0.00169)
Prop. Housing Units Built 2000-2010 -2.28e- 05**
(9.48e-06)
-2.19e- 05**
(9.66e-06)
-5.99e-06
(9.22e-06)
2.05e-05
(1.40e-05)
1.64e-05
(1.37e-05)
3.81e- 05***
(1.42e-05)
Relative Change in Total Population 2000-2008 0.00527
(0.00747)
0.00610
(0.00763)
0.00376
(0.00851)
0.0189
(0.0122)
0.0201*
(0.0119)
0.0202
(0.0142)
Establishments Stayed over the Past 5 Years 1.21e-06
(5.92e-05)
1.60e-05
(4.80e-05)
Establishments Moved In during the Past 5 Years
-6.24e-05
(3.96e-05)
-5.48e- 05**
(2.79e-05)
Establishments Closed/Moved Out during the Past 5 Years
-8.22e-06
(4.17e-05)
-3.42e-05
(3.37e-05)
Total Establishments in 2002 -3.88e-06
(3.81e-05)
-3.92e-05
(2.62e-05)
Constant 0.0565***
(0.00212)
-0.0703
(0.152)
0.00770
(0.164)
0.0337
(0.169)
0.0596***
(0.00147)
-0.121
(0.0823)
-0.0912
(0.0835)
-0.0794
(0.0762)
Clustered S.E.'s? Y Y Y Y Y Y Y Y
MSA and State-Yr Dummies? N N Y Y N N Y Y
Observations 8,772 7,005 7,005 4,553 17,569 14,458 14,458 10,149
R-squared 0.009 0.083 0.107 0.163 0.001 0.081 0.102 0.187
DRAFT—PLEASE DO NOT CITE WITHOUT PERMISSION FROM AUTHORS
Robust standard errors in parentheses
*** p<0.01, ** p<0.05, * p<0.1
33
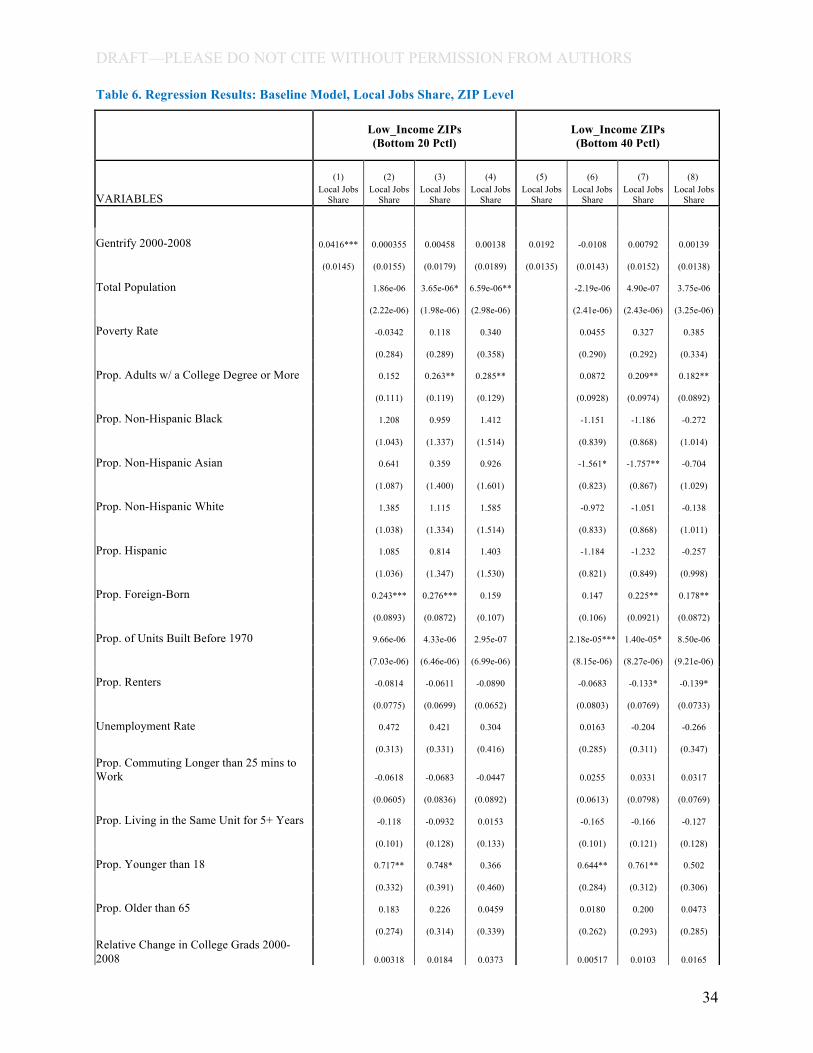
Gentrify 2000-2008 0.0416***
(0.0145)
0.000355
(0.0155)
0.00458
(0.0179)
0.00138
(0.0189)
0.0192
(0.0135)
-0.0108
(0.0143)
0.00792
(0.0152)
0.00139
(0.0138)
Total Population 1.86e-06
(2.22e-06)
3.65e-06*
(1.98e-06)
6.59e-06**
(2.98e-06)
-2.19e-06
(2.41e-06)
4.90e-07
(2.43e-06)
3.75e-06
(3.25e-06)
Poverty Rate -0.0342
(0.284)
0.118
(0.289)
0.340
(0.358)
0.0455
(0.290)
0.327
(0.292)
0.385
(0.334)
Prop. Adults w/ a College Degree or More 0.152
(0.111)
0.263**
(0.119)
0.285**
(0.129)
0.0872
(0.0928)
0.209**
(0.0974)
0.182**
(0.0892)
Prop. Non-Hispanic Black 1.208
(1.043)
0.959
(1.337)
1.412
(1.514)
-1.151
(0.839)
-1.186
(0.868)
-0.272
(1.014)
Prop. Non-Hispanic Asian 0.641
(1.087)
0.359
(1.400)
0.926
(1.601)
-1.561*
(0.823)
-1.757**
(0.867)
-0.704
(1.029)
Prop. Non-Hispanic White 1.385
(1.038)
1.115
(1.334)
1.585
(1.514)
-0.972
(0.833)
-1.051
(0.868)
-0.138
(1.011)
Prop. Hispanic 1.085
(1.036)
0.814
(1.347)
1.403
(1.530)
-1.184
(0.821)
-1.232
(0.849)
-0.257
(0.998)
Prop. Foreign-Born 0.243***
(0.0893)
0.276***
(0.0872)
0.159
(0.107)
0.147
(0.106)
0.225**
(0.0921)
0.178**
(0.0872)
Prop. of Units Built Before 1970 9.66e-06
(7.03e-06)
4.33e-06
(6.46e-06)
2.95e-07
(6.99e-06)
2.18e-05***
(8.15e-06)
1.40e-05*
(8.27e-06)
8.50e-06
(9.21e-06)
Prop. Renters -0.0814
(0.0775)
-0.0611
(0.0699)
-0.0890
(0.0652)
-0.0683
(0.0803)
-0.133*
(0.0769)
-0.139*
(0.0733)
Unemployment Rate 0.472
(0.313)
0.421
(0.331)
0.304
(0.416)
0.0163
(0.285)
-0.204
(0.311)
-0.266
(0.347) Prop. Commuting Longer than 25 mins to
Work -0.0618
(0.0605)
-0.0683
(0.0836)
-0.0447
(0.0892)
0.0255
(0.0613)
0.0331
(0.0798)
0.0317
(0.0769)
Prop. Living in the Same Unit for 5+ Years -0.118
(0.101)
-0.0932
(0.128)
0.0153
(0.133)
-0.165
(0.101)
-0.166
(0.121)
-0.127
(0.128)
Prop. Younger than 18 0.717**
(0.332)
0.748*
(0.391)
0.366
(0.460)
0.644**
(0.284)
0.761**
(0.312)
0.502
(0.306)
Prop. Older than 65 0.183
(0.274)
0.226
(0.314)
0.0459
(0.339)
0.0180
(0.262)
0.200
(0.293)
0.0473
(0.285) Relative Change in College Grads 2000-2008 0.00318 0.0184 0.0373 0.00517 0.0103 0.0165
DRAFT—PLEASE DO NOT CITE WITHOUT PERMISSION FROM AUTHORS
Table 6. Regression Results: Baseline Model, Local Jobs Share, ZIP Level
Low_Income ZIPs (Bottom 20 Pctl)
Low_Income ZIPs (Bottom 40 Pctl)
VARIABLES
(1) Local Jobs
Share
(2) Local Jobs
Share
(3) Local Jobs
Share
(4) Local Jobs
Share
(5) Local Jobs
Share
(6) Local Jobs
Share
(7) Local Jobs
Share
(8) Local Jobs
Share
34
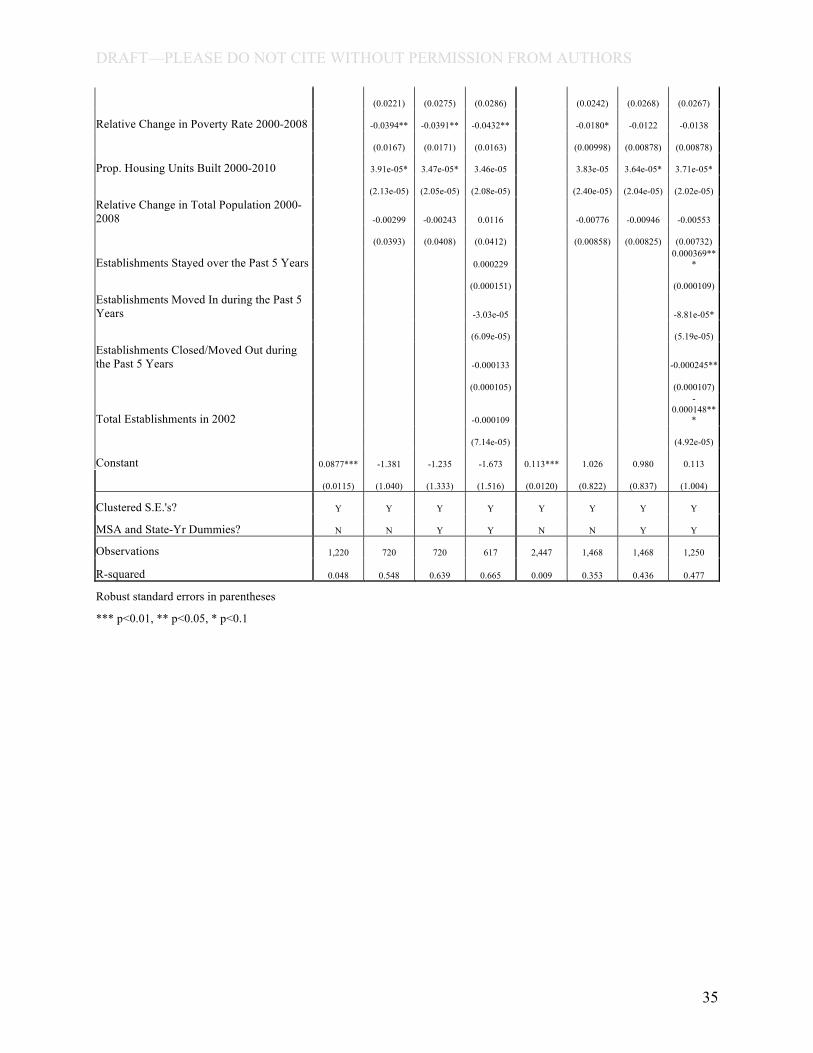
(0.0221) (0.0275) (0.0286) (0.0242) (0.0268) (0.0267)
Relative Change in Poverty Rate 2000-2008 -0.0394**
(0.0167)
-0.0391**
(0.0171)
-0.0432**
(0.0163)
-0.0180*
(0.00998)
-0.0122
(0.00878)
-0.0138
(0.00878)
Prop. Housing Units Built 2000-2010 3.91e-05*
(2.13e-05)
3.47e-05*
(2.05e-05)
3.46e-05
(2.08e-05)
3.83e-05
(2.40e-05)
3.64e-05*
(2.04e-05)
3.71e-05*
(2.02e-05) Relative Change in Total Population 2000-2008 -0.00299
(0.0393)
-0.00243
(0.0408)
0.0116
(0.0412)
-0.00776
(0.00858)
-0.00946
(0.00825)
-0.00553
(0.00732) 0.000369**
*
(0.000109)
Establishments Stayed over the Past 5 Years
Establishments Moved In during the Past 5 Years
Establishments Closed/Moved Out during the Past 5 Years
Total Establishments in 2002
Constant 0.0877***
(0.0115)
-1.381
(1.040)
-1.235
(1.333)
0.000229
(0.000151)
-3.03e-05
(6.09e-05)
-0.000133
(0.000105)
-0.000109
(7.14e-05)
-1.673
(1.516)
0.113***
(0.0120)
1.026
(0.822)
0.980
(0.837)
-8.81e-05*
(5.19e-05)
-0.000245**
(0.000107) -
0.000148** *
(4.92e-05)
0.113
(1.004)
Clustered S.E.' s? Y Y Y Y Y Y Y Y
MSA and State-Yr Dummies? N N Y Y N N Y Y
Observations 1,220 720 720 617 2,447 1,468 1,468 1,250
R-squared 0.048 0.548 0.639 0.665 0.009 0.353 0.436 0.477
DRAFT—PLEASE DO NOT CITE WITHOUT PERMISSION FROM AUTHORS
Robust standard errors in parentheses
*** p<0.01, ** p<0.05, * p<0.1
35
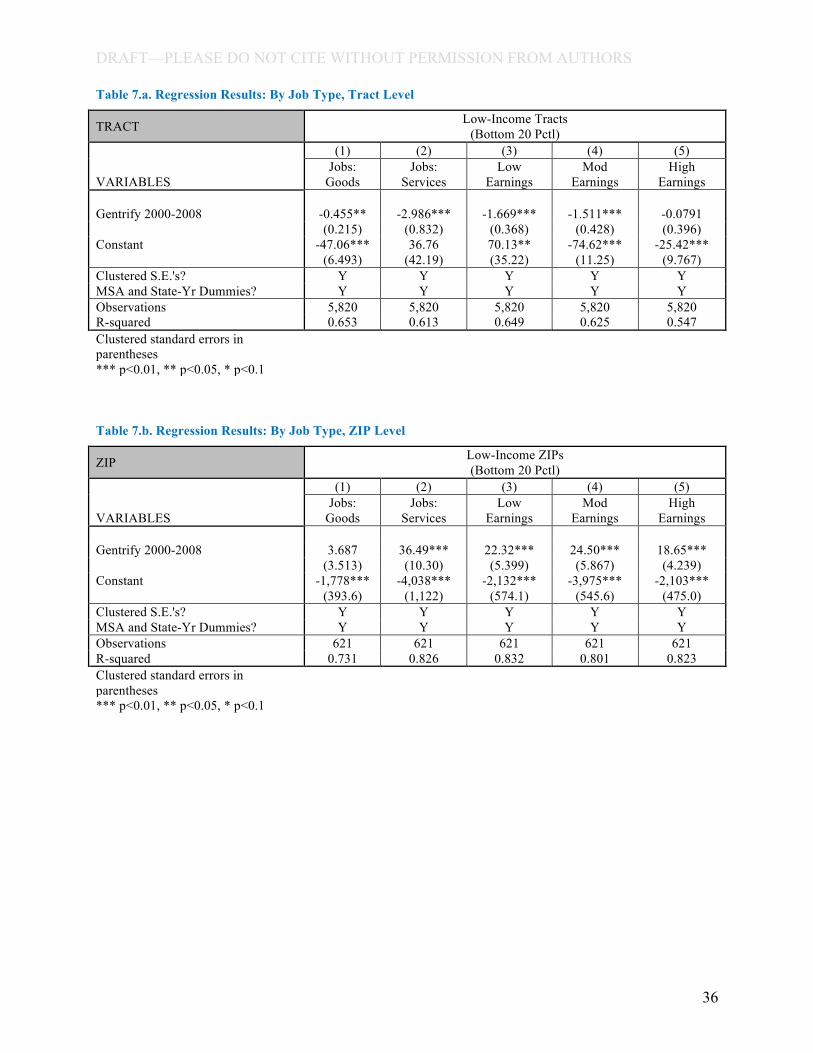
Clustered S.E.'s? Y Y Y Y Y
MSA and State-Yr Dummies? Y Y Y Y Y Observations 5,820 5,820 5,820 5,820 5,820 R-squared 0.653 0.613 0.649 0.625 0.547
Clustered S.E.'s? Y Y Y Y Y
MSA and State-Yr Dummies? Y Y Y Y Y Observations 621 621 621 621 621 R-squared 0.731 0.826 0.832 0.801 0.823
DRAFT—PLEASE DO NOT CITE WITHOUT PERMISSION FROM AUTHORS
Table 7.a. Regression Results: By Job Type, Tract Level
TRACT Low-Income Tracts (Bottom 20 Pctl)
(1) (2) (3) (4) (5)
VARIABLES Jobs:
Goods Jobs:
Services Low
Earnings Mod
Earnings High
Earnings
Gentrify 2000-2008
Constant
-0.455** (0.215)
-47.06*** (6.493)
-2.986*** (0.832) 36.76
(42.19)
-1.669*** (0.368) 70.13** (35.22)
-1.511*** (0.428)
-74.62*** (11.25)
-0.0791 (0.396)
-25.42*** (9.767)
Clustered standard errors in parentheses *** p<0.01, ** p<0.05, * p<0.1
Table 7.b. Regression Results: By Job Type, ZIP Level
ZIP Low-Income ZIPs (Bottom 20 Pctl)
(1) (2) (3) (4) (5)
VARIABLES Jobs:
Goods Jobs:
Services Low
Earnings Mod
Earnings High
Earnings
Gentrify 2000-2008
Constant
3.687 (3.513)
-1,778*** (393.6)
36.49*** (10.30)
-4,038*** (1,122)
22.32*** (5.399)
-2,132*** (574.1)
24.50*** (5.867)
-3,975*** (545.6)
18.65*** (4.239)
-2,103*** (475.0)
Clustered standard errors in parentheses *** p<0.01, ** p<0.05, * p<0.1
36
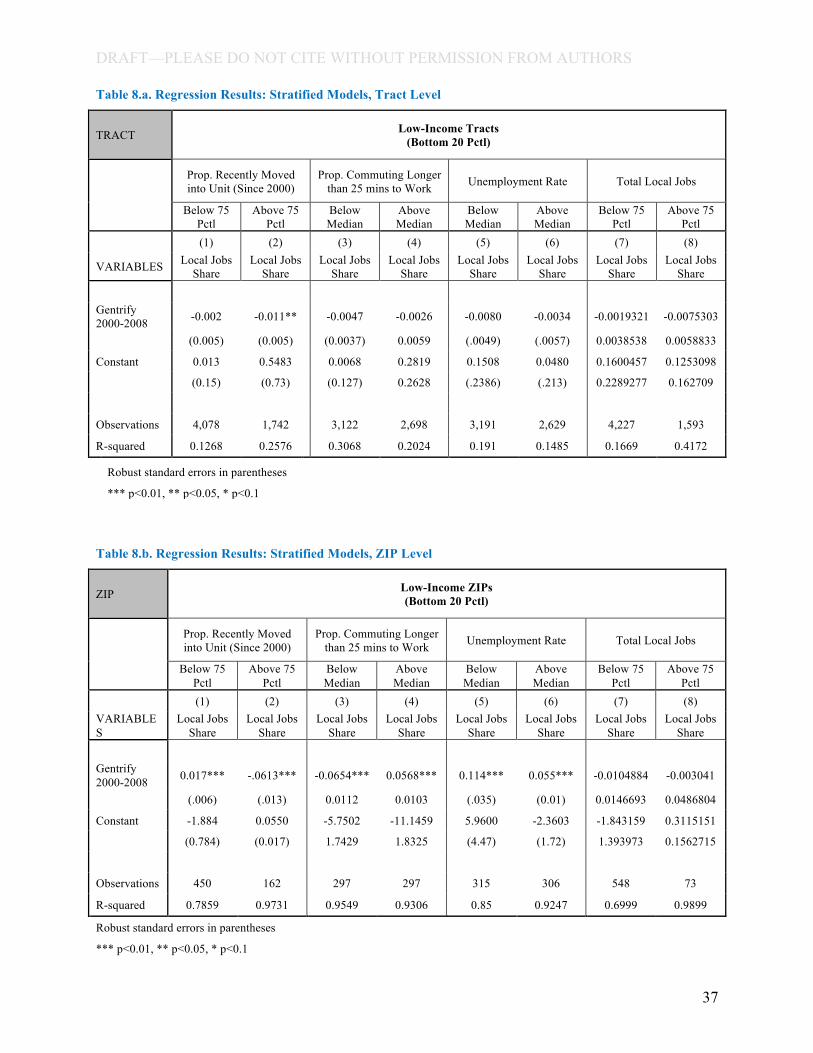
Gentrify
2000-2008 -0.002
(0.005)
-0.011**
(0.005)
-0.0047
(0.0037)
-0.0026
0.0059
-0.0080
(.0049)
-0.0034
(.0057)
-0.0019321
0.0038538
-0.0075303
0.0058833
Constant 0.013
(0.15)
0.5483
(0.73)
0.0068
(0.127)
0.2819
0.2628
0.1508
(.2386)
0.0480
(.213)
0.1600457
0.2289277
0.1253098
0.162709
Observations 4,078 1,742 3,122 2,698 3,191 2,629 4,227 1,593
R-squared 0.1268 0.2576 0.3068 0.2024 0.191 0.1485 0.1669 0.4172
Gentrify 2000-2008 0.017***
(.006)
-.0613***
(.013)
-0.0654***
0.0112
0.0568***
0.0103
0.114***
(.035)
0.055***
(0.01)
-0.0104884
0.0146693
-0.003041
0.0486804
Constant -1.884
(0.784)
0.0550
(0.017)
-5.7502
1.7429
-11.1459
1.8325
5.9600
(4.47)
-2.3603
(1.72)
-1.843159
1.393973
0.3115151
0.1562715
Observations 450 162 297 297 315 306 548 73
R-squared 0.7859 0.9731 0.9549 0.9306 0.85 0.9247 0.6999 0.9899
DRAFT—PLEASE DO NOT CITE WITHOUT PERMISSION FROM AUTHORS
Table 8.a. Regression Results: Stratified Models, Tract Level
TRACT Low-Income Tracts (Bottom 20 Pctl)
Prop. Recently Moved into Unit (Since 2000)
Prop. Commuting Longer than 25 mins to Work Unemployment Rate Total Local Jobs
Below 75 Pctl
Above 75 Pctl
Below Median
Above Median
Below Median
Above Median
Below 75 Pctl
Above 75 Pctl
VARIABLES
(1) Local Jobs
Share
(2) Local Jobs
Share
(3) Local Jobs
Share
(4) Local Jobs
Share
(5) Local Jobs
Share
(6) Local Jobs
Share
(7) Local Jobs
Share
(8) Local Jobs
Share
Robust standard errors in parentheses
*** p<0.01, ** p<0.05, * p<0.1
Table 8.b. Regression Results: Stratified Models, ZIP Level
ZIP Low-Income ZIPs (Bottom 20 Pctl)
Prop. Recently Moved into Unit (Since 2000)
Prop. Commuting Longer than 25 mins to Work Unemployment Rate Total Local Jobs
Below 75 Pctl
Above 75 Pctl
Below Median
Above Median
Below Median
Above Median
Below 75 Pctl
Above 75 Pctl
VARIABLE S
(1) Local Jobs
Share
(2) Local Jobs
Share
(3) Local Jobs
Share
(4) Local Jobs
Share
(5) Local Jobs
Share
(6) Local Jobs
Share
(7) Local Jobs
Share
(8) Local Jobs
Share
Robust standard errors in parentheses
*** p<0.01, ** p<0.05, * p<0.1
37

DRAFT—PLEASE DO NOT CITE WITHOUT PERMISSION FROM AUTHORS
38

![Vipul Bhatt Suraj Jacob James Madison University · Suraj Jacob† James Madison University [Preliminary Draft: Please do not cite without authors’ permission] Abstract This paper](https://img.pdfslide.us/doc/110x75/5f46332863cc7e67fd487fb4/vipul-bhatt-suraj-jacob-james-madison-suraj-jacoba-james-madison-university-preliminary.jpg)