Embed Size (px)
Citation preview

DRAFT WATER RESOURCES MANAGEMENT PLAN 2019
Helen Orton
Finance and Regulation Director
Portsmouth Water Limited
PO Box 8
West Street
Havant
Hants
PO9 1LG March 2017

2
1 Draft Water Resources Management Plan Executive Summary ............................................................. 8
1.1 Introduction....................................................................................................................................... 8
1.2 Supply ................................................................................................................................................ 8
1.3 Demand ............................................................................................................................................. 9
1.4 Baseline Supply/Demand Balance ................................................................................................... 11
1.5 Options appraisal ............................................................................................................................ 12
1.6 The Draft Plan .................................................................................................................................. 14
1.7 Testing the Sensitivity of the Plan ................................................................................................... 15
1.8 Consultation and next steps ............................................................................................................ 15
2 Introduction and Background ................................................................................................................ 16
2.1 Characteristic of Portsmouth Water ............................................................................................... 16
2.2 Water Resources Management Plan Statutory Process .................................................................. 17
2.3 Components of the Supply Demand Balance .................................................................................. 19
2.4 Previous Water Resources Management Plan ................................................................................ 19
2.5 Government Policies Influencing this Plan ...................................................................................... 20
2.6 Natural England Documents............................................................................................................ 20
2.7 Environmental Legislation ............................................................................................................... 21
2.8 Legislative Framework ..................................................................................................................... 21
2.9 Stakeholder Engagement ................................................................................................................ 21
3 Supply .................................................................................................................................................... 25
3.1 Introduction..................................................................................................................................... 25
3.2 Deployable Output Assessment ...................................................................................................... 27
3.3 Sustainability Reductions ................................................................................................................ 43
3.4 Climate Change ............................................................................................................................... 49
3.5 Outage Assessment ......................................................................................................................... 51
3.6 Process Losses ................................................................................................................................. 54
3.7 Bulk Supply Imports......................................................................................................................... 54
4 Demand ................................................................................................................................................. 56
4.1 Introduction..................................................................................................................................... 56
4.2 Demand Scenarios ........................................................................................................................... 57
4.3 The Base Year .................................................................................................................................. 57
4.4 The Demand Forecast ..................................................................................................................... 69

3
4.5 Non-Household Demand Forecast .................................................................................................. 83
4.6 Other Components of Demand ....................................................................................................... 84
4.7 The NYAA and DYAA Scenario ......................................................................................................... 85
4.8 The DYCP Scenario .......................................................................................................................... 86
4.9 Bulk Supply Exports ......................................................................................................................... 87
5 BASELINE SUPPLY/DEMAND BALANCE .................................................................................................. 89
5.1 Introduction .................................................................................................................................... 89
5.2 Headroom Assessment ................................................................................................................... 89
5.3 Baseline Supply/Demand Balance ................................................................................................... 95
6 OPTIONS APPRAISAL ............................................................................................................................ 101
6.1 Introduction .................................................................................................................................. 101
6.2 Unconstrained Options ................................................................................................................. 102
6.3 Feasible List of Options ................................................................................................................. 103
6.4 Appraisal of Feasible Options for the Draft Plan ........................................................................... 104
6.5 Production Side Options ............................................................................................................... 107
6.6 Resource Side Options .................................................................................................................. 107
6.7 Distribution of Water Options ....................................................................................................... 111
6.8 Customer Side Options .................................................................................................................. 113
6.9 Drought Options ............................................................................................................................ 116
6.10 Current Operations ................................................................................................................... 117
7 FINAL PLANNING ................................................................................................................................. 118
7.1 Introduction .................................................................................................................................. 118
7.2 Selection of the Final Planning Solution ........................................................................................ 118
7.3 Final Planning Solution Constraints ............................................................................................... 119
7.4 Implementation Programme ......................................................................................................... 120
7.5 Final Planning Tables ..................................................................................................................... 120
7.6 Final Planning Per Capita Consumption ........................................................................................ 125
7.7 Compliance with the Directions .................................................................................................... 125
7.8 Government Policies Influencing this Plan .................................................................................... 126
7.9 Strategic Environmental Assessment and Habitats Regulation Assessment ................................ 126
7.10 Commitment to Further Work ................................................................................................. 127
7.11 Water Framework Directive ..................................................................................................... 127
7.12 In combination effects .............................................................................................................. 127
8 TESTING THE PLAN .............................................................................................................................. 128

4
8.1 Introduction................................................................................................................................... 128
8.2 Sensitivity of the Plan .................................................................................................................... 129
9 NEXT STEPS .......................................................................................................................................... 130
9.1 Publication Process ....................................................................................................................... 130
9.2 Water Resources Management Plan 2024 .................................................................................... 130
10 TABLE COMMENTARIES ................................................................................................................. 131
10.1 Dry Year – Annual Average ....................................................................................................... 131
10.2 Dry Year – Peak Week............................................................................................................... 132
10.3 Severe Drought – Annual Average ............................................................................................ 132
10.4 Severe Drought Peak Week ...................................................................................................... 132

5
APPENDICES A Deployable Output Assessment (AECOM Sept 2017)
B Water Industry National Environment Programme (EA Sept 2017)
C Climate Change Impact Assessment (HRW Nov 2016)
D Outage Assessment (AECOM Sept 2017)
E Water Resource Zone Integrity (PRT Feb 2017)
F Headroom Assessment (AECOM Nov 2017)
G Property and Population Forecast (EXPERIAN Jan 2017)
H WRMP19 Problem Characterisation (PRT Nov 2017)
I Household Demand Forecast (PRT Nov 2017)
J Non-household Demand Forecast (PRT Nov 2017)
K Leakage Report (SELL) (Tooms Moore Nov 2017)
L Water Resources Management Plan Direction 2017 (DEFRA 2017)
M Water Resources Planning Guidelines (EA Apr 2017)
N Guiding Principles for Water Resources Planning (DEFRA May 2016)
O HRA Report (AMEC Feb 2018)
P SEA Report (AMEC Feb 2018)
Q Long Term Planning Framework (Water UK Jul 2016)
R Feasible Options (AMEC Feb 2018)
S WRSE further information (WRSE Nov 2017)
T Contact Plan (PRT Nov 2017)
U Draft Drought Plan 2018 (PRT Dec 2017)
V Annual Review 2017 (PRT Jun 2017)
W Water Industry Strategic Environmental Requirements (WISER) (EA/NE Oct 2017)
X Conservation 21 (Natural England 2016)
Y Strategic Priorities and Objectives for Ofwat (DEFRA Sept 2017)
Z Pre Consultation Responses (PRT Nov 2017)
AA WRP Tables (PRT March 2018)
BB Base Year and Projected Occupancy for WRMP19 (PRT Nov 2017)

6
Glossary of acronyms
Term Meaning
A ADO Average deployable output
ADPW Average day peak week
AISC Average Incremental Social Cost
AMP Asset Management Plan period
AMP6 The current Asset Management Planning period, running from 2015/16 to 2019/20
AMP7 The Asset Management Planning period, running from 2020/21 to 2024/25
B BL Baseline (Plan) The WRMP excluding all future options
C CAPEX Capital Expenditure
CC Climate change
CCW Consumer Council for Water
D DAPWL Deepest Advisable Pump Water Level
Defra Department for Environment, Food and Rural Affairs
DFSE Demand Forecasting in the South East
DI Distribution Input
DMA District Metering Area
DO Deployable output
DYAA Dry year annual average planning scenario
DYCP Dry year critical period planning scenario
DYMDO Dry year minimum deployable output planning scenario
E EA Environment Agency
EBSD Economics of Balancing Supply and Demand
F FP Final (Plan) i.e. The plan including all options
fWRMP Final Water Resources Management Plan
H HH Household customers
HOF Hands Off Flow
HRA Habitats Regulation Assessment
L l/h/d Litres per head per day
l/prop/d Litres per property per day
LoS Levels of Service
LTA Long Term Average
M mAOD Meters Above Ordinance Datum
MDO Minimum deployable output
Ml/d Megalitres per day
N NE Natural England
NEP National Environment Programme
NHH Non-household – i.e. commercial and industrial customers
NYAA Normal Year Annual Average planning scenario
O ONS Office for National Statistics

7
OPEX Operational Expenditure
P PCC Per capita consumption
PDO Peak deployable output
PET Potential evapotranspiration
PHC Per household consumption
PR19 Periodic Review 2019
PRT Portsmouth Water
PRV Pressure reducing valve
PUSH Partnership for Urban South Hampshire
S SDB Supply demand balance
SEA Strategic Environmental Assessment
SEAA Severe Drought Annual Average planning scenario
SECP Severe Drought Critical Period planning scenario
SELL Sustainable Economic Level of Leakage
SMA Strategic Metering Area
SPA Special Protection Area
U UKCP UK Climate Projections
UKWIR UK Water Industry Research Ltd
W WAFU Water available for use
WFD Water Framework Directive
WINEP Water Industry National Environmental Programme
WRMP Water Resources Management Plan
WRPG Water Resource Planning Guidelines, produced and published by the EA
WRSE Water Resources in the South East group
WRZ Water Resource Zone
WSW Water Supply Works
WWTW Waste Water Treatment Works

8
1 DRAFT WATER RESOURCES MANAGEMENT PLAN EXECUTIVE SUMMARY
1.1 Introduction
Portsmouth Water has a long tradition of serving Portsmouth and the surrounding area since
the Company was established in 1857. Through amalgamation, the area has expanded beyond
Portsmouth to supply the towns and cities of Gosport, Fareham, Havant, Chichester and
Bognor Regis in the South East of Hampshire and West Sussex.
Long-term planning for the provision of public water supplies is a vital aspect of maintaining
the security of supply to customers whilst respecting the needs of the environment. Water
resource planning has been a regular activity for water companies for many decades and the
Government has introduced legislation that requires companies to prepare Water Resource
Management Plans and for public consultation to be carried out. The plans are prepared in
accordance with the statutory guidance and policies issued by the Environment Agency and
Defra.
In preparing this plan, Portsmouth Water have also engaged with a number of customers and
stakeholders. Our customer engagement has, for example, shaped our approach to metering.
In parallel our plan is closely aligned to the Government’s expectation for ensuring resilient
water supplies in the long term and contributing to regional solutions through the use of
greater bulk supplies to neighbouring companies.
The most significant proposal in the plan is to commence the development of a winter storage
reservoir, at Havant Thicket. This development has been considered in the past and is now
required to support the request for greater bulk supplies to Southern Water, who face some
significant sustainability reductions on the River Test and River Itchen. Working with our local
stakeholders Portsmouth Water aim to be able to support the requirements of Southern
Water.
This plan presents our Supply / Demand balance for 5 scenarios, which effectively are the
result of greater drought severity. The 5 scenarios take us through a range, from our current
planning assumptions of Temporary Bans being required 1 year in 20 to the most significant
requirement for Drought Orders 1 year in 200. It shows the actions Portsmouth Water need
to take over the next 10 years, in particular, to ensure it is resilient to greater drought
severities and be able to support other water companies in the region.
1.2 Supply
The supply side forecast for this Plan includes a reassessment of Deployable Output of the 22
Company water sources.
It includes:-
An assessment of the impact of climate change on each source.
Quantifying the impact of any short term loss of production referred to as ‘outage’.
An assessment of the use of water in the treatment process itself.
Portsmouth Water appointed consultants, AECOM, to carry out a full reassessment of
Deployable Output (DO) including a range of drought scenarios up to and including the

9
reference scenario of a 1 in 200 year return period (0.5% chance of occurring in each year). In
addition, the consultants assessed the impact of outage and an allowance for risk referred to
as ‘headroom’.
Further, Portsmouth Water has revised its assessment of the impact of Climate Change on its
sources, based on the UKCP09 data with consultants HR Wallingford. The results indicated
that Portsmouth Water’s vulnerability to climate change is ‘medium’. However, given the
general interest in this issue the, Company has undertaken a full assessment of climate change
and this is discussed further in this plan.
Finally Portsmouth Water has assumed no sustainability reduction is required to our sources,
as advised by the Environment Agency in their WINEP2 letter (September 2017).
The overall assessment has resulted in a lower estimate of the Deployable Output and water
available for use than in our previous, WRMP14, plan by 7%.
1.3 Demand
Experian were appointed by a group of water companies in the South East to develop detailed
property and population forecasts for the planning period 2020-2045. The results indicate
that the Company’s supply area will see a similar increase in both properties and population
over the planning period to that estimated in the previous plan, WRMP14.
Our current metering strategy is based on metering of new houses and allowing all
unmeasured customers to opt for a meter free of charge. Despite significant campaigns,
meter optants have been significantly lower than planned during this 5 year period.
Accordingly, Portsmouth Water approached Defra to discuss the legislation. Unlike other
companies in the South East, Portsmouth Water is not Resource Stressed and therefore not
able to compulsory meter its customer base. We proposed that the power for water
companies to meter all customers should reflect the needs of the region not solely the
Company. This would enable Portsmouth Water to meter its customers in line with all others
in the South East.
Unfortunately, this proposal was not progressed by Defra and Portsmouth Water are now
proposing the introduction of a new strategy – ‘not for revenue metering’ which it hopes will
increase customer acceptability of metering. We will continue to review the issue of
compulsory metering in the future.
Specifically, Portsmouth Water will encourage its unmeasured customers to switch to a
measured charge based on information of their actual usage. Portsmouth Water will install
meters at specific properties and provide the customer with a comparison between their
current unmeasured bill and the resultant measured bill. We anticipate that this will
encourage customers to opt for a meter.
Portsmouth Water has assumed, at this stage, that one third of the customers trialled will
ultimately switch to the measured charge. It is likely that, even if customers do not switch to
a measured basis, the provision of timely water consumption information will result in a
reduction in demand by 5%.
The result of our proposal for metering and new growth also allows us to establish a forecast
of household demand. The results show that, in line with the Government’s aspirations, the

10
Company’s PCC will fall over the planning period from 140 litres per head per day to 135 litres
per head per day by 2024/25.
PCC may fall faster if developers choose to install water efficient appliances in new homes or
adopt new methods of supplying households used elsewhere in the world. These include
options of rainwater harvesting, grey and black water recycling. Clearly such schemes reduce
demand in normal conditions – but caution needs to be applied with rainwater harvesting, for
example, as we plan for dry periods of weather.
Our assessment is that non-household demand will continue to fall over the planning period,
with the long term trend being reinforced by retailers in the Non-household Retail Market
working with their customers to reduce usage further.
The Company has re-assessed its methodology to calculate leakage as part of a wider industry
revised harmonisation programme. The ‘new’ methodology will be applied by all companies
and should ensure the reported values of leakage are determined on a consistent basis. The
impact of this change in methodology is to increase the volume of reported leakage by circa
5 Ml/d, with a corresponding reduction on all other items in the water balance, in particular
household usage. This results in a leakage estimate of 35 Ml/d, equating to almost 110 litres
per property per day.
Our plan proposes to develop District Meter Areas in specific parts of the Company region to
enable leaks to be detected more quickly. Portsmouth Water estimate that the initial tranche
of DMAs could reduce leakage by almost 5Ml/d or 15% over the first five years of the plan.

11
1.4 Baseline Supply/Demand Balance
The ‘baseline’ water available for use is compared with the baseline demand forecast to
assess Portsmouth Water’s security of supply. This is the position before any interventions
take place. It shows that we have positive headroom to meet both our customers and existing
bulk supply commitments to Southern Water.
Ml/d 2019/20 2024/25 2029/30 2034/35 2039/40 2044/45
Distribution Input 170.8 170.0 170.3 171.4 172.8 174.6
Deployable Output 226.5 226.5 226.5 226.5 226.5 226.5
Process Losses 2.4 2.4 2.4 2.4 2.4 2.4
Climate Change 0.0 0.2 0.4 0.6 0.7 0.9
Outage 14.7 14.7 14.7 14.7 14.7 14.7
WAFU 209.4 209.2 209 208.8 208.7 208.5
Bulk Supplies 30.0 30.0 30.0 30.0 30.0 30.0
Total WAFU 179.4 179.2 179.0 178.8 178.7 178.5
Available Headroom
8.6 9.2 8.7 7.4 5.9 3.9
Table 1: Baseline Supply/Demand Balance (Dry Year Annual Average) Exc.
Additional Bulk Supplies
The graph below compares the Baseline Annual Average Dry Year and shows that the Water
Available for Use WAFU (Red line) stays above the Total demand + headroom (Blue line) which
means the Company is in surplus for the whole planning period, confirming opportunities for
further bulk supplies to Southern Water.
Figure 1: Baseline Supply/Demand Balance (Dry Year Annual Average) Exc.
Additional Bulk Supplies
A surplus also exists for the Baseline Peak Week and the Baseline Minimum Deployable
Output scenarios.
0
50
100
150
200
250
202
0-2
1
202
2-2
3
202
4-2
5
202
6-2
7
202
8-2
9
203
0-2
031
203
2-3
3
203
4-3
5
203
6-3
7
203
8-3
9
204
0-4
1
204
2-4
3
204
4-4
5
Ml/d
Measured household consumption Unmeasured household consumption
Non-household consumption Total leakage
Other components of demand Total water available for use
Total demand + target headroom (baseline)

12
Bulk Supplies
A key expectation of Government, is that companies will work together to improve resilience
of water supply for all customers. This is not something new for Portsmouth Water as it
already provides Southern Water with a bulk supply which was commissioned in 2004. In
preparing for this plan we have had considerable discussions with Southern Water about their
requirements.
Analysis undertaken by WaterUK and detailed work undertaken by Water Resources in the
South East (WRSE) both indicate that greater bulk supplies from Portsmouth Water to
Southern Water are both necessary and economic. These studies indicate that, to facilitate
these greater supplies, resource development is required; Havant Thicket is a significant
development and effectively becomes a regional source, meeting the needs of the region as
opposed to meeting the needs of customers of Portsmouth Water.
By end of 2017/18 the Company will provide Southern Water with two bulk supplies, both for
15 Ml/d to their Sussex and Hampshire zones up to 30 Ml/d (from Whiteways Lodge to their
SRN Source D site and River Itchen into supply in Hampshire respectively).
They have asked for two additional supplies, of 9 Ml/d and 21 Ml/d into their Hampshire zone
in 2022/23 and 2028/29 respectively; the water will come from Source A on the River Itchen
and effectively take all available water from that source for Southern Water’s needs.
The total bulk supply to Southern Water will therefore be up to a total of 60 Ml/d by 2030.
There is, however, some uncertainty over the requirements for these additional supplies to
Southern Water as it has challenged the Environment Agency proposals to reduce its
abstraction licences on the Test and Itchen. A public enquiry is planned for March 2018.
Portsmouth Water will continue to work with Southern Water and other stakeholders to
progress this issue. However, we have assumed, in this plan that the requirements are
confirmed and both supply and demand options will need to be undertaken to meet this
requirement.
Finally, South East Water have asked for a 10 Ml/d bulk supply to Petersfield in 2057/58. This
is beyond the planning horizon and Portsmouth Water will consider the availability of supplies
in the next plan.
1.5 Options appraisal
To determine what Portsmouth Water should do in the period, in particular to meet the
requirements of Southern Water, it has undertaken an Options Appraisal exercise which
identifies options Portsmouth Water have available to meet the supply / demand balance.
The Company conducted its Options Appraisal in accordance with the Water Resource
Planning Guidelines. Firstly an ‘unconstrained list’ of options for balancing a supply demand
deficit was produced. These options are technically feasible but not constrained by
environmental permits or planning issues.
The options range from resource development, changing the way we operate a source,
greater metering, reducing leakage and greater water efficiency activity with customers and
even drought permits in one scenario. This exercise was undertaken by AMEC Foster
13
Wheeler, who are recognised as experts in this field and have worked with other companies
in the water industry for many years.
The initial list of options, of almost 200, was then screened against eight criteria including
yield uncertainty, social impacts and technical difficulty by an expert panel made up of
Portsmouth Water representatives, reducing the unconstrained options to 20 feasible
options.
Each feasible option was then assessed for costs on a financial, social, environmental and
carbon basis. The risk of delivery and yield was also assessed. This allowed Average
Incremental Social Costs (AISC’s) to be calculated to assist in ranking the options.
The most significant option was that of Havant Thicket. Portsmouth Water therefore engaged
Atkins to quantify both the yield of the source and its likely capital cost with greater certainty
than AMEC were in a position to easily provide.
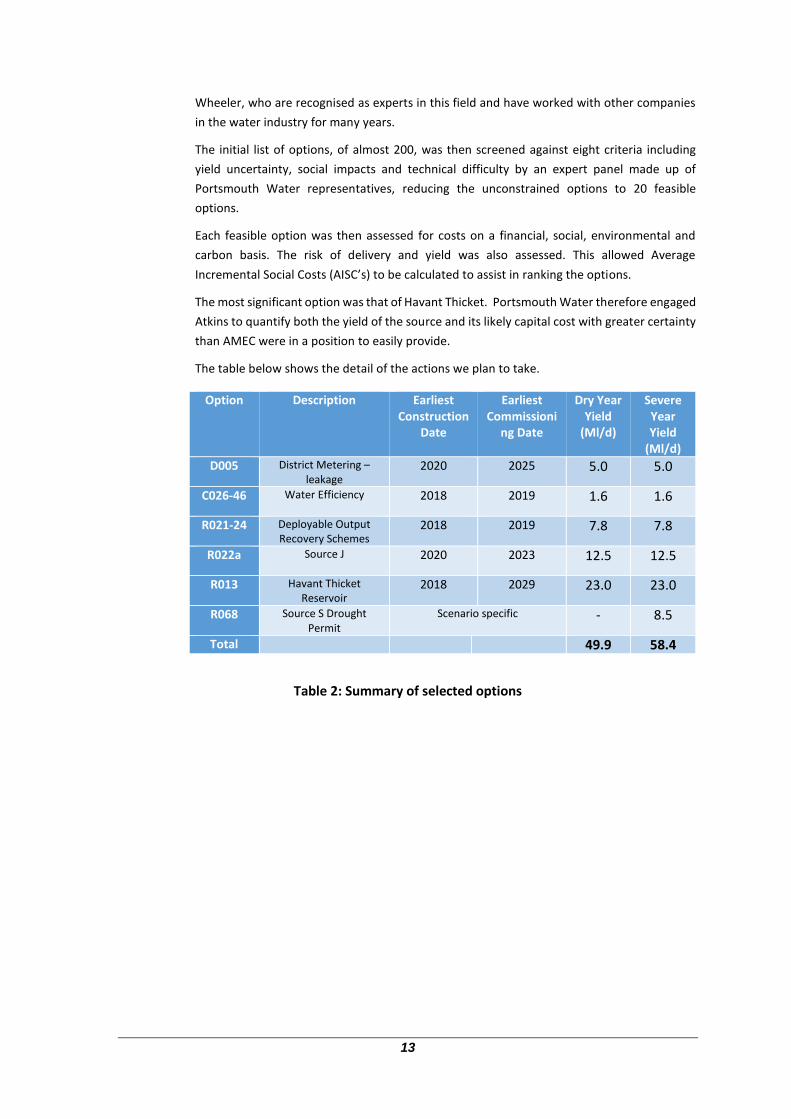
The table below shows the detail of the actions we plan to take.
Table 2: Summary of selected options
Option Description Earliest Construction
Date
Earliest Commissioni
ng Date
Dry Year Yield
(Ml/d)
Severe Year Yield
(Ml/d)
D005 District Metering – leakage
2020 2025 5.0 5.0
C026-46 Water Efficiency 2018 2019 1.6 1.6
R021-24 Deployable Output Recovery Schemes
2018 2019 7.8 7.8
R022a Source J 2020 2023 12.5 12.5
R013 Havant Thicket Reservoir
2018 2029 23.0 23.0
R068 Source S Drought Permit
Scenario specific - 8.5
Total
49.9 58.4

14
1.6 The Draft Plan
Portsmouth Water believes it has prepared an ambitious draft plan for consultation which is
in line with Government Policy Priorities, customers’ expectations and meets the
requirements set out in the Water Resources Planning Guidelines.
Specifically there are six key elements in the plan which are discussed in more detail
throughout this document and associated appendices.
The six elements are as follows:-
The Company is forecasting a falling per capita consumption over the planning period as
a result, in particular, of its new approach to domestic metering.
The Company is planning to reduce leakage significantly over the planning period as a
result of investment in District Meter Areas.
The Company can accommodate requests from Southern Water for bulk supplies to
support the environment elsewhere in the region.
The Company will further develop resources at Source J and Havant Thicket with the
associated recreational and biodiversity benefits at Havant Thicket reservoir.
The Company will meet the longer term supply challenges of rising population and
climate change and can demonstrate that it will continue to have no detrimental impact
on the environment.
The Company can quantify how resilient supplies are to greater and more frequent
droughts expected in the future and provide confidence that it can meet such events.
The table below quantifies the key elements of the proposed.
Table 3: Final Supply/Demand Balance (Dry Year Annual Average)
Ml/d 2019/20 2024/25 2029/30 2034/35 2039/40 2044/45
Baseline WAFU 179.4 179.2 179.0 178.8 178.7 178.5
Resource Schemes 7.8 20.3 43.3 43.3 43.3 63.3
New Bulk Supplies 0.0 9.0 30.0 30.0 30.0 40.0
Final WAFU 187.2 190.5 192.3 192.1 192.0 201.8
Baseline Distribution Input
170.8 170.0 170.3 171.4 172.8 174.6
Demand Management
-1.2 -6.6 -6.6 -6.6 -6.6 -6.6
Final Distribution Input
169.6 163.4 163.7 164.8 166.2 168.0
Available Headroom
17.6 27.1 28.6 27.3 25.7 33.7

15
The graph below again compares the Final Plan Annual Average Dry Year Demand and shows
that the Water Available for Use WAFU (Red line) stays above the Total demand + headroom
(Blue line) which means the Company is in surplus for the whole planning period.
Figure 2: Final Supply/Demand Balance (Dry Year Annual Average)
A surplus also exists for the Peak Week and the Minimum Deployable Output scenarios.
1.7 Testing the Sensitivity of the Plan
The Company has undertaken analysis to test its plan to ensure that it stands up robustly
against the assumptions made. The Company has investigated how changes to assumptions
for supply and demand changed the outcome of the Plan. This analysis confirmed that the
Plan is robust.
1.8 Consultation and next steps
This document is the basis of a statutory consultation process with stakeholders which will
start in early 2018.
A shorter, non-technical summary, will be produced for this purpose. It will be available on
the Company website, with links to the technical detail as appropriate.
Further, we will hold workshops for stakeholders and undertake further customer
engagement to ensure all customers have a good opportunity to comment on this plan,
0
50
100
150
200
250
20
20
-21
20
22
-23
20
24
-25
20
26
-27
20
28
-29
20
30
-203
1
20
32
-33
20
34
-35
20
36
-37
20
38
-39
20
40
-41
20
42
-43
20
44
-45
Ml/
d
Measured household consumption Unmeasured household consumption
Non-household consumption Total leakage
Other components of demand Total water available for use
Total demand + target headroom (final plan)

16
2 INTRODUCTION AND BACKGROUND
The Company has a duty as a water undertaker to ensure that it meets its customers’
expectations in terms of the provision of public water supplies in a sustainable manner. The
Company undertakes Water Resources Planning to show that it will be able to meet this duty
both now and in the future.
In developing Water Resources Management Plans (WRMP) the Company recognises the
need to balance the provision of secure water supplies with the needs of the environment
and the affordability of customer’s bills.
The Company has a long tradition of serving Portsmouth and the surrounding area. The
Company was first established in 1857 and has only once imposed a temporary usage ban,
during the National Drought in 1976. In 2004 a bulk supply was made available to a
neighbouring company as a result of taking a regional view of Water Resource Planning. This
bulk supply has supported the recipient company during recent droughts. Over the last few
years the Company has also, pro-actively, varied a significant number of their abstraction
licences to offer increased protection to the environment.
The preparation and review of Water Resources Management Plans became a statutory
requirement in April 2007, under the Water Industry Act 1991 as amended by the Water Act
2003 (HM Government, 2003). The Water Resources Management Plan Regulations 2007
(HM Government, 2007) and the Water Resources Management Plan Directive 2017 (HM
Government, 2017) provides further detail on the process and further matters a water
company must address when preparing its plan.
The WRMP has been prepared to meet the following levels of service:
Temporary Bans 1 in 20 (Dry Year)
Ordinary Drought Orders 1 in 80 (Extended Drought)
Emergency Drought Orders 1 in 200 (Severe Drought)
The actions required to meet these Levels of Service are set out in the Draft Drought Plan
2018 (Appendix ‘U’).
2.1 Characteristic of Portsmouth Water
Portsmouth Water supplies an area of 868 square kilometres with a population of around
722,000 across West Sussex and Hampshire. The area of supply includes a large expanse of
coastline with numerous important habitats that have been designated under European
Directives (including the South Downs National Park). As a statutory undertaker, Portsmouth
Water has due regard to the purposes of the national park. The Company abstracts an
average of around 170 Ml/d from boreholes, natural springs and one river. The Company has
no significant raw water storage, and consequently is reliant on the recharge of groundwater
over the winter period.
Within Portsmouth Water’s supply area there are a series of ephemeral and perennial chalk
streams and rivers. In addition to their global rarity, chalk streams are diverse ecosystems
which support a wide range of native wildlife. Their special status has been recognised by the
European Commission’s Habitats Directive.

17
The map below gives an overview of the sources Portsmouth Water abstract from. A number
of sources are subject to ‘group licences’ where the licence conditions are limited between
sources. The group sources are listed below.
Source B Springs
Source C and Source D
Source F and Source G
QRST Group (Source T, Source Q, Source R and Source S)
LMNOP Group (Source P, Source O, Source L, Source M and Source N)
There are also a further 6 sites that are licenced in their own right.
Figure 3: Map of Portsmouth Water Area of Supply
Over the last few years the Company has undertaken a number of infrastructure
reinforcement projects which has resulted in improved connectivity between sources. As a
result, Portsmouth Water has a single Water Resource Zone. The justification for the single
zone is set out in Appendix ‘E’.
2.2 Water Resources Management Plan Statutory Process
Water Resources Management Plans are statutory documents and the procedure and
timetable which must be followed is set out in legislation and regulations.
The steps of the statutory process are set out below and this is reproduced from the Water
Resources Planning Guideline (Environment Agency 2017).

18
Figure 4: Process for developing a WRMP
The Company must undertake a period of pre-consultation prior to the preparation of its Draft
Plan. The process of pre-consultation ensures that companies take account of the views of
the statutory consultees namely the Environment Agency and Natural England. Once the
Draft Plan has been prepared it is vetted to ensure there are no security issues and when
approved by Defra, is published for public consultation. All representations to the public
consultation are reviewed and a statement of response is prepared for the Secretary of State
which sets out how the Company will reflect the representations in its final plan. The
Secretary of State determines if the plan should be published, requires modification or if an
examination in public of the plan is needed.
The water resources planning process runs in parallel to the process for setting water
Company price limits. The two processes are linked and the Company has taken an integrated
approach to ensure a consistent approach between the plans. This is particularly important
to ensure the outcomes that reflect what customers’ value are aligned with the WRMP. The
Company has provided regular updates to the Portsmouth Water Customer Challenge Group.

19
2.3 Components of the Supply Demand Balance
The Company builds a forecast of its supply and its demand by considering the individual
elements. The section below sets out the key building blocks that are considered in
developing the forecasts.
2.3.1 Supply Side Components
Deployable Output Assessment – The deployable output of each source
considers a full range of scenarios from the ‘Dry Year’ to a ‘Severe Drought’.
Outage Assessment – The Company must make an allowance for the time
that treatment works are unavailable to supply water because of asset
failure.
Treatment Work Losses – Treatment works that have filtration as part of
their processes use water to wash the filters. The supply assessment must
take account of this requirement as the water will not be available to supply
customers.
Climate Change – The Company needs to take account of how its sources
may be impacted as a result of the changing climate over time.
Sustainability Reductions – Where companies abstractions have the
potential to damage the environment, then it is possible that these
abstractions may have to be reduced to protect the environment.
Bulk Supply Imports – if the Company is the recipient of bulk supplies from
its neighbours this will also be reflected in the supply forecast.
2.3.2 Demand Side Components
Household Consumption – The Company builds a household consumption
forecast taking account of changes to population and properties for its area
of supply. The forecast also takes into account how water use will change
over the planning period and the impact of the metering policy.
Non-Household Consumption – The Company must make an assessment of
the demand for water from commercial activities.
Leakage Forecasts – The demand forecast needs to take account of water
that will be lost through leaks in the piped network. The forecast is now
based on the new leakage methodology.
Bulk Supplies – these are considered to be part of the demand side of the
balance.
2.4 Previous Water Resources Management Plan
The Company published its previous WRMP in August 2014. The 2014 Plan ran from 2015 to
2039 and included an additional bulk supply to Southern Water. This will be commissioned in
2018 and will be regarded as a baseline provision in the new Plan. The 2014 Plan did not

20
forecast a deficit and there were no new supply or demand management options required as
a result.
2.4.1 Commitment for Further Work
In Section 8.2 of the Final WRMP 2014 the Company gave details of its commitment to further
work.
The commitment was to undertake further work on deployable output and resilience of the
Plan to drought and climate change and to include stakeholders in a dialogue of this further
work.
Since the publication of the 2014 Plan, Portsmouth Water have reviewed all of the
components and engaged consultants to re-assess several elements of the supply/demand
balance. This work has been shared with the Environment Agency throughout the preparation
of this plan.
2.5 Government Policies Influencing this Plan
2.5.1 Government Documents
In the preparation of this WRMP, Portsmouth Water has taken account of the following
Government Policy:
Guiding Principles for Water Resources planning (May 2016)
Strategic Priorities and Objectives for Ofwat (September 2017)
The Water Resources Management Plan Direction (April 2017)
Portsmouth Water agrees and support the aims set out in these documents and has
developed the WRMP accordingly.
2.5.2 Water Stress Assessment
In 2012 the Environment Agency produced a revised assessment of ‘Water Stress’. This
assessment is referred to in the legislation for compulsory metering and the 2017 Directive
requires Water Companies to consider this option if their area of supply is ‘Seriously Water
Stressed’.
Portsmouth Water’s area of supply is only ‘Moderately Water Stressed’ and Defra have
confirmed verbally, in April 2017, that the Company cannot legally compulsory meter its
domestic customers.
2.5.3 Environment Agency Documents
Portsmouth Water have taken account of the following EA document in producing the WRMP:
Water Resources Planning Guideline (April 2017)
River Basin Management Plan (February 2016)
Water Industry National Environment Programme (WINEP) (September
2017)
2.6 Natural England Documents
Portsmouth Water have considered guidance and reports produced by Natural England:
Conservation 21 Strategy (2016)

21
Sussex and Kent Focus Areas (2017)
Common Standards Monitoring Guidance (2016)
The Conservation Strategy for the 21st Century reflects recent political changes and aims to
focus on resilient landscapes and seas. The Focus Areas will help Portsmouth Water promote
joint working with the catchment partnerships.
2.7 Environmental Legislation
In recent years Portsmouth Water has undertaken a significant number of Environmental
Studies to determine if its abstraction of water results in an adverse impact on the
environment. As a result of these studies Portsmouth Water has varied a large number of
abstraction licences.
All of the abstraction licences are fully compliant with the Habitats Regulations and the Water
Framework Directive.
2.8 Legislative Framework
The Water Industry Act 1991 (as amended by the Water Act of 2003) set out the requirements
for water companies to prepare and maintain a WRMP.
Further detail on process and requirements on matters to be addressed in the Plan are set
out in the Water Resources Management Plan Regulations 2007 (HM Government, 2007) and
the Water Resources Management Plan Directions (Appendix L).
2.9 Stakeholder Engagement
Portsmouth Water recognises the importance of effective engagement with its stakeholders
to ensure that the Plan has broad support. The Company used a number of mechanisms to
engage with a variety of stakeholders.
Portsmouth Water’s process of stakeholder engagement formed the basis of the pre-
consultation on its Draft WRMP. Through the mechanisms outlined below, Portsmouth Water
shared details on the approach to preparing their Draft WRMP and was able to consider issues
raised by stakeholders (Appendix Z).
2.9.1 Water Resources Management Plan Stakeholder Group
A WRMP Stakeholder Group was established and organisations were invited to join the group
who had made representations or expressed an interest in the Company’s previous plan.
These consisted of the Consumer Council for Water (CCW), Environment Agency, Ofwat,
Natural England and Partnership for Urban South Hampshire (PUSH) representing local
authorities. The Company is grateful for the time and effort these organisations have
contributed to the Water Resources Planning process thus far.
2.9.2 Portsmouth Water Customer Challenge Group
The Water Services Regulatory Authority (Ofwat) has asked that customers should be placed
at the heart of the price review process. Companies are required to maintain a Customer
Challenge Group which provides a report to Ofwat on their view of how well the Company
engaged with their customers throughout the price setting process and if the Business Plan
reflects the views of customers.

22
Water resources are obviously a key element of this process and have been a standing agenda
item at meetings, allowing a dialogue to take place on the various issues arising from the
Company’s Water Resources Management Plan.
2.9.3 Customer Research
Portsmouth Water is undertaking a programme of customer research to inform its Business
Plan and outcomes for the PR19 process. This research consists of a qualitative phase based
around a number of focus groups and quantitative research used to derive values customers
place on elements of service. This research has helped Portsmouth Water to understand
customer views with regard to water resources and to take account of them in the preparation
of the Plan. The research has covered issues such as:
Resilience
Leakage
Temporary Bans
Water Efficiency
Interruptions to Supply
Carbon Footprint
Biodiversity
Hardness of the water
Public Amenities and Community Support
Customer Funded Subsidies
The key results of the market research, in terms of water resources, were:
Support for reduced leakage
Support for Temporary Bans
Support for increased water efficiency
Support for better wildlife habitat
As a result of the customer engagement, the following concerns have been addressed:
Sustainable Economic Level of Leakage (SELL) has been re-calculated using
the new methodology an action plan developed to reduce leakage to the
new target
More information has been provided about the Drought Plan to describe
actions we will take in times of drought.
Water efficiency activities are included in the demand forecast
Development of catchment management and biodiversity programmes. This
is not explicitly discussed further here.
2.9.4 Local Authority Engagement
Portsmouth Water engages with Local Authorities in its area of supply with the aim of
developing a consistent set of assumptions between Portsmouth Water’s WRMP and Local
Authority Plans.

23
Portsmouth Water has also worked with the Partnership for Urban South Hampshire (PUSH)
on the development of an Integrated Water Management Study. This reflects the 2014
WRMP, but future updates will need to take account of the WRMP 2019.
2.9.5 Contact Plan
Portsmouth Water recognises the importance of giving due consideration to potential bulk
supplies and possible solutions to deficits that may be delivered by third parties. Portsmouth
Water developed a Contact Plan to record these opportunities. This Contact Plan involved
publishing a document setting out the likely surplus water Portsmouth Water forecasting over
the planning period. The Company has worked closely with other water companies in the
region, both through Water Resources in the South East (WRSE) and through bilateral
meetings to determine mutually beneficial trades.
2.9.6 Water Resources in the South East (WRSE)
The WRSE Group comprises six water companies, the Environment Agency, Ofwat, Defra, The
Consumer Council for Water and Natural England. The WRSE Group was set up to consider a
regional water resources issues comprising a range of options to find the best solution for
customers and the environment in the South East of England.
Portsmouth Water has been an active participant of WRSE providing data to enable the work
to take place and contributing to the development of the modelling approach.
The results produced by WRSE have confirmed the Company supply/demand position and
scope for greater supplies to Southern Water.
Portsmouth Water has considered the results of the WRSE modelling in preparation for its
WRMP.
For further details about Water Resources in the South East see appendix ‘S’.
2.9.7 Response to Pre-Consultation
Companies are under a statutory obligation to formally pre-consult on their plan and
Portsmouth Water wrote to the statutory consultees to seek their views. A copy of the pre-
consultation letter and response received are contained in Appendix Z.
Portsmouth Water received written responses to their pre-consultation from Defra, the
Environment Agency, Ofwat, Natural England and Southern Water.
The Environment Agency, Natural England and Defra noted that they expected the Company
to take account of the:
Collaboration with others
Customer requirements
Water Resources Planning Guideline
Risk Management
To give due consideration to a range of options including Regional Solutions
The Company’s Plan has been prepared giving due consideration to these elements. The
Company has included in Appendix ‘L’ a table setting out the requirements of the Water
Resources Planning Directive 2017 and which sections of the Plan demonstrate compliance
with the directive.

24
The Environment Agency raised a number of technical points in its response. The Company,
through further meetings and provision of information, has sought to address these issues.
Natural England made reference to Drought Permits and the fact that they did not sit
comfortably with protecting the water environment. Portsmouth Water will try to avoid the
use of Drought Permits, if possible, but the Drought Plan does make reference to a Source A
Drought Order. This is not required to satisfy Portsmouth Water’s needs but it is a short term
measure related to Southern Water’s sustainability reduction on the River Itchen and to
provide the bulk supply to Southern Water.
2.9.8 Habitats Regulations Assessment and Strategic Environmental Assessment
In preparing its Plan, the Company undertook a Strategic Environmental Assessment and a
Habitats Regulating Assessment. These processes formed an integral part of the Plan and
further details are given in Section 6.4.7.

25
3 SUPPLY
3.1 Introduction
The estimates of output available from our sources of supply were fully revised for the WRMP
2019. It now reflects a detailed re-assessment of source yields and the variation of deployable
output with return period. The key assumptions included in the supply side forecast are
outlined briefly below with more detail in the following sections:
Deployable Output Assessment
Sustainability Reductions
Climate Change
Outage Assessment
Treatment Works Losses
Bulk Supply Imports
3.1.1 Deployable Output Assessment
The assessment has been totally revised for the WRMP 2019 using the latest UKWIR guidance.
The Consultant, AECOM, has reviewed drought events to identify a range of scenarios from
the ‘Dry Year’ to a ‘Severe Drought’.
In addition to the ‘Annual Average’ deployable output, two further ‘Critical Period’ scenarios
have been investigated. These are ‘Peak Week’ which is assumed to occur in August and
‘Minimum Deployable Output’ which is assumed to occur in October, November or
December.
3.1.2 Sustainability Reductions
Portsmouth Water have now completed the National Environmental Programme Schemes for
the ‘Water Framework Directive’ (WFD). This included a channel restoration scheme on the
River Ems and water quality improvements on the River Hamble.
The EA have recently published the Water Industry National Environment Programme
(WINEP) (Sept 2017). This includes further WFD investigations but Portsmouth Water do not
believe that there will be any DO reductions as a consequence.
3.1.3 Climate Change
Following publication of the UKCP09 scenarios, and further guidance from the Environment
Agency, Portsmouth Water carried out a ‘Vulnerability Assessment’ (see Appendix C) of
climate change impacts. The results showed the Company has a ‘medium’ vulnerability and
so further climate change studies were commissioned from AECOM/HR Wallingford.
The impacts of climate change on flows in the River Itchen and on groundwater sources have
been investigated.
The future risk of climate change is included in headroom both in supply and demand.
3.1.4 Outage Assessment
Companies need to take account of the reduction in deployable output that results from
treatment works being temporarily unavailable.

26
The outage assessment has been repeated using data from 2007-2016. Events longer than 90
days are excluded where they relate to raw water quality issues resulting from domestic
heating oil spills and cryptosporidium.
The current outage data is seasonal with higher outage in the winter and lower outage in the
summer. This is to be expected as the Company schedules maintenance at periods of lower
demand. This is reflected in the figures for Peak Deployable Output (PDO) and Minimum
Deployable Output (MDO).
3.1.5 Treatment Works Losses
The allowance of treatment works losses is based on water used for cleaning filters from the
more complex sites such as Farlington and the River Itchen Works. The losses from Farlington
have been significantly reduced due to the replacement of the membrane filters with a UV
treatment plant.
3.1.6 Bulk Supply Impacts
WRSE modelling has been used to identify possible bulk supplies of water between
companies. Although several of the bulk supplies are potentially bi-directional, Portsmouth
Water has not formally been offered any bulk supply imports or any third party supplies.
The existing bulk supply to Southern Water’s Sussex North Zone, via Whiteways Lodge, is
subject to an agreement that was renewed in 2016. A second bulk supply, at Source A, is due
to be commissioned in 2018.
3.1.7 Future Bulk Supplies
Southern Water have previously asked for additional bulk supplies from Source A on the West
of Portsmouth Water’s area of supply. These are considered in the demand section (Section
4.9) where they reduce the amount of Water Available for Use (WAFU).

27
3.2 Deployable Output Assessment
In the WRMP 2014 Portsmouth Water gave an undertaking to do further work on deployable
output and to look at resilience to drought and climate change.
To comply with these requirements, Portsmouth Water appointed AECOM to carry out a full
DO assessment in additional to an assessment of outage and headroom. This included an
assessment of a range of drought scenarios and the impact of ‘Deepest Available Pumped
Water Level’ on deployable output.
3.2.1 Previous Deployable Output Assessments
As part of the WRMP 2009 Portsmouth Water submitted a DO assessment which was largely
based on previous work. These previous assessments were:
Southern Water Authority 1984
Portsmouth Water 1997
These studies used operational data from 1973 and 1976 which were considered to be the
worst drought periods in the last 100 years.
The surface water assessment for the River Itchen was based on groundwater modelling data
for the period 1970-2002 which was provided by the Environment Agency.
For the WRMP 2014 Portsmouth Water submitted a DO assessment based on the unified
methodology (UKWIR 2000) and the WR27 report on Water Resources Planning Tools (UKWIR
2012).
The DO assessment used data from 1880 until 2012 and included the latest statistical
approach to calculate DO’s for droughts beyond the ‘Worst Drought on Record’.
3.2.2 Current Guidance on Deployable Output Assessment
The Water Resources Planning Guideline (WRPG) sets out the procedure for assessing
deployable output and this refers to the UKWIR report ‘Handbook of Source Yield
Methodologies’ (2014) and the UKWIR report ‘WRMP19 Methods – Risk Based Planning
Methods’ (2016).
The first report sets out a five step process to follow:
Step 1 – Choose a DO Assessment Framework
Step 2 – Assess Vulnerability to Climate Change
Step 3 – Establish DO Assessment Data Sheet
Step 4 – Calculate DO with a Confidence Table
Step 5 – Report DO Assessment
This work has been undertaken by our Consultant AECOM who worked with the Environment
Agency on their ‘Reliability of Southern Region Public Water Supplies’ (2011) project.
The full report from AECOM is included in Appendix ‘A’ and this includes summaries of the
data used.

28
3.2.3 Drought Scenarios
The WRMP used to be based on a ‘Dry Year’ with a return period set by the level of service
for Temporary Bans. Events rarer than this were covered by the Drought Plan and the
Emergency Plan.
The Drought Plan is now fully integrated into the WRMP and all the Drought Scenarios and
Drought Options have been considered as part of the overall process. Scenarios with a return
period of greater than 1 in 200 are covered by the Emergency Plan and are not included in the
WRMP.
The Company’s record from its groundwater monitoring borehole centrally located at Well
‘X’, near Rowlands Castle, dates back to 1932. As a result, it provides the Company with a
significant record of the most critical conditions for single and multi-season droughts recorded
in more than eighty five years.
Due to the strategic location of this borehole and the availability of this long term record, the
Company has based its drought planning scenarios upon the likely effects of drought
sequences on groundwater levels and the consequent impact upon source yields.
Figure 5 shows most of the key drought years from the recent history.
Figure 5: Historic Well ‘X’ Levels 1972 to 2006
Portsmouth Water has undertaken further analysis of groundwater levels to test if more
severe events occurred prior to 1932 when Well ‘X’ records began. To extend the
groundwater level record it is possible to use an Environment Agency observation borehole
at Well ‘Z’. Records of groundwater level at this site are available from 1836 until the present
day.
10.0
15.0
20.0
25.0
30.0
35.0
May Jun
Jul
Au
g
Sep
Oct
No
v
Dec Jan
Feb
Mar
Ap
r
May Jun
Jul
Au
g
Sep
Oct
No
v
Dec Jan
Feb
Mar
Ap
r
1972-74 1975-77 1989-91 2004-06 LTA

29
Figure 6: Well ‘Z’ Levels 1972 to 2006
Comparison of the Well ‘X’ Levels and the Well ‘Z’ Levels shows that for the same years the
shape of the curve is similar. For example, 1975-1977 shows groundwater levels above the
LTA in May, June and July. Levels then stay almost flat until the groundwater recovery in
November of 1976. In 1989-1991, groundwater levels fell to a minimum in the first dry winter,
rise above the LTA, and then fall again to a minimum in the second dry winter. In 1972-1974,
groundwater levels fell to a minimum in the first dry winter, rise significantly during the spring,
and then fall again to a second low.
This gives the Company confidence that groundwater levels recorded at Well ‘Z’ are
correlated to those at Well ‘X’ and it is appropriate to consider Well ‘Z’ data in determining
possible drought scenarios.
Figure 7: Well ‘Z’ Levels 1857-1907
30
35
40
45
50
55
60
65
70
75
Jan
Feb
Mar
Ap
r
May Jun
Jul
Au
g
Sep
Oct
No
v
Dec Jan
Feb
Mar
Ap
r
May Jun
Jul
Au
g
Sep
Oct
No
v
Dec Jan
Feb
Mar
Ap
r
1972-74 1975-77 1989-91
2004-06 LTA -complete record
30
35
40
45
50
55
60
65
70
75
May Jun
Jul
Au
g
Sep
Oct
No
v
Dec Jan
Feb
Mar
Ap
r
May Jun
Jul
Au
g
Sep
Oct
No
v
Dec Jan
Feb
Mar
Ap
r
1857-59 1890-92 1897-99 1904-06 LTA

30
Figure 8: Well ‘Z’ Levels 1837-1856
The data shows that minimum groundwater level is influenced by winter rainfall and the
timing of the recovery. However, the aquifer is very resilient to drought and all the events
tend towards a minimum groundwater level of around 33 mAOD for Well ‘Z’ and around 13
mAOD for Well ‘X’.
The data set contains long periods of low groundwater levels such as 1989-1991 and 1904-
1906. In these cases, winter recharge was just enough to prevent a year on year fall in
groundwater level. Both these events produced groundwater levels well above the critical
level at Well ‘X’ of 12.7 mAOD, which is based on levels at the end of the recession in 1973.
Figure 9: Well ‘Z’ Level 1904-1906
30
35
40
45
50
55
60
65
70
May Jun
Jul
Au
g
Sep
Oct
No
v
Dec Jan
Feb
Mar
Ap
r
May Jun
Jul
Au
g
Sep
Oct
No
v
Dec Jan
Feb
Mar
Ap
r
1837-39 1846-48 1850-52 1854-56 LTA
30
35
40
45
50
55
60
65
70
75
80
Outturn LTA Drought Trigger

31
Figure 10: Well ‘Z’ Level 1989-1991
The above analysis of the Well ‘Z’ data demonstrates that although low periods of rainfall and
groundwater have been experienced in the past, these have not led to more severe drought
scenarios than the Company had previously considered.
3.2.4 Single Season Droughts
Portsmouth Water has no significant raw water storage, but the South Downs chalk aquifer is
very resilient to drought. The most significant single season dry summer occurred in 1990.
The summer of 1990 was very dry but groundwater levels did not reach the critical level of
12.7 mAOD which was recorded at the end of 1973. Groundwater levels were below average
throughout the summer and autumn without significantly impacting upon source yields.
Levels recovered early in 1991, following average rainfall in the winter.
A ‘Single Season Drought’ is considered unlikely to have a critical effect on the supply/demand
balance for Portsmouth Water. Further experience from the dry summers of 1995 and 2003
when, again, drought measures were not required, demonstrates the Company’s capability
to cope with single season dry summers.
3.2.5 Multi-Season Droughts
Multi-Season Droughts are defined as two or more consecutive seasons of below average
rainfall, and have a much greater impact upon the Company’s ability to balance demands with
available supplies, especially if they are combined with high summer peak demand.
The most serious drought years of 1973, 1976 and 2005 all started with groundwater levels
close to the LTA at the end of the summer of the preceding year. As a result of low rainfall
during the first winter, limited recharge occurred and groundwater levels were well below
average at the beginning of the summer period. Below average rainfall was recorded during
the summer and groundwater levels continued to fall, albeit at a much slower rate, due to
water was ‘drawn from storage’ in the chalk. As the second dry winter developed,
groundwater levels reached their lowest levels. In each of these years, groundwater recharge
occurred in the spring of the third year following a return to wetter conditions.
These events represent the worst droughts on record which we have called ‘Historic Drought’.
30
35
40
45
50
55
60
65
70
75
GWL LTA Trigger

32
For drought scenarios outside the recent history, Portsmouth Water have used groundwater
simulations based on rainfall and temperature records. These simulations are similar to the
work done for the Water UK report ‘Water Resources Long Term Planning Framework 2015-
2065’ and were carried out by same consultant AECOM.
The Company has developed three additional scenarios for multi-season droughts, which are
more extreme than the ‘Rarest Drought on Record’ and scenarios which are considered to be
challenging but plausible. Emergency planning will be used if the Company experienced an
unprecedented event such as loss of a major treatment works from a pollution incident,
combined with an extreme drought.
For the WRMP, and therefore the Drought Plan, the following scenarios have been
considered:
Dry Year (1 in 20)
Scenario ‘A’ Historic Drought (1 in 40)
Scenario ‘B’ Extended Drought (1 in 80)
Scenario ‘C’ Serious Drought (1 in 125)
Scenario ‘D’ Severe Drought (1 in 200)
There is no ‘Design Drought’ but each scenario has been considered and a supply/demand
balance produced. The Water Resources Planning Guideline refers to a ‘Reference Level of
Service’. This is set at a 0.5% chance of customers experiencing an emergency Drought Order.
This is covered by Scenario ‘D’ which has a nominal return period of 1 in 200 (0.5%) and is
designed to avoid the use of standpipes in the street.
3.2.6 Planning Scenarios
The WRMP is developed from a baseline forecast which is defined in Section 5 of this Plan.
The guideline requires companies to complete tables for the ‘Annual Average’ scenario and,
if appropriate, a ‘Critical Period’. In the past Portsmouth Water completed tables for annual
average and peak week.
In the last plan we considered the possibility that the period at the end of the groundwater
recession, when deployable output is at a minimum could be a critical period for Portsmouth
Water. Tables were produced for ADO, MDO and PDO and were compared to determine the
critical period.
MDO was not critical for the last Plan and the deployable output assessment for this Plan also
shows that this is not a critical scenario for Portsmouth Water.
For the WRMP 2014 Portsmouth Water presented supply/demand balances for the full range
of scenarios. Even allowing for the proposed bulk supplies to Southern Water the Company
remained in surplus.
The WRMP 2019 is based on the same approach with each scenario considered in terms of
supply, demand, bulk supplies and feasible options. Some of the feasible options are only
available in rarer droughts and each scenario has a different final planning demand forecast.
Demand management options, such as Temporary Bans, are considered to provide simple
percentage reductions.

33
The supply/demand balance is set out in detail in the associated tables but is summarised in
Section 5.3.
3.2.7 Critical Periods
Portsmouth Water is historically a peak driven company because of its groundwater supplies
and lack of raw water storage. Previous yield assessments concentrated on drought
deployable output recorded during events such as the summer of 1976. Recent licence
variations have often retained peak week abstraction capacity at the expense of annual
average licence totals.
For this deployable output assessment the sources have been considered individually and as
part of the current group licences. The published methodology is based on daily abstraction
with a 7 day running mean over a 5 week period either side of the peak week.
Operational data for critical years such as 1976 has been lost, so water level data has been
collected for recent years. This data is summarised in the main AECOM report which is
included as Appendix ‘A’.
To represent the worst drought on record, curve shifting has been used. The degree of shift
in rest water levels is calculated from observation borehole records and produces scaling
factors that can be applied to each source. A ‘signature’ borehole is allocated to each source
and represents the appropriate part of the aquifer.
The assessment diagrams, included in the Deployable Output Assessment, show the
operational data and the predicted drought curves. There are diagrams are for peak week
and annual average data for each of the source works.
Weekly flows are available for the Source B spring source for the period 1980 to 2016. The
method for calculating DO is similar to that used for the groundwater sources.
The River Itchen source at Source A is linked by its licence to the Environment Agency’s
gauging station close by at Riverside Park. A suite of de-naturalised flow records has been
developed but it is important to consider the impact of Southern Water’s abstractions and
discharges which are upstream of Source A.
Portsmouth Water in 2011 varied its abstraction licence on the River Itchen as a result of the
Site Action Plan put in place to comply with the Habitats Directive. The site action plan also
requires Southern Water to vary their abstraction licence. At present Southern Water have
not varied their abstraction licence and this is now the subject of a Public Hearing expected
to start in March 2018.
Portsmouth Water’s deployable output assessment assumes that Southern Water have
complied with the Habitats Directive and are working to a 198 Ml/d Hands Off Flow (HOF) at
Highbridge and Allbrook. In the short term this will not be possible and Southern Water will
have to apply for a Drought Order to overturn the Hands Off Flow (HOF) at Source A. This is
covered in more detail in the Drought Plan 2018.
3.2.8 External Constraints
The deployable output assessment involved liaison with Southern Water over the modelling
of naturalised flows in the River Itchen. This included the assumptions made about
Chickenhall effluent discharges. After completion of the DO assessment Southern Water
informed Portsmouth Water that the discharge from Chickenhall could be a lot lower in

34
drought events. Rather than re-run all the modelling for the River Itchen we have taken a
nominal 5 Ml/d from the Source A DO for the drought scenarios. This represents a degree of
pain sharing between Southern Water and Portsmouth Water as we would expect the bulk
supplies to be reduced accordingly.
3.2.9 Source Constraints
Deployable output can be constrained by a number of factors:
Licence Constraints
Environmental Constraints
Source Works Constraints
Distribution Constraints
Deepest Advisable Pumping Level
The following table sets out the licence quantities following the implementation of the
Habitats Directive Review of Consents in December 2015.
Abstraction Licence (Ml/d)
Source Works Average Peak Week
Source A 45.5 45.5
Source C 20.5 31.5
Source E 0.5 0.5
Source F 9.0 15.0
Source H 9.1 13.6
Source I 1.5 7.0
Source J 22.7 25.2
Source K 11.4 13.6
Source B 98.0 137.0
LMNOP Group 65.0 94.6
QRST Group 28.4 41.0
Company Total 312 425
Table 4: Abstraction Licence Quantities (Ml/d)
The Source A surface water abstraction, on the River Itchen, is subject to a Hands Off Flow
(HOF) condition of 198 Ml/d. This was set as part of the Habitats Regulation Review of
Consents Site Action Plan. Portsmouth Water has fully implemented this requirement as a
Licence Variation (September 2011).
Source B Springs also have a Minimum Residual Flow (MRF) condition where the Company
cannot abstract water if the fresh water flows to the harbours fall below a prescribed level.
The main part of this condition relates to the Brockhampton Mill Lake which has a MRF of 6.0
Ml/d. The second part relates to the Langstone Mill Stream which has a MRF of 1.3 Ml/d.
These conditions were agreed in February 2010.
Some groundwater sources that were assessed as part of the Habitats Regulations Review of
Consents were subject to a group licence condition. The LMNOP Group includes six source
works and has additional seasonal abstraction conditions at Source P.

35
The current group licences are:
Source B Springs
Source C and Source D
Source F and Source G
QRST Group
LMNOP Group
The LMNOP Group licence was the first licence to have a Minimum Residual Flow (MRF)
condition included in the licence. The Source N licence also has a further condition associated
with a compensation flow that must be provided to the River Ems when the flow in the river
falls below 2.7 Ml/d. This augmentation water is now provided by our raw water source at
Source U.
Source works constraints have been considered in the preparation of the assessment forms
and diagrams (See Appendix ‘A’). Pump capacity and pump depth are considered and a pump
cut out level of 3m above pump depth has been assumed.
Only Source B Springs are constrained by treatment works capacity. When the licence was
revised at Source B the annual total was set at 98.0 Ml/d. This is sufficient to allow Havant
Thicket Reservoir to be filled but is also the nominal maximum treatment capacity at Works
A.
Portsmouth Water only has a single Water Resources Zone and this implies that there is
sufficient mains capacity to allow abstraction to be distributed across the Company’s area. A
high level assessment was undertaken for the WRMP 2009 and no significant changes have
been made since then.
‘Deepest Advisable Pumping Water Levels’ (DAPWL) have now been calculated and they have
resulted in lower DO’s in some cases.
3.2.10 Sourceworks Assessment
From the source assessment diagrams AECOM initially calculated peak and average
deployable outputs for each source. This took account of pump and borehole constraints but
did not take account of group licences. The assessment was undertaken for the worst drought
on record which for Portsmouth Water occurred in 1973.
The results for individual source works are shown below:

36
Table 5: Sourceworks Deployable Outputs
The values for MDO are essentially the same as ADO for individual sources.
Compared to the previous yield assessment for WRMP14 the following key changes have
occurred:
Source K is now available
Source M DO reduced because of a large cavity DAPWL
Source O DO has decreased due to DAPWL
Source J DO has been reduced because of a major fissure flow DAPWL
Source I DO has been reduced because of a new environmental river flow
condition
Source H DO has been reduced following reassessment at the environmental
river flow condition
Source C DO has decreased due to throttling of the borehole pumps to
overcome a turbidity issue
Sourceworks
Individual Deployable Outputs
Sourceworks Average
1973
Peak
1973
Source A 39.2 40.7
Source B 52.5 71.0
Source C 20.5 22.5
Source D 0.7 2.7
Source E 0.5 0.5
Source F 9 12.4
Source G 1.9 3.8
Source H 9.0 9.1
Source I 1.5 2.2
Source J 10.2 10.2
Source K 11.4 12.3
Source L 16.0 16.0
Source M 4.0 6.3
Source N 26.1 35.2
Source O 1.8 5.4
Source P 10.0 10.0
Source Q 12.0 13.0
Source R 12.5 14.0
Source S 2.5 2.5
Source T 8.1 8.8

37
Source U is now unavailable due to the potential risk of cryptosporidium
3.2.11 Resource Zone Assessment
A resource zone model was developed by AECOM to calculate the deployable output for
various levels of service. The resource zone model includes a time series of abstraction rates
for each source. The model sums these time series, applies group licence constraints, and
gives a total available abstraction rate. The introduction of a demand profile allows the critical
period to be identified and a customer ‘Level of Service’ (LOS) analysis to be undertaken.
The WRPG requires companies to relate deployable output to levels of service. As a minimum,
the Environment Agency expects companies to assess DO for the following levels of service:
No Restrictions ‘Dry Year’ 1 in 20
Reference Level of Service ‘Severe Drought’ 1 in 200
For the latest DO assessment AECOM has developed a 1,000 year time series based on
stochastic weather data. This allows DO to be calculated for drought events outside the
historic recorded data. The guideline describes these to be ‘challenging but plausible
droughts’. For Portsmouth Water the full range of scenarios is as follows:
Dry Year 1 in 20
Historic Drought: Scenario ‘A’ 1 in 40
Extended Drought: Scenario ‘B’ 1 in 80
Serious Drought: Scenario : Scenario ‘A’ 1 in 125
Severe Drought: Scenario ‘D’ 1 in 200
The deployable output was also calculated for more extreme events but these do not form
part of this WRMP.
The resource zone model determines observation borehole groundwater levels on a daily
time step and calculates rest water levels. This gives the maximum available abstraction rate
which the model then corrects for licence constraints and sums the source DO’s to give the
resource zone DO. The model runs the selected groundwater scenario and increases demand
until the available resource fails to meet demand for a target number of years. So fifty failures
within the 1,000 year stochastic sequence represents a 1 in 20 year event.

38
Figure 11: Return Period Calculation
Portsmouth Water has produced demand profiles to represent unrestricted demand (Dry Year
1 in 20) and a range of restricted demands. These represent the impact of Temporary Bans,
Non-essential Use Bans and emergency Drought Orders. The Water Resource Zone model
uses these profiles to predict deployable output.
Compared to the previous assessments the demand profile is now less smooth over the year
and recognises a minor peak around Easter. It also shows the peak week in August which is
later than previous profiles. This produces more conservative DO’s and may reflect changing
customer behaviour and the impact of climate change.
Figure 12: Water Resource Zone Demand Profiles
The Water Resources Zone Model produces unrestricted and restricted estimates of
deployable output. The restricted estimates use the scenario profiles to calculate DO for a
given return period.
The following graph shows how this relates to ADO, PDO and MDO.

39
Figure 13: Influence of Demand Profile on Deployable Output
The demand profiles do not impact on modelled groundwater levels but it is possible that
demand restrictions could help conserve aquifer storage. The effect is believed to be
relatively minor when compared to the impact of demand restrictions on surface water
storage reservoirs.
Emergency Drought Orders are not part of the WRMP process and supply side Drought
Permits are excluded for the DO assessment. Drought Permits are considered to be options
and are representative in the Final Planning Tables if required.
The Resource Zone Model does not take account of bulk supplies to Southern Water. These
are represented as separate inputs to the WRMP tables.
3.2.12 Deployable Output Assessment
The deployable outputs for each source works for each of the scenarios is given in Appendix
‘A’. Rather than use the deployable output of an actual Dry Year as was done in the past, the
Water Resource Zone Model now uses a simulated one. This is based on the latest demand
profiles and matched the ‘Dry Year’ level of service of 1 in 20.
The ‘Worst drought on record’/’Historic Drought’ is also simulated with a return period of 1
in 40. Under this scenario demand restrictions would apply but no drought permits would be
required. Portsmouth Water has only implemented one demand restriction, a temporary
usage ban in 1976.
Return period ADO
Ml/d
PDO
Ml/d
MDO
Ml/d
1 in 20 227 280 252
1 in 40 212 270 237
1 in 80 207 263 233
1 in 125 198 252 234
1 in 200 191 236 222
Table 6: Total Deployable Output
As noted earlier, since the production of the DO Assessment Southern Water have stated that
the discharge from Chickenhall WTW is likely to be lower than previously forecast. This will
reduce the DO from Source A and therefore the overall Company DO.
The table below allows for a 5.0 Ml/d reduction in yield from Source A for scenarios with a
return period of 1 in 40 or greater.
Total deployable output is used in Section 5 as part of the overall supply/demand balance.

40
1 in 20:
Dry 1 in 40: Historic
1 in 80: Extended
1 in 125: Serious
1 in 200: Severe
Source A 36.9 31.6 30.3 30.2 20.0
Source B 53 47.6 46.6 42.4 42.9
Source C 17.3 17.2 16.6 16.5 16.3
Source D 1.1 0.8 0.8 0.6 0.8
Source E 0.4 0.4 0.4 0.4 0.4
Source F 7.2 7.3 7.1 7.2 6.9
Source G 1.5 1.6 1.5 1.5 1.5
Source H 7.7 7.6 7.3 7.3 7.2
Source I 1.5 1.4 1.4 1.3 1.4
Source J 9.1 8.5 8.5 7.8 8.3
Source K 9.6 9.5 9.2 9.1 9.0
Source L 13.7 13.3 12.9 12.5 12.6
Source M 4.5 3.7 3.5 2.8 3.8
Source N 22.2 22.1 21.3 21.1 20.9
Source O 4.1 2.9 2.8 1.6 2.8
Source P 8.4 8.4 8.1 8.0 7.9
Source Q 9.7 9.7 9.7 9.6 9.6
Source R 10.3 10.2 10.2 10.1 10.1
Source S 1.9 2.0 1.9 2.0 1.9
Source T 6.4 6.5 6.5 6.4 6.4
Total 227 212 207 198 191
Table 7: Sourceworks Average Deployable Output

41
The peak week values have not been reduced because the Chickenhall input will be greater
during the critical period when demand for water is higher.
1 in 20: Dry
1 in 40: Historic
1 in 80: Extended
1 in 125: Serious
1 in 200: Severe
Source A 40.6 40.6 40.6 40.6 39.4
Source B 57.8 52.1 48.7 43.9 39.0
Source C 22.5 22.5 22.5 22.5 21.8
Source D 2.4 2.1 1.9 1.7 1.5
Source E 0.5 0.5 0.5 0.5 0.4
Source F 11.7 11.9 12.1 11.9 8.8
Source G 3.3 3.1 2.9 2.6 2.3
Source H 9.1 9.1 9.1 9.1 8.8
Source I 2.1 2.0 1.9 1.9 1.8
Source J 10.2 10.2 10.2 7.9 7.9
Source K 12.3 12.2 12.2 12.2 13.2
Source L 15.5 15.0 14.7 14.3 13.6
Source M 6.0 4.8 3.9 2.8 2.0
Source N 35.2 35.2 35.2 33.9 30.7
Source O 4.2 2.7 1.7 1.3 1.0
Source P 10.0 10.0 10.0 10.0 10.0
Source Q 12.4 12.1 11.6 11.7 11.2
Source R 13.5 13.1 12.5 12.6 12.0
Source S 2.5 2.5 2.4 2.5 2.4
Source T 8.5 8.4 8.0 8.2 7.8
Total 280 270 263 252 236
Table 8: Sourceworks Peak Deployable Output

42
1 in 20: Dry
1 in 40: Historic
1 in 80: Extended
1 in 125: Serious
1 in 200: Severe
Source A 40.1 45.0 45.0 39.7 32.4
Source B 56.4 42.6 41.3 44.8 61.8
Source C 21.0 20.9 20.8 20.8 14.6
Source D 0.9 0.5 0.5 0.5 1.2
Source E 0.5 0.5 0.5 0.5 0.3
Source F 8.9 9.2 9.1 9.1 5.9
Source G 1.9 1.9 1.9 1.9 1.2
Source H 9.3 9.1 9.1 9.1 6.5
Source I 1.6 1.5 1.5 1.5 1.7
Source J 10.4 7.5 7.1 8.3 8.1
Source K 11.6 11.6 11.5 11.5 11.0
Source L 16.1 15.1 14.9 15.2 13.1
Source M 4.6 1.9 1.7 2.4 4.3
Source N 26.8 26.6 26.5 26.5 18.6
Source O 2.8 0.4 0.3 0.7 5.1
Source P 10.3 10.2 10.2 10.1 7.1
Source Q 9.9 10.9 10.6 10.6 9.8
Source R 10.4 11.3 11.0 11.1 10.6
Source S 2.0 2.4 2.3 2.3 1.8
Source T 6.6 7.4 7.2 7.2 6.4
Total 252 237 233 234 222
Table 9: Sourceworks Minimum Deployable Output
3.2.13 Future Reviews of Deployable Output
In addition to linking the deployable output from the WRMP with the drought planning
scenarios, it would be sensible to co-ordinate work on the River Itchen. The use of the
Environment Agency groundwater model and Southern Water’s sustainability reductions will
need to be reviewed for the next plan.
With the requirement to plan for rarer droughts it will be necessary to do further work on
deepest available pumped water level. This will indicate if pumps can be dropped under
drought conditions to retain the deployable output. In some cases, the pump level will be
constrained by the presence of audits and critical fissures. Portsmouth Water will undertake
to carry out this work in time for the next Drought Plan/WRMP.

43
3.3 Sustainability Reductions
Reductions in deployable output can occur as a result of environmental investigations which
determine that abstraction has an adverse impact on the environment.
3.3.1 Previous Sustainability Reductions
The first sustainability reductions to affect the Company resulted from investigations into the
impact of abstraction in the Bishop’s Waltham area in the 1990’s where, it was determined
that Hoe Water Treatment Works impacted on the Moors SSSI. An options appraisal led to
the closure of Hoe in August 2003 and the development of Source D and Source G. These
satellite boreholes were developed in the confined chalk where there were no significant
impacts on surface water features.
3.3.2 Habitats Directive Review of Consents
The Habitats Directive Review of Consents was carried out by the Environment Agency in
2005. As a result of the review Portsmouth Water made changes to the following licences:
Source N
Source U
Source O
Source P
Source M
Source L
Source B
Source A
3.3.3 Further Habitats Directive Investigations
Following completion of the initial Habitats Directive Investigations, and having complied with
the Site Action Plans, Portsmouth Water was required to carry out further studies at a number
of sites. This involved further work on harbours and estuaries and was carried out by our
Consultants AMEC who produced a Final Report in March 2013. Portsmouth Water were
asked to study:
Hamble Estuary
Titchfield Haven
Hill Head Harbour
Fareham Creek
AMEC concluded that there were no adverse effects from abstraction on the Hamble Estuary.
They also concluded that there was no adverse effect on Titchfield Haven or Hill Head Harbour
but there might be an ‘in-combination’ effect. There are a number of spray irrigators which
abstract water from the River Meon and the ‘Canal’ at Titchfield Haven. The Environment
Agency chose to initially time limit Portsmouth Water’s Source F Licence until December 2017
to allow time for further investigations to take place.
Our understanding is that the spray irrigators were not approached until the end of 2014 and
one spray irrigator agreed to a voluntary licence reduction at that time. In January 2015 the

44
Environment Agency commissioned AMEC to undertake modelling of Titchfield Haven. This
was designed to show if there was an ‘in combination’ effect on the Haven or the Harbour in
relation to the internationally protected bird interests.
The modelling tested whether there was an in-combination effect on the protected features
at Titchfield Haven. The environmental criteria were:
Enough flow for habitats in Titchfield Haven
Some flow into Hill Head Harbour
Enough flow for upstream fish migration
The modelling concluded that reductions in the spray irrigation abstractions could reduce, but
not remove, the risk of impact on the special protection area (SPA) at Titchfield Haven.
Groundwater modelling shows that Portsmouth Water’s abstractions on the Meon have
relatively little impact on low flows. The Environment Agency, however, decided to impose a
temporary augmentation clause on the Source F licence which was reviewed in December
2015.
The temporary clause was due for re-assessment in December 2017 and Portsmouth Water
proposed alternative mitigation works at Titchfield Haven. These were rejected by the
Environment Agency and the augmentation clause will become permanent in December
2017. This has resulted in a deployable output reduction of 2.0 Ml/d in the WRMP for Source
F.
Fareham Creek is impacted by abstraction at Source I and Source J. At low flows it was agreed
that abstraction at Source I should be restricted to 1.5 Ml/d to ensure freshwater discharges
to the harbour. The Source I Licence was varied in May 2015 and the Deployable Output
Assessment has taken account of this restriction.
3.3.4 Water Framework Directive
The Water Framework Directive (WFD) has become the main driver for sustainability
investigations. The Environment Agency published the River Basin Management Plan in the
South East in December 2009, with the aim of returning all water bodies to ‘Good Ecological
Status’ (GES) by 2015. Where this is not practical for economic reasons, further deadlines
have been set for 2021 and 2027. Below is a map of the Portsmouth Water operating area
which shows the water bodies and their hydrological status.

45
High level information regarding these water bodies can be found in the Drought Plan
(Appendix ‘U’).
In 2010 Portsmouth Water asked AMEC to investigate the impact of abstraction on four water
bodies:
River Hamble
River Wallington
River Ems
River Lavant
An additional water body, Source T Rife, was added to the list in 2011 and the Environment
Agency chose to investigate three further water bodies:
River Meon
Bosham Stream
Fishbourne Stream
As part of the investigation Portsmouth Water set up a ‘Stakeholder Group’ which consisted
of the following regulators and NGO’s:
Environment Agency
English Nature
CC Water
Hampshire County Council
Hants and Isle of Wight Wildlife Trust
Sussex Wildlife Trust
AMEC concluded that the River Hamble was in relatively good condition but abstraction from
Source C will impact on the North Pond in Bishop’s Waltham and the water body just

46
downstream. Options for supporting flows in this section of river were considered in the NEP
(Section 3.3.6).
The Upper Wallington has little or no connectivity with groundwater at times of low flow. The
impact of abstraction on the ecology of the river is considered to be minor. The Lower
Wallington would only be impacted under ‘Fully Licensed’ conditions and then only in the area
of the tidal limit. Low flows are supported by discharges and the licence variation at Source I
(May 2015) included a limit on abstraction which will improve flows at the bottom of the
catchment.
AMEC concluded that the River Ems was impacted by abstraction but an augmentation
scheme went some way to mitigate this at low flows.
It was recommended that the augmentation scheme be reviewed and this was done in
association with the Environment Agency. Source U, which is adjacent to the River Ems,
became available as a raw water augmentation source. The works washout discharges into
the River Ems approximately 0.8km upstream from the original augmentation point. During
2013 and 2014 trials were carried out using the washout location and a raw water flow of
double the existing agreement. The majority of this augmented water reached the village of
Westbourne and continued down the River Ems to the tidal limit.
The Environment Agency expressed concern about the short circuiting of augmented water
back to the Source U. Under the flow conditions experienced in 2013 and 2014 this did not
seem to be the case. It is possible that under drier conditions, such as 1973 or 1976, not all
the augmented water would reach Westbourne. This was taken into account when the Source
N and Source U Licences were re-issued in April 2016. These licences are time limited to 2028
with the augmentation flow falling to the lower original flow and location if not renewed.
The River Lavant is naturally ‘ephemeral’ with periods of no flow in most years. The overall
ephemeral nature and extent is not affected by abstraction. The ecological data shows
relatively little sensitivity to the duration of wetting and drying with rapid recovery once flow
commences.
The Company believes abstraction within current licenses is sustainable under the Water
Framework Directive. A large number of licences have been varied and conditions set to
protect the environment. Since the 1980s overall abstraction has fallen significantly due to
leakage reductions and the decline of manufacturing in the area. Under drought conditions
the need for ‘Drought Orders’ or ‘Drought Permits’ has been carefully considered. The
environment will only be impacted during rare events when many features would naturally
be dry. Under extreme events the Secretary of State will determine what license conditions
can be overturned in the interest of public water supplies.
The WFD investigations were completed in March 2013 and the subsequent options
appraisals were completed in 2014 and included in the National Environment Programme
(NEP).
The outcomes from the WFD Investigations were considered in the WRSE Modelling.
Portsmouth Water believes that further sustainability reductions are unlikely and no
allowance has been made in the current WRSE modelling.
47
3.3.5 Water Resources in the South East
Portsmouth Water has been involved in Water Resources in the South East (WRSE) for many
years. This is a joint initiative to identify potential ‘Regional Solutions’ such as bulk supplies
between companies. WRSE undertook a modelling exercise, producing a base line solution
and a number of scenarios. Although the Baseline model only contains confirmed and likely
sustainability reductions other scenarios consider larger sustainability reductions.
3.3.6 National Environment Programme
The National Environment Programme (NEP) was set up by the Environment Agency to ensure
compliance with environmental legislation. In August 2012 the Environment Agency
published a list of possible environmental schemes based on the evidence available at that
time. With the publication of the PIM/WFD Investigations it was possible for the Environment
Agency to update the NEP programme. The Environment Agency published the National
Environment Programme (NEP) in August 2013.
The NEP spreadsheet contained proposals to review augmentation on the River Ems and to
consider river restoration work. The NEP also covered river restoration on the Hamble to
support abstraction at Source C. Portsmouth Water included these schemes in the WRMP
2014 and in the Business Plan 2014. The NEP Scheme was covered by an ‘Outcome Delivery
Incentive’ (ODI) in the Business Plan.
Portsmouth Water considered river restoration at two sites on the River Ems at Watersmeet
and Deep Springs. The Watersmeet site proved unsuitable for major restoration work due to
the presence of a large number of Water Voles. Portsmouth Water did assist with the de-
silting of an online pond and funded alterations to two control structures. The control
structures allow low flows to be diverted to the ‘Main River’ for the benefit of migrating fish.
At Deep Springs the river benefits from the revised augmentation flows and the channel was
suitable for restoration. Portsmouth Water worked with the local Rivers Trust to produce an
acceptable scheme. This included liaison with the land owners and regulators including
Natural England and the South Downs National Park. The work was completed in September
2015 and accommodated high flows that winter.
Collaboration with the Rivers Trust ensured that other schemes were developed downstream
with other landowners and funding sources. This has provided a real benefit in terms of fish
migration on the River Ems.
On the River Hamble the Environment Agency set out a range of measures that it wanted to
see. These included:
Bankside fencing
Installation of Woody Debris
Unfortunately due to issues with the land owners it was not possible to deliver these
measures. In association with the Rivers Trust and the Downs and Harbours Clean Water
Partnership alternative measures were developed. These included:
Silt traps
Road drainage improvements
Hard surface cattle crossings

48
Weir removal
These measures were approved by the Environmental Agency and implemented in the
summer of 2016 and 2017.
At Titchfield Haven Portsmouth Water initially assumed that variations to the spray irrigators
licences would ensure a sustainable outcome. In September 2015 the Environment Agency
informed Portsmouth Water that they intended to place a temporary augmentation clause
on the Source F Licence. This was challenged by the Company because of the loss of
deployable output. An offer of mitigation measures at Titchfield Haven was rejected and the
augmentation clause will become permanent in December 2017. The augmentation water is
provided by Source G and represents 2.0 Ml/d.
The licence variation at Source I was agreed without the need for further investigations or any
river restoration measures.
The ‘Catchment Partnerships’ which oversee implementation of the WFD schemes encourage
collaborative work with local stakeholders. Portsmouth Water has worked with the two
partnerships in its area of supply to help deliver the NEP schemes. Successful management
schemes have involved joint working with NGO’s and the regulators.
3.3.7 Water Industry National Environment Programme
The Water Industry National Environment Programme (WINEP) was published in September
2017 by the Environment Agency to ensure compliance with current environmental
legislation. Portsmouth Water has already complied with the majority of the sustainability
drivers. The key issue for Water Resources seems to be the prevention of deterioration of
Water Body status. The Environment Agency has suggested that Portsmouth Water should
study the following source works again:
Source O
Source L
Source M
Source J
Source N
Source F
Source A
Abstraction at all of these sites is considered to be sustainable by Portsmouth Water as we
have recently varied licences. Portsmouth Water have existing bulk supplies to Southern
Water and the WRMP contains proposals for the enhancement of one bulk supply and the
provision of a new one to South East Water. These bulk supplies will require additional
abstraction but the issue is whether these additional abstractions are damaging to the
environment. In the case of the enhanced bulk supply to Southern Water this is designed to
replace an existing unsustainable abstraction upstream on the River Itchen by Southern
Water.
Water for the bulk supply will be abstracted at Source A. This is also on the River Itchen but
it is downstream and in a more sustainable location. In the future the bulk supply will also be
supported by the development of Havant Thicket Reservoir. The reservoir will be filled with

49
water from Source B Springs. Abstraction at this location is also sustainable with Minimum
Residual Flow (MRF) conditions to protect the bird interests in Langstone Harbour.
The Environment Agency has also asked Portsmouth Water to investigate the impact of
tighter flow standards on the River Itchen. These flow standards are set out in the ‘Common
Standards Monitoring Guidance’ (CSMG) document but these are not a regulatory
requirement yet. They have not been the subject of a Regulatory Impact Assessment and the
Environment Agency has not provided any details for the River Itchen.
Using the flow simulation from the DO assessment it is possible to estimate the impact of the
tighter standard. Portsmouth Water think that all the impact will be at low flows and that it
will fall on Southern Water’s SRN Source A abstraction. This abstraction is upstream from
Source A and upstream from the Chickenhall WWTW discharge. Even under the lowest flow
conditions, Portsmouth Water should be able to abstract 20 Ml/d at Source A. If abstraction
is limited to this figure then the bulk supplies to Southern Water would be affected but not
the supply to Portsmouth Water.
The WINEP spreadsheet, which sets out the Environment Agency’s requirements, also
includes a new designation, the Solent and Dorset Coast SPA. Natural England have confirmed
verbally that this is a marine protection area designed to ensure feeding areas are available
for Terns. The associated harbours have already been investigated by Portsmouth Water and
the freshwater flows do not influence feeding Terns. We believe there is no justification for
any further investigations (See appendix ‘B’).
3.3.8 Sensitivity Tests
The planning guidance requires companies to consider scenarios to test its Plan. Portsmouth
Water has considered the sensitivity of the Plan to even lower deployable output. This could
be due to further sustainability reductions or to greater than expected climate change
impacts.
Section 8 considers a scenario where deployable output is reduced by a further 10% of the
end of the planning period.
3.4 Climate Change
For the WRMP 2019, Portsmouth Water has completely revised the assessment and the data
on which it is based. The WRMP requires companies to use UKCP09 data and the
methodology set out in the UKWIR report ‘Climate Change and Water Resources Planning’
(2012). In addition to this new guidance was issued in relation to forecasting river flows in
the 2080’s.
3.4.1 Vulnerability Assessment
The first stage of the methodology is to assess the vulnerability of the Company’s sources to
climate change impacts. Portsmouth Water employed AECOM to do the overall deployable
output assessment and they were assisted by HR Wallingford (HRW) for the climate change
work. The vulnerability assessment is based on information already available from previous
WRMP’s and Drought Plans.
HRW produced a vulnerability assessment summary table (see Appendix ‘C’) and this
concluded that the overall sensitivity was ‘medium’. This implied that a full climate change
assessment was not required but AECOM has carried out one anyway.

50
3.4.2 Climate Change Impacts on Surface Water
For the WRMP 2019, HRW have used the UKCP09 projections of climate change impacts. The
full set of data contains 10,000 projections of weather data but HRW advised the company
that a subset of 100 results represents the full range of uncertainty in the climate change
projections. HRW have set out how the sampling approach works and what the results look
like for the South East of England (Appendix ‘C’).
To apply the climate change projections to surface water flows the consultants used a
CATCHMOD surface water model developed for the River Itchen at Source A. The
Environment Agency provided baseline daily rainfall, potential evaporation and temperature
data from 1880 to 2005. This data was ‘perturbed’ using the monthly UKCP09 factors for the
100 selected samples and the model was run 100 times. A set of 100 river flow time series
were generated for the flow gauging sites at Allbrook and Highbridge (which are both
upstream of our abstraction) and these were then transposed to Riverside Park using a
regression relationship. Riverside Park is the gauging point at the tidal limit which is used to
control abstraction at Source A.
Figure 14 presents the potential impact of climate change on flows by 2080 for Allbrook and
Highbridge under a 'Medium' emissions scenario.
Figure 14: Climate Change Impact on Surface Waters
3.4.3 Climate Change Impacts on Groundwater
For the WRMP 2019, AECOM have produced a ‘Groundwater Level’ model which allows
groundwater impacts to be assessed in more detail. The sub set of 100 climate change
projections is used to perturb Well ‘X’ levels. Portsmouth Water uses this well to measure
the level of groundwater. The 100 groundwater levels are inserted into the ‘Resource Zone’
model, which calculates the abstraction rate at each source works. This relatively simple
approach to climate change impacts on groundwater has produced results that are consistent
with previous modelling. Climate change causes groundwater levels to fall and therefore
groundwater yields to fall also.

51
3.4.4 Combined Climate Change Impacts
When the surface water impacts at Source A are added to the groundwater impacts the
combined impact in 2044 is -0.92 Ml/d at average and -2.70 Ml/d at peak.
Year 2019 2024 2029 2034 2039 2044
ADO -0.04 -0.21 -0.39 -0.60 -0.75 -0.92
PDO -0.2 -0.70 -1.20 -1.70 -2.20 -2.70
Table 10: Climate Change Impact of on Deployable Output
The requirement to set out the water balance for drought events, in the WRMP, means that
the impact of climate change on rare events needs to be considered. This was not done for
the Drought Plan 2018 because it was considered to be an ‘operational plan’ and specifically
excluded climate change. It is likely that climate change will impact on rare events and more
work needs to be undertaken.
3.4.5 Headroom Allowance
The statistical approach to climate change produces a central forecast and a range of
uncertainty. This can be used to calculate the impact of climate change on deployable output
and feeds into the headroom assessment. (See appendix ‘F’)
For the WRMP 2019, AECOM have used the uncertainty data from HRW to populate the
Monte Carlo simulation. The guideline and the table definition require the climate change
element of headroom to be separated out. Headroom is described more fully in Section 5.2
and in Appendix F.
3.5 Outage Assessment
Outage is defined as a temporary loss of deployable output at a source works. It can relate to
planned or unplanned events and covers a wide range of influences from power failure to
short term pollution incidents.
3.5.1 Previous Outage Assessment
The outage assessments are based on the UKWIR methodology ‘Outage Allowances for Water
Resources Planning’ (1995). For the 2014 Plan, data was analysed for the period 2007-2012.
For the WRMP 2019, the assessment is based on data from 2007-2016. This ensures that the
outage is relevant for the following five year time step. Over a longer period outage will
continue to be influenced by power failure, system failure and pollution incidents.
3.5.2 Current Guidance
The guidance requires companies to pre-consult on the outage methodology if it is different
from the UKWIR methodology therefore Portsmouth Water did not need to pre-consult with
all the stakeholders but has shared the Draft Report with the Environment Agency.

52
3.5.3 Methodology
The methodology is set out in the report produced by AECOM and complies with the UKWIR
approach (see Appendix ‘D’). Historical data has been split into outage categories with
magnitudes and durations recorded. A Monte Carlo simulation is used to simulate outage in
the future having justified which events are ‘legitimate’. AECOM used a model called @ RISK
to carry out the simulation and have commented on the seasonal distribution of outage and
the repeatability of results. The risk percentiles and the relative contributions are set out in
the appendix.
3.5.4 Analysis of Recorded Data
Since 2007 Portsmouth Water’s operational staff has been maintaining a new record system
for actual outage. The outage register is in the form of a spreadsheet which records:
Start and end date and time
Site reference
Percentage of deployable output lost
Planned or unplanned events
Short term or long term shutdown
Classification and fault code
Since 2012 the Company have been recording outages of less than one day.
Figure 15: Outage Events by Month
Over the ten year period there were 4,563 outage events of which 19% were planned and
81% were unplanned. Less work is planned in the summer months when peak demands are
likely to occur.
3.5.5 Outage Assumptions
The analysis of future outage is based on events that are considered to be ‘legitimate’. If an
unplanned event lasts for more than 90 days it is capped at 90 days. This is because the works
may have shut down because it was not needed to meet demand rather than because of an
actual outage event. Additionally, events that have lasted for long periods, such as a
shutdown to reduce the risk of cryptosporidium, will have been resolved by capital
investment prior to the next plan.

53
For the current assessment the following events have been capped at 90 days:
112 day event at Source O caused by turbidity
365 day event at Source F caused by a system failure (Booster pump)
345 day event at Source G caused by a system failure (Telemetry)
128 day event at Source K caused by a system failure (Membrane)
149 day event at Source A caused by a system failure (Booster pump)
Most outage events at Portsmouth Water are considered to be all of the deployable output
at each site. This is because works shut down on alarms and are only re-started when supply
staff visit site.
Planned events are not included in the analysis of the critical period because maintenance is
not carried out in the peak week.
Significant outages related to cryptosporidium have been reduced with the provision of UV
treatment plants at Source Q and Source R.
Oil pollution has been included as a generic risk in headroom because it is considered to be
randomly related to individual works. Past pollution incidents at Source J, Source C, Source K
and Source R do not mean that these sites will be impacted again in the future.
The turbidity events can increase the risk of cryptosporidium risk because turbidity can mask
the presence of crypto oocysts. Cryptosporidium risk can be seasonal because it is linked to
lambing and surface run off.
The algae category has been dropped from the analysis because the problems at the River
Itchen works have been resolved. There is no algae risk at the groundwater sources.
The Monte Carlo simulation now involves 10,000 iterations rather than the 1,000 used
previously providing a more robust result.
3.5.6 Results
Outage allowances have been calculated for three scenarios:
Annual Average
Critical Period (Peak Week)
Minimum Deployable Output
A probability of 90% has been used and the results compared with the previous Plan.
Scenario WRMP 2014 WRMP 2019
Annual Average 9.3 14.7
Critical Period 4.6 12.5
Minimum Deployable Output 10.8 16.2
Table 11: Outage included in WRMP (Ml/d)
Outages is assumed to be higher than the previous plan because events shorter than one day
have been included.

54
Outage has been calculated for each works but the figures are not cumulative as all sites are
not assumed to be unavailable at the same time. The combined probability distributions are
provided in the detailed report (Appendix ‘D’).
3.6 Process Losses
Treatment works losses only apply to sources with more complex processes such as rapid
gravity filtration and membrane filtration. Portsmouth Water has two works with full
conventional treatment and two works with membranes for cryptosporidium removal. At
two works there is a compensation water condition in the licence but this raw water loss is
not included in process losses.
In general, complex treatment works such as Works A have losses of around 5% of DO. At
Works B, membrane filters have now been replaced with a UV treatment plant and losses
have fallen to less than 1%.
The following table summarises the process losses assumed for a Dry Year:
Source Works Treatment Average (Ml/d) Peak (Ml/d)
Works A Complex 1.9 1.9
Works B Complex 0.2 0.2
Source F Membrane 0.1 0.1
Source K Membrane 0.1 0.1
Source P Membrane 0.1 0.1
Total
2.4 2.4
Table 12: Process Losses
Portsmouth Water does not include treatment works losses in the calculation of deployable
output. Treatment works losses and raw water losses are entered as separate lines in the
WRMP Tables. The tables then combine these to give the overall process loss.
The River Ems augmentation flow has been removed from the process losses because it has
been be provided by raw water since 2015. The augmentation is provided by Source U which
has been removed from the overall DO assessment.
3.7 Bulk Supply Imports
The guidance requires companies to consider a wide range of supply options including bulk
transfers from other companies and third party suppliers. Portsmouth Water has been fully
involved in the WRSE modelling programme which included bi-directional flows in the existing
Southern Water bulk supply and potential bulk supplies from South East Water. That said,
these options are not required.
3.7.1 Whiteways Lodge (Southern Water)
The existing bulk supply from Portsmouth Water to Southern Water has an average and a
peak capacity of 15.0 Ml/d. Water is pumped from Source S Works to Whiteways Lodge and
then gravitates to SRN Source D Treatment Works. It would be possible to pump water from
SRN Source D to Whiteways Lodge and for the water to gravitate to Source S. From here it
could be pumped to Littleheath Reservoir using the existing booster pumps.

55
3.7.2 Clanfield (South East Water)
An option to transfer water from a South East Water Service Reservoir in Petersfield, to the
Portsmouth Water Service Reservoir at Clanfield was included in the WRSE model. This would
include high lift pumps at Petersfield and a pipeline across the South Downs to Clanfield. A
route was selected that would minimise the pumping head and minimise the environmental
impact on the chalk downs and ancient woodland. This option was not selected by the model
and South East Water did not offer a bulk supply to Portsmouth Water.
3.7.3 Third Party Supplies
No third party suppliers have contacted Portsmouth Water with a firm offer of supplies. The
Contact Plan (Appendix ‘T’) records the potential suppliers that Portsmouth Water
considered. Portsmouth Water already has two housing developments where a third party
delivers the water to the end user. In these cases, Portsmouth Water is retained as the bulk
supplier and there is no net increase in supply. It would be possible for a developer to install
effluent re-use and therefore create a nominal surplus for Portsmouth Water to use
elsewhere. This has not happened so far.
3.7.4 Bulk Supply Exports
Portsmouth Water already has a bulk supply export to Southern Water (as explained in
Section 4.9).
A second bulk supply to Southern Water is due to be commissioned in 2018. It would be
possible to use this bulk supply in reverse but under dry or drought conditions Southern Water
do not have a surplus. Under normal conditions this reversal does offer some additional
resilience to Portsmouth Water.
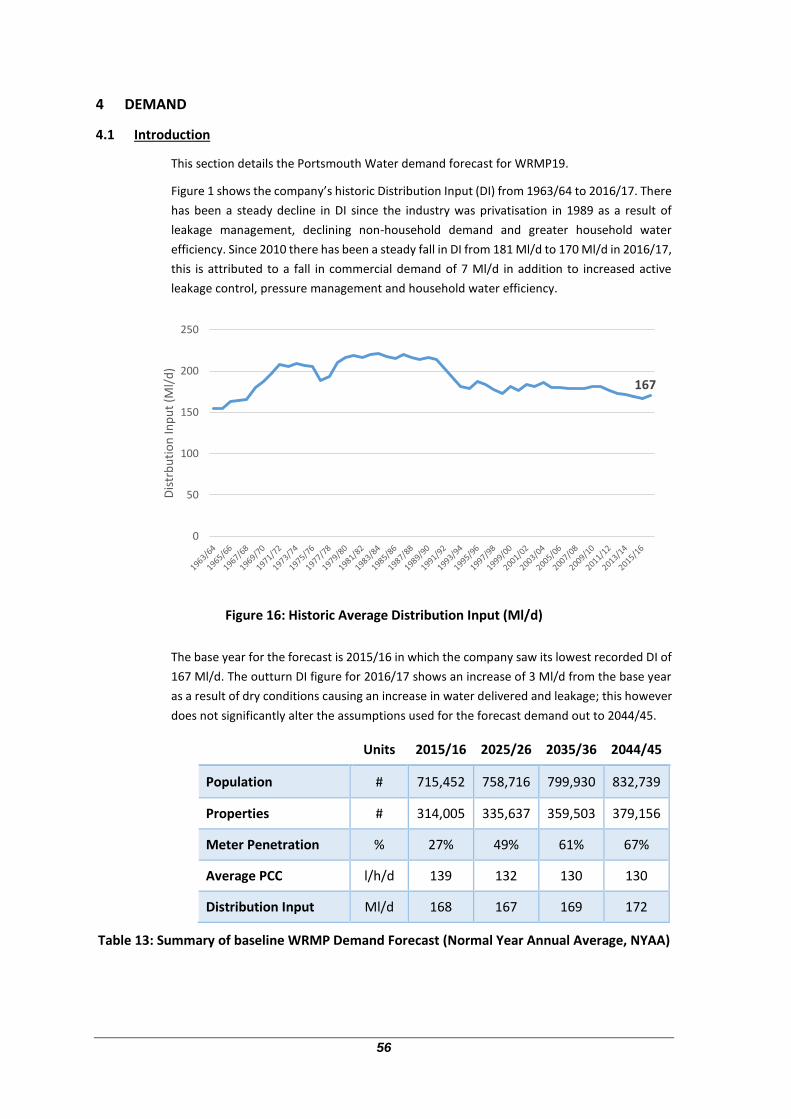
56
4 DEMAND
4.1 Introduction
This section details the Portsmouth Water demand forecast for WRMP19.
Figure 1 shows the company’s historic Distribution Input (DI) from 1963/64 to 2016/17. There
has been a steady decline in DI since the industry was privatisation in 1989 as a result of
leakage management, declining non-household demand and greater household water
efficiency. Since 2010 there has been a steady fall in DI from 181 Ml/d to 170 Ml/d in 2016/17,
this is attributed to a fall in commercial demand of 7 Ml/d in addition to increased active
leakage control, pressure management and household water efficiency.
Figure 16: Historic Average Distribution Input (Ml/d)
The base year for the forecast is 2015/16 in which the company saw its lowest recorded DI of
167 Ml/d. The outturn DI figure for 2016/17 shows an increase of 3 Ml/d from the base year
as a result of dry conditions causing an increase in water delivered and leakage; this however
does not significantly alter the assumptions used for the forecast demand out to 2044/45.
Units 2015/16 2025/26 2035/36 2044/45
Population # 715,452 758,716 799,930 832,739
Properties # 314,005 335,637 359,503 379,156
Meter Penetration % 27% 49% 61% 67%
Average PCC l/h/d 139 132 130 130
Distribution Input Ml/d 168 167 169 172
Table 13: Summary of baseline WRMP Demand Forecast (Normal Year Annual Average, NYAA)
167
0
50
100
150
200
250
Dis
trb
uti
on
Inp
ut
(Ml/
d)

57
Table 13 shows a summary of the demand forecast for the Normal Year Annual Average
(NYAA) scenario. Despite that total population is expected to increase by nearly 16% by
2044/45, overall DI is expected to remain relatively flat, falling over the period before
returning to 172 Ml/d by 2044/45.
Demand is supressed over the period as a result of baseline water efficiency, falling non-
household demand and the companies continued commitment to 5,000 meter optants per
year up to 2027/28. The 5,000 meters per year average target consists of traditional meter
promotion activities in addition to a new ‘not for revenue meters’ approach will start in
2018/19.
4.2 Demand Scenarios
The following demand scenarios are presented in this section.
Normal Year Annual Average Demand (NYAA): The annual average daily
value of demand under ‘normal’ weather conditions.
Dry Year Annual Average Demand (DYAA): The annual average value of
demand under dry conditions without any restrictions in place. For
Portsmouth Water this is considered to be a 1 in 20 year event and is
matched against a 1 in 20 year Deployable Output and the 1 in 20 Minimum
Deployable Output (MDO) scenario.
Dry Year Critical Period Demand (DYCP): the peak week in summer that
occurs during the Dry Year (1 in 20), this demand scenario is matched with
the Peak Deployable Output (PDO) scenario.
4.3 The Base Year
4.3.1 Demand Normalisation
Demand varies year to year as a result of long term changes such as leakage reduction, non-
household demand, water efficiency, metering and increasing properties and population.
Demand is also affected by weather which has a more immediate effect on consumption and
leakage.
Demand normalisation seeks to separate trend from the effects of weather so that an
estimate can be made of the demand that would have occurred in the base year had ‘Normal’
or ‘Dry’ conditions been experienced.
A weather demand model consistent with that described in the UKWIR ‘WRMP19 Methods –
Household Consumption Forecasting’ (UKWIR, 2016) guidance was developed that allows
historical weather data to be run through the base year to determine ‘what if the weather in
year X occurred again in 2015/16?
The model was developed using the following process:
1. Weekly company record of Distribution Input (DI) back to 1997/98 is combined with
rainfall and temperature data.
2. DI is decomposed into a smoothed trend element reflecting changes in the customer
base and leakage reduction.

58
3. A Random Forest regression, an effective non-linear statistical model, is fitted to the
trend and weather data.
4. The model is validated against the historical data.
5. The trend element is held as at 2015/16 whilst historical weather is run back through
the model.
6. The weekly simulated time series is aggregated to annual averages and annual
maximum DI (peak week).
7. Statistical distributions are fit to annual averages and annual maximums.
8. The 50th Percentile is used to represent the Normal Year whilst the 95th Percentile is
used to represent the Dry Year (1 in 20).
UKWIR WRMP19 Methods – Household Consumption Forecasting’ recommends removing
leakage from DI before modelling. A weekly time series of leakage for the period was
unavailable therefore could not be separated from DI. It is argued however that the impact of
this is relatively small as the variance of leakage will likely only account for up to 5% of total
variance in DI in any week. Additionally, long term leakage control will be reflected in the
trend element of the models whilst the leaks from bursts as a factor of weather will be
captured in the weather variables.
Portsmouth Water have not had any restrictions in the period 1997 to 2015 and so all years
are included in the analysis.
Figure 17 shows the model fitted to the historic data, the model appears to fit well.
Figure 17: Model fitted to historic Distribution Input
Figure 18 shows the normalised result, the blue line shows the historic line whilst the green
line is the estimation of what demand would be if that year’s weather happened again with
the current customer base and behaviours. The normalised line values produce a sensible
result with DI being lower than historic levels and less ‘peaky’ in nature. The NYAA and DYAA
figures were validated using a ‘Comparison of summer and winter consumption’ approach
150
160
170
180
190
200
210
220
230
240
250
Ml/
d
Outturn Modelled

59
from the ‘WRMP19 Methods – Household Consumption Forecasting’ (UKWIR, 2016) guidance
which produced a similar result.
Figure 18: Normalised Distribution Input Time series
Figure 19 shows the fitted statistical distribution for the annual average and annual peak from
which the 50th and 95th percentile are extracted, the results of which are presented in Table
14.
Figure 19 : Fitted Cumulative Distribution Functions; Annual Average (Left) Peak Week (Right)
Average Peak
Normal (q50) 168.1 197.5
Dry (q95) 170.6 213.5
Table 14: Normal and Dry Year Estimates of Distribution Input
150
160
170
180
190
200
210
220
230
240
250
Ml/
d
Outturn Simulated

60
Normalised DI is input into a water balance for a Normal and Dry Year in order to derive the
sub components, Table 15. The bottom-up Non-household and Household elements are
derived from regression models described later in this section.
Outturn leakage for 2015/16 has been increased by 5.14 Ml/d over the originally reported
figure of 28.18 Ml/d as a result of the industry wide leakage convergence project, the impact
of which is described later in this section.
A mild winter in 2014/15 lead to particularly low leakage levels, 6% below that of the company
target. For WRMP19 the company target has been used in place of the outturn 2015/16 figure.
The company leakage target for the period 2015/16 – 2019/20 is 30 Ml/d, this figure is
rebased to 35.14 Ml/d as a result of the convergence reporting.
Table 15 presents the water balances for the 2015/16 outturn, ‘Normal Year' and the 'Dry
Year'. The outturn uses the 2015/16 DI with the adjusted leakage figure with the other
elements also recast. The 'Normal' and 'Dry' balances use the DI output from the
weather/demand model with leakage set to the rebased target of 35.1 Ml/d in both instances.
2015/16
Outturn Normal Year Dry Year
Component Ml/d % Ml/d % Ml/d %
Unmeasured Households 86.5 51.6% 83.7 49.8% 85.0 49.8%
Measured Households 20.2 12.0% 21.5 12.8% 21.7 12.7%
Unmeasured Non-Households 0.2 0.1% 0.2 0.1% 0.2 0.1%
Measured Non-Households 33.8 20.2% 33.3 19.8% 34.2 20.1%
Distribution Losses 24.2 14.4% 26.6 15.8% 26.6 15.6%
Total Leakage 33.3 19.5% 35.1 20.9% 35.1 20.6%
Distribution System Operating Losses 0.4 0.3% 0.4 0.3% 0.4 0.2%
Water Taken Legally Unbilled 1.6 0.9% 1.7 1.0% 1.7 1.0%
Water Taken Illegally Unbilled 0.7 0.4% 0.7 0.4% 0.7 0.4%
Total 167.5 100% 168.1 100% 170.6 100%
Table 15: Outturn, Normal and Dry Year Water Balance

61
4.3.2 Customer Segmentation
4.3.2.1 Household Segmentation
Household demand is modelled at a Per Household Consumption (PHC) level for Measured
and Unmeasured customers. The model reflects new properties and movements of
population from unmeasured to measured status as a result of metering. Portsmouth Water
has an optant policy whereby customers are encouraged to switch to a meter, this is achieved
through meter promotion and in the future will include the installation of ‘not for revenue
meters’. It is assumed that some customers are more likely to switch to a meter than others
and most likely, those with a lower occupancy. Data was collated from occupancy surveys,
ONS demographic data sets and the company billing system to define 62 unique customer
types used to produce measured/unmeasured occupancy and to create a profile of customers
moving from the unmeasured customer base on to a meter.
ONS Demographic Super Groups (8 Groups)
Flat/Non-flat status (2 Groups)
Meter Optant/Non Meter Optant status (2 Groups)
New Property (Post 2004)/Existing Property (2 Groups)
Table 4 to Table 7 present the measured/unmeasured splits between each of the 4 factors.
Unmeasured Measured
Constrained City Dwellers 14% 8% Cosmopolitans 6% 4% Ethnicity Central 2% 1% Hard-Pressed Living 21% 12% Multicultural Metropolitans 3% 1% Rural Residents 7% 11% Suburbanites 20% 33% Urbanites 27% 30% Total 100% 100%
Table 16: ONS Demographic Super Groups
Unmeasured Measured
Non-Flat 85% 82%
Flat 15% 18%
Table 17: Flat/Non-flat status
Unmeasured Measured
Non Optant 100% 32%
Meter Optant 0% 68%
Table 18: Meter Optant/Non Meter Optant status

62
Unmeasured Measured
Existing Property 100% 68% New Property (Post 2004) 0% 32%
Table 19: New Property/Existing Property Status
4.3.2.2 Non-Household Segmentation
A ‘top down’ and ‘bottom up’ approach are both modelled to forecast non-household
demand whereby the ‘top down’ uses economic and weather factors to model total non-
household volumes whilst the ‘bottom’ up approach uses segmentations of the Non-
household customer base aggregated up to total NHH demand.
For the bottom up approach, 20 classification groups are used, 19 of which refer to Standard
Industry Codes (SIC) whilst 1 category represents the defence presence in the area. Figure 20
shows the split of measured non-household demand aggregated into 12 ONS categories based
upon 2015/16 volumes.
Figure 20: % Volume Split of Non-household Demand
0.2%
0.5%
1.0%
3.5%
5.0%
6.6%
8.4%
10.5%
11.1%
11.5%
18.5%
23.2%
Information and communication
Financial and insurance activities
Construction
Business service activities
Real estate activities
Production
Other services and household activities
Defence
Manufacturing
Agriculture, forestry and fishing
Public administration; education; health
Distribution; transport; accommodation and…

63
4.3.3 Base Year Population, Property and Occupancy Estimates
4.3.3.1 Base Year Household Population
Population and Properties data for WRMP19 was provided by Experian as part of a Demand
Forecasting in the South East (DFSE) club project with four other water companies ensuring
consistency with bordering companies South East Water and Southern Water in particular.
Table 20 shows that since WRMP14 there has been a relatively small reduction of less than
1% in the estimation of the company household population as a result of the WRMP19
population reassessment.
Table 20: WRMP14/WRMP19 Household Population Estimation
4.3.3.2 Base Year Household Properties
1.1. The number of household properties in the base year is held consistent with the company
billing system in 2015/16.
Measured Unmeasured Total
2015/16 Household Properties (Exc.voids)
210,156 78,509 288,665
Table 21: Base Year Household Properties
WRMP14 WRMP19 Difference
2015/16 Household Population 702,777 701,651 -1,126
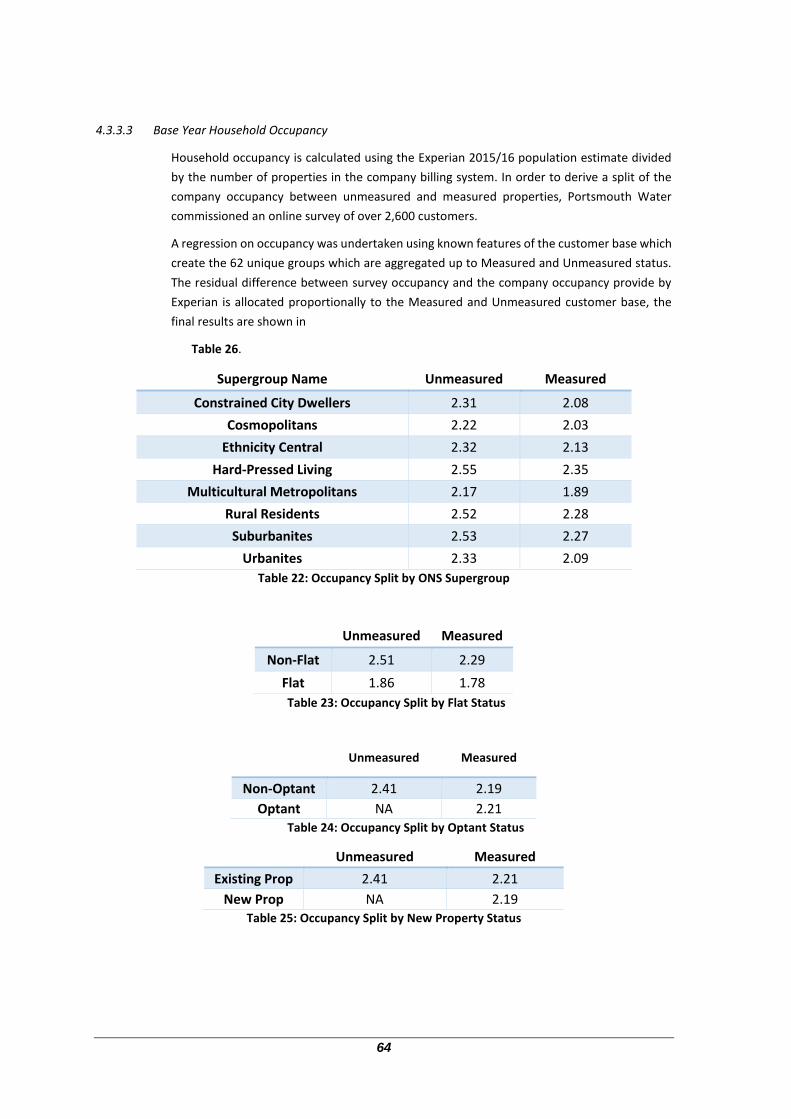
64
4.3.3.3 Base Year Household Occupancy
Household occupancy is calculated using the Experian 2015/16 population estimate divided
by the number of properties in the company billing system. In order to derive a split of the
company occupancy between unmeasured and measured properties, Portsmouth Water
commissioned an online survey of over 2,600 customers.
A regression on occupancy was undertaken using known features of the customer base which
create the 62 unique groups which are aggregated up to Measured and Unmeasured status.
The residual difference between survey occupancy and the company occupancy provide by
Experian is allocated proportionally to the Measured and Unmeasured customer base, the
final results are shown in
Table 26.
Supergroup Name Unmeasured Measured
Constrained City Dwellers 2.31 2.08
Cosmopolitans 2.22 2.03
Ethnicity Central 2.32 2.13
Hard-Pressed Living 2.55 2.35
Multicultural Metropolitans 2.17 1.89
Rural Residents 2.52 2.28
Suburbanites 2.53 2.27
Urbanites 2.33 2.09
Table 22: Occupancy Split by ONS Supergroup
Unmeasured Measured
Non-Flat 2.51 2.29
Flat 1.86 1.78
Table 23: Occupancy Split by Flat Status
Unmeasured Measured
Non-Optant 2.41 2.19
Optant NA 2.21
Table 24: Occupancy Split by Optant Status
Unmeasured Measured
Existing Prop 2.41 2.21
New Prop NA 2.19 Table 25: Occupancy Split by New Property Status

65
Unmeasured Measured Company Average
2.49 2.27 2.43
Table 26: Aggregated 2015/16 Occupancy by Measured/Unmeasured Status
4.3.3.4 Base Year Non-Household Population
Non-household/communal population refers to residential accommodation such as sheltered
accommodation units, student halls of residence, large hostels, hospitals and prisons.
Table 27 shows the comparison of WRMP14 Non-household population with the revised
Experian WRMP19 estimate to which there is a marginal difference. Non-household
population is not used as a factor in the Non-household demand forecast.
Table 27: Non-Household Population
WRMP14 WRMP19 Difference
2015/16 Measured Non-Household Population
12,940 12,574 -366 (-2.8%)
2015/16 Unmeasured Non-Household
Population 1,262 1,376 114 (9.0%)

66
4.3.3.5 Base Year Non-Household Properties
In 2015 and 2016 a data cleansing exercise was undertaken to align the company billing
system with the Ofwat guidance on eligibility for the opening of the non-household retail
market which saw some relatively small movements between household and non-household
classifications. It is these values which are reflected in WRMP19.
Figure 21 shows the trend in measured and unmeasured non-household properties since
2010. There has been a steady decline in the number of non-household properties in both
groups with the effect of the data cleansing activity is largely unapparent as the movement
between household and non-households is broadly equal. Furthermore, there is no significant
impact of the cleaning exercise on total non-household volumes with standard variability
observed between years, this may be unsurprising as those contestable properties are
typically low users; home businesses, cattle troughs, bin stores etc.
Figure 21: Historic Outturn Non-Household Properties
The drop in measured properties in 2013/14 is a result of a change in the company billing
system when significant data cleansing occurred.
17,469 17,110 16,709
14,243 14,663 14,189 13,951
2,042 1,937 1,853 1,663 1,595 1,553 1,689
-
2,000
4,000
6,000
8,000
10,000
12,000
14,000
16,000
18,000
20,000
2010-11 2011-12 2012-13 2013-14 2014-15 2015-16 2016-17
Tota
l No
n-h
ou
seh
old
Pro
per
ties
Measured Unmeasured

67
4.3.4 Base Year Per Capita Consumption (PCC)
Unmeasured PCC has shown a steady decrease from 160 l/h/d in 2009/2010 to 146 l/h/d in
2015/16 whist measured PCC has remained almost flat since 2009/2010 with a slight
increasing trend from 2013/14. A step change can be observed in 2012/13 in both
unmeasured and measured PCC as a result of revised population figures. Figure 16 displays
the trend in PCC, note that these are not the historically reported PCCs but revised PCC that
account for the change in the water balance as a result of the leakage convergence project.
The base year PCCs under Normal and Dry Year conditions are calculated via a base year water
balance whereby the DI output by the weather-demand model is balanced with the bottom
up regression model of the sub components of DI. A good balance is provided with an error
of just 1%.
Figure 22: Per Capita Consumption (PCC)
For WRMP19 regression models where developed for Measured and Unmeasured PHC which
reflect factors including changes in the customer base and weather variations. Reductions in
PHC as a result of water efficiency and water using device replacement are treated outside of
the model using assumptions largely based upon modified DEFRA Market Transformation
Programme forecasts. Percentage reductions are assumed using the splits of measured and
unmeasured PCC shown. The Splits of PCC are based upon the WRc Compendium of Micro
Components (WRc, 2012).
2009-2010
2010-2011
2011-2012
2012-2013
2013-2014
2014-2015
2015-2016
Outturn Measured 116 117 112 122 110 111 117
Outturn Unmeasured 159 153 151 147 151 150 146
Normal Year Measured 111
Normal Year Unmeasured 148
Dry Year Measured 113
Dry Year Unmeasured 150
100
110
120
130
140
150
160
170l/
h/d

68
Figure 23: Breakdown of Base Year per Capita Consumption (PCC)
4.3.5 Base Year Leakage impact on PCC
For WRMP19 Portsmouth Water are using the rebased leakage figure as a result of the Ofwat
Leakage Convergence Project which has seen an increase of 5.14 Ml/d on the pre-MLE leakage
figure. The result of the project brings the base year leakage figure up from 30 Ml/d to 35.14
Ml/d. This does not significantly alter the baseline demand forecast as the new leakage figure
feeds into the NYAA and DYAA water balance. As a result of the increase in leakage, Normal
Year 2015/16 PCC falls from 145 l/h/d to 139 l/h/d (-4.3%).
42.6
35.0
23.9
18.4
12.89.7
2.2 1.8 0.4
28.424.9
11.915.7
28.5
1.8 1.7 1.7 0.20
5
10
15
20
25
30
35
40
45
Toilet Tap Bath WashingMachine
Shower External Tap Dishwasher Unknown WaterSoftener
l/h
/d
Unmeasured Measured

69
4.4 The Demand Forecast
4.4.1 Household Property & Population Forecast
The forecast of Properties and Population was undertaken by Experian and commissioned by
the Demand Forecasting in the South East (DFSE) group consisting of five water companies.
Neighbouring companies South East Water and Southern Water are included within the DFSE
group providing consistency at the company boundary. A full copy of the Experian report is
available in appendix G.
For WRMP19 Experian produced a Trend based, Plan based, Econometric and a Most-
likely/Hybrid forecast.
Trend: Represents growth if recent trends (5 to 6 years) in terms of demographic change
(births, deaths and migration) and long-term household formation patterns continue
into the future
Plan Based: show the expected growth if local authorities are able to deliver the
dwelling targets set out in their plans
Econometric: forecast is designed to determine what growth would be expected once
economic factors are taken into account
In WRMP14 a similar approach was taken. The WRMP14 results of the projected population
and household estimates against the outturn for the period 2011-2015 are in
Table 28. The outturn population projection was closest to the trend and most-likely
estimations which had an error of 0.1%. Outturn household forecast was closest to the plan
and most-likely/hybrid estimation, both with an error of 0.1%.
Forecast % population growth,
2011-2015 % household growth,
2011-2015
WRMP14 Trend 3.0 3.6
WRMP14 Plan 2.3 2.8
Outturn 2.9 2.7
Table 28: WRMP14 Projections comparison with Outturn
In WRMP19 there is a requirement that water companies must take account of planned
growth. For WRMP Portsmouth Water intend to meet this requirement however will not be
directly using a Plan based forecast, instead a Trend based method is used.

70
Figure 24: New Household Connections per Year
The Trend based approach is used over a Plan based approach as it provides a smoother, more
reasonable connection profile compared to the recent outturn in new property connections
whilst delivering a very similar amount of properties over the forecasted period.
Total new properties 2016/17 to 2044/45
Average New properties per year
2016/17 to 2044/45
Trend 73,082 2,520
Plan 73,610 2,538
Econometric 65,521 2,259
Hybrid 60,360 2,081
Table 29: New Household Properties
Figure 25 and Figure 26 show the forecasted property and population figures for WRMP19
using the Trend based approach. An average of 2,520 new properties are expected per year
leading to 73,082 new properties by 2044/45, growth of 35% on 2015/16 household property
counts (exc voids).
Population is expected to increase by 111,627 over the period, a growth of 16% on the
2015/16 population.
0
500
1000
1500
2000
2500
3000
3500
4000
New
Pro
per
ties
per
Yea
r
Trend Plan Econometric Outturn

71
Figure 25: Household Property Forecast
Figure 26: Household Population Forecast
New housing is expected to outstrip new population growth in the region resulting in
occupancy falling from 2.43 in 2015/16 to 2.25 by 2044/45.
260,000
280,000
300,000
320,000
340,000
360,000
380,000
Ho
use
ho
ld P
rop
erti
es
Outturn Household Properties Trend Forecast
600,000
650,000
700,000
750,000
800,000
850,000
Ho
use
ho
ld P
op
ula
tio
n
Outturn Population Trend Population Forecast

72
Figure 27: Household Occupancy Forecast
2.15
2.20
2.25
2.30
2.35
2.40
2.45
2.50
Ho
use
ho
ld O
ccu
pan
cy
Outturn Occupancy Projected Occupancy

73
4.4.2 Baseline Metering Policy
Table References: 45.2BL, 45.6BL
Figure 28: Meter Optants 2007/08 to 2016/17
In 2012 the Environment Agency produced a revised assessment of ‘Water Stress’. This
assessment is referred to in the legislation for compulsory metering and the 2017 Directive
requires Water Companies to consider this option if their area of supply is ‘Seriously Water
Stressed’. Portsmouth Water’s area of supply is only ‘Moderately Water Stressed’ and Defra
have confirmed verbally, in April 2017, that the Company cannot legally compulsory meter its
domestic customers.
Portsmouth Water currently has an optional metering programme where unmeasured
customers are encouraged to switch to a meter using promotional activities. In WRMP14
Portsmouth Water committed to 5,000 meter optants per year. In the first two years of the
plan, despite additional promotional efforts by the Company to increase the uptake of
metering, the outturn number of optants has fallen below the target (Figure 28).
Since 1990 Portsmouth Water has been installing meter boxes when conducting mains
renewal activity. There are an estimated 68,000 unmeasured properties whom have an
existing meter box and therefore can cost effectively have a meter installed without the
requirement for excavation. From 2018/19 Portsmouth Water will seek to attract more
customers onto a meter by using a dual-billing style approach referred to as ‘Metering not for
revenue’ whereby unmeasured customers whom have an existing meter box will be fitted
with a meter and will be encouraged to switch by offering comparative bills and water
efficiency advice.
For WRMP19 the number of meter optants achieved through promotional activities is
expected to fall away whilst the deficit of the 5,000 meters will be met using a dual billing
approach, Figure 29. A meter uptake rate of 1/3 of dual billed customers is expected until the
initial 68,000 customer base is exhausted in 2027/28. From 2025-26 metering falls back to
promotional activities in addition to those dual billing customers achieved through mains
renewal activity.
0
1,000
2,000
3,000
4,000
5,000
6,000
New
Met
er O
pta
nts
Outturn Target

74
Figure 29: Meter Optant Baseline Policy
4.4.3 Per Household Consumption (PHC) /Per Capita Consumption (PCC) Forecast
Table References: 29BL, 30BL, 31BL
For WRMP19 a mix of methods suggested in the ‘Household Consumption Forecasting
(UKWIR 2016)’ has been used. Whilst a Regression Model is used to reflect changes in the
customer base, percentage reductions in micro-components are used to adjust the forecast.
The Regression models are modelled on Measured and Unmeasured PHC. PHC was selected
over PCC as it is not sensitive to changes in population estimates. A range of variables were
trialled which included changes in the customer base: new properties, meter optants, meter
penetration, occupancy rates. The inclusion of weather variables also allow for Dry Year
estimates for PHC to be calculated and fed into the NYAA and DYAA water balance.
Table 30 below shows the variables that were included in the final models in addition to the
Mean Absolute Percentage Error (MAPE), a measure of the predictive accuracy of the
regression models on the outturn data.
Group Predictor Variables Mean Absolute % Error
Unmeasured PHC Unmeasured Occupancy Total Rainfall (Annual)
Total Dry Days (Annual) Average Summer Max
Temperature
0.80%
Measured PHC Meter Penetration Occupancy change (Dummy
variable to capture post 2015 occupancy reassessment)
1.71%
Table 30: Summary of Regression Models
0
1000
2000
3000
4000
5000
6000
New
Met
er O
pta
nts
Promotional Dual Bill

75
Whilst changes in the customer base are included within the regression models, reductions in
consumption as a result of water device replacement are handled outside of the model using
litre reductions in PHC/PCC in each year, Figure 30 and Figure 31. Volume reductions are
based upon Defra Market Transformation Program (MTP) baseline reductions although some
adjustments have been made, for example reductions associated with toilet flushing have
been reduced by 8pp as newer dual flush toilet systems have been shown to leak leading to a
reduced benefit. By 2044/45 Unmeasured PCC is expected to fall by 11.1 l/h/d as a result of
device replacement, largely due to reduced volumes in bathing and replacement of single
flush toilets. Measured PCC is expected to remain mostly unchanged with a total reduction of
0.2 l/h/d by 2044/45.
The impact of climate change on PHC/PCC is also treated outside of the PCC model. PCC is
expected to increase by 0.7 l/h/d and 0.9 l/h/d by 2044/45 for Measured and Unmeasured
customers respectively. These assumptions align with the ‘Impact of Climate Change on Water
Demand’ guidance (UKWIR, 2012) assumptions for a water company operating in the South
East of England.
Figure 30: Cumulative change in consumption (Measured PCC)
-10
-8
-6
-4
-2
0
2
4
6
8
10
l/h
/d
Tap Toilet Shower
Bath Washing Machine Dishwasher
External Tap Water Softener Unknown

76
Figure 31: Cumulative change in consumption (Unmeasured PCC)
The difference in PCC as a result of changes the customer base, device replacement and
climate change adjustments are presented in Figure 32.
Unmeasured PCC is expected to fall from 147.9 l/h/d in 2015/16 to 139 l/h/d by 2044/45,
largely as a result of device replacement. Measured PCC is expected to show a steady increase
from 111.4 l/h/d to 125.7 l/h/d in 2044/45 as metered properties become occupied by less
efficient households than the existing new property/meter optant customer base with
increased meter penetration. Average PCC falls over time and becomes increasingly weighted
to the Measured PCC. By 2029-2030 the rate of unmeasured customers moving to the
measured customer base slows as all customers that are likely to have opted through the dual
billing exercise would have been metered and the number of meter optants falls back to those
achieved through promotional activities.
In 2035/36 the company average PCC falls to 130 l/h/d, the Defra aspiration for per capita
consumption.
A small reduction of 5% in unmeasured PCC is expected as a result of those customers who
are dual billed and change their behaviour without switching to a meter.
-10
-8
-6
-4
-2
0
2
4
6
8
10
20
15
/16
20
16
/17
20
17
/18
20
18
/19
20
19
/20
20
20
/21
20
21
/22
20
22
/23
20
23
/24
20
24
/25
20
25
/26
20
26
/27
20
27
/28
20
28
/29
20
29
/30
20
30
/31
20
31
/32
20
32
/33
20
33
/34
20
34
/35
20
35
/36
20
36
/37
20
37
/38
20
38
/39
20
39
/40
20
40
/41
20
41
/42
20
42
/43
20
43
/44
20
44
/45
l/h
/d
Tap Toilet Shower
Bath Washing Machine Dishwasher
External Tap Water Softener Unknown

77
Figure 32: Forecasted NYAA PCC
100
110
120
130
140
150
160
170
l/h
/d
Outturn Measured NYAA Measured Outturn Unmeasured
NYAA Unmeasured Outturn Average NYAA Average

78
4.4.4 Leakage
Leakage, water abstracted and treated but not delivered to customer’s taps is of significant
concern to the Company and its customers. The amount of water lost through leaks in
customer’s pipes ideally would be zero. However the reality is that the majority of water lost
is as a result of leaks that occur on underground pipes without the water rising to the surface.
The leaks that do result in water being visible on the surface are easy to identify and
consequently are repaired quickly and are not a significant proportion of the leakage reported
by companies.
Leakage reduction activities involve companies’ identifying and reporting the ‘non-visible’
leaks through various techniques. These include reducing the pressure in the system which
reduces the flow of water from leaks, which stops new leaks developing active leak detection
activities and replacing old pipes which have recurrent failures. The Company seeks to
balance the cost of leakage reduction activities against the cost of the water lost through the
leaks. In assessing both of these costs, the Company considers externalities such as the
carbon cost of pumping and treating water, and the benefit to the environment of not
abstracting the water. The point at which the costs of the water lost through leakage is equal
to the cost of reducing leakage further is known as the sustainable economic level of leakage
(SELL). The Company’s leakage should not rise above this point, however the Company should
consider if their leakage forecast should be below the SELL, for example if customers place a
value on this and would be willing to pay for a lower level of leakage.
4.4.4.1 New Leakage Methodology
The Government’s ‘Guiding Principles’ for Water Resource planning states that leakage should
not rise at any point in the planning period. At the same time a new methodology has been
produced to ensure that there is consistent reporting between companies. For Portsmouth
Water the new methodology produces higher outturn leakage figures and also a higher
Sustainable Economic Level of Leakage (SELL). This does not represent a deterioration in
terms of leakage control, only a rebasing of the figure. The WRMP is based on the new
methodology and Ofwat reporting will follow in 2020. Historic leakage performance has been
re-based to be consistent with the new approach. Distribution Input does not change,
therefore historic per capita consumption figures are lower to compensate.
4.4.4.2 Leakage Assessment for the Last Plan
The current leakage assessment was undertaken at the same time as a review of leakage
management by Portsmouth Water. The Company engaged Tooms Moore Consulting to
undertake a full SELL appraisal which included a review of the marginal cost of water. Tooms
Moore are also the consultants undertaking the independent leakage review and this allowed
them to understand the uncertainty in the leakage calculation and deal with it appropriately
in the plan.
4.4.4.3 Current Leakage Assessment
The current leakage assessment was also undertaken by Tooms Moore Consulting and was
based on the new methodology. A full SELL appraisal was based on the latest marginal cost
of water. This reflects variable costs, such as power and chemicals, and the most expensive
source. If water is saved through leakage control it is assumed that abstraction at the most
expensive source is reduced (appendix ‘K’).
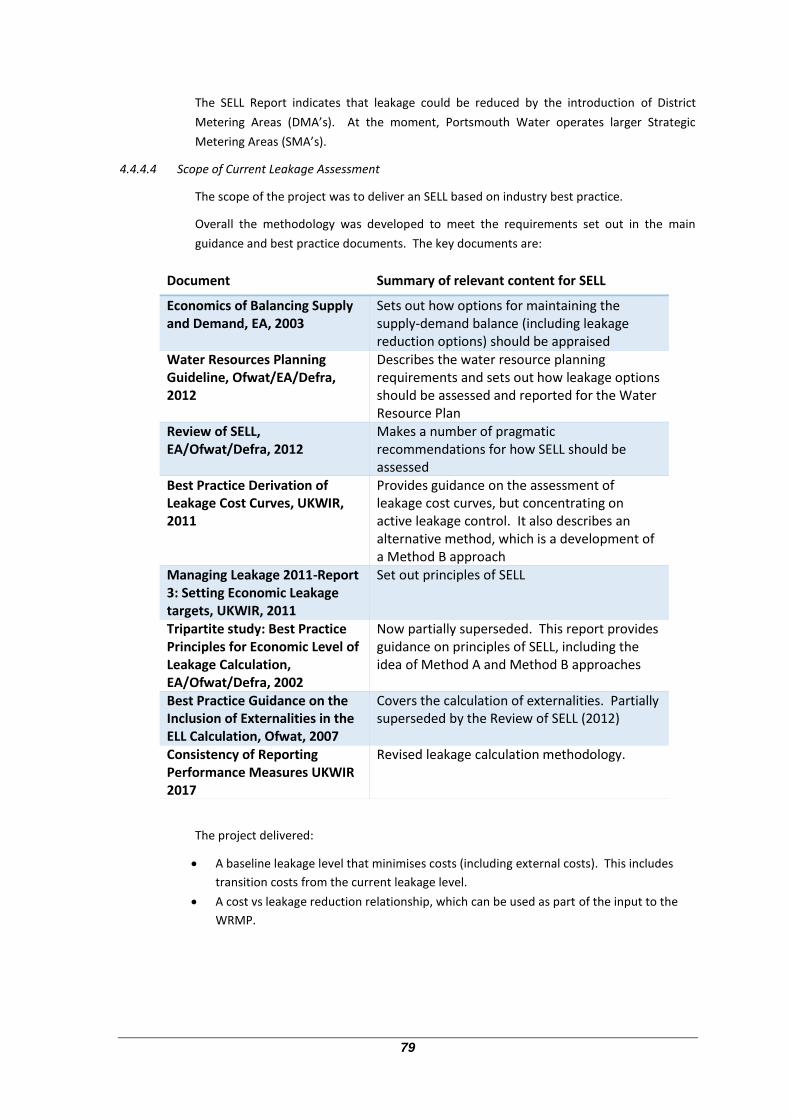
79
The SELL Report indicates that leakage could be reduced by the introduction of District
Metering Areas (DMA’s). At the moment, Portsmouth Water operates larger Strategic
Metering Areas (SMA’s).
4.4.4.4 Scope of Current Leakage Assessment
The scope of the project was to deliver an SELL based on industry best practice.
Overall the methodology was developed to meet the requirements set out in the main
guidance and best practice documents. The key documents are:
The project delivered:
A baseline leakage level that minimises costs (including external costs). This includes
transition costs from the current leakage level.
A cost vs leakage reduction relationship, which can be used as part of the input to the
WRMP.
Document Summary of relevant content for SELL
Economics of Balancing Supply and Demand, EA, 2003
Sets out how options for maintaining the supply-demand balance (including leakage reduction options) should be appraised
Water Resources Planning Guideline, Ofwat/EA/Defra, 2012
Describes the water resource planning requirements and sets out how leakage options should be assessed and reported for the Water Resource Plan
Review of SELL, EA/Ofwat/Defra, 2012
Makes a number of pragmatic recommendations for how SELL should be assessed
Best Practice Derivation of Leakage Cost Curves, UKWIR, 2011
Provides guidance on the assessment of leakage cost curves, but concentrating on active leakage control. It also describes an alternative method, which is a development of a Method B approach
Managing Leakage 2011-Report 3: Setting Economic Leakage targets, UKWIR, 2011
Set out principles of SELL
Tripartite study: Best Practice Principles for Economic Level of Leakage Calculation, EA/Ofwat/Defra, 2002
Now partially superseded. This report provides guidance on principles of SELL, including the idea of Method A and Method B approaches
Best Practice Guidance on the Inclusion of Externalities in the ELL Calculation, Ofwat, 2007
Covers the calculation of externalities. Partially superseded by the Review of SELL (2012)
Consistency of Reporting Performance Measures UKWIR 2017
Revised leakage calculation methodology.

80
The activities that were assessed as part of the SELL were:
Changing Active Leakage Control (find and fix) (ALC). - This could include changed
detection technology, improvements in management systems, changes in the number of
detection staff and reconfiguration of SMAs and DMAs to improve efficiency.
Changing pressures by the use of control valves or pumps. - This will include pump
control, changed PRV control, new PRVs and zone reconfiguration.
Infrastructure renewal. - This includes mains, communication pipes, supply pipes and
possibly service reservoirs. Activities are likely to be targeted on particular assets with
known poor performance.
Management of repairs. - This is mainly about shortening repair time for reported and
detected leaks by changed systems and increased repair resources.
The Company also undertook a further assessment of the approach to assessing policy
minimum, the details of which are included in Appendix ‘K’. This assessment identified the
uncertainty associated with policy minimum assessment which is presented in the report.
4.4.4.5 Marginal Cost of Water
The marginal of cost of water was assessed as part of the project and took into account:
Operating cost savings seen by the Company; typically power and chemicals costs.
Capital deferral seen by the Company if supply-demand investment is required within
the planning horizon. This component is excluded if the Company undertakes a least
cost planning exercise to avoid double counting the benefit of deferral.
Environmental benefit of reduced abstraction.
Carbon cost saving, typically driven by the electricity saving due to less pumping.
4.4.4.6 Short Run SELL
The SELL assessment concludes that the SELL is in the range of 32.0 to 39.9 Ml/d with the
central point being 34.1 Ml/d. The range in the SELL reflects the uncertainty in the underlying
data.
The Company has decided to set an initial leakage target of 35 Ml/d based on this SELL
assessment reducing to 30 Ml/d in 2025.
4.4.4.7 Baseline Leakage Forecast
Over the planning period the level of leakage will change as a result of increased customer
metering which can be expected to reduce supply pipe leakage. The Company is also
expecting a growth in the number of properties over the planning period which is likely to
result in an increase in the length of mains and the number of connections which will result
in a rise in leakage. Furthermore, it is reasonable to expect that there will be improvements
in efficiency and advances in leakage detection technology over the planning period and this
is likely to result in a reduction in the costs of leakage management and a corresponding fall
in the SELL.
Ofwat have stated that SELL does not necessarily drive sufficient efficiency improvements or
innovation. They have suggested that all companies could make the same percentage
reduction in total leakage. This reduction should be achieved during the first five years of the
next Plan.

81
To ensure that the water balance stays in surplus in the early years of the Plan, it may be
necessary to reduce leakage as soon as possible. This could be done as a baseline activity or
as a demand management option.
The Company has to take account of these factors when forecasting the baseline level of
leakage. The Company believes that it is reasonable to expect the increase in leakage from
growth in the distribution network to be offset by expected gains in efficiency and technology.
It is reasonable to expect that the savings resulting in supply pipe leakage from the metering
of customers to be reflected in the leakage forecast. The Company has allowed for this benefit
in their baseline leakage forecast which results in a falling leakage forecast over the planning
period. This is illustrated in the graph below.
Figure 33: Total Leakage Forecast
Figure 34: Leakage per property per day
4.4.4.8 Customer Supply Pipe Leaks
The leakage figure reported by Portsmouth Water includes water that is lost through
customers supply pipes. Portsmouth Water undertakes leakage detection activity to identify
these leaks or customers sometimes become aware of the leaks themselves. The Company
0.0
5.0
10.0
15.0
20.0
25.0
30.0
35.0
40.0
Ml/
d
Measured Non Household - USPL Unmeasured Non Household - USPL
Measured Household - USPL Unmeasured Household - USPL
Void Properties - USPL Distribution Losses
0
20
40
60
80
100
120
140
l/p
rop
/d
Outturn Forecast

82
continues to offer up to 2 free supply pipe repairs or a subsidised replacement of the supply
pipe.
Supply pipe leakage tends to be lower on measured properties than on unmeasured
properties. If a leak occurs on a measured property customers will notice the step change in
the volume consumed. Also when a customer opts for a meter a check is undertaken on the
customer’s supply pipe. Consequently the leakage forecast falls over the period to take
account of the reduction in supply pipe leakage as a result of the number of customers opting
for a meter.

83
4.5 Non-Household Demand Forecast
For the Non-household demand forecast two approaches were applied; a Top-Down and a
Bottom-Up linear regression forecast.
Both methods utilise the same data sources; local weather factors (temperature and rainfall)
in addition to regional Gross Value Added data by SIC code which reflect the changes in local
economic conditions. The Top-Down model consists of a single model regressed on the total
Measured Non-Household volumes for the period 2005 to 2015. The Bottom-Up model
consists of 21 sub models for different SIC groups which utilise a subset of economic factors.
The resulting estimates of future Non-household demands are presented in Figure 35. The
two forecasts provided differing projections on Non-household demands. The Top-Down
forecast shows demand falling rapidly from 35 Ml/d to 24Ml/d in 2044/45. The Bottom-Up
forecast shows Measured Non-household demand to remain flat with a small increase of
0.8Ml/d by the end of the period. Since both models performed well against the historic data
and produce reasonable forecasts, a hybrid approach is adopted for WRMP19 which is simply
an average of the two models.
Portsmouth Water has engaged with Castle Water, the largest Non-household retailer in the
company area. Whilst water efficiency activities are planned by Castle Water, the scale of the
savings are largely unknown. Reductions as a result of retailer water efficiency activities are
not specifically included in the model however water efficiency will be somewhat captured
within the regression models although not included as a specific factor.
Portsmouth Water has also engaged with the West Sussex Growers Association regarding the
growth of horticultural activities in the area of supply. Whilst growth between 5% to 10% is
expected per year, this will be met with greater water efficiency activities in addition to some
reliance on the growers own resources. No additional growth on top of that implicit within
the regression models is assumed over the planning period.
Figure 35: Measured Non-Household Demand Forecast
0.0
5.0
10.0
15.0
20.0
25.0
30.0
35.0
40.0
45.0
20
04
/05
20
06
/07
20
08
/09
20
10
/11
20
12
/13
20
14
/15
20
16
/17
20
18
/19
20
20
/21
20
22
/23
20
24
/25
20
26
/27
20
28
/29
20
30
/31
20
32
/33
20
34
/35
20
36
/37
20
38
/39
20
40
/41
20
42
/43
20
44
/45
Ml/
d
Outturn Bottom Up Top Down Hybrid

84
Unmeasured non-household demand makes up less than 1% of demand and is assumed to
stay at the same rate over the planning period at 0.17 Ml/d.
The UKWIR Impact of Climate Change on Water Demand (UKWIR, 2012) guidance suggests
that there is little evidence to suggest that climate change will have an influence on Non-
household water demand therefore no increase is applied.
4.6 Other Components of Demand
Table References: 32BL, 33BL
Other components of demand include
Distribution System Operating Usage (DSOU) – Water run to waste such as that used for the
purpose of mains flushing.
Water Taken Unbilled – Includes water legally and illegally unbilled. Legally unbilled water
includes water used for firefighting purposes whilst water illegally unbilled includes void
properties which are actually occupied.
Water Taken Unbilled and Distribution System Operational Usage is assumed to stay at the
same rate over the period at 2.42 Ml/d and 0.43 Ml/d respectively.

85
4.7 The NYAA and DYAA Scenario
Figure 36: Baseline NYAA & DYAA Forecast
Demand is expected to remain broadly flat up to the end of the planning period. Demand
continuously falls until 2025-26 when demand reaches 167.3 Ml/d under NYAA conditions,
this is a combined result of falling measured non-household demand and the movement of
5,000 unmeasured properties onto a meter in each year as a result of the meter promotion
and ‘not for revenue metering’ exercises.
From 2025-26 demand slowly rises back up to just above 2015/16 levels at 172.1 Ml/d under
the NYAA scenario. Demand increases post 2025-26 as all those unmeasured customers that
are likely to have switched to the measured tariff as a result of the dual billing exercise will
have been metered. From 2025-26 metering levels fall back to those achieved through
promotional exercises and new dual-bill properties become available through mains renewal.
150
160
170
180
190
200
210
220
19
90
/91
19
92
/93
19
94
/95
19
96
/97
19
98
/99
20
00
/01
20
02
/03
20
04
/05
20
06
/07
20
08
/09
20
10
/11
20
12
/13
20
14
/15
20
16
/17
20
18
/19
20
20
/21
20
22
/23
20
24
/25
20
26
/27
20
28
/29
20
30
/31
20
32
/33
20
34
/35
20
36
/37
20
38
/39
20
40
/41
20
42
/43
20
44
/45
Ml/
d
Outturn DI NYAA DYAA

86
4.8 The DYCP Scenario
In WRMP14 the DYCP was the critical scenario. A review of the Deployable Output assessment
has shown the peak scenario to be less important in terms of operational supply, however it
is still included as a scenario in WRMP19.
The approach for WRMP19 is consistent with the ‘Peak Water Demand Forecasting
Methodology’ guidance (UKWIR, 2006). A regression was undertaken on weekly peak
demands since 1997 with the variance explained using a mixture of variable which reflect
weather variations and changes in the customer base, Table 31.
Factors Mean Absolute %
Error
Total Dry Days (Week)
Total Rainfall (Week)
Max Average Temperature (Week)
Month: Aug
Month: Jul
Household Demand (Year)
Measured Non-Household Consumption (Year)
1.67%
Table 31: Peak Demand Model Summary
The weather variables are held at notional Dry Year values as at 2013, which was shown to be
drier than normal, and balanced against the peak demand as derived from the demand
normalisation process. Forecasted ‘Household Demand’ and ‘Measured Non-Household
Consumption’ values output from the DYAA forecast are then fed through the model
providing future estimations of peak demand.
As with the NYAA and DYAA forecasts Climate Change is accounted for outside of the model
using the UKWIR Impact of Climate Change on Water Demand’ (UKWIR,2012) guidance.
Climate Change assumed to only impact on household volumes. The increase as a result of
Climate Change by the end of the planning period is 1.1 Ml/d or 0.6% of total demand.
Figure 37: Dry Year Peak Demand Forecast
Peak Demand falls to its minimum in 2027-28 at 212 Ml/d before rising back up to 218 Ml/d
by the end of the planning period as a result of increasing population.
150
170
190
210
230
250
270
290
Ml/
d
Outurn Peak Week Forecast DYCP
87
4.9 Bulk Supply Exports
Bulk supplies to other companies are included in Table 2 Baseline Supply and contribute to
the overall reduction in deployable output. They are not actually supply reductions and are
therefore detailed under the demand section of this WRMP.
4.9.1 Southern Water Sussex North
Portsmouth Water has one existing bulk supply agreement which is with Southern Water and
supplies their Sussex North zone. The bulk supply was constructed in 2004 and the agreement
was renewed in 2016.
The maximum transfer rate is 15.0 Ml/d and this was originally intended to be available only
at Minimum Deployable Output during the autumn. Southern Water took the bulk supply for
a much longer period in 2004 and into the winter of 2005. Portsmouth Water obtained a
licence variation for the QRST Group to help secure the bulk supply. The bulk supply
agreement was renewed on the basis that 15.0 Ml/d can be delivered at an average and peak
demand.
The existing bulk supply is available under all the scenarios considered in this WRMP. Under
some drought conditions the supply would be delivered on a ‘best endeavours’ basis with the
assumption that Southern Water had applied temporary demand restrictions and drought
permits.
The current bulk supply is not bi-directional and this is reflected in Section 3.7.
4.9.2 Southern Water Sussex Worthing
There is a cross connection between the bulk supply to Sussex North and an existing Southern
Water main to their Sussex Worthing zone (Littlehampton). This connection provides
operational flexibility but does not increase the total transfer capacity. When Southern Water
is operating their SRN Source C the main is not available as a bulk supply.
4.9.3 Sussex North Duplication
Portsmouth Water has considered an option for duplicating the existing bulk supply to Sussex
North. This would follow the same route to Whiteways Lodge and would require Southern
Water to duplicate their main as well. Additional pumps would be required at Source S but
no allowance has been made for increasing the capacity of the break pressure tank.
If developed, this bulk supply would deliver an additional 15 Ml/d. In the WRSE Modelling, it
is assumed that the duplicate bulk supply would deliver 15 Ml/d at average, peak and MDO
conditions. The new bulk supply will be reliable if additional resources are developed by
Portsmouth Water.
4.9.4 Southern Water Hampshire South
As part of the WRMP14 a second bulk supply was offered to Southern Water from the River
Itchen Works. Initially this was expected to go to Moor Hill Service Reservoir but as the project
progressed, it was clear that the bulk supply would go directly to Southampton (Hampshire
South Zone). Southern Water have now completed the main and Portsmouth Water have
provided a new connection and new pumps within an existing building.
A new bulk supply agreement has been drafted and this is based on the assumption that
Portsmouth Water can supply 15.0 Ml/d at all times. This includes average and peak demand

88
and scenarios from the ‘Normal Year’ to the ‘Severe Drought’. The new pipeline offers some
increased resilience for Portsmouth Water under normal conditions. It would be possible to
discharge water from Southern Water into the contact tank at Source A and for this to be
pumped to Hoads Hill Reservoir in an emergency.
Southern Water have experienced problems in their Hampshire South Zone in relation to
meeting the sustainability reductions. Two sources of water, Testwood and the Candover
Augmentation Scheme, may have less water available than expected. This means that their
new Plan has to consider alternative supply options to meet demand. At the time of
producing this Draft WRMP19 Southern Water expect that additional bulk supplies from
Portsmouth Water will be required. Their modelling has selected an enhancement to the
current bulk supply and a new bulk supply. The enhancement involves fitting bigger pumps
in Portsmouth Water’s pumping station but using the same pipeline to Southampton. The
pumps are assumed to provide an additional 9 Ml/d bringing the total pumped to 24 Ml/d.
The new bulk supply would require a new connection to Southern Water’s distribution
system. This may not be in Southampton but in another area where there is housing growth.
The new connection would be sized at 21 Ml/d but would not be available until 2029. This
bulk supply would increase the total amount of water provided to Hampshire South to 45
Ml/d. This is the full works capacity at Source A but this water would only be available if
Portsmouth Water develop alternative supplies for their customers, at Havant Thicket for
example.
The need for alternative supplies is covered in Section 6 Options Appraisal. Under drought
conditions only 30 Ml/d of water is available from the River Itchen at Source A. To make up
the additional 15 Ml/d Portsmouth Water would have to backfeed water from Hoads Hill
Service Reservoir to Source A. The Company needs to ensure that its distribution system can
cope with the revised flow patterns. Portsmouth Water customers will then be supplied with
different water but it all originates from the same chalk aquifer.
4.9.5 South East Water - Petersfield
South East Water has formally requested a bulk supply from Clanfield Service Reservoir to
Tilmoor Reservoir in Petersfield. Construction of the bulk supply will be split between
Portsmouth Water and South East Water. The route crosses the South Downs National Park
but it is not expected that there will be significant lasting environmental impacts. The pipeline
will be sized to supply 10.0 Ml/d and South East Water has requested to use this bulk transfer
under all scenarios from 2058. This is outside Portsmouth Water’s planning period but water
supply options could be brought forward to meet this demand. This bulk supply will be
reviewed in the next WRMP.

89
5 BASELINE SUPPLY/DEMAND BALANCE
5.1 Introduction
In order to assess security of supply, Portsmouth Water has to compare the baseline
deployable output with the baseline demand forecast. It has been assumed that these will
both have the same probability of occurrence or return period. This is related to the ‘Level of
Service’ (LOS) referred to in Section 3.2.5. In a ‘Dry Year’, temporary demand restrictions are
just avoided and the current LOS is 1 in 20 or a 5% risk of failure.
In a ‘Historic Drought’ there will be domestic temporary use bans but further restrictions will
be avoided; the return period for this scenario is 1 in 40. An ‘Extended Drought’ will just avoid
Ordinary Drought Orders such as Non-essential Use Bans and most Drought Permits. This
scenario has a return period of 1 in 80.
In a ‘Serious Drought’ Non-essential Use Bans and Drought Permits will be required. The
scenario has a return period of 1 in 125.
In a ‘Severe Drought’ stand pipes in the street are just avoided. This scenario has a return
period of 1 in 200.
For the WRMP 2019, Portsmouth Water has decided to submit tables for Annual Average and
Peak Week demand to show that the correct ‘Critical Period’ is identified. There are tables for
the ‘Dry Year’ and the ‘Severe Drought’ to cover the range of weather conditions possible.
Minimum Deployable Output is no longer considered to be critical for Portsmouth Water.
5.2 Headroom Assessment
Target headroom is a buffer between supply and demand and allows for uncertainty and risk.
Demand is based on a ‘Trend’ forecast for the population numbers and a central forecast of
per capita demand. Headroom takes account of the fact that these could be under estimated
and that deployable output could be lower. Security of supply is maintained even if all of the
headroom is used.
5.2.1 Methodology
Portsmouth Water employed AECOM to carry out the headroom assessment and asked them
to use the ‘Improved Methodology’. This is a probabilistic approach based on the 2002 UKWIR
report and the guidance published by the Environment Agency. The Monte Carlo simulations
were carried out using @ RISK software with 10,000 iterations. The higher numbers of
iterations were used to improve repeatability of results.
5.2.2 Headroom Uncertainty Factors
The standard methodology includes thirteen uncertainty factors:
Uncertainty Factors
Factor Name
S1 Vulnerable Surface water licences
S2 Vulnerable Groundwater licences
S3 Time Limited Licences
S4 Bulk Imports

90
S5 Gradual Pollution
S6 Accuracy of Supply-Side Data
S7 Single Source Dominance
S8 Impact of Climate Change on Deployable Output
S9 New Sources
D1 Accuracy of Sub-Component Demand Data
D2 Demand Forecast Variation
D3 Impact of Climate Change on Demand
D4 Demand Management Measures
Table 32: Uncertainty Factors
A probability distribution is assigned to each uncertainty factor to represent a range of
possible outcomes. The probability distributions are then combined using the Monte Carlo
software to produce an overall curve that relates to a particular level of risk.
The level of risk can be set for each Monte Carlo simulation and a family of headroom graphs
produced. The Water Resources Planning Guideline states that companies should accept a
higher level of risk in the future. This is because the Regulators feel that the uncertainties
that the industry will face in the future can be managed.
It is helpful to consider each of the uncertainty factors and their influence on the final
headroom figure. More detail is contained in the AECOM Headroom Allowance Assessment
Report (see Appendix ‘F’).
5.2.2.1 S1 Vulnerable Surface Water Licences
Portsmouth Water only has one surface water abstraction which is from the River Itchen at
Source A. The abstraction licence has been varied to comply with the Habitats Regulation
Review of Consents. There are no additional abstraction issues for Portsmouth Water from
the Water Framework Directive. No allowance has been included for this factor in the
calculations.
5.2.2.2 S2 Vulnerable Groundwater Licences
The WRPG, published by Ofwat, the Environment Agency and Defra, say that it is not
necessary to include this factor in headroom. Portsmouth Water remains concerned that
further sustainability reductions, as a result of the Water Framework Directive, are a key area
of uncertainty for the future.
5.2.2.3 S3 Time Limited Licences
Time limited licences are a potential area of uncertainty for Portsmouth Water. The existing
bulk supply to Southern Water in Sussex North relies on a licence variation that is time limited
to 2028. The licence that relates to the new bulk supply into Hampshire is not time limited.
The guidance says that the impact of time limited licences should not be included in
headroom. This is because the Environment Agency will give notice of any proposed licence
reductions and there will be enough time to ‘restore’ the supply/demand balance. In the past,
Portsmouth Water believed that this was a key area of uncertainty but did not include it in
headroom to comply with the guidance.

91
No allowance for confirmation of time limited licences in the future has been included in the
WRMP 2019.
5.2.2.4 S4 Bulk Imports
Portsmouth Water does not currently have any bulk imports of water and there are no such
arrangements currently planned. This factor has been excluded from the headroom
assessment.
5.2.2.5 S5 Gradual Pollution
There are five sources of gradual pollution in the Portsmouth Water area of supply:
Nitrates
Pesticides
Turbidity
Oil Spillages
Cryptosporidium
In the past, high nitrate levels have been managed by the introduction of blending schemes.
In addition to blending, Portsmouth Water is now involved in ‘Downs & Harbours Clean Water
Partnership’ with the Environment Agency, Natural England and the South Downs National
Park. With these measures in place it was decided not to include gradual nitrate pollution in
headroom. Further nitrate blending schemes may be included in the Business Plan to address
specific problems. If shut downs occur due to nitrate levels in the shorter term, these will be
covered by the outage allowance.
One sample failure for pesticides was detected in Source B Spring water in 2016. If these
developed to a critical level it is likely that granular activated carbon would be added to the
filters at Farlington WTW. No allowance for gradual pesticide pollution has been included in
headroom.
In the recent past Portsmouth Water has experienced outages due to oil spillages. These have
occurred at:
Source C 2005
Source K 2011
Source J 2011
Source R 2014
Source H 2016
These events represent a medium term loss of deployable output and a risk of further losses
at other works in the future exists. In order to comply with the guidance, events that last
longer than 3 months are excluded from the outage calculations. These incidents represent
a loss of deployable output and are reported in the Annual Review. If the causes are not
removed by capital works the loss of DO becomes permanent. Portsmouth Water has decided
to include oil pollution as a generic risk at all works. The risk is calculated to be 0.83% for any
source for any future year. We have a proactive catchment management programme to
mitigate this risk.

92
5.2.2.6 S6 Accuracy of Supply Side Data
A small allowance has been included from the uncertainty in the accuracy of abstraction
meters and the source yield assessment. This factor does not significantly influence the
overall headroom figure.
5.2.2.7 S7 Single Source Dominance
This factor is no longer included in the headroom assessment because Portsmouth Water only
has one water resources zone.
5.2.2.8 S8 Impact of Climate Change on Deployable Output
For the WRMP2019, a new assessment has been carried out by AECOM and HR Wallingford
using the latest UKCP09 climate change scenarios. The assessment is based on a sub set of
100 scenarios selected from the full set of 10,000 scenarios in UKCP09. For each of the 100
scenarios, models have been produced for groundwater level, spring flow and river flow.
These were used to develop a ‘Resource Zone Model’ to give 100 possible outcomes for each
scenario.
The model results give a statistical mean, minimum and maximum for average and peak
demand periods. The variability of the results is used in the headroom calculation and the
mean figures are included as a reduction in deployable output in Table 2, Baseline Supply. In
2040’s, these figures are -0.9 Ml/d at average and -2.7 Ml/d at peak.
5.2.2.9 D1 Accuracy of Sub-Component Demand Data
A small allowance has been included for the uncertainty in the accuracy of distribution input
meters. These meters are located at Service Reservoirs and are not the same as the meters
located at source works. This factor does not significantly influence the overall headroom
figure.
5.2.2.10 D2 Demand Forecast Variation
The demand forecasts for the WRMP2019 submission are based upon population and
property estimates provided by Experian. In addition to the central estimate presented in the
WRMP19 text, Experian also provided forecasts at 10% and 90% confidence. These bands
were used as scenarios in the Portsmouth Water demand spreadsheet model to derive a ‘low’
and ‘high’ forecast which in turn are used in the headroom assessment.
By 2044/45 the under ‘low’ growth the demand drops to 161 Ml/d whilst under extreme
growth demand could reach 187 Ml/d.
5.2.2.11 D3 Impact of Climate Change on Demand
In the WRMP 2014, this factor was included as a separate line in Table WRP2 for the impact
on the baseline forecast.
Portsmouth Water produced three climate change scenarios for measured and unmeasured
household demand:
Minimum (10th quantile)
Most likely (median)
High (90th quantile)

93
The variation in demand as a result of climate change is relatively low causing less that 1Ml/d
difference by 2044/45 under the ‘Most Likely’ scenario.
5.2.2.12 D4 Demand Management Measures
The baseline supply/demand balance does not include additional demand management
measures other than the existing meter optants achieved through promotion and ‘metering
not for revenue’.
There are assumptions about the existing optional metering policy and its ability to influence
demand. Portsmouth Water calculated an upper and lower band representing variations in
meter uptake. These were used to calculate the contribution of demand management
uncertainty to headroom.
5.2.2.13 Target Headroom Allowance
The results of the Monte Carlo simulation are presented in Appendix ‘F’ and the profiles for
the selected profiles are shown on the following graph for Dry Year Annual Average.
Headroom increases with time and the impact of selecting different risk assumptions. Within
a 90% probability (10% risk of failure), headroom would be 11.4 Ml/d in 2017/18.
The WRPG states that companies should be prepared to take more risks at the end of the
planning period. This is represented as a stepped reduction in probability starting at 90% in
2020/21. Portsmouth Water has assumed that probability would fall by 1% for each 5 year
time step.
The risk profile adopted was:
Period Risk Probability
2020/21-2024/25 10% 90%
2025/26-2029/30 11% 89%
2030/31-2034/35 12% 88%
2035/36-2039/40 13% 87%
2040/41-2044/45 14% 86%
Table 33: Headroom Risk Profile
The results in the following headroom profile which has been used for the WRMP.
Final Headroom Profile
Figure 38: Final Headroom Profile
0.00
5.00
10.00
15.00
20.00
25.00
Dry Year Annual Average Dry Year Peak Week

94
The final headroom allowance can be compared with the previous plans for 2019/20:
Scenario WRMP 2009 WRMP 2014 WRMP 2019
Annual Average 10.7 Ml/d 10.3 Ml/d 11.8 Ml/d
Critical Period 12.4 Ml/d 13.8 Ml/d 13.9 Ml/d
Table 34: Headroom Assumed 2019/20
Target headroom is higher than previous plans but this is due to increased risks associated
with oil spills and a greater range of uncertainty around future demands. Climate change
uncertainty is also higher at the start of the planning period due to a change of methodology.
Final Headroom Allowance
Year Dry Year Annual
Average Ml/d
Dry Year Critical Period Ml/d (Peak Week)
2017/18 11.4 13.0
2019/20 11.8 13.9
2024/25 13.2 15.7
2029/30 14.7 17.8
2034/35 15.6 19.3
2039/40 17.1 21.4
2044/45 18.0 22.3
Table 35: Headroom Allowance 2019/20

95
5.3 Baseline Supply/Demand Balance
The ‘Baseline’ supply/demand balance is a comparison of Deployable Output (DO) and
Distribution Input (DI). It is based on unconstrained demand and can be presented for a range
of scenarios from ‘Normal Year’ to ‘Severe Drought’.
The baseline balance can be carried out for Annual Average and critical period conditions with
reductions in DO for climate change, outage and process losses. The resulting volume is
termed ‘Water Available for Use’ (WAFU). After allowing for existing bulk supplies, and new
bulk supplies resulting from recipient company requests, WAFU is compared with DI. This
figure is called ‘Available Headroom’ and it can be compared to the ‘Target Headroom’
calculated in Section 5.2.
If Available Headroom is greater than Target Headroom, at any given time step, then there is
a surplus. If there is a surplus until the end of the planning period, then the plan balances and
there is no need for any further actions. If there is a deficit then a further stage of options
appraisal needs to take place.
5.3.1 Average Supply/Demand Balance
The baseline supply/demand balance is shown in Water Resource Planning Table WRP4 with
deployable output information drawn from WRP Table 2 and demand data from Table 3.
These tables form a separate appendix to this report. The balance can be represented as five
year time steps.
2019/20 2024/25 2029/30 2034/35 2039/40 2044/45
Distribution Input 170.8 170.0 170.3 171.4 172.8 174.6
Deployable Output
226.5 226.5 226.5 226.5 226.5 226.5
Process Losses 2.4 2.4 2.4 2.4 2.4 2.4
Climate Change 0.0 0.2 0.4 0.6 0.7 0.9
Outage 14.7 14.7 14.7 14.7 14.7 14.7
WAFU 209.4 209.2 209 208.8 208.7 208.5
Bulk Supplies 30.0 39.0 60.0 60.0 60.0 60.0
Total WAFU 179.4 170.2 149 148.8 148.7 148.5
Target Headroom 11.8 13.2 14.7 15.6 17.1 18.0
Available Headroom
8.6 0.2 -21.3 -22.6 -24.1 -26.10
Supply Demand Balance
-3.2 -13.0 -36.0 -38.2 -41.2 -44.1
Table 36: Baseline Supply Demand Balance - Dry Year Annual Average
This table shows data for the ‘Dry Year’ scenario as required by the Planning Guideline. Data
has also been produced for all the other scenarios from the ‘Normal Year’ to the ‘Severe
Drought’ which is the Reference Level of Service. For the baseline supply demand balance
distribution input is ‘unconstrained’ with no demand restrictions. Deployable output remains
constant except for the influence of climate change which causes a gradual reduction.
Water Available for Use (WAFU) is calculated by subtracting climate change, process losses
and outage from deployable output. Total WAFU is WAFU minus any bulk supplies to other

96
companies. For Portsmouth Water the bulk supply to Southern Water is expected to increase
by 9 Ml/d in 2022/23 and a further 21 Ml/d in 2028/29. These bulk supplies have been agreed
in principle but will require further detailed negotiations before they are confirmed.
Under the baseline scenario, with the additional bulk supplies to Southern, the supply demand
balance is in deficit and schemes will have to be brought forward to correct this. Portsmouth
Water is unable to implement Compulsory Metering for legislative reasons and so the baseline
demand forecast assumes an impact from optional metering and a new initiative, ‘Metering
not for revenue’. This is covered in more detail in Section 6 Options Appraisal.
Under the ‘Reference Level of Service’ scenario of a ‘Severe Drought’ (1 in 200) there would
be a significant reduction in deployable output. Groundwater levels and river flows would be
lower and there would be some restrictions in abstraction to protect the environment. For
the baseline balance the distribution input would be the same because it is ‘unconstrained’
however the reduction as a result of demand restrictions is considered in the final planning
tables. The bulk supply is assumed to be the same but in reality there may be a degree of pain
sharing under severe drought conditions.
2019/20 2024/25 2029/30 2034/35 2039/40 2044/45
Distribution Input 170.8 170.0 170.3 171.4 172.8 174.6
Deployable Output 190.7 190.7 190.7 190.7 190.7 190.7
Process Losses 2.4 2.4 2.4 2.4 2.4 2.4
Climate Change 0.0 0.2 0.4 0.6 0.7 0.9
Outage 14.7 14.7 14.7 14.7 14.7 14.7
WAFU 173.6 173.4 173.2 173.0 172.9 172.7
Bulk Supplies 30.0 39.0 60.0 60.0 60.0 60.0
Total WAFU 143.6 134.4 113.2 113.0 112.9 112.7
Target Headroom 11.8 13.2 14.7 15.6 17.1 18.0
Available Headroom -27.2 -35.6 -57.1 -58.4 -59.9 -61.9
Supply Demand Balance
-39.0 -48.8 -71.8 -74.0 -77.0 -79.9
Table 37: Baseline Supply Demand Balance – Severe Drought Annual Average

97
5.3.2 Average Balance Graphical Representation
The WRMP Tables are included as an appendix to this report and have a graphical
representation of the supply demand balance. This is shown below for the average Dry Year
scenario.
Figure 39: Baseline Annual Average Dry Year
The baseline graph for average conditions shows the impact of optional metering on overall
demand. Non-household demand falls gradually over the planning period and leakage falls as
a result of reductions in supply pipe losses. The blue line represents demand plus target
headroom and it is these numbers that are compared with supply in the baseline balance.
The red line represents total water available for use. Total WAFU is calculated from
deployable output minus climate change, outage, process losses and bulk supplies.
The graph shows that the red line is below the blue line so there is a deficit at average demand.
This increases with time as the impact of climate change is felt and the bulk supplies increase.
Supply and demand management schemes will be required to regain the balance.
For comparison the graph of the Severe Drought Scenario shows a much lower Total Water
Available for Use (Total WAFU). The red line is well below the blue line and the deficits are
greater than the Dry Year Scenario. The baseline supply demand balance is based on
unconstrained demand and there are no demand restrictions such as Temporary Bans. These
are considered in the Final Planning Tables (Section 7.5)
0
50
100
150
200
250
20
20
-21
20
22
-23
20
24
-25
20
26
-27
20
28
-29
20
30
-203
1
20
32
-33
20
34
-35
20
36
-37
20
38
-39
20
40
-41
20
42
-43
20
44
-45
Ml/
d
Measured household consumption Unmeasured household consumption
Non-household consumption Total leakage
Other components of demand Total water available for use
Total demand + target headroom (baseline)

98
Figure 40: Baseline Annual Average Severe Drought
The severe drought has a return period of around 1 in 200 years (0.5% probability) and
matches the Reference Level of Service. This reference level just avoids the use of standpipes
in the street and rota cuts.
5.3.3 Peak Week Supply/Demand Balance
Portsmouth Water has historically been a peak driven company due to the shape of the
demand profile and the lack of raw water storage. The critical period has always been the
peak week which was assumed to occur in June or July. Some recent years have seen peaks
occur in August and this plan is based on revised demand profiles. For the critical period of
‘Peak Week’ the data has been set out for the five yearly time steps of the Business Plan.
2019/20 2024/25 2029/30 2034/35 2039/40 2044/45 Distribution Input 213.5 212.0 212.3 213.9 215.8 218.3 Deployable Output
280.3 280.3 280.3 280.3 280.3 280.3
Process Losses 2.4 2.4 2.4 2.4 2.4 2.4 Climate Change 0.2 0.7 1.2 1.7 2.2 2.7 Outage 12.5 12.5 12.5 12.5 12.5 12.5 WAFU 265.2 264.7 264.2 263.7 263.2 262.7 Bulk Supplies 30.0 39.0 60.0 60.0 60.0 60.0 Total WAFU 235.2 225.7 204.2 203.7 203.2 192.7 Target Headroom 13.9 15.7 17.8 19.3 21.4 22.3 Available Headroom
21.7 13.7 -8.1 -10.2 -12.6 -25.6
Supply Demand Balance
7.8 -2.0 -25.9 -29.5 -34.0 -37.9
Table 38: Dry Year Peak Week
The distribution input figures in this table are unconstrained and the bulk supplies increase
with time. Compared to WRMP 2014 deployable output is lower and outage and headroom
0
50
100
150
200
250
20
20
-21
20
22
-23
20
24
-25
20
26
-27
20
28
-29
20
30
-203
1
20
32
-33
20
34
-35
20
36
-37
20
38
-39
20
40
-41
20
42
-43
20
44
-45
Ml/
d
Measured household consumption Unmeasured household consumption
Non-household consumption Total leakage
Other components of demand Total water available for use
Total demand + target headroom (baseline)

99
are higher. The deficits are similar for the peak week and annual average demand so this is
no longer the critical time period.
5.3.4 Peak Week Balance Graphical Representation
The WRMP tables are included as an appendix to this report and a graphical representation
of the data is shown below for the peak week Dry Year scenario.
Figure 41: Baseline Peak Week Dry Year
The baseline graph for peak week Dry Year conditions shows the impact of optional metering
with unmeasured demand reducing. Non-household demand falls gradually over the planning
period and leakage falls as a result of reductions in supply pipe losses. The blue line represents
demand plus target headroom and the red line represents the total water available for use.
The graph shows the red line above the blue line at the start of the planning period but drops
below as the bulk supplies are increased.
For comparison the data for the peak week severe drought has lower deployable outputs and
greater deficits.
0
50
100
150
200
250
300
20
20
-21
20
22
-23
20
24
-25
20
26
-27
20
28
-29
20
30
-203
1
20
32
-33
20
34
-35
20
36
-37
20
38
-39
20
40
-41
20
42
-43
20
44
-45
Ml/
d
Measured household consumption Unmeasured household consumption
Non-household consumption Total leakage
Other components of demand Total water available for use
Total demand + target headroom (baseline)
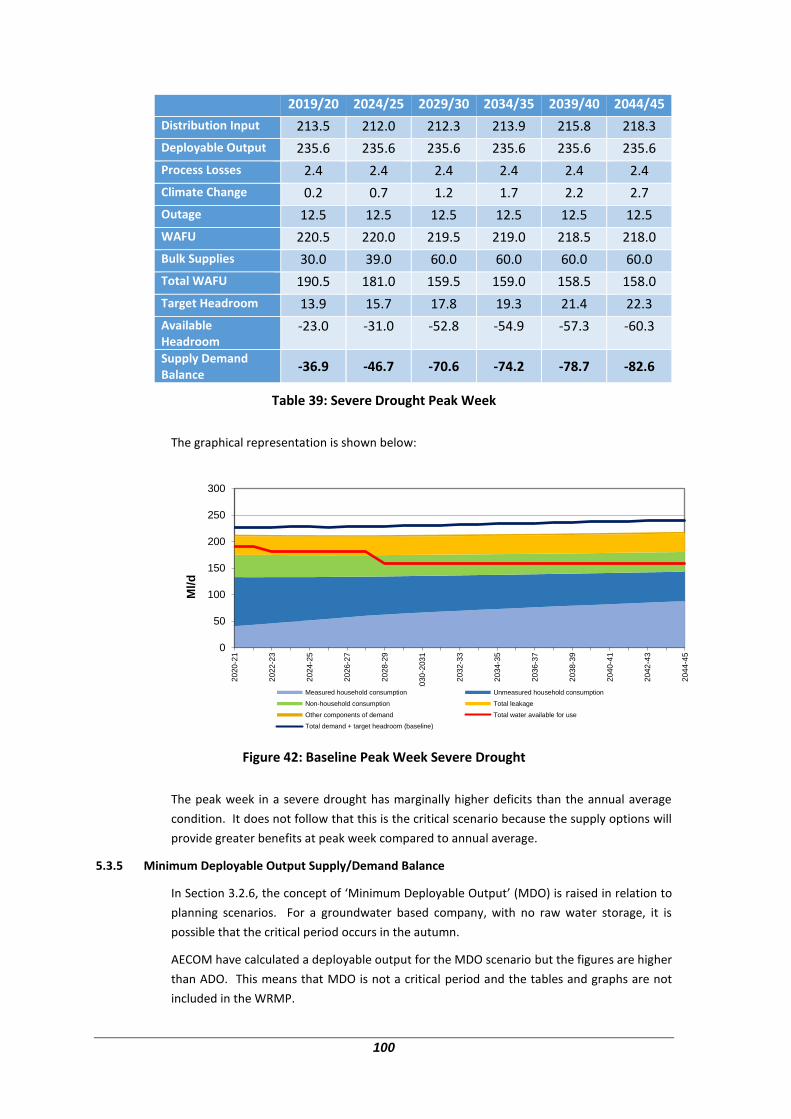
100
2019/20 2024/25 2029/30 2034/35 2039/40 2044/45
Distribution Input 213.5 212.0 212.3 213.9 215.8 218.3
Deployable Output 235.6 235.6 235.6 235.6 235.6 235.6
Process Losses 2.4 2.4 2.4 2.4 2.4 2.4
Climate Change 0.2 0.7 1.2 1.7 2.2 2.7
Outage 12.5 12.5 12.5 12.5 12.5 12.5
WAFU 220.5 220.0 219.5 219.0 218.5 218.0
Bulk Supplies 30.0 39.0 60.0 60.0 60.0 60.0
Total WAFU 190.5 181.0 159.5 159.0 158.5 158.0
Target Headroom 13.9 15.7 17.8 19.3 21.4 22.3
Available Headroom
-23.0 -31.0 -52.8 -54.9 -57.3 -60.3
Supply Demand Balance
-36.9 -46.7 -70.6 -74.2 -78.7 -82.6
Table 39: Severe Drought Peak Week
The graphical representation is shown below:
Figure 42: Baseline Peak Week Severe Drought
The peak week in a severe drought has marginally higher deficits than the annual average
condition. It does not follow that this is the critical scenario because the supply options will
provide greater benefits at peak week compared to annual average.
5.3.5 Minimum Deployable Output Supply/Demand Balance
In Section 3.2.6, the concept of ‘Minimum Deployable Output’ (MDO) is raised in relation to
planning scenarios. For a groundwater based company, with no raw water storage, it is
possible that the critical period occurs in the autumn.
AECOM have calculated a deployable output for the MDO scenario but the figures are higher
than ADO. This means that MDO is not a critical period and the tables and graphs are not
included in the WRMP.
0
50
100
150
200
250
300
20
20
-21
20
22
-23
20
24
-25
20
26
-27
20
28
-29
20
30
-203
1
20
32
-33
20
34
-35
20
36
-37
20
38
-39
20
40
-41
20
42
-43
20
44
-45
Ml/
d
Measured household consumption Unmeasured household consumption
Non-household consumption Total leakage
Other components of demand Total water available for use
Total demand + target headroom (baseline)

101
6 OPTIONS APPRAISAL
6.1 Introduction
Having developed a baseline supply demand forecast, an assessment can be made as to which
one of the following situations the Company is in:
There is enough supply to meet demand over 25 years
There is enough supply to meet demand, however the Company wishes to
implement a series of measures to become more efficient, better for the
environment and meet Government aspirations
There is not enough supply to meet demand, options need to be
investigated.
When a water company has a deficit in its baseline supply demand balance, supply side
options can help to increase supplies, whilst demand side options can help to reduce demand.
Implementing both options simultaneously is called a ‘twin-track’ approach and may be the
best way to remove the deficit.
Conversely, where a water company has surplus supplies, surplus water can be used to help
other water companies in a deficit, by providing a bulk supply.
The Options Appraisal process outlines the potential options on the supply and demand side
to resolve a supply/demand deficit should this exist. This process has many stages before a
final planning solution can be sought. These stages include but are not restricted to:
Unconstrained Options
Feasible Options
Economic Appraisal
Programme Appraisal
Preferred Programme of Options
Unconstrained options are generated based on technical feasibility but tend not to be
constrained by regulatory restrictions. These options are generated from past and present
information available to the Company and take into account the core business functions and
government aspirations.
Feasible options are those short listed from the original list of unconstrained options (Section
6.2). These are options considered to be technically feasible but are constrained by
restrictions. The original list of unconstrained options is screened against marking criteria and
a feasible options list is generated.
This feasible options list is then economically appraised by taking into account financial costs,
social and environmental costs, carbon costs, yield and delivery uncertainties (Section 6.3).
An integral part of the process involves the assessment of the options potential negative and
positive impacts on the environment and protected habitats (Section 6.4.7). To ensure that
this process is as robust as possible, all feasible options identified are screened in line with
national guidance. The completed assessments include;
Strategic Environment Assessment (SEA)

102
Habitats Regulations Assessment (HRA)
After these stages are complete, a final planning solution can be sought taking into account
the results from all screening processes and whether options are needed to remove the
deficit, or support bulk supplies.
Engagement with the regulators and stakeholders has taken place throughout this whole
process to ensure statutory compliance and incorporation of industry expertise.
6.1.1 Contact with Third Party Suppliers
The WRPG requires companies to engage with third party suppliers to see if they have feasible
options. As set out in Section 2.9, Portsmouth Water contacted a number of water companies
and potential suppliers as part of the pre-consultation process. The following organisations
were considered to be potential suppliers:
Southern Water
South East Water
Albion Water
SSE Water
6.1.2 Options Assessment Process
In order for Portsmouth Water to develop its assessment of options for this Water Resources
Management Plan, the Company enlisted AMEC to assist in carrying out the Options Appraisal
process. AMEC worked with the Company to review the process through which supply and
demand side options are identified, appraised and selected for inclusion in the Plan.
6.2 Unconstrained Options
A generic list of options was taken from the Economics of Balancing Supply and Demand
(EBSD) report was used to develop a list of unconstrained options. These options are
technically feasible but are not constrained by restrictions such as environmental permits and
planning issues.
Portsmouth Water considered options which take into account customer management,
distribution management, production management and resource management. These
include but are not restricted to, water efficiency, leakage, resource sharing and options
proposed by third parties.
An initial list of 179 unconstrained options was created based on:
Portsmouth Waters 2014 Water Resources Management Plan
‘Generic’ options from the EBSD Guidelines
Consideration of other water companies supply demand balance by
including bulk supply options
Leakage management options as recommended in the Sustainable Economic
Level of Leakage (SELL) report
Bids by third parties (including other water companies)

103
The unconstrained list included options such as:
Havant Thicket Winter Storage Reservoir
Portsmouth Harbour Desalination Plant
Budds Farm Effluent reuse scheme
Leakage Control
Compulsory Metering
Water Efficiency
Drought Measures
A full list of the unconstrained options can be found in Appendix ‘R’.
6.3 Feasible List of Options
The Unconstrained Options List was then reduced down to create a feasible options list using
a six step screening process. Feasible options are considered to be technically feasible and
capable of implementation within the current regulatory and legal framework.
6.3.1 Unconstrained Options Screening
From the unconstrained options, a list of feasible options was selected using the screening
process
Step 1 – Remove baseline and duplicate activities
Step 2 – Remove options that compete with Southern Water for resources
Step 3 – Identify mutually exclusive options and apply a risk based approach
to options selection
Step 4 – Technical credibility
Step 5 – Assess how well the option can be promoted and if it is acceptable
to stakeholders and customers
Step 6 – Other issues which may suggest that an option is not feasible
Since WRMP14 there have been a number of policy changes that have affected options:
Retail competition affecting the ability of a wholesaler (Portsmouth Water)
to interact directly with commercial customers
6.3.2 Options included in Baseline
Due to slower than expected progress with optional metering it was decided to put option
C005 ‘Metering not for revenue’ in baseline. This option provides a meter where water mains
have been refurbished and then uses a dual bill marketing approach to inform customers of
their usage patterns and encourage them to switch to the measured tariff.
6.3.3 Foundations for a Feasible Options List
This screening process used EBSD and included the following criteria:
Does the option address the problem?
Does the option breach unalterable planning constraints?

104
Is it promotable?
Does it have a high risk of failure?
Yield Uncertainty?
Flexibility to adjust yield to meet requirement?
Conservation Impact?
Landscape and Heritage Impact?
Social Impact?
Sustainability?
Technical Difficulty?
Each option was screened against the eight criteria and a score was assigned for each of the
criteria on a 1-5 scale (1=good and 5=poor). The scores were summed up to give a total with
the maximum score being 32 for the best performing options and a minimum score of zero
for the worst performing options. Initially options with a score of 17 or more were excluded,
whilst options with a score of 16 or less were included for further consideration.
Sense checking identified options which scored poorly but were considered appropriate to be
included. The next step in the screening process involved identifying options which can be
combined and are mutually exclusive. With stakeholder agreement, many options including
water efficiency, leakage, Havant Thicket Winter Storage Reservoir and metering were
reduced in number and combined with similar options. This rationalisation resulted in a
reduction in the total number of feasible options.
The next stage identified options with an unacceptably high risk against any of the criteria.
Factors that cannot be fully reflected in the screening criteria are identified at this stage. For
example, options were awarded a score of above four but were seen to have an unacceptably
high risk of delivery.
Finally, options where there was significant uncertainty to the viability of the option were
removed. These options get ‘parked’ and may be added at a future date if they are proven
viable. The removal of these options resulted in a total of 20 options retained in the feasible
options list. The comments and justification for not including particular options within the
feasible options list can be found in Appendix ‘R’.
6.4 Appraisal of Feasible Options for the Draft Plan
Each of the feasible options has been appraised fully in line with the WRPG which refer to the
key principles set out in the ESBD.
The Company is aware that climate change has the potential to impact upon the feasibility of
the options identified to maintain the supply demand balance. This could range from changes
in the patterns of water used by customers, the yield available from sources as rainfall
patterns change, and increased risk of outage due to extreme weather events.
The Company is fully committed to cutting greenhouse gas emissions to reduce the effects of
climate change as a result of the Climate Change Act (HM Government, 2008). The Company
have taken this into account determining feasible options.
The next stage in the process was to derive estimates of costs and yield for each scheme.
These costs (or benefits) are split up into:

105
Cost of building the scheme (The Capital cost or CAPEX)
Cost of operating the scheme (The Operating cost or OPEX)
Social and Environmental costs of the scheme
Carbon costs of the scheme
The Company assessed the feasible options on an 80 year planning horizon for each of the
following parameters.
6.4.1 Financial Costs
Capital costs were assessed for all items associated in the creation of the asset which includes
design, feasibility, planning, construction costs and initial operational requirements once
implemented.
Operational costs such as labour, electricity, chemicals and abstraction charges were
assessed. The change in operational costs can also be negative i.e. a cost saving. For example,
demand reduction schemes can lead to the savings in electricity and chemicals through the
reduced volume of water used. All financial cost information is included in an Appendix but
this document is commercially confidential and is not included in the public version of this
plan.
6.4.2 Social and Environmental Costs
A monetised assessment of the impacts upon the environment and the relevant population
affected using the approach recommended by the WRPG. This assessment was also informed
by the Environmental and Social Costs Supporting Document.
6.4.3 Carbon Costs
A whole life carbon cost for each feasible option is determined, this included embodied
carbon resulting from the commissioning of the asset and the operational carbon associated
with operating the asset. Carbon emissions have been monetised using the updated central
short term traded carbon value.
6.4.4 Risk of Delivery and Yield
For each of the feasible options, an assessment of the risk of delivery and any practical
difficulties that may prevent a solution being implemented. These can include engineering
difficulties in delivering the solution or obtaining the necessary permissions such as planning
permission or abstraction licences.
Each of the options were assessed for the risk associated with the yield; the risk differs from
the risk of delivery in that a groundwater source could be commissioned, however, there is
uncertainty relating to the output that may be achieved from the groundwater source.
Similarly, a metering programme may be delivered but there will be uncertainty around the
amount by which it reduces consumption.
A qualitative assessment of these risks is undertaken for each scheme and this assessment is
carried out to inform the choice of the final planning solution.
Yield information for all the feasible options is included in the text and has been based on full
implementation.

106
6.4.5 Average Incremental Costs and Average Incremental Social Costs
The Average Incremental Costs (AIC) approach gives each scheme a cost in terms of pence per
cubic metre of water delivered or saved. This enables each scheme to be compared with any
other scheme on a sound financial basis. Schemes can then be ranked by cost to identify the
options needed to maintain the balance between supplies and demand at lowest cost (AIC’s
do not take into account social and environmental costs). The Average Incremental Social
Costs (AISC) includes social and environmental costs.
The AISC’s for each of the options are included in the following sections.
6.4.6 Assessment of Individual Options
For each of the feasible options, a description is given, with an explanation of how each of the
parameters described previously has been assessed.
The Company has undertaken a complete reappraisal of options for inclusion in this Plan since
the Water Resources Management Plan in 2014.
For the purpose of representation, AMEC have given each option a specific code containing a
letter and three numbers. In doing so, AMEC have categorised the options into segments.
These segments such as Distribution options (e.g. D004) and Resource options (e.g. R013)
have been used to describe the option and a table has been produced including the AISC’s
and yield for each option.
6.4.7 Strategic Environmental Assessment and Habitats Regulation Assessment
The Strategic Environmental Assessment Directive (SEA EU, 2001) requires a formal
environmental assessment of certain categories of plans and programmes which are likely to
have significant effects on the environment. The directive has been transposed into The
Environmental Assessment of Plans and Programmes Regulations HM Government, 2004. The
Company accept that the WRMP falls within the remit of the SEA Directive and has carried
out the appropriate assessments. The Environmental Report produced as a result of the SEA
process is available in Appendix ‘P’.
The SEA considers the potential impacts of the options that could be included in the WRMP
against 10 objectives including; biodiversity, soil/land use, water quality/quantity, flood risk,
effects on climate change, economic/social needs, protection/enhancement of human health,
wise use of water and other resources, protecting/enhancing historic assets and landscape
character. The assessment considered the nature of the effect, its timing and geographic
scale, the sensitivity of the people or environmental receptor that could be affected, and how
long any effect might last (short, medium or long-term). The objectives and approach to the
assessment was set out in a Scoping Report which was issued for consultation on 22 July 2016.
The approach taken was refined to address the feedback from the three regulators who
responded (English Heritage, Environment Agency and Natural England).
The Company also determined that because of the proximity and potential for an impact on
European Protected sites of some of the feasible options the plan needed to be assessed
under the Conservation of Habitats and Species Regulations HM Government, 2010.
Regulation 102 requires that competent authorities assess the potential impact of land use
plans on the Natural 2000 network of European protected sites. The HRA determines whether
there will be any ‘likely significant effects’ on any European site as a result of the Plan’s

107
implementation (either on its own or ’in combination’ with other plans or projects), and if so,
whether these effects will result in any adverse effects on the site’s integrity.
In accordance with accepted best practice, the HRA and SEA have been run as an iterative
process alongside the plan development. All feasible options have been screened in
accordance with national SEA and UKWIR guidance where appropriate, in order to identify
whether potentially significant effects are likely to occur which would then require further
assessment, or if serious enough the rejection of an option. The completion of the HRA had
the added benefit of identifying options that might be high risk in terms of plan delivery if
they were selected, as they were unlikely to meet the requirements of the Habitat
Regulations, or where further detailed assessment and studies would be needed before the
option could be fully assessed.
Portsmouth Water has ensured that the Strategic Environmental Assessment (SEA) and
Habitats Regulations Assessment (HRA) have been an intrinsic part of the options appraisal
process. Information on the outcome from the HRA and SEA process is summarised below the
description of each of the options. The HRA and SEA have been completed by environmental
consultants at AMEC who specialise in this work. The full HRA and SEA can be found in
Appendix ‘O’ and ‘P’, along with tables summarising the outcome of each assessment for all
of the feasible options.
6.5 Production Side Options
The Company reduced operational losses at its biggest treatment works, Works B, in 2016/17.
Other washwater recovery schemes were considered at Source F and Source P for this plan
but these are modern membrane plants and the savings were not considered significant
enough for them to be included.
6.6 Resource Side Options
Resource options relate to making better use of water resources to ensure they are available
in the future. These options incorporate regulatory aspirations to include schemes which
consider;
The promotion of winter storage reservoirs to store excess water from the
winter when it is plentiful for use in the summer when it is less so
Further resource sharing between water companies in surplus or deficit in
the form of bulk supply imports or exports
New technology such as desalination of seawater to produce potable water,
or the re-use of sewage effluent
Maximising the deployable output of existing sources
6.6.1 Havant Thicket Winter Storage Reservoir
Following a commitment to further work in previous Plans, the Company considered a
number of winter storage options. These included alternative sizes for Havant Thicket and
the following alternative locations:
Southleigh Farm
Colden Common
Testwood Lakes

108
Woodend
Boarhunt
Havant Thicket Winter Storage Reservoir (HTWSR) was assessed and agreed with stakeholders
as the most feasible reservoir option to take forward. This option relates to the construction
of a pumped storage reservoir at Havant Thicket. Water would be sourced from the Source B
Springs during the winter period and stored in the reservoir for use in the summer when
necessary. Water would be abstracted using a draw off structure and transferred through a
dedicated main to Bedhampton, where it would link to existing infrastructure for transfer to
Works B. Depending on the quality of the reservoir water, some additional treatment may be
required at Bedhampton.
The SEA process has identified the impacts of HTWSR as being largely neutral, minor or
positive during the different stages of the project. During the construction phase, there would
be significant negative effects against the climate change and landscape objectives of the
assessment, due to embodied carbon in construction materials, and because this would be a
large construction project visible to some extent from the South Downs National Park,
Staunton Country Park and some residential properties. A significant positive effect is
recorded against the economy objective due to the employment that will arise from this large
construction project. The majority of the material used in the construction of the
embankments would be sourced from the site resulting in only a minor negative effect
assessment against the ‘use of resources’ objective.
During operation, the SEA records significant positive effects against the economy as the large
yield from the HTWSR will support economic growth in the region and ensure the continuity
of a safe and secure supply of drinking water. The associated green infrastructure will be of
benefit to the existing community and help to support new housing growth, as this is a
strategic project in the Partnership for Urban South Hampshire (PUSH) Green Infrastructure
Strategy. The new paths, cycle ways, spaced play and water sports training facilities will
provide a significant positive benefit in relation to the human health objective. Positive effects
are also recorded in the longer term in relation to biodiversity and flood risk.
Once constructed, the reservoir provides a conjunctive use scheme which anticipates the
future effects of climate change to store excess water from the Source B Springs in wetter
winters, to be supplied to customers in drier summers. A new visitor centre will provide
opportunities to explain and promote ‘water wise’ messages and alternative energy solutions.
The HRA concluded for the HTWSR site that construction works associated with this option
will have no likely significant effects on the European sites (SPA/SAC/Ramsar) downstream of
the reservoir, assuming normal best practice measures are adopted during construction. The
analysis of operational impacts has concluded that there will be no significant effect on
European sites (SPA/SAC/Ramsar) from; the additional abstraction within the existing licensed
volume at the springs, potential changes in water quality, or emergency drawdown.

109
Option Number
Option Name AISC at Average Deployable Output
(p/m3)
Yield (Ml/d)
R013 Havant Thicket Winter Storage Reservoir
20.6 23
Table 40: Havant Thicket Winter Storage Reservoir
6.6.2 Resource sharing
These options relate to the sharing of surplus resources with other companies in the area.
Options were considered to use the existing bulk supply pipework to Southern Water in
reverse. Unfortunately Southern Water does not have a planned surplus in either Sussex
North or Hampshire. These pipelines do, however, provide some additional resilience under
‘Normal Year’ emergency scenarios.
Conjunctive use of options considered whether additional resource benefit could be gained
by operating Portsmouth Waters existing resources in a different way to current. For example,
whether operating certain sources during the winter period would result in greater resources
remaining in the Chalk aquifer during dry or summer periods. However the hydrological
characteristics of the area do not allow for any long-term storage of groundwater. Any water
not abstracted from the aquifer will flow into the harbours and not be available in the future
to abstract.
Regional water resources options were considered. This would involve the import of water
from regional sources developed through the Water Resources in the South East Group
(WRSE). It is assumed that rather than dedicated mains being developed into Portsmouth
Waters area, the construction of new resources elsewhere would enable benefits to be
‘cascaded’ through the South and East. This would enable existing bulk supply exports from
Portsmouth Water to cease, and the resources could be used to benefit Portsmouth Water
customers.
Phase 3 of the WRSE regional modelling identifies regional solutions such as Havant Thicket
Winter Storage Reservoir but it does not select any reversals of flow or cancellations of
existing bulk supplies.
Portsmouth Water have not received any offers of bulk supplies or considered the
termination of the existing bulk supplies to Southern Water.
6.6.3 Maximise Deployable Output
The options appraisal process considered several schemes to recover deployable output.
These options were initially identified through the Deployable Output Assessment (Appendix
‘A’) Consideration of water quality issues and Deepest Advisable Pumping Water Level
indicated that DO could be recovered at:
Source O
Source J
Source H
Source C

110
At Source O the existing boreholes are connected with horizontal adits which are at a
relatively high level. As the water level is drawn down in dry conditions the adit is exposed
and sediment causes water quality problems. Various options were considered to resolve this
problem but the AISC calculation is based on extending the existing casing at the top of
borehole No 2 to block off the adits. The borehole will then be deepened by 24m so that it
matches borehole No1. The borehole pump will be re-installed at a lower level to give greater
drought resilience. The ADO will rise from 3.7 Ml/d to the recent actual abstraction of 5.5
Ml/d giving a potential DO recovery of 1.8 Ml/d. The deepened boreholes would require a
licence variation but there would be no deterioration under the WFD. The Source O option
has been included in the SEA and should be available early in the planning period.
The Source J has a deployable output of 9.2 Ml/d under dry conditions. With a current average
licence of 22.7 Ml/d it could be possible to abstract an additional 12.5 Ml/d from the site.
Source J is currently being investigated for water quality reasons and it is possible that satellite
boreholes are part of the solution. The WFD investigations concluded that abstraction at
Source J did not significantly impact on low flows in the River Wallington. Source I licence has
already been reduced to protect flows in the lower reaches of this river.
Option R022a which seeks to maximise the deployable output from the Source J within the
existing abstraction licence requirements was found to have significant positive effect against
any of the SEA objectives. This is a groundwater scheme, increasing the yield from an existing
source in the confined aquifer. Minor negative effects were determined against three of the
SEA objectives during the construction (soils, climate change and human health). During
operation a minor negative effect was determined against climate change, with significant
positive effects anticipated in relation to the economy and human health.
Source H has deployable output of 7.1 Ml/d under dry conditions and this is constrained by
water quality issues. With a current average licence of 9.1 Ml/d it should be possible to
recover an additional 2.0 Ml/d from this site. This is a water quality scheme but the AISC has
been based on the cost of air lifting the existing boreholes, to clean them, and a maximum
rate pumping test to confirm the DO. Source H impacts on the River Meon which has not
previously been studied as part of the Habitats Review of Consents or the WFD. The
Environment Agency has raised concerns about ‘Deterioration’ of the River Meon under the
WFD.
Source C has a deployable output of 16.5Ml/d in dry conditions and this is due to a water
quality constraint. If the pumps are run at the full licenced capacity of 20.5 Ml/d turbidity
causes the works to cut out. The licence capacity is only needed in dry or drought conditions
which occur relatively infrequently. It has been proposed that cartridge filters are provided
to allow the pumps to run at the full licensed quantity. This would recover 4.0Ml/d of DO at
average demand but would involve regular replacement of the filters. In terms of
‘Deterioration’ under the WFD the River Hamble has already been the subject of an
investigation. The Source C Licence was confirmed in April 2016 and a time limit was set at
2028. As part of the National Environment Programme (NEP) the river restoration scheme
was completed on the River Hamble in 2017. This should make the river more resilient to low
flows and allow fish to migrate up and down stream.

111
Table 41: Existing Resource Options
6.6.4 New Technology
As a commitment for further work, the Company have considered new resource options such
as effluent re-use.
For Portsmouth Water, this could involve the construction of Budds Farm Effluent Re-use
scheme. This scheme could involve the direct reuse of treated wastewater effluent from
Budds Farm Wastewater Treatment Works but this is unlikely to be acceptable to customers.
The second option would be indirect use after the water was polished using a membrane
treatment process. The water would be pumped to Havant Thicket Reservoir for blending
before being put into supply. Budds Farm Indirect Effluent Re-Use has not been fully costed
and is not considered in this WRMP.
6.7 Distribution of Water Options
Along with supply side options, distribution side options are an important part of the ‘Twin
Track’ approach. A water company can manage demand for water by enhancing leakage
control, manage pressure effectively and replace mains when appropriate to reduce the
amount lost through leakage and excess consumption.
6.7.1 Leakage Management
In the last WRMP there was some uncertainty about the methodology used to assess leakage
levels and therefore justify further reductions. A new methodology has been developed by
the Water Industry and this has been adopted for the WRMP19. (Consistency of Reporting
Performance Measures UKWIR 2017). The new methodology suggests that leakage was
higher than previously reported and that per capita consumption was lower. Leakage is now
an integral part of the overall demand forecast and the change of methodology does not
affect the forecast of the total amount of water required.
The new methodology allows more consistent comparisons between companies and with the
performance of other countries. This is a Government requirement set out in the Guiding
Principles (Appendix ‘N’). The new methodology uses the ‘Lowest Achieved’ level of leakage
in a control zone. This new approach requires the calculation of a revised ‘Sustainable
Economic Level of Leakage’ (SELL). Under the current leakage control policy this SELL figure
is higher than previously.
Calculation of the SELL is set out in Appendix K and the revised figure is 34.1 Ml/d.
Option Number Option Name AISC at Average
Deployable Output (p/m3)
(Ml/d)
RO21a Source O DO Recovery 6.3 1.8
RO22a Source J DO Recovery 6.2 12.5
RO23a Source F DO Recovery 6.6 2.0
RO24a Source C DO Recovery 14.4 4.0

112
The revised SELL report sets out options to reduce leakage. The first option refers to the
installation of additional district meters throughout the distribution network. The district
meters would enable more detailed monitoring of flows within the distribution network and
allow leakage to be targeted more readily. This would result in an increase in the number of
leaks identified and repaired, reducing the amount of water lost through leakage. Leakage
would be expected to fall by about 5.0 Ml/d to 30.0 Ml/d as a result of the installation of
District Meters.
The second option refers to main replacement and would result in targeted replacement of
the parts of the network with greatest leakage. Existing distribution mains would be
excavated and replace with new mains, reducing leakage.
The third option involves the deployment of permanent noise loggers throughout the
distribution network. The noise loggers would be linked through telemetry and would
automatically identify when suspected new leaks occur within the distribution network. This
would result in an increase in the amount of leaks identified and repaired, reducing the
amount of water lost through leakage (D004).
In the SEA the leakage options are assessed as having neutral or minor positive and minor
negative effects against eight of the ten objectives. The exceptions to this are objectives 5
(climate change) and 6 (economy) in relation to mains replacement.

113
Option Number
Option Name AISC at Average Deployable
Output (p/m3)
Yield (Ml/d)
D004 Deployment of permanent noise loggers
42.3 4.9
D005 Installation of district meters
13.3 5.1
D007 Mains Replacement N/A N/A
Table 42: Leakage Management Options
Option D007 (mains replacement) has been assessed as having a significant negative effect
during construction against the climate change objective. Although the mass of materials and
embodied carbon in these materials is not known at present, the option is likely to require
the replacement of several tens of kilometres of mains, which would have significant
embodied carbon.
Three additional leakage options were considered in the options appraisal report:
Additional pressure management (D006)
Increased find and fix activity on trunk mains and distribution mains (D002)
Increased find and fix activity on communication pipes (D003)
These options are now considered to be baseline activity with little further benefit from
pressure reduction.
6.8 Customer Side Options
Customer side options relate to the conservation of water through education of customers
and promotion of water efficiency to allow other options such as metering to work more
effectively.
6.8.1 Metering Options
The first metering option refers to upgrading meters installed as ‘Not for Revenue’ optants to
a ‘Smart’ system. Portsmouth Water intend to install meters in all existing meter pits and in
all new meter pits added as part of a main refurbishment scheme. This will be part of the
baseline provision but will use the existing dumb meters.
The second metering option involves replacing dumb meters with smart meters in new
properties. Customers would be provided with additional advice and encouraged to use
meter readings to change their behaviour. The initial roll out period would be five years with
a review at that stage.
The third metering option refers to upgrading all the remaining meter optants to a smart
system on request. Customers would be provided with additional advice and encouraged to
change their behaviour or to fit more water efficient fixtures and fittings. Water efficiency
audits would also be offered.

114
Portsmouth Water has considered metering customer with high discretionary use (such as
swimming pool owners) during the options appraisal process. This option was considered as
having a high risk of not delivering any yield as it was considered that customers are likely to
require the same amount of water whether they are metered or not.
In the SEA the metering and tariff options were assessed by AMEC as having neutral or minor
negative effects against seven of the ten objectives. The exceptions to this were;
Climate change – significant negative effect during construction, positive during
operation.
Economy – significant positive effect during construction, neutral during operation.
Human health – combination of positive and negative effects for tariff options. The use
of tariffs to manage demand may impact on vulnerable customers, such as those on low
incomes, or those with medical conditions that are dependent on using more water for
treatment and personal hygiene.
The large-scale metering options have been assessed as having significant negative effects
against the climate change objective during construction. This is due to the large number of
meters being installed and the embodied carbon within the meters, and the emissions
associated with their installation (vehicle movements). Following implementation, the same
options are assessed as having a significant positive effect against the same objective due to
the reduction in emissions from pumping, treating and distributing water and reduction in
energy use from heating water in the home. These options are also assessed as having a
significant positive effect against the economy objective during construction due to the large
number of meters that would require installation, and employment opportunities that result.
Options C005, C069 and C075 and the tariff options were also assessed as having a significant
positive effect against objective 8 (wise use of resources) as a result of the reduction in energy
use (treatment, pumping, distribution and heating water in the home) during operation.
Demand side measures such as metering and water efficiency options were screened out and
not considered further in the HRA. This was because collectively they are likely to have a
positive effect on European sites by reducing water demand. The only potential mechanism
for a negative effect would be through direct encroachment at the local level. For example, if
a meter was installed in or near a Special Area of Conservation (SAC). Further information on
why it was appropriate to screen out demand side measures is included in Section 3 of the
HRA.
Optant Number
Option Name AISC at Average
Deployable Output (p/m3)
Yield (Ml/d)
C005 Not for Revenue Optional Metering (Smart)
281 0.1
C069 Smart Metering New Properties
46.6 0.2
C075 Smart Metering Existing Properties
191 1.4
Table 43: Metering Options

115
6.8.2 Water Efficiency Options
The core objectives of all these options are to ‘free up’ resources to make them available to
meet supply demand deficits.
The first water efficiency option refers to offering subsidies to customers who have purchased
water efficient appliances. This option involves the introduction of a Portsmouth Water
funded subsidy (i.e. vouchers) on water efficient washing machines and dishwashers. The
rationale behind this option is to encourage wider uptake of water efficient appliances
amongst customers (C026a).
The second option would be to retrofit existing toilets. Retrofitting using dual flush
mechanisms in toilets in household and non-household properties would replace existing
higher flush volume mechanisms. The rationale behind this option would be to reduce
demand for water used for toilet flushing.
The third option would be to retrofit spray fittings to existing taps in household and non-
household properties. This would be applied to bathroom taps as kitchen use is often more
volume driven whereas wash basin taps is often ‘action’ driven. Spray inserts are only suitable
for taps with round flow diameters. The rationale behind this option is that spray fitting
reduces the volume of water that passes through the tap each time it is used (compared to a
tap that does not have a spray fitting).
The fourth option is to fit Water Butts and trigger guns to properties with gardens.
The fifth option would be to run a Water Efficiency Programme in association with partners
such as Housing Associations and possible Southern Water.
Water efficiency is included in the demand forecast in the form of falling average per capita
consumption. This is a result of the impact of optional metering and changes in customer
behaviour. Metering and water efficiency will be promoted via the company’s website and
through joint work with other organisations such as the National Park Authority and Wildlife
Trusts.
The water efficiency options were assessed by AMEC as having neutral effects against most
of the SEA objectives during construction and operation. Minor positive and minor negative
effects were recorded against three of the objectives (water, climate change and use of
resources) reflecting benefits of water savings, and minor increases or decreases in energy
use and carbon emissions during construction and operation.

116
Option Number
Option Name AISC at Average Deployable
Output (p/m3)
Yield (Ml/d)
C026 Subsidiary to customers that purchase water efficient appliances – washing machines and dishwashers
-14.7 0.1
C034 Water savings devices – retrofitting existing toilets
11.2 0.1
C040 Water saving devices – retrofitting spray fittings to taps
426 0.1
C043 Fit Water Butts and Trigger Guns
274 0.1
C046 Water Efficiency Programme -21.7 1.2
Table 44: Water Efficiency Options
6.9 Drought Options
The Government’s Guiding Principles and the Water Resources Planning Guideline both
require companies to consider drought or resilience options. These can take the form of
supply options, such as Drought Permits, or customer side measures such as demand
restrictions. AMEC were asked to consider these options as part of the appraisal process and
the SEA/HRA assessment.
The first drought option is voluntary calls for restraint and additional leakage control as the
drought starts. The triggers for this action are set out in the Drought Plan but it is likely to
happen in the 1 in 40 Historic Drought Scenario. It has been assumed that demand will fall by
approximately 2.5% and this represents 4.3 Ml/d under all scenarios.
The second drought option is the introduction of Temporary Bans. These would be triggered
by the Drought Plan under the 1 in 80 Extended Drought Scenario. It has been assumed that
demand will fall by an additional 5% and this represents 8.3 Ml/d. The Drought Plan now
contains additional concessions and these reduce the potential savings from Temporary Bans.
The third drought option is the introduction of Drought Directions by the Secretary of State.
These require a ‘Serious Shortage of Rainfall’ and include restrictions on commercial demand
previously known as Non-essential Use Bans. These restrictions would be in place under the
Serious Drought Scenario and a further 5% reduction in demand would be expected. This
represents a 7.9 Ml/d benefit to the supply/demand balance.
The final drought option is the introduction of the Source S Drought Permit. This would allow
more water to be abstracted from the QRST Group of licences. This option would be
introduced as and when required under the Drought Directions. It would be implemented in
association with Southern Water who have two other abstractions in the area. Details of the
Source S Drought Permit are given in the Draft Drought Plan 2018 due to be published at the
same time as the Draft WRMP2019.

117
Option Number
Option Name AISC at Average Deployable
Output (p/m3)
Yield (Ml/d)
C078 Voluntary Restraint 102 4.3
C079 Temporary Bans 163 8.3
C080 Non Essential Use Bans 136 7.9
R068 Source S Drought Permit 5.3 8.5
Table 45: Drought Options
6.10 Current Operations
In undertaking the options appraisal Portsmouth Water has considered if any of the options
identified should be implemented even if a surplus exists over the planning period.
The Company reviewed the AISC for each option; if a scheme was assessed to have a negative
AISC then the conclusion would be the benefits of the scheme outweigh the costs. Schemes
were identified with negative AISC for water efficiency and these will be included in the water
efficiency program.

118
7 FINAL PLANNING
7.1 Introduction
In developing the final planning solution, the Company has given due consideration to the
issues raised by stakeholders throughout the pre-consultation process.
In selecting the final planning solution, the Company has sought to balance the expectations
of customers, the needs of the environment and Government policy priorities.
The baseline supply/demand balance shows a deficit at average and peak week (Section 5.3).
This means that the existing supply network can’t cope with future demands and all of the
assumed uncertainties and risks.
The results of WRSE identify further bulk supplies from Portsmouth Water to neighbouring
companies. Portsmouth Water has included bulk supplies that other companies have agreed
to in principal. These bulk supplies drive the supply/demand balance and the need for
resource options.
7.2 Selection of the Final Planning Solution
The Water Resources Planning Guideline sets out the steps that the options appraisal should
follow. These include data collection, problem characterisation and modelling to find a
solution. The Final Planning Solution represents Portsmouth Water’s preferred, or best valve
solution, rather than the least cost solution. It takes account of resilience, environmental
protection and customer preferences. Sensitivity analysis checks that the Final Planning
Solution is robust to possible changes in forecasts or availability of resources.
7.2.1 Planning Information
The WRMP is based on the best available information for properties and population and for
the commercial demand forecast. Outage and headroom has been re-calculated and
deployable output has been re-assessed. Additional bulk supplies have been provisionally
agreed and the drought options have been incorporated into the WRMP.
7.2.2 Unconstrained Options
A full list of unconstrained options was considered including third party options, drought
options and demand management options. A list of feasible options was then developed with
the assistance of the Regulators and other stakeholders.
7.2.3 Problem Characterisation
The initial problem characterisation was produced in July 2016 prior to agreement about the
new bulk supplies and the re-assessment of deployable output. It assessed Portsmouth Water
as having no problem to solve and with a low complexity score. The size of the bulk supplies,
and the resource schemes that are required to meet them, mean that the Characteristic has
now changed. It is now likely that the problem has a medium score and the complexity has
also risen to medium.
7.2.4 Modelling Method
Despite the problem characterisation rising from low to medium, Portsmouth Water feel that
the conventional Economics of Balancing Supply and Demand (EBSD) approach is still
acceptable. Modelling carried out for Water Resources in the South East (WRSE) uses more
sophisticated techniques. In general these have produced the same range of options and the

119
same implementation timetable. In this document options are compared using Average
Incremental and Social Costs (AISC). The full cost profiles are commercially confidential and
are not in the public domain.
7.2.5 Options Selected
The timing of the new bulk supplies, and the earliest completion dates of the options, means
that all of the feasible options are selected as soon as possible in the planning period. Some
schemes are mutually dependant on others, such as Budds Farm Effluent Re-Use, and must
follow in sequence.
Option Description Yield (Ml/d)
D005 District Metering 5.0
C026-46 Water Efficiency 1.6
C078-80 Drought Measures 20.7
R013 Havant Thicket Reservoir 23
R021a Source O DO Recovery 1.8
R022a Source J Boreholes 12.5
R023a Source H DO Recovery 2.0
R024 Source C DO Recovery 4.0
R068 Source S Drought Permit 8.5
Table 46: Selected Options
In addition to these options Portsmouth Water will enhance its optional metering programme
within the baseline provision. ‘Not for revenue’ metering will ensure that the original target
of 5,000 meters per year is reached. This is reflected in the baseline demand forecast and
results in the overall fall in per capita consumption and the flat demand profile over the
planning period.
7.3 Final Planning Solution Constraints
The final planning solution is influenced by external factors such as Government Policy and
the involvement of third party water suppliers. They key considerations are as follows:
The Company is not in an ‘Area of Serious Water Stress’ and is unable legally
to compulsory meter its domestic customers
No third party suppliers of water made a firm proposal to Portsmouth Water
The surrounding Water Companies have current or future deficits and are
unable to supply water to Portsmouth Water
Government Policy expects per capita consumption and/or overall demand
to fall with time
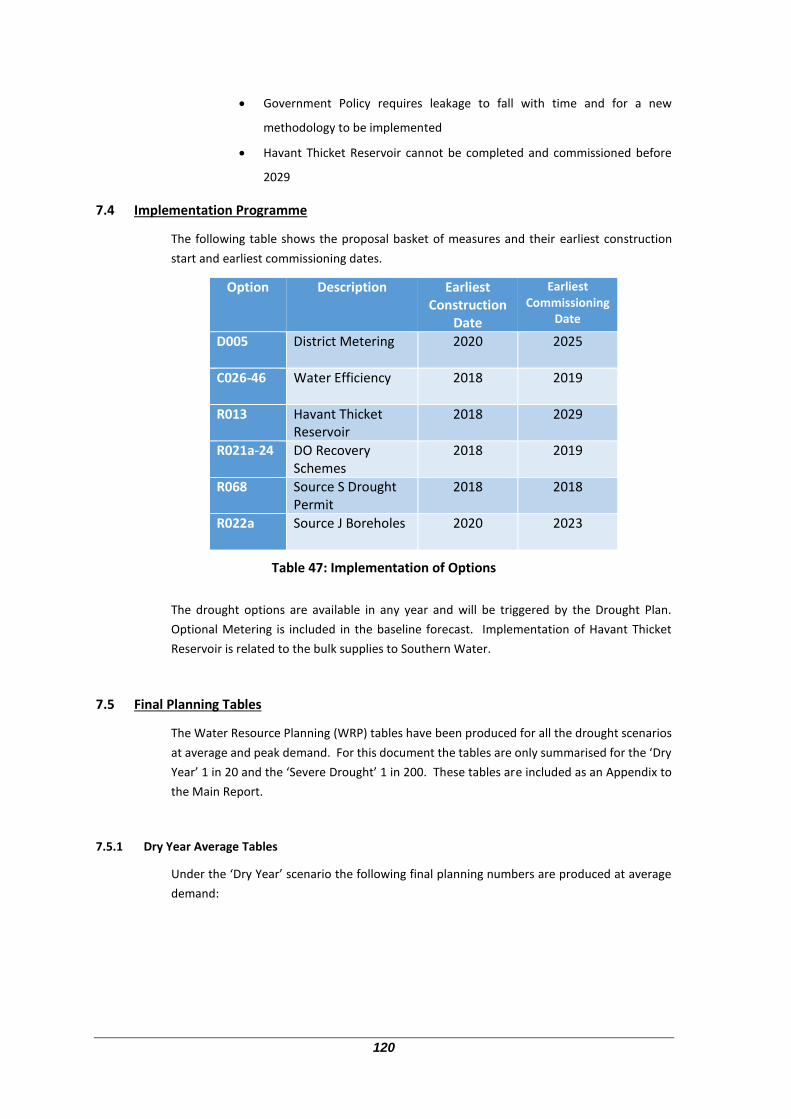
120
Government Policy requires leakage to fall with time and for a new
methodology to be implemented
Havant Thicket Reservoir cannot be completed and commissioned before
2029
7.4 Implementation Programme
The following table shows the proposal basket of measures and their earliest construction
start and earliest commissioning dates.
Option Description Earliest Construction
Date
Earliest Commissioning
Date
D005 District Metering 2020 2025
C026-46 Water Efficiency 2018 2019
R013 Havant Thicket Reservoir
2018 2029
R021a-24 DO Recovery Schemes
2018 2019
R068 Source S Drought Permit
2018 2018
R022a Source J Boreholes 2020 2023
Table 47: Implementation of Options
The drought options are available in any year and will be triggered by the Drought Plan.
Optional Metering is included in the baseline forecast. Implementation of Havant Thicket
Reservoir is related to the bulk supplies to Southern Water.
7.5 Final Planning Tables
The Water Resource Planning (WRP) tables have been produced for all the drought scenarios
at average and peak demand. For this document the tables are only summarised for the ‘Dry
Year’ 1 in 20 and the ‘Severe Drought’ 1 in 200. These tables are included as an Appendix to
the Main Report.
7.5.1 Dry Year Average Tables
Under the ‘Dry Year’ scenario the following final planning numbers are produced at average
demand:
121
2019/20 2024/25 2029/30 2034/35 2039/40 2044/45
Distribution Input 170.8 170.0 170.3 171.4 172.8 174.6
Demand Management 1.2 6.6 6.6 6.6 6.6 6.6
Deployable Output 226.5 226.5 226.5 226.5 226.5 226.5
Resource Schemes 7.8 20.3 43.3 43.3 43.3 43.3
Process Losses 2.4 2.4 2.4 2.4 2.4 2.4
Climate Change 0.0 0.2 0.4 0.6 0.8 1.0
Outage 14.7 14.7 14.7 14.7 14.7 14.7
WAFU 217.2 229.5 252.3 252.1 251.9 251.7
Bulk Supplies 30.0 39.0 60.0 60.0 60.0 60.0
Total WAFU 187.2 190.5 192.3 192.1 191.9 191.7
Target Headroom 11.8 13.2 14.7 15.6 17.1 18.0
Available Headroom 17.6 27.1 28.6 27.3 25.7 23.7
Supply Demand Balance
5.8 13.9 13.9 11.7 8.6 5.7
Table 48: Final Planning Table ‘Annual Average’ Dry Year
7.5.2 Dry Year Annual Average Graph
The data in the tables can be expressed graphically as this is done in WRZ Summary tab of the
WRP tables.
Figure 43: Final Planning ‘Annual Average’ Dry Year
Compared to the baseline graph the red line (Total WAFU) is now above the blue line that
represents total demand. Total WAFU includes reductions to represent the bulk supplies and
increases to represent the resources options. Demand Management reduces the total
demand line but this is more obvious in the drought scenarios (see below).
0
50
100
150
200
250
20
20
-21
20
22
-23
20
24
-25
20
26
-27
20
28
-29
20
30
-203
1
20
32
-33
20
34
-35
20
36
-37
20
38
-39
20
40
-41
20
42
-43
20
44
-45
Ml/
d
Measured household consumption Unmeasured household consumption
Non-household consumption Total leakage
Other components of demand Total water available for use
Total demand + target headroom (final plan)

122
7.5.3 Severe Drought Average Table
Under the ‘Severe Drought’ scenario the final planning numbers at average demand are as
follows:
2019/20 2024/25 2029/30 2034/35 2039/40 2044/45
Distribution Input 170.8 170.0 170.3 171.4 172.8 174.6
Demand Management
21.7 27.1 27.1 27.1 27.1 27.1
Deployable Output 190.7 190.7 190.7 190.7 190.7 190.7
Resource Schemes 16.3 28.8 51.8 51.8 51.8 51.8
Process Losses 2.4 2.4 2.4 2.4 2.4 2.4
Climate Change 0.0 0.2 0.4 0.6 0.8 1.0
Outage 14.7 14.7 14.7 14.7 14.7 14.7
WAFU 189.9 202.2 225.0 224.8 224.6 224.4
Bulk Supplies 30.0 39.0 60.0 60.0 60.0 60.0
Total WAFU 159.9 163.2 165.0 164.8 164.6 164.4
Target Headroom 11.8 13.2 14.7 15.6 17.1 18.0
Available Headroom
10.8 20.3 21.8 20.5 18.9 16.9
Supply Demand Balance
-1.0 7.1 7.1 4.9 1.8 -1.1
Table 49: Final Planning Table ‘Annual Average’ Severe Drought
The reduction in demand in Table is a result of the implementation of Temporary Bans and
Non-essential Use Bans. There is a small deficit in the early years due to the commissioning of
the second bulk supply to Southern Water. Available headroom is still 10.8 Ml/d.
7.5.4 Severe Drought Annual Average Graph
Figure 44: Final Planning Annual Average Severe Drought
0
20
40
60
80
100
120
140
160
180
20
20
-21
20
22
-23
20
24
-25
20
26
-27
20
28
-29
20
30
-203
1
20
32
-33
20
34
-35
20
36
-37
20
38
-39
20
40
-41
20
42
-43
20
44
-45
Tit
le
Measured household consumption Unmeasured household consumption
Non-household consumption Total leakage
Other components of demand Total water available for use
Total demand + target headroom (final plan)

123
Under Severe Drought conditions although deployable output is much lower so is demand.
This means that target headroom is met in all but the early years when the bulk supply to
Southern is increased.
7.5.5 Dry Year Peak Week Tables
Under the ‘Dry Year’ scenario the following final planning numbers are produced at peak week
demand.
Table 50: Final Planning Table ‘Peak Week’ Dry Year
When these numbers are compared with the annual average table it is clear that ‘Peak Week’
is not the critical time period. This is because peak week deployable output is much higher as
more licenced abstraction is available during this period.
2019/20 2024/25 2029/30 2034/35 2039/40 2044/45
Distribution Input
213.5 212.0 212.3 213.9 215.8 218.3
Demand Management
1.2 6.6 6.6 6.6 6.6 6.6
Deployable Output
280.3 280.3 280.3 280.3 280.3 280.3
Resource Schemes
11.8 26.8 76.8 76.8 76.8 76.8
Process Losses 2.4 2.4 2.4 2.4 2.4 2.4
Climate Change 0.2 0.7 1.2 1.7 2.2 2.7
Outage 12.5 12.5 12.5 12.5 12.5 12.5
WAFU 277.0 291.5 341.0 340.5 340.0 339.5
Bulk Supplies 30.0 39.0 60.0 60.0 60.0 60.0
Total WAFU 247.0 252.5 281.0 280.5 280.0 279.5
Target Headroom
13.9 15.7 17.8 19.3 21.4 22.3
Available Headroom
34.7 47.1 75.3 73.2 70.8 67.8
Supply Demand Balance
20.8 31.4 57.5 53.9 49.4 45.5

124
7.5.6 Dry Year Peak Week Graph
The Dry Year peak week graph shows a surplus for the whole of the planning period.
Figure 45: Final Planning Peak Week Dry Year
7.5.7 Severe Drought Peak Week Table
Under the ‘Severe Drought’ scenario the following numbers are produced at peak week
demand.
2019/20
2024/25
2029/30
2034/35
2039/40
2044/45
Distribution Input 213.5 212.0 212.3 213.9 215.8 218.3
Demand Management
50.0 55.4 55.4 55.4 55.4 55.4
Deployable Output 235.6 235.6 235.6 235.6 235.6 235.6
Resource Schemes 20.3 35.3 85.3 85.3 85.3 85.3
Process Losses 2.4 2.4 2.4 2.4 2.4 2.4
Climate Change 0.2 0.7 1.2 1.7 2.2 2.7
Outage 12.5 12.5 12.5 12.5 12.5 12.5
WAFU 240.8 255.3 304.8 304.3 303.8 303.3
Bulk Supplies 30.0 39.0 60.0 60.0 60.0 60.0
Total WAFU 210.8 216.3 244.8 244.3 243.8 243.3
Target Headroom 13.9 15.7 17.8 19.3 21.4 22.3
Available Headroom
47.3 59.7 87.9 85.8 83.4 80.4
Supply Demand Balance
33.4 44.0 70.1 66.5 62.0 58.1
Table 51: Final Planning Peak Week Severe Drought
Compared to the ‘Dry Year’ the ‘Severe Drought’ peak week surplus are slightly higher due to
the impact of demand restrictions.
0
50
100
150
200
250
300
20
20
-21
20
22
-23
20
24
-25
20
26
-27
20
28
-29
20
30
-203
1
20
32
-33
20
34
-35
20
36
-37
20
38
-39
20
40
-41
20
42
-43
20
44
-45
Ml/
d
Measured household consumption Unmeasured household consumption
Non-household consumption Total leakage
Other components of demand Total water available for use
Total demand + target headroom (final plan)

125
7.5.8 Severe Drought Peak Week Graph
The severe drought graph shows a surplus for the whole of the planning period.
Figure 46: Final Planning Peak Week Severe Drought
7.6 Final Planning Per Capita Consumption
The Government set an aspiration for average per capita consumption to fall to 130 l/h/d by
2030.
The Final Planning for the ‘Normal Year’ are not included in the WRMP but they show that the
average per capita consumption falls to 130 l/h/d by 2034. This is a result of water efficiency,
optional metering and changes in customer behaviour. Housing growth will see a greater
percentage of water efficient fixtures and fittings in the community. Metering and potential
future tariffs could cause further falls in PCC.
7.7 Compliance with the Directions
As part of the water resources planning process Defra and the Environment Agency set out
the ‘Guiding Principles’ (Ofwat, Environment Agency and Defra, 2016). Appendix ‘L’ to this
document sets out the ‘Directions’ which the water companies must comply with. Portsmouth
Water has added an assessment of what has been included in the WRMP2019 and where it is
included. This detailed summary is included in Appendix ‘L’ but some of the key issues are set
out below:
25 year planning period
How frequently demand restrictions will be imposed
Options appraisal methodology including SEA
Climate change impacts
Population and housing forecasts
Compulsory metering options
Optional metering options
Implementation programme
Reasons for not using compulsory metering
0
50
100
150
200
250
300
20
20
-21
20
22
-23
20
24
-25
20
26
-27
20
28
-29
20
30
-203
1
20
32
-33
20
34
-35
20
36
-37
20
38
-39
20
40
-41
20
42
-43
20
44
-45
Ml/
d
Measured household consumption Unmeasured household consumption
Non-household consumption Total leakage
Other components of demand Total water available for use
Total demand + target headroom (final plan)

126
Statutory consultation process
Statutory publication process
Portsmouth Water considers that they have complied with all the relevant directions in
preparing the WRMP.
7.8 Government Policies Influencing this Plan
Portsmouth Water believes that the WRMP meets the policy priorities set out by Government.
The plan considers the long term supply challenges from population growth and climate
change.
The final planning solution has a forecast of falling average per capita consumption over the
planning period as a result of the ‘Metering not for revenue’ and ‘promotional optional
metering programme’.
The final planning solution also includes a reduction in leakage over the planning period as a
result of the installation of district metering.
The Company is an active member of the WRSE Group; and this has resulted in the inclusion
of additional bulk supplies in the WRMP.
7.9 Strategic Environmental Assessment and Habitats Regulation Assessment
The Strategic Environmental Assessment (SEA) of the draft Plan has assessed the impact on
the water environment as neutral. The proposed bulk supply exports to Southern Water and
South East Water would be sourced from existing sustainable licences and are considered
unlikely to prevent Water Framework Directive objectives being achieved. The construction
of the new bulk supply pipelines have been assessed as having significant negative effects
during construction against the climate change objective due to carbon emissions during
construction and embodied in materials. During operation, no significant negative effects
have been identified. The cumulative effect of the options has been assessed as having a
significant positive effect on the economy of the region as the additional yield generated by
these options will help to meet the needs of economic growth in the region.
The Habitats Regulation Assessment of the Base Plan concluded that;
The schemes will operate within existing abstraction license volumes and there will be no
likely significant effects on any European sites as a result of the operation of these
schemes, alone or in combination with other plans or projects
No likely significant effects on any European sites have been identified, as a result of
construction of the schemes, either alone or in combination with other plans or projects,
assuming that normal best practice measures are taken.
The WRMP will have no likely significant effects on any European sites as a result of its
implementation, alone or in combination with other plans or projects
The complete SEA and HRA reports can be found in Appendix ‘O’ and ’P’.

127
7.10 Commitment to Further Work
The Company’s previous WRMP set out a commitment to undertake further work on
deployable output and resilience. The Company believes it has met this commitment and this
is clearly presented in the relevant sections of the plan.
7.11 Water Framework Directive
The WRPG recommends that companies should assess if the net changes in its operations as
a result of the plan has the potential to cause a water body to deteriorate. The Company
notes that the WRMP includes two bulk supplies which may cause a net change in operations.
For each bulk supply the Company sets out how it has considered this impact.
7.11.1 Bulk Supply from the River Itchen to Southampton
This bulk supply will result in increased abstraction from the River Itchen by Portsmouth
Water compared to current levels. However the abstraction will be further downstream than
Southern Water’s abstraction which will reduce. The current licence was revised in 2013 to
comply with the Habitats Directive and is considered sustainable therefore it is unlikely to
result in a deterioration of water body status.
7.11.2 Renewal of Bulk Supply to Sussex North
The current bulk supply from Portsmouth Water to Southern Water was renewed in 2016 and
has been included in the plan.
7.12 In combination effects
The Company has included the Southern Water bulk supplies in the WRMP and the SEA has
been modified to include the impact of the bulk supply pipelines in both the South East and
Southern Water’s area of supply. Additional work on the ‘In combination’ effects of the bulk
supplies was carried out as part of the WRSE work. Although other bulk supplies cross the
South Downs National Park they are not in the same area and do not have the same timings.

128
8 TESTING THE PLAN
8.1 Introduction
In order to demonstrate the robustness of its plan, Portsmouth Water has undertaken a series
of sensitivity tests around key assumptions in the base plan. The sensitivity analysis considers
the uncertainty of inputs across the plan such as demand and deployable output.
To test the draft WRMP19 plan 15 scenarios are tested against the Final Planning Supply-
Demand Balance (SDB):
1. Planned Growth: For WRMP19 Portsmouth Water is using a ‘Trend’ based
forecast provided by Experian. Water companies have been asked to account for
‘Planned’ growth derived from Local Authority plans; which Experian also
produced for the Company. The ‘Trend’ forecasts delivers a very similar amount
of new properties over the planning period however places most new growth in
the first half of the plan. This scenario therefore is testing the impact on the SDB
with more housing in the first half of the period
2. Low Growth: The effect on the SDB as a result of the ‘Low’ population and
property growth scenario (with a 10% chance of growth being below this level).
3. High Growth: The effect on the SDB as a result of the ‘High’ population and
property growth scenario (with a 90% chance of growth being below this level).
4. Low Climate Change (on demand): The effect on the SDB as a result of the ‘Low’
climate change scenario (q10).
5. High Climate Change (on demand): The effect on the SDB as a result of the ‘High’
climate change scenario (q90).
6. Low Metering: The impact of achieving 50% of the targeted meter optants in
each year.
7. High Metering: The impact of achieving 150% of the targeted meter optants in
each year.
8. High+ Metering: The impact of only achieving 200% of the targeted meter
optants in each year.
9. Compulsory Metering: The impact of compulsory metering in the year 2025/26
with meter penetration up to 90% (15% saving assumed).
10. Leakage: No reduction: No reduction in leakage assumed during the planning
period.
11. Leakage: 7 Ml/d DMA reduction (2 Ml/d More than baseline): Leakage reduced
by a further 2Ml/d on top of 5Ml/d assumed in Final Plan
12. Leakage: 3 Ml/d DMA reduction (2 Ml/d Less than baseline): Leakage reduced
3Ml/d, 2Ml/d less than that assumed to occur as a result of the installation of the
additional DMAs.
13. Bulk Supply (Capped at 30 Ml/d): The impact of no further bulk supply exports
beyond the currently confirmed 30 Ml/d to Southern Water on the East and West
of the company area.
14. Deployable Output (5%): The impact of an increase in DO by 5%.
15. Deployable Output (-5%): The impact a decrease in DO by 5%

129
8.2 Sensitivity of the Plan
Figure 47 presents the Supply/Demand Balances for the given scenarios tested against the
Final Planning tables.
Figure 47: Scenario Supply/Demand Balances (Ml/d)
The plan is resilient to most of the 15 scenarios with the exception of scenario 2 and scenario
15.
With scenario 2, ‘High’ population and property growth, the SDB becomes negative in
2036/37. The probability of this level of growth occurring is just 10% therefore relatively low.
Furthermore, since the deficit does not occur for almost 20 years, it is logical that a planning
decision relating to this potential deficit is considered when the uncertainty of future growth
resolves itself in future planning cycles. Moreover, it should be noted that the options
selected in the first half of the planning period for supporting bulk supplies and meeting
leakage aspirations also provides some resilience to potentially high future growth.
A deficit is also generated over the planning period under scenario 15, ‘DO 5% ‘lower’. The
5% provides a notional test to the Final Planning Tables. The Company is confident that the
uncertainty as a result of the inaccuracies of modelling DO are sufficiently captured within
headroom. It does however highlight the importance that the Company maintains it’s DO
through operational maintenance. It also suggests that the impact of any future sustainability
reductions has upon the SDB and could result in further options being brought forward in
order to maintain the Company’s resilience and to secure bulk supplies to Southern Water.

130
9 NEXT STEPS
9.1 Publication Process
The formal process requires Portsmouth Water to publish this Draft Plan following approval from the
Secretary of State. This will be done on Portsmouth Water’s website www.portsmouthwater.co.uk.
Letters will be sent to each of the stakeholders and a hard copy of the main report will be available at the
Havant Office.
A Strategic Environmental Assessment has been carried out in parallel with the production of the
WRMP2019. The formal process requires Portsmouth Water to publish the ‘Post Adoption Statement’ and
will be published on the Company website. In addition letters will be sent to the statutory consultees and a
hard copy will be available for interested parties at the Havant Offices.
9.2 Water Resources Management Plan 2024
Work has already started on the next Water Resources Management Plan. Portsmouth Water is committed
to working with the Environment Agency and other stakeholders on a review of key assumptions. This will
include further work by the WRSE group on Robust Decision Making and the use of more sophisticated
models.

131
10 TABLE COMMENTARIES
The WRPG states that ‘water resources planning guideline supply-demand tables’ must
accompany the plan. These tables have to be filled in for the Dry Year scenario and the
Reference Scenario. If a Company is in deficit, a critical period table must also be completed.
More detail on what is included within the tables is in the technical instructions (Ofwat,
Environment Agency and Defra, 2016), whilst the completed WRP tables are in Appendix ‘AA’.
Each workbook contains baseline tables based on current policies and final planning tables
which represent the solution to any supply demand deficits.
The tables are based on the latest demand forecasts and the options that emerged from the
appraisal process. Portsmouth Water only has one water resources zone and the level of
service for a Dry Year is 1 in 20 and for the Reference Scenario it’s 1 in 200. There is a summary
for each set of tables with graphs of baseline and final planning data.
The baseline and final planning graphs are reproduced in the main text with data from the
2020, up to the planning horizon of 2045.
10.1 Dry Year – Annual Average
Hard copies of the WRP Tables are provided for the Dry Year Annual Average. The tables will
have also been provided electronically on the company website.
10.1.1 WRP Table 1
Table 1 sets out the abstraction licences available with the total licenced quantity and the
deployable output available for each source and for the company area. The group licences are
shown separately and there is one ‘Unused’ licence which provides raw water for river
augmentation. The total deployable output is different for each scenario but at its maximum
for the ‘Dry Year’ scenario.
10.1.2 WRP Table 2
Table 2 sets out the Baseline Supply position with lines for bulk supplies, total DO, climate
change impacts on DO, sustainability reductions, treatment works losses and outage.
10.1.3 WRP Table 3
Table 3 sets out the Baseline Demand position including household and non-household
demand, per capita consumption and total leakage and metering policy. Portsmouth Water
have included ‘Metering not for revenue’ and ‘Promotional’ optional metering in the baseline
forecast. Household population and property projections are based on Experian’s ‘Trend’
forecast adjusted for Portsmouth Water’s base year billing records.
10.1.4 WRP Table 4
Table 4 sets out the initial supply/demand balance with an allowance for target headroom.
10.1.5 WRP Table 5
Table 5 sets out the feasible options and the AISC calculation. The detailed cost profiles are
commercially confidential and are not included in the public WRMP documents.
10.1.6 WRP Table 6
Table 6 sets out ta preferred list of resource management and demand management options.
132
10.1.7 WRP Table 7
Table 7 sets out the Final Planning supply numbers with deployable output including the
preferred supply options. It also shows treatment works losses and the outage allowance.
10.1.8 WRP Table 8
Table 8 shows the Final Planning demand numbers with household and non-household
demand, per capita consumption, metering programme, property numbers and population
numbers.
10.1.9 WRP Table 9
Table 9 shows the Final Planning supply/demand balance with distribution input reflecting the
demand management schemes, including drought measures, and Water Available for Use
reflecting supply schemes. Target headroom allows the final supply surplus/deficit to be
calculated.
10.1.10 WRP Table 10
Table 10 is a summary of DO and DI for each of the scenarios and is the same for each set of
tables. Portsmouth Water currently has no surface water storage and demand restrictions
only impact the demand side of the balance. There is only one drought supply measure,
Source S Drought Permit’, but DO is different for each scenario. There and no DO impacts of
Demand Restrictions.
The Summary Report relates to the individual scenarios such as ‘Dry Year’ or ‘Severe Drought’.
The Baseline and Final Planning graphs are in the WRZ summary tab of the tables. The graphs
are reproduced in the main body of the report and clearly illustrate the impact of things like
the bulk supplies and the supply schemes over the planning period. Demand management
interruptions are more difficult to see because they apply to every year in the sequence if
they are selected. They show as lower total demands in the Final Planning graphs.
10.2 Dry Year – Peak Week
WRP tables are provided for the Dry Year ‘Critical Period’. The critical period is the peak week
which can now occur in August. Comparisons of the Baseline Planning deficits shows that the
peak week is no longer the critical time period in the WRMP. The deficits are higher under the
average demand condition when group licences have been used up and deployable output is
lower.
10.3 Severe Drought – Annual Average
The Severe Drought scenario has a return period of 1 in 200 years and represents the
reference level of service. This level of service refers to the avoidance of standpipes in the
street and rota cuts. Under this scenario all of the other drought management options are
implemented. This includes Source S Drought Permit and Non Essential Use Bans.
10.4 Severe Drought Peak Week
In a Severe Drought the Final Planning demand is significantly reduced by demand
management measures such as Temporary Bans and Non-essential Use Bans. In the peak
week the peaking factor is much lower and this time period is not critical.