Embed Size (px)
Citation preview
arX
iv:1
801.
0473
6v2
[as
tro-
ph.H
E]
29
Jun
2018
Draft version July 2, 2018Preprint typeset using LATEX style emulateapj v. 12/16/11
THE FIRST CONTINUOUS OPTICAL MONITORING OF THE TRANSITIONAL MILLISECOND PULSARPSR J1023+0038 WITH KEPLER
A. Papitto1, N. Rea2,3,4, F. Coti Zelati2,3, D. de Martino5, S. Scaringi6, S. Campana7, E. de Ona Wilhelmi2,3,C. Knigge8, A. Serenelli2,3, L. Stella1, D. F. Torres2,3,9, P. D’Avanzo7, G. L. Israel1
(Received; Revised July 2, 2018)Draft version July 2, 2018
ABSTRACT
We report on the first continuous, 80 day optical monitoring of the transitional millisecond pulsar PSRJ1023+0038 carried out in mid 2017 with Kepler in the K2 configuration, when an X-ray subluminousaccretion disk was present in the binary. Flares lasting from minutes to 14 hr were observed for15.6% of the time, which is a larger fraction than previously reported on the basis of X-ray and pastoptical observations, more frequently when the companion was at superior conjunction of the orbit. Asinusoidal modulation at the binary orbital period was also present with an amplitude of ≃16%, whichvaried by a few percent over timescales of days, and with a maximum that took place 890±85 s earlierthan the superior conjunction of the donor. We interpret this phenomena in terms of reprocessing ofthe X-ray emission by an asymmetrically heated companion star surface and/or a non-axisymmetricoutflow possibly launched close to the inner Lagrangian point. Furthermore, the non-flaring averageemission varied by up to ≈ 40% over a time scale of days in the absence of correspondingly largevariations of the irradiating X-ray flux. The latter suggests that the observed changes in the averageoptical luminosity might be due to variations of the geometry, size, and/or mass accretion rate in theouter regions of the accretion disk.Keywords: pulsars: individual (PSR J1023+0038) stars: neutron X-rays: binaries
1. INTRODUCTION
Binary systems hosting a neutron star (NS hereafter)that accretes matter from a low mass donor (NS-LMXB)are the progenitors of millisecond radio pulsars (MSP)powered by the rotation of the pulsar magnetic field. Thelink between MSPs and NS-LMXBs has been demon-strated by three transitional MSPs which switch be-tween accretion and rotation-powered states on timescales of days/months due to variations of the massinflow rate (PSR J1023+0038, Archibald et al. 2009;IGR J18245-2452, Papitto et al. 2013; XSS J12270-4859,de Martino et al. 2010; Bassa et al. 2014). In additionto accretion outbursts (LX = 1036−37 erg s−1) androtation-powered radio pulsar states (LX ≈ 1032 ergs−1), all three known transitional MSPs have been ob-served also into a peculiar X-ray sub-luminous disk state(LX = 1033−34 erg s−1).
Discovered as an eclipsing 1.69-ms radio pulsar in
1 INAF–Osservatorio Astronomico di Roma, via Frascati 33,I-00040, Monteporzio Catone (RM), Italy
2 Institute of Space Sciences (ICE, CSIC), Campus UAB, Car-rer de Can Magrans, 08193, Barcelona, Spain
3 Institut d’Estudis Espacials de Catalunya (IEEC), 08034Barcelona, Spain
4 Anton Pannekoek Institute for Astronomy, University ofAmsterdam, Postbus 94249, NL-1090-GE Amsterdam, TheNetherlands
5 INAF–Osservatorio Astronomico di Capodimonte, SalitaMoiariello 16, I-80131 Napoli, Italy
6 School of Physical and Chemical Sciences, University of Can-terbury, Christchurch 8041, New Zealand
7 INAF–Osservatorio Astronomico di Brera, via Bianchi 46,I-23807 Merate (LC), Italy
8 School of Physics and Astronomy, University of Southamp-ton, Highfield, Southampton SO17 1BJ, UK
9 Institucio Catalana de Recerca i Estudis Avancats (ICREA),E-08010 Barcelona, Spain
a 4.75-h binary that previously had an accretion disk(Archibald et al. 2009), PSR J1023+0038 entered in asub-luminous disk state in 2013 June. The transi-tion featured the appearance of a double-peaked Hαemission line in the optical spectrum (Halpern et al.2013), the disappearance of radio pulsations, and theincrease of the X-ray and gamma-ray by a factor ofabout ten and five, respectively (Stappers et al. 2014;Patruno et al. 2014; Tendulkar et al. 2014; Torres et al.2017). The X-ray emission switches from a high mode(LX ∼ 7 × 1033 erg s−1; 0.3–79 keV, 70–80% of thetime), to a low mode (LX ∼ 1033 erg s−1; 20% of thetime), and sometimes flares (LX ∼ 5 × 1034 erg s−1,2% of the time; Bogdanov et al. 2015, B15 hereafter,Jaodand et al. 2016, J16 henceforth) on a timescale oftens of seconds. Coherent X-ray pulsations assumed tobe accretion-powered were detected during the high mode(but not in the low mode; Archibald et al. 2015). Theoptical emission of PSR J1023+0038 in the disk state(g ≃ 16.5 mag) became one magnitude brighter than inthe radio pulsar state (g ≃ 17.5), and was dominatedby the reprocessing of the X-ray emission from the diskand the illuminated face of the donor (Coti Zelati et al.2014, CZ14 hereafter). Flares were also observed in theoptical band (Bond et al. 2002, B15) and sometimes alsoa mode switching similar to that observed in X-rays(Shahbaz et al. 2015, S15 henceforth). Optical pulsa-tions with an amplitude of less than 1% were also de-tected; even if observed when the source had a disk,they could be hardly reconciled with accretion and sug-gested that a rotation-powered pulsar might be operat-ing (Ambrosino et al. 2017). In this paper we present anextensive optical monitoring performed with the NASAKepler Space Telescope when the source was in its cur-
2 Papitto et al.
1
2
3
4
0 20 40 60 80 100
1
2
3
4
100 120 140 160 180 200
1
2
3
4
200 220 240 260 280 300
1
2
3
4
300 320 340 360 380 400Orbital cycles since Tasc
Kep
ler
coun
t rat
e (1
03 e- s
-1)
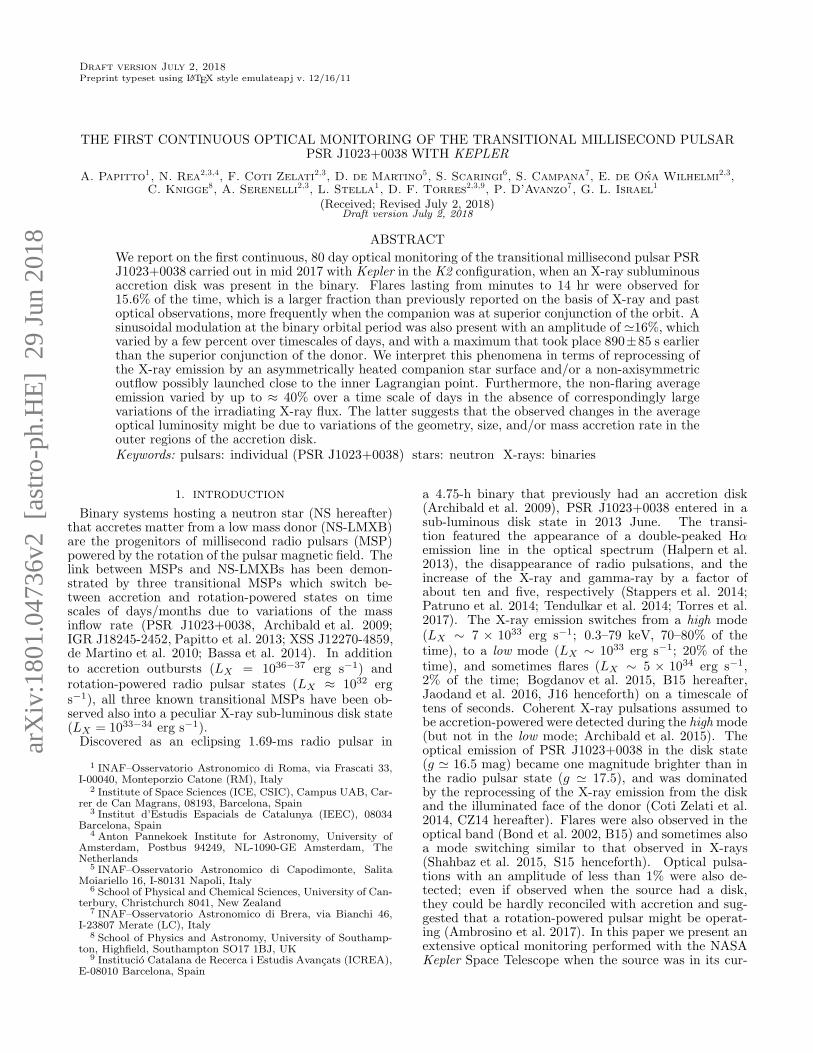
Figure 1. PSR J1023+0038 optical light curve observed by K2. Time is expressed in orbital cycles since Tasc = 57905.1493086 MJD,assuming Porb = 17115.5216592 s (Jaodand et al. 2016, Papitto et al. in prep.). Flares are plotted with red dots, while the non-flaringemission is plotted using blue dots. The black solid line is the best-fitting model of the non-flaring emission (see text for details).
rent sub-luminous accretion disk state.
2. K2 OBSERVATIONS, ANALYSIS AND RESULTS
PSR J1023+0038 was observed by the K2 mission dur-ing the campaign 14 between 2017-06-01 05:21:11 UTand 2017-08-19 21:56:19 UT (see Fig. 1). Here we anal-yse short cadence (SC) data (cadence of 58.8 s) obtainedfrom the Mikulski Archive for Space Telescope (MAST)archive. The data is provided in raw format, consist-ing of target pixel data. For each 58.8 s exposure wethus have a 8x8 pixel image centered on the target. PSRJ1023+0038 was near the edge of module 16.4. Althoughthis module is not known to be affected by Moire Pat-tern Drift (MPD) noise, the target point spread function(PSF) is asymmetric as it lies at the edge of one of theoutermost modules. As no other sources are known toexist within the 8x8 pixel images, we created the lightcurve by manually defining a large target mask as wellas a background mask. A large target mask is requireddue to occasional small scale jittering of the spacecraft,
resulting in the target moving slightly from its nominalposition, as well as including the elongated PSF of PSRJ1023+0038. The inset in the lower left corner of Fig. 2shows the average masks obtained from 117,030 individ-ual target images, as well as the background pixels used.We removed 1,691 observations because of bad qualitydue to occasional spacecraft rolls or due to cosmic rays.Fig. 2 also shows the target and background masks inred and black respectively. We produced the lightcurveby summing together all target pixels for each exposure,and subtracted the average background. The photomet-ric time series was then converted to the Solar Systembarycenter.
To convert Kepler flux to magnitudes, we consideredtwo Hubble Space Telescope STIS/CCD 1 s-long unfil-tered acquisition (ACQ) images taken on 2017-06-13 andavailable at MAST archive. Assuming the same spec-tral energy distribution observed in 2014 (see Fig. 4.3of Hernandez Santisteban 2016), the HST count ratetranslates into magnitudes of g = 16.47(4) and r =
Kepler observations of PSR J1023+0038 3
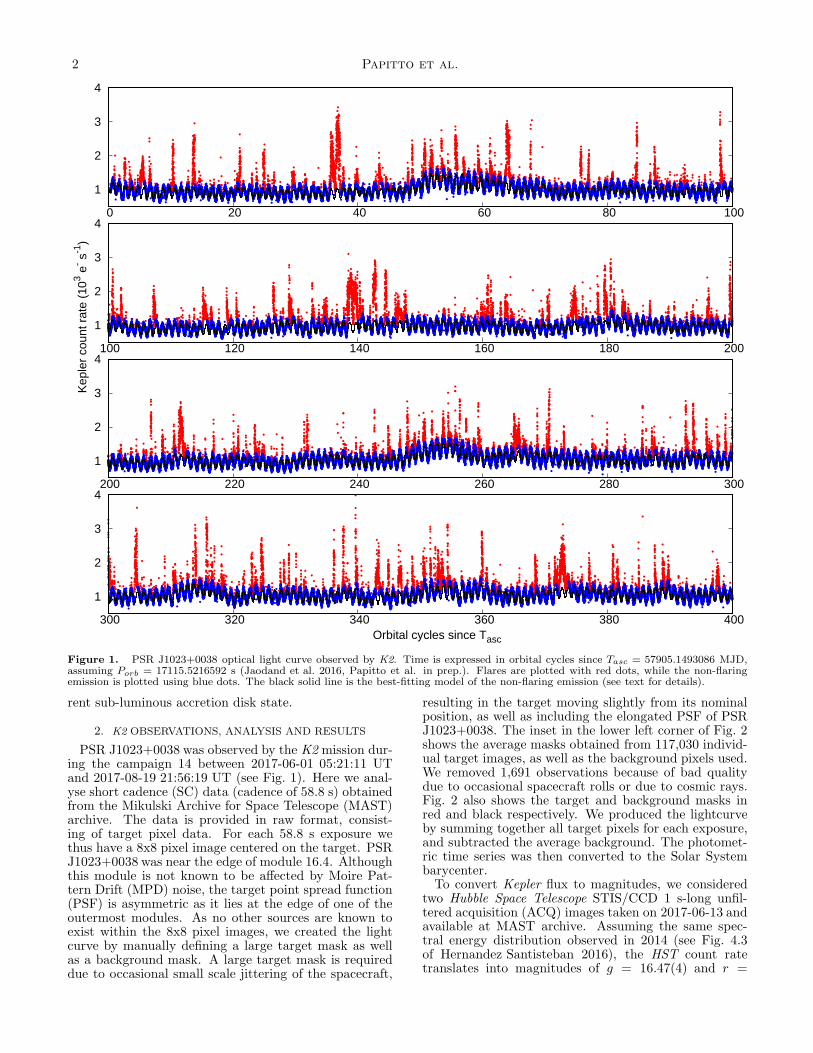
Figure 2. Power density spectrum obtained averaging 15 inter-vals, each 3 days-long, and normalized to give the squared rmsfractional variability. The red-line shows a power law functionP (ν) ∝ νβ , with β = −1.12± 0.01. The inset in the lower left cor-ner shows the K2 average target pixel image for PSR J1023+0038.The target mask pixels are marked in red, whilst background maskpixels are marked in black. The inset in the upper right cornershows the residual light curve folded at the 4.75h orbital period,after removing the flares and the long-term trend evaluated with aquadratic function over 2 d-long intervals. The red solid line showsthe best-fitting two-harmonics decomposition, the green and theblue solid lines show the first and the second harmonic, respec-tively.
16.48(4) mag. The average flux observed by Kepler dur-ing the 1 minute-long intervals overlapping with HSTobservations was S0 = 1323(5) e−/s ; using the relationgiven by Brown et al. (2011) to estimate the Kepler mag-nitude as Kp = 0.1g+ 0.9r for (g− r) ≤ 0.8, we obtainedthe conversion Kp = 16.48−2.5 log (S/S0), where S is theKepler flux in e−/s . Variability on time scales shorterthan the Kepler time resolution and flux-dependent colorchanges both introduce an uncertainty by ∼ 0.1 mag.
The Kepler light curve is highly variable (< S >= 1083e−/s , Srms = 286 e−/s ; Fig. 1), reaching up to 3950e−/s (i.e., Kp ≃15.3 mag). We identified: (i) flares last-ing from minutes up to ∼ 14 hours, (ii) a periodic mod-ulation at the 4.75 hr binary orbital period, and (iii)a variation of the average optical luminosity over a timescale of days. Figure 2 shows the power density spectrumcalculated averaging 3 days-long intervals, and normal-ized to the fractional rms amplitude per unit frequency.The spectrum is approximately described by a power lawP (ν) ∝ νβ with β = −1.12 ± 0.01 (errors are given at 1-σ confidence level throughout the paper), similar to thevalue found by S15, above which an excess peaking atthe orbital frequency is evident (see Fig. 2).
2.1. Flaring orbital variability
In order to study the flare characteristics, we first iso-lated them from the lower amplitude variations. To thisaim we divided the K2 light curve into 41 intervals eachspanning 10 orbital cycles (i.e. ≃2 days), and fitted thecount rate with a function consisting of the sum of aquadratic polynomial function and a Fourier decomposi-tion with period Porb = 17115.5216592 s (J16). In someof the intervals up to seven harmonic components weredetected, while two were enough in most of the cases. Wemodeled with a Gaussian function the negative portionof the distribution of light curve residuals with respect
0
500
1000
1500
2000
2500
3000
-200 0 200 400 600 800 1000Flux residuals (e-/s)
Num
ber
of o
ccur
renc
es
0 0.25 0.5 0.75 1
800
1000
1200
Num
ber
of o
ccur
renc
es
Orbital Phase
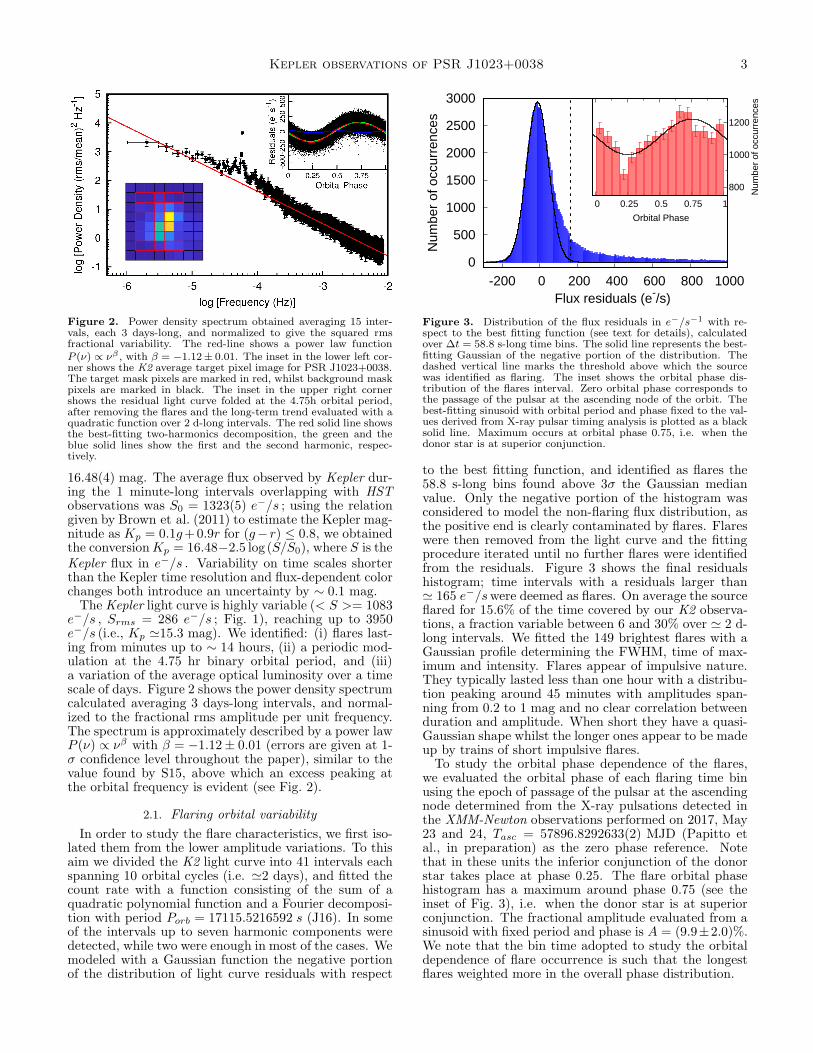
Figure 3. Distribution of the flux residuals in e−/s−1 with re-spect to the best fitting function (see text for details), calculatedover ∆t = 58.8 s-long time bins. The solid line represents the best-fitting Gaussian of the negative portion of the distribution. Thedashed vertical line marks the threshold above which the sourcewas identified as flaring. The inset shows the orbital phase dis-tribution of the flares interval. Zero orbital phase corresponds tothe passage of the pulsar at the ascending node of the orbit. Thebest-fitting sinusoid with orbital period and phase fixed to the val-ues derived from X-ray pulsar timing analysis is plotted as a blacksolid line. Maximum occurs at orbital phase 0.75, i.e. when thedonor star is at superior conjunction.
to the best fitting function, and identified as flares the58.8 s-long bins found above 3σ the Gaussian medianvalue. Only the negative portion of the histogram wasconsidered to model the non-flaring flux distribution, asthe positive end is clearly contaminated by flares. Flareswere then removed from the light curve and the fittingprocedure iterated until no further flares were identifiedfrom the residuals. Figure 3 shows the final residualshistogram; time intervals with a residuals larger than≃ 165 e−/swere deemed as flares. On average the sourceflared for 15.6% of the time covered by our K2 observa-tions, a fraction variable between 6 and 30% over ≃ 2 d-long intervals. We fitted the 149 brightest flares with aGaussian profile determining the FWHM, time of max-imum and intensity. Flares appear of impulsive nature.They typically lasted less than one hour with a distribu-tion peaking around 45 minutes with amplitudes span-ning from 0.2 to 1 mag and no clear correlation betweenduration and amplitude. When short they have a quasi-Gaussian shape whilst the longer ones appear to be madeup by trains of short impulsive flares.
To study the orbital phase dependence of the flares,we evaluated the orbital phase of each flaring time binusing the epoch of passage of the pulsar at the ascendingnode determined from the X-ray pulsations detected inthe XMM-Newton observations performed on 2017, May23 and 24, Tasc = 57896.8292633(2) MJD (Papitto etal., in preparation) as the zero phase reference. Notethat in these units the inferior conjunction of the donorstar takes place at phase 0.25. The flare orbital phasehistogram has a maximum around phase 0.75 (see theinset of Fig. 3), i.e. when the donor star is at superiorconjunction. The fractional amplitude evaluated from asinusoid with fixed period and phase is A = (9.9±2.0)%.We note that the bin time adopted to study the orbitaldependence of flare occurrence is such that the longestflares weighted more in the overall phase distribution.
4 Papitto et al.
2.2. Non-flaring orbital variability
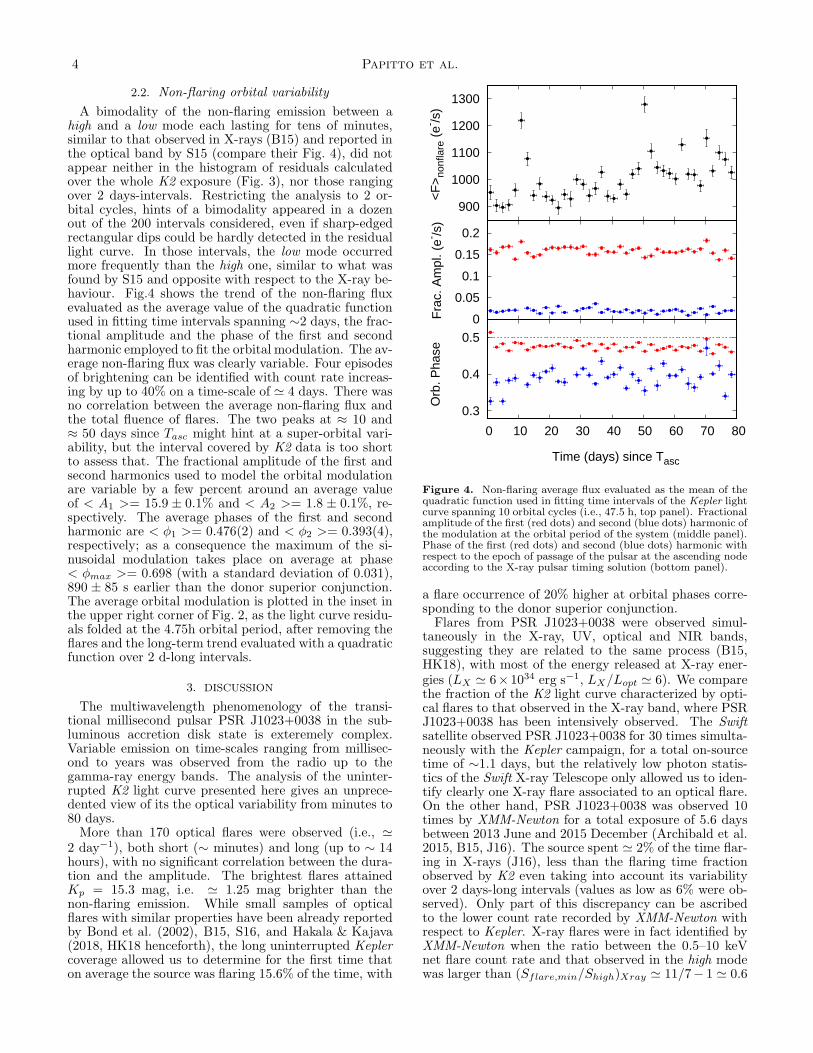
A bimodality of the non-flaring emission between ahigh and a low mode each lasting for tens of minutes,similar to that observed in X-rays (B15) and reported inthe optical band by S15 (compare their Fig. 4), did notappear neither in the histogram of residuals calculatedover the whole K2 exposure (Fig. 3), nor those rangingover 2 days-intervals. Restricting the analysis to 2 or-bital cycles, hints of a bimodality appeared in a dozenout of the 200 intervals considered, even if sharp-edgedrectangular dips could be hardly detected in the residuallight curve. In those intervals, the low mode occurredmore frequently than the high one, similar to what wasfound by S15 and opposite with respect to the X-ray be-haviour. Fig.4 shows the trend of the non-flaring fluxevaluated as the average value of the quadratic functionused in fitting time intervals spanning ∼2 days, the frac-tional amplitude and the phase of the first and secondharmonic employed to fit the orbital modulation. The av-erage non-flaring flux was clearly variable. Four episodesof brightening can be identified with count rate increas-ing by up to 40% on a time-scale of ≃ 4 days. There wasno correlation between the average non-flaring flux andthe total fluence of flares. The two peaks at ≈ 10 and≈ 50 days since Tasc might hint at a super-orbital vari-ability, but the interval covered by K2 data is too shortto assess that. The fractional amplitude of the first andsecond harmonics used to model the orbital modulationare variable by a few percent around an average valueof < A1 >= 15.9 ± 0.1% and < A2 >= 1.8 ± 0.1%, re-spectively. The average phases of the first and secondharmonic are < φ1 >= 0.476(2) and < φ2 >= 0.393(4),respectively; as a consequence the maximum of the si-nusoidal modulation takes place on average at phase< φmax >= 0.698 (with a standard deviation of 0.031),890 ± 85 s earlier than the donor superior conjunction.The average orbital modulation is plotted in the inset inthe upper right corner of Fig. 2, as the light curve residu-als folded at the 4.75h orbital period, after removing theflares and the long-term trend evaluated with a quadraticfunction over 2 d-long intervals.
3. DISCUSSION
The multiwavelength phenomenology of the transi-tional millisecond pulsar PSR J1023+0038 in the sub-luminous accretion disk state is exteremely complex.Variable emission on time-scales ranging from millisec-ond to years was observed from the radio up to thegamma-ray energy bands. The analysis of the uninter-rupted K2 light curve presented here gives an unprece-dented view of its the optical variability from minutes to80 days.
More than 170 optical flares were observed (i.e., ≃
2 day−1), both short (∼ minutes) and long (up to ∼ 14hours), with no significant correlation between the dura-tion and the amplitude. The brightest flares attainedKp = 15.3 mag, i.e. ≃ 1.25 mag brighter than thenon-flaring emission. While small samples of opticalflares with similar properties have been already reportedby Bond et al. (2002), B15, S16, and Hakala & Kajava(2018, HK18 henceforth), the long uninterrupted Keplercoverage allowed us to determine for the first time thaton average the source was flaring 15.6% of the time, with
0.3
0.4
0.5
0 10 20 30 40 50 60 70 80O
rb. P
hase
Time (days) since Tasc
900
1000
1100
1200
1300
<F
>no
nfla
re (
e- /s)
0
0.05
0.1
0.15
0.2
Fra
c. A
mpl
. (e- /s
)
Figure 4. Non-flaring average flux evaluated as the mean of thequadratic function used in fitting time intervals of the Kepler lightcurve spanning 10 orbital cycles (i.e., 47.5 h, top panel). Fractionalamplitude of the first (red dots) and second (blue dots) harmonic ofthe modulation at the orbital period of the system (middle panel).Phase of the first (red dots) and second (blue dots) harmonic withrespect to the epoch of passage of the pulsar at the ascending nodeaccording to the X-ray pulsar timing solution (bottom panel).
a flare occurrence of 20% higher at orbital phases corre-sponding to the donor superior conjunction.
Flares from PSR J1023+0038 were observed simul-taneously in the X-ray, UV, optical and NIR bands,suggesting they are related to the same process (B15,HK18), with most of the energy released at X-ray ener-gies (LX ≃ 6× 1034 erg s−1, LX/Lopt ≃ 6). We comparethe fraction of the K2 light curve characterized by opti-cal flares to that observed in the X-ray band, where PSRJ1023+0038 has been intensively observed. The Swiftsatellite observed PSR J1023+0038 for 30 times simulta-neously with the Kepler campaign, for a total on-sourcetime of ∼1.1 days, but the relatively low photon statis-tics of the Swift X-ray Telescope only allowed us to iden-tify clearly one X-ray flare associated to an optical flare.On the other hand, PSR J1023+0038 was observed 10times by XMM-Newton for a total exposure of 5.6 daysbetween 2013 June and 2015 December (Archibald et al.2015, B15, J16). The source spent ≃ 2% of the time flar-ing in X-rays (J16), less than the flaring time fractionobserved by K2 even taking into account its variabilityover 2 days-long intervals (values as low as 6% were ob-served). Only part of this discrepancy can be ascribedto the lower count rate recorded by XMM-Newton withrespect to Kepler. X-ray flares were in fact identified byXMM-Newton when the ratio between the 0.5–10 keVnet flare count rate and that observed in the high modewas larger than (Sflare,min/Shigh)Xray ≃ 11/7− 1 ≃ 0.6
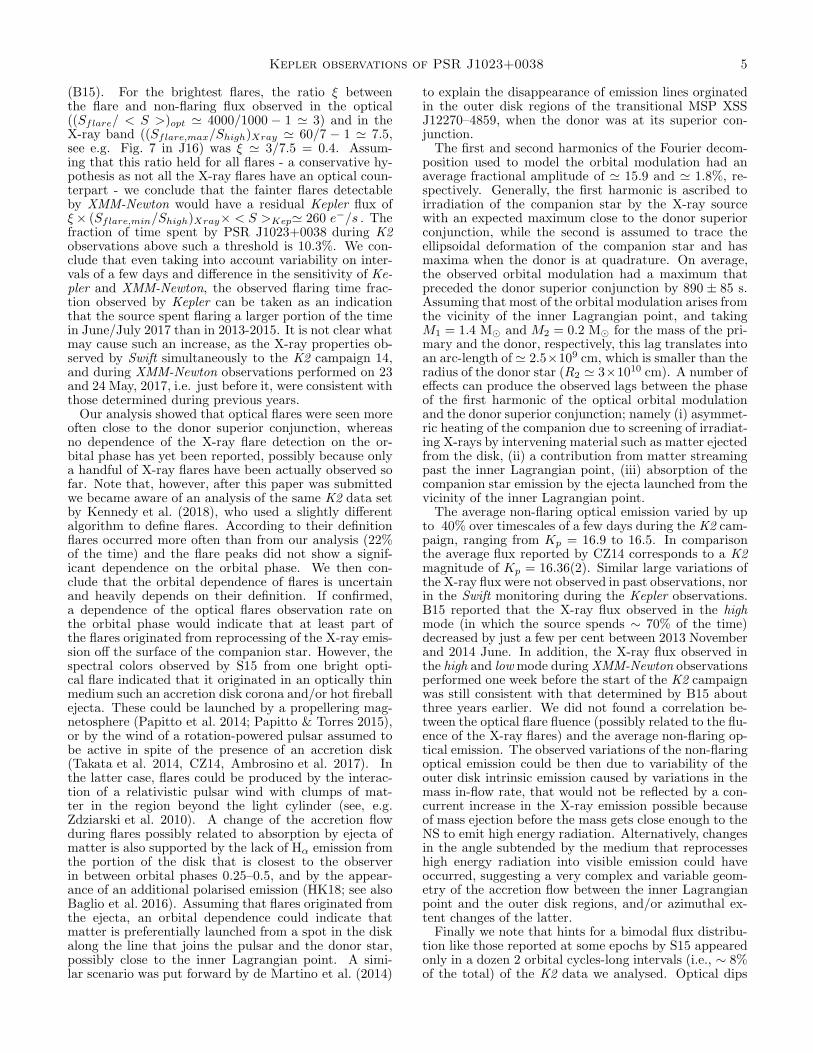
Kepler observations of PSR J1023+0038 5
(B15). For the brightest flares, the ratio ξ betweenthe flare and non-flaring flux observed in the optical((Sflare/ < S >)opt ≃ 4000/1000 − 1 ≃ 3) and in theX-ray band ((Sflare,max/Shigh)Xray ≃ 60/7 − 1 ≃ 7.5,see e.g. Fig. 7 in J16) was ξ ≃ 3/7.5 = 0.4. Assum-ing that this ratio held for all flares - a conservative hy-pothesis as not all the X-ray flares have an optical coun-terpart - we conclude that the fainter flares detectableby XMM-Newton would have a residual Kepler flux ofξ× (Sflare,min/Shigh)Xray× < S >Kep≃ 260 e−/s . Thefraction of time spent by PSR J1023+0038 during K2observations above such a threshold is 10.3%. We con-clude that even taking into account variability on inter-vals of a few days and difference in the sensitivity of Ke-pler and XMM-Newton, the observed flaring time frac-tion observed by Kepler can be taken as an indicationthat the source spent flaring a larger portion of the timein June/July 2017 than in 2013-2015. It is not clear whatmay cause such an increase, as the X-ray properties ob-served by Swift simultaneously to the K2 campaign 14,and during XMM-Newton observations performed on 23and 24 May, 2017, i.e. just before it, were consistent withthose determined during previous years.
Our analysis showed that optical flares were seen moreoften close to the donor superior conjunction, whereasno dependence of the X-ray flare detection on the or-bital phase has yet been reported, possibly because onlya handful of X-ray flares have been actually observed sofar. Note that, however, after this paper was submittedwe became aware of an analysis of the same K2 data setby Kennedy et al. (2018), who used a slightly differentalgorithm to define flares. According to their definitionflares occurred more often than from our analysis (22%of the time) and the flare peaks did not show a signif-icant dependence on the orbital phase. We then con-clude that the orbital dependence of flares is uncertainand heavily depends on their definition. If confirmed,a dependence of the optical flares observation rate onthe orbital phase would indicate that at least part ofthe flares originated from reprocessing of the X-ray emis-sion off the surface of the companion star. However, thespectral colors observed by S15 from one bright opti-cal flare indicated that it originated in an optically thinmedium such an accretion disk corona and/or hot fireballejecta. These could be launched by a propellering mag-netosphere (Papitto et al. 2014; Papitto & Torres 2015),or by the wind of a rotation-powered pulsar assumed tobe active in spite of the presence of an accretion disk(Takata et al. 2014, CZ14, Ambrosino et al. 2017). Inthe latter case, flares could be produced by the interac-tion of a relativistic pulsar wind with clumps of mat-ter in the region beyond the light cylinder (see, e.g.Zdziarski et al. 2010). A change of the accretion flowduring flares possibly related to absorption by ejecta ofmatter is also supported by the lack of Hα emission fromthe portion of the disk that is closest to the observerin between orbital phases 0.25–0.5, and by the appear-ance of an additional polarised emission (HK18; see alsoBaglio et al. 2016). Assuming that flares originated fromthe ejecta, an orbital dependence could indicate thatmatter is preferentially launched from a spot in the diskalong the line that joins the pulsar and the donor star,possibly close to the inner Lagrangian point. A simi-lar scenario was put forward by de Martino et al. (2014)
to explain the disappearance of emission lines orginatedin the outer disk regions of the transitional MSP XSSJ12270–4859, when the donor was at its superior con-junction.
The first and second harmonics of the Fourier decom-position used to model the orbital modulation had anaverage fractional amplitude of ≃ 15.9 and ≃ 1.8%, re-spectively. Generally, the first harmonic is ascribed toirradiation of the companion star by the X-ray sourcewith an expected maximum close to the donor superiorconjunction, while the second is assumed to trace theellipsoidal deformation of the companion star and hasmaxima when the donor is at quadrature. On average,the observed orbital modulation had a maximum thatpreceded the donor superior conjunction by 890 ± 85 s.Assuming that most of the orbital modulation arises fromthe vicinity of the inner Lagrangian point, and takingM1 = 1.4 M⊙ and M2 = 0.2 M⊙ for the mass of the pri-mary and the donor, respectively, this lag translates intoan arc-length of ≃ 2.5×109 cm, which is smaller than theradius of the donor star (R2 ≃ 3×1010 cm). A number ofeffects can produce the observed lags between the phaseof the first harmonic of the optical orbital modulationand the donor superior conjunction; namely (i) asymmet-ric heating of the companion due to screening of irradiat-ing X-rays by intervening material such as matter ejectedfrom the disk, (ii) a contribution from matter streamingpast the inner Lagrangian point, (iii) absorption of thecompanion star emission by the ejecta launched from thevicinity of the inner Lagrangian point.
The average non-flaring optical emission varied by upto 40% over timescales of a few days during the K2 cam-paign, ranging from Kp = 16.9 to 16.5. In comparisonthe average flux reported by CZ14 corresponds to a K2magnitude of Kp = 16.36(2). Similar large variations ofthe X-ray flux were not observed in past observations, norin the Swift monitoring during the Kepler observations.B15 reported that the X-ray flux observed in the highmode (in which the source spends ∼ 70% of the time)decreased by just a few per cent between 2013 Novemberand 2014 June. In addition, the X-ray flux observed inthe high and low mode during XMM-Newton observationsperformed one week before the start of the K2 campaignwas still consistent with that determined by B15 aboutthree years earlier. We did not found a correlation be-tween the optical flare fluence (possibly related to the flu-ence of the X-ray flares) and the average non-flaring op-tical emission. The observed variations of the non-flaringoptical emission could be then due to variability of theouter disk intrinsic emission caused by variations in themass in-flow rate, that would not be reflected by a con-current increase in the X-ray emission possible becauseof mass ejection before the mass gets close enough to theNS to emit high energy radiation. Alternatively, changesin the angle subtended by the medium that reprocesseshigh energy radiation into visible emission could haveoccurred, suggesting a very complex and variable geom-etry of the accretion flow between the inner Lagrangianpoint and the outer disk regions, and/or azimuthal ex-tent changes of the latter.
Finally we note that hints for a bimodal flux distribu-tion like those reported at some epochs by S15 appearedonly in a dozen 2 orbital cycles-long intervals (i.e., ∼ 8%of the total) of the K2 data we analysed. Optical dips
6 Papitto et al.
were not detected at other epochs (J16, HK18), indi-cating that these features are not stable as in the X-ray band. When observed (S15), dips had ingress/egresstimes of 12-35 s, duration in the range 80–1300 s, anda separation 200–1900 s. These properties are similar tothose of the low mode dips observed in the X-ray bandfor ∼ 20% of the time (B15, J16), and were claimed to betheir equivalent, even if simultaneous observations werelacking. Note that when a bimodal distribution of theoptical flux is observed (S15, or in a few intervals of theK2 data analysed here, the low flux mode is predominant,whereas the opposite happens in the X-rays. The timeresolution (∼60s) of K2 data could well cause smearingof the sharp ingress/egress shape of the dips but shouldnot have prevented the detection of the long (20 min)dips interleaved by less than an hour. Even when a bi-modality of the flux was suggested by the residual fluxdistribution, the light curve did not show such prolongeddips. Future simultaneous optical and X-ray monitoringwill possibly ascertain whether the lack of optical dipsmarked a change in the properties of the source.
A.P. acknowledges funding from the EU’s Horizon2020 Framework Programme for Research and Innova-tion under the Marie Sk lodowska-Curie Individual Fel-lowship grant agreement 660657-TMSP-H2020-MSCA-IF-2014, and from the agreements ASI-INAF I/037/12/0and ASI-INAF 2017-14-H.0. N.R., F.C.Z., and D.F.T.acknowledge funding from grants AYA2015-71042-P andSGR 2017-1383. A.S. acknowledges funding from grantsESP2017-82674-R (MINECO) and 2017-SGR-1131.
REFERENCES
Ambrosino, F., Papitto, A., Stella, L., et al. 2017, NatureAstronomy, 1, 854
Archibald, A. M., Stairs, I. H., Ransom, S. M., et al. 2009,Science, 324, 1411
Archibald, A. M., Bogdanov, S., Patruno, A., et al. 2015,Astrophys. J., 807, 62
Baglio, M. C., D’Avanzo, P., Campana, S., et al. 2016, Astron.and Astrophys., 591, A101
Bassa, C. G., Patruno, A., Hessels, J. W. T., et al. 2014,MNRAS, 441, 1825
Bogdanov, S., Archibald, A. M., Bassa, C., et al. 2015, Astrophys.J., 806, 148
Bond, H. E., White, R. L., Becker, R. H., & O’Brien, M. S. 2002,PASP, 114, 1359
Brown, T. M., Latham, D. W., Everett, M. E., & Esquerdo, G. A.2011, AJ, 142, 112
Coti Zelati, F., Baglio, M. C., Campana, S., et al. 2014, MNRAS,444, 1783
de Martino, D., Falanga, M., Bonnet-Bidaud, J.-M., et al. 2010,Astron. and Astrophys., 515, A25
de Martino, D., Casares, J., Mason, E., et al. 2014, MNRAS, 444,3004
Hakala, P., & Kajava, J. J. E. 2018, MNRAS, 474, 3297Halpern, J. P., Gaidos, E., Sheffield, A., Price-Whelan, A. M., &
Bogdanov, S. 2013, The Astronomer’s Telegram, 5514Hernandez Santisteban, J. V. 2016, PhD thesis, University of
SouthamptonJaodand, A., Archibald, A. M., Hessels, J. W. T., et al. 2016,
Astrophys. J., 830, 122Kennedy, M. R., Clark, C. J., Voisin, G., Breton, R. 2018,
astro-ph/1801.10609Papitto, A., & Torres, D. F. 2015, Astrophys. J., 807, 33Papitto, A., Torres, D. F., & Li, J. 2014, MNRAS, 438, 2105Papitto, A., Ferrigno, C., Bozzo, E., et al. 2013, Nature, 501, 517Patruno, A., Archibald, A. M., Hessels, J. W. T., et al. 2014,
ApJ, 781, L3
Shahbaz, T., Linares, M., Nevado, S. P., et al. 2015, MNRAS,453, 3461
Stappers, B. W., Archibald, A. M., Hessels, J. W. T., et al. 2014,Astrophys. J., 790, 39
Takata, J., Li, K. L., Leung, G. C. K., et al. 2014, Astrophys. J.,785, 131
Tendulkar, S. P., Yang, C., An, H., et al. 2014, Astrophys. J., 791,77
Torres, D. F., Ji, L., Li, J., et al. 2017, Astrophys. J., 836, 68Zdziarski, A. A., Neronov, A., & Chernyakova, M. 2010, MNRAS,
403, 1873
![SandipKumarChakrabarti, arXiv:2004.03792v2 [astro-ph.HE ... · arXiv:2004.03792v2 [astro-ph.HE] 22 May 2020 Draftversion May25,2020 TypesetusingLATEXtwocolumnstyleinAASTeX63 AccretionFlowEvolutionofaNewBlackHoleCandidateMAXIJ1348](https://img.pdfslide.us/doc/110x75/5f6442657bea20242f5643d2/sandipkumarchakrabarti-arxiv200403792v2-astro-phhe-arxiv200403792v2-astro-phhe.jpg)
![arXiv:1307.0688v1 [astro-ph.HE] 2 Jul 2013](https://img.pdfslide.us/doc/110x75/616a0e9b11a7b741a34e5590/arxiv13070688v1-astro-phhe-2-jul-2013.jpg)
![arXiv:2004.12999v2 [astro-ph.HE] 21 Aug 2020](https://img.pdfslide.us/doc/110x75/6180e13c86705a0b90739af0/arxiv200412999v2-astro-phhe-21-aug-2020.jpg)
![arXiv:2012.11130v1 [astro-ph.HE] 21 Dec 2020](https://img.pdfslide.us/doc/110x75/61c543a37892fa691c538365/arxiv201211130v1-astro-phhe-21-dec-2020.jpg)
![arXiv:1808.01435v1 [astro-ph.HE] 4 Aug 2018](https://img.pdfslide.us/doc/110x75/626a7aa92ad708503d4300c3/arxiv180801435v1-astro-phhe-4-aug-2018.jpg)
![arXiv:1111.0523v1 [astro-ph.HE] 2 Nov 2011](https://img.pdfslide.us/doc/110x75/623d3f0626b54c58747cdf8a/arxiv11110523v1-astro-phhe-2-nov-2011.jpg)
![arXiv:1809.01966v2 [astro-ph.HE] 17 Jan 2019](https://img.pdfslide.us/doc/110x75/618d4ec190eacf24d521eb27/arxiv180901966v2-astro-phhe-17-jan-2019.jpg)
![arXiv:2105.03829v2 [astro-ph.HE] 16 Oct 2021](https://img.pdfslide.us/doc/110x75/626c30cda7dc9e6c8b55741d/arxiv210503829v2-astro-phhe-16-oct-2021.jpg)
![arXiv:2108.05141v1 [astro-ph.HE] 11 Aug 2021](https://img.pdfslide.us/doc/110x75/621220a80c79b44edd4a6e8a/arxiv210805141v1-astro-phhe-11-aug-2021.jpg)
![arXiv:2109.01276v1 [astro-ph.HE] 3 Sep 2021](https://img.pdfslide.us/doc/110x75/61cf3906f2d5cd7f33663c38/arxiv210901276v1-astro-phhe-3-sep-2021.jpg)
![arXiv:2101.08839v1 [astro-ph.HE] 21 Jan 2021](https://img.pdfslide.us/doc/110x75/615b8f01d46fba742d613380/arxiv210108839v1-astro-phhe-21-jan-2021.jpg)
![arXiv:2012.14967v1 [astro-ph.HE] 29 Dec 2020](https://img.pdfslide.us/doc/110x75/61bd3fd661276e740b10de22/arxiv201214967v1-astro-phhe-29-dec-2020.jpg)
![arXiv:1710.06748v1 [astro-ph.HE] 18 Oct 2017](https://img.pdfslide.us/doc/110x75/6180e59543ed816d963d4384/arxiv171006748v1-astro-phhe-18-oct-2017.jpg)
![arXiv:1409.7811v2 [astro-ph.HE] 6 Nov 2014](https://img.pdfslide.us/doc/110x75/61d928bea181981c227b8477/arxiv14097811v2-astro-phhe-6-nov-2014.jpg)
![arXiv:2111.03094v1 [astro-ph.HE] 4 Nov 2021](https://img.pdfslide.us/doc/110x75/620e12dc5cc670596f27365f/arxiv211103094v1-astro-phhe-4-nov-2021.jpg)
![arXiv:1602.04199v2 [astro-ph.HE] 18 Feb 2016](https://img.pdfslide.us/doc/110x75/587185cb1a28ab613f8ba7d2/arxiv160204199v2-astro-phhe-18-feb-2016.jpg)
![arXiv:1312.0632v1 [astro-ph.HE] 2 Dec 2013](https://img.pdfslide.us/doc/110x75/61e6558600c4e77c2748b8bc/arxiv13120632v1-astro-phhe-2-dec-2013.jpg)
![arXiv:1812.04021v1 [astro-ph.HE] 10 Dec 2018](https://img.pdfslide.us/doc/110x75/61e4916950f2496118214b84/arxiv181204021v1-astro-phhe-10-dec-2018.jpg)
![arXiv:2105.08851v3 [astro-ph.HE] 22 Jul 2021](https://img.pdfslide.us/doc/110x75/62685c80595d0834b7219c81/arxiv210508851v3-astro-phhe-22-jul-2021.jpg)
![arXiv:2107.06333v1 [astro-ph.HE] 13 Jul 2021](https://img.pdfslide.us/doc/110x75/61cf3462413f063350756219/arxiv210706333v1-astro-phhe-13-jul-2021.jpg)
![arXiv:1001.3298v1 [astro-ph.HE] 19 Jan 2010](https://img.pdfslide.us/doc/110x75/623dffaefd4ad1745c0e101f/arxiv10013298v1-astro-phhe-19-jan-2010.jpg)
![arXiv:2111.02690v1 [astro-ph.HE] 4 Nov 2021](https://img.pdfslide.us/doc/110x75/6238ec0decded154dc56d3b6/arxiv211102690v1-astro-phhe-4-nov-2021.jpg)
![arXiv:2011.12463v2 [astro-ph.HE] 4 Dec 2020](https://img.pdfslide.us/doc/110x75/621affb1ca7858410429e897/arxiv201112463v2-astro-phhe-4-dec-2020.jpg)
![arXiv:2102.10627v1 [astro-ph.HE] 21 Feb 2021](https://img.pdfslide.us/doc/110x75/61e3f98a654405388d65ef53/arxiv210210627v1-astro-phhe-21-feb-2021.jpg)
![arXiv:1111.2536v1 [astro-ph.HE] 10 Nov 2011](https://img.pdfslide.us/doc/110x75/61ecf2f867c498466a1a4d26/arxiv11112536v1-astro-phhe-10-nov-2011.jpg)
![arXiv:2105.11446v1 [astro-ph.HE] 24 May 2021](https://img.pdfslide.us/doc/110x75/624058f0f673c33c9714695b/arxiv210511446v1-astro-phhe-24-may-2021.jpg)
![arXiv:2110.10954v1 [astro-ph.HE] 21 Oct 2021](https://img.pdfslide.us/doc/110x75/61e4a30d71175524b25e3c1a/arxiv211010954v1-astro-phhe-21-oct-2021.jpg)
![arXiv:1007.2206v1 [astro-ph.HE] 13 Jul 2010](https://img.pdfslide.us/doc/110x75/61bd30ff61276e740b103dec/arxiv10072206v1-astro-phhe-13-jul-2010.jpg)
![arXiv:2011.05332v2 [astro-ph.HE] 22 Jul 2021](https://img.pdfslide.us/doc/110x75/61c50ad162c9797b255ad8e2/arxiv201105332v2-astro-phhe-22-jul-2021.jpg)
![arXiv:1602.01081v1 [astro-ph.HE] 2 Feb 2016](https://img.pdfslide.us/doc/110x75/61d440719ae0c124b36339d0/arxiv160201081v1-astro-phhe-2-feb-2016.jpg)