Embed Size (px)
Citation preview
Draft
Experimental study on dynamic interference effect of two
closely spaced machine foundations
Journal: Canadian Geotechnical Journal
Manuscript ID: cgj-2014-0462.R1
Manuscript Type: Article
Date Submitted by the Author: 25-Apr-2015
Complete List of Authors: Swain, Abhijeet; IIT Kanpur, Ghosh, Priyanka; Indian Institute of Technology, Kanpur
Keyword: Dynamic interference, Machine foundation, Model test, Square foundation, Vibration
https://mc06.manuscriptcentral.com/cgj-pubs
Canadian Geotechnical Journal
Draft
1
Experimental study on dynamic interference effect of two
closely spaced machine foundations
Abhijeet Swaina and Priyanka Ghosh
b,*
aResearch Scholar,
Department of Civil Engineering, Indian Institute of Technology, Kanpur,
Kanpur – 208 016, India
bAssociate Professor,
Department of Civil Engineering, Indian Institute of Technology, Kanpur,
Kanpur – 208 016, India
Corresponding author: Dr. Priyanka Ghosh
(E-mail address: [email protected], Tel: +91-512-2597022, Fax: +91-512-2597395)
ABSTRACT
This paper presents an experimental study on the dynamic interaction effect of closely
spaced square foundations under machine vibration. Under dynamic condition, a
number of large-scale model tests were conducted in the field, which include a wide
range of study on the isolated as well as the interacting footing response resting on the
local soil available at Kanpur, India. The dynamic interaction of different combinations
(size) of two-footing assembly was investigated by inducing vertical harmonic load on
one of the footings (active footing), where the other footing (passive footing) was
loaded with the static weight only. The active footing was excited with different
Page 1 of 41
https://mc06.manuscriptcentral.com/cgj-pubs
Canadian Geotechnical Journal
Draft
2
magnitudes of dynamic loading and the response was recorded for both the footings,
placed at different clear spacing (S). The results are compiled and shown as the
variation of displacement amplitude with frequency. The transmission ratio, which
predicts the effect of dynamic excitation of the active footing on the passive one, is
determined for the interacting footings and plotted with respect to the frequency ratio.
Keywords: Dynamic interference; Machine foundation; Model test; Square foundation;
Vibration
Page 2 of 41
https://mc06.manuscriptcentral.com/cgj-pubs
Canadian Geotechnical Journal
Draft
3
Introduction
Harmonic and periodic vibrations can be generated mostly by heavy machines, moving
vehicles or by running trains, which cause the supporting foundations to behave in a
different fashion. Therefore, these foundations should be designed properly to resist
such dynamic loads to have a greater serviceability and longevity. Expertise has been
developed starting from the simple spring-mass-dashpot system to the rigorous elastic
half space model proposed by Sung (1953), Lysmer and Richart (1966), Richart et al.
(1970), Gazetas (1991) and Kameswar Rao (1998, 2011) for single isolated foundation.
However, when the foundations are located in groups, the interference of one on the
other neighboring foundations due to such dynamic loading is likely to occur
significantly. Hence, the importance of such study cannot be ignored in the design of
closely spaced foundations experiencing dynamic interaction.
The problem of soil-structure interaction has been the most active area of research
in the field of geotechnical engineering. Several studies have been performed to
understand the soil-structure interaction under dynamic loading. The studies conducted
by Liang (1974), Lysmer et al. (1975), Wong and Luco (1986), Tham et al. (1998),
Ghosh (2011), Ghosh and Kumari (2012), and Ghosh (2013) explain the interference
effect of nearby foundations and ground anchors under the earthquake loading using
different numerical techniques such as finite element, finite difference and boundary
element method. However, very few studies (Vivek and Ghosh 2012, Ghosh 2013)
have been performed on the interference effect of foundations subjected to machine
vibration. Machine foundations are basically designed for mounting of heavy machines
generating unwanted unbalanced periodic forces. The available methodology is good
enough to design single isolated machine foundation. However, in several practical
situations, the machine foundations may be found in a group and placed closely, due to
Page 3 of 41
https://mc06.manuscriptcentral.com/cgj-pubs
Canadian Geotechnical Journal
Draft
4
space crunch or some inevitable conditions. The behavior of closely spaced machine
foundations is expected to be significantly different than that of single isolated machine
foundation due to their interaction within the group. Hence, the dynamic interaction
amongst these closely spaced machine foundations may be of great interest of research
to obtain their safe design methodology.
Several analytical and numerical studies (Warburton et al. 1971; Wong and Luco
1986; Triantafyilidis and Prange 1989; Wang et al. 1991; Wang and Schmid 1992; Qian
and Beskos 1996; Karabalis and Mohammadi 1991, 1998) have been conducted to
understand the dynamic interaction of foundations in a group. However, lack of
experimental study on the interference behavior of nearby machine foundations
motivates to take up the present investigation, which explains the dynamic interaction
effect between two closely spaced square foundations of two different sizes, by
conducting large scale model experiments. The interaction effect of two-footing
assembly was obtained by mounting a Lazan type mechanical oscillator and motor
assembly on the active footing, which produces purely vertical vibrations on the footing.
On the contrary, the passive footing was placed adjacent to the active one and loaded
with the dead weights, which produces same static load intensity as that exerted by the
active footing. Accelerometer was used to measure the acceleration, velocity and
displacement amplitude of the steady state vibration, both for active and passive
footings. The tests were performed with the active and passive footings kept at different
spacing and at a certain depth (Df = 0.55B and 0.45B for 550mm and 650mm wide
footings respectively, where B is the width of the footing) below the ground surface.
Page 4 of 41
https://mc06.manuscriptcentral.com/cgj-pubs
Canadian Geotechnical Journal
Draft
5
Experimental details
The experimental program majorly includes the study on the dynamic response of
isolated footings and the dynamic interaction of two-footing assembly. The basic
arrangement includes the block vibration test setup and other accessories.
Test setup and material
The present experimental setup was designed based on the IS code provisions (IS-5249)
and on the programs presented by various researchers (Erden 1974; Baidya 1992;
Baidya and Muralikrishna 2001; Baidya and Mandal 2006; Baidya and Rathi 2004;
Kumar and Reddy 2006; Mandal et al. 2012) on the analysis of foundations subjected
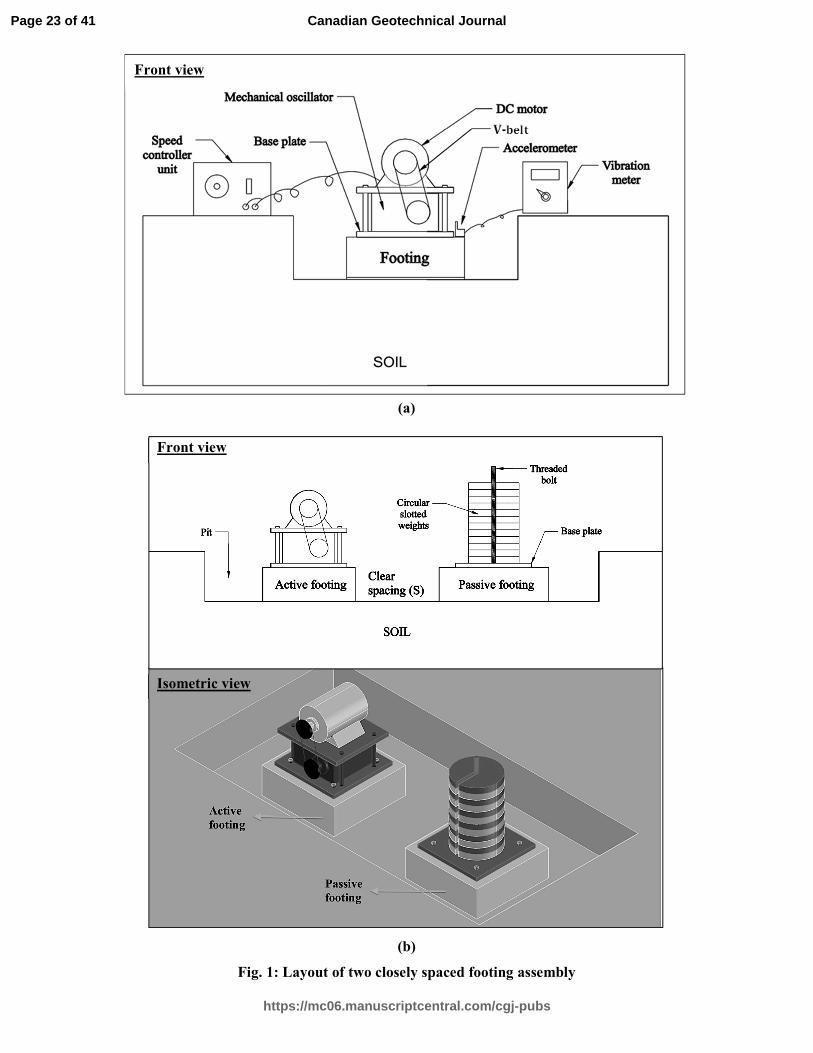
to harmonic vibrations (or block vibration tests). A general layout of the present test
setup for the block vibration test and the dynamic interaction of footings is shown in
Fig. 1. RCC square footings made of M20 grade concrete were casted to serve as the
model footings, in two different sizes: (a) Footing 1 (F1): 0.55m × 0.55m × 0.2m- 2
numbers, (b) Footing 2 (F2): 0.65m × 0.65m × 0.2m - 2 numbers. A provision for
mounting the vibrating machine over the footing was made, by incorporating
foundation bolts (20 mm in diameter) at four corners of the footing. Mild steel (MS)
plates and discs were used to achieve any desired level of static load intensity below the
active and the passive footings. Square shaped mild steel plates of size –
0.45m × 0.45m × 0.016m were employed with 25mm diameter clear holes at the four
corners to fit on the foundation bolts. Along with that, circular slotted weights (16kg
and 20kg in mass) of 30cm in diameter were used for loading the passive footing
statically, which can be seen in Fig. 1. A Lazan rotating mass type mechanical
oscillator, developed by the New Engineering Enterprises, India, was clamped over the
MS base plate to generate a sinusoidal varying dynamic force. The force generated by
Page 5 of 41
https://mc06.manuscriptcentral.com/cgj-pubs
Canadian Geotechnical Journal
Draft
6
the oscillator depends on the angular velocity of rotation and the angle of eccentricity
between the eccentric unbalanced masses present inside the oscillator. The force
generated can be calculated using the following relation
�� = �� . �. = 0.119 sin ��� (1)
where, F0 is the force in N, m� is the eccentric unbalanced mass rotating with a radius
of e, ω is the angular frequency in rad/sec and θ is the angle between the eccentric
masses. A variable speed 3HP DC motor was used to operate the mechanical oscillator
to run at different frequency ranging from 120rpm – 3000rpm. The DC motor was
placed and clamped over the oscillator and their shafts were connected with a V-belt as
shown in Fig. 1. A speed controller unit was placed outside the pit (Fig. 1a) for
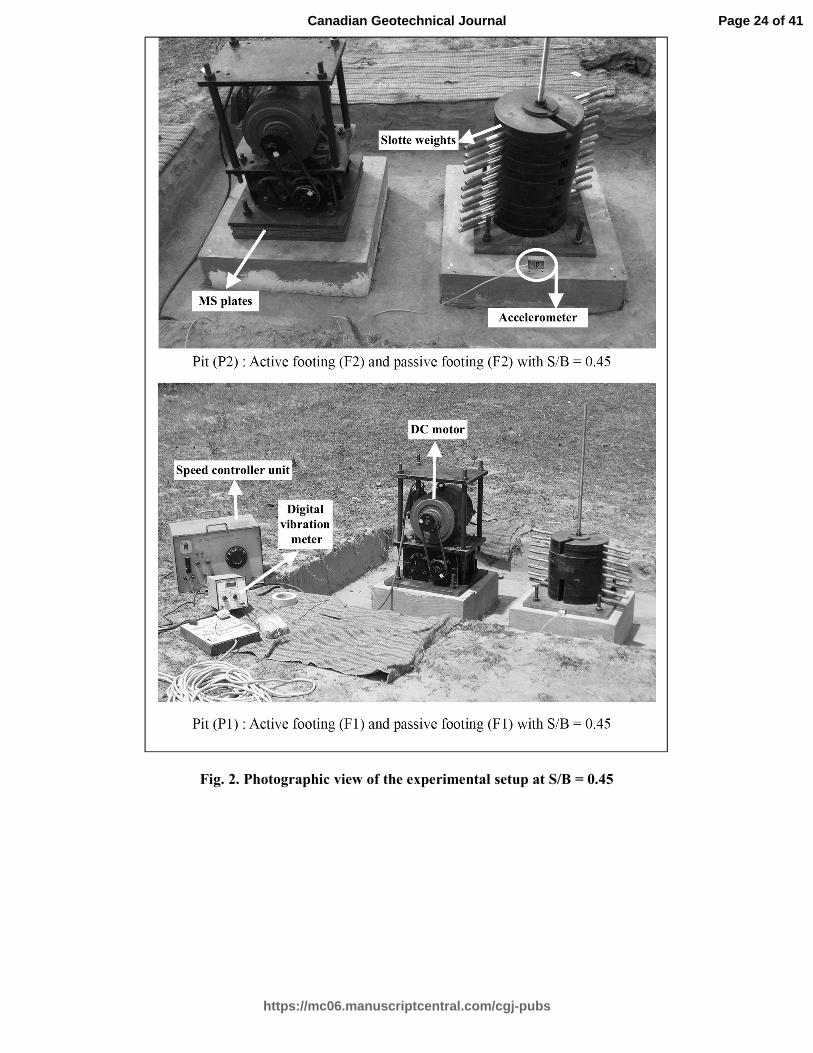
controlling the speed of the DC motor. A low ‘g’ high output MEMS accelerometer,
manufactured by Micron, India was employed to measure the acceleration response of
the footings. The output from the accelerometer was displayed on a digital vibration
meter in terms of the peak amplitudes of the acceleration, velocity and displacement
due to the vibration. All the tests were conducted in pits of depth 300mm to avoid the
top loose soil, which were properly leveled before placing the footings over it. A
photographic view of the experimental setup employed for studying the dynamic
interaction of footings is shown in Fig. 2. All the experiments were performed in the
geotechnical in-situ laboratory site of IIT-Kanpur campus, Kanpur, Uttar Pradesh, India,
where the soil strata comprises mostly of silt with some clay and very less sand content
(Chanda 2011). The top 2m depth of the layer was found to be clayey-silt with some
kankar. The liquid limit was found to be as low as about 35%. The plasticity index was
also found to be in low to medium range and the natural moisture content up to 2.0m
depth was observed as approximately 17%, during the testing period. The water table
Page 6 of 41
https://mc06.manuscriptcentral.com/cgj-pubs
Canadian Geotechnical Journal
Draft
7
was generally found to be located below 6.5m, which was reasonably beyond the zone
of influence.
Testing procedure
Initially, the dynamic response of two different isolated footings (F1 and F2) was
recorded. The complete assembly for the block vibration test was prepared (Fig. 1) and
placed in a pit of dimension 1.4m × 1.4m × 0.3m, found to be sufficient for easy
placement of the footing and machine assembly. The load intensity below the footings
(F1 and F2) was maintained as 10,750 N/m2, which was found to be well within the
working load and was the optimum value that could be achieved using the available
experimental resources. The force (F0) of vibration was set in the oscillator by keeping
the eccentric angle setting (θ) of the oscillator to a desired value. All tests were
performed at three different magnitudes of θ (16°, 24°and32°), and the corresponding
values of eccentric force (me⋅ e) were obtained as 0.017 N-sec2, 0.025 N-sec
2 and 0.033
N-sec2, respectively. The eccentric force setting was limited to the aforementioned
values, to avoid the vibration causing any separation between the footing and the soil.
The response was measured using the accelerometer as mentioned earlier. The
accelerometer was placed along the centre line on the front edge of the footings as
shown in Fig. 2 and enough care was taken to record only the vertical vibration. The
footing responses were noted for the frequency increments in the range of 50rpm to
100rpm approximately, so as to obtain an accurate trend in the results. At each
frequency, the response parameters were noted after 5 to 10 secs from the initiation of
foundation excitation to ensure a steady state vibration condition and thus, the
instantaneous recording of readings was discouraged. Few selected combinations of
model footing assembly, consisting of same or different size of footings, were
Page 7 of 41
https://mc06.manuscriptcentral.com/cgj-pubs
Canadian Geotechnical Journal
Draft
8
considered to study the dynamic interaction effect between two closely placed footings.
Both active and passive footings were loaded to have a static load intensity of 10,750
N/m2 on each footing. A pit of suitable dimension was prepared to accommodate the
whole setup as shown in Fig. 3. The tests were conducted at four different S/B ratios
(0.45, 0.90, 1.35 and 1.80). At each S/B ratio, the dynamic response of active and
passive footings was recorded for three different eccentric force settings as mentioned
earlier.
Experimental program
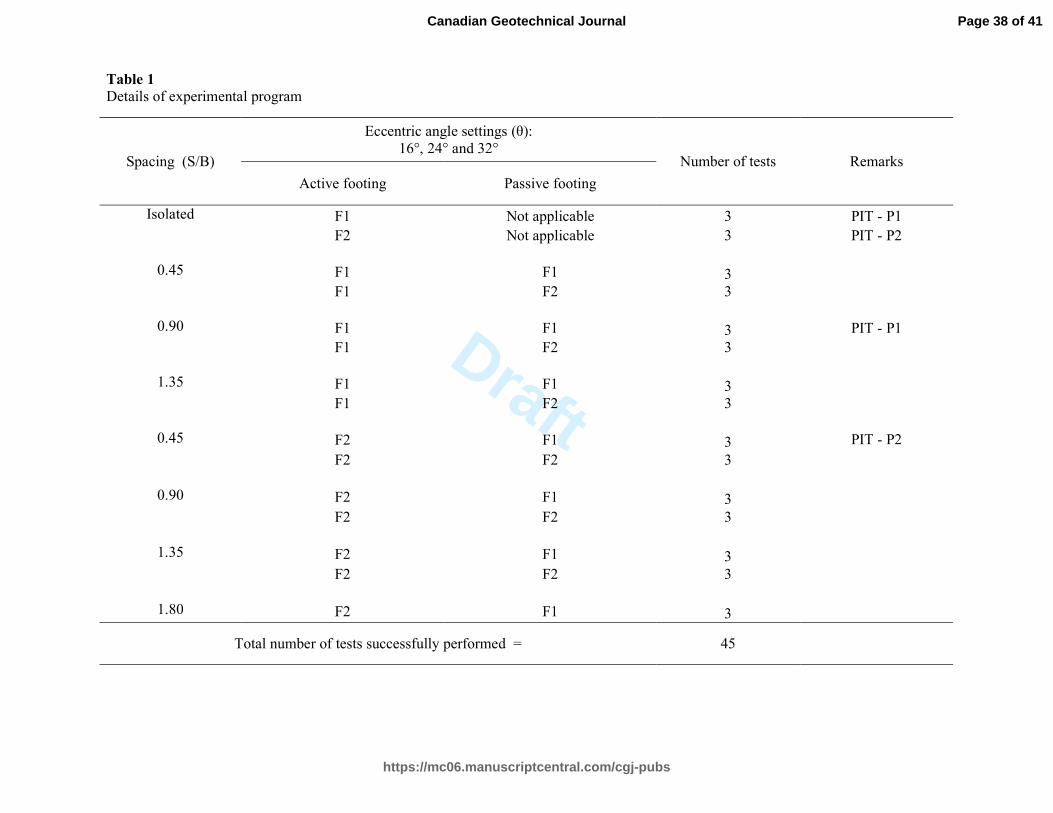
Total 45 numbers of tests were performed and the sequence of all experiments
performed in the present study is shown in Table 1. Some selective tests were
conducted more than once to ensure the repeatability of the tests. The tests on isolated
footings (F1 and F2) were conducted first in two different pits (P1 and P2), which were
later extended to perform the tests on different pair of interactive active and passive
footings. Each test is identified by a specific nomenclature assigned to it as IijSmEn. Iij
represents the dynamic interaction of active (Fi) and passive (Fj) footings, where i = {1,
2} and j = {0, 1, 2}, j = 0 represents the special case of isolated (Fi) footing of different
sizes. Sm represents the spacing between the footings, where m stands for different S/B
values (0.0, 0.45, 0.90, 1.35 and 1.80). It is worth noting here that the special case of
isolated footing can be represented by S/B = 0 along with j = 0. En represents different
eccentric angle setting for the vibrating force and n = {16, 24, 32} stands for different
magnitude of θ in degrees.
Page 8 of 41
https://mc06.manuscriptcentral.com/cgj-pubs
Canadian Geotechnical Journal
Draft
9
Results and discussions
After attaining the steady state vibration in each test, the variation of displacement
amplitude of the footing was recorded with respect to the frequency of vibration of the
oscillator. In the subsequent sections, the results are presented and discussed in non-
dimensional form to reflect the generality.
Isolated footing
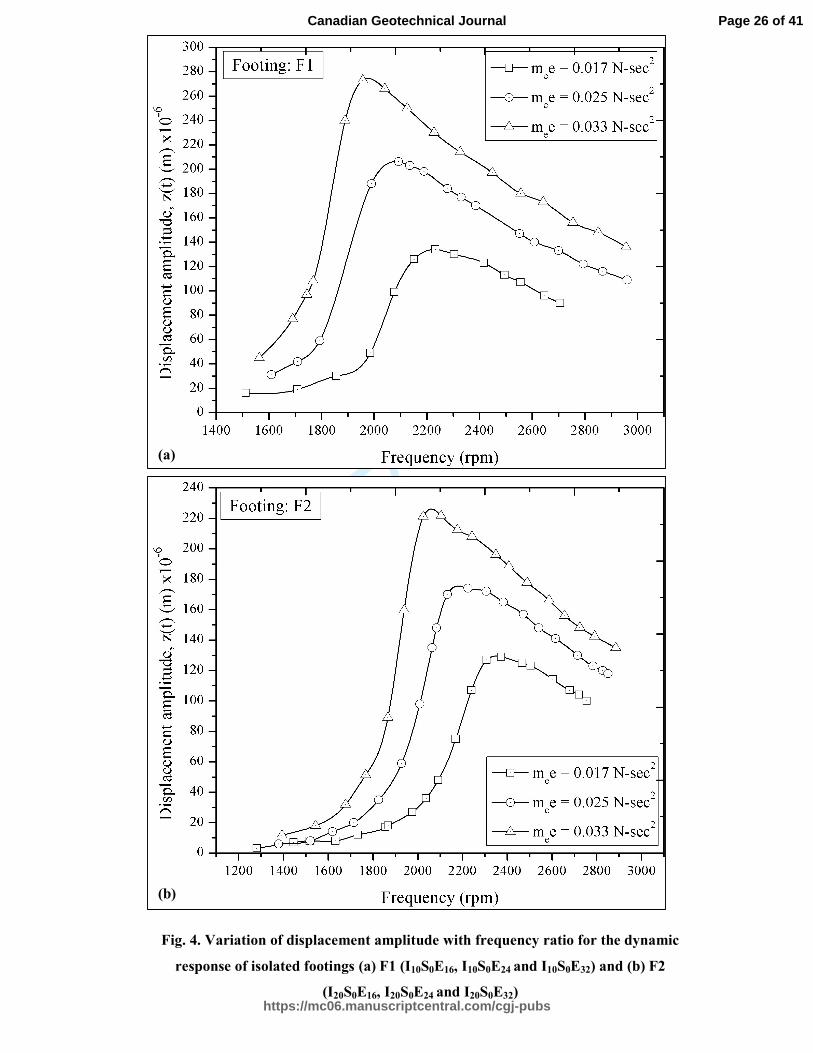
The block vibration test was conducted for the footings F1 and F2 and the response was
recorded for three different eccentric force settings. For footings F1 and F2, the
variation of the displacement amplitude with the frequency is plotted in Fig. 4 for
different eccentric settings. It can be observed that with increase in the value of
eccentric force (me.e), the resonant frequency decreases but the resonant displacement
amplitude increases. From the steady state vibration theory for the rotating mass type
vibration, the following equations can be derived (Richart et al. 1970) to compute the
magnitudes of equivalent stiffness (k) and damping ratio (D):
zr�me.e
m� =
1
2D 1-D2(2)
fmr= 1
2π 1-2D2# k
m(3)
where, zr is the vertical displacement of vibration at resonance, me is the eccentric
unbalanced mass in the rotating mass type system, e is the radius of rotation of the
eccentric mass, m is the total mass of the vibrating system and f%& is the resonant
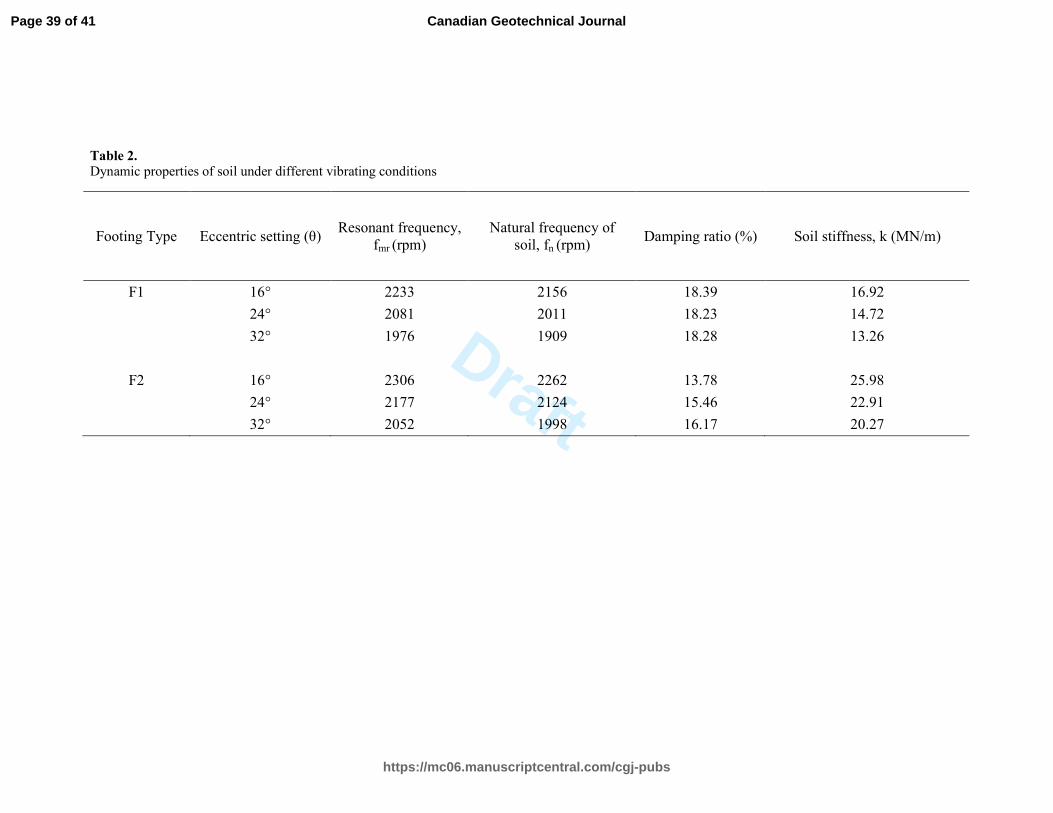
frequency for the rotating mass type system. The dynamic properties of the soil
Page 9 of 41
https://mc06.manuscriptcentral.com/cgj-pubs
Canadian Geotechnical Journal
Draft
10
evaluated are reported in Table 2. It can be noted that the magnitude of the natural
frequency and the stiffness of the soil generally decreases with increase in the value of
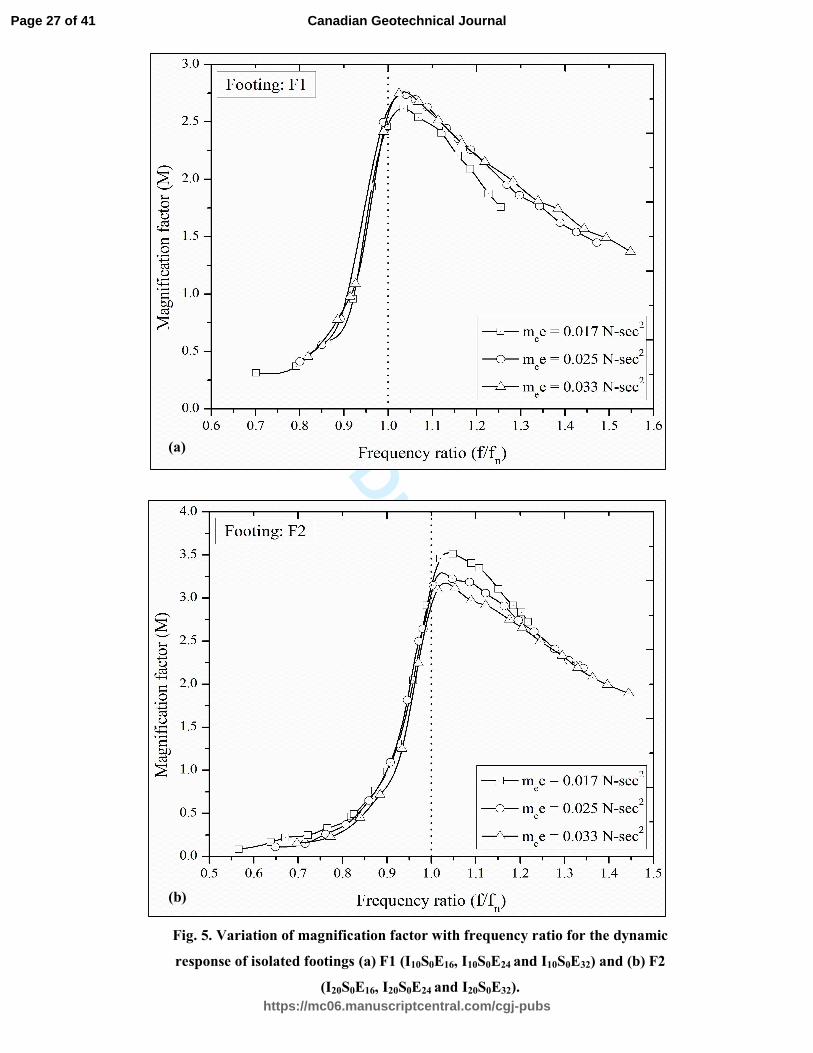
θ. In Fig. 5, the variation of the magnification factor with the frequency ratio is plotted
in non-dimensional form, where the frequency ratio and magnification factor can be
expressed as:
Frequency ratio (fr) =f
fn
(4)
fn=1
2π#k
m(5)
Magnification factor (M) = z
�me.e
m� (6)
where, z is the vertical displacement amplitude of vibration, f is the operating
frequency and f' is the natural frequency of the soil considering the mass of the active
vibrating system. It can be observed from Fig. 5 that the magnification factor, M attains
a peak beyond fr =1, which is in line with the response generally obtained for rotating
mass type excitation (Richart et al. 1970; Kameswar Rao 2011). For both the footings,
no significant variation in the magnification factor can be noticed up to fr = 1 for
different eccentric force settings. For the footings F1 and F2, the peak magnitude of M
varies approximately from 2.6 to 2.7 and from 3.1 to 3.6 with increase in the eccentric
force setting from 0.017 N-sec2 to 0.033 N-sec
2 respectively. The magnitude of total
damping (material damping + radiation damping) ratio for the footing F1 was found to
be approximately 18.3% for all the eccentric force values (Table 2). Similarly for the
footing F2, the damping ratio was observed to vary approximately from 13.8% to
16.2% with increasing eccentric settings (Table 2).
Page 10 of 41
https://mc06.manuscriptcentral.com/cgj-pubs
Canadian Geotechnical Journal
Draft
11
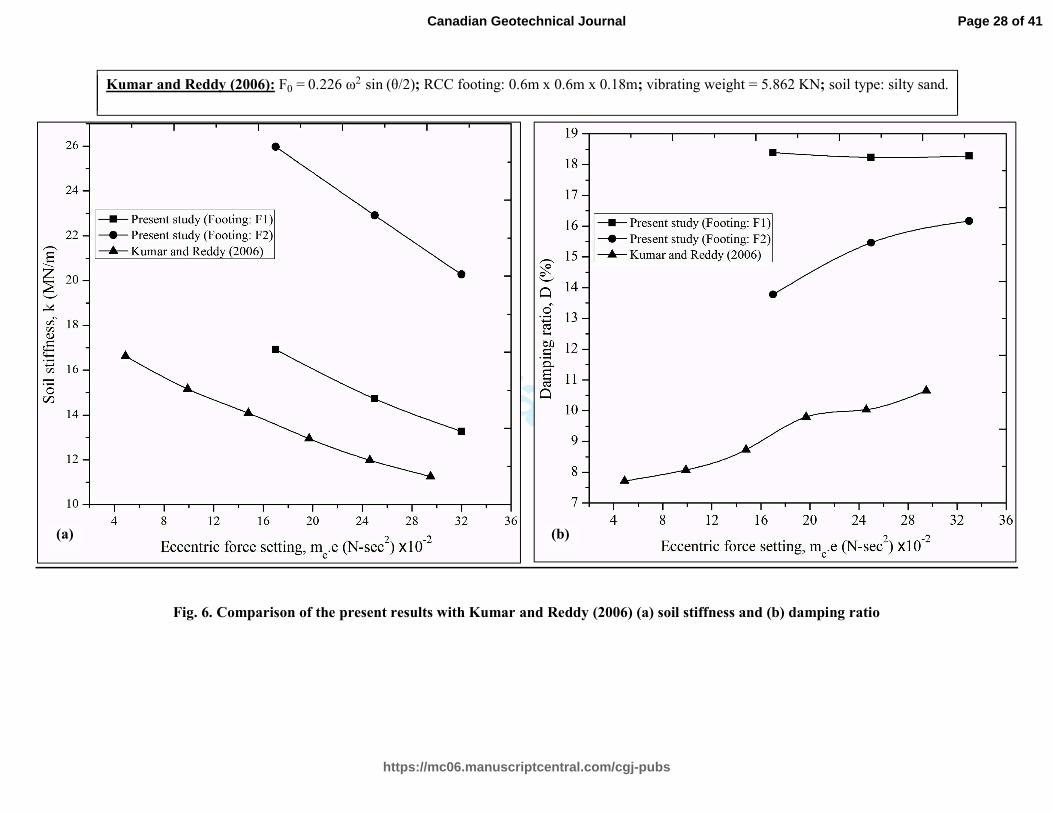
The present results obtained for the isolated footing are qualitatively compared
with those reported by previous researchers since the studies were conducted in
different experimental environments. In Fig. 6, the present variation of soil stiffness (k)
and damping ratio (D) with the eccentric force setting is compared with that predicted
by Kumar and Reddy (2006). The soil type, footing dimensions and vibrating weight
were different in the present study as compared to those considered in the study of
Kumar and Reddy (2006). However, the type of loading (rotating mass type excitation)
was same in both the investigations. A good agreement in the trends can be observed.
The soil stiffness is found to decrease whereas the damping ratio is seen to increase
with the increase in the eccentric force setting for both the cases. It is worth mentioning
that the similar trend was also observed by several other researchers (Baidya 1992;
Baidya and Muralikrishna 2001; Baidya and Mandal 2006; Baidya and Rathi 2004;
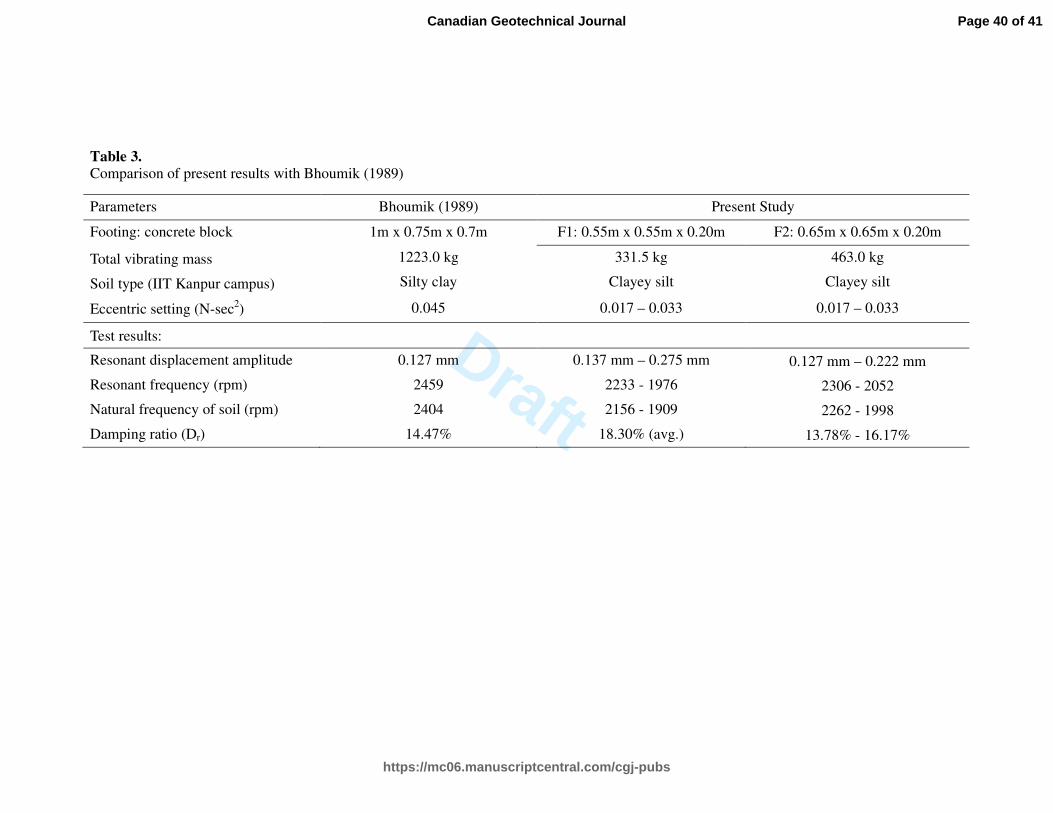
Kumar and Reddy 2006). Bhoumik (1989) conducted block vibration test on a large
concrete block in the Geotechnical Engineering Laboratory site of IIT Kanpur campus.
In Table 3, the test details and results obtained from the present study are compared
with the results reported by Bhoumik (1989) and a good agreement can be observed in
the values of natural frequency and damping of the soil.
Interacting footings
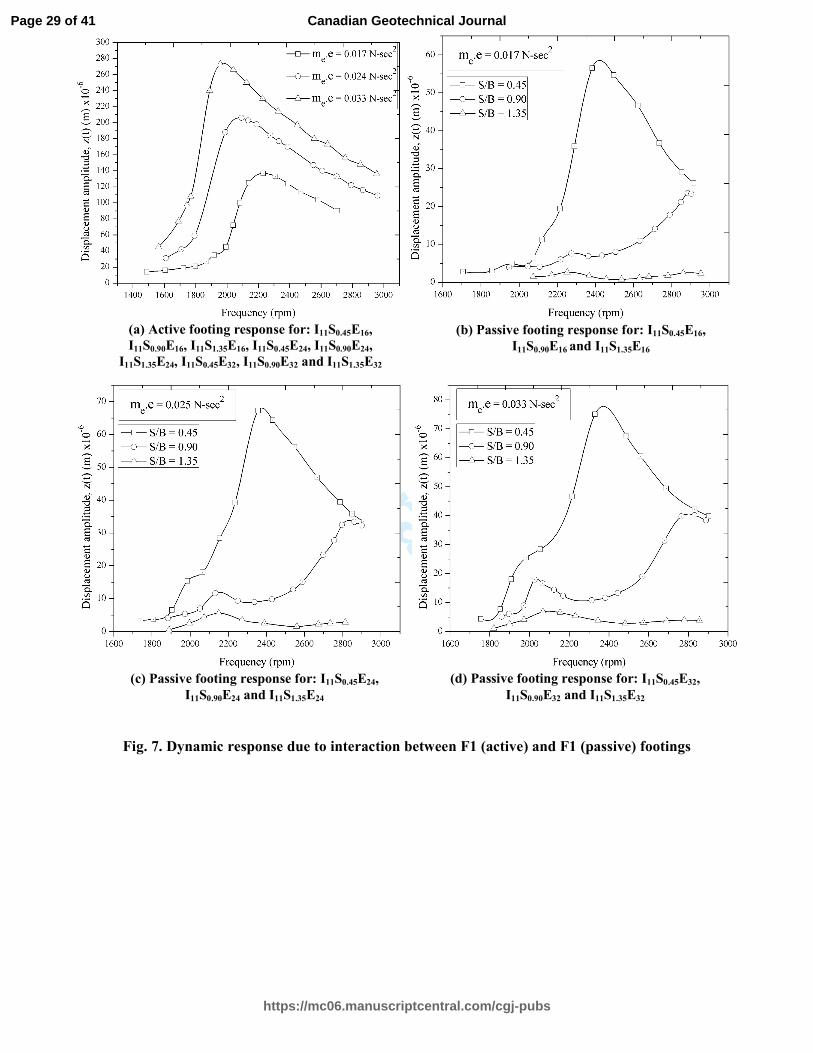
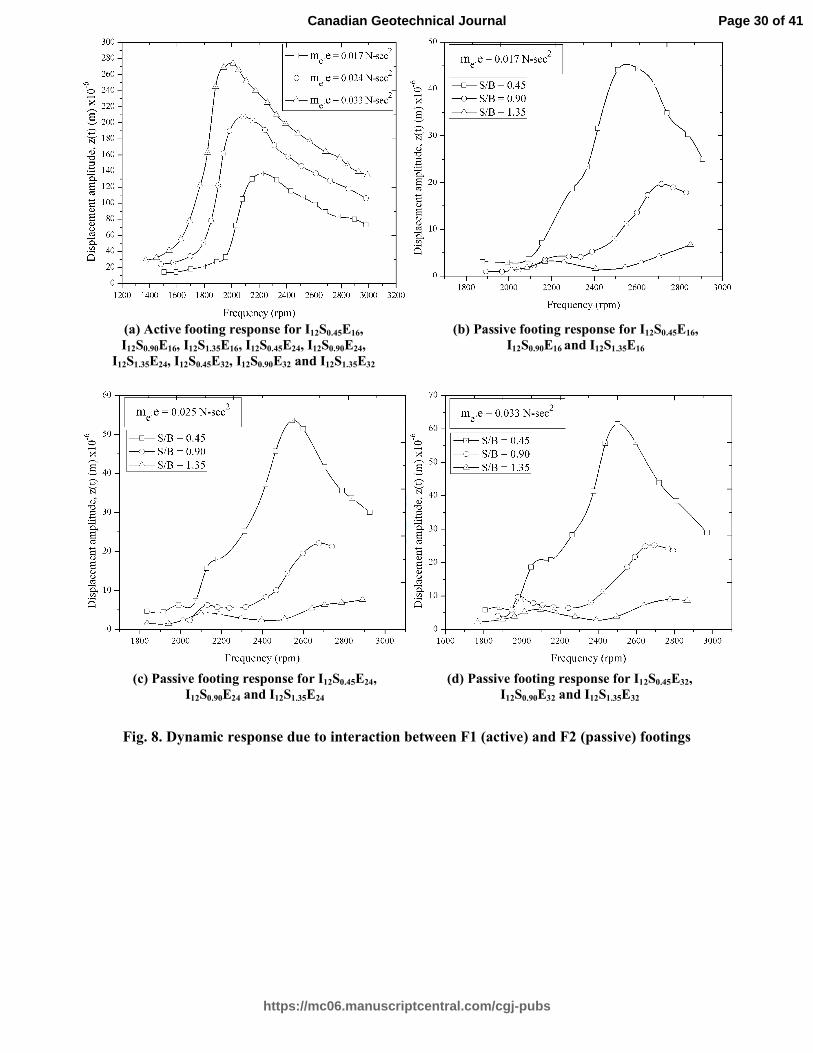
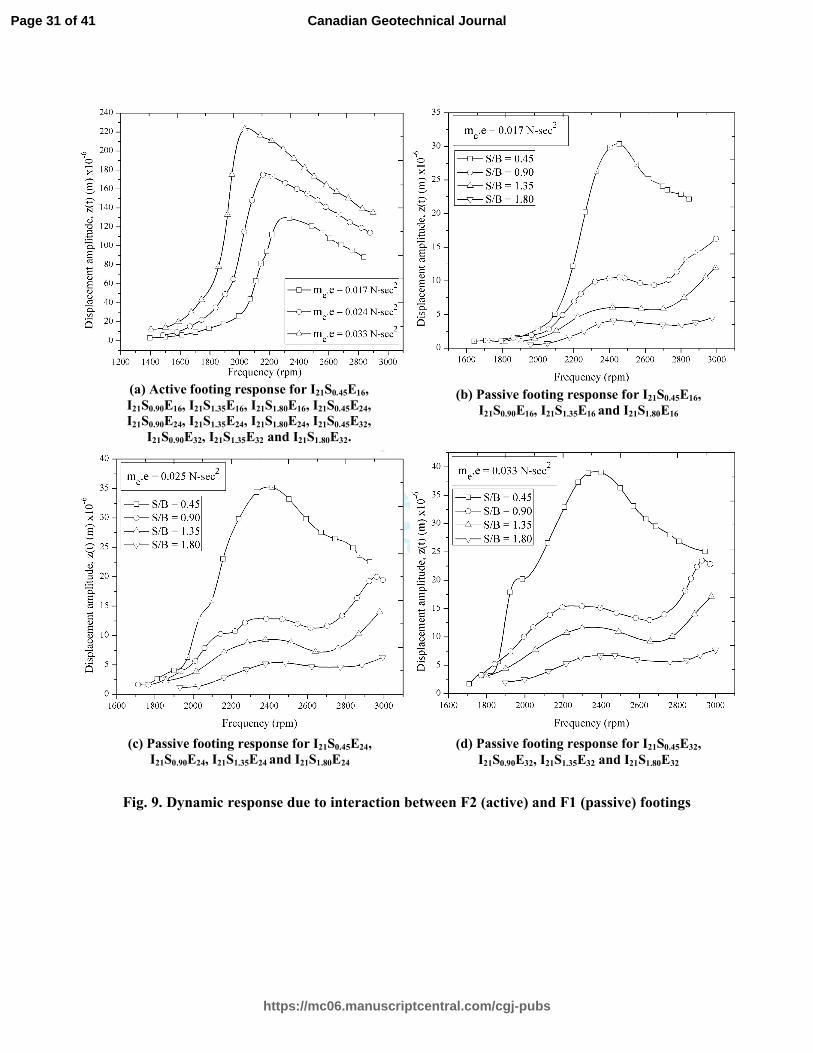
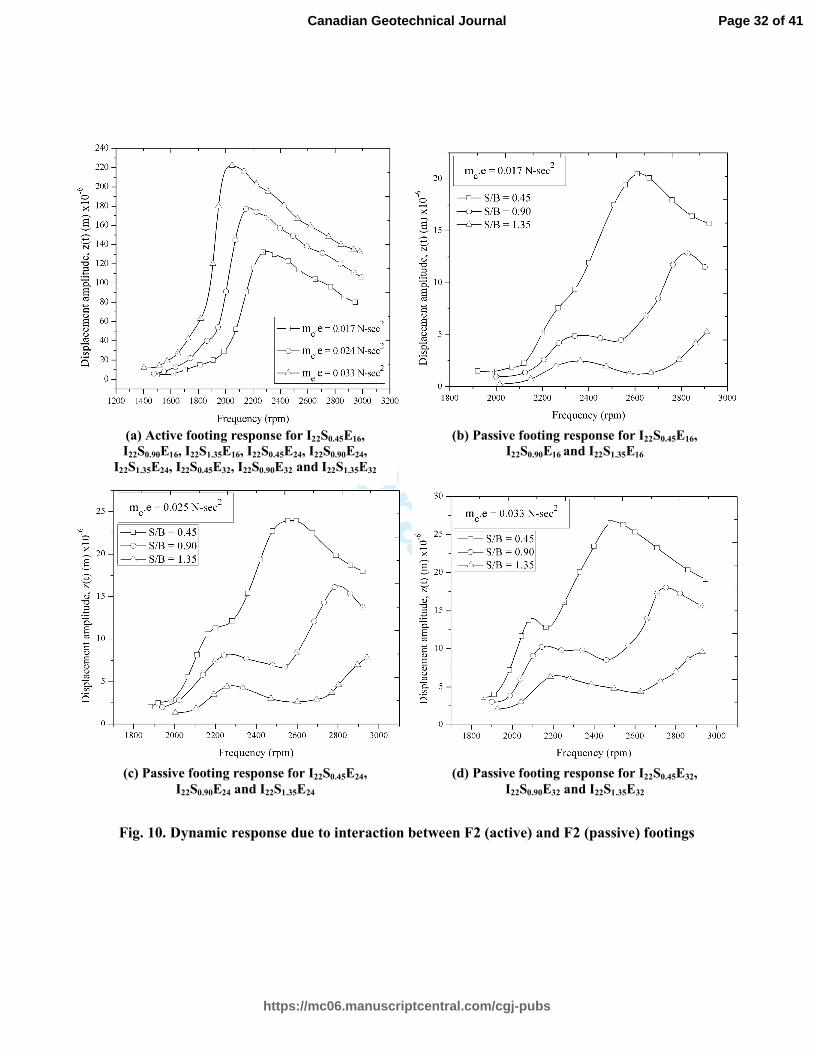
Several tests were conducted on the interfering footings F1 and F2 in four basic
combinations (F1-F1, F1-F2, F2-F1 and F2-F2) to explore the dynamic interaction
between two nearby footings. The variation of the displacement amplitude with the
frequency for both active and passive footings is presented in Figs. 7-10. No significant
variation can be observed in the response of the active footing when compared with that
of the isolated footing response at the same eccentric setting. It is worth noting that the
Page 11 of 41
https://mc06.manuscriptcentral.com/cgj-pubs
Canadian Geotechnical Journal
Draft
12
feedback from the passive footing might have some measurable effect on the response
of the active footing, which in the present case was found to have negligible effect on
the vertical response and hence this factor was neglected. The active footing response
also remains almost unchanged at different S/B ratios, for the eccentric setting being
constant. However, at a particular eccentric force setting, the response of the passive
footing shows significant variation in the displacement amplitude with the frequency at
different S/B ratios. The present observations are reported for the machines operating
within its working range of frequency (120 rpm–3000 rpm). The magnitude of the peak
displacement of the passive footing is found to be lower than that of the active footing
at every S/B ratio. The resonant frequency for the passive footing is found to be higher
than that of the active footing and this difference in the frequencies may be attributed to
the phase lag between the response of the active and the passive footings. The phase lag
is found to increase with the increase in S/B ratio, whereas the reverse trend can be
observed for the resonant displacement amplitude of the passive footing. For the
passive footing, the phase lag attributes to a sudden rise in the rate of increase in z(t) by
attaining a local peak near the resonant condition of the active footing followed by
nearly constant variation in z(t), which further increases at a higher rate to attain the
peak value near the resonance of the passive footing. However, after resonance, z(t)
decreases and eventually attains almost constant value. This phase lag concept can be
clearly observed from the response of the passive footing as shown in Figs. 7-10. A
well-defined resonance can be observed for the passive footing at S/B = 0.45. However,
the phase lag increases at S/B > 0.45 and the point of resonance shifts forward and in
some cases, it shifts beyond the upper limit of the operating frequency range. This
might have resulted in non-availability of well defined resonant peaks at higher S/B
ratios. At any spacing and eccentric setting, the magnitude of the resonant displacement
Page 12 of 41
https://mc06.manuscriptcentral.com/cgj-pubs
Canadian Geotechnical Journal
Draft
13
amplitude for the passive footing is found to be higher for I11SmEn as compared to
I12SmEn. This indicates that the increase in the size of the passive footing decreases the
magnitude of the resonant displacement amplitude for the passive footing by keeping
the same active footing. The magnitude of the resonant displacement amplitude for the
passive footing is found to be higher for the tests I11SmEn and I12SmEn as compared to
that obtained from the tests I21SmEn and I22SmEn, respectively. This shows that the
increase in size of the active footing reduces the magnitude of the resonant
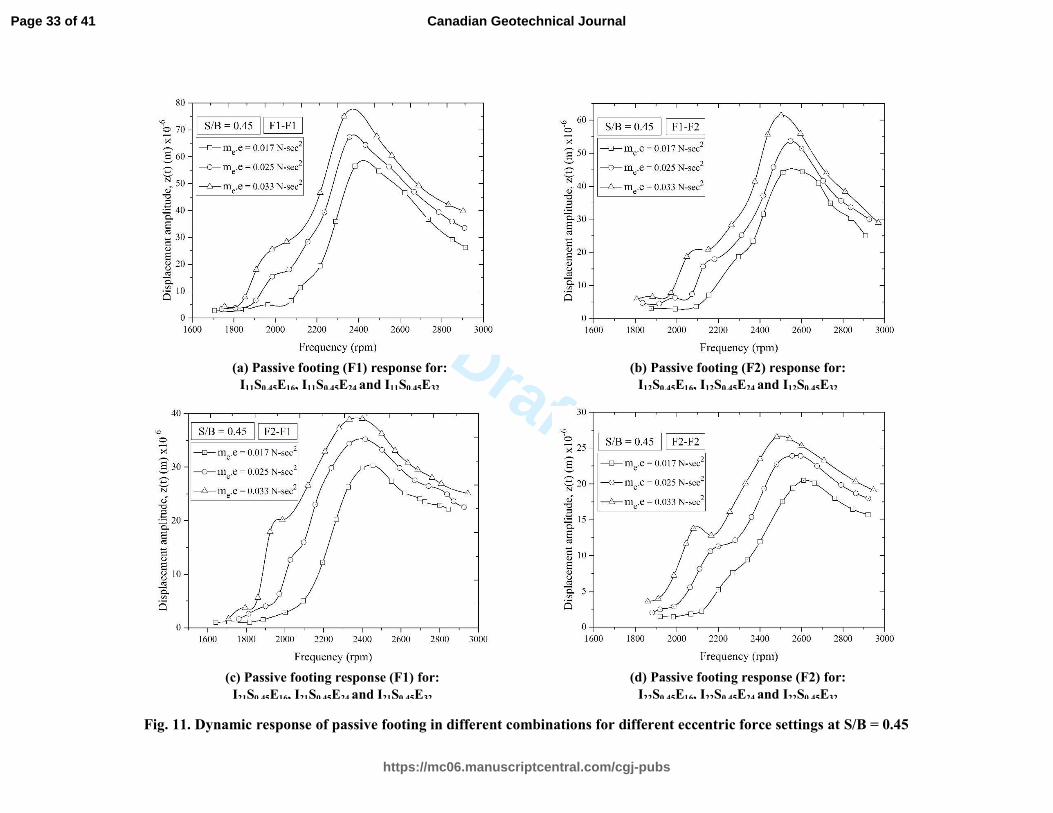
displacement amplitude for the passive footing keeping all other parameters same. Fig.
11 presents the dynamic response of passive footing in different combinations for
different values of θ at S/B = 0.45. It can be noted that the magnitude of displacement
amplitude, z(t) of the passive footing increases with increase in the exciting force on
the active footing at a particular S/B ratio. The resonance frequency of the passive
footing is found to decrease with increase in the magnitude of eccentric force setting
(me⋅e). Similar trend is also observed in the passive footing response for other values
S/B ratio.
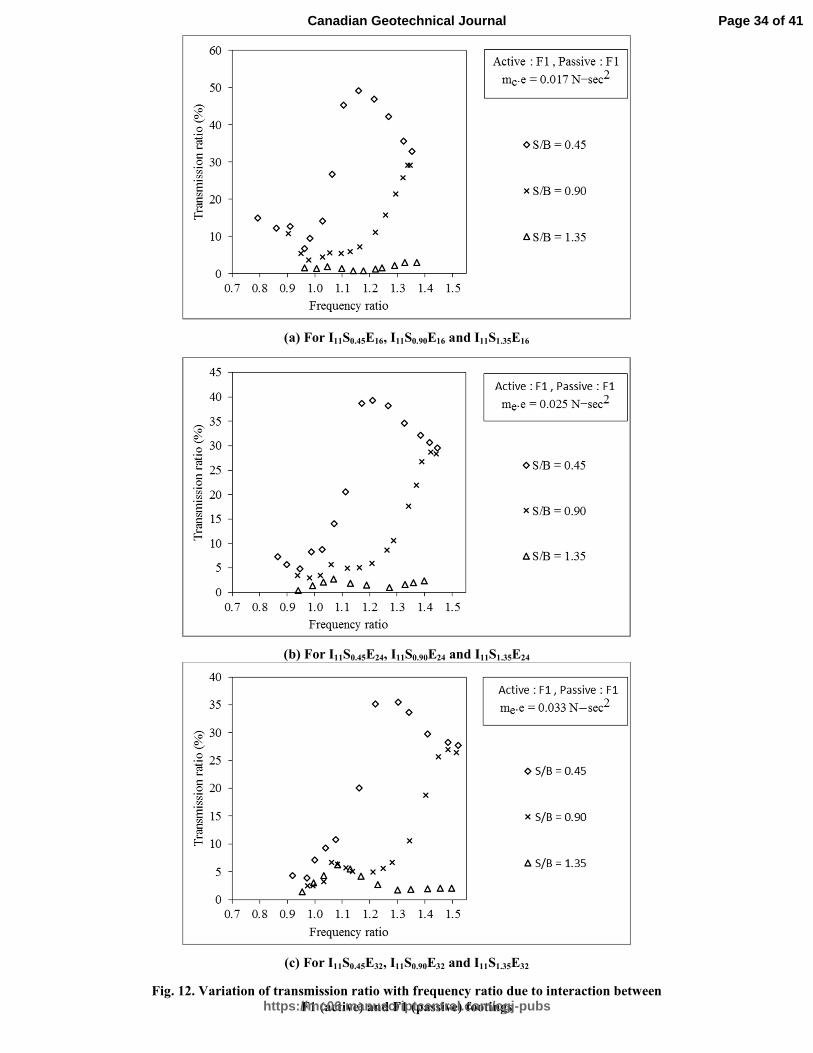
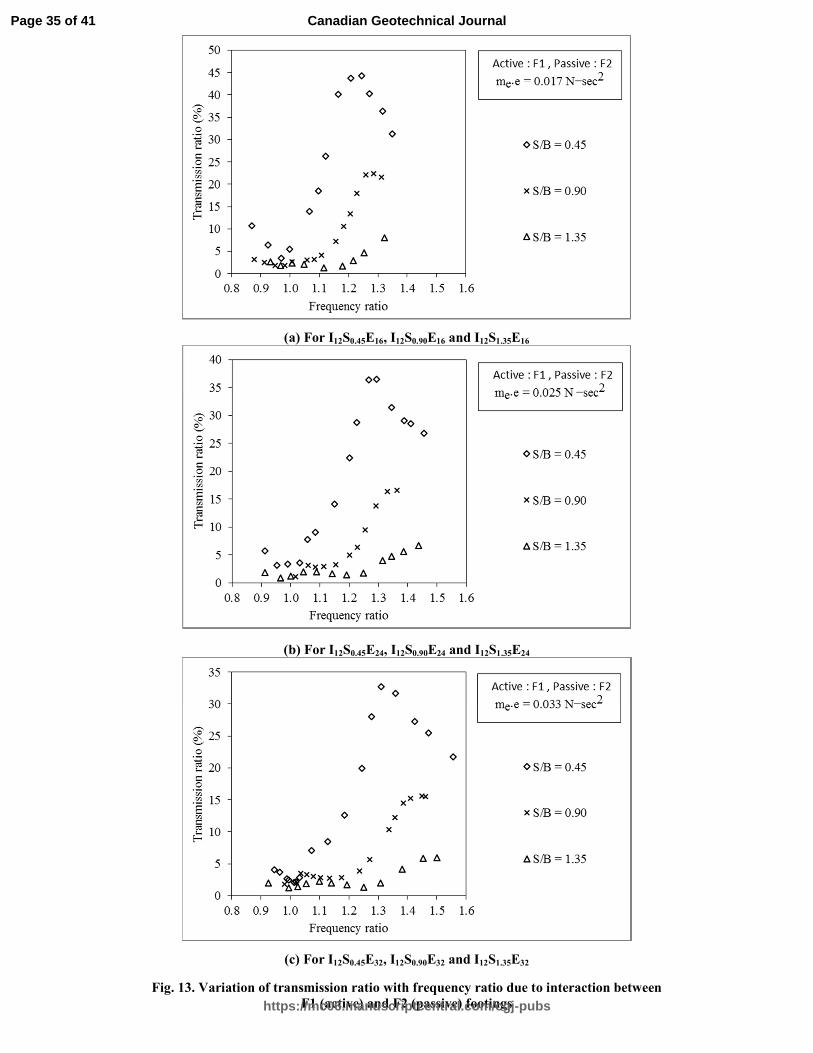
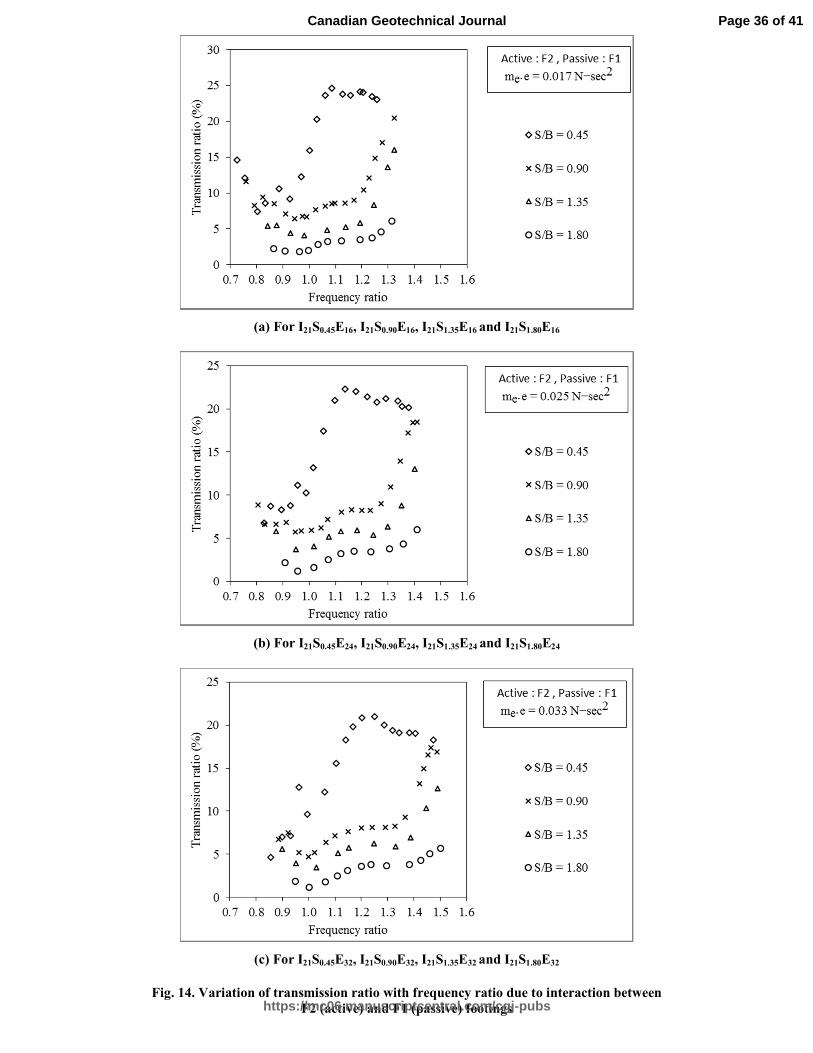
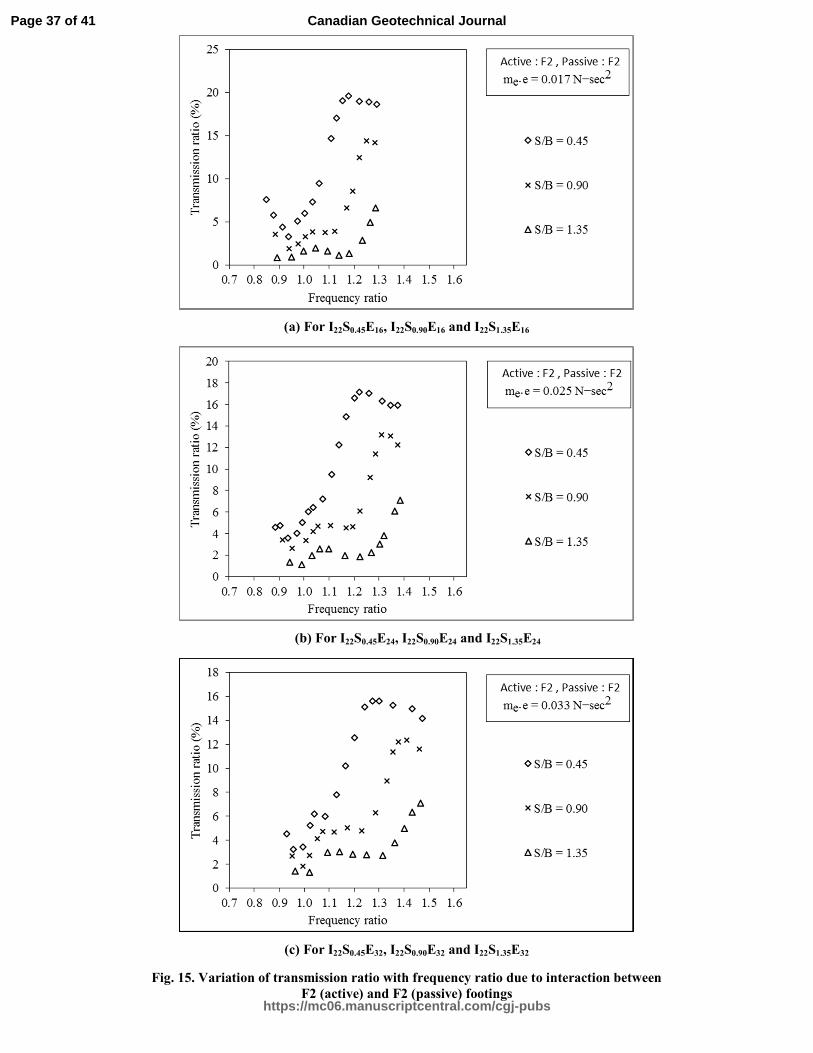
The effect of dynamic interaction between the footings can be expressed in
terms of transmission ratio (Tr), which is defined as:
Tr= Vertical translational displacement amplitude of passive footing
Vertical translational displacement amplitude of active footing (7)
In Figs. 12-15, the transmission ratio is plotted with respect to the normalized
frequency ratio (fr). The frequency is normalized with respect to the natural frequency
of the active footing-soil system as defined in Eq. 4. It can be noticed that the variation
of Tr generally decreases initially to reach a local minimum and then increases
gradually to reach the peak corresponding to the maximum Tr. Generally, the local
minima in the variation of Tr can be observed close to fr = 1 representing the natural
Page 13 of 41
https://mc06.manuscriptcentral.com/cgj-pubs
Canadian Geotechnical Journal
Draft
14
frequency of the soil with respect to the active vibrating system, whereas the
transmission ratio can be seen to attain the maximum value at the resonant point of the
passive footing. The resonance in the active footing is observed to occur at a frequency
ratio ( frm=fmr/fn ) ≈ 1.025. The difference between f&% and fr corresponding to
maximum Tr may be attributed due to the phase lag, as discussed earlier. Similar
observations are also valid for other set of test cases. The phenomena of achieving local
minimum and maximum in the variation of Tr can be explained subsequently. When the
operating frequency approaches the natural frequency of the soil, the rate of increase in
the response parameter (displacement, velocity or acceleration) of the active footing
shoots up rapidly, whereas the rate of increase in the corresponding response parameter
in the passive footing is found to be significantly less. Hence, the magnitude of Tr is
observed to decrease initially. At a particular operating frequency, the rate of increase
in the response parameters becomes almost same for both active and passive footings,
which can be denoted by the local minimum point. Just after the resonant condition of
the active footing, the response parameters of the active footing start decreasing,
whereas the passive footing continues to receive increasingly higher energy from the
active footing through the soil due to the increase in the frequency of vibration on the
active footing. This probably results in an increasing rate of the response parameters of
the passive footing, which causes the transmission ratio to increase gradually. At some
frequency beyond the local minimum point, the passive footing experiences the
resonance. The transmission ratio mostly attains the maximum value corresponding to
the resonant frequency of the passive footing. However, the predominance of the local
minima gets diminishing gradually with increase in the S/B ratio due to lower energy
received by the passive footing causing reduction in the interaction with increasing
spacing. Further, the response parameters for both active and passive footings decrease
Page 14 of 41
https://mc06.manuscriptcentral.com/cgj-pubs
Canadian Geotechnical Journal
Draft
15
with increase in the frequency, which results in decrease in Tr value beyond the peak.
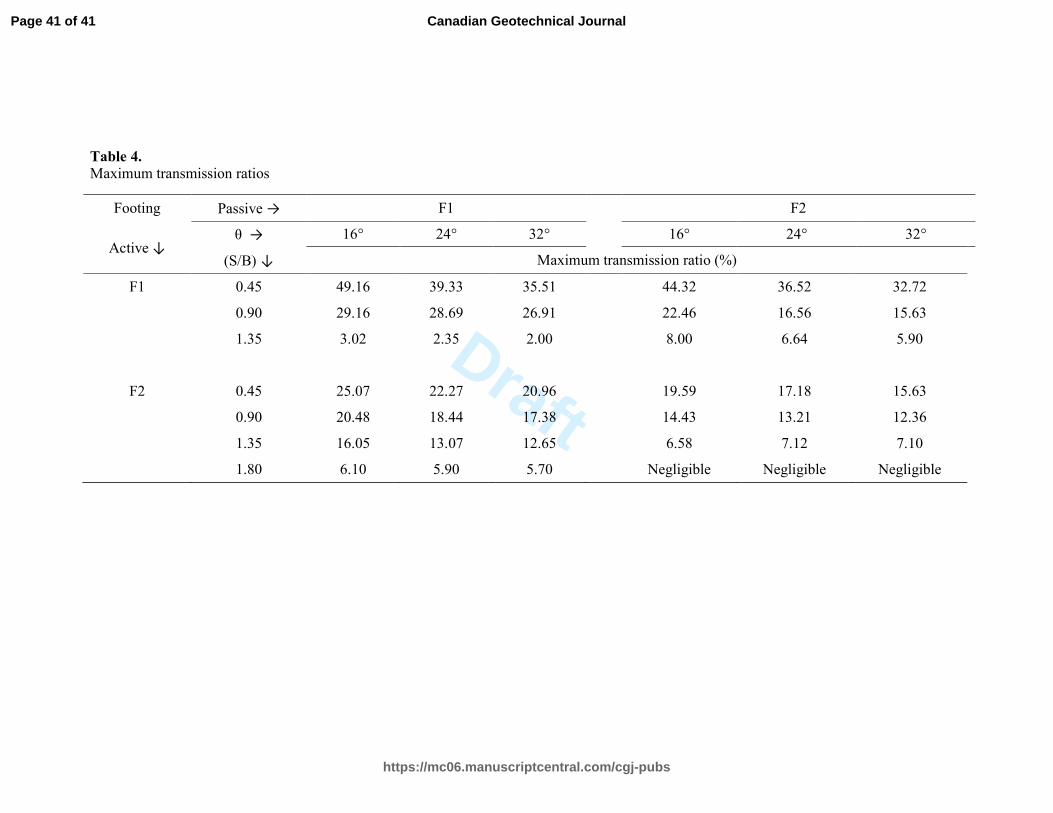
Table 4 shows the variation of the maximum value of Tr with S/B ratio and eccentric
setting (θ). The values of maximum Tr are generally found to decrease with increase in
the eccentric setting (θ) for a given combination of footings and at a particular spacing.
This may be due to the rate of increase in the vibration energy received by the passive
footing is less than that induced on the active footing. It can be noted that the
magnitude of maximum Tr decreases rapidly with increase in the spacing between the
footings, which indicates that the interaction of closely spaced footings decreases with
increase in the spacing. It is worth mentioning here that the criteria for terminating any
experiment at a particular S/B ratio was based on the maximum Transmission ratio (Tr)
falling below 7.5%, which actually represents negligible interaction between the
footings i.e., if for a particular S/B ratio, the maximum Tr ≤ 7.5%, then the experiment
was stopped, else the test was performed for the next higher S/B ratio. The terminating
criteria being maximum Tr ≤ 7.5% was chosen to be an approximate value by
performing trial tests, which resulted in negligible variation to be recorded in the
passive footing and no well-defined response curve was obtained..
Summary and conclusions
Present advanced stage of industrialization often includes heavy machines operating at
high frequencies, which may affect the nearby foundations or structures and its own
operation may be hampered due to working of other machines in close proximity to it.
Therefore, the present investigation aimed to study the interference effect of closely
spaced machine foundations, which should be taken into consideration during the
design of machine foundations and their installation. Large scaled model tests were
conducted using model RCC footings (square in shape) to study the dynamic response
Page 15 of 41
https://mc06.manuscriptcentral.com/cgj-pubs
Canadian Geotechnical Journal
Draft
16
of isolated and two closely spaced interacting foundations. All tests were conducted in
the geotechnical in-situ laboratory of IIT Kanpur, India. The variation of the
displacement amplitude with the frequency was studied for two different sizes of
footings (F1 and F2). The dynamic properties of the soil at the test site were obtained
from the block vibration test conducted on the isolated footing and were validated with
the available data. The dynamic interaction of two footings in combination was
investigated by maintaining the same magnitude of static load intensity of 10,750 N/m2
below each footing. The response of the active and passive footings was recorded and
studied for exploring the dynamic interaction of footings F1 and F2 in four different
combinations. The tests were conducted for different S/B ratios (0.45, 0.90, 1.35 and
1.80) and at different vibrating force (eccentric) settings (θ = 16°, 24°and32°). The
dynamic interaction of the active and passive footings was observed by studying the
variation of transmission ratio (T+) with the frequency ratio (fr). It can be observed that
the passive footing undergoes resonance due to the dynamic excitation on the active
footing, which occurs, however, with a phase lag from the resonant frequency of the
active footing. This phase lag is found to be a vital parameter in defining the dynamic
interaction of a group of footings. The phase lag is observed to decrease with decrease
in the spacing between the footings. The variation of transmission ratio is generally
associated with a minimum and a maximum point. The minimum point occurs as Tr
approaches the resonance of the active footing (fr = 1), whereas the maximum occurs at
the frequency ratio associated with resonance of the passive footing.
Page 16 of 41
https://mc06.manuscriptcentral.com/cgj-pubs
Canadian Geotechnical Journal
Draft
17
References
Baidya, D.K. 1992. Dynamic response of foundations resting on layered and
nonhomogeneous soils. Ph.D. Thesis, Indian Institute of Science, Bangalore,
India.
Baidya, D.K., and Muralikrishna, G. 2001. Investigation of resonant frequency and
amplitude of vibrating footing resting on a layered soil system. Geotechnical
Testing Journal, 24(4): 409–417.
Baidya, D.K., and Mandal, A. 2006. Dynamic response of footing resting on a layered
soil system. West Indian Journal of Engineering, 28(2): 65-79.
Baidya, D.K., and Rathi, A. 2004. Dynamic response of footings resting on a sand layer
of finite thickness. Journal of Geotechnical and Geoenvironmental Engineering,
ASCE, 130(6): 651–655.
Bhoumik, K. 1989. Coupled vibration of footings on elastic half-space. M.Tech Thesis,
I.I.T-Kanpur, Kanpur, India.
Chanda, S. 2011. Measurement of shear wave velocity and evaluation of liquefaction
potential of kanpur soil by seismic downhole technique. M.Tech. Thesis, I.I.T-
Kanpur, Kanpur, India.
Erden, S.M. 1974. Influence of shape and embedment on dynamic foundation response.
Ph.D. Thesis, University of Massachusetts, Amherst.
Gazetas, G. 1991. Formulas and charts for impedances of surface and embedded
foundations. Journal of Geotechnical Engineering, ASCE. 117(9): 1363–1381.
Ghosh, P. 2011. Seismic interference effect of two nearby square
footings. Geotechnical Special Publication, ASCE (GSP 211): 352-361.
Page 17 of 41
https://mc06.manuscriptcentral.com/cgj-pubs
Canadian Geotechnical Journal
Draft
18
Ghosh, P. 2012. FLAC based numerical studies on dynamic interference of two nearby
embedded machine foundations. Geotechnical and Geological Engineering
Journal, 30(5): 1161-1181.
Ghosh, P., and Kumari, R. 2012. Seismic interference of two nearby horizontal strip
anchors in layered soil. Natural Hazards, 63(2): 789-804.
Ghosh, P. 2013. Numerical studies on seismic interference of two nearby embedded
shallow footings. Disaster Advances, 6(9): 19-30.
IS:5249. 1992. Method of test for determination of in-situ dynamic properties of soils.
Indian Standard Institution, Manak Bhavan, New Delhi, India.
Kameswara Rao, N.S.V. 1998. Vibration analysis and foundation dynamics. Wheeler,
New Delhi.
Kameswara Rao, N.S.V. 2011. Foundation design: theory and practice. Wiley,
Singapore.
Karabalis, D.L., and Mohammadi, M. 1991. 3-D foundation-soil-foundation dynamics
using a 3D frequency domain BEM. In:proceedings of the thirteenth conference
on boundary element. Istanbul, Turkey; p. 446-456.
Karabalis, D.L., and Mohammadi, M. 1998. 3-D foundation-soil-foundation dynamics
using a 3D frequency domain BEM. Soil Dynamics and Earthquake
Engineering, 17: 139-152.
Kumar, J., and Reddy, C.O. 2006. Dynamic response of footing and machine with
spring mounting base. Geotechnical and Geological Engineering, 24: 15–27.
Liang, C.V. 1974. Dynamic response of structures in layered soils. Ph.D. Thesis,
Massachusetts Institute of Technology, Cambridge, U.S.A.
Lysmer, J., and Richart, F.E. 1966. Dynamic response of footing to vertical loading.
Journal of Soil Mechanics and Foundation Division, 92(1): 65-91.
Page 18 of 41
https://mc06.manuscriptcentral.com/cgj-pubs
Canadian Geotechnical Journal
Draft
19
Lysmer, J., Udaka, T., Tsai, C.F., and Seed, H.B. 1975. FLUSH-A computer program
for approximate 3-d analysis of soil-structure interaction problems. Report No.
EERC 75-30, Earthquake Engineering Research Center, University of
California, Berkeley.
Mandal, A., Baidya, D.K., and Roy, D. 2012. Dynamic response of foundations resting
on a two-layered soil underlain by a rigid layer. Geotechnical and Geological
Engineering, 30: 775–786.
Qian, J., and Beskos, D.E. 1996. Harmonic wave response of two 3-D rigid surface
foundations. Soil Dynamics and Earthquake Engineering, 15: 95–110.
Richart, F.E., Hall, J.R., and Woods, R.D. 1970. Vibrations of soils and foundations.
Prentice-Hall, Englewood Cliffs, N.J.
Sung, T.Y. 1953. Vibrations in semi-infinite solids due to periodic surface loadings.
Symposium on dynamic testing of soils, STP no. 156, ASTM, Philadelphia, 35–
64.
Tham, L.G., Qian, J., and Cheung, Y.K. 1998. Dynamic response of a group of flexible
foundations to incident seismic waves. Soil Dynamic and Earthquake
Engineering, 17: 127-137.
Triantafyllidis, T., and Prange, B. 1989. Dynamic subsoil-coupling between rigid,
circular foundations on the half-space. Soil Dynamics and Earthquake
Engineering, 8(1): 9–22.
Vivek, P., and Ghosh, P. 2012. Dynamic interaction of two nearby machine foundations
on homogeneous soil. Geotechnical Special Publication, ASCE (GSP 225).
Wang, Y., Rajapakse, R.K.N.D., and Shah, A.H. 1991. Dynamic interaction between
flexible strip foundations. Earthquake Engineering and Structural Dynamics, 20:
441-454.
Page 19 of 41
https://mc06.manuscriptcentral.com/cgj-pubs
Canadian Geotechnical Journal
Draft
20
Wang, S., and Schmid, G. 1992. Dynamic structure–soil–structure interaction by FEM
and BEM. Computational Mechanics, 9: 347–357.
Warburton, G.B., Richardson, J.D., and Webster, J.J. 1971. Forced vibrations of two
masses on an elastic half space. J. Appl. Mech., ASME, 38, 148-156.
Wong, H.L., and Luco, J.E. 1986. Dynamic interaction between rigid foundations in a
layered half space. Soil Dynamics and Earthquake Engineering, 5(3): 149–158.
Page 20 of 41
https://mc06.manuscriptcentral.com/cgj-pubs
Canadian Geotechnical Journal
Draft
21
Table captions
Table 1 Details of experimental program.
Table 2 Dynamic properties of soil under different vibrating conditions.
Table 3 Comparison of present results with Bhoumik (1989).
Table 4 Magnitude of maximum transmission ratio for different footings, S/B ratio and
θ value.
Figure captions
Fig. 1. Layout of two closely spaced footing assembly.
Fig. 2. Photographic view of the experimental setup at S/B = 0.45.
Fig. 3. General layout of the test setup for two closely spaced machine foundations.
Fig. 4. Variation of displacement amplitude with frequency for dynamic response of
isolated footings (a) F1 (I10S0E16, I10S0E24 and I10S0E32) and (b) F2 (I20S0E16,
I20S0E24 and I20S0E32).
Fig. 5. Variation of magnification factor with frequency ratio for dynamic response of
isolated footings (a) F1 (I10S0E16, I10S0E24 and I10S0E32) and (b) F2 (I20S0E16,
I20S0E24 and I20S0E32).
Fig. 6. Comparison of the present results with Kumar and Reddy (2006) for (a) soil
stiffness and (b) damping ratio.
Fig. 7. Dynamic response due to interaction between F1 (active) and F1 (passive)
footings.
Fig. 8. Dynamic responses due to interaction between F1 (active) and F2 (passive)
footings.
Page 21 of 41
https://mc06.manuscriptcentral.com/cgj-pubs
Canadian Geotechnical Journal
Draft
22
Fig. 9. Dynamic response due to interaction between F2 (active) and F1 (passive)
footings.
Fig. 10. Dynamic response due to interaction between F2 (active) and F2 (passive)
footings.
Fig. 11. Dynamic response of passive footing in different combination for different
eccentric force settings at S/B = 0.45.
Fig. 12. Variation of transmission ratio with frequency ratio due to interaction between
F1 (active) and F1 (passive) footings.
Fig. 13. Variation of transmission ratio with frequency ratio due to interaction between
F1 (active) and F2 (passive) footings.
Fig. 14. Variation of transmission ratio with frequency ratio due to interaction between
F2 (active) and F1 (passive) footings.
Fig. 15. Variation of transmission ratio with frequency ratio due to interaction between
F2 (active) and F2 (passive) footings.
Page 22 of 41
https://mc06.manuscriptcentral.com/cgj-pubs
Canadian Geotechnical Journal
Draft
(a)
(b)
Fig. 1: Layout of two closely spaced footing assembly
Front view
Front view
Isometric view
Page 23 of 41
https://mc06.manuscriptcentral.com/cgj-pubs
Canadian Geotechnical Journal
Draft
Fig. 2. Photographic view of the experimental setup at S/B = 0.45
Page 24 of 41
https://mc06.manuscriptcentral.com/cgj-pubs
Canadian Geotechnical Journal
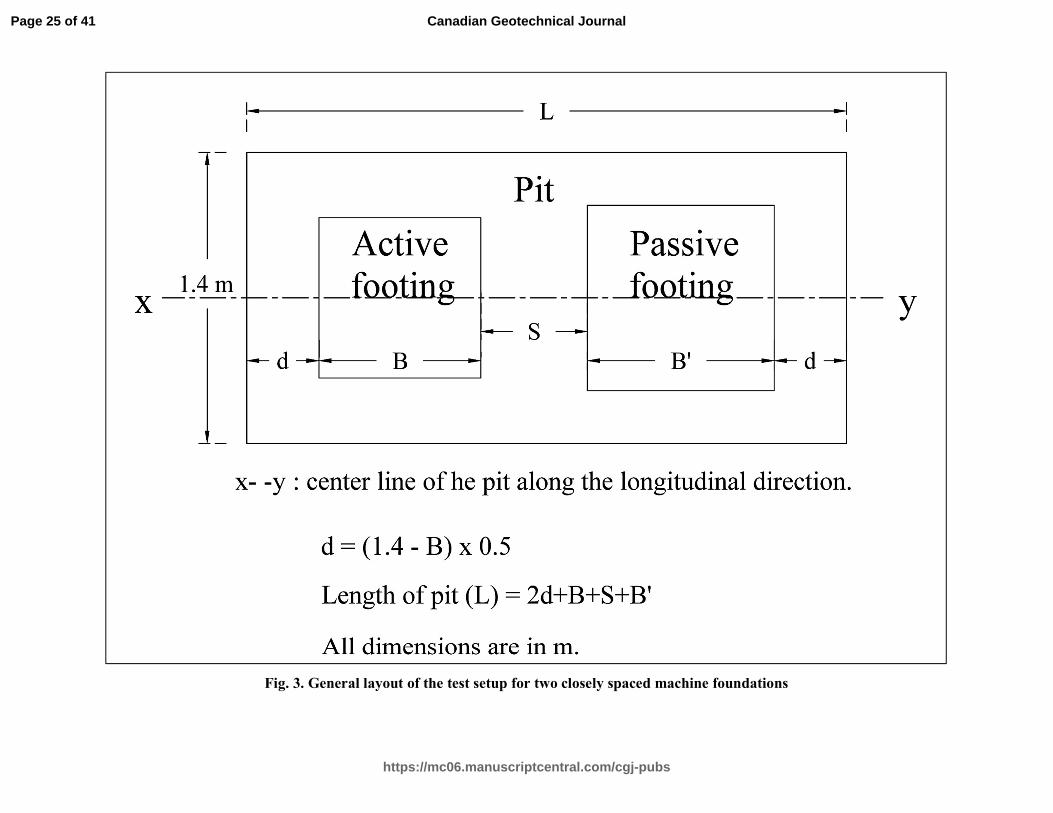
Draft
Fig. 3. General layout of the test setup for two closely spaced machine foundations
Page 25 of 41
https://mc06.manuscriptcentral.com/cgj-pubs
Canadian Geotechnical Journal
Draft
Fig. 4. Variation of displacement amplitude with frequency ratio for the dynamic
response of isolated footings (a) F1 (I10S0E16, I10S0E24 and I10S0E32) and (b) F2
(I20S0E16, I20S0E24 and I20S0E32)
(a)
(b)
Page 26 of 41
https://mc06.manuscriptcentral.com/cgj-pubs
Canadian Geotechnical Journal
Draft
Fig. 5. Variation of magnification factor with frequency ratio for the dynamic
response of isolated footings (a) F1 (I10S0E16, I10S0E24 and I10S0E32) and (b) F2
(I20S0E16, I20S0E24 and I20S0E32).
(a)
(b)
Page 27 of 41
https://mc06.manuscriptcentral.com/cgj-pubs
Canadian Geotechnical Journal
Draft
Fig. 6. Comparison of the present results with Kumar and Reddy (2006) (a) soil stiffness and (b) damping ratio
Kumar and Reddy (2006): F0=0.226 ω2 sin(θ/2); RCC footing: 0.6m x 0.6m x 0.18m; vibrating weight = 5.862 KN; soil type: silty sand.
(a) (b)
Page 28 of 41
https://mc06.manuscriptcentral.com/cgj-pubs
Canadian Geotechnical Journal
Draft
Fig. 7. Dynamic response due to interaction between F1 (active) and F1 (passive) footings
(a) Active footing response for: I11S0.45E16,
I11S0.90E16, I11S1.35E16, I11S0.45E24, I11S0.90E24,
I11S1.35E24, I11S0.45E32, I11S0.90E32 and I11S1.35E32
(b) Passive footing response for: I11S0.45E16,
I11S0.90E16 and I11S1.35E16
(c) Passive footing response for: I11S0.45E24,
I11S0.90E24 and I11S1.35E24
(d) Passive footing response for: I11S0.45E32,
I11S0.90E32 and I11S1.35E32
Page 29 of 41
https://mc06.manuscriptcentral.com/cgj-pubs
Canadian Geotechnical Journal
Draft
Fig. 8. Dynamic response due to interaction between F1 (active) and F2 (passive) footings
(a) Active footing response for I12S0.45E16,
I12S0.90E16, I12S1.35E16, I12S0.45E24, I12S0.90E24,
I12S1.35E24, I12S0.45E32, I12S0.90E32 and I12S1.35E32
(d) Passive footing response for I12S0.45E32,
I12S0.90E32 and I12S1.35E32
(c) Passive footing response for I12S0.45E24,
I12S0.90E24 and I12S1.35E24
(b) Passive footing response for I12S0.45E16,
I12S0.90E16 and I12S1.35E16
Page 30 of 41
https://mc06.manuscriptcentral.com/cgj-pubs
Canadian Geotechnical Journal
Draft
Fig. 9. Dynamic response due to interaction between F2 (active) and F1 (passive) footings
(a) Active footing response for I21S0.45E16,
I21S0.90E16, I21S1.35E16, I21S1.80E16, I21S0.45E24,
I21S0.90E24, I21S1.35E24, I21S1.80E24, I21S0.45E32,
I21S0.90E32, I21S1.35E32 and I21S1.80E32.
(d) Passive footing response for I21S0.45E32,
I21S0.90E32, I21S1.35E32 and I21S1.80E32
(c) Passive footing response for I21S0.45E24,
I21S0.90E24, I21S1.35E24 and I21S1.80E24
(b) Passive footing response for I21S0.45E16,
I21S0.90E16, I21S1.35E16 and I21S1.80E16
Page 31 of 41
https://mc06.manuscriptcentral.com/cgj-pubs
Canadian Geotechnical Journal
Draft
Fig. 10. Dynamic response due to interaction between F2 (active) and F2 (passive) footings
(a) Active footing response for I22S0.45E16,
I22S0.90E16, I22S1.35E16, I22S0.45E24, I22S0.90E24,
I22S1.35E24, I22S0.45E32, I22S0.90E32 and I22S1.35E32
(d) Passive footing response for I22S0.45E32,
I22S0.90E32 and I22S1.35E32
(c) Passive footing response for I22S0.45E24,
I22S0.90E24 and I22S1.35E24
(b) Passive footing response for I22S0.45E16,
I22S0.90E16 and I22S1.35E16
Page 32 of 41
https://mc06.manuscriptcentral.com/cgj-pubs
Canadian Geotechnical Journal
Draft
Fig. 11. Dynamic response of passive footing in different combinations for different eccentric force settings at S/B = 0.45
(d) Passive footing response (F2) for:
I22S0.45E16, I22S0.45E24 and I22S0.45E32
(c) Passive footing response (F1) for:
I21S0.45E16, I21S0.45E24 and I21S0.45E32
(b) Passive footing (F2) response for:
I12S0.45E16, I12S0.45E24 and I12S0.45E32
(a) Passive footing (F1) response for:
I11S0.45E16, I11S0.45E24 and I11S0.45E32
Page 33 of 41
https://mc06.manuscriptcentral.com/cgj-pubs
Canadian Geotechnical Journal
Draft
(a) For I11S0.45E16, I11S0.90E16 and I11S1.35E16
(b) For I11S0.45E24, I11S0.90E24 and I11S1.35E24
(c) For I11S0.45E32, I11S0.90E32 and I11S1.35E32
Fig. 12. Variation of transmission ratio with frequency ratio due to interaction between
F1 (active) and F1 (passive) footings
Page 34 of 41
https://mc06.manuscriptcentral.com/cgj-pubs
Canadian Geotechnical Journal
Draft
(a) For I12S0.45E16, I12S0.90E16 and I12S1.35E16
(b) For I12S0.45E24, I12S0.90E24 and I12S1.35E24
(c) For I12S0.45E32, I12S0.90E32 and I12S1.35E32
Fig. 13. Variation of transmission ratio with frequency ratio due to interaction between
F1 (active) and F2 (passive) footings
Page 35 of 41
https://mc06.manuscriptcentral.com/cgj-pubs
Canadian Geotechnical Journal
Draft
(a) For I21S0.45E16, I21S0.90E16, I21S1.35E16 and I21S1.80E16
(b) For I21S0.45E24, I21S0.90E24, I21S1.35E24 and I21S1.80E24
(c) For I21S0.45E32, I21S0.90E32, I21S1.35E32 and I21S1.80E32
Fig. 14. Variation of transmission ratio with frequency ratio due to interaction between
F2 (active) and F1 (passive) footings
Page 36 of 41
https://mc06.manuscriptcentral.com/cgj-pubs
Canadian Geotechnical Journal
Draft
(a) For I22S0.45E16, I22S0.90E16 and I22S1.35E16
(b) For I22S0.45E24, I22S0.90E24 and I22S1.35E24
(c) For I22S0.45E32, I22S0.90E32 and I22S1.35E32
Fig. 15. Variation of transmission ratio with frequency ratio due to interaction between
F2 (active) and F2 (passive) footings
Page 37 of 41
https://mc06.manuscriptcentral.com/cgj-pubs
Canadian Geotechnical Journal
Draft
Table 1
Details of experimental program
Spacing (S/B)
Eccentric angle settings (θ):
16°, 24° and 32° Number of tests Remarks
Active footing Passive footing
Isolated F1 Not applicable 3 PIT - P1
F2
Not applicable
3
PIT - P2
0.45 F1 F1 3
PIT - P1
F1
F2
3
0.90 F1 F1 3
F1
F2
3
1.35 F1 F1 3
F1
F2
3
0.45 F2 F1 3 PIT - P2
F2
F2
3
0.90 F2 F1 3
F2
F2
3
1.35 F2 F1 3
F2
F2
3
1.80 F2 F1 3
Total number of tests successfully performed = 45
Page 38 of 41
https://mc06.manuscriptcentral.com/cgj-pubs
Canadian Geotechnical Journal
Draft
Table 2.
Dynamic properties of soil under different vibrating conditions
Footing Type Eccentric setting (θ) Resonant frequency,
fmr (rpm)
Natural frequency of
soil, fn (rpm) Damping ratio (%) Soil stiffness, k (MN/m)
F1 16° 2233 2156 18.39 16.92
24° 2081 2011 18.23 14.72
32° 1976 1909 18.28 13.26
F2 16° 2306 2262 13.78 25.98
24° 2177 2124 15.46 22.91
32° 2052 1998 16.17 20.27
Page 39 of 41
https://mc06.manuscriptcentral.com/cgj-pubs
Canadian Geotechnical Journal
Draft
Table 3.
Comparison of present results with Bhoumik (1989)
Parameters Bhoumik (1989) Present Study Footing: concrete block 1m x 0.75m x 0.7m F1: 0.55m x 0.55m x 0.20m F2: 0.65m x 0.65m x 0.20m
Total vibrating mass 1223.0 kg 331.5 kg 463.0 kg
Soil type (IIT Kanpur campus) Silty clay Clayey silt Clayey silt
Eccentric setting (N-sec2) 0.045 0.017 – 0.033 0.017 – 0.033
Test results:
Resonant displacement amplitude 0.127 mm 0.137 mm – 0.275 mm 0.127 mm – 0.222 mm
Resonant frequency (rpm) 2459 2233 - 1976 2306 - 2052
Natural frequency of soil (rpm) 2404 2156 - 1909 2262 - 1998
Damping ratio (Dr) 14.47% 18.30% (avg.) 13.78% - 16.17%
Page 40 of 41
https://mc06.manuscriptcentral.com/cgj-pubs
Canadian Geotechnical Journal
Draft
Table 4.
Maximum transmission ratios
Footing Passive → F1 F2
Active ↓ θ → 16° 24° 32° 16° 24° 32°
(S/B) ↓ Maximum transmission ratio (%)
F1 0.45 49.16 39.33 35.51 44.32 36.52 32.72
0.90 29.16 28.69 26.91 22.46 16.56 15.63
1.35 3.02 2.35 2.00 8.00 6.64 5.90
F2 0.45 25.07 22.27 20.96 19.59 17.18 15.63
0.90 20.48 18.44 17.38 14.43 13.21 12.36
1.35 16.05 13.07 12.65 6.58 7.12 7.10
1.80 6.10 5.90 5.70 Negligible Negligible Negligible
Page 41 of 41
https://mc06.manuscriptcentral.com/cgj-pubs
Canadian Geotechnical Journal

![A Study on RC Columns and Slabs and Restoration of RC ... · PDF fileis used for the design of isolated footing [2]. Isolated RC Rectangular footings were provided for all the columns](https://img.pdfslide.us/doc/110x75/5a78c3be7f8b9a83238c18a6/a-study-on-rc-columns-and-slabs-and-restoration-of-rc-used-for-the-design-of.jpg)