Embed Size (px)
Citation preview

Draft
Origin and evolution of ore-forming fluids, and genesis of
the Duhuangling and Jiusangou gold deposits in eastern Yanbian, northeast China
Journal: Canadian Journal of Earth Sciences
Manuscript ID cjes-2016-0118.R2
Manuscript Type: Article
Date Submitted by the Author: 10-Nov-2016
Complete List of Authors: Zhao, Ke-Qiang; Jilin University
Sun, Jing-Gui; Jilin University, College of Earth Sciences; Li, Liang; Jilin University Men, Lan-Jing; Changchun Institute of Technology Nagao, Keisuke; Korea Polar Research Institute, Division of Polar Earth-System Sciences Chai, Peng; Jilin University
Keyword: ore-forming fluids, genesis of gold deposit, Yanbian, northeast China
https://mc06.manuscriptcentral.com/cjes-pubs
Canadian Journal of Earth Sciences

Draft
1
Origin and evolution of ore-forming fluids, and genesis of the
Duhuangling and Jiusangou gold deposits in eastern Yanbian,
northeast China
Ke-Qiang Zhaoa, Jing-Gui Sun
a,*, Liang Li
a, Lan-Jing Men
b, KEISUKE Nagao
c, and Peng
Chaia
aCollege of Earth Sciences, Jilin University, Changchun 130061, China
bChangchun Institute of Technology, Changchun, China
cLaboratory for Earthquake Chemistry, Graduate School of Science, The University of
Tokyo, Tokyo 7-3-1, Japan
*Corresponding author (S.-J. Gui)
Tel: +86 431 88502278;
Fax: +86 431 88584422
Email: [email protected]
130061, China
Page 1 of 55
https://mc06.manuscriptcentral.com/cjes-pubs
Canadian Journal of Earth Sciences

Draft
2
Abstract
The Duhuangling and Jiusangou gold deposits are located east of the Yanbian
area, NE China. We present the results of systematic studies of the ore geology, fluid
inclusion (FI) features, and isotopic geochemistry of the two gold deposits. Four
mineralization stages have been defined in each gold deposit: pyrite + sericite +
quartz (stage I), quartz + pyrite ± chalcopyrite ± arsenopyrite (stage II), quartz +
native gold + polymetallic sulfide (stage III), and quartz–calcite (stage IV). FIs from
the two gold deposits are similar and contain five types: pure vapor phase (V-type),
vapor-rich phase (RV-type), liquid-rich phase (RL-type), daughter mineral-bearing
polyphase (S-type), and pure liquid phase (L-type) FIs. Stage I FIs homogenize at
temperatures of 350–450 °C, yielding salinities of 5.40–48.67 wt.%. FIs from both
stages II and III samples homogenize at 160–350 °C, yielding salinities of 5.71–39.75
wt.%. FIs in pyrite from the stage II have 3
He/4He ratios of 0.0069–0.0148 Ra and
40Ar/
36Ar ratios of 1302–4433, demonstrating that ore-forming fluids of the two gold
deposits were derived from the crust. The δD values of the two gold deposits range
from −107‰ to −92‰, with δ18
OH2O values of 4.3‰ to 9.0‰, indicating that the
ore-forming fluids were mainly magmatic water in origin. Lead isotope data suggest
that the ore-forming materials were originated from deep crust. Integrated data
indicate that both Duhuangling and Jiusangou gold deposits are medium- to
high-temperature, hydrothermal gold deposits.
Keyword: Ore-forming fluids; genesis of gold deposit; Yanbian; northeast China
Page 2 of 55
https://mc06.manuscriptcentral.com/cjes-pubs
Canadian Journal of Earth Sciences
Draft
3
Introduction
Since the early 20th
century, economic geologists have recognized epithermal
deposits as being important sources of gold (Lindgren 1922). Research and
exploration over the past 20 years have led to the discovery of 11 gold-rich porphyry
copper deposits and 14 epithermal gold deposits in the circum-Pacific region, which
together contain >200 t (>7 million oz) of gold (Sillitoe 1997; Jiang et al. 2004).
These discoveries have led to a great number of significant researches into the
formation of epithermal deposits (e.g., Hedenquist et al. 1994, 1996; Sillitoe 1997;
Cooke et al. 2000; Mao et al. 2003; Deyell et al. 2005; Rye 2005; Jiang et al. 2013).
The Yanbian area, located in the continental margin of eastern China, is part of
the West Pacific porphyry–epithermal gold–copper metallogenic belt and hosts a great
number of ore systems. Since the discovery of the first epithermal gold deposit at
Wufeng in the 1930s (Rui et al. 1995), seven other epithermal gold deposits, two
gold-rich porphyry copper deposits, and lots of epithermal gold occurrences have
been identified in this region, including Jiusangou and Duhuangling (Fig. 1b). In
recent years, several researches have been working on the ore geology, fluid geology
and chronology of the two gold deposits (Fig. 1b; e.g., Han et al. 2013; Chai et al.
2014), but the genesis and genetic models of these two deposits are still in dispute.
Some researchers suggested that the ore-forming fluids of the Duhuangling gold
deposit probably belong to a low- to medium-temperature hydrothermal system (Zhou
et al. 2007; Huai et al. 2007). However, others suggested that was a super-shallow to
Page 3 of 55
https://mc06.manuscriptcentral.com/cjes-pubs
Canadian Journal of Earth Sciences
Draft
4
shallow magmatic–hydrothermal system (Yin et al. 2010) and that the Duhuangling
gold deposit was high-sulfidation epithermal (Han et al. 2013). On the other hand, the
Jiusangou gold deposit was suggested to be hydrothermal, related to volcanic (Rui et
al. 1995) or high-sulfidation epithermal (Men 2011; Han et al. 2013; Chai et al. 2014).
Thus, mechanisms and processes responsible for ore genesis in both deposits remain
controversial.
In this study, we focus on the geology, fluid inclusions, and isotope geochemistry of
the Duhuangling and Jiusangou gold deposits. We discuss the ore genesis, and
evolution of the ore-forming fluids. Our data and results suggest that the geneses of
the two gold deposits are medium- to high-temperature, hydrothermal gold deposits,
which is transitional between high-sulfidation epithermal gold deposit and gold-rich
porphyry copper deposit.
1. Geological background
The Yanbian area is located in eastern Jilin Province. Tectonically, the area is
within the east of the Xing’an–Mongolian orogenic belt (XMOB), and adjacent to the
North China Craton to the south, the Jiamusi Massif to the north, and the Khanka to
the northeast (Fig. 1a). The region has a complex tectono-magmatic history, which
was a result of influences by a series of events involving evolution of the Paleo–Asian
Ocean, construction of the XMOB, and subsequent subduction of the Paleo–Pacific
Plate (Sun et al. 2006). The Yanbian area is dominated by Late Paleozoic marine
volcano–sedimentary sequence, Mesozoic volcanic–sedimentary rocks as well as
Page 4 of 55
https://mc06.manuscriptcentral.com/cjes-pubs
Canadian Journal of Earth Sciences

Draft
5
granitic complex. Both the NE–SW and NW–NE trending faults are dominant with
secondary fault systems trending NNE–SSW, N–S, and E–W (Fig. 1b; Sun et al.
2006). The area contains numerous gold-rich porphyry copper deposits and epithermal
gold deposits (Fig. 1b). Magmatic events associated with this mineralization include
emplacements of the Early Cretaceous granitic magmas, and volcanic and subvolcanic
events at 125–95 Ma (Han et al. 2013; Sun et al. 2013a). The two gold deposits hosted
in granitic, volcanic, and subvolcanic units, and distributed in an N–S trending fault
along the eastern margin of the Wangqing volcanic basin, are the objects of this study
(Fig. 1b).
2. Ore deposit geology
3.1 Duhuangling gold deposit
The Duhuangling gold deposit is located on the eastern side of the volcanic basin,
15 km northwest of Xiaoxinancha, which is a gold-rich porphyry copper deposit.
Intrusions associated with the Duhuangling gold deposit are Early Cretaceous quartz
diorite (118.1 ± 2.2 Ma), granodioritic porphyry (110.1 ± 1.1Ma), biotite granodiorite
(115.9 ± 3.3 Ma), diorite, and subandesite (Fig 1c; Han et al. 2013; Chai et al. 2014).
Several E–W trending faults that control orebodies are developed in the mine. In
addition, there are numerous E–W, NEE–SWW, N–S, and NW–SE trending
secondary faults.
Nineteen orebodies have been identified, including altered rock-type orebody and
crypto-explosive breccia-type orebody, all of which are hosted in the quartz diorite.
Page 5 of 55
https://mc06.manuscriptcentral.com/cjes-pubs
Canadian Journal of Earth Sciences

Draft
6
The gold deposit occurs as altered rock (2# and 3
#; Fig. 1c) and crypto-explosive
breccia (1#; Fig. 1c). The orebody 1
# is the biggest one and is associated with breccia
pipe, which exceed 50.0 m in length and 224.0 m in depth, trends NNE–SSW and dips
at 70-75°, with an average thickness of 11.0 m. The gold-bearing breccia has an
average Au grade of 3.0 g/t. The orebodies 2#
and 3# are both characterized by
gold-bearing sulfide quartz veinlet and crosscut altered granodiorite porphyry. The
orebodies are parallel, trends 330–350° and dips at 65–80°, with Au grade of 3.8–9.4
g/t. At surface, six small orebodies have been identified which are 40.0–100.0 m long
and 0.5–12.0 m wide. These reserves contain 9.7 t of potential gold-bearing resources
(unpublished Duhuangling census report, 2004).
The ores are characterized by euhedral- to subhedral-granular, metasomatic, and
cataclastic textures (Fig. 2f, g), and by massive, brecciated, veinlet-disseminated, and
geode structures (Fig. 2a, b, c, i). The sulfide minerals are mostly pyrite and
chalcopyrite, with minor pyrrhotite, chalcocite, sphalerite, and galena. Gangue
minerals are mainly quartz and sericite, with minor calcite, chlorite, epidote, and clay
mineral. Native gold comprises >90% of gold minerals, and occurs within
intergranular spaces of pyrite (Fig. 2f).
Alteration in the Duhuangling gold deposit includes sericitization, kaolinization,
silicification, carbonatization, propylitization, and K-feldspathization (Fig. 2a, e, d).
Silicification and sericitization are closely related to mineralization.
Four stages of mineralization have been identified in the Duhuangling gold deposit.
Stage I (quartz–sericite–pyrite) consists of milky quartz (Q1), sericite, and yellowish
Page 6 of 55
https://mc06.manuscriptcentral.com/cjes-pubs
Canadian Journal of Earth Sciences

Draft
7
pyrite (Fig. 2b, e), and is the early mineralization stage, free of gold. Stage II
(quartz–chalcopyrite–pyrite) consists of gray quartz (Q2) and golden subhedral- to
anhedral-granular pyrite, with minor chalcopyrite, sphalerite, and gold mineral (Fig.
2a, c). Stage III (quartz–polymetallic sulfide) consists of quartz (Q3), pyrite,
chalcocite, galena, chalcopyrite, sphalerite, and native gold (Fig. 2h). Stage II and
stage III are the main Au deposition stages. Stage IV (quartz–calcite) is characterized
by carbonatization. Calcite-quartz (Q4) veins crosscut all the three early stages (Fig.
2i).
3.2 Jiusangou gold deposit
The Jiusangou gold deposit is located 5 km northwest of the Duhuangling deposit
(Fig. 1b) at the intersection of the NNE–SSW (Fuxing) and NW–SE (Jincang) faults.
The geological units are represented by continental volcanic sequences of the Upper
Cretaceous Jingouling Group and Late Yanshanian diorite, diorite porphyrite(109.3 ±
2.1Ma), quartz diorite, and granite porphyry intrusions (Chai et al. 2012). The E–W
and N–S trending faults, which controlled the orebodies, are developed. The host
rocks are composed of diorite porphyrite, fine-grained diorite, and granite porphyry
(Fig. 1d).
At surface, seven altered rock-type orebodies have been identified, and these
orebodies have a thickness of 4.7-6.2 m, with Au grades of 1.9-9.0 g/t. The biggest
orebody (1#) is 130.0 m long and 40.0 m wide, trends 330-30° and dips at 0-20°, with
an average Au grade of 5.4 g/t. Another large orebody (2#) is slightly smaller than 1
#,
which is 120.0 m long and 55.0 m wide, trends 210-245° and dips at 0-27°, with a
Page 7 of 55
https://mc06.manuscriptcentral.com/cjes-pubs
Canadian Journal of Earth Sciences
Draft
8
higher average Au grade of 6.3 g/t. Liu et al (1999) suggested that it contains at least
5.0 t of gold. Gold occurs in fissures within pyrite and arsenopyrite (Fig. 2f).
The ores generally exhibit euhedral- to subhedral-granular, metasomatic, or
peritectic textures (Fig. 3g, h, i), and have disseminated and cystic structures (Fig. 3c,
e, f). The ore minerals are dominated by pyrite and arsenopyrite (Fig. 3h, i) with
minor amounts of chalcopyrite (Fig. 3g), tennantite, galena, sphalerite, native gold,
and electrum. Gangue minerals are illite, quartz, calcite, tourmaline, and sericite.
Alteration includes silicification, kaolinization, pyritization, and sericitization, with
minor carbonatization, K-feldspathization, and chloritization (Fig. 3a, e, f).
Silicification and sericitization are closely related to mineralization.
Four mineralization stages are distinguished. Stage I (disseminated
quartz–pyrite–sericite) consists of pyrite and quartz, free of gold. It is the early
mineralization stage (Fig. 3b). K-feldspathization (Fig. 3a) is replaced by silicification
and sericitization. Stage II quartz (Q2) is gray and characterized by disseminated and
massive arsenopyrite (Fig. 3c), and silicification and pyritization. Products of this
stage comprise veins, altered rock ores, and minor brecciated rock ores. Stage III
(sulfide–quartz) is characterized by numerous veins that contain pyrite, quartz, and
native gold, with or without galena and chalcopyrite. Stage III veinlets cut through
stage II minerals (Fig. 3e). Sulfides mainly occur as euhedral–subhedral pyrite and
chalcopyrite veins (Fig. 3e). This stage is confined to the quartz-vein ores, which also
exhibit kaolinization and minor chloritization. Stage IV (calcite) is characterized by
carbonate alteration. Veinlets of this stage occur within the vein ores and altered zones.
Page 8 of 55
https://mc06.manuscriptcentral.com/cjes-pubs
Canadian Journal of Earth Sciences

Draft
9
Two types of veinlets are identified: calcite–quartz (Fig. 3e) and pyrite–quartz; its
veins are normally <3 cm in width.
4. Fluid inclusions (FIs)
4.1. Sample and analytical methods
Samples were collected from underground mine workings at depths of 200 m,
250 m, and 300 m within the Duhuangling gold deposit, and from depths of 230 m
and 280 m within the Jiusangou gold deposit. These comprised milky-white quartz,
pyrite–quartz, sulfide-bearing quartz, and calcite–quartz veins (Figs 2, 3). FI
microthermometry was performed using a THMS600 heating–freezing stage (Linkam,
Tadworth, United Kingdom) at the Geological Fluid Lab of Earth Sciences, Jilin
University, China. Analyses involved determining the homogenization temperatures
of FIs within quartz that were trapped during different stages of mineralization. In
total, 194 FIs were analyzed using the procedures and parameters outlined in Zhang et
al. (2013). The obtained temperatures were used to measure in-situ gas compositions
from representative two-phase and polyphase FIs using a LABHR–VIS LabRAM
HR800 Raman spectrometer at the Analytical Laboratory of Beijing Research Institute
of Uranium Geology, China. Analyses using the approaches outlined in Burke (2001)
and Zhang (2013).
4.2. Petrographic characteristics of fluid inclusions
Microscope-based petrographic observations indicated that quartz-hosted FIs from
Page 9 of 55
https://mc06.manuscriptcentral.com/cjes-pubs
Canadian Journal of Earth Sciences

Draft
10
the Duhuangling and Jiusangou gold deposits were generally similar, containing pure
vapor phase (V-type), vapor–liquid two-phase (W-type), daughter mineral-bearing
polyphase (S-type), and pure liquid (L-type) FIs (Fig. 4). Minor pure CO2 (PC-type)
inclusions were also observed in the mineralization stage of the Duhungling gold
deposit, but carbonic-aqueous (CO2–H2O–NaCl; C-type) inclusions did not exist
during freezing and heating. Thus, we focused on the S-type, W-type, L-type, and
V-type FIs in this study. FIs observed from both gold deposits had similar features,
which were described in detail as follows.
(1) V-type: V-type FIs represented ~10% of the total early-stage FI populations in
each gold deposit (Fig. 4a, i). These FIs usually coexisted with W-type and S-type FIs.
They ranged from 8-10 µm and presented elliptical or round shapes. However, minor
irregular shape FIs were also observed.
(2) W-type: W-type FIs were common in samples and could be divided into
vapor-rich FIs (RV-type; V/L >50%) and liquid-rich FIs (RL-type; V/L <50%).
W-type FIs were common in samples, forming nearly 70% of the total population in
each deposit. The RV-type FIs (6–14 µm) were recognized mainly in mineralization
stage I in both gold deposits. It was also observed in minor proportions in
mineralization stage II in the Jiusangou gold deposit. The RL-type FIs were observed
in all mineralization stages in both gold deposits, and had total size ranges of 4–24 µm
(clustered at 8–14 µm). Both the RV- and RL-types FIs were isolated or were
associated with S-type FIs (Fig. 4c, d). Overall, FIs from the Duhuangling gold
deposit were slightly larger than those from Jiusangou.
Page 10 of 55
https://mc06.manuscriptcentral.com/cjes-pubs
Canadian Journal of Earth Sciences
Draft
11
(3) S-type: S-type FIs were mainly observed in stages I, II, and III, and ranged from
6-28 µm (clustered in 8–16 µm). These FIs were isolated or were in association with
W-type FIs. FIs from the Jiusangou gold deposit were slightly larger than those from
Duhuangling. S-type FIs from Jiusangou contained several kind daughter minerals.
Halite (Fig. 4e, f, j) and sylvite (Fig. 4h, k) were common. In addition, transparent
minerals observed in S-type FIs are probable anhydrite (Fig. 4h) and barite (Fig. 4g),
respectively, and an opaque mineral might be chalcopyrite (Fig. 4h). However,
daughter minerals from Duhuangling samples contained halite and sylvite. A
transparent mineral might be sulfate (Fig. 4l).
(4) L-type: L-type FIs were only observed in the late mineralization stage in each
deposit. They were rare, making up only 5% of the inclusion population (by volume)
and were 6–10 µm in size.
4.3. Microthermometry, salinity, and density
The microthermometric data obtained from the Jiusangou and Duhuangling gold
deposits were summarized in Table 1 and Fig. 5. Calculation of salinity for the
water–salt liquid system followed the methods described by Hall (1988) and Bischoff
(1991), and the salinity of S-type FIs was estimated by the final halite melting
temperature (Sterner et al. 1988).
4.3.1. Duhuangling gold deposit
Stage I quartz contained V-type, RV-type, RL-type, and S-type FIs. The analyzed
RV-type and RL-type FIs had final ice-melting temperatures (Tm-ice) of −10.8 °C to
Page 11 of 55
https://mc06.manuscriptcentral.com/cjes-pubs
Canadian Journal of Earth Sciences
Draft
12
−4.0 °C, and −13.2 °C, respectively, corresponding to salinities of 6.44–14.84 wt.%
and 17.19 wt.% (NaCl equivalent). These FIs homogenized at temperatures in the
ranges of 330.0–379.0 °C and 325.5–404.5 °C, respectively, with the RL-type FIs
homogenizing with the disappear of vapor phase and the RV-type FIs homogenizing
into the vapor phase. These inclusions yielded densities of 0.66–0.83 g/cm3.
Homogenization temperatures for the S-type FIs were between 335.0 °C and 420.0 °C,
and the melting temperature of halite (Tm-halite) ranged from 265.4 °C to 411.0 °C.
Halite dissolved earlier than the vapor, although a few other daughter minerals did not
dissolve. Their salinities were 35.68–48.67 wt.% (NaCl equivalent) and their
calculated densities were 1.03–1.08 g/cm3
.
Stage II quartz contained RL-type and S-type FIs, with rare RV-type FIs. The
RL-type FIs had final Tm-ice of −15.1 °C to −5.5 °C, corresponding to salinities of
8.54–18.88 wt.% (NaCl equivalent). They homogenized to the liquid phase at
temperatures of 246.6 °C and 345.8 °C, corresponding to densities of 0.78–0.96 g/cm3.
Tm-halite ranged from 189.0 °C to 325.0 °C, and salinities of 31.34–40.19 wt.% (NaCl
equivalent) were obtained when halite was homogenized to liquid. The majority of
halites dissolved at a higher temperature than vapors. Homogenization temperatures
for the S-type FIs were from 260.0 °C to 325.0 °C, and their calculated densities were
between 1.08 g/cm3 and 1.10 g/cm
3.
Stage III quartz contained abundant RL-type FIs with rare halite-bearing S-type
FIs. The RL-type FIs yielded final Tm-ice of −15.0 to −0.9 °C, and salinities of
1.56–18.79 wt.% (NaCl equivalent). These FIs were homogenized to the liquid phase
Page 12 of 55
https://mc06.manuscriptcentral.com/cjes-pubs
Canadian Journal of Earth Sciences
Draft
13
at temperatures (Th-hot) of 160.6–252.1 °C, and had calculated densities of 0.85–0.98
g/cm3. Only one S-type FI from stage III sample was analyzed, producing Tm-halite of
210.0 °C and yielding a salinity of 32.39 wt.% (NaCl equivalent). The halite
dissolved at a higher temperature than vapors and homogenized to liquid at 210.0 °C.
L-type and RL-type FIs were observed in stage IV samples. The final Tm-ice of the
RL-type FIs ranged from −3.5 °C to −3.3 °C, and their salinities were in the range of
5.40–5.70 wt. % (NaCl equivalent). They were homogenized to liquid at
92.7–154.0 °C and their calculated densities ranged from 0.96 g/cm3 to 1.00 g/cm
3.
4.3.2. Jiusangou gold deposit
Stage I quartz contained V-type, RL-type, and S-type FIs, with rare RV-type FIs.
The RL-type FIs had Tm-ice between −17.2 °C and −10.8 °C, and calculated salinities
of 14.84–20.59 wt.% (NaCl equivalent). These FIs homogenized into the liquid
phase at 343.8 °C-468.5 °C, and the densities were estimated of 0.75 g/cm3 to 0.81
g/cm3. Tm-halite ranged from 179.0 °C to 236.4 °C, and halite homogenized to liquid,
with salinities in the range of 30.88–33.85 wt.% (NaCl equivalent). The S-type FIs
had homogenization temperatures from 433.2 °C to 454.0 °C, yielding densities of
0.90–0.93 g/cm3
. The RV-type FIs had homogenization temperatures of
390.0 °C-470.0 °C, but it was hard to measure Tm-ice as their small sizes.
Stage II quartz was composed of RL-type and S-type FIs, with rare RV-type FIs.
The RL-type FIs had final Tm-ice values of −18.6 °C to −13.5 °C, corresponding to
salinities of 17.47–21.65 wt.% (NaCl equivalent). The homogenization temperatures
to the liquid phase ranged from 249.0 °C to 340.6 °C, which yielded salinities of
Page 13 of 55
https://mc06.manuscriptcentral.com/cjes-pubs
Canadian Journal of Earth Sciences

Draft
14
0.93–0.99 g/cm3. Tm-halite ranged from 215.0 °C to 352.6 °C, with the majority of
halite dissolving at a higher temperature than vapors. However, a few did not dissolve.
These data corresponded to densities of 32.65–42.65 wt.% (NaCl equivalent). The
homogenization temperatures were from 289.0 °C to 328.0 °C for the S-type FIs, and
their calculated densities ranged from 1.05 g/cm3 to 1.09 g/cm
3.
Stage III quartz contained RL-type FIs, with minor S-type FIs. The RL-type FIs
yielded a final Tm-ice of −6.7 °C to −0.3 °C and salinities of 0.52–10.11 wt.% (NaCl
equivalent). These FIs had Th-hot of 168.8–266.8 °C, yielding densities of 0.83–0.89
g/cm3. Their Tm-halite ranged from 173.4 °C to 261.2 °C, and halite homogenized to
liquid. In addition, only one halite dissolved at a lower temperature than vapors and
others yielded salinities of 30.63–35.40 wt.% (NaCl equivalent). The S-type FIs had
homogenization temperatures between 195.0 °C and 241.7 °C, and had calculated
densities of 1.10–1.17 g/cm3.
Due to their small sizes, only L-type and RL-type FIs were observed in stage IV
samples. All the RL-type FIs homogenized at temperatures <150 °C.
4.4. Ore-forming pressure and depth
Ore-forming pressures were calculated from the equation:
P1 = P0 × T1/T0, (1)
where P0 = 219 + 2620 × S and T0 = 374 + 920 × S. P0 is the initial pressure, S is
salinity, P1 is the ore-forming pressures, T1 is the measured temperature, and T0 is the
initial temperature (Shao 1990). We used a pressure gradient of 26.5 MPa/km (Hu
Page 14 of 55
https://mc06.manuscriptcentral.com/cjes-pubs
Canadian Journal of Earth Sciences

Draft
15
2003) to estimate depth of both gold deposits. Using equation (1), FIs from the
Duhuangling gold deposit yielded pressures of 13.07–75.82 MPa and depths of
0.49–2.86 km. Mineralization stages I, II, and III were calculated to be associated
with pressures (and depths) of 32.59–75.82 MPa (1.23–2.86 km), 26.08–55.38 MPa
(0.98–2.10 km), and 14.61–30.74 MPa (0.54–1.16 km), respectively. By contrast, FIs
of the Jiusangou gold deposit yielded pressures and depths of 14.37–73.25 MPa and
0.54–2.76 km, respectively. The first three mineralization stages were calculated to be
associated with pressures (and depths) of 40.93–73.25 MPa (1.54–2.76 km),
33.74–61.49 MPa (1.27–2.32 km), and 14.37–42.80 MPa (0.54–1.61 km), respectively.
It suggested that metallogenesis occurred at depths generally less than 1.5 km. Thus,
both gold deposits were classified to be hypabyssal.
4.5. Laser Raman spectroscopy
Laser Raman spectroscopy reveals that the Duhuangling and Jiusangou gold
deposits have similar gas compositions. Early-stage V-type FIs were mainly CO2 (Fig.
7b) with traces of N2 (Fig. 7a), and W-type FIs were mainly H2O with minor CO2 (Fig.
7f). In the main mineralization stage, W-type FIs were mainly H2O (Fig. 7e) with
minor CO2, and trace amounts of CH4 and N2 (Fig. 7c).
5. Isotopic characteristics of FIs
5.1. Hydrogen–oxygen isotopic compositions
5.1.1. Samples and analytical methods
Page 15 of 55
https://mc06.manuscriptcentral.com/cjes-pubs
Canadian Journal of Earth Sciences

Draft
16
The main mineralization stage samples for hydrogen and oxygen isotope analyses
were collected from 250 m and 300 m depth within the Duhuangling gold deposit.
Analyses were performed on a MAT 252 gas mass spectrometer at the Stable Isotope
Geochemistry Lab, Institute of Geology and Geophysics, Chinese Academy of
Sciences, Beijing, China, using the analytical approaches outlined by Chen (2008).
Values of δ18
O in quartz and δD in FIs were calibrated according to Vienna Standard
Mean Ocean Water (V-SMOW) standards, with analytical precisions of ±0.2‰ for
δ18
O and ±2.0‰ for δD. The results of analyses on samples and standards are
presented in Table 2, along with similar sample data reported in previous studies.
5.1.2. Results
Samples from the Duhuangling gold deposit have values of δ18
OH2O in quartz of
4.3–5.1‰, and values of δDV-SMOW for FIs of −104‰ to −107‰. By contrast, samples
from the Jiusangou gold deposit have values of δ18
OH2O in quartz of 7.3‰ and 9.0‰,
and values of δDV-SMOW for FIs of –92‰ and –104‰ (Table 2). All of these results are
similar to typical values for magmatic fluids (δ18
OH2O = 5.5–9.5‰ and δDV-SMOW =
−40‰ to −80‰; Sheppard 1986). These data plotted in the lower part of magmatic
water on an H–O isotope diagram (Fig. 8), which suggests that the ore-forming fluids
consist predominantly of magmatic water with minor meteoric water.
5.2. Noble gas isotopes
5.2.1. Samples and analytical methods
Subhedral–anhedral stage II pyrite samples were collected from depths of 300 m
Page 16 of 55
https://mc06.manuscriptcentral.com/cjes-pubs
Canadian Journal of Earth Sciences

Draft
17
within the Duhuangling gold deposit and 280 m within the Jiusangou gold deposit.
Samples selected for crushing and analysis lacked multistage FIs, according to the
recommendations of Hu et al. (1998) and Burenaed et al. (1999, 2016). In addition, a
series of 1–2 g aliquots of 100% purity were created from FI-hosting minerals that
had similar structures and isotropic optical properties, and were used to represent the
specific stages of mineralization present within each deposit. Four single pyrite
samples were selected for analysis (Table 3) using a VG5400 mass spectrometer
(MS-III) in the Geochemistry Laboratory of the Faculty of Science, Tokyo University,
Japan. Gases were captured by crushing samples and were subsequently cooled for
noble gas separation by using the techniques outlined in Nagao et al. (1996) and
Sumino et al. (2001). Analytical precision was better than 5% (1σ).
5.2.2. Results
The results of isotopic analysis were given in Table 3. Values for 4He,
20Ne,
40Ar,
84Ke, and
132Xe plot along a normal distribution on a variation diagram (Fig. 9a),
indicating that the analyzed FIs did not lose noble gases after being trapped. In
addition, these inclusions had 3He/
4He (R) values of 0.007–0.015 Ra, where Ra is the
atmospheric value of 1.4 × 10⁻⁶
. The typical crustal He signature (R value) was
0.01–0.05 Ra (Tolstikhin 1978; O’Nions and Oxburgh 1988). In addition, these
inclusions had F(4He) values between 17,561 and 125,131, indicating an abundance of
atmospheric He within this section of the crust during mineralization. The F(4He)
values of sulfide samples from the Duhuangling and Jiusangou gold deposits were
more than 15,000 times that of the atmosphere (Table 3), indicating a concentration of
Page 17 of 55
https://mc06.manuscriptcentral.com/cjes-pubs
Canadian Journal of Earth Sciences

Draft
18
4He that was >15,000 times greater than that present in the atmosphere. In addition,
the amount of air-saturated water (F(4He) = 0.18–0.28) within these samples
was >45,000 times that of the atmospheric value, indicating that these samples
contained negligible atmospheric He and that none was added to the inclusions after
entrapment.
Samples from both deposits had F(84
Kr) and F(132
Xe) values of 1.26–1.53 and
3.51–5.78, respectively, which indicated that elemental fractionation did not occur
after entrapment. This result was supported by correlation between the FXe and FKr
values [Fx = (X/36
Ar)sample/(X/36
Ar)air, where (132
Xe/36
Ar)air = 0.75 × 10⁻³
and
(84
Kr/36
Ar)air = 0.0207], although the fractionation factors in this system were
somewhat lower at FKr<4 and FXe<16 (Kendrick et al. 2001).
Samples from both deposits had similar 3He/
4He,
20Ne/
22Ne,
21Ne/
22Ne,
38Ar/
36Ar,
and 40
Ar/36
Ar ratios (Table 3). The measured 3He/
4He ratios 0.0096–0.0206 were
significantly lower than those expected for the upper mantle (3He/
4He = 6–9 Ra) and
the atmosphere (3He/
4He = 1 Ra; Allegre et al. 1987; Patterson et al. 1994; Sun et al.
2006), but were close to those of fluids in continental crust (Stuart et al. 1995). The
measured 20
Ne/22
Ne (9.817–9.960) and 21
Ne/22
Ne (0.0290–0.0295) ratios in both
deposits were similar to the atmospheric values of 20
Ne/22
Ne (9.800) and 21
Ne/22
Ne
(0.0290), but were somewhat different from the values expected for mantle-derived
fluids (20
Ne/22
Ne = 9.8–13.2 and 21
Ne/22
Ne = 0.580–0.680). In addition, measured
38Ar/
36Ar ratios 0.18962–0.19270 were consistent with those expected for
air-saturated water (0.188), although the measured 40
Ar/36
Ar ratios 1302.4–4433.6
Page 18 of 55
https://mc06.manuscriptcentral.com/cjes-pubs
Canadian Journal of Earth Sciences
Draft
19
from both gold deposits were slightly higher than those expected for air-saturated
water (295.5, Burnard et al, 1999; Sun et al, 2006) and fluids in continental crust.
However, they were significantly lower than that for the mantle (>40,000; Fig. 9b).
All of these data plotted along crustal, cosmogenic Ne, and nuclear fission
evolution lines on a 21
Ne/22
Ne–20
Ne/22
Ne diagram (Fig. 9b). These samples also
plotted to the right of the cut-off line in the field defining the lower crust on a
3He/
4He–
4He diagram, indicating that the FIs contained higher levels of radiogenic
4He than that typically found in crust fluids (Fig. 10a; Gautheron et al. 2005). They
also plotted within the crust fluid field, albeit with enriched 40
Ar values, in a
3He/
4He–
40Ar/
36Ar diagram (Fig. 10b), suggesting that the ore-forming fluids of the
two gold deposits derived from the crust.
5.3. Lead isotopic compositions
5.3.1. Samples and analytical procedures
The separation and analytical techniques used to determine lead isotopic
compositions in this study were similar to those used during the noble gas isotopic
analysis described above, using a MAT-261 mass spectrometer housed at the
Analytical Laboratory of Beijing Research Institute of Uranium Geology, Beijing,
China. Two-sigma variations were 0.05%, 0.09%, and 0.30% for 206
Pb/204
Pb,
207Pb/
204Pb, and
208Pb/
204Pb, respectively. The analytical precision of the lead isotope
was better than ±0.09‰. All results were given in Table 4.
5.3.2. Results
Page 19 of 55
https://mc06.manuscriptcentral.com/cjes-pubs
Canadian Journal of Earth Sciences
Draft
20
The measured 206
Pb/204
Pb, 207
Pb/204
Pb, and 208
Pb/204
Pb ratios in pyrite from the
Duhuangling gold deposit were 18.3072–18.3244, 15.5208–15.5328, and
38.1055–38.1419, respectively, whereas those from pyrite in the Jiusangou gold
deposit were 18.2955–18.3513, 15.5322–15.5441, and 38.1325–38.1715, respectively
(Table 4). When plotted on the 206
Pb/204
Pb–207
Pb/204
Pb and 206
Pb/204
Pb–208
Pb/204
Pb
diagrams, data points for these lead isotope compositions fell in the lower-crustal
source region field along the orogenic evolution line (Fig. 11a, b). It implied that the
ore-forming materials might have originated from deep-seated resources related to a
lower crust.
6. Discussion
6.1. Origin of ore-forming fluids
A number of recent systematic investigations have been performed on the origin of
ore-forming fluids in epithermal gold deposits associated with felsic magmatism (e.g.,
Hedenquist 1987, 1996; Corbett 2002; Carrillo et al. 2003; Sillitoe 2010). Epithermal
gold deposit is commonly closely associated with porphyry deposit in space and in
time, and they shares similar ore-forming fluid characteristics. Many geologists
suggested that ore-forming fluids in both cases had the same origin, or else that the
ore-forming fluids of the epithermal gold deposit was evolved from porphyry deposit
system (Eaton et al. 1993; Corbett 2002). The Duhuangling and Jiusangou gold
deposits, together with the Xiaoxinancha gold-rich porphyry copper deposit, are all
located in the same metallogenic belt in the Yanbian area (Han et al. 2013), and have
Page 20 of 55
https://mc06.manuscriptcentral.com/cjes-pubs
Canadian Journal of Earth Sciences
Draft
21
similar ore geology features (Table 5), fluid inclusion features, ages of metallogeny,
and stable isotope signatures. Nonetheless, origin of the fluids that formed the
Duhuangling and Jiusangou gold deposits is uncertain: they could have been products
of the immiscibility of deep-seated gold-bearing fluids; they could represent
ore-forming fluids that had evolved from the Xiaoxinancha gold-rich porphyry copper
deposit; or alternatively they may have been exsolved during unrelated magmatism.
The measured homogenization temperatures of FIs entrapped during the early stage
of the Duhuangling and Jiusangou ore formation are essentially similar to those from
the Xiaoxinancha deposit reported by Men (2011). In addition, quartz samples from
main stages of the two gold deposits, together with that quartz from early stage of the
Jiusangou gold deposit, have similar H–O isotopic compositions to those from
Xiaoxinancha (Fig. 8). These evidences indicate that it is impossible that the
ore-forming fluids of the Duhuangling and Jiusangou gold deposits evolved from that
of Xiaoxinancha. Homologous fluids should have formed only from ore-bearing fluid
immiscibility prior to unloading of its metallogenic elements.
The 3He/
4He and
40Ar/
36Ar ratios of FIs from the Xiaoxinancha deposit are
0.08–4.45 Ra, and 306–430, which indicates that the initial ore-forming fluids were
produced by partial melting of crust material containing a mantle component (Sun et
al. 2008). However, the ore-forming fluids of the Jiusangou and Duhuangling gold
deposits are riched in radioactive 21
Ne, 4
He, and 40
Ar, all of which are typical
components of crust fluids (Figs. 9, 10). In addition, these samples plotted in the crust
region on the 3He/
4He–
4He/
20Ne diagram, which was close to granitic source,
Page 21 of 55
https://mc06.manuscriptcentral.com/cjes-pubs
Canadian Journal of Earth Sciences

Draft
22
additional evidences of derivation from crust or granite-related magmatic fluids (Fig.
12).
The Jiusangou and Duhuangling gold deposits and the Xiaoxinancha gold-rich
porphyry copper deposit are in the same metallogenic belt, having similar
metallogenetic ages, fluid inclusions, and H–O isotopes showing a feature of
magmatic water. However, the ore-forming fluids of the two gold deposits do not
contain mantle component and are derived from an exsolution process of crustal
magmatic water, with enrichments of 40
Ar, 36
Xe, and 4He (Candela 1997; Harris et al.
2004). Thus, we suggest that the ore-forming fluids of the two gold deposits are
magmatic water derived from crust.
6.2. Ore-forming fluid evolution
Four mineralization stages have been classified in the Duhuangling and Jiusangou
gold deposits. Quartz crystals from the early-stage contain RV-, RL-, and S-type FIs.
The FIs in early-stage samples indicated that the initial ore-forming fluids are
high-temperature (mainly 350–470°C) and high salinity (15-50 wt.%; Fig. 6), which
are similar to those of porphyry deposit (Hedenquist et al. 1994; Sillitoe 1997, 2010;
Li et al. 2006). These features indicate that the initial ore-forming fluid belongs to a
H2O–NaCl ± CO2 system. Subsequently, the fluids evolved into low- to
medium-temperature (160–350 °C), with various salinities during main stages,
showing a heterogeneous thermal condition (Shepherd et al., 1985). FI data plotted on
a homogenization temperature versus salinity diagram (Fig. 6) show that the early
Page 22 of 55
https://mc06.manuscriptcentral.com/cjes-pubs
Canadian Journal of Earth Sciences
Draft
23
stage fluids are medium- to high-salinity, and that low-salinity and high-salinity FIs
coexisted during the main stages. Furthermore, the coexistence within the same
sample of RL and RV type FIs show a similar range of homogenization temperatures
and opposite modes of homogenization (i.e., V→L vs. L→V). This indicates that
these ore-forming fluids are immiscible in the main stages, which is an important
mechanism resulting in ore-metal deposition of hydrothermal system (Roedder 1984;
Shepherd et al. 1985; Davidson 2001; Hagemann and Lüders, 2003). Laser Raman
spectroscopy data reveal that the ore-forming fluids of the two deposits contained CO2
and minor small-size pure CO2 (PC-type) FIs were observed in the mineralization
stage of the Duhungling gold deposit. However, there was no independent CO2 phase
in these FI samples during freezing and heating, indicating that the CO2 content was
rare. Thus, the ore-forming fluids should belong to a NaCl-H2O system. The C-type
FIs may be trapped during fluid immiscibility in the main mineralization stage at low-
to medium-temperature (160–350 °C). FIs trapped during the last mineralization
stages have low salinities (<6.0 wt.%) and temperatures (<150 °C), indicating that
the ore-forming fluids experienced cooling and diluting.
6.3. Ore genesis
Previous studies have proposed a variety of processes responsible for genesis of the
Duhuangling gold deposit including: (1) low- to medium-temperature hydrothermally
altered rock type (Huai et al. 2007; Zhou et al. 2007), (2) shallow to super-shallow
magmatic–hydrothermal type (Yin et al. 2010), and (3) high-sulfidation epithermal
Page 23 of 55
https://mc06.manuscriptcentral.com/cjes-pubs
Canadian Journal of Earth Sciences

Draft
24
type (Han et al. 2013; Chai et al. 2014). Additionally, the Jiusangou deposit has been
reported to be either a volcanic hydrothermal or epithermal type (Rui et al. 1995) or a
high-sulfidation epithermal type (Men 2011; Han et al. 2013), although it is now
generally accepted that both deposits are high-sulfidation epithermal gold types
related to volcanic–subvolcanic magmatism. However, these various processes, which
are based on the characteristics of ore deposit geology, do not provide satisfactory
explanations of the nature of the deposit.
The ore geology features of the Duhuangling and Jiusangou gold deposits also
indicate that the mineralization occur within Early Cretaceous granitic complex,
comprising of quartz diorite and granodiorite in both mines, with additional
granodiorite porphyry in Duhuangling, and diorite porphyrite and diorite in Jiusangou.
Both deposits are associated with subvolcanic rocks and their main orebody types are
altered rock and crypto-explosive breccias. Moreover, ore minerals are pyrite and
arsenopyrite, with minor chalcopyrite, sphalerite, and native gold and alteraltion
consisted of sericitization, silicification, and kaolinization (Table 5). All of these ore
geology characteristics are similar to typical high-sulfidation epithermal gold deposits
associated with volcanic–subvolcanic magmatism described worldwide (Hedenquist
and Lowenstern 1994; Arribas et al. 1995; Ruggieri et al. 1997).
However, features of the FIs present in both deposits suggest that the two gold
deposits are characteristic of both high-sulfidation epithermal gold deposit and
porphyry deposit. FI homogenization temperatures from the stages II and III were
160–350 °C and 170–340 °C, with salinities of 1.56–41.95 wt.% and 0.52–40.19 wt.%
Page 24 of 55
https://mc06.manuscriptcentral.com/cjes-pubs
Canadian Journal of Earth Sciences

Draft
25
(NaCl equivalent), respectively. Calculated depths of ore formation are less than 1.5
km. H–O isotopic composition of the ore-forming fluids is also similar to those of
porphyry deposit (Fig. 8). Nonetheless, the crypto-explosive breccia orebody
associtated with K-feldspathization and carbonatization is a typical feature of
porphyry deposit (Table 5). In high-sulfidation deposits, the ore is typically closely
associated with, or lies within, the zone of most acidic alteration (White and
Hedenquist 1995). Integrating all data, we conclude that both gold deposits are a
transitional type between a high-sulfidation epithermal gold deposit and a gold-rich
porphyry deposit. Thus, we consider both as medium- to high-temperature,
hydrothermal gold deposits.
6.4 A metallogenic model
The Yanbian area contains abundant gold-rich porphyry copper and epithermal
gold–copper or gold deposits (Sun et al. 2006). The area is located in the eastern part
of the XMOB, and is highly predicted an excellent metallogenic background and
condition for epithermal gold deposit (Han et al. 2013; Sun et al. 2013b). As the two
most significant gold mineralizing events that both gold deposits are a transitional
type between a high-sulfidation epithermal gold deposit and a gold-rich porphyry
deposit in this region.
We propose a new metallogenic model for the genesis of the two gold deposits. A
partial melting of lower crust occur in an active continental margin setting relate to
the subduction of the Paleo-Pacific Plate in early Cretaceous (110-105 Ma, Chai et al.
2014), forming felsic magmas (Chai et al. 2014), which filled lower crust magmatic
Page 25 of 55
https://mc06.manuscriptcentral.com/cjes-pubs
Canadian Journal of Earth Sciences

Draft
26
chambers. Then crystallization and differentiation of this magma formed the quartz
diorite, granodiorite porphyry, and granite porphyry phases that then fluid
immiscibility generated the early stage high-temperature and high-salinity
ore-forming fluids. The fluids from deep source migrated upwards along the shear
zone and faults, with rapid decreasing of temperature and pressure. The fluids
experienced fluid immiscibility again. The heterogeneous fluids caused large amounts
of sulfide precipitation with gold, resulting in altered rock-type orebody. Then rapid
decreasing pressure formed crypto-explosive breccia-type orebody at a shallow level.
In addition, a close temporal–spatial relationship between epithermal gold–copper
and gold-rich porphyry copper deposits was revealed (Corbett 2002; Heinrich 2003).
We propose that a gold-rich porphyry copper orebodies may be existed at deep levels,
and the data presented here may be useful in future exploration targeting.
7. Conclusions
1. Isotope geochemistry of samples from the Duhuangling and Jiusangou gold
deposits suggest that the ore-forming fluids of two gold deposits are magmatic water
derived from crust.
2. Their geological characteristics, fluid inclusion data, and isotope data indicate
that both deposits are medium- to high-temperature, hydrothermal gold deposits.
3. The early stages of mineralization occurred because of strong fluid immiscibility
prior to these fluids having metasomatically interacted with the host rocks to deposit
gold and other ore minerals. This interpretation agrees with the penetration of
Page 26 of 55
https://mc06.manuscriptcentral.com/cjes-pubs
Canadian Journal of Earth Sciences

Draft
27
hydrothermal fluids into the host rocks, which formed crypto-explosive breccia-type
orebodies, altered rock-type orebodies, and gold-bearing sulfide–quartz veinlets.
Acknowledgements
We sincerely appreciate the generous help provided by Prof. I. Kaneoka, Dr. A.
Shimizu, and Dr. N. Ebisawa (Laboratory for Earthquake Chemistry, Graduate School
of Science, University of Tokyo) with the fluid-inclusion noble gas experiments. We
are obliged to two reviewers for their critical reviews and good suggestions. This
work was funded by the National Natural Science Foundation of China (Grant
Numbers 40772052 and 41172072), the major project for the National Natural
Science Foundation of China (Grant No. 41390444), the Project for Scientific and
Technology Development (Grant No. 20100450), the Science Research Foundation of
Province ((Grant No. 120160038).
Reference
Allegre, C.J., Staudacher, T., and Sarda, P. 1987. Rare gas systematics: formation of
the atmosphere, evolution and structure of the Earth's mantle. Earth & Planetary
Science Letters, 81: 127–150.
Arribas, A.J. 1995. Characteristics of high sulfidation epithermal, and their relation to
magmatic fluid. Mineralogical Association of Canada Short Course, 23:
419–454.
Ballentine, C.J., Burgess, R., and Marty, B. 2002. Tracing fluid origin, transport and
Page 27 of 55
https://mc06.manuscriptcentral.com/cjes-pubs
Canadian Journal of Earth Sciences

Draft
28
interaction in the crust. Reviews in Mineralogy and Geochemistry, 47: 539-614.
Bischoff, J.L. 1991. Densities of liquids and vapors in boiling NaCl-H2O solutions: A
PVTX summary from 300℃ to 500℃. American Journal of Science, 291:
309–338.
Bodnar, R.J., Vityk, M.O. 1994. Interpretation of microthermometric data for
H2O-NaCl fluid inclusions. In De Vivo B, Frezzotti ML.(Eds) Fluid Inclusions
in Minerals: Methods, Applications. Blacksburg, VA, Virginia Polytechnic
Institute, State University, 117-130p.
Burenaed, P.G., Hu, R.Z., and Turner, G. 1999. Mantle, crustal and atmospheric noble
gases in Ailaoshan Gold deposits, Yunnan Province,China. Geochim Cosmochim
Acta, 63: 1595–1604.
Burnard, P. G. 2016. The Noble Gases as Geochemical Tracers. Springer, pp1-391.
Burke, E.A.J. 2001. Raman microspectrometry of fluid inclusions. J. Lithos, 55:
139–158.
Candela, P.A. 1997. A review of shallow, ore-related granites: Textures, volatiles, and
ore metals. Journal of Petrology, 38: 1619–1633.
Carrillo, R.F.J., Morales, R.S., and Boyce, A.J., and Fallick, A.E. 2003. High and
intermediate sulphidation environment in the same hydrothermal deposit: The
example of Au-Cu Palai -Islica deposit, Carboneras (Almería). Eliopoulos, et al.
Proceedings of the Seventh Biennial SGA Meeting —Mineral Exploration and
Sustainable Development. Rotterdam: Millpress Science Publishers, 445–448.
Chai, P., Sun, J.G., Xing, S.W., Men, L.J., and Han, J.L. 2014. Early Cretaceous arc
Page 28 of 55
https://mc06.manuscriptcentral.com/cjes-pubs
Canadian Journal of Earth Sciences

Draft
29
magmatism and high-sulphidation epithermal porphyry Cu–Au mineralization in
Yanbian area, Northeast China: the Duhuangling example. International Geology
Review, 57: 1267–1293.
Chen, L., Sun J.G., Zhao J.K., Men L.J., Liang S.N., Chen D., and Pang W. 2008.
Characteristics of Fluid Inclusions and Genetic Model of Wufeng-Wuxingshan
Gold (Silver) Deposit, Yanbian. Journal of Jilin University( Earth Science
Edition), 38: 567–575. (in Chinese with English abstract).
Chiaradia, M., and Fontboté, L. 2003. Separate lead isotope analyses of leachate and
residue rock fractions: implications for metal source tracing in ore deposit studies.
Mineralium Deposita, 38: 185–195.
Cooke, D.R. and Simmons, S.F. 2000, Characteristics and genesis of epithermal gold
deposits. Reviews in Economic Geology, 13: 221–244.
Corbett G. 2002. Epithermal gold for explorationists. A IG Journal-Applied
Geoscientific Practice and Research in Australia, 1–26.
Davidson P. 2001. Immiscibility and continuous felsic melt-fluid evolution within the
Rio Blanco porphyry system, Chile: Evidence from inclusions in magmatic
quartz. Economic Geology, 96(8):1921-1929.
Deyell, C.L and Dipple, G.M. 2005. Equilibrium mineral -fluid calculations and their
application to the solid solution between alunite and natroalunite in the
EIIndio-Pascua belt of Chile and Grgent ina1. Chemical Geology, 215: 219–234.
Eaton, P.C., and Setterfield, T.N., 1993. The relationship between epithermal and
porphyry hydrothermal systems within the tavua caldera, fiji. Economic Geology,
Page 29 of 55
https://mc06.manuscriptcentral.com/cjes-pubs
Canadian Journal of Earth Sciences
Draft
30
88(5), 1053-1083.
Gautheron, C., Moreira, M., and Allegre, C. 2005. He, Ne and Ar composition of the
European lithospheric mantle. Chemical Geology, 217: 97–112.
Hall, D.L., and Sterner, S.M. 1988. Freezing point depression of NaCl-KCl-H2O
solution. Economic Geology, 83: 197–202.
Han, S.J., Sun, J.G., Bai, L.A. Xing, S.W., Chai, P., and Zhang, Y. 2013. Geology and
ages of porphyry and medium-to high-sulphidation epithermal gold deposits of
the continental margin of Northeast China. International Geology Review, 55:
287–310.
Harris, A.C., Kamenetsky, V.S., White, N.C. and Steele, D.A. 2004. Volatile phase
separation in silicic magmas at Bajodela Alumbrera porphyry Cu-Au deposit,
NW Argentina. Resourse Geology, 54: 341–356.
Hedenquist, J.W., Gakkai, S.C., and White, N.C. 1996. Epithermal gold deposits:
Styles, characteristics, and exploration. Society of Resource Geology. Special
Publication Number, 1: 1–14.
Hedenquist, J.W., and Lowenstern, J.B. 1994. The role of magmas in the formation of
hydrothermal ore deposits Freezing point depression of NaCl-KCl-H2O solution.
Nature, 370: 519–527.
Hedenquist, J.W. 1987. Mineralization associated with volcanic-related hydrothermal
systems in the circum-Pacific Basin. Transactions of fourth circum-pacific
energy and mineral resources conferences. 513–524p.
Heinrich, C.A., Gunther, D., Audetat, A., Ulrich, T., and Frischknecht, R. 1999. Metal
Page 30 of 55
https://mc06.manuscriptcentral.com/cjes-pubs
Canadian Journal of Earth Sciences

Draft
31
fractionation between magmatic brine and vapor, determined by microanalysis of
fluid inclusions. Geology, 27: 755–758.
Heinrich, C.A., Ryan, C.G., Mernagh, T.P., and Eadington, P.J. 1992. Segregation of
ore metal between magmatic brine and vapor - A fluid inclusion study using
PIXE microanalysis. Economic Geology and the Bulletin of the Society of
Economic Geologists, 87: 1566–1583.
Heinrich, C.A. 2005. The physical and chemical evolution of low-salinity magmatic
fluids at the porphyry to epithermal transition: a thermodynamic study[J].
Mineralium Deposita, 39(8): 864-889.
Hu, B.Q., Wang, Z.F., Sun, Z.X., Liu, C.D., and Bai, L.H. 2003. Pressure gradient in
the lithosphere, Earth Science Frontiers, 10: 129–133.
Hu, R., Burnard, R.Z., Burnard, P.G., and Turner, G. 1998. Helium and argon isotope
systematics in fluid inclusions of Machangqing copper deposit in west Yunnan
Province, China Chemical Geology. 146: 55–63.
Huai B.F., Wang X.Y., Song F.F., and Liang H.J. 2007. Geological characteristics and
metallogenic regularity analysis of Duhuangling gold deposit in Jilin. Gold
Science and Technology, 15: 19–23.
Jiang, S.H., Nie, F.J., Zhang, Y., and Hu, P. 2004. The latest advances in the research
of epithermal deposits. Earth Science Frontiers, 11: 401–411. (in Chinese with
English abstract)
Jiang, S.H., 2013. Geodynamic setting of the Zijinshan porphyry–epithermal
Cu–Au–Mo–Ag ore system, SW Fujian Province, China: Constrains from the
Page 31 of 55
https://mc06.manuscriptcentral.com/cjes-pubs
Canadian Journal of Earth Sciences

Draft
32
geochronology and geochemistry of the igneous rocks. Ore Geology Reviews, 53:
287–395.
Kendrick, M.A., Burgess,R., Pattrick, R.A., and Turner. 2001. Fluid inclusion noble
gas and halogen evidence on the origin of Cu-porphyry mineralizing fluids.
Geochimica Cosmochimica Acta, 65: 2651–2668.
Li, J., Qin, K.Z., Li, G. 2006. Basic characteristics of gold-rich porphyry copper
deposits and their ore sources and evolving processes of high oxidation magma
and ore-forming fluid. Acta Petrologica Sinica, 22(3):678-688. (in Chinese with
English abstract)
Lindgren, W. 1922. A suggestion for a terminology of certain mineral deposits.
Economic Geology, 17: 292–294.
Liu, B., Ma, Q.B., 1999. The geological characteristics of Jiushisangou gold deposit.
Journal of Precious Metallic Geology, 3:136-146. (in Chinese with English
abstract)
Mao J.W., Li X.F., Zhang Z.H. Wang, Y.T., and Hou-Min, L.I. 2003. Geology,
distribution, types and tectonic settings of Mesozoic epithermal gold deposits in
East China. Geological Journal of China Universities, 9: 620–637. (in Chinese
with English abstract)
Matsuda, J., Matsumoto, T., Sumino, H., Nagao, K., Yamamoto, J., and Miura, Y.
2002. The 3He/
4He ratio of the new internal he standard of japan. Geochemical
Journal, 36(2): 191-195.
Men L.J. 2011. An ore-forming fluid study on Late Mesozoic epithermal Au-Cu
Page 32 of 55
https://mc06.manuscriptcentral.com/cjes-pubs
Canadian Journal of Earth Sciences

Draft
33
deposits in Yanbian-Dongning area: implication for the metallogenic mechanism.
Ph.D. Thesis, Jilin University, Changchun, 125p. (in Chinese with English
abstract)
Meng Q.L., Zhou Y.C., and Chai, S.L. 2001. The porphyry and hydrothermal lode
gold and copper deposits in Eastern Yanbian region of China. Changchun: Jilin
Science and Technology Press, 162p.
Nagao, K., Ogata, N., and Matsubayashi, O. 1996. Ar isotope analysis for K-Ar dating
using tow modified-VG5400 mass spectrometers–Ⅰ: isotope dilution method.
The Mass Spectrometry Society of Japan, 44: 39–61.
O’Nions, R.K., and Tolstikhin, I.N. 1994. Behaviour and residence times of lithophile
and rare gas tracers in the upper mantle. Earth Planetary Science Letters, 124:
131–138.
O’Nions, R.K. and Oxburgh, E.R. 1988. Helium, volatile fluxes and the development
of continental crust. Earth Planetary Science Letters, 90: 331–347.
Patterson, D.B., Honda, M., and McDougall, I. 1994. Noble gases in mafic
phenocrysts and xenoliths from New Zealand. Geochimica Cosmochimica Acta,
58: 4411–4428.
Roedder, E. 1984. Fliud inclusion:reviews in mineralogy. Mineralogical Society of
America, 12: 644.
Ruggieri, G., Lattoazi, P., Luxoro, S., Luxoro, S.S., Dessi, R., Benvenuti, M., and
Tanelli, G. 1997. Geology, mineralogy, and fluid inclusion data of the furtei
high-sulfidation gold deposit, sardinia, italy. Economic Geology, 92(1): 1-19.
Page 33 of 55
https://mc06.manuscriptcentral.com/cjes-pubs
Canadian Journal of Earth Sciences

Draft
34
Rui, Z.Y., Zhang, H.T., Wang, L.S., and Chen, R.Y. 1995. The multiple metallogenic
model of the porphyry–epithermal copper–gold deposits in Eastern Jilin and
Heilongjiang. Mineral Deposits, 14: 174–184. (in Chinese with English abstract)
Rye, R.O. 2005. A review of the stable-isotope geochemistry of sulfate minerals in
selected igneous environments and related hydrothermal systems Chemical
Geology, 215: 5–36.
Schlosser, P. and Winckler, G., 2002. Noble gases in ocean water and sediments.
Reviews in Mineralogy & Geochemistry, 47.
Shao, J.L. 1990. Prespespecting Mineralogy of Gold Deposit. Wuhan, China
University of Geosciences Press, 150p.
Shao, J.A., and Tang, K.D. 1995. Terranes in Northeast China and evolution of
Northeast Asia continental margin: Beijing, Earthquake Press, p. 1–185. (in
Chinese with English abstract)
Shepherd, T.J., Rankin, A.H., Alderton, D.H.M., 1985. A Practical Guide to Fluid
Inclusion Studies. Blackie & Son Limited, Glasgow & London, pp. 1–154.
Sheppard, S.M.F. 1986. Characterization and isotope variation in nature water. Stable
isotopes in high temperatre geological process. Reviews in Mineralogy and
geochemistry, 16: 165–183.
Sillitoe, R.H. 1997. Characteristics and controls of the largest porphyry copper-gold
and epithermal gold deposits in the Circum-Pacific Region. Australian Journal of
Earth Science, 44: 373–388.
Sillitoe, R.H. 2000. Gold-rich deposits: Descriptive and their role in exploration and
Page 34 of 55
https://mc06.manuscriptcentral.com/cjes-pubs
Canadian Journal of Earth Sciences

Draft
35
discovery. Reviews in Economic Geology, 13: 315–345.
Stephan, M.K., Henley, R.W., and Christoph, H.A. 1995. Gold preciptation by fluid
mixing in bedding-parallel fractures near carbonaceoµs slates at the
Cosmopolitan How gold deposit, Northern Australia. Economic Geology and the
Bulletin of the Society of Economic Geologists, 90: 2123–2139.
Sterner, S.M., Hall, D.L., Bodnar, R.J. 1988. Synthetic fluid inclusions. V. Solubility
relations in the system NaCl-KCl-H2O under vapor-saturated conditions.
Geochimica et Cosmochimica Acta, 52(5): 989-1005.
Stuart, F.M., Burnard, P.G., Taylor, R.P. and Turner, G. 1995. Resolving mantle and
crustal contributions to ancient hydrothermal fluids: He-Ar isotopes in fluid
inclusions from Dae Hwa W-Mo mineralisation, south Korea. Geochimica
Cosmochimica Acta, 59: 4663–4673.
Sumino, H., Nagao, K., and Notsu, K. 2001. Highly sensitive and precise
measurement helium isotopes using a mass spectrometer with double collector
system. Mass spectroscopy, 49: 61–68.
Sun, J.G., Han, S.J., Zhang, Y., Xing, S.W., and Bai, L.A. 2013a. Diagenesis and
metallogenetic mechanisms of the Tuanjiegou gold deposit from the Lesser
Xing’an Range, NE China: Zircon U–Pb geochronology and Lu–Hf isotopic
constraints. Journal of Asian Earth Sciences, 62: 373–388.
Sun, J.G., Zhang, Y., Han, S.J., Men, L.J. 2013b. Timing of formation and geological
setting of low-sulphidation epithermal gold deposits in the continental margin of
NE China. International Geology Review, 55(5):142-161.
Page 35 of 55
https://mc06.manuscriptcentral.com/cjes-pubs
Canadian Journal of Earth Sciences
Draft
36
Sun, J.G., Zhao, J.K., Chen, J.Q., Keisuke, N., Hirochika, S., and Shen, K. 2008.
Ore-forming mechanism for the Xiaoxinancha Au-rich Cu deposit in
Yanbian,Jilin Province, China: Evidence from noble gas isotope geochemistry of
fluid inclusions in minerals. Science in China Series D: Earth Sciences, 51:
216–228.
Sun, J.G., Xing, S.W., and Zheng, Q.D. 2006. Geodynamic and geochemistry of
norferrous and noble metal deposits, Northeastern China, Changchun, Jilin
University Press, 128 p. (in Chinese)
Sun, X.M., Zhang, Y., Xiong, D.X., Sun, W.D., Shi, G.Y., Zhai, W., Wang, S.W. 2009.
Crust and mantle contributions to gold-forming process at the Daping deposit,
Ailaoshan gold belt, Yunnan, China. Ore Geology Reviews, 36(1–3):235–249.
Sun, X.M., Xiong, D.X., Wang, S.W., Shi, G.Y., Zhai, W. 2006. Noble gases isotopic
composition of fluid inclusions in scheelites collected from Daping goldmine,
Yunnan province, China, and its metallogenic significance. Acta Petrologica
Sinica, 22 (3):725–732. (in Chinese with English abstract)
Tolstikhin, I.N. 1978. A review: some recent advances in isotope geochemistry of
light rare gases. In Terrestrial rare gases, (eds. E. C. Alexander and M. Ozima),
62p. Japan Scientific Society Press, Tokyo.
Yin, Q., Qing, M., Piao, X.H., Bian, H.Y., Cheng, J., Zhang, J.H., and Wan, D., 2010.
ore-forming fluid geochemistry characteristics of DuHuangling gold deposit , in
yanbian Jilin. Gold Science and Technology, 11: 16–19. (in Chinese with English
abstract)
Page 36 of 55
https://mc06.manuscriptcentral.com/cjes-pubs
Canadian Journal of Earth Sciences

Draft
37
Zartman, R.E., and Doe, B.R. 1981. Plumbotectonics - The Model. Tectonophysics,
75: 135–162.
Zhang, D.H. 1997. Some new advances in ore-forming fluid geochemistry on boiling
and mixing of fluids during the processes of hydrothermal deposits. Advance in
Earth Sciences, 12: 546–552.
Zhang, Y., Sun J.G., Xing S.W., Zhao K.Q., and Qiu D.M. 2013. Fliud inclusions in
the Xinhualong molybdenum deposit, JiLin Province. Journal of Jilin Univer
sity( Earth Science Edition), 43: 1878–1888.
Zhao, H., Cui, X.W., and Xu, L.X. 2008. Geological and isotopic characteristics of
Jiusangou gold deposit in Wangqing. Gold Science and Technology, 16: 48–51.
(in Chinese with English abstract)
Zhou, D.Y., Song, F.F., and Huai B.F. 2007. Geological characteristics and
prospecting indicators of Wangqing gold deposit in Duhuangling. Gold Science
and Technology, 15: 12–14 (in Chinese with English abstract)
Zotov, N., Boysen, H., and Romano, C. 1995. Neutron diffraction study of feldspar
glasses. Mixed alkali effect. Journal of Non-Crystalline Solids, 191: 124–131.
Figure legends
Fig.1 Geotectonic division in NE China, after Shao and Tang (1995) (a), geological
map of the Yanbian area showing the locations of gold and copper deposits, modified
after Meng et al. (2001) (b) and geological map (c: Duhuangling gold deposit, d:
Jiusangou gold deposit)
Fig.2. Photographs showing the ore geology of the Duhuangling gold deposit.
a, Crypto-explosion breccia type ore with K-feldspathization. b, Early stage milky
quartz (Q1) and yellow–white pyrite. c, Pyrite-quartz veinlets. d, Kaolinization. e,
Page 37 of 55
https://mc06.manuscriptcentral.com/cjes-pubs
Canadian Journal of Earth Sciences

Draft
38
Gold-bearing altered rock type ore. f, Pyrite cataclastic texture, hair-like sphalerite,
and native gold. g, anhedral chalcopyrite and sphalerite. h, Quartz–sulfide vein. I,
anhedral chalcopyrite and sphalerite.
Abbreviation: Py = pyrite, Q1-4 = quartz in different stages, Ccp = chalcopyrite, Au =
nature gold, Sp = Sphalerite.
Si = silicification, Ser = sericitization, Kf = K-feldspathization, Kao = kaolinization.
Fig.3. Photographs showing the ore geology of the Jiusangou gold deposit.
a, K-feldspathization and silicification. b, Early stage milky quartz (Q1) and
yellow–white pyrite. c, Quartz–sulfide ore. d, Quartz–sulfide vein. e, Quartz and
carbonatization veinlets . f, K-feldspathization and kaolinization. g, Chalcopyrite
replacement pyrite. h, Euhedral–subhedral arsenopyrite and anhedral pyrite. i,
Euhedral arsenopyrite within euhedral pyrite.
Abbreviation: Py = pyrite, Q1-4 = quartz in different stages, Ccp = chalcopyrite, Apy =
arsenopyrite.
Car = carbonatization, Si = silicification , Kf = K-feldspathization, Kao =
kaolinization.
Fig.4. Photomicrographs of fluid inclusions from the Duhuangling and Jiusangou gold
deposits. V = vapor phase, S = sylvite , H = halite, Anh = anhydrite, Brt = barite, Ccp
= chalcopyrite, Mag = magnetite
Fig.5 Homogenization temperature (Th) histogram of fluid inclusions in different
stages from the Duhuangling and Jiusangou gold deposits
Fig.6. Plots of homogenization temperature (Th) vs salinity of fluid inclusions from
the Duhuangling and Jiusangou gold deposits
Fig.7. Laser Raman spectra of fluid inclusions from the Duhuangling gold deposit.
Fig.8. δO-δD plots of the ore fluids for Duhuangling and Jiusangou deposits.
(According to Hedenquist and Lowenstern 1994)
Fig.9. Noble gas composition of fluid inclusions in the ore minerals (a) and 21
Ne/22
Ne—20
Ne/22
Ne diagrams (b)
Fig.10. 4He —
3He/
4He and
40Ar/
36Ar—
3He/
4He diagrams for fluid inclusions (After
Gautheron et al. 2005 and Ballentine et al. 2002)
Fig.11. Lead isotope ratios diagram of the ore minerals in the Duhuangling and
Jiusangou gold deposits (After Zartman and Doe 1981)
Fig.12. 3He/
4He—
4He/
20Ne diagram (After Allegre et al. 1987; O’Nions 1994)
Page 38 of 55
https://mc06.manuscriptcentral.com/cjes-pubs
Canadian Journal of Earth Sciences

Draft
Table 1 Microthermometric data of fluid inclusions from the Duhuangling and Jiusangou gold deposits
Deposit Stage Type Size
(µm) Proportion% Tm-ice (℃) Tm-halite(℃) Th-hot(℃)
Salinity
(wt%)
Density
(g/cm3)
Pressure
( MPa)
Duhuangling
I1
RV 6~14 55-90 -10.8~ -4.0 -- 330.0~379.0 6.44~14.84 0.66~0.83 55.04~75.82
RL 8~24 8~ 30 -13.2 -- 325.5~404.5 17.19 0.86 40.94
S 8~14 10 ~ 25 -- 265.4~411.0 335.0~420.0 35.68~48.67 1.03~1.08 32.59~39.28
II1
RV 6~10 50-60 -- -- 321.8~327.9 -- -- --
RL 4~12 5-45 -15.1~-5.5 -- 246.6~348.5 8.54~18.88 0.78~0.96 26.08~33.19
S 6~16 10-20 -- 189.0~325.0 260.0~325.0 31.34~40.19 1.08~1.10 40.83~55.58
III1 RL 4~14 8-30 -15.0~ -0.9 -- 160.6~252.1 1.56~18.79 0.85~0.98 14.61~30.74
S 16 5-10 -- 210.0 210.0 32.39 1.15 33.36
IV1 RL 4~10 10-25 -3.5~ -3.3 -- 92.7~154.0 5.40~5.70 0.96~1.00 <13.07
Jiusangou
I2
RV 3~5 55-70 -- -- 390.0~470.0 -- -- --
RL 4~20 5-45 -17.2~-10.8 -- 343.8~468.5 14.84~20.59 0.75~0.81 40.93~60.04
S 20~28 30-50 -- 179.0~236.4 433.2~454.0 30.88~33.85 0.90~0.93 60.30~73.25
II2 RL 6~14 5-35 -18.6~-13.5 -- 249.0~340.6 17.47~21.65 0.93~0.99 33.74~48.62
S 8~18 5-25 -- 215.0~352.6 289.0~328.0 32.65~42.65 1.05~1.09 47.78~61.49
III2 RL 4~20 5-40 -6.7~-0.3 -- 168.8~267.8 0.52~10.11 0.83~0.89 14.37~27.75
S 6~8 15-20 -- 173.4~261.2 195.0~241.7 30.63~35.40 1.10~1.17 30.37~42.80
IV2 RL 4 25 -- -- <150.0 -- -- --
Page 39 of 55
https://mc06.manuscriptcentral.com/cjes-pubs
Canadian Journal of Earth Sciences

Draft
Table 2 Hydrogen and oxygen isotope analysis of fluid inclusions results
Sample Deposit
Sample
description
Mineral
δDV-SMOW δ18O
Homogenizatio
n temperature δ18OH2O
Data
sources
Dhl-9
Duhuangling
Pyrite
quartz vein
quartz -104 9. 6 350℃ 4.3
This Paper
Dhl-N5
Pyrite
quartz vein quartz -107 10.2 350℃ 4.9
Dhl-N6
Pyrite
quartz vein quartz -104 10.4 350℃ 5.1
JSG-1 Jiusangou
Pyrite
phyllic
quartz -92 15.2 320℃ 9.0 Zhao et al.,
2008 JSG-2 quartz -104 13.5 320℃ 7.3
XNC-N24-1
Xiaoxinancha
Quartz vein quartz -100 7.0 350℃ 1.7
Men, 2011
XNC-N24-2 Calcite vein calcite -130 14.3 100℃ -2.8
I-580-6A-1 Quartz vein quartz -82 5.9 400℃ 1.9
I-580-6A-2 Calcite vein calcite -92 0.9 170℃ -10.4
XNC-I-1 Granite quartz -110 8.9 500℃ 6.6
XNC-1 Granite quartz -109 8.8 500℃ 6. 6
XNC-2 Granite quartz -106 8.8 500℃ 6.5
Clayton formula: 1000lnα=δ18O mineral−δ
18O H20=3.38×10⁶ T −2 − 3.4, The mineral measured δ18O is quartz , T represent for
absolute temperature
Page 40 of 55
https://mc06.manuscriptcentral.com/cjes-pubs
Canadian Journal of Earth Sciences

Draft
Table 3. The noble gas isotope data for the Jiusangou and Duhuangling gold deposits.
Continued from Table 3
Sample
36Ar 38Ar 40Ar 38Ar/36Ar 40Ar/36Ar 84Kr 132Xe F4He F84Kr F132Xe
10-9cc/g 10-12cc/g
Jsg-1 0.577±0.060 0.110 ±0.011 752±79 0.19011±0.00075 1302.4 ±14.2 15.1 ±1.6 1.52 ±0.17 17561 1.26 3.51
Jsg-2 0.561 ±0.058 0.106 ±0.011 1115±117 0.18962±0.00097 1990.0 ±22.0 17.8 ±1.9 2.43 ±0.26 33033 1.53 5.78
Dhl-1 0.581 ±0.060 0.112 ±0.012 2577±271 0.19270±0.00130 4433.6 ±67.3 17.2 ±1.8 2.52 ±0.27 125131 1.43 5.78
Dhl-2 1.245 ±0.127 0.237 ±0.024 3128±319 0.19011±0.00101 2511.6 ±16.6 32.6 ±3.4 3.48 ±0.36 72653 1.26 3.73
*3HeDM/3Hem=((1-(
3He/4He)c/(3He/4He)m)/(1-(
3He/4He)c/(3He/4He)DM))×100;
20NeDM/20Nem=((1-(
3He/4He)air/(3He/4He)m)/ (1- (20Ne/22Ne)air/ (20Ne/22Ne)DM))×100;
Ar*%=((40Ar/36Ar)m-295.5)/ (40Ar/36Ar)m)×100; FX =(X/
36Ar)m /(X36Ar) air; DM- mantle;m= The measured values;c- Crustal fluids;air- atmosphere;According to Gautheron,
et al. 2002 and Buikin, et al. 2005
Sample Mineral
Mass
g
3He 4He 3He/4He 20Ne 21Ne 22Ne 20Ne/22Ne 21Ne/22Ne
10-15cc/g 10-9cc/g 10-6 10-9cc/g
Jsg-1 Pyrite 0.3116 34±10 1677±168 0.0206±0.0057 0.419±0.042 0.00131±0.00014 0.0425±0.0043 9.870±0.112 0.0309±0.0013
Jsg-2 Pyrite 0.3206 40±15 3067±307 0.0132±0.0047 0.350±0.035 0.00115±0.00013 0.0359±0.0036 9.734±0.080 0.0320±0.0015
Dhl-1 Pyrite 0.3190 116±42 12032±1203 0.0096±0.0034 0.405±0.041 0.00168±0.00018 0.0413±0.0042 9.811±0.088 0.0406±0.0014
Dhl-2 Pyrite 0.3266 166±99 14970±1497 0.0111±0.0065 0.951±0.096 0.00330±0.00035 0.0966±0.0097 9.849±0.069 0.0342±0.0011
Page 41 of 55
https://mc06.manuscriptcentral.com/cjes-pubs
Canadian Journal of Earth Sciences

Draft
Table 4 Lead isotope composition of the ore minerals in the Duhuangling and jiusangou glod deposits
Deposit Sample Sample description Mineral 206Pb/204Pb 2σ 207Pb/204Pb 2σ 208Pb/204Pb 2σ
Jiusangou JSG1 Pyrite altered rocks
pyrite 18.2955 20 15.5322 17 38.1325 41
JSG 2 pyrite 18.3513 15 15.5441 12 38.1715 30
Duhuangling DHL1 Disseminated pyrite
altered rocks
pyrite 18.3244 7 15.5328 8 38.1419 19
DHL 2 pyrite 18.3072 8 15.5208 7 38.1055 18
Page 42 of 55
https://mc06.manuscriptcentral.com/cjes-pubs
Canadian Journal of Earth Sciences

Draft
Table 5 Geological and fluid inclusions features from the research area and typical deposits
Deposit Jiusangou deposit Duhuangling deposit Xiaoxinancha
deposit
High-sulfidation epithermal
gold deposit
Gold-rich porphyry copper
deposit
Host rock Diorite porphyrite, diorite,
and granite porphyry
Quartz diorite Granite complex Typically calc-alkalic
andesite, dacite, and
rhyodacite; commonly
porphyry
Calc-alkaline or high-K
calc-alkaline; commonly
porphyritic intrusions
Orebody
type
Altered rock-type Altered rock-type and
crypto-explosive
breccia-type
Veinlet-disseminate
d, sulphide-quartz
vein
Altered rock-type Veinlet-disseminated type
Ore
structure
Disseminated and cystic Massive, brecciated,
veinlet-disseminated, and
geode structures
Main vein,
disseminated
Main disseminated, also
present brecciated, vein
Main disseminated and
veinlet, minor brecciated
Ore
mineral
Main pyrite and
arsenopyrite, minor
chalcopyrite, tennantite,
galena, sphalerite, native
gold, and electrum
Main pyrite and
chalcopyrite, with minor
pyrrhotite, chalcocite,
sphalerite, galena, and
native gold
Pyrite, pyrrhotite,
chalcopyrite,
arsenopyrite,bornite
, molybdenum,
sphalerite, galena,
native gold
Pyrite, chalcopyrite,
tennantite, bismuthinite,
native gold, sphalerite,
galena
Pyrite, chalcopyrite, Pyrite,
chalcopyrite, magnetite
Gangue
mineral
Quartz, illite, calcite,
tourmaline and sericite
Main quartz and sericite
and minor calcite,
chlorite, epidote, and clay
mineral are also present
Quartz, calcite,
sericite, chlorite,
biotite
Quartz, alunite,barite,
kaolinite, pyrophyllite
Quartz, sericite, K-feldspar
Alteration Silicification, kaolinization,
pyritization, and
sericitization, with minor
carbonatization,
K-feldspathization, and
chloritization
Sericitization,
kaolinization,
silicification,
carbonatization,
propylitization and
K-feldspathization
K-feldspathization,
biotitization,chloriti
zation,
sericitization,
silicification,
minorsilicification
Silicification, alunitization
and kaolinization
K-feldspathization,
Sericitization, mudding,
propylitization
Fluid
characteris
tic
170-4703, salinities from
1.56 to 48.67 wt.%
160-4203, salinities from
0.52 to 42.65 wt.%
470-1903,
salinities from 9.45
to 20.15 wt.%
200-3003; salinities from 1
to 24 wt. %
300-7003, salinities > 30
wt.%
ore-formin
g fluids
origin
Main magmatic water Main magmatic water Mantle-derived
magmatic fluids.
Dominantly meteoric water
with significant magmatic
components
Dominantly magmatic water
with minor atmospheric
water
Geotectoni
c setting
Subduction -related
continental margin
Subduction -related
continental margin
Subduction -related
continental margin
Subduction -related
continental margin or
island-arc
Subduction -related
continental margin or
island-arc
Reference This paper; Chai et al.
2013
This paper; Chai et al.
2013
Men 2011; Sun et
al. 2008
Sillitoe 1997; White and
Hedenquist 1995
Sillitoe 1997, 2010; Li et al.
2006
Page 43 of 55
https://mc06.manuscriptcentral.com/cjes-pubs
Canadian Journal of Earth Sciences

Draft
Fig.1 Geotectonic division in NE China, after Shao and Tang (1995) (a), geological map of the Yanbian area showing the locations of gold and copper deposits, modified after Meng et al. (2001) (b) and geological map
(c: Duhuangling gold deposit, d: Jiusangou gold deposit)
209x219mm (300 x 300 DPI)
Page 44 of 55
https://mc06.manuscriptcentral.com/cjes-pubs
Canadian Journal of Earth Sciences

Draft
Fig.2. Photographs showing the ore geology of the Duhuangling gold deposit. a, Crypto-explosion breccia type ore with K-feldspathization. b, Early stage milky quartz (Q1) and yellow-white pyrite. c, Pyrite-quartz veinlets. d, Kaolinization. e, Gold-bearing altered rock type ore. f, Pyrite
cataclastic texture, hair-like sphalerite, and native gold. g, anhedral chalcopyrite and sphalerite. h, Quartz-sulfide vein. I, anhedral chalcopyrite and sphalerite.
Abbreviation: Py = pyrite, Q1-4 = quartz in different stages, Ccp = chalcopyrite, Au = nature gold, Sp = Sphalerite.
Si = silicification, Ser = sericitization, Kf = K-feldspathization, Kao = kaolinization.
179x138mm (300 x 300 DPI)
Page 45 of 55
https://mc06.manuscriptcentral.com/cjes-pubs
Canadian Journal of Earth Sciences

Draft
Fig.3. Photographs showing the ore geology of the Jiusangou gold deposit. a, K-feldspathization and silicification. b, Early stage milky quartz (Q1) and yellow–white pyrite. c, Quartz–
sulfide ore. d, Quartz–sulfide vein. e, Quartz and carbonatization veinlets . f, K-feldspathization and kaolinization. g, Chalcopyrite replacement pyrite. h, Euhedral–subhedral arsenopyrite and anhedral pyrite. i,
Euhedral arsenopyrite within euhedral pyrite. Abbreviation: Py = pyrite, Q1-4 = quartz in different stages, Ccp = chalcopyrite, Apy = arsenopyrite.
Car = carbonatization, Si = silicification , Kf = K-feldspathization, Kao = kaolinization.
178x138mm (300 x 300 DPI)
Page 46 of 55
https://mc06.manuscriptcentral.com/cjes-pubs
Canadian Journal of Earth Sciences

Draft
Fig.4. Photomicrographs of fluid inclusions from the Duhuangling and Jiusangou gold deposits. V = vapor phase, S = sylvite, H = halite, Anh = anhydrite, Brt = barite, Ccp = chalcopyrite, Mag = magnetite.
181x134mm (300 x 300 DPI)
Page 47 of 55
https://mc06.manuscriptcentral.com/cjes-pubs
Canadian Journal of Earth Sciences

Draft
Fig.5 Homogenization temperature(Th) histogram of fluid inclusions in different stages from the Duhuangling and Jiusangou gold deposits
137x210mm (300 x 300 DPI)
Page 48 of 55
https://mc06.manuscriptcentral.com/cjes-pubs
Canadian Journal of Earth Sciences
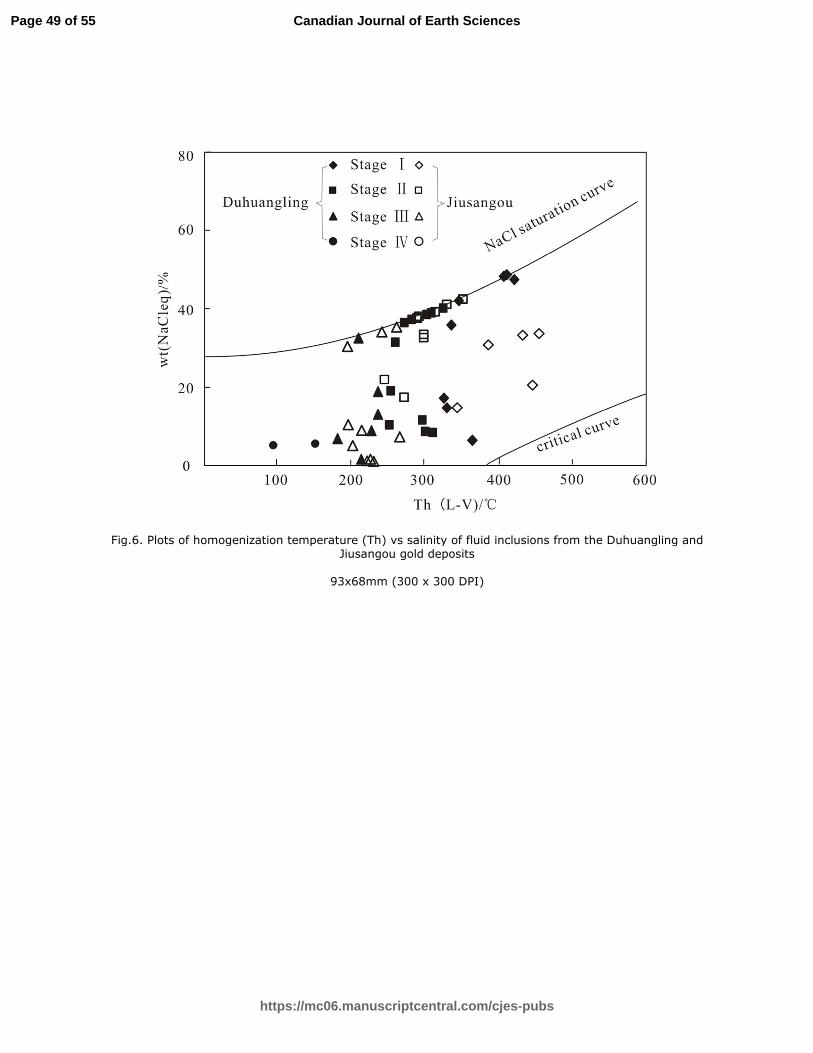
Draft
Fig.6. Plots of homogenization temperature (Th) vs salinity of fluid inclusions from the Duhuangling and Jiusangou gold deposits
93x68mm (300 x 300 DPI)
Page 49 of 55
https://mc06.manuscriptcentral.com/cjes-pubs
Canadian Journal of Earth Sciences

Draft
Fig.7. Laser Raman spectra of fluid inclusions of the Duhuangling gold deposit.
153x76mm (300 x 300 DPI)
Page 50 of 55
https://mc06.manuscriptcentral.com/cjes-pubs
Canadian Journal of Earth Sciences

Draft
Fig.8. δO-δD plots of the ore fluids for Duhuangling and Jiusangou deposits.(According to Hedenquist and
Lowenstern 1994)
130x82mm (300 x 300 DPI)
Page 51 of 55
https://mc06.manuscriptcentral.com/cjes-pubs
Canadian Journal of Earth Sciences

Draft
Fig.9. Noble gas composition of fluid inclusions in the ore minerals (a) and 21Ne/22Ne—20Ne/22Ne diagrams (b)
192x78mm (300 x 300 DPI)
Page 52 of 55
https://mc06.manuscriptcentral.com/cjes-pubs
Canadian Journal of Earth Sciences

Draft
Fig.10. 4He —3He/4He and 40Ar/36Ar—3He/4He diagrams for fluid inclusions (After Gautheron et al. 2005 and Ballentine et al. 2002)
196x80mm (300 x 300 DPI)
Page 53 of 55
https://mc06.manuscriptcentral.com/cjes-pubs
Canadian Journal of Earth Sciences

Draft
Fig.11. Lead isotope ratios diagram of the ore minerals in the Duhuangling and Jiusangou gold deposits (After Zartman and Doe 1981)
167x58mm (300 x 300 DPI)
Page 54 of 55
https://mc06.manuscriptcentral.com/cjes-pubs
Canadian Journal of Earth Sciences

Draft
Fig.12. 3He/4He—4He/20Ne diagram (After Allegre et al. 1987; O’Nions 1994)
155x95mm (300 x 300 DPI)
Page 55 of 55
https://mc06.manuscriptcentral.com/cjes-pubs
Canadian Journal of Earth Sciences