Embed Size (px)
Citation preview

Draft
Towards a simple and reliable method for calculating the uplift 1
capacity of plate anchors in sand 2
A. Roy1, S.H Chow2, C.D. O’Loughlin3, M.F. Randolph4 3
1,3,4 Centre for Offshore Foundation Systems, University of Western Australia, Australia 4
2 Department of Infrastructure Engineering, the University of Melbourne, Australia 5
Article manuscript submitted to Canadian Geotechnical Journal 6
First submission: May, 2020 7
1Corresponding Author
PhD student, Centre for Offshore Foundation Systems (BEng, MEng)
The University of Western Australia
35 Stirling Highway, Crawley WA 6009, Perth, Australia
E-mail: [email protected]
Orcid: (0000-0002-3093-1848)
2Senior Lecturer, Department of Infrastructure Engineering (BEng, MEng, PhD)
Engineering Block B, Grattan Street, Parkville
The University of Melbourne, Victoria 3010, Australia
Phone: +61 3 9035 7504
E-mail: [email protected]
Orcid: (0000-0002-5442-0014)
3Associate Professor, Centre for Offshore Foundation Systems (BEng, PhD)
The University of Western Australia
35 Stirling Highway, Crawley WA 6009, Perth, Australia
Phone: +61 8 6488 6488,
E-mail: [email protected]
Orcid: (0000-0002-5823-6265)
4Professor, Centre for Offshore Foundation Systems (MA, PhD, FAA, FREng, FRS, FTSE, FIEAust, CPEng)
The University of Western Australia
35 Stirling Highway, Crawley WA 6009, Perth, Australia
Phone: +61 8 6488 3075,
E-mail: [email protected]
Orcid : (0000-0003-3136-6454)
Number of words 6731 (excluding abstract, references and captions) 8
Number of figures 17 9
Number of tables 07 10
Page 1 of 44
https://mc06.manuscriptcentral.com/cgj-pubs
Canadian Geotechnical Journal

Draft
Abstract 11
This paper investigates the uplift capacity of horizontal plate anchors in sand through finite element 12
analyses and centrifuge experiments. Finite element simulations adopt a sophisticated bounding surface plasticity 13
model that accounts for stress and density dependent behaviour, as well as loading and fabric related anisotropic 14
effects in sands. Failure mechanisms at peak anchor capacity show that failure occurs progressively, with a marked 15
decrease in mobilised friction angle within the shear bands close to the anchor edge. Numerical simulations of a 16
large set of centrifuge experiments on rectangular, strip and circular plates at different relative densities and stress 17
levels are in good agreement for dense conditions, but perform poorer for loose conditions due mainly to the open 18
cone yield surface in the bounding surface model. Equivalent comparisons with current limit equilibrium methods 19
highlight the challenges in direct application of element level strength equations. Finally, the paper proposes a 20
modified limit equilibrium solution based on a ‘rigid-block’ failure mechanism extending to soil surface, but with 21
anchor factors that encompass the results from the finite element simulations. The modified solution provides a 22
higher level of agreement with results from a large database of plate and pipeline test data than existing limit 23
equilibrium methods. 24
Keywords 25
Plate anchor capacity; bounding surface plasticity; centrifuge tests; sands; stress level dependence 26
27
28
29
30
31
32
33
34
Page 2 of 44
https://mc06.manuscriptcentral.com/cgj-pubs
Canadian Geotechnical Journal

Draft
Introduction 35
Plate anchors are used onshore as foundation elements for structures subjected to high uplift or lateral 36
loads. They could also be an economical alternative to pile foundations for mooring offshore floating renewable 37
energy devices, as relative to piles, they provide much higher capacity relative to their weight (O’Loughlin and 38
Barron 2012, Al Hakeem and Aubeny 2019). Much of their use offshore (e.g. drag embedment anchors or suction 39
embedded plate anchors) has been in the soft clay deposits typically encountered in deep water (Murff et al. 2005, 40
O’Loughlin et al. 2018), whereas offshore floating renewable energy devices are likely to be sited in much 41
shallower water where coarser-grained seabed deposits are to be expected. Consequently, much less attention has 42
been given to studying the performance of plate anchors in sand than in clay. This will require rectification if plate 43
anchor technology is to find application in the offshore renewable energy industry. 44
Early experimental studies into plate anchor capacity in sand were mainly at single gravity (1g) and hence 45
at very low stress levels (Murray and Geddes 1987, Rowe and Davis 1982) with a limited number of centrifuge 46
testing programmes at higher and more realistic stress levels (Dickin 1988, 1994). The main contribution from 47
these experimental investigations was to identify soil friction (ϕ) and dilation (ψd) angles as the key governing 48
parameters. The earliest analytical methods were mainly based on a ‘vertical slip surface’ mechanism (Fig. 1 (b)), 49
in which soil failure is assumed to occur along vertical planes extending from the extremities of the buried object 50
to the soil surface (Trautmann et al. 1985), although uniform gradient planar or conical surfaces have also been 51
considered (Vermeer and Sutjiadi 1985). Success of such methods depended on accurate estimation of the lateral 52
stress coefficient to compute shear stress (τf in Fig. 1) on the slip surface. More recently (Cheuk et al. 2008), pipe 53
uplift experiments in sand involving sophisticated imaging techniques that revealed the progressive failure nature 54
of the uplift problem concluded that the failure mechanism for a shallowly buried pipe (or plate) was better 55
described using ‘inclined slip surfaces’ with a tendency for the slip surfaces to curve outwards as they approach 56
the ground surface. Similar evidence revealing inclined deforming soil bands, but with intense shear banding 57
concentrated close to the anchor, can be seen in the image analysis data presented in Liu et al. (2012). In light of 58
this evidence, it is logical to assume that the zone of observed deformation does not necessarily coincide with the 59
zone of intense shearing, such that methods that assume peak shear resistance mobilisation along the entire length 60
of the slip plane would tend to overestimate anchor capacity. 61
Modern LE methods (White et al. 2008, Giampa et al. 2017) have aimed to strike a balance for this apparent 62
mismatch on shear resistance through certain approximation of the shear stresses on the slip plane, which depend 63
Page 3 of 44
https://mc06.manuscriptcentral.com/cgj-pubs
Canadian Geotechnical Journal

Draft
on inputs of ϕ and ψd. Acknowledging that selecting appropriate inputs of ϕ and ψd is complicated by their 64
dependence on mean stress level (p′), loading path direction and relative density (RD), it is of interest to consider 65
more advanced soil models (e.g. bounding surface models) that are able to accurately capture stress dilatancy in 66
sands under progressively evolving stress and stain conditions without explicit inputs of ϕ and ψd. 67
Another aspect of plate anchor capacity that deserves attention is the response at field scale stress levels. 68
Most of the experimental investigations have been reduced scale model testing at very low stress levels (Rowe 69
1978, Rowe and Davis 1982, Frydman and Shaham 1989, Ilamparuthi et al. 2002, Chow et al. 2018, Giampa et 70
al. 2018) which raises questions about the appropriateness of the resulting analytical methods for field scale 71
applications. Although centrifuge test data (e.g. Tagaya et al. 1988) show that for a given anchor embedment 72
depth, the anchor (capacity) factor reduces as the anchor dimension (and hence stress level) increases, such stress-73
level dependencies have not been incorporated in design equations used in engineering practice. It would be 74
challenging to quantify this stress-level dependence using element level strength degradation equations as 75
attempted through lumped inputs in White et al. (2008), particularly as the plate anchor boundary value problem 76
involves a multitude of different stress paths and varying stress levels in the domain. 77
This paper provides a comparative assessment of uplift capacity of shallowly embedded horizontal anchors 78
through finite element (FE) analyses and centrifuge experiments, drawing on the numerical and experimental data 79
to articulate limitations of calculating anchor capacity using simplified methods based solely on specified friction 80
and dilation angles. The FE analyses utilised a sophisticated bounding surface plasticity model that takes into 81
account the variation of dilation with relative density, mean stress, direction of loading and progressive failure 82
(elaborated in Dafalias et al. 2004, Dafalias and Manzari 2004, Papadimitriou et al. 2005) with some modifications 83
that allow for fabric anisotropy. As described in Roy et al.(2020), these simple and practical modifications avoid 84
the more complex variations to the model described in Li and Dafalias (2012) and Petalas et al. (2019), which 85
would be required to account for cyclic loading reversals and stress rotations over multiple cycles, but are 86
unnecessary for the monotonic loading conditions considered in this paper. Results from the FE analyses are 87
validated against centrifuge model tests in loose and dense sand that consider plate anchors of different geometries, 88
and at different embedment depths and gravitational acceleration levels. The numerical results shed light on the 89
mobilised friction angles within the failure mechanisms and identify potential demerits of predictive capabilities 90
of existing methods when used across different stress levels. Finally, results from the FE analyses are represented 91
algebraically, allowing for routine use by practitioners. 92
Page 4 of 44
https://mc06.manuscriptcentral.com/cgj-pubs
Canadian Geotechnical Journal

Draft
Methodology 93
Details of the numerical analysis 94
Soil constitutive model details 95
The finite element simulations adopted a bounding surface plasticity model as elaborated in Table 1, with 96
a governing platform identical to the parent models developed by Dafalias and Manzari (2004) and Dafalias et al. 97
(2004). The model controls sand behaviour with the simultaneous interaction of the yield surface (Eq. (7)) with 98
three other surfaces, namely the critical state surface (Eq. (9)), the bounding surface (Eq. (11)) and the dilatancy 99
surface (Eq. (12)). Lode angle (θ) and state parameter (ψ) dependences for these surfaces, as per Eq. (8 - 12), 100
allow realistic predictions of stresses and strains to be obtained over a wide range of densities and mean stress 101
levels. A unique CSL in e - p′ space is assumed (Eq. (1)), consistent with the latest developments in constitutive 102
modelling in sands elaborated in Li and Dafalias (2012). It is widely accepted that mobilised stresses and dilation 103
(Eq. (20)) in sands varies with respect to different loading paths and inherent fabric anisotropy (Vaid et al. 1990, 104
Arthur and Menzies 1972). In order to capture these effects with a unique CSL, the model is implemented by 105
adopting a variable rate of interaction of ψ for different loading directions with regards to sand fabric (encapsulated 106
through 𝐴𝑟𝑎𝑡𝑖𝑜 in Eqn. (23)). Scaling parameters (𝑓and 𝑓ℎ
in Eq. (24) and Eq. (25)) are used to adjust the influence 107
of ψ (to 𝜓𝑓in Eq. (26)), thus altering the contractive/dilative tendencies of the soil in the model’s governing 108
equations (Eq. (15), Eq. (16) and Eq. (20)). The implementation adopted here is detailed in Roy et al. (2020) and 109
summarised in Table 1 for completeness. Model parameters for the UWA silica sand (with index properties listed 110
in Table 2) used in the centrifuge experiments were calibrated using an optimisation technique on triaxial 111
compression and extension responses (Fig. 2) at various densities and stress levels ranging from 25 kPa to 667 112
kPa (see Table 3). 113
Model details and FE methodology 114
The problem was modelled numerically in Abaqus (Dassault Systemes, 2012) using a series of plane strain 115
and axisymmetric analyses, with an unstructured mesh (Fig. 3) composed of linear quadrilateral elements (CPE4 116
and CAX4 respectively). The analyses were conducted for different anchor plate dimensions – width (B) or 117
diameter (D) at shallow embedment ratios (H/B or H/D) between 1.05 and 4 in sand with relative density (RD) 118
varying between 30% and 85%. The anchor corners were filleted with a radius of 0.02B or 0.02D to avoid 119
numerical convergence issues. The anchor was weightless and fully rigid, with its centre on the upper surface 120
taken as the reference point for the application of displacements. Minimum element sizes in regions within 0.5B 121
Page 5 of 44
https://mc06.manuscriptcentral.com/cgj-pubs
Canadian Geotechnical Journal

Draft
(or 0.5D) around the anchor were maintained at approximately 0.03B (or 0.03D) to capture strain localisation. As 122
shown by Fig. 3, the bottom and lateral boundaries of the domain were 3B (3D) and 5B (5D) respectively from 123
the centre of the plate, established from a number of preliminary analyses. All nodes on the bottom boundary were 124
fully restrained, whereas lateral restraint only was imposed for nodes on the side boundaries. 125
The plate-soil interface was taken as fully rough as previous numerical studies indicate that the interface 126
condition of a plate anchor has minimal influence on capacity (Merifield and Sloan 2006, Merifield et al. 2006, 127
Dickin and Laman 2007, Hao et al. 2014). The unit weight of the soil (γ) was assumed as 15 kN/m3 in the numerical 128
analysis and the anchor capacities are reported (later in the paper) using the dimensionless anchor factor, Nγ = 129
qu/σ′vo, where qu is the peak anchor capacity (expressed as a stress). The coefficient of earth pressure (K0) for the 130
soil was taken as 0.5. As expected in field conditions, a horizontally layered sand has been defined for the soil by 131
appropriate definition of the fabric tensor (F in Eqn. (21) in Table 1). An explicit integration scheme based on the 132
formulation described in Sloan et al. (2001) was used to obtain the updated stresses for a given increment of strain. 133
Details of the experimental program 134
Model plate anchors 135
Multiple circular, strip (aspect ratio = 8:1) and rectangular (aspect ratio = 2:1) plate anchor models, 136
fabricated from either steel or aluminium were used in the experiments, with dimensions (width B, length L, 137
diameter D and thickness t) and masses given in Table 4. A higher plate thickness (t) was chosen for the strip 138
anchor models to limit bending. The slight variation in t/D and t/B is not considered to have a meaningful effect 139
on anchor capacity for these experiments, where capacity is derived from mobilisation of a soil mass above the 140
plate. The plates were sand-blasted, with surface roughness measurements (normalised roughness coefficient in 141
the range 0.1 to 0.13) indicating that the surface could be considered fully rough (Paikowsky et al. 1995), although 142
surface roughness in not expected to influence vertical capacity (Merifield and Sloan 2006). As shown in Fig. 4, 143
loading of the anchors was achieved using a smooth rod, 4.7 mm in diameter, screwed to the centre of the plate. 144
The rod extended to above the sand surface, allowing connection to an electrical actuator to load the plate anchor 145
(see Fig. 4). 146
Sample details 147
The uplift tests were conducted in a fine sub-angular silica sand (UWA silica sand), with properties as 148
summarised in Table 2. 13 samples were prepared in rectangular centrifuge sample containers (or ‘strongboxes’) 149
with internal dimensions of 650 mm × 390 mm × 325 mm (length × width × height) by air pluviation using an 150
Page 6 of 44
https://mc06.manuscriptcentral.com/cgj-pubs
Canadian Geotechnical Journal

Draft
automated sand rainer. To maintain consistency with the numerical modelling where the anchors were ‘wished-151
in-place’, the anchors were pre-embedded in the samples. This was achieved by pausing pluviation when the sand 152
reached the required anchor embedment depth, vacuum levelling the sand surface and carefully placing the 153
anchors, with a spatial separation distance such that the uplift mechanisms from adjacent tests would not overlap 154
(calculated assuming an inverted trapezoid (or conical frustum) using a maximum slip surface inclination (to the 155
vertical) of 30º (Liu et al. 2012, Ilamparuthi et al. 2002). Pluviation was then resumed and the sample surface was 156
vacuum-levelled to achieve a desirable final sample height, typically ranging between 160 mm and 240 mm 157
(depending on the targeted embedment ratio). As drained behaviour is of interest, there was no requirement to 158
saturate the samples, noting that this also led to quicker turnaround times between samples. 159
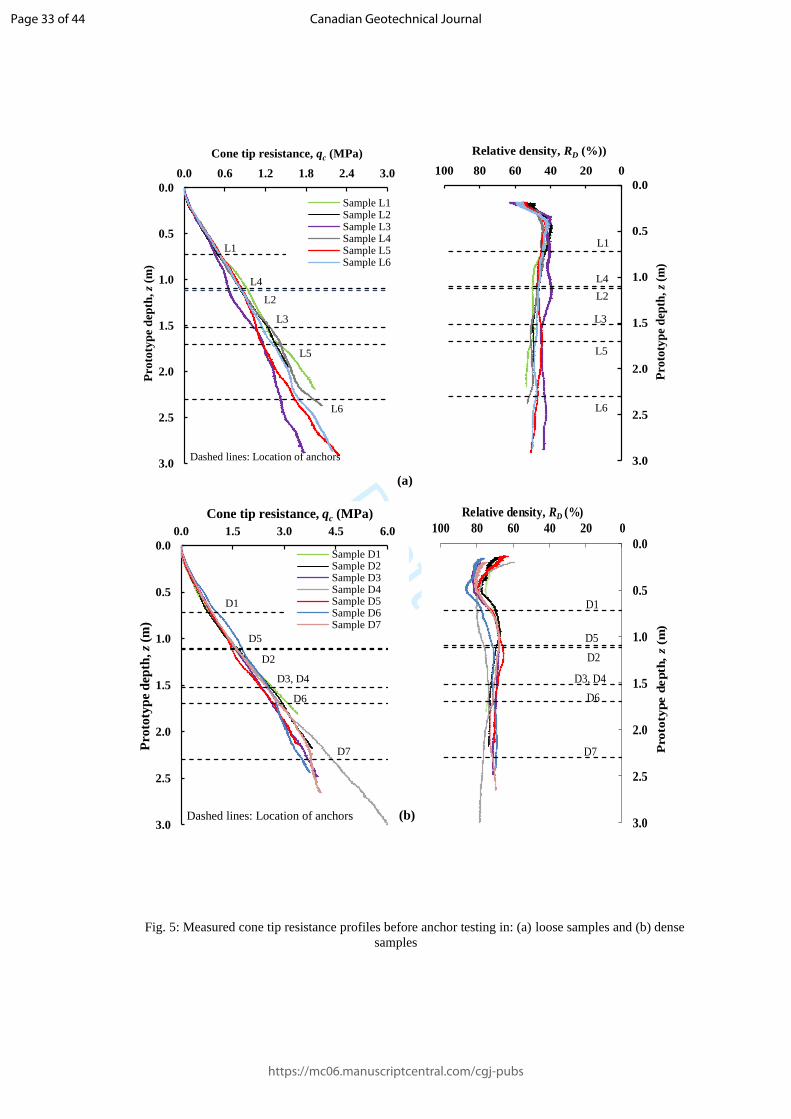
Cone penetrometer tests (CPTs) were conducted in each sample (using a 10 mm diameter cone 160
penetrometer) before the anchor tests. Depth profiles of cone tip resistance, 𝑞𝑐, with depth, z, are provided in Fig. 161
5 which show the expected increase in cone resistance with depth, reflecting the dependence of 𝑞𝑐 on vertical 162
effective stress level. Determination of relative density from global measurements of sample mass and volume 163
was hindered by the inclusion of the plate anchors in the sample. For this reason, relative density (and subsequently 164
unit weight) was determined using the empirical relationship between cone tip resistance (𝑞𝑐) and RD proposed 165
by Roy et al. (2019) for UWA silica sand. These profiles (also shown in Fig. 5) indicate that relative density was 166
typically in the range RD = 41% to 51% and RD = 69% to 76% in the loose and dense samples respectively (relative 167
to the targeted RD = 45% and RD = 70%). 168
Testing program 169
The plate anchor uplift experiments were conducted at The National Geotechnical Centrifuge Facility in 170
the University of Western Australia using the 3.6 m diameter UWA beam centrifuge. The anchors were tested at 171
shallow embedment ratios (H/B or H/D) ranging between 2 and 4 at acceleration levels between 20 and 100g. 172
These embedment ratios and acceleration levels were selected to cover (field scale) stress levels associated with 173
plate embedment depths in the range 1.2 to 8 m. The test program (outlined in Table 5 and Table 6) involved 60 174
uplift tests across 13 sand samples; 6 loose and 7 dense. The samples are identified as Cj, where ‘C’ is either ‘L’ 175
or ‘D’ for a loose or dense sample and ‘j’ denotes the order of testing of the sample. Among the 13 samples, 6 176
(D5 - D7, L4 - L6) were dedicated towards a parallel study on inclined loading and only the vertical uplift tests 177
from these samples are reported here. As detailed in Table 5 and Table 6, the tests were performed at different g-178
levels to simulate different anchor embedment depths (at fixed embedment ratios) and enable quantification of 179
Page 7 of 44
https://mc06.manuscriptcentral.com/cgj-pubs
Canadian Geotechnical Journal

Draft
potential stress level effects. Also included in Table 5 and Table 6 are values of peak mobilised anchor capacity 180
(𝑞𝑢) and corresponding anchor factors (Nγ = qu/Hγ′) from each test, obtained by reducing the measured peak uplift 181
load by the sum of the anchor and rod weight (friction along the soil-rod interface was not considered as it was 182
estimated to be less than 5% of the total capacity). 183
Results and Discussion 184
Comparison of the present dataset with relevant data from literature and FE simulations 185
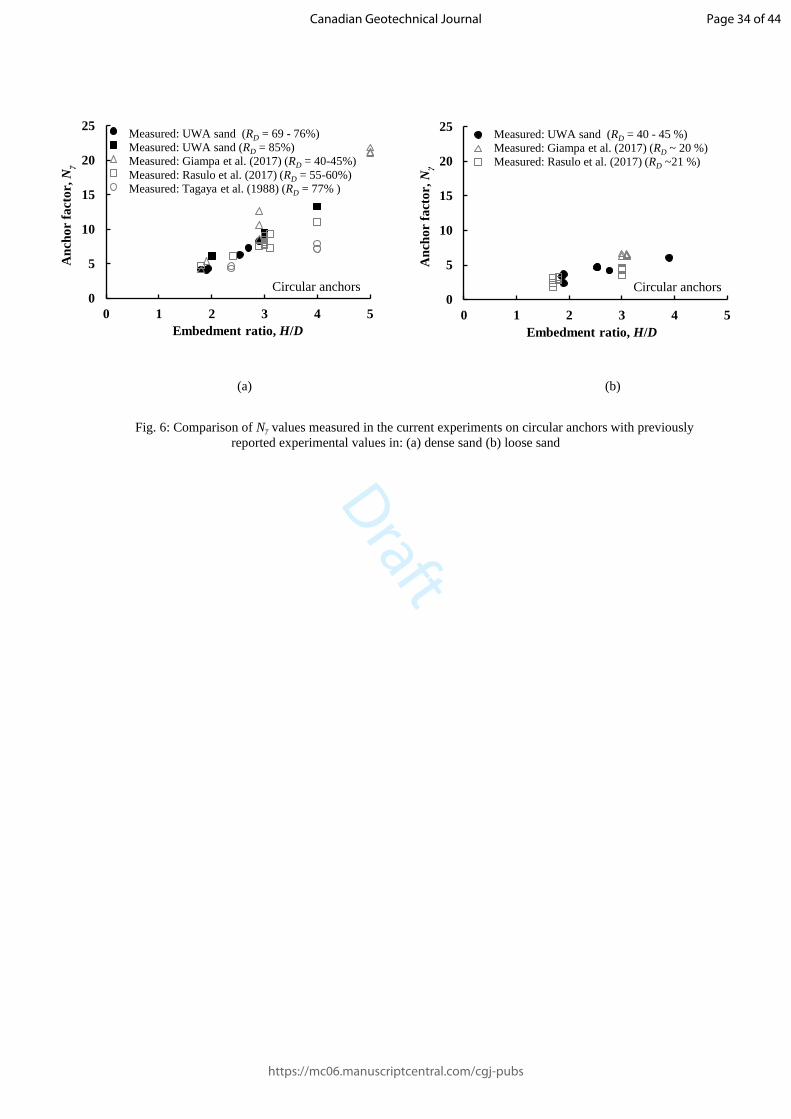
Before introducing the FE simulations, Fig. 6 compares Nγ values from the circular plate centrifuge tests 186
with equivalent experimental values in the literature (at approximately similar relative densities), where the 187
(prototype) diameter is larger than 0.15 m. Overall the data are fairly consistent and exhibit the expected increase 188
in Nγ with depth (and hence stress level) and with relative density. There is some scatter in the data (particularly 189
in the Giampa et al. (2017) results in dense sand) and the Tagaya et al. (1988) data Nγ values are slightly lower, 190
which is considered to be due to the lower ϕ = 35.1° for this sand (Ottawa sand) as reported in Tagaya et al. (1988). 191
Comparison between the experimental and numerical results 192
The measured and simulated results from strip and circular anchors in UWA silica sand are summarised as 193
𝑁𝛾 values in Fig. 7 (dense sand) and Fig. 8 (loose sand). Simulated results for B (or D) = 1 m only are included in 194
these figures to enable direct comparison with the experimental results. Data from tests on rectangular plates are 195
also included, with the measured 𝑁𝛾 adjusted by a shape factor (𝑆𝑓) as per the expression developed by Dickin 196
(1988) and expressed as: 197
𝑆𝑓 = 1 −𝑗𝐵
3𝐿𝐻(6𝐵 − 7𝐻) (27a) 198
where j was found by Dickin (1988) to be 1.0 for RD = 76% and 0.4 for RD = 33% in Erith sand. To account for 199
the slightly different RD values in the experiments reported here, the value of j in Eq. (27a) was calculated by 200
linearly interpolating between the limits 0.4 and 1.0 for RD = 33% and 76% respectively, as per the following 201
expression: 202
𝑗 = 0.0132 𝑅𝐷(%) − 0.013 (27b) 203
The numerical results show that the dependence of 𝑁𝛾 on H/B is quasi-linear for strip anchors and non-linear for 204
circular anchors. For strip anchors in dense sand (RD = 70%, Fig. 7(a)), the simulated and experimental results 205
agree within an average margin of 8.9% for H/B 3, increasing to an average under-prediction of 12.5% at H/B 206
Page 8 of 44
https://mc06.manuscriptcentral.com/cgj-pubs
Canadian Geotechnical Journal

Draft
= 4. The under prediction is partly because the simulations were for RD = 70%, whereas the sample at H/B = 4 207
was at RD = 76%, such that the dilation potential would have been lower in the numerical simulations than in the 208
centrifuge tests. An additional numerical simulation adopting RD = 76% reduced the under prediction slightly to 209
9.1%. Agreement between the numerical simulations and the experiments is higher for the circular plates at RD = 210
70% (Fig. 7(b)), with a maximum difference in 𝑁𝛾 of 14%. Additional comparisons are provided in Fig. 7(c) for 211
a circular plate (D = 0.4 m, t = 0.04 m), where the experiments (reported in Hao et al. 2018) considered both 212
circular and helical plates1 in the same sand but at RD = 85 - 90% and at a centrifuge acceleration of 20g. Similar 213
to the comparison on Fig. 7(b), the numerical and experiment N values are within 7%. 214
Corresponding comparisons for loose sand with D = 1 m are shown in Fig. 8, where the agreement is 215
slightly poorer, with the numerical simulations over predicting the experimental N values by up to 66% and 44% 216
for circular and strip anchors respectively, with an average disparity of 46% (circular anchors) and 17% (strip 217
anchors). Extending the comparisons to all the centrifuge test data on loose sand (at different stress levels), the 218
average over prediction is about 51% for circular anchors and 23% for strip anchors. This discrepancy could be 219
partly attributed to the open cone yield surface in the FE soil model that is unable to simulate plastic strains with 220
increase in mean stress levels under constant deviatoric stress ratios (i.e. in compression dominated loading) and 221
partly to the uncertainty in the choice of K0 for the numerical analyses. A few simulations were repeated using a 222
reduced K0 of 0.4, as obtained using the original Jaky formulae reported in Mesri and Hayat (1993), instead of K0 223
= 0.5 (i.e. as was adopted initially). The lower K0 produces a twofold effect: firstly, it reduces p′ in the domain 224
and secondly, it affects the initial distance between the yield surface axis and the bounding surface, causing a 225
change in the hardening modulus. A few numerical simulations for RD = 30% and 70% and adopting both K0 = 226
0.4 and 0.5 are provided in Fig. 9(a) and Fig. 9(b) for strip anchors and circular anchors respectively. The lower 227
K0 results in a lower anchor capacity by a margin that lies between 2% and 5%, reducing slightly the disparity in 228
the numerically and experimentally determined N values. 229
Analytically determined 𝑁𝛾 values calculated using the limit equilibrium solutions of White et al. (2008) 230
for strip anchors and Giampa et al. (2017) for circular anchors are shown on Fig. 7 and Fig. 8, selected as they 231
provide a simplified, hand-calculable method to account for stress level dependent ϕ, ψd and non-associated flow. 232
Although the two methods differ slightly in the treatment of the mobilised shear resistance (White et al. (2008) 233
assumes constancy of normal stress on slip planes whereas Giampa et al. (2017) assumes a ϕ and ψd dependent 234
1 Hao et al. (2018) concluded that there was no discernible difference in the uplift capacity of helical and circular plates
Page 9 of 44
https://mc06.manuscriptcentral.com/cgj-pubs
Canadian Geotechnical Journal
Draft
shear stress on slip planes), they account for effects of density and stress in uplift capacity problems through the 235
use of element-level correlations of friction and dilation angles with relative density and stress level (Bolton 1986, 236
Chakraborty and Salgado 2010). The LE solutions produce higher 𝑁𝛾 values than the finite element simulations 237
in dense sand, and are in slightly poorer agreement with the experimental data. At a relative density, RD = 70%, 238
the LE solution and FE simulations are in good agreement for circular anchors, whereas for strip anchors the LE 239
solution results in higher 𝑁𝛾 values than the finite element simulations. This indicates that the treatment of normal 240
stresses on slip plane is handled more appropriately by Giampa et al. (2017) than by White et al. (2008), consistent 241
with arguments by Smith (2012). When relative density increases to RD = 85% (circular anchors, Fig. 7(c)) the FE 242
simulations and the LE solution diverge, with the LE solution resulting in higher 𝑁𝛾 values that are in slightly 243
poorer agreement with the measurements than the FE simulations. This suggests that, for potential use in 244
progressive failure problems, there are shortcomings associated with direct use of Bolton’s correlations (Bolton 245
1986, 1987), as they may prescribe a stronger increase in ϕ and ψd with RD than is appropriate. At low relative 246
densities (RD = 30%, Fig. 8) the LE solution and the FE simulations are in close agreement, presumably as ψd 247
would be close to zero in both approaches. 248
Deformation and shear strain contours at peak capacity for strip and circular anchors 249
Fig. 10 shows contours of normalised incremental octahedral plastic shear strain (∆𝛾𝑜𝑐𝑡𝑝
/∆𝛾𝑜𝑐𝑡_𝑚𝑎𝑥𝑝
) together 250
with normalised soil displacement (𝛿𝑠𝑜𝑖𝑙/𝛿, where 𝛿 and 𝛿𝑠𝑜𝑖𝑙 are anchor and soil displacement respectively) at 251
peak capacity for a strip anchor with B = 2 m at H/B = 2 and 4, and at relative densities of RD = 30% and 85%. 252
The failure mechanism observed from the displacement contours (in red dashed lines) resembles those observed 253
in model tests on shallowly buried pipes in sand (Cheuk et al. 2008), involving an inverted trapezoidal block 254
bounded by distributed shear zones curving outwards and widening towards the soil surface, with no observable 255
movements beneath the plate. The displacement field becomes wider as the relative density increases and as the 256
stress level reduces (i.e. at shallower depths), consistent with the higher dilation angle that would apply to such 257
conditions. Fig. 10 also shows for a strip anchor at H/B = 2, vertical displacement of the soil from the plate level 258
to the soil surface is similar to the anchor displacement (𝛿𝑠𝑜𝑖𝑙/ 𝛿 > 0.9), whereas for a circular plate at the same 259
embedment depth (Fig. 11) vertical displacement reduces with height above the plate, reaching 𝛿𝑠𝑜𝑖𝑙/𝛿 = 0.5 and 260
0.8 at the soil surface for RD = 30% and 85% respectively. The lower magnitude of soil displacement at shallow 261
depths observed for the circular anchor is indicative of the lower kinematic constraint associated with the three-262
dimensional failure mechanism for this axisymmetric problem. Hence, the ‘rigid block’ mechanism appears less 263
Page 10 of 44
https://mc06.manuscriptcentral.com/cgj-pubs
Canadian Geotechnical Journal

Draft
applicable to circular anchors than to strip anchors, although as the strip anchor embedment depth increases to 264
H/B = 4, the magnitude of soil displacement also reduces close to the soil surface (to 𝛿𝑠𝑜𝑖𝑙/𝛿 = 0.43 and 0.75 for 265
RD = 30% and 85% respectively; Fig. 10(c) and Fig. 10 (d)). 266
The inclination of the intense plastic shear strain bands (measured to the vertical) for strip anchors indicates 267
the mobilised peak dilation angle, which is approximately ψd = 6° and 17° for RD = 30% and 85% respectively at 268
H/B = 2, reducing to ψd = 5° and 15° at H/B = 4. The lower kinematic restraint for circular anchors results in shear 269
strain band inclinations that are slightly lower at around 2° and 15° respectively for RD = 30% and 85% at H/D = 270
2, and serve as an indication, rather than a measure, of the mobilised dilation angle. However, both mechanisms 271
portray that the shear bands do not extend fully to the soil surface, particularly at deeper depths (see Fig. 10(c,d)), 272
which implies that shear resistance may not be fully mobilised along the entire length of the slip plane. Fig. 10 273
and Fig 11 also show that the orientation of the zone of intense shearing is remarkably different from the deforming 274
curved soil bands (shown by the dashed lines), and more so as plate embedment depth increases. 275
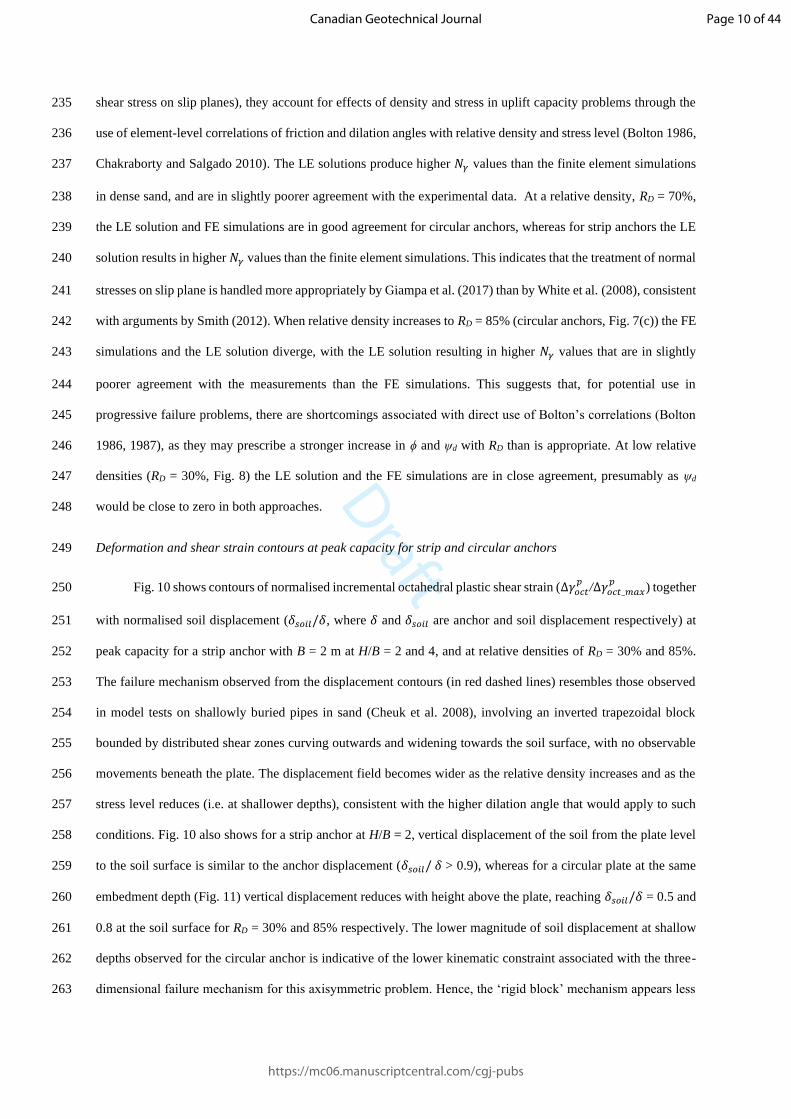
Variation of friction angle (𝜙) in the domain 276
Fig. 12(a) shows contours of friction angle (𝜙 = sin−1(𝜎1−𝜎3
𝜎1+𝜎3)) at peak capacity for a strip anchor with B 277
= 2 m at H/B = 4 and in sand of relative density, RD = 30% and 85%. The numerical simulations show that the 278
value of ϕ mobilised in a rectangular block of soil extending a distance 2B above the strip anchor is relatively 279
constant and is in the range ϕ = 29° to 36° for RD = 30% and ϕ = 34° and 41° for RD = 85%. Compared with Fig. 280
10, this rectangular block corresponds to the zone of soil moving at approximately the same velocity as the anchor 281
(i.e. attaining the same total displacement). Concentrations of contour lines at higher ϕ values occur in shear zones 282
adjacent to this rectangular block, at approximately ϕ = 38° for RD = 30% and ϕ = 47° for RD = 85%. The higher 283
ϕ in the shear bands is due to a combination of change in Lode angle (θ) of the loading direction (creating a stress 284
anisotropy) and non-normal loading with respect to the fabric (creating a fabric anisotropy) captured in the FE 285
model. Therefore, this observation of distinct banding is markedly different from limit analysis studies by Khatri 286
and Kumar (2011), which did not explicitly account for loading and fabric anisotropy. There is also a higher ϕ 287
mobilised at shallow depths on account of the lower stresses. 288
It is also instructive to examine the mobilised ϕ along the slip planes inclined at an angle of dilation as 289
predicted using the White et al. (2008) LE solution. As previously shown in Fig. 10, the FE simulations result in 290
ψd = 15° and 5° for RD = 85% and RD = 30% respectively, whereas Bolton’s (1986) correlations result in ψd = 291
21.4° and 3.5° for RD = 85% and RD = 30% respectively (assuming p′ = σ′vo as suggested in White et al. 2008). 292
Page 11 of 44
https://mc06.manuscriptcentral.com/cgj-pubs
Canadian Geotechnical Journal
Draft
ψd values from the numerical simulations (determined at the centroid of each element) along a slip plane inclined 293
at the LE ψd values (as indicated by the dashed lines in Fig. 12(a)) are plotted in Fig. 12(b) with increasing distance 294
(zl /B along the slip plane) from the anchor. The FE results indicate that, even in the intense shearing zone close 295
to the anchor (say zl /B < 2), ϕ varies from 40° to 48° for the dense case (RD = 85%) and from 36° to 39° for the 296
loose case (RD = 30%) on account of a greater degree of progressive failure in the domain. Also shown in Fig. 297
12(b) are the LE peak friction angles determined using Bolton’s correlations, that would result in ϕ = 35° for RD 298
= 30% and 49° for RD = 85%. Evidently, there appears to be a higher average variation in mobilised ϕ between 299
the LE approach and the current FE simulations for the dense sand by a margin of ~6°, but by only about 1.5° for 300
the loose sand. This highlights clearly why a LE method relying on a single lumped value of ϕ is ill-suited for 301
calculating uplift capacity in dense sand. 302
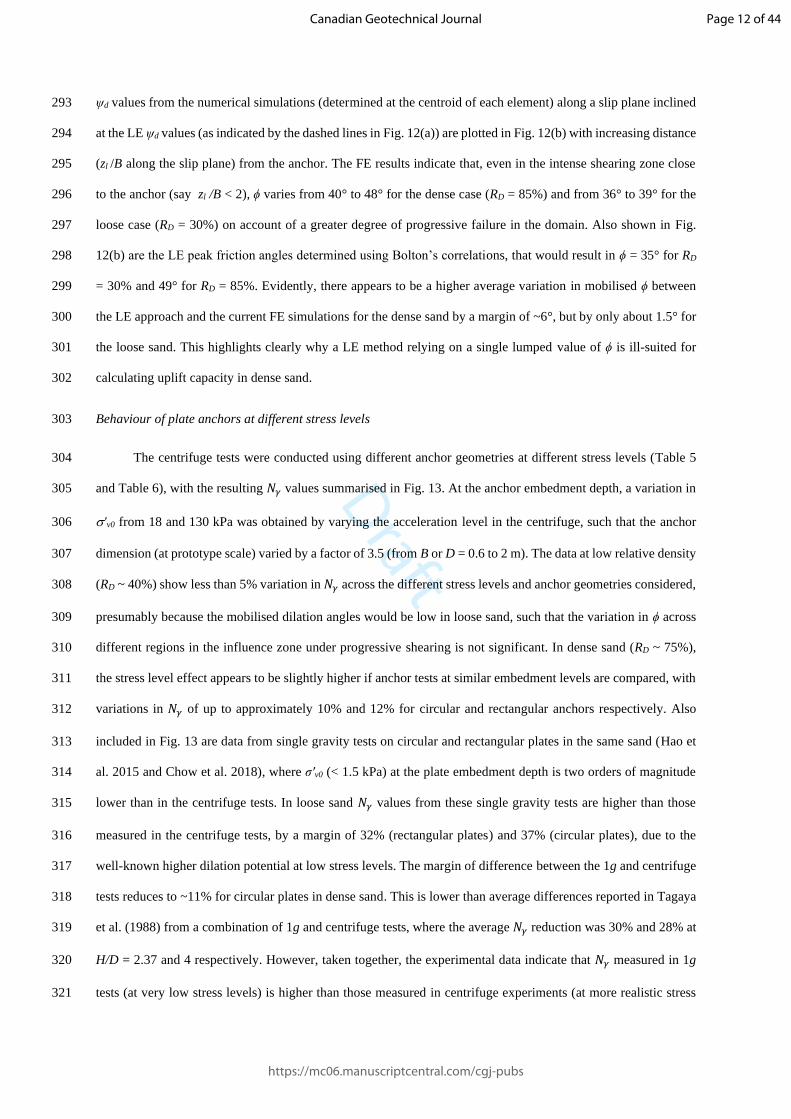
Behaviour of plate anchors at different stress levels 303
The centrifuge tests were conducted using different anchor geometries at different stress levels (Table 5 304
and Table 6), with the resulting 𝑁𝛾 values summarised in Fig. 13. At the anchor embedment depth, a variation in 305
'v0 from 18 and 130 kPa was obtained by varying the acceleration level in the centrifuge, such that the anchor 306
dimension (at prototype scale) varied by a factor of 3.5 (from B or D = 0.6 to 2 m). The data at low relative density 307
(RD ~ 40%) show less than 5% variation in 𝑁𝛾 across the different stress levels and anchor geometries considered, 308
presumably because the mobilised dilation angles would be low in loose sand, such that the variation in ϕ across 309
different regions in the influence zone under progressive shearing is not significant. In dense sand (RD ~ 75%), 310
the stress level effect appears to be slightly higher if anchor tests at similar embedment levels are compared, with 311
variations in 𝑁𝛾 of up to approximately 10% and 12% for circular and rectangular anchors respectively. Also 312
included in Fig. 13 are data from single gravity tests on circular and rectangular plates in the same sand (Hao et 313
al. 2015 and Chow et al. 2018), where σ′v0 (< 1.5 kPa) at the plate embedment depth is two orders of magnitude 314
lower than in the centrifuge tests. In loose sand 𝑁𝛾 values from these single gravity tests are higher than those 315
measured in the centrifuge tests, by a margin of 32% (rectangular plates) and 37% (circular plates), due to the 316
well-known higher dilation potential at low stress levels. The margin of difference between the 1g and centrifuge 317
tests reduces to ~11% for circular plates in dense sand. This is lower than average differences reported in Tagaya 318
et al. (1988) from a combination of 1g and centrifuge tests, where the average 𝑁𝛾 reduction was 30% and 28% at 319
H/D = 2.37 and 4 respectively. However, taken together, the experimental data indicate that 𝑁𝛾 measured in 1g 320
tests (at very low stress levels) is higher than those measured in centrifuge experiments (at more realistic stress 321
Page 12 of 44
https://mc06.manuscriptcentral.com/cgj-pubs
Canadian Geotechnical Journal

Draft
levels). This apparent scatter in 𝑁𝛾 at the same embedment depth can be reduced by simultaneously considering 322
stress level and relative density using a relative dilatancy term IR (= 𝑅𝐷(%)
100(10 − ln 𝑝′) − 1) (discussed later in 323
the paper). 324
Results from numerical simulations at different stress levels (covering B (or D) = 0.6 m to 5 m) are provided 325
in Fig. 14. As with the centrifuge data, the numerically determined 𝑁𝛾 values reduce with increasing stress level, 326
by an amount that increases with increasing relative density, and that is higher for circular anchors than strip 327
anchors. For strip anchors 𝑁𝛾 reduces by about 6.1% at RD = 85% and at H/B = 4 as B increases from 0.6 to 5 m 328
compared to a reduction that is within 1.5% at RD = 30%, broadly consistent with the reduction in 𝑁𝛾 observed in 329
the centrifuge tests on strip anchors. Stress level effects are higher in the numerical simulations of circular anchors 330
in dense sand (RD = 85%), with a reduction in 𝑁𝛾 of 24% at H/D = 3 as D increases from 0.6 to 5 m, compared to 331
a reduction of only 6.2% for RD = 30%. 332
Fig. 14 also shows corresponding results from analytical LE solutions from White et al. (2008) for strip 333
anchors (B = 1 and 5 m) and Giampa et al. (2017) for circular anchors (D = 1 and 5 m), which rely on element 334
level correlations for ϕ and ψd . The evidence in Fig. 14 suggests that the LE methods would be in good agreement 335
with the FE simulations at lower embedment ratios, where the extent of the failing soil mass remains relatively 336
small and the degree of progressive failure is low. However, the point of contrast is that the LE approaches predict 337
a much higher capacity reduction with increasing stress level than both the FE simulations and the experiments. 338
For example, the maximum change in the LE determined 𝑁𝛾 values for strip anchors is 22.6% at RD = 85% at H/B 339
= 4 (Fig. 14(d)), increasing to 28% for circular anchors at H/D = 3. This higher reduction in 𝑁𝛾 in the LE methods 340
is due to the over-simplistic assumption that the same mobilised ϕ applies along the shear surfaces at the point of 341
peak anchor capacity, whereas the FE approach allows the mechanism to develop progressively. 342
Modified limit equilibrium method for anchor uplift capacity in sand 343
Having demonstrated the performance of the FE model, this final section synthesises the FE results within 344
a modified limit equilibrium method that can be used to compute plate anchor capacity as an alternative to running 345
additional, and computationally intensive, FE simulations. 346
Assuming an inverted trapezoidal block mechanism for strip anchors and pipelines and separately 347
accounting for the resistance due to soil weight and shearing along the inclined slip planes (White et al. 2008), the 348
Page 13 of 44
https://mc06.manuscriptcentral.com/cgj-pubs
Canadian Geotechnical Journal
Draft
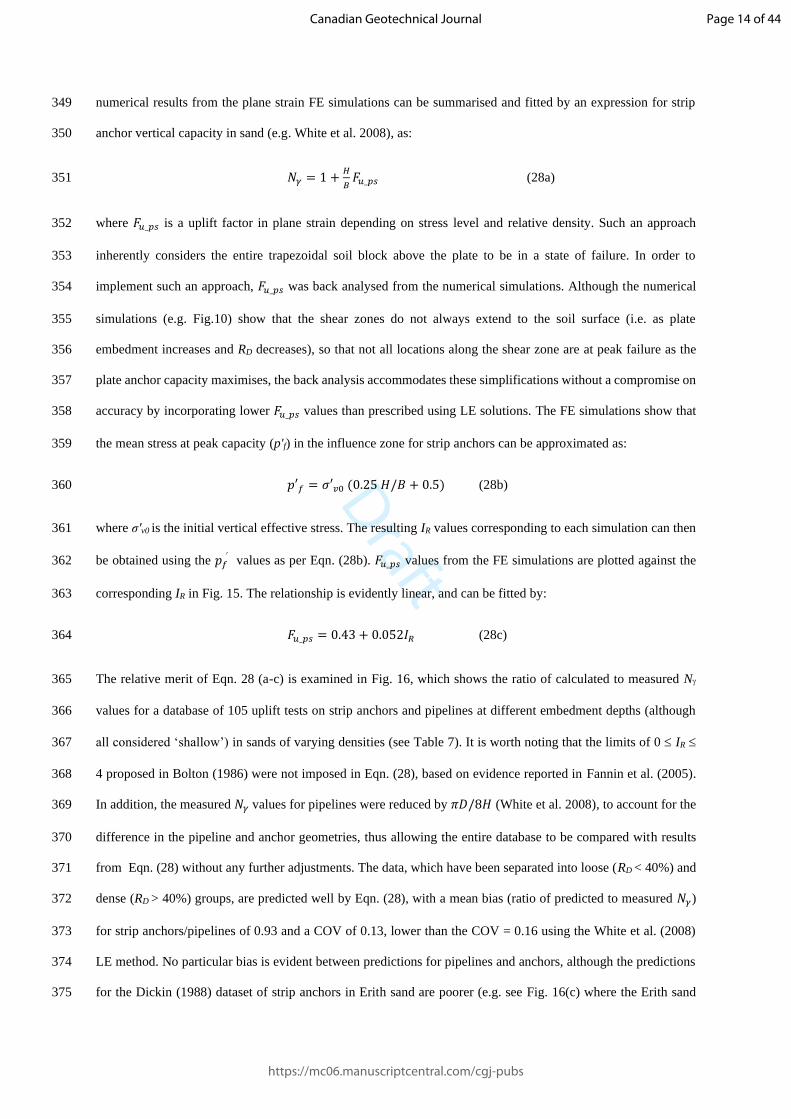
numerical results from the plane strain FE simulations can be summarised and fitted by an expression for strip 349
anchor vertical capacity in sand (e.g. White et al. 2008), as: 350
𝑁𝛾 = 1 +𝐻
𝐵𝐹𝑢_𝑝𝑠 (28a) 351
where 𝐹𝑢_𝑝𝑠 is a uplift factor in plane strain depending on stress level and relative density. Such an approach 352
inherently considers the entire trapezoidal soil block above the plate to be in a state of failure. In order to 353
implement such an approach, 𝐹𝑢_𝑝𝑠 was back analysed from the numerical simulations. Although the numerical 354
simulations (e.g. Fig.10) show that the shear zones do not always extend to the soil surface (i.e. as plate 355
embedment increases and RD decreases), so that not all locations along the shear zone are at peak failure as the 356
plate anchor capacity maximises, the back analysis accommodates these simplifications without a compromise on 357
accuracy by incorporating lower 𝐹𝑢_𝑝𝑠 values than prescribed using LE solutions. The FE simulations show that 358
the mean stress at peak capacity (p'f) in the influence zone for strip anchors can be approximated as: 359
𝑝′𝑓 = 𝜎′𝑣0 (0.25 𝐻/𝐵 + 0.5) (28b) 360
where σ′v0 is the initial vertical effective stress. The resulting IR values corresponding to each simulation can then 361
be obtained using the 𝑝𝑓′ values as per Eqn. (28b). 𝐹𝑢_𝑝𝑠 values from the FE simulations are plotted against the 362
corresponding IR in Fig. 15. The relationship is evidently linear, and can be fitted by: 363
𝐹𝑢_𝑝𝑠 = 0.43 + 0.052𝐼𝑅 (28c) 364
The relative merit of Eqn. 28 (a-c) is examined in Fig. 16, which shows the ratio of calculated to measured N 365
values for a database of 105 uplift tests on strip anchors and pipelines at different embedment depths (although 366
all considered ‘shallow’) in sands of varying densities (see Table 7). It is worth noting that the limits of 0 IR 367
4 proposed in Bolton (1986) were not imposed in Eqn. (28), based on evidence reported in Fannin et al. (2005). 368
In addition, the measured 𝑁𝛾 values for pipelines were reduced by 𝜋𝐷/8𝐻 (White et al. 2008), to account for the 369
difference in the pipeline and anchor geometries, thus allowing the entire database to be compared with results 370
from Eqn. (28) without any further adjustments. The data, which have been separated into loose (RD < 40%) and 371
dense (RD > 40%) groups, are predicted well by Eqn. (28), with a mean bias (ratio of predicted to measured 𝑁𝛾) 372
for strip anchors/pipelines of 0.93 and a COV of 0.13, lower than the COV = 0.16 using the White et al. (2008) 373
LE method. No particular bias is evident between predictions for pipelines and anchors, although the predictions 374
for the Dickin (1988) dataset of strip anchors in Erith sand are poorer (e.g. see Fig. 16(c) where the Erith sand 375
Page 14 of 44
https://mc06.manuscriptcentral.com/cgj-pubs
Canadian Geotechnical Journal

Draft
data plot at RD = 76%, or Fig. 16(d), where the Erith sand data are under predicted and plot between σ'v0 = 33 and 376
128 kPa), which is considered to be due to the high friction angles and dilating potential of this sand, rather than 377
an inherent difference in the response of a pipeline and strip anchor under uplift. 378
The limit of 0 IR 4 applies in the White et al. (2008) LE method, such that dense sand data at low p’ 379
levels (having IR > 4) in the database are capped at IR = 4 in the LE solution. An immediate consequence of this 380
is that the LE method would result in the same N values for highly dilative conditions associated with IR > 4. Fig. 381
16 shows that the simplified approach, which reflect the results from sophisticated FE simulations, lead to 382
comparable predictions as the LE solution for IR < 3 and slightly conservative estimates of capacities for IR > 3. 383
Taking the same assumption of a rigid block failure mechanism for a circular anchor (see Giampa et al. 384
2017) leads to: 385
𝑁𝛾 = 1 +𝐻
𝐷𝐹𝑢_𝑎𝑠1 + (
𝐻
𝐷)
2
𝐹𝑢_𝑎𝑠2 (29a) 386
where 𝐹𝑢_𝑎𝑠1 and 𝐹𝑢_𝑎𝑠1 are uplift factors that are dependent on IR. 𝐹𝑢_𝑎𝑠1 and 𝐹𝑢_𝑎𝑠2 were back analysed from the 387
FE simulations of circular anchors, with 𝑝𝑓′ taken as: 388
𝑝𝑓′ = 1.1 𝜎𝑣𝑜′(
𝐻
𝐷) (29b) 389
leading to the following expressions: 390
𝐹𝑢𝑎𝑠1= 1.32 + 0.03 𝐼𝑅 (29c) 391
𝐹𝑢𝑎𝑠2= 0.32 𝐼𝑅
0.3 (29d) 392
The performance of Eqn. (29) is examined in Fig. 17, which summarises the ratio of calculated to measured 393
N for a database of 56 tests (from four studies) on circular plate (or helix) anchors in different sands of varying 394
densities and at embedment depths up to H/D < 6 (see Table 7). The mean of the ratio of predicted to measured 395
𝑁𝛾 values is 0.91 with a COV of 0.19, significantly lower than the COV of 0.29 obtained using the Giampa et al 396
(2017) LE method. Although the Giampa et al. (2017) LE method for circular anchors appears to perform less 397
well than the White et al. (2008) LE method for strip anchors (or pipelines), the treatment of shear stresses on the 398
slip planes differs in the two approaches, so that the former should not be viewed as an axisymmetric equivalent 399
of the latter and insights regarding the appropriateness of each approach cannot be drawn from the comparisons 400
with predictions obtained using Eqns. 28 and 29. Fig. 17 indicates that Eqn. (29) does not lead to any evident bias 401
Page 15 of 44
https://mc06.manuscriptcentral.com/cgj-pubs
Canadian Geotechnical Journal

Draft
with relative density, embedment depth or stress level, unlike the LE method, which significantly overpredicts 402
capacities at higher relative densities associated with IR > 3.5 or at higher stress levels. 403
In summary, adopting the simplified assumption of a rigid block mechanism for shallowly embedded plate 404
anchors, together with uplift factors that reflect progressive failure along slip planes leads to better overall 405
estimates of anchor capacity than existing LE methods. 406
Conclusions 407
The capacity of vertically loaded horizontal plate anchors at shallow embedment in sand has been studied 408
both numerically, using a bounding surface plasticity model, and experimentally, through a series of centrifuge 409
tests. Both the numerical and experimental investigations considered the effects of plate geometry (circular, 410
rectangular and strip), sand densities (in the range RD = 30% - 85%), embedment depths (up to H/B and H/D = 4) 411
under initial overburden stress levels varying from 18 to 130 kPa. The key findings from this study are as follows: 412
• The experimental data indicates that N for strip and circular anchors increases with embedment ratio, and 413
that the rate of increase is stronger for circular anchors than for strip anchors. Corresponding FE simulations 414
were able to reproduce peak capacity for plates in dense sand within an average margin of ~10%, whereas 415
the agreement in loose sand was over-predicted by an average margin of 23%, due mainly to the open cone 416
yield surface in the bounding surface model. 417
• The numerical displacement contours at peak anchor capacity resembled an inverted trapezoidal block 418
bounded by distributed shear zones curving outwards towards the soil surface, the extent of which was 419
influenced by relative density, embedment ratio and anchor shape. 420
• The corresponding normalised octahedral plastic shear strain contours mobilised at peak capacity showed 421
inclinations of the shear bands in the range 5° - 6° and 15° - 17° for RD = 30% and 85% respectively. The 422
shear bands do not extend fully to the soil surface, particularly as anchor embedment increases, implying that 423
shear resistance may not be fully mobilised along the entire length of the slip plane. 424
• The FE simulations show that the mobilised friction angles along the slip planes vary by around 8° in dense 425
sand, but only by about 1.5° in loose sand. This is considered to arise from progressive failure, which implies 426
that methods that assume a fully mobilised friction and dilation angle along slip planes would produce non-427
conservative estimates of anchor capacity in dense sand, unless the methods are calibrated to account for this. 428
Page 16 of 44
https://mc06.manuscriptcentral.com/cgj-pubs
Canadian Geotechnical Journal

Draft
• Both the experiments and the FE simulations indicate a small reduction in anchor factor with increasing stress 429
level, with a higher stress level dependence observed for circular anchors than for strip anchors. Existing LE 430
methods result in a much higher and unrealistic effect of stress level, owing to the over-simplistic assumption 431
of a uniform mobilised friction angle along the slip planes. 432
• An analytical solution, based on the same rigid block mechanism assumed in LE methods but encompassing 433
the results from the FE simulations, provides better agreement with a large database of anchor and pipeline 434
tests than existing LE methods, particularly for circular plate anchors. The agreement level could be improved 435
further by treating soil compressibility and the initial stress field in the bounding surface plasticity model 436
more appropriately for loose sand states. 437
Acknowledgements 438
This work forms part of the activities of the Centre for Offshore Foundation Systems (COFS), currently 439
supported by the Lloyd's Register Foundation. The Lloyd’s Register Foundation invests in science, engineering 440
and technology for public benefit, worldwide. The first author would like to acknowledge the financial support 441
provided through an Australian Government Research Training Program Scholarship. The first author would also 442
like to thank Dong-Xue Hao from Northeast Dianli University of China for making available the anchor test 443
results in UWA silica sand. 444
List of notation 445
δ Anchor displacement
δsoil Soil displacement
∆𝛾𝑜𝑐𝑡𝑝
Incremental octahedral plastic shear strain
σ1, σ2, σ3 Three major principal stresses
γ' Effective unit weight of soil
σ′vo Initial effective overburden stress at anchor level
ϕc Critical state friction angle
ϕ Soil friction angle
ψd Soil dilation angle
τf Shear stress
θ Lode angle
ψ State parameter
A Area of the plate anchor
B Plate width (strip and rectangular anchors)
Page 17 of 44
https://mc06.manuscriptcentral.com/cgj-pubs
Canadian Geotechnical Journal

Draft
D Plate diameter (circular anchors)
d50 Median particle size
e Void ratio
Fu_ps Uplift factor in plane strain conditions
Fu_as1, Fu_as2 Uplift factor in axisymmetric condition
g Centrifuge acceleration level
H Embedment depth of the anchor plate
IR Relative dilatancy index
j Fitting constant
K0 Coefficient of earth pressure
L Plate length (strip and rectangular anchors)
Nγ Anchor factor
p′ Mean effective stress
qu Peak anchor capacity
qc Cone tip resistance
RD Relative density
Sf Shape factor
t Thickness of plate anchor
z Depth
zl Distance of soil element from the anchor edge
446
References
Ansari, Y., Kouretzis, G. and Sloan, S.W. 2018. Development of a prototype for modelling soil–pipe interaction
and its application for predicting uplift resistance to buried pipe movements in sand. Canadian Geotechnical
Journal, 55(10), pp.1451–1474.
Arthur, J.R.F. and Menzies, B.K. 1972. Inherent Anisotropy in a sand. Géotechnique, 22(1), pp.115–128.
Bolton, M.D. 1986. The strength and dilatancy of sands. Géotechnique, 36(1), pp.65–78.
Chakraborty, T. and Salgado, R. 2010. Dilatancy and Shear Strength of Sand at Low Confining Pressures. Journal
of Geotechnical and Geoenvironmental Engineering, 136(1), pp.527–532.
Cheuk, C.Y., White, D.J. and Bolton, M.D. 2008. Uplift Mechanisms of Pipes Buried in Sand. Journal of
Geotechnical and Geoenvironmental Engineering, 134(2), pp.154–163.
Chow, S.H. , Le, J., Forsyth, M. and O' Loughlin, C.D. 2018. Capacity of vertical and horizontal plate anchors in
Page 18 of 44
https://mc06.manuscriptcentral.com/cgj-pubs
Canadian Geotechnical Journal

Draft
sand under normal and shear loading. In International Conference on Physical Modelling in Geotechnics.
pp. 559–564.
Dafalias, Y.F. and Manzari, M.T. 2004. Simple Plasticity Sand Model Accounting for Fabric Change Effects.
Journal of Engineering Mechanics, 130(6), pp.622–634.
Dafalias, Y.F., Papadimitriou, A.G. and Li, X.S. 2004. Sand plasticity model accounting for inherent fabric
anisotropy. Journal of Engineering Mechanics, 130(11), pp.1319–1333.
Dickin, E.A. 1994. Uplift resistance of buried pipes in sand.Pdf. Soils and Foundations, 34(2), pp.41–48.
Dickin, E.A. and Laman, M. 2007. Uplift response of strip anchors in cohesionless soil. Advances in Engineering
Software, 38(8–9), pp.618–625.
Fannin, R.J., Eliadorani, A. and Wilkinson, J.M.T. 2005. Shear strength of cohesionless soils at low stress.
Géotechnique, 55(6), pp.467–478.
Frydman, S. and Shaham, I. 1989. Pullout capacity of slab anchors in sand. Canadian Geotechnical Journal,
26(3), pp.385–400.
Giampa, J., Bradshaw, A. and Schneider, J. 2017. Influence of Dilation Angle on Drained Shallow Circular
Anchor Uplift Capacity. International Journal of Geomechanics, 17(2), p.4016056.
Giampa, J.R., Bradshaw, A.S., Gerkus, G., Gilbert, R.B., Gavin, K.G. and Sivakumar, V. 2018. The effect of
shape on the pullout capacity of shallow plate anchors in sand. Géotechnique, pp.1–9.
Al Hakeem, N. and Aubeny, C. 2019. Numerical Investigation of Uplift Behavior of Circular Plate Anchors in
Uniform Sand. Journal of Geotechnical and Geoenvironmental Engineering, 145(9), p.04019039.
Hao, D. Wang, D., O’Loughlin, C.D. and Gaudin, C. 2018. Tensile monotonic capacity of helical anchors in sand:
interaction between helices. Canadian Geotechnical Journal, 3483, pp.1–33.
Hao, D., Fu, S. and Rong, C. 2014. Numerical Analysis of Uplift Capacity of Circular Plate Anchor in Sand.
Journal of geotechnical engineering, 19, pp.18947–18961.
Hao, D.X., Fu, S., Chen, R.,Zhang, Y. and Hou, L. 2015. Experimental investigation of uplift behavior of anchors
and estimation of uplift capacity in sands. Chinese Journal of Geotechnical Engineering, 37(11), pp.2101–
2106.
Page 19 of 44
https://mc06.manuscriptcentral.com/cgj-pubs
Canadian Geotechnical Journal

Draft
Ilamparuthi, K., Dickin, E.A. and Muthukrisnaiah, K. 2002. Experimental investigation of the uplift behaviour of
circular plate anchors embedded in sand. Canadian Geotechnical Journal, 39, pp.648–664.
Khatri, V.N. and Kumar, J. 2011. Effect of anchor width on pullout capacity of strip anchors in sand. Canadian
Geotechnical Journal, 48(3), pp.511–517.
Li, X.S. and Dafalias, Y.F. 2012. Anisotropic Critical State Theory: Role of Fabric. Journal of Engineering
Mechanics, 138(3), pp.263–275.
Li, X.S. and Wang, Y. 1998. Linear Representation of Steady-State Line for Sand. Journal of Geotechnical and
Geoenvironmental Engineering, 124(12), pp.1215–1217.
Liu, J.Y., Liu, M.L. and Zhu, Z.D. 2012. Sand Deformation around an Uplift Plate Anchor. Journal of
Geotechnical and Geoenvironmental Engineering, 138(6), pp.728–737.
Loukidis, D. and Salgado, R. 2009. Modeling sand response using two-surface plasticity. Computers and
Geotechnics, 36(1–2), pp.166–186.
Merifield, R.S. and Sloan, S.W. 2006. The ultimate pullout capacity of anchors in frictional soils. Canadian
Geotechnical Journal, 43(8), pp.852–868.
Merifield, R.S, Lyamin, A.V. and Sloan, S.W. 2006. Three-dimensional lower bound solutions for stability of
plate anchors in sand. Geotechnique, 56(2), pp.123-132.
Mesri, G. and Hayat, T.M. 1993. The coefficient of earth pressure at rest: Discussion. Canadian Geotechnical
Journal, 30(5), pp.647–666.
Murff, J.. D., Randolph, M., Elkhatib, S., Kolk, H.J., Ruinen, R., Storm, P.J. and Thorne, C. 2005. Vertically
loaded plate anchors for deepwater applications. In International symposium on Frontiers of Offshors
Geotecnics, Perth. pp. 31–48.
Murray, E.J. and Geddes, J.D. 1987. Uplift of anchor plates in sand. ASCE Journal of geotechnical engineering,
113(3), pp.202–215.
O’Loughlin, C.D. and Barron, B. 2012. Capacity and keying response of plate anchors in sand. 7th International
Conference Offshore Site Investigation and Geotechnics, pp.649–655.
O’Loughlin, C.D., Neubecker, S.R. and Gaudin, C. 2018. Anchoring Systems: Anchor Types, Installation and
Page 20 of 44
https://mc06.manuscriptcentral.com/cgj-pubs
Canadian Geotechnical Journal

Draft
Design. In Encyclopaedia of Marine and Offshore Engineering, Wiley.
Paikowsky, S.G., Player, C.M. and Connors, P.J. 1995. A dual interface appaartus for testing unrestricted friction
of a soil along solid surfacs. Geotechnical Testing Journal, 18(2), pp.168–193.
Papadimitriou, A.G., Dafalias, Y.F. and Yoshimine, M. 2005. Plasticity modelling of the effect of sample
preparation method on sand response. Soils and Foundations, 45(2), pp.109–123.
Petalas, A.L., Dafalias, Y.F. and Papadimitriou, A.G. 2019. SANISAND-FN: An evolving fabric-based sand
model accounting for stress principal axes rotation. International Journal for Numerical and Analytical
Methods in Geomechanics, 43(1), pp.97–123.
Rasulo, M.P., Schneider, J.A., Newgard, J.T. and Aubeny, C.P. 2017. Transition depths for deep circular anchors
in saturated sand. Proceedings of the 8th International conference of Offshore Site Investigation
Geotechnics. pp. 987–994.
Rowe, R.K. 1978. Soil structure interaction analysis and its application to the prediction of anchor plate
behaviour., PhD thesis, University of Sydney, Sydney, NSW, Asutralia
Rowe, R.K. and Davis, E.H. 1982. The behaviour of plate anchors in sand. Geotechnique, 32(1), pp.25–41.
Roy, A., Chow, S.H. , O’Loughlin, C.D. and Randolph, M.F. 2019. Effect of stress history and shallow embedment
on centrifuge cone penetration tests in sands, Proceedings of the 38th International Conference on Offshore
Mechanics and Arctic Engineering, Glasgow
Roy, A., Chow, S.H., O'Loughlin, C.D., Randolph, M.F. and Whyte, S. 2020. Use of a bounding surface model
in predicting element tests and capacity in simple boundary value problems. Canadian
Geotechnical Journal, doi.org/10.1139/cgj-2019-0841
Sheng, D., Sloan, S.W. and Yu, H.S. 2000. Aspects of finite element implementation of critical state models.
Computational Mechanics, 26(2), pp.185–196.
Sloan, S.W., Abbo, A.J. and Sheng, D. 2001. Refined explicit integration of elastoplastic models with automatic
error control. Engineering Computations, 18(1/2), pp.121–194.
Smith, C.C. 2012. Limit loads for a shallow anchor/ trapdoor embedded in a non-associative Coulomb soil.
Geotechnique, 62 (7), 563-571.
Page 21 of 44
https://mc06.manuscriptcentral.com/cgj-pubs
Canadian Geotechnical Journal
Draft
Tagaya, K., Scott, R.F. and Aboshi, H. 1988. Scale effects in anchor pullout test by centrifugal technique. Soils
and Foundations, 28(3).
Trautmann, C.H., O’Rourke, T.D. and Kulhawy, F.H. 1985. Uplift force-Displacement response of Buried pipe.
Journal of Geo- technical and Geoenvironmental Engineering, 111(9), pp.1061–1076.
Vaid, Y.P., Chung, E.K.F. and Kuerbis, R.H. 1990. Stress path and steady state. Canadian Geotechnical Journal,
27(1), pp.1–7.
Vermeer, P.A. and Sutjiadi, W. 1985. The uplift resistance of shallow embedded anchors. In Proc., of 11th Int.
Conf. of Soil Mechanics and Foundation Engineering, Balkema, Rotterdam, Netherlands. pp. 1635–1638.
White, D.J., Teh, K.L., Leung, C.F. and Chow, Y.K. 2008. A comparison of the bearing capacity of flat and
conical circular foundations on sand. Géotechnique, 58(10), pp.781–792.
White, D.J., Cheuk, C.Y. and Bolton, M.D. 2008. The uplift resistance of pipes and plate anchors buried in sand.
Géotechnique, 58(10), pp.771–779.
Table captions
Table 1: Governing equations for the bounding surface model
Table 2: Physical properties of UWA silica sand
Table 3 : Model parameters for UWA silica sand
Table 4: Details of the plate anchor models used in the experiments
Table 5: Test program and results in dense sand
Table 6: Test program and results in loose sand
Table 7 : Database of anchor and pipeline experiments
Page 22 of 44
https://mc06.manuscriptcentral.com/cgj-pubs
Canadian Geotechnical Journal

Draft
Figure captions
Fig. 1: (a) problem definition, (b) failure mechanism with vertical slip surface and (c) failure mechanism
with an inclined slip surface
Fig. 2 : Comparison of measured and simulated responses in UWA sand: (a) drained triaxial compression
tests (b) undrained triaxial extension tests
Fig. 3 : Mesh details along with boundary conditions used in the strip anchor simulations
Fig. 4 : Experimental details: (a) testing arrangement, (b) plate anchor dimensions, and (c) model plates
used in the tests
Fig. 5: Measured cone tip resistance profiles before anchor testing in: (a) loose samples and (b) dense
samples
Fig. 6: Comparison of Nγ values measured in the current experiments on circular anchors with previously
reported experimental values in: (a) dense sand (b) loose sand
Fig. 7 : Comparison of measured and simulated anchor capacities in dense sand for: (a) strip anchors at RD
~ 70%, (b) circular anchors at RD ~ 70% and (c) circular anchors at RD ~ 85%
Fig. 8 : Comparison of measured and simulated anchor capacities in loose sand for: (a) strip anchors at RD
= 30% and (b) circular anchors at RD = 30%
Fig. 9 : Influence of different K0 values in the simulated FE responses in: (a) strip anchors and (b) circular
anchors
Fig. 10 :Normalised shear strain contours (Δγpoct /Δγp
oct_max) contrasted against normalised deformation
contours (δ/δsoil)at peak anchor capacity for strip anchors (B = 2 m): (a) H/B = 2, RD = 30% (b) H/B = 2, RD = 85%
(c) H/B = 4, RD = 30% (d) H/B = 4, RD = 85%
Fig. 11 : Normalised shear strain contours (Δγpoct /Δγp
oct_max) contrasted against normalised deformation
contours (δ/δsoil) at peak anchor capacity for circukar anchors (H/D = 2, D = 2 m): (a) RD = 30% and (b) RD = 85%
Fig. 12 : Variation in mobilised friction angle at peak anchor capacity for strip anchors (B = 2 m, H/B = 4):
(a) entire domain for RD = 85% and R
D = 30%, (b) along slip planes inclined at the angle of dilation from the
White et al. (2008) LE method
Page 23 of 44
https://mc06.manuscriptcentral.com/cgj-pubs
Canadian Geotechnical Journal

Draft
Fig. 13 : Measured Nγ values from anchor tests in UWA silica sand with different plate dimensions: (a)
circular anchors, (b) rectangular anchors and (c) strip anchors
Fig. 14: Anchor capacity factors from FE and LE at different relative densities and initial stress levels
Fig. 15 : Fitting of Fu_ps from the FE simulations in strip anchors
Fig. 16 : Comparison between predicted and measured Nγ for plane strain uplift for (a) variation in IR (b)
variation in H/B (c) variation in RD (d) variation in initial vertical stress
Fig. 17 : Comparison between predicted and measured Nγ for circular anchors for (a) variation in IR (b)
variation in H/D (c) variation in RD (d) variation in initial vertical stress
Page 24 of 44
https://mc06.manuscriptcentral.com/cgj-pubs
Canadian Geotechnical Journal

Draft
Table 1: Governing equations for the bounding surface model
Parameters Description Governing equations (Eqn. No) Notes/Reference
eo
Controls the intercept of the
CSL at very low mean stress
levels in e- (p’/Pa)ξ space
𝑒𝑐 = 𝑒𝑜 − 𝜆𝑐 (𝑝′
𝑃𝑎⁄ )
𝜉
(1)
𝜓 = (𝑒 − 𝑒𝑐) (2)
Li and Wang
(1998), Dafalias
and Manzari
(2004)
λc Controls the slope of the CSL
in e- (p’/Pa) ξ space
ξ Influences the linearisation of
the CSL with p'
M Controls critical state stress
ratios in triaxial compression
c1 Controls critical state stress
ratio in triaxial extension
G0 Elastic shear modulus 𝐺 = 𝐺0𝑝𝑎𝑡(2.97−𝑒)2
(1+𝑒)(
𝑝′
𝑃𝑎)
1/2
(3)
𝐾 = 𝐺 2(1+𝜈)
3(1−2𝜈) (4)
𝑑휀𝑒𝑒 = 𝑑𝑠/2𝐺 (5)
𝑑휀𝑣𝑒 = 𝑑𝑝/𝐾 (6)
Dafalias and
Manzari (2004)
ν Poisson’s ratio
m Controls the size of the yield
surface 𝑓 = [(𝐫 − 𝛂): (𝐫 − 𝛂) ]1/2 − √2
3⁄ 𝑚 = 0 (7) Dafalias and
Manzari (2004)
nd, nb
Influences the mobilised
stress ratio at peak friction
angle and at phase
transformation
𝛂𝛉𝐚 = √
2
3(𝑀𝜃
𝑎 − 𝑚)𝒏 (a = b, d, c) (8)
𝑀𝜃𝑐 = 𝑔1(𝜃, 𝑐1)𝑀 (9)
𝑔1(𝜃, 𝑐1) = (2𝑐1
4
((1+𝑐14)−(1−𝑐1
4) cos 3𝜃))
1/4
(10)
𝑀𝜃𝑏 = [𝑀𝜃
𝑐 exp(−𝑛𝑏 𝜓𝑓)] (11)*
𝑀𝜃𝑑 = [𝑀𝜃
𝑐 exp(𝑛𝑑𝜓𝑓)] (12)*
Dafalias and
Manzari (2004),
Sheng et al.
(2000)
ch , hin Plastic modulus constants
𝐾𝑝 =2
3𝑝′ℎ(𝛂𝛉
𝐛 − 𝛂): 𝐧 (13)
ℎ =𝑏𝑜
(𝛂−𝛂𝐢𝐧):𝐧 (14)
𝑏𝑜 = ℎ0𝐺0(1 − 𝑐ℎ𝑒) (𝑝′
𝑃𝑎)
−1/2
(15)
ℎ0 = ℎ𝑖𝑛 𝑓ℎ (16)*
Dafalias et
al.(2004)
Page 25 of 44
https://mc06.manuscriptcentral.com/cgj-pubs
Canadian Geotechnical Journal
Draft
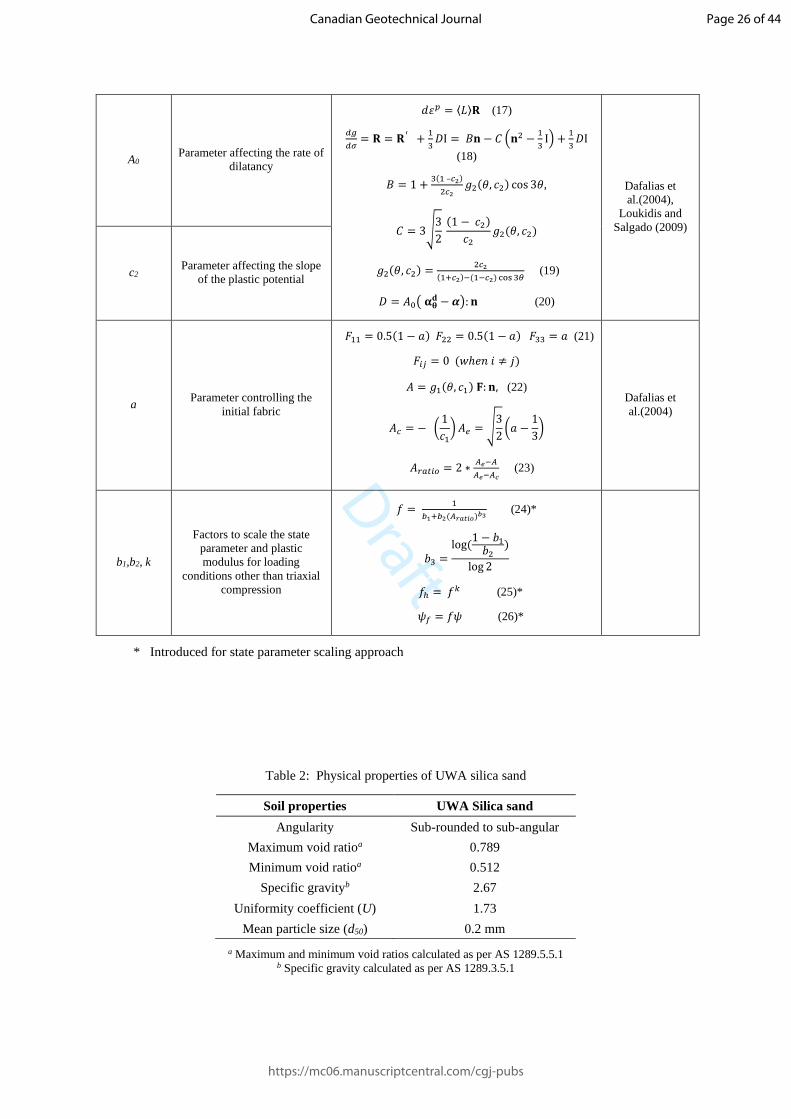
A0 Parameter affecting the rate of
dilatancy
𝑑휀𝑝 = ⟨𝐿⟩𝐑 (17)
𝑑𝑔
𝑑𝜎= 𝐑 = 𝐑′ +
1
3𝐷I = 𝐵𝐧 − 𝐶 (𝐧2 −
1
3I) +
1
3𝐷I
(18)
𝐵 = 1 +3(1 –𝑐2)
2𝑐2𝑔2(𝜃, 𝑐2) cos 3𝜃,
𝐶 = 3√3
2 (1 − 𝑐2)
𝑐2𝑔2(𝜃, 𝑐2)
𝑔2(𝜃, 𝑐2) =2𝑐2
(1+𝑐2)−(1−𝑐2) cos 3𝜃 (19)
𝐷 = 𝐴0( 𝛂𝛉𝐝 − 𝜶): 𝐧 (20)
Dafalias et
al.(2004),
Loukidis and
Salgado (2009)
c2 Parameter affecting the slope
of the plastic potential
a Parameter controlling the
initial fabric
𝐹11 = 0.5(1 − 𝑎) 𝐹22 = 0.5(1 − 𝑎) 𝐹33 = 𝑎 (21)
𝐹𝑖𝑗 = 0 (𝑤ℎ𝑒𝑛 𝑖 ≠ 𝑗)
𝐴 = 𝑔1(𝜃, 𝑐1) 𝐅: 𝐧, (22)
𝐴𝑐 = − (1
𝑐1) 𝐴𝑒 = √
3
2(𝑎 −
1
3)
𝐴𝑟𝑎𝑡𝑖𝑜 = 2 ∗𝐴𝑒−𝐴
𝐴𝑒−𝐴𝑐 (23)
Dafalias et
al.(2004)
b1,b2, k
Factors to scale the state
parameter and plastic
modulus for loading
conditions other than triaxial
compression
𝑓 = 1
𝑏1+𝑏2(𝐴𝑟𝑎𝑡𝑖𝑜)𝑏3 (24)*
𝑏3 =log(
1 − 𝑏1𝑏2
)
log 2
𝑓ℎ = 𝑓𝑘 (25)*
𝜓𝑓 = 𝑓𝜓 (26)*
* Introduced for state parameter scaling approach
Table 2: Physical properties of UWA silica sand
Soil properties UWA Silica sand
Angularity Sub-rounded to sub-angular
Maximum void ratioa 0.789
Minimum void ratioa 0.512
Specific gravityb 2.67
Uniformity coefficient (U) 1.73
Mean particle size (d50) 0.2 mm
a Maximum and minimum void ratios calculated as per AS 1289.5.5.1 b Specific gravity calculated as per AS 1289.3.5.1
Page 26 of 44
https://mc06.manuscriptcentral.com/cgj-pubs
Canadian Geotechnical Journal

Draft
Table 3 : Model parameters for UWA silica sand
Parameters Symbol Value
Elastic properties G0 135
ν 0.14*
Critical state properties
eo 0.812
λ 0.0189
ξ 0.7
M 1.296
c1 0.7
Yield surface m 0.05*
Parameter for plastic
potential gradient c2 0.78*
Parameters influencing
plastic modulus
h0 7.5
ch 1.01
nb 2.0
Parameters influencing
dilatancy
A0 0.84
nd 3.4
Anisotropy and state
parameter scaling
parameters
a 0.27
b1 2.5
b2 -0.833*
k 1.5
*Assumed
Table 4: Details of the plate anchor models used in the experiments
Anchor
code
Anchor
geometry Material
Width, B or
diameter, D
(mm)
Plate
length, L
(mm)
Anchor
thickness,
t (mm)
Plate
mass (g)
ST1 Strip Steel 20 160 5 152.26
ST2 Strip Steel 20 160 5 152.79
ST3 Strip Steel 20 160 5 151.72
R1 Rectangular Aluminium 20 40 4 39.13
R2 Rectangular Aluminium 20 40 4 38.86
R3 Rectangular Aluminium 20 40 4 38.88
R4 Rectangular Steel 30 60 5 98.07
R5 Rectangular Steel 30 60 5 99.76
C1 Circular Steel 30 3 47.27
C2 Circular Steel 30 3 47.1
C3 Circular Steel 30 3 44.82
Page 27 of 44
https://mc06.manuscriptcentral.com/cgj-pubs
Canadian Geotechnical Journal

Draft
Table 5: Test program and results in dense sand
Sample
no.
Relative
density,
RD (%)
Unit
weight, γ′
(kN/m3)
Anchor
code
g-
level
Embedment
ratio, H/B
Peak mobilised
anchor capacity,
qu (kPa)
Anchor factor,
Nγ = qu/γ′H
D1 76.72 16.61
ST3 30 1.95 43.73 2.28
ST2 30 1.95 41.01 2.14
ST1 50 1.95 69.39 2.18
R2 30 2.00 67.42 3.49
R3 50 2.00 108.10 3.37
R1 100 2.05 222.24 3.38
D2 73.5 16.52
ST2 30 2.70 65.93 2.51
ST3 50 2.70 100.57 2.30
R2 30 2.70 96.62 3.73
R3 50 2.95 179.19 3.82
R1 100 2.68 275.53 3.25
C1 33.3 1.80 119.94 4.18
C2 66.6 1.80 195.02 3.43
D3 75.28 16.58
ST1 30 3.95 159.61 4.17
ST2 50 3.95 253.20 3.99
R3 30 4.00 270.98 7.11
R1 50 4.00 401.73 6.34
R2 100 4.00 776.96 6.15
C1 33.3 2.70 313.55 7.32
C2 66.6 2.70 566.40 6.68
D4 75.14 16.57
ST1 30 3.85 149.96 4.01
ST2 50 3.96 230.16 3.60
R1 30 3.81 217.58 5.98
R3 50 3.95 369.20 5.89
R2 100 3.85 680.84 5.59
C1 33.3 2.53 253.95 6.31
C2 66.6 2.57 494.68 6.12
D5* 69.53 16.41 R4 20 1.80 50.77 2.96
C3 20 1.93 78.28 4.33
D6* 71.1 16.45 R5 20 3.03 123.29 4.29
C3 20 2.90 223.65 8.28
D7* 74.35 16.54 R4 20 3.77 232.50 6.55
* Samples prepared for inclined loading tests; only vertical uplift tests from these boxes are reported here
Page 28 of 44
https://mc06.manuscriptcentral.com/cgj-pubs
Canadian Geotechnical Journal

Draft
Table 6: Test program and results in loose sand
Sample
no.
Relative
density,
RD (%)
Unit
weight, γ′
(kN/m3)
Anchor
code
g-
level
Embedment
ratio, H/B
Peak mobilised
anchor capacity,
qu (kPa)
Anchor factor,
Nγ = qu/γ′H
L1 42.8 15.68
ST2 30 1.75 21.24 1.31
ST3 50 1.75 35.80 1.33
ST1 100 1.75 67.52 1.26
R3 30 1.80 33.05 2.01
R2 50 1.80 51.87 1.90
R1 100 1.85 105.80 1.90
L2 48.9 15.84
ST2 30 2.75 40.07 1.56
ST1 50 2.75 68.09 1.60
ST3 100 2.75 133.29 1.56
R1 30 2.8 52.01 1.98
R2 50 2.75 118.37 2.82
R5 20 1.90 40.03 2.29
R4 33.3 1.83 49.40 1.72
C1 33.3 1.90 77.25 2.61
L3 45.7 15.76
ST2 30 3.60 79.26 2.38
ST3 50 3.85 138.38 2.35
ST1 75 3.70 190.41 2.25
R3 30 3.80 135.60 3.93
R2 50 3.80 220.65 3.86
R1 100 3.73 420.67 3.75
C1 33.3 2.53 179.87 4.70
C2 66.6 2.53 356.09 4.70
L4* 47.35 15.8 R4 20 1.83 35.81 2.13
C3 20 1.90 40.91 2.39
L5* 47.37 15.79 R4 20 2.87 86.78 3.33
C3 20 2.77 103.88 4.19
L6* 48.67 15.83 R4 20 4.07 165.28 4.51
C3 20 3.90 209.38 6.04
* Samples prepared for inclined loading tests; only vertical uplift tests from these boxes are reported here
Page 29 of 44
https://mc06.manuscriptcentral.com/cgj-pubs
Canadian Geotechnical Journal

Draft
Table 7 : Database of anchor and pipeline experiments
Source Test type g -
level
Plate or
pipe
dimension
, B or D*
(mm)
Unit weight,
γ′ (kN/m3)
Relative
density,
RD (%)
Embedment
ratio, H/B
or H/D
Relative
dilatancy
index, IR
Rowe (1978) Anchor 1 g 51 14.75 - 15.3 18 – 38 1.0 – 6.0 0.6 – 2.7
Murray and Geddes
(1987)
Anchor 1 g 50.8 15.3 42 1.0 – 6.0 2.8 – 3.6
Rowe and Davis (1982) Anchor 1 g 51 14.75 - 15.3 18 – 38 1.0 – 6.0 1.0 – 2.7
Dickin (1988) Anchor 40 g 1000 14.24 - 16 33, 76 1.0 – 8.0 0.5 – 4.7
Dickin (1994) Pipe 40 g 1000 14.24 - 16 33, 76 1.6 – 5.6 0.9 – 4.4
Dickin (1994) Pipe 1 g 25 – 1000 14.24 - 16 33, 76 3.5 2.8 – 6.1
Trautmann et al. (1985) Pipe 1 g 102 16.4 - 17.7 36, 81 1.5 – 8.0 0.0 – 5.2
Ansari et al. (2018) Pipe 1 g 75 15.03 - 16.1 22, 63 1.5 – 4.0 1.2 – 4.1
White et al. (2001) Pipe 10 g 220 8.25 16 – 70 3.14 0.5 – 5.2
Hao et al. (2018) Helix, plate 20 g 400 16.87 86 3-6 3.4 – 5.6
Giampa et al.(2017) Helix 1 g 152 15.2 - 15.6 32 – 45 1.8-5 1.2 – 2.3
Ilamparuthi et al.(2002) Plate 1 g 100 – 400 15.5 - 17 39 – 74 0.85-5 1.3 – 6.0
Rasulo et al. (2017) Helix 1 g 50 – 254 15.2- 16.1 32 – 60 1.8-5 1.2 – 3.0
* at prototype scale. Note that all tests except for White et al. (2001) were conducted in dry sands
Page 30 of 44
https://mc06.manuscriptcentral.com/cgj-pubs
Canadian Geotechnical Journal

Draft
Fig. 1: (a) problem definition, (b) failure mechanism with vertical slip surface and (c) failure mechanism with an
inclined slip surface
Fig. 2 : Comparison of measured and simulated responses in UWA sand: (a) drained triaxial
compression tests (b) undrained triaxial extension tests
(a)
(b)
(c)
Page 31 of 44
https://mc06.manuscriptcentral.com/cgj-pubs
Canadian Geotechnical Journal

Draft
Fig. 3 : Mesh details along with boundary conditions used in the strip anchor simulations
Fig. 4 : Experimental details: (a) testing arrangement, (b) plate anchor dimensions, and (c) model plates
used in the tests
3B
B varies
Strip anchor
Length varies (with H)
H
Length varies (with H)
(a) (b)
Note:
• Figure not to scale.
• All dimensions are in mm.
Circular
plate anchor
Strip anchor
Rectangular plate
anchor
(c)
Page 32 of 44
https://mc06.manuscriptcentral.com/cgj-pubs
Canadian Geotechnical Journal
Draft
Fig. 5: Measured cone tip resistance profiles before anchor testing in: (a) loose samples and (b) dense
samples
0.0
0.5
1.0
1.5
2.0
2.5
3.0
0.0 0.6 1.2 1.8 2.4 3.0
Pro
toty
pe d
ep
th, z
(m)
Cone tip resistance, qc (MPa)
Sample L1Sample L2Sample L3Sample L4Sample L5Sample L6
L1
L3
L2
L5
L4
L6
Dashed lines: Location of anchors
(a)
0.0
0.5
1.0
1.5
2.0
2.5
3.0
0.0 1.5 3.0 4.5 6.0
Pro
toty
pe
dep
th, z
(m)
Cone tip resistance, qc (MPa)
Sample D1Sample D2Sample D3Sample D4Sample D5Sample D6Sample D7
D6
D3, D4
D5
D1
D7
D2
Dashed lines: Location of anchors (b)
0.0
0.5
1.0
1.5
2.0
2.5
3.0
020406080100
Pro
toty
pe
dep
th,
z(m
)
Relative density, RD (%))
L3
L2
L1
L4
L6
L5
0.0
0.5
1.0
1.5
2.0
2.5
3.0
020406080100
Pro
toty
pe
de
pth
, z
(m)
Relative density, RD (%)
D6
D3, D4
D5
D1
D7
D2
Page 33 of 44
https://mc06.manuscriptcentral.com/cgj-pubs
Canadian Geotechnical Journal
Draft
(a) (b)
Fig. 6: Comparison of Nγ values measured in the current experiments on circular anchors with previously
reported experimental values in: (a) dense sand (b) loose sand
0
5
10
15
20
25
0 1 2 3 4 5
An
cho
r fa
cto
r, N
γ
Embedment ratio, H/D
Series3Measured : Giampa et al. (2017) [Dense]Measured: Rasulo et al. (2017), [Dense]
Measured: UWA sand (RD = 40 - 45 %)
Measured: Giampa et al. (2017) (RD ~ 20 %)
Measured: Rasulo et al. (2017) (RD ~21 %)
Circular anchors0
5
10
15
20
25
0 1 2 3 4 5
An
cho
r fa
cto
r, N
γ
Embedment ratio, H/D
Series3haoMeasured : Giampa et al. (2017) [Dense]Measured: Rasulo et al. (2017), [Dense]Measured: Tagaya et al. (1988) [Dense]
Measured: UWA sand (RD = 69 - 76%)
Measured: UWA sand (RD = 85%)
Measured: Giampa et al. (2017) (RD = 40-45%)
Measured: Rasulo et al. (2017) (RD = 55-60%)
Measured: Tagaya et al. (1988) (RD = 77% )
Circular anchors
Page 34 of 44
https://mc06.manuscriptcentral.com/cgj-pubs
Canadian Geotechnical Journal

Draft
Fig. 7 : Comparison of measured and simulated anchor capacities in dense sand for: (a) strip anchors at
RD ~ 70%, (b) circular anchors at RD ~ 70% and (c) circular anchors at RD ~ 85%
0.0
1.5
3.0
4.5
6.0
7.5
0 1 2 3 4 5
An
cho
r fa
cto
r, N
γ
Embedment Ratio, H/B
Series3Measured: Rasulo et al. (2017), [Dense]
- - - -
- - - - -FE : RD = 70%
Analytical : White et al. (2008) (RD = 70%)
Measured : UWA Sand (RD = 69 -76 %)
Measured : UWA Sand (RD = 69 -76 %, using Sf)
Strip anchors
(b) (c)
(a)
0
5
10
15
20
25
30
0 1 2 3 4 5
An
cho
r fa
cto
r, N
γ
Embedment ratio, H/D
Series2Numerical : Giampa et al. (2017) [Dense]Measured: Rasulo et al. (2017), [Dense]
FE: RD = 85 %
LE : Giampa et al. (2017) (RD = 85 %)
Measured: Hao et al. (2018) (RD = 85 - 90 %)
Circular anchors
0
5
10
15
20
25
30
0 1 2 3 4 5
An
cho
r fa
cto
r, N
γ
Embedment ratio, H/D
Series3
FE : RD = 70 %
LE : Giampa et al. (2017) (RD = 70 %)
Measured: UWA sand (RD = 70 - 75 %)
- - -
------
Circular anchors
Page 35 of 44
https://mc06.manuscriptcentral.com/cgj-pubs
Canadian Geotechnical Journal

Draft
Fig. 8 : Comparison of measured and simulated anchor capacities in loose sand for: (a) strip anchors at
RD = 30% and (b) circular anchors at RD = 30%
Fig. 9 : Influence of different K0 values in the simulated FE responses in: (a) strip anchors and (b)
circular anchors
0.0
0.5
1.0
1.5
2.0
2.5
0.0 2.0 4.0 6.0 8.0 10.0
An
cho
r fa
cto
r ,
Nγ
Normalised displacement, δ/B (%)
Ser…Ser…
RD = 70%
H/B = 2, B = 1 m
RD = 30%
K0 = 0.4
K0= 0.5
Strip anchors
(a) (b)
(a) (b)
0
4
8
12
16
20
0 1 2 3 4
An
cho
r fa
cto
r, N
γ
Embedment ratio, H/D
Series3
- - -
-----FE: RD = 30 %
LE: Giampa et al. (2017) (RD = 40 %)
Measured: UWA sand (RD = 42 - 48 %)
Circular anchors
0.0
1.0
2.0
3.0
4.0
5.0
6.0
0.0 2.0 4.0 6.0 8.0 10.0
An
cho
r fa
cto
r ,
Nγ
Normalised displacement, δ/D (%)
Series1
Series2
RD = 70%
H/D = 2, D = 1 m
K0 = 0.4
K0 = 0.5
RD = 30%
Circular anchors
0.0
1.5
3.0
4.5
6.0
7.5
0 1 2 3 4 5
An
cho
r fa
cto
r, N
γ
Embedment ratio, H/B
Series3Series4
FE: RD = 30 %
LE: White et al. (2008) (RD = 40 %)
Measured UWA Sand (RD = 42 - 48 %)
Measured: UWA Sand (RD = 42 - 48 %, using Sf)
- - -
-----
Strip anchors
Page 36 of 44
https://mc06.manuscriptcentral.com/cgj-pubs
Canadian Geotechnical Journal
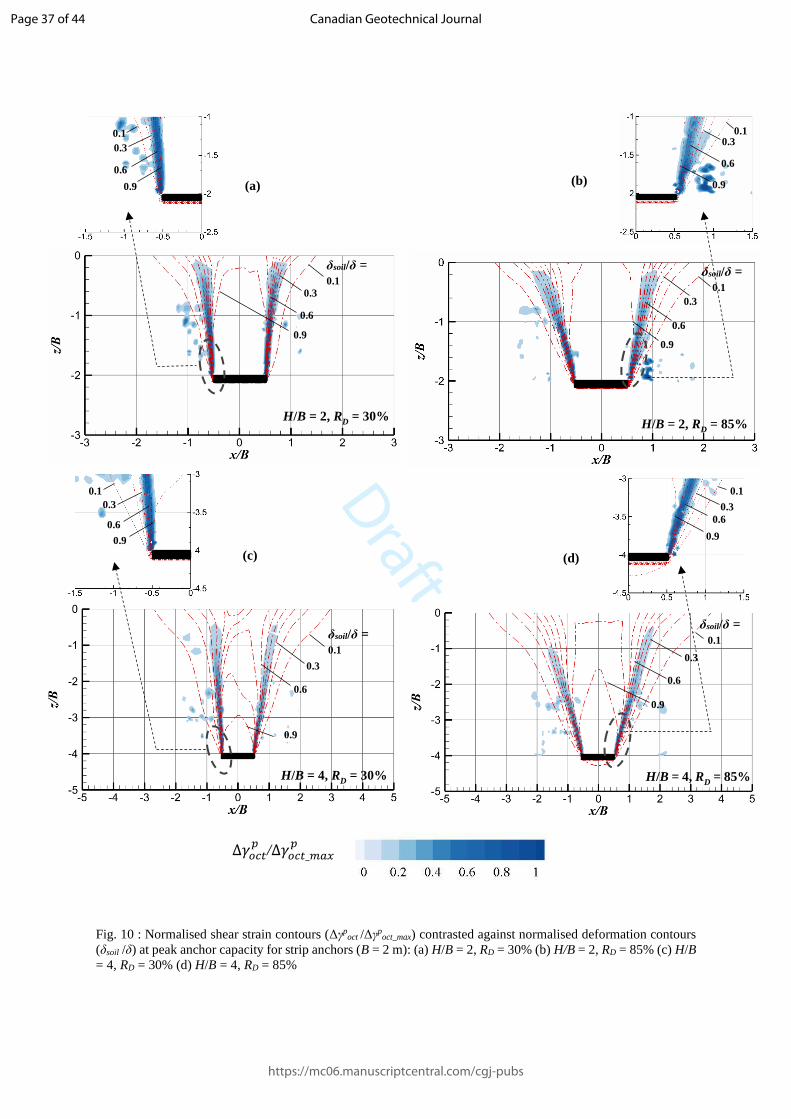
Draft
Fig. 10 : Normalised shear strain contours (Δγpoct /Δγp
oct_max) contrasted against normalised deformation contours
(δsoil /δ) at peak anchor capacity for strip anchors (B = 2 m): (a) H/B = 2, RD = 30% (b) H/B = 2, RD = 85% (c) H/B
= 4, RD = 30% (d) H/B = 4, RD = 85%
0.6
0.1
30.
0.9
0.3
0.6
3
(c) (d)
∆𝛾𝑜𝑐𝑡𝑝
/∆𝛾𝑜𝑐𝑡_𝑚𝑎𝑥𝑝
(b) (a)
H/B = 4, RD = 30%
0.9
0.3
0.6
δsoil/δ =
0.1
H/B = 2, RD = 30%
0.9
0.6
0.3
δsoil/δ =
0.1
H/B = 2, RD = 85%
0.3
0.6
0.9
δsoil/δ =
0.1
0.9
0.3
0.9
0.3
0.6
3
0.1
30.0.1
30.
0.9
0.3
0.6
3
0.1
H/B = 4, RD = 85%
0.3
0.6
0.9
δsoil/δ =
0.1
Page 37 of 44
https://mc06.manuscriptcentral.com/cgj-pubs
Canadian Geotechnical Journal

Draft
Fig. 11 : Normalised shear strain contours (Δγpoct / Δγp
oct_max) contrasted against normalised deformation
contours (δsoil /δ) at peak anchor capacity for circular anchors (H/D = 2, D = 2 m): (a) RD = 30% and (b) RD =
85%
r/D
z/D
r/D
z/D
H/D = 2, RD = 85% H/D = 2, RD = 30%
(b) (a)
∆𝛾𝑜𝑐𝑡𝑝
/∆𝛾𝑜𝑐𝑡_𝑚𝑎𝑥𝑝
0.6
0.9 0.9
0.3
δsoil/δ =
0.1
0.6
0.3
δsoil/δ =
0.1
Page 38 of 44
https://mc06.manuscriptcentral.com/cgj-pubs
Canadian Geotechnical Journal

Draft
Fig. 12 : Variation in mobilised friction angle at peak anchor capacity for strip anchors (B = 2 m, H/B =
4): (a) entire domain for RD = 85% and R
D = 30%, (b) along slip planes inclined at the angle of dilation from the
White et al. (2008) LE method
25
30
35
40
45
50
55
0.0 0.4 0.8 1.2 1.6 2.0
Mo
bil
sed
fri
ctio
n a
ng
le,
ϕ(°
)
Normalised distance from anchor edge, zl /B
Series2
Series1
Simulations: RD = 30%
Simulations: RD = 85%
ϕLE
= 49.4º
ϕLE
= 35.0º
ψLE = 21.4º
(b)
(a)
H/B = 4, RD = 30% H/B = 4, R
D = 85%
ψLE = 3.5º
ϕpeak °
Page 39 of 44
https://mc06.manuscriptcentral.com/cgj-pubs
Canadian Geotechnical Journal

Draft
Fig. 13 : Measured Nγ values from anchor tests in UWA silica sand with different plate dimensions: (a) circular
anchors, (b) rectangular anchors and (c) strip anchors
(c)
(b)
(a)
0
2
4
6
8
0 1 2 3 4 5
An
cho
r fa
cto
r, N
γ
Embedment ratio, H/B
0.6m_d
1m_d
Series8
Rectangular anchors
RD ~ 75%
B = 0.6 m
B = 1 m
B = 2 m
0
2
4
6
8
0 1 2 3 4 5
An
cho
r fa
cto
r, N
γ
Embedment ratio, H/B
1g
Series1
Series2
Series3
Rectangular anchors
RD ~ 40%
B = 0.02 m (Chow et al. 2018)
B = 0.6 m
B = 1 m
B = 2 m
0
2
4
6
0 1 2 3 4 5
An
cho
r fa
cto
r, N
γ
Embedment ratio, H/B
Series2
Series3
Series4
Strip anchors
RD ~ 40%
B = 0.6 m
B = 1 m
B = 2 m
0
2
4
6
0 1 2 3 4 5
An
cho
r fa
cto
r, N
γ
Embedment ratio, H/B
Series7
Series1
B = 0.6 m
B = 1 m
Strip anchors
RD ~ 75%
0
3
6
9
12
15
0 1 2 3 4
An
cho
r fa
cto
r, N
γ
Embedment ratio, H/D
Series2
0.6_d
1d
2d
Circular anchors
RD = 75 - 85%
D = 0.6 m
D = 1 m
D = 2 m
D = 0.02 m, 0.05 m (Hao et al. 2015)
0
3
6
9
12
15
0 1 2 3 4
An
cho
r fa
cto
r, N
γ
Embedment ratio, H/D
Series1Series4Series5Series6
D = 0.02 m, 0.05 m
D = 0.6 m
D = 1 m
D = 2 m
(Hao et al. 2015)
Circular anchors
RD ~ 40%
Page 40 of 44
https://mc06.manuscriptcentral.com/cgj-pubs
Canadian Geotechnical Journal

Draft
Fig. 14: Anchor capacity factors from FE and LE at different relative densities and initial stress levels
1
2
3
4
5
0 1 2 3 4
An
cho
rfa
cto
r, N
γ
Embedment ratio, H/B
Series12Series2Series3Series4dw_30p_5
Strip anchors
RD =30%, γ =15 kN/m3
B = 1 m
B = 5 m
(c) (d)
(e) (f)
1
2
3
4
5
0 1 2 3 4
An
cho
rfa
cto
r, N
γ
Embedment ratio, H/B
Series12Series1Series5Series6dw_50_1
Strip anchors
RD = 50%, γ =15 kN/m3
B = 1 m
B = 5 m
(a) (b)
0
3
6
9
12
15
18
0 1 2 3
An
cho
r fa
cto
r, N
γ
Embedment ratio, H/D
Series9Series4Series5Series6Series8
Circular anchors
RD = 85% ,γ =15 kN/m3
D = 1 m
D = 5 m
1
2
3
4
5
0 1 2 3 4
An
cho
rfa
cto
r, N
γ
Embedment ratio, H/B
Series11Series2Series3Series4dw_85_1
Strip anchors
RD = 85%, γ =15 kN/m3
B = 1 m
B = 5 m
FE: B = 0.6 m
FE: B = 1 m
FE: B = 2 m
FE: B = 5 m
LE: White et al. (2008)
1
2
3
4
5
0 1 2 3 4
An
cho
r fa
cto
r, N
γ
Embedment ratio, H/B
Series11Series1Series5Series6dw_70_5
B = 1 m
B = 5 m
Strip anchors
RD = 70%, γ =15 kN/m3
FE: B = 0.6 m FE: B = 1 m FE: B = 2 m FE: B = 5 m LE: White et al. (2008)
FE: B = 0.6 m FE: B = 1 m FE: B = 2 m FE: B = 5 m LE: White et al. (2008)
FE: B = 0.6 m FE: B = 1 m FE: B = 2 m FE: B = 5 m LE: White et al. (2008)
FE: D = 0.6 m FE: D = 1 m FE: D = 2 m FE: D = 5 m LE: Giampa et al. (2017)
Simulations: D = 0.6 m Simulations: D = 1 m Simulations: D = 2 m Simulations: D = 5 m LE: Giampa et al. (2017)
0
3
6
9
12
15
0 1 2 3
An
cho
r fa
cto
r, N
γ
Embedment Ratio, H/D
0.6Series4Series5Series6Series8
Simulations: D = 0.6 m
Simulations: D = 1 m
Simulations: D = 2 m
Simulations: D = 5 m
LE: Giampa et al. (2017)
Circular anchors
RD = 30%, γ =15 kN/m3
D = 5m
D = 1 m
Page 41 of 44
https://mc06.manuscriptcentral.com/cgj-pubs
Canadian Geotechnical Journal

Draft
Fig. 15 : Fitting of Fu_ps from the FE simulations in strip anchors
0.0
0.2
0.4
0.6
0.8
0 1 2 3 4 5U
pli
ft f
act
or,
Fu
_ps
Relative dilatancy index, IR
30p
50p
70p
85p
RD = 30%
RD = 50%
RD = 70%
RD = 85%
Page 42 of 44
https://mc06.manuscriptcentral.com/cgj-pubs
Canadian Geotechnical Journal

Draft
Fig. 16 : Comparison between predicted and measured Nγ for plane strain uplift for (a) variation in IR (b)
variation in H/B (c) variation in RD (d) variation in initial vertical stress
0
0.25
0.5
0.75
1
1.25
1.5
1.75
2
0 1 2 3 4 5 6 7
An
cho
r fa
cto
r, N
γ(P
red
icte
d /
Mea
sure
d)
Relative dilatancy index, IR
-20 %
+20 %
0
0.25
0.5
0.75
1
1.25
1.5
1.75
2
0 1 2 3 4 5 6 7
An
cho
rfa
cto
r, N
γ(P
red
icte
d /
Mea
sure
d)
Embedment ratio, H/B
-20 %
+20 %
0
0.25
0.5
0.75
1
1.25
1.5
1.75
2
0 20 40 60 80 100
An
cho
r fa
cto
r, N
γ(P
red
icte
d /
Mea
sure
d)
Relative density, RD (%)
-20 %
+20 %
0
0.25
0.5
0.75
1
1.25
1.5
1.75
2
1 10 100 1000
An
cho
r fa
cto
r, N
γ(P
red
icte
d /
Mea
sure
d)
Initial vertical stress, σ′vo (kPa)
-20 %
+20 %
Black markers: Eqn. (28) (COV = 0.13) Grey markers: LEM (COV = 0.16)
Anchor: Loose sand Anchor: Dense sand Pipe: Loose sand Pipe: Dense sand
(d) (c)
(a) (b)
Page 43 of 44
https://mc06.manuscriptcentral.com/cgj-pubs
Canadian Geotechnical Journal

Draft
Fig. 17 : Comparison between predicted and measured Nγ for circular anchors for (a) variation in IR (b)
variation in H/D (c) variation in RD (d) variation in initial vertical stress
0
0.25
0.5
0.75
1
1.25
1.5
1.75
2
0 1 2 3 4 5 6
An
cho
r fa
cto
r, N
γ(P
red
icte
d/
Mea
sure
d)
Relative dilatancy index, IR
-20 %
+20 %
0
0.25
0.5
0.75
1
1.25
1.5
1.75
2
0 1 2 3 4 5 6
An
cho
r fa
cto
r, N
γ(P
red
icte
d/
Mea
sure
d)
Embedment ratio, H/D
-20 %
+20 %
0
0.25
0.5
0.75
1
1.25
1.5
1.75
2
0 20 40 60 80 100
An
cho
r fa
cto
r, N
γ(P
red
icte
d/
Mea
sure
d)
Relative density, RD (%)
-20 %
+20 %
0
0.25
0.5
0.75
1
1.25
1.5
1.75
2
1 10 100
An
cho
r fa
cto
r, N
γ(P
red
icte
d/
Mea
sure
d)
Initial vertical stress, σ′vo (kPa)
-20 %
+20 %
Black markers: Eqn. (29) (COV = 0.19) Grey markers: LEM (COV = 0.29)
Anchor: Loose sand Anchor: Dense sand
(a) (b)
(d) (c)
Page 44 of 44
https://mc06.manuscriptcentral.com/cgj-pubs
Canadian Geotechnical Journal

Minerva Access is the Institutional Repository of The University of Melbourne
Author/s:
Roy, A; Chow, SH; O'Loughlin, CD; Randolph, MF
Title:
Towards a simple and reliable method for calculating the uplift capacity of plate anchors in
sand
Date:
2021
Citation:
Roy, A., Chow, S. H., O'Loughlin, C. D. & Randolph, M. F. (2021). Towards a simple and
reliable method for calculating the uplift capacity of plate anchors in sand. Canadian
Geotechnical Journal, 58 (9), https://doi.org/10.1139/cgj-2020-0280.
Persistent Link:
http://hdl.handle.net/11343/251839
File Description:
Accepted version