Embed Size (px)
Citation preview

DRAFT
REPORT OF THE FINANCIAL AFFAIRS COMMITTEE April 25, 2019
The Financial Affairs Committee met at 1:00 p.m. on April 25, 2019 at the University of New Hampshire in Durham, NH. Present were Committee members Chairman Joseph Morone, Todd Black, Kass Ardinger, Suzanne Foster, Morgan Rutman, Wally Stevens, and Alex Walker; Trustees John Small, Amy Begg, Jacqueline Eastwood, Cathy Green, Shawn Jasper, Ken Moulton, Scott Mason, Chris Pope, Marjorie Smith, Christian Merheb, Nadia Hasan; President Donald Birx, President James Dean, President Mark Rubinstein, President Melinda Treadwell and Chancellor Todd Leach. Representing the Governor’s Office was Rhonda Hensley and Mac Zellem.
A number of faculty, staff and students were also in attendance.
Chairman Morone called the meeting to order at 1:00 p.m.
I. Presentation of the Brad Perry Award
Vice Chancellor Provencher said an award is presented in honor of former Vice Chancellor and Treasurer Brad Perry who served USNH from 1988 to his death in 2000. The award recognizes significant contributions to financial improvements and/or collaboration. This year’s recipients are lead members of the Banner Upgrade team: Julien Lafleur, Amanda Riecks-Kurshinsky, Sergey Vorotnikov, and Marc Behan. Vice Chancellor Provencher thanked the four recipients for their important contribution.
II. Approval of Minutes (Moved on recommendation of Trustee Dey and duly seconded)
VOTED, that the minutes of the January 17, 2019 meeting be approved.
(The Committee voted unanimously to approve this motion)
Chairman Morone shared several excerpts from the January meeting minutes that described the difficulty in meeting operating margin targets and the fact that in the last few cycles, margins have been met through expense mitigation. He said that these statements are still true and the margin projection has eroded further since January.
III. Actual and projected financial results and budgeting
A. Performance dashboard
Vice Chancellor Provencher reviewed the performance dashboard of system-wide indicators and Chairman Morone pointed out the declining trend in Operation Margin. Presidents Dean,
Agenda Item, I. A.

2
Treadwell and Birx described the metrics they are using to monitor results. Committee members asked questions on retention, class size, financial aid discount, quality and fundraising. President Rubinstein reported that GSC is in the process of updating its strategic plan and developing metrics. He shared the four areas of focus they will be measuring: Student success, engagement and partnerships, quality, and cost. Presidents commented that the impact of changes and improvements are not always immediately seen.
B. Admission Updates
Vice Chancellor Provencher reviewed updated admissions information as of April 23, 2019. She said systemwide, resident paid deposits are down 5.4% over the prior year at the same time and non-residents are down 8.4%. She noted that the admission cycle is still open, and results are subject to change in the next week prior to the May 1 deadline. Campuses shared comments on their results and current projections, with President Treadwell indicating that KSC is hopeful that an admitted student event on Saturday which is being held one week later than the prior year, will result in additional paid deposits. In response to a question, campuses shared the financial impact of 100 less students at their respective institutions.
Chancellor Leach provided information on NH Community College transfers and enrollment of NH residents indicating that while there are fewer graduates, USNH has lost market share with both. He shared plans for outreach to NH guidance counselors and high schools. Committee members discussed the perception of USNH within the State and the importance of marketing. Trustee Small said there would be a presentation at the Executive Committee meeting by the Communications Council.
C. FY19 P2 Projection
Vice Chancellor Provencher reviewed the updated FY19 budget projection (P2) compared to the approved budget. She said that Total Operating Margin decreased $8 million from 1.3% to .4%. She briefly discussed the reasons for the decrease. She noted that operating revenues decreased $13 million and operating expenses decreased $5 million
Chairman Morone said that operating margin is down because of less revenue, and that decrease is partially offset by reductions in expenses. He said that at the next meeting when the FY 20 budget is approved, the Committee should consider whether an assumption of 2.5% increase in revenues if realistic. It was noted that net tuition and fees revenue is falling in large part because of increased discounting. Chairman Morone reviewed OM trends by institution and pointed out that UNH’s strategic ambitions are growing, and they are not able to grow margin enough to support the other institutions. Committee members discussed the trend in declining margin and ways to address it agreeing that USNH needs to think about both tactical and structural changes.
Vice Chancellor Provencher explained the “SYS” allocation explaining that it was not the cost of the system office but rather unallocated expenses such as LRTP, fringe pool costs in excess of recoveries, etc. Trustee Morgan noted that if the allocation of the unallocated costs to the campuses is not proportional, leaving them unallocated could distort actual performance by each campus.

3
President Treadwell offered comments on KSC’s financial situation and steps that have been taken and will be taken to improve results. She said a large part of the problem was with greater financial aid given than budgeted due to an unanticipated change in the mix of new students.
Vice Chancellor Provencher said the UFR: Debt ratio went from 54% (Budget) to 59% (P2) primarily because of the lower FY18 OPEB liability recorded. Chairman Morone said that the UFR:Debt ratio should not go below 50%, and if margins are lower than projected, the UFR-Debt ratio will decline, which will reduce USNH’s ability to borrow or invest in the System.
D. Non-Public Session
At 2:45 p.m. the following motion to enter nonpublic session was made by Trustee Morone. The motion was duly seconded and approved by roll call vote. In addition to trustees, some system and campus administrators attended the non-public session. After about 10 minutes of discussion, Trustee Jasper questioned the need for the non-public session and asked to be recorded opposed. The need for non-public session was clarified by the Chairman.
MOVED, that the USNH Board of Trustees Financial Affairs Committee go into nonpublic session for the purposes of (1) discussing personnel issues including matters relating to collective bargaining, (2) discussing the hiring, dismissal, and compensation of certain public employees, (3) discussing strategic matters which if discussed in public could provide a competitive advantage to certain private interests to the detriment of the interests of the general community, and (4) consulting with legal counsel, as authorized by RSA 91-A:2, I (a) and (b) and 91-A:3, II (a), (c), and (d).
E. Return to Public Session
Upon a motion to exit nonpublic session, made by Trustee Rutman, duly seconded, and approved, Chairman Morone reconvened the public meeting at 4:15 p.m. and announced that the Committee discussed financial planning, management strategy and risk exposures. No actions were taken while in nonpublic session. A report on UNH Manchester was deferred until June.
F. Update of State Operating Appropriation Request
Chancellor Leach provided an update on the state operating budget request. He described the Governor’s and House budget proposals, noting that the Governor’s budget calls for flat funding in the ongoing support but includes $24 million in one-time strategic investments and $6 million for the UNH Child Study and Development Center. He said the House budget provides a $4.5 million increase in ongoing support for FY20 and $7.5 million increase in FY21 (in exchange for a tuition freeze), but it does not recommend one-time strategic investments. He indicated that he and campus presidents will be attending the Senate Finance hearing tomorrow.
4
IV. Capital Items
A. Update of State Capital Budget Request
Chancellor Leach said the Governor included $10 million for the UNH biological science center project in his capital budget and $2 million for PSU Hyde Hall in HB2. The House recommendation is for $42m over 3 biennia for the UNH Biological Science, PSU Hyde Hall, and KSC Elliott Hall projects.
B. Update on Ongoing Capital Projects
Vice Chancellor Provencher reviewed the status of ongoing projects noting that the KSC Cohen Center was completed in February and the donors were very pleased with the finished project.
C. Review USNH 6-year capital plan
Mr. Purcell presented USNH’s six-year capital plan. He explained the Facilities Condition Index (FCI) noting that it is a commonly used benchmark to assess condition of facilities. He said USNH manages 9.2 million square feet with a value of over $3.3 billion in replacement value. He said USNH plans to invest $520 million into capital assets over the next 5 years, with the majority of funds being spent on existing capital assets. Trustee Rutman noted that the $3.3 billion is what it would cost to replace the existing plant and is not a current appraised value.
Vice Chancellor Provencher explained that the only way USNH can borrow money is through the New Hampshire Higher Education Health Facilities Authority (HEFA). She said that campuses are budgeted to invest in their facilities in an amount equal to depreciation.
Presidents were given an opportunity to comment on their capital plans. It was noted that even with the pressure on margins, USNH has been able to reinvest in its facilities and address deferred maintenance.
The Committee discussed the number of priority projects that do not have a funding source. HEFA funding was discussed and it was noted that the cost of financing a project through HEFA does not necessarily mean an increase in student fees for that project. Chairman Morone requested that in June when the operating and capital budgets are presented, the multiyear capital plan (5 year projections) be integrated with proposed timing and options for unfunded priority projects so that trustees can understand the gap between those priorities and the capacity to fund.
D. PSU Artificial Turf Field – Preliminary review
Discussion of this item was deferred.
V. Ongoing Systemwide Initiatives
A. Strategic Procurement – UshopNH Project Status

5
Discussion of this item was deferred.
VI. Other Business
A. Chair or Committee comments
B. The Committee adjourned at 4:55 pm
C. Next meeting date is June 27, 2019 at GSC

1
UNIVERSITY SYSTEM OF NEW HAMPSHIRE BOARD OF TRUSTEES
Motion Sheet
Keene State College
To: Financial Affairs Committee Re: Approval of Keene Endowment Association Budget and Goals for FY20
PROPOSED MOTION
MOVED, on recommendation of the Keene State College President, that the Board of Trustees approve the following motion.
MOVED, on recommendation of the Financial Affairs Committee, that the FY2020 budget for the Keene Endowment Association as summarized in the attachment be approved.
SUMMARY OF PROPOSED ACTION
Keene State College is seeking approval of the FY20 budget, including planned distributions for the Keene Endowment Association (KEA).
While there is no policy requirement that changes to KEA’s investment guidelines need the approval of the USNH Board of Trustees, recently approved revisions to the guidelines are attached for information.
RATIONALE FOR PROPOSED ACTION
In accordance with Trustee policy, Board approval of the "fund raising and disbursement goals and budgets" for any affiliated foundation is required annually. KEA will continue to work closely with the College to increase awareness of the KEA among alumni, the campus and community. The attached material fulfills the KEA budgetary requirement for FY2020.
PREVIOUS REVIEWS AND APPROVALS
The proposed operating budget was approved by the KEA Board on June 6th.
RELEVANT GOVERNANCE DOCUMENTS, POLICIES, AND PRACTICES
Board of Trustee Policy on Foundations Established for the Benefit of USNH or its Component Institutions BOT III.C. states that every affiliated foundation shall establish fund raising and disbursement goals and budgets and that these goals and budgets are subject to approval by the USNH Board of Trustees. Article 6 of the April 6, 1996 agreement between the Keene
Agenda Item I.B.

2
Endowment Association (KEA) and the Board states that "Because KEA is not primarily a fund raising organization; its fund raising goals may be zero."
RESOURCE IMPLICATIONS
Keene Endowment Association provides financial assistance to the College, supporting scholarships, books, facilities and programs. As of March 31, 2019, KEA assets had a market value of $9,174,878. KEA plans to distribute approximately $336,189.43 in support of Keene State College scholarships and program support and does not expect to incur more than $2,000 in expenses this year. In addition, the KEA Board has authorized an annual payout to KSC of 1% of the market value as of December 31, 2018 (approximately $82,485) of the total endowed portfolio in support of the advancement division’s operations, specifically to support stewardship activities. KEA is anticipating approximately $2.5 million in new gifts in FY20. Management of KEA assets is the responsibility of the KEA.
RISK MANAGEMENT CONSIDERATIONS
It is important that the USNH Board of Trustees coordinate with affiliated foundations to advance the interests of the University System as a whole. Through these reporting requirements, the BOT retains ultimate control over the activities of any affiliated foundation including the raising, investing, and disbursing of funds. KEA’s unaudited financial statements are consolidated in the USNH audited financial statements.
SUBSEQUENT ACTION REQUIRED Approval by the USNH Board of Trustees is scheduled for consideration on June 28, 2019 Catherine A. Provencher Todd Leach Vice Chancellor Chancellor For Financial Affairs and Treasurer
Date Prepared: June 13, 2019 For the Meeting of: June 27, 2019
-- End of Motion Sheet --


UNIVERSITY SYSTEM OF NEW HAMPSHIRE BOARD OF TRUSTEES
To: Trustees' Financial Affairs Committee
Re: UNH Foundation Budget for Fiscal Year 2020
REQUEST FOR BOARD ACTION
MOVED, on recommendation of the UNH President, that the following motion be presented for consideration of the Board of Trustees
MOVED, on recommendation of the Financial Affairs Committee, that the attached budget for the University of New Hampshire Foundation for Fiscal Year 2020 be approved.
SUMMARY OF PROPOSED ACTION
The proposed budget reflects the operating plan for the UNH Foundation for the period July 1, 2019 to June 30, 2020. Please see attachments.
RATIONALE FOR THE PROPOSED ACTION
The proposed FY20 UNH Foundation budget is $8,222,045, an increase of 8.5% over the FY19 year-end projection as of May 2019 and significantly higher than the FY19 budget the Board approved in June 2018 which was $6,024,995 (original budget). The FY19 Adjusted budget and current FY19 projection are higher than the FY19 original budget approved as a result of transferring the Gift Planning and Annual Giving departments during FY19 from outside the UNH Foundation budget to the Development budget within the UNH Foundation budget. Additionally, FY20 Personnel Expenses are increased over the FY19 Adjusted Budget and Year-End Projection due to the full year impact of rehiring certain fundraising positions held open for parts of FY19, annual salary increases and fringe benefit increases. Some goods & services budgets were also deliberately underspent in FY19 to help UNH meet the operating margin goal. This spending restriction has been removed in the FY20 budget proposal.
On the revenue side, the FY20 administrative fees from the UNH Foundation and USNH endowed fund pools, as approved by their respective governing bodies in early 2019, are increasing by 0.6%. The UNH Central Allocation funding to the Foundation has been increased in order to achieve a breakeven budget for the Foundation.
PREVIOUS REVIEWS AND APPROVALS
The UNHF budget is developed by the UNHF staff, reviewed by the UNH Vice President for Finance and Administration, and brought forward by the Foundation President / Vice President for Advancement. The budget was reviewed and recommended for approval at the UNH Foundation Board Investment & Finance Committee meeting of May 30, 2019, and subsequently approved by the UNHF Board of Directors on May 31, 2019.
RELEVANT GOVERNANCE DOCUMENTS, POLICIES AND PRACTICES
The USNH Board of Trustees policy BOT.III.C "Foundations Established for the Benefit of USNH or its Component Institutions" requires in item 6 that "Prior to the commencement of each fiscal year, every
Agenda Item I.C.
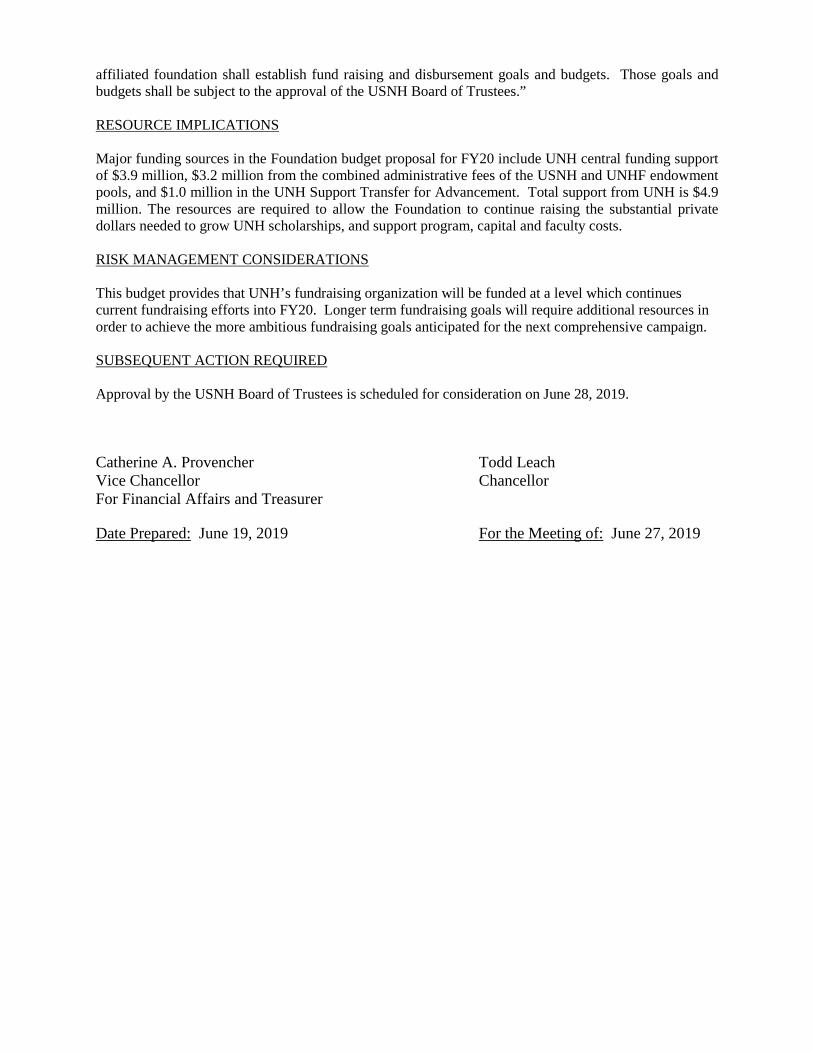
affiliated foundation shall establish fund raising and disbursement goals and budgets. Those goals and budgets shall be subject to the approval of the USNH Board of Trustees.” RESOURCE IMPLICATIONS Major funding sources in the Foundation budget proposal for FY20 include UNH central funding support of $3.9 million, $3.2 million from the combined administrative fees of the USNH and UNHF endowment pools, and $1.0 million in the UNH Support Transfer for Advancement. Total support from UNH is $4.9 million. The resources are required to allow the Foundation to continue raising the substantial private dollars needed to grow UNH scholarships, and support program, capital and faculty costs. RISK MANAGEMENT CONSIDERATIONS This budget provides that UNH’s fundraising organization will be funded at a level which continues current fundraising efforts into FY20. Longer term fundraising goals will require additional resources in order to achieve the more ambitious fundraising goals anticipated for the next comprehensive campaign. SUBSEQUENT ACTION REQUIRED Approval by the USNH Board of Trustees is scheduled for consideration on June 28, 2019. Catherine A. Provencher Todd Leach Vice Chancellor Chancellor For Financial Affairs and Treasurer
Date Prepared: June 19, 2019 For the Meeting of: June 27, 2019

Office of the President
105 Main StreetDurham, NH 03824
V: 603.862.2450F: 603.862.3060TTY: 7.1.1 (Relay NH)
June 17, 2019
Dr. Todd J. Leach, Chancellor University System of New Hampshire 5 Chenell Drive Concord, NH 03301
Dear Todd,
The purpose of this letter is to transmit the FY20 operating budget for the UNH Foundation (UNHF). This budget has been approved by the UNHF Investment & Finance Committee and the full UNHF Board at their meetings of May 30 and 31, 2018. The enclosed budget is scheduled to be reviewed as a consent agenda item by the USNH Financial Affairs Committee meeting this month.
For the coming year, the UNHF budget is increased by 8.5% over the FY19 adjusted budget, reflecting the full year impact of hiring several essential fundraising positions that were purposely held open in FY18 until early FY19 for UNH budget reasons, as well as the annual salary increases for Foundation staff. The similar increase in support expenses is essentially flat to the FY19 original budget. The deliberate underspending in FY19 to help UNH meets its operating margin goal is not projected to be necessary in FY20. This budget will allow the Foundation to maintain its fundraising efforts into FY20 as it enters the planning year of UNH’s next comprehensive campaign.
As in the last few years, the FY20 administrative and payout to purpose fees from the UNHF endowment funds will be 1.00% and 4.25%, respectively, both based on the trailing 12-quarter average unit value as of 12/31/2018.
We are happy to answer any questions regarding this budget.
Best regards,
James W. Dean, Jr. President
Attachments
c: Chris Clement Wayne Jones Catherine Provencher Kerry Scala Debbie Dutton Erik Gross

Printed on: 6/18/2019 @ 2:51 PM
UNH Foundation FY20 Budget with prior year comparisons (Fund 4DG070) Updated: 06/18/19
Line FY17 Actuals FY18 Actuals FY19
Adjusted** Budget
% of Total
FY19Year-EndProjection
% of Total
FY20 BudgetRequest
% of Total
$ +/- FY20 vs.
FY19 YE Proj.
Revenues1 Admin Fee on Endowments 2,919,470$ 2,991,732$ 3,206,789$ 42.4% 3,218,495$ 42.4% 3,233,049$ 39.3% 14,554$
2 UNH Central Funding * 2,541,894 2,099,914 3,223,066 42.6% 3,223,066 42.5% 3,983,996 48.5% 760,930
3 Other Revenue/Transfer In 123,829 222,713 128,500 1.7% 141,224 1.9% 5,000 0.1% (136,224)
4 USNH/UNH Support Transfer 550,000 1,000,000 1,000,000 13.2% 1,000,000 13.2% 1,000,000 12.2% -
5 Total Revenues 6,135,193$ 6,314,359$ 7,558,355$ 100.0% 7,582,785$ 100.0% 8,222,045$ 100.0% 639,260$
Expenses6 Personnel 4,942,720$ 5,020,997$ 6,126,154$ 81.1% 6,033,803$ 79.6% 6,616,650$ 80.5% 582,847$
7 Goods, Services, Travel, etc. 830,864 746,622 1,356,072 17.9% 1,193,489 15.7% 1,501,015 18.3% 307,526
8 Facilities 248,536 136,578 93,829 1.2% 93,829 1.2% 104,380 1.3% 10,551
9 Total Expenses 6,022,120$ 5,904,196$ 7,576,055$ 100.2% 7,321,121$ 96.5% 8,222,045$ 100.0% 900,924$
10 Revenues - Expenses 113,073$ 410,163$ (17,700)$ 261,664$ -$ 11 CRM Implementation Transfer (1,500,000) (500,000) - - -
12 Beginning Fund Balance 2,863,041$ 1,476,114$ 1,386,277$ 1,386,277$ 1,647,941$ 13 Ending Fund Balance 1,476,114$ 1,386,277$ 1,368,577$ 1,647,941$ 1,647,941$
* includes RCM S&W Assessment
** The Foundation’s FY19 original budget was ~$6M. The FY19 adjusted budget restores two fundraising positions totaling $205K, as approved by the UNH Executive Committee, that were vacant at the time the budget was originally submitted. The remaining increase is due moving the budgets of the offices of Gift Planning and Annual Giving moving into the Development budget from Advancement Services, which is outside the UNH Foundation budget.
Admin Fee on Endowments
39.3%
UNH Central Funding48.5%
Other Revenue/Transfer In
0.1%
USNH/UNH Support Transfer12.2%
FY20 Revenues - Budget FY19 Projection Highlights:Overall results are expecting a 3.5% margin. Revenues are in line with Budget. Expense savings are due to position vacancy savings, as well as targeted underspending in Support expenses such as travel and professional development.
FY20 Budget Highlights:Support --Endowment admin fee revenue is increasing modestly over FY19. UNH central funding is increased in accordance with expense increases as noted below to generate a breakeven budget.
Expenses --Personnel includes: salary increase effective Jan 1, 2020, and the full year impact of all FY19 personnel changes, most notably certain positions that were held open in FY18 but released for hire in FY19. The vacancy savings factor remains at 5% (same level since FY17).
No new positions are included in this budget. Non-personnel costs are somewhat lower than the FY19 original budget, but the targeted underspending of FY19 is not anticipated for FY20.
Personnel80.5%
Goods, Services, Travel, etc.
18.3%
Facilities1.3%
FY20 Expenses - Budget

UNIVERSITY SYSTEM OF NEW HAMPSHIRE
BOARD OF TRUSTEES
Financial Affairs Committee
Information Item
For Meeting: June 27, 2019
UNIVERSITY OF NEW HAMPSHIRE, PLYMOUTH STATE UNIVERSITY, KEENE STATE COLLEGE
To: Financial Affairs Committee
Re: Fall 2019 Paid Deposits – June Admissions Summary
SUPPORTING MATERIALS
Changes in paid deposit counts are summarized below. Additional detail in appendices.
SUMMARY
The table below describes the change in paid deposits at the same point in the fall admissions cycle of the prior
year on June 17.
SUBMITTED BY: USNH System Office/hgh
% # % # % #
UNH 2019 1,126 -11.6% -148 1,707 -8.6% -160 3289 -9.5% -345
2018 1,274 -0.7% -9 1,867 2.2% 41 3634 -1.2% -43
PSU 2019 536 -6.1% -35 574 -8.7% -55 1246 -9.4% -129
2018 571 8.6% 45 629 -10.1% -71 1375 -2.6% -37
KSC 2019 387 -0.8% -3 478 -19.0% -112 966 -11.1% -121
2018 390 4.8% 18 590 -5.3% -33 1087 -2.1% -23
Total 2019 2,049 -8.3% -186 2,759 -10.6% -327 5,501 -9.8% -595
2018 2,235 2.5% 54 3,086 -2.0% -63 6,096 -1.7% -103
RESIDENT FRESHMEN NONRESIDENT FRESHMEN FRESHMEN + TRANSFERS
Deposits
Change from PY
Deposits
Change from PY
Deposits
Change from PY
Agenda Item II. A.

with percent change
FRESHMEN 2019 Change 2018 Change 2017 2019 Change 2018 Change 2017 2019 Change 2018 Change 2017
APPLY 4,603 -2.4% 4,715 -2.0% 4,809 15,087 -1.8% 15,362 1.4% 15,152 19,690 -1.9% 20,077 0.6% 19,961
ADMIT 3,478 -4.4% 3,638 -3.2% 3,757 11,670 -1.0% 11,783 2.4% 11,502 15,148 -1.8% 15,421 1.1% 15,259
PAID DEP 1,126 -11.6% 1,274 -0.7% 1,283 1,707 -8.6% 1,867 2.2% 1,826 2,833 -9.8% 3,141 1.0% 3,109
APPLY 2,477 14.3% 2,167 7.4% 2,018 5,516 23.4% 4,469 -4.4% 4,675 7,993 20.4% 6,636 -0.9% 6,693
ADMIT 2,208 19.2% 1,852 9.8% 1,686 4,568 26.9% 3,599 0.6% 3,579 6,776 24.3% 5,451 3.5% 5,265
PAID DEP 536 -6.1% 571 8.6% 526 574 -8.7% 629 -10.1% 700 1,110 -7.5% 1,200 -2.1% 1,226
APPLY 1,805 5.8% 1,706 -0.4% 1,713 3,150 -2.3% 3,223 -16.3% 3,851 4,955 0.5% 4,929 -11.4% 5,564
ADMIT 1,589 18.0% 1,347 -4.1% 1,404 2,787 4.7% 2,663 -16.6% 3,192 4,376 9.1% 4,010 -12.8% 4,596
PAID DEP 387 -0.8% 390 4.8% 372 478 -19.0% 590 -5.3% 623 865 -11.7% 980 -1.5% 995
APPLY 8,885 3.5% 8,588 0.6% 8,540 23,753 3.0% 23,054 -2.6% 23,678 32,638 3.1% 31,642 -1.8% 32,218
ADMIT 7,275 6.4% 6,837 -0.1% 6,847 19,025 5.4% 18,045 -1.2% 18,273 26,300 5.7% 24,882 -0.9% 25,120
PAID DEP 2,049 -8.3% 2,235 2.5% 2,181 2,759 -10.6% 3,086 -2.0% 3,149 4,808 -9.6% 5,321 -0.2% 5,330
TRANSFERSAPPLY 654 -2.5% 671 -12.5% 767 657 -13.4% 759 3.8% 731 1,311 -8.3% 1,430 -4.5% 1,498
ADMIT 394 -1.3% 399 -16.4% 477 357 -19.6% 444 -5.5% 470 751 -10.9% 843 -11.0% 947
PAID DEP 274 2.6% 267 -17.6% 324 182 -19.5% 226 -7.4% 244 456 -7.5% 493 -13.2% 568
APPLY 220 -29.9% 314 -7.6% 340 195 -26.7% 266 0.4% 265 415 -28.4% 580 -4.1% 605
ADMIT 149 -22.0% 191 -12.8% 219 114 -18.0% 139 6.1% 131 263 -20.3% 330 -5.7% 350
PAID DEP 89 -25.2% 119 -10.5% 133 47 -16.1% 56 5.7% 53 136 -22.3% 175 -5.9% 186
APPLY 145 -24.9% 193 -8.5% 211 151 -13.2% 174 5.5% 165 296 -19.3% 367 -2.4% 376
ADMIT 105 -7.1% 113 -17.5% 137 80 -5.9% 85 11.8% 76 185 -6.6% 198 -7.0% 213
PAID DEP 58 -18.3% 71 -15.5% 84 43 19.4% 36 16.1% 31 101 -5.6% 107 -7.0% 115
APPLY 1,019 -13.5% 1,178 -10.6% 1,318 1,003 -16.3% 1,199 3.3% 1,161 2,022 -14.9% 2,377 -4.1% 2,479
ADMIT 648 -7.8% 703 -15.6% 833 551 -17.5% 668 -1.3% 677 1,199 -12.5% 1,371 -9.2% 1,510
PAID DEP 421 -7.9% 457 -15.5% 541 272 -14.5% 318 -3.0% 328 693 -10.6% 775 -10.8% 869
READMITSAPPLY 69 74 111 28 48 72 97 122 183
ADMIT 52 63 83 22 41 62 74 104 145
PAID DEP 52 62 83 22 40 62 74 102 145
APPLY 28 45 46 22 27 16 50 72 62
ADMIT 19 35 36 17 21 10 36 56 46
PAID DEP 18 34 35 17 20 10 35 54 45
APPLY 20 18 14 14 11 15 34 29 29
ADMIT 17 17 13 14 10 15 31 27 28
PAID DEP 14 12 13 9 6 14 23 18 27
APPLY 117 137 171 64 86 103 181 223 274
ADMIT 88 115 132 53 72 87 141 187 219
PAID DEP 84 108 131 48 66 86 132 174 217
TOTALS – UNH total and 3‐campus total exclude UNH re‐admits in all years*APPLY 5,257 -2.4% 5,386 -3.4% 5,576 15,744 -2.3% 16,121 1.5% 15,883 21,001 -2.4% 21,507 0.2% 21,459
ADMIT 3,872 -4.1% 4,037 -4.7% 4,234 12,027 -1.6% 12,227 2.1% 11,972 15,899 -2.2% 16,264 0.4% 16,206
PAID DEP 1,400 -9.1% 1,541 -4.1% 1,607 1,889 -9.7% 2,093 1.1% 2,070 3,289 -9.5% 3,634 -1.2% 3,677
APPLY 2,725 7.9% 2,526 5.1% 2,404 5,733 20.4% 4,762 -3.9% 4,956 8,458 16.1% 7,288 -1.0% 7,360
ADMIT 2,376 14.3% 2,078 7.1% 1,941 4,699 25.0% 3,759 1.0% 3,720 7,075 21.2% 5,837 3.1% 5,661
PAID DEP 643 -11.2% 724 4.3% 694 638 -9.5% 705 -7.6% 763 1,281 -10.4% 1,429 -1.9% 1,457
APPLY 1,970 2.8% 1,917 -1.1% 1,938 3,315 -2.7% 3,408 -15.5% 4,031 5,285 -0.8% 5,325 -10.8% 5,969
ADMIT 1,711 15.8% 1,477 -5.0% 1,554 2,881 4.5% 2,758 -16.0% 3,283 4,592 8.4% 4,235 -12.4% 4,837
PAID DEP 459 -3.0% 473 0.9% 469 530 -16.1% 632 -5.4% 668 989 -10.5% 1,105 -2.8% 1,137
APPLY 9,952 1.3% 9,829 -0.9% 9,918 24,792 2.1% 24,291 -2.3% 24,870 34,744 1.8% 34,120 -1.9% 34,788
ADMIT 7,959 4.8% 7,592 -1.8% 7,729 19,607 4.6% 18,744 -1.2% 18,975 27,566 4.7% 26,336 -1.4% 26,704
PAID DEP 2,502 -8.6% 2,738 -1.2% 2,770 3,057 -10.9% 3,430 -2.0% 3,501 5,559 -9.9% 6,168 -1.6% 6,271
USNH/hgh 06/19/2019
Consolidated Undergraduate Admissions Summary
USNH Residential Institutions
Fall 2019 — June 17
RESIDENT NONRESIDENT TOTAL
PSU
KSC
TOTAL
UNH
PSU
UNH
PSU
KSC
TOTAL
UNH
UNH
PSU
KSC
TOTAL
KSC
TOTAL
All institutions report newly entering degree‐seeking undergrads (2‐ / 4‐year). Nonresident includes US citizen, permanent resident, and nonresident alien (international).
Source: Campus R+30 Admissions Reports, UNH (Durham) 06/17/19, 06/17/18, 06/18/17 | PSU 06/17/19, 06/18/18, 06/19/17 | KSC 06/17/19, 06/18/18, 06/19/17
*UNH modification to Leave of Absence policy in 2017 changes the re‐admit enrollment process. Re‐admit counts 2018 forward are not comparable to prior years.
Transfers may be reported as freshman at UNH depending on incoming number of credits and prior matriculation status. UNH data do not include Navitas students.
Applications reflect total received ‐‐ not necessarily total reviewed with admission decision, admit rate is valid at R30. All campuses report active paid deposit counts.

with headcount change
FRESHMEN 2019 Change 2018 Change 2017 2019 Change 2018 Change 2017 Change 2018 Change 2017
APPLY 4,603 (112) 4,715 (94) 4,809 15,087 (275) 15,362 210 15,152 19,690 (387) 20,077 116 19,961
ADMIT 3,478 (160) 3,638 (119) 3,757 11,670 (113) 11,783 281 11,502 15,148 (273) 15,421 162 15,259
PAID DEP 1,126 (148) 1,274 (9) 1,283 1,707 (160) 1,867 41 1,826 2,833 (308) 3,141 32 3,109
APPLY 2,477 310 2,167 149 2,018 5,516 1,047 4,469 (206) 4,675 7,993 1,357 6,636 (57) 6,693
ADMIT 2,208 356 1,852 166 1,686 4,568 969 3,599 20 3,579 6,776 1,325 5,451 186 5,265
PAID DEP 536 (35) 571 45 526 574 (55) 629 (71) 700 1,110 (90) 1,200 (26) 1,226
APPLY 1,805 99 1,706 (7) 1,713 3,150 (73) 3,223 (628) 3,851 4,955 26 4,929 (635) 5,564
ADMIT 1,589 242 1,347 (57) 1,404 2,787 124 2,663 (529) 3,192 4,376 366 4,010 (586) 4,596
PAID DEP 387 (3) 390 18 372 478 (112) 590 (33) 623 865 (115) 980 (15) 995
APPLY 8,885 297 8,588 48 8,540 23,753 699 23,054 (624) 23,678 32,638 996 31,642 (576) 32,218
ADMIT 7,275 438 6,837 (10) 6,847 19,025 980 18,045 (228) 18,273 26,300 1,418 24,882 (238) 25,120
PAID DEP 2,049 (186) 2,235 54 2,181 2,759 (327) 3,086 (63) 3,149 4,808 (513) 5,321 (9) 5,330
TRANSFERSAPPLY 654 (17) 671 (96) 767 657 (102) 759 28 731 1,311 (119) 1,430 (68) 1,498
ADMIT 394 (5) 399 (78) 477 357 (87) 444 (26) 470 751 (92) 843 (104) 947
PAID DEP 274 7 267 (57) 324 182 (44) 226 (18) 244 456 (37) 493 (75) 568
APPLY 220 (94) 314 (26) 340 195 (71) 266 1 265 415 (165) 580 (25) 605
ADMIT 149 (42) 191 (28) 219 114 (25) 139 8 131 263 (67) 330 (20) 350
PAID DEP 89 (30) 119 (14) 133 47 (9) 56 3 53 136 (39) 175 (11) 186
APPLY 145 (48) 193 (18) 211 151 (23) 174 9 165 296 (71) 367 (9) 376
ADMIT 105 (8) 113 (24) 137 80 (5) 85 9 76 185 (13) 198 (15) 213
PAID DEP 58 (13) 71 (13) 84 43 7 36 5 31 101 (6) 107 (8) 115
APPLY 1,019 (159) 1,178 (140) 1,318 1,003 (196) 1,199 38 1,161 2,022 (355) 2,377 (102) 2,479
ADMIT 648 (55) 703 (130) 833 551 (117) 668 (9) 677 1,199 (172) 1,371 (139) 1,510
PAID DEP 421 (36) 457 (84) 541 272 (46) 318 (10) 328 693 (82) 775 (94) 869
READMITSAPPLY 69 (5) 74 (37) 111 28 (20) 48 (24) 72 97 (25) 122 (61) 183
ADMIT 52 (11) 63 (20) 83 22 (19) 41 (21) 62 74 (30) 104 (41) 145
PAID DEP 52 (10) 62 (21) 83 22 (18) 40 (22) 62 74 (28) 102 (43) 145
APPLY 28 (17) 45 (1) 46 22 (5) 27 11 16 50 (22) 72 10 62
ADMIT 19 (16) 35 (1) 36 17 (4) 21 11 10 36 (20) 56 10 46
PAID DEP 18 (16) 34 (1) 35 17 (3) 20 10 10 35 (19) 54 9 45
APPLY 20 2 18 4 14 14 3 11 (4) 15 34 5 29 0 29
ADMIT 17 0 17 4 13 14 4 10 (5) 15 31 4 27 (1) 28
PAID DEP 14 2 12 (1) 13 9 3 6 (8) 14 23 5 18 (9) 27
APPLY 117 (20) 137 (34) 171 64 (22) 86 (17) 103 181 (42) 223 (51) 274
ADMIT 88 (27) 115 (17) 132 53 (19) 72 (15) 87 141 (46) 187 (32) 219
PAID DEP 84 (24) 108 (23) 131 48 (18) 66 (20) 86 132 (42) 174 (43) 217
TOTALS – UNH total and 3‐campus total exclude UNH re‐admits in all years*
APPLY 5,257 (129) 5,386 (190) 5,576 15,744 (377) 16,121 238 15,883 21,001 (506) 21,507 48 21,459
ADMIT 3,872 (165) 4,037 (197) 4,234 12,027 (200) 12,227 255 11,972 15,899 (365) 16,264 58 16,206
PAID DEP 1,400 (141) 1,541 (66) 1,607 1,889 (204) 2,093 23 2,070 3,289 (345) 3,634 (43) 3,677
APPLY 2,725 199 2,526 122 2,404 5,733 971 4,762 (194) 4,956 8,458 1,170 7,288 (72) 7,360
ADMIT 2,376 298 2,078 137 1,941 4,699 940 3,759 39 3,720 7,075 1,238 5,837 176 5,661
PAID DEP 643 (81) 724 30 694 638 (67) 705 (58) 763 1,281 (148) 1,429 (28) 1,457
APPLY 1,970 53 1,917 (21) 1,938 3,315 (93) 3,408 (623) 4,031 5,285 (40) 5,325 (644) 5,969
ADMIT 1,711 234 1,477 (77) 1,554 2,881 123 2,758 (525) 3,283 4,592 357 4,235 (602) 4,837
PAID DEP 459 (14) 473 4 469 530 (102) 632 (36) 668 989 (116) 1,105 (32) 1,137
APPLY 9,952 123 9,829 (89) 9,918 24,792 501 24,291 (579) 24,870 34,744 624 34,120 (668) 34,788
ADMIT 7,959 367 7,592 (137) 7,729 19,607 863 18,744 (231) 18,975 27,566 1,230 26,336 (368) 26,704
PAID DEP 2,502 (236) 2,738 (32) 2,770 3,057 (373) 3,430 (71) 3,501 5,559 (609) 6,168 (103) 6,271
USNH/hgh 06/19/2019
Consolidated Undergraduate Admissions Summary
USNH Residential Institutions
Fall 2019 — June 17
RESIDENT NONRESIDENT TOTAL
UNH
PSU
KSC
TOTAL
UNH
PSU
KSC
TOTAL
UNH
PSU
KSC
TOTAL
All institutions report newly entering degree‐seeking undergrads (2‐ / 4‐year). Nonresident includes US citizen, permanent resident, and nonresident alien (international).
UNH
PSU
KSC
TOTAL
Applications reflect total received ‐‐ not necessarily total reviewed with admission decision, admit rate is valid at R30. All campuses report active paid deposit counts.
Transfers may be reported as freshman at UNH depending on incoming number of credits and prior matriculation status. UNH data do not include Navitas students.
Source: Campus R+30 Admissions Reports, UNH (Durham) 06/17/19, 06/17/18, 06/18/17 | PSU 06/17/19, 06/18/18, 06/19/17 | KSC 06/17/19, 06/18/18, 06/19/17
*UNH modification to Leave of Absence policy in 2017 changes the re‐admit enrollment process. Re‐admit counts 2018 forward are not comparable to prior years.

1
UNIVERSITY SYSTEM OF NEW HAMPSHIRE
BOARD OF TRUSTEES
Financial Affairs Committee
Motion Sheet
University System of New Hampshire
To: Financial Affairs Committee
Re: Approve FY20 Operating Budget
PROPOSED MOTION
MOVED, on recommendation of the Chancellor and Presidents, that the following
motion be presented for consideration of the Board of Trustees.
MOVED, on recommendation of the Financial Affairs Committee, that the
operating budget for University System units applicable to the fiscal year
beginning July 1, 2019 and ending June 30, 2020 (FY20) be approved by the
Board of Trustees as presented in the attachments AND FURTHER that
for/during FY20:
1. In the event the State operating appropriations authorized in law are
higher or lower than currently included in the USNH operating budget,
the budget will be adjusted to reflect the final amounts authorized by the
State using the FY20 allocation method for the block grant or as directed
by the State budget.
2. In the event budgeted revenues are not realized by individual campuses
and the System as a whole, expense reductions will be made by the
respective campuses and the System to maintain the campus and overall
System operating margin percentages included in the attachments.
3. Campuses and the System Office are authorized to adjust revenues and
expenses between the attached revenue and expense categories as
needed to meet the attached operating margin % approved.
SUMMARY OF PROPOSED ACTION
This motion approves the all funds operating budget for the University System for FY20.
Agenda Item II.C.

2
RATIONALE FOR PROPOSED ACTION/ PREVIOUS REVIEWS AND APPROVAL
The FY20 operating budget was prepared using the budget planning assumptions and parameters
adopted by the Financial Affairs Committee in January 2019 and using the price of attendance (POA)
approved by the Financial Affairs Committee and Board of Trustees in January 2019. The parameters
have been met/not met as outlined within the attached documents. The Long Range Technology Plan
was approved by the Administrative Board in May 2019 and the estimated FY20 costs have been
included within the attached budget.
As of this date, the State budget process is not complete for FY20. Accordingly, this motion provides
authorization to adjust the operating budget to reflect the final amounts authorized by the State using
the FY20 allocation method for the block grant or as directed by the State budget
RELEVANT GOVERNANCE DOCUMENTS, POLICIES AND PRACTICES
State law (RSA 187-A:16) delegates to the Board of Trustees powers for "... the management and
control of all property and affairs of the University System of New Hampshire, the University of New
Hampshire (including the New Hampshire college of agriculture and the mechanical arts), and all its
divisions and departments, the Keene State College, the Plymouth State University, and the Granite
State College."
Policy BOT IV.A.2.2 states that the Board of Trustees, upon recommendation of the Financial Affairs
Committee, retains sole responsibility for approval of tuition and fees, annual operating budgets,
proportion of nonresident students attending UNH if greater than 25%, and certain other authorities as
it deems necessary.
RESOURCE IMPLICATIONS
Operating Margin:
The proposed FY20 operating budget includes $868 million of Total Operating Revenues (2%
increase compared to the most recent fiscal year 2019 projections) and Total Operating Expenses of
$861 million (1.5% increase compared to the most recent fiscal year 2019 projections). The resulting
consolidated operating margin for USNH if the proposed budget is adopted is 0.8% or $7 million.
Excluding approximately $2.4 million of operating expenses deemed to be strategic and one-time in
nature for PSU, the proposed consolidated operating margin is budgeted at 1.1% or $9.5 million.
Capital Expenditures:
The estimated capital expenditures for FY20 are $95 million of which $76 million is estimated to
be funded by USNH Unrestricted Financial Resources (UFR). The projections include the Board-
approved and System-funded strategic investment for UNH Spaulding Hall Expansion and
Renovation of $8 million in FY20. Annual depreciation expense is approximately $67 million.

3
UFR:Debt Ratio:
The UFR:Debt ratio projected for FY20 is 53% which assumes approval of the proposed Operating
Budget and Capital Expenditure projections noted above.
RISK MANAGEMENT CONSIDERATIONS
There are many assumptions made associated with developing a balanced budget. Some of these
include: the impact on students and their families if tuition is increased; the potential negative effect
of tuition increases on enrollment; the impact on the quality of programs and the ability to meet
strategic goals if the expense budget is reduced; and the financial health and ratings of the University
System of New Hampshire if operating margins and the UFR:Debt ratios are reduced. A list of
additional budget risks and considerations are included within the budget presentation.
SUBSEQUENT ACTION REQUIRED
Approval by the Board of Trustees, to be considered on June 28, 2019.
SUBMITTED BY: APPROVED BY:
Catherine Provencher Todd Leach
Vice Chancellor for Financial Affairs/ Chancellor
Treasurer
Date Prepared: June 19, 2019 For the Meeting of: June 27, 2019
-- End of Motion Sheet --

Financial Presentation and Fund Groupings
• ‘All (Total) Funds’ activity is now broken out into the following fund group:– Gift Funds (Restricted non-capital gifts/restricted endowment payout)– Grant Funds (Restricted and generally reimbursement grants)– All Funds Excluding Gifts and Grants - which includes primarily Unrestricted funds as
outlined below:• General and Education Funds (Unrestricted)• Auxiliary Funds (Unrestricted)• Plant Funds (primarily Unrestricted)• Internally Designated Funds (Unrestricted including unrestricted gifts/unrestricted
endowment payout)• Other very small unrestricted and/or restricted fund types
• Financial Aid % of Total All Funds Gross Tuition Revenue has been added to present abreakdown of the student financial aid by major funding sources.
– Please note that the ‘Financial Aid % of Total All Funds Gross Tuition Revenue’ is notthe same as the ‘Discount Rate %’
• Other Operating Revenue and Expenses – Additional/select details have been provided

13
14
151617
181920212223242526272829303132333435363739404142434546474849505152535455565758596061626364656667686970717273777879808182
A C F J K OP A AF AI AJ AAOA AS AV AW BBBB BF BI BJ B
FY18 Actual
FY19 P2 Projection
FY20 Budget
FY18 Actual
FY19 P2 Projection
FY20 Budget
FY18 Actual
FY19 P2 Projection
FY20 Budget
FY18 Actual
FY19 P2 Projection
FY20 Budget
Resident tuition. $165.3 $166.4 $168.6 $165.3 $166.4 $168.6 $0.0 $0.0 $0.0 $0.0 $0.0 $0.0 Nonresident tuition. 299.7 307.1 313.4 299.7 307.1 313.4 0.0 0.0 0.0 0.0 0.0 0.0 Continuing education tuition. 20.7 19.3 22.6 20.7 19.3 22.4 0.0 0.0 0.2 0.0 0.0 0.0 Student fees revenue. 28.1 28.7 28.6 28.1 28.7 28.5 0.0 0.0 0.0 0.0 $0.0 0.0Gross Tuition Revenue & Fees. 513.9 521.5 533.1 513.8 521.5 532.9 0.0 0.0 0.2 0.0 0.0 0.0
Less: student financial aid. (187.5) (196.1) (202.6) (141.6) (150.0) (155.1) (11.7) (12.1) (13.5) (34.1) (34.0) (34.0)Financial Aid % of Total All Funds Gross Tuition Revenue & Fees. 36.5% 37.6% 38.0% 27.6% 28.8% 29.1% 2.3% 2.3% 2.5% 6.6% 6.5% 6.4% Net Tuition & Fees. 326.4 325.4 330.5 372.2 371.5 377.8 (11.7) (12.1) (13.3) (34.1) (34.0) (34.0) State of New Hampshire general appropriations. 81.0 81.0 81.0 81.0 81.0 81.0 0.0 0.0 0.0 0.0 0.0 0.0 Sales of auxiliary services. 214.8 214.4 217.0 214.8 214.4 217.0 0.0 0.0 0.0 0.0 0.0 0.0 Grants, Contracts and Other Operating Revenue. 227.0 230.7 235.1 65.4 66.5 68.4 28.1 27.4 28.9 133.5 136.8 137.9
Grants & contracts - direct. 105.7 110.0 110.8 0.0 0.0 0.0 0.0 0.0 0.0 105.7 110.0 110.8Grants & contracts - F&A recovery. 21.2 21.6 22.7 21.2 21.6 22.7 0.0 0.0 0.0 0.0 0.0 0.0Federal Pell grants. 26.4 25.9 26.0 0.0 0.0 0.0 0.0 0.0 0.0 26.4 25.9 26.0Operating investment income. 1.7 2.3 2.0 1.6 2.3 2.0 0.1 (0.0) 0.0 0.0 0.0 0.0Noncapital gifts. 14.1 10.8 12.5 1.7 0.8 0.9 12.4 10.0 11.7 0.0 0.0 0.0Endowment income used in operations. 28.0 33.8 35.9 13.8 18.2 19.8 14.2 15.6 16.1 0.0 0.0 0.0Other operating revenue. 29.6 26.1 24.8 26.8 23.3 22.7 1.5 1.8 1.1 1.3 1.0 1.0Other 0.3 0.2 0.2 0.3 0.2 0.2 0.0 0.0 0.0 0.0 0.0 0.0
Total Operating Revenues. 849.2 851.4 863.7 733.4 733.3 744.2 16.4 15.3 15.6 99.4 102.8 103.9
Salaries and wages. 404.3 402.4 411.8 346.9 343.7 352.7 5.7 5.7 4.9 51.6 53.0 54.2 Employee Benefits. 134.1 138.4 142.2 120.2 123.8 129.2 1.5 1.5 1.5 12.3 13.1 14.0 Annual OPEB Adjustment. (5.7) (5.6) (3.2) (5.7) (5.6) (5.6) 0.0 0.0 0.0 0.0 0.0 0.0 Employee Compensation . 532.7 535.2 550.8 461.5 461.9 476.2 7.3 7.1 6.4 63.9 66.1 68.1 Supplies and Services . 208.3 207.7 206.1 167.7 165.9 161.7 7.2 7.3 8.4 33.4 34.5 36.0 Strategic Allocations. (0.0) 0.0 0.0 0.0 0.0 0.0 0.0 0.0 0.0 0.0 0.0 0.0 Utilities. 19.1 19.3 20.4 19.0 19.0 20.1 0.0 0.3 0.3 0.0 0.0 0.0 Depreciation, Plant & Equipment Investment. 65.1 68.3 67.1 65.1 68.3 67.1 0.0 0.0 0.0 0.0 0.0 0.0 Interest and Other Operating Expense. 18.4 17.5 16.6 18.3 17.2 16.4 0.2 0.2 0.2 0.0 0.0 0.0
Interest expense, net. 18.4 17.4 16.6 18.4 17.4 16.6 0.0 0.0 0.0 0.0 0.0 0.0Postretirement medical actuarial expense. 0.0 0.0 0.0 0.0 0.0 0.0 0.0 0.0 0.0 0.0 0.0 0.0All Other. (0.0) 0.0 (0.0) (0.2) (0.2) (0.3) 0.2 0.2 0.2 0.0 0.0 0.0
Total Operating Expenses. 843.6 848.0 861.1 731.6 732.4 741.5 14.6 14.9 15.3 97.4 100.7 104.2
Incremental State of New Hampshire general appropriations. 0.0 0.0 4.5 0.0 0.0 4.5 0.0 0.0 0.0 0.0 0.0 0.0
Net Operating Income or (Loss) (Operating Margin). 5.6 3.4 7.1 1.8 0.9 7.2 1.8 0.4 0.3 2.0 2.1 (0.3) Operating Margin % Including Strategic Investments 0.7% 0.4% 0.8% 0.2% 0.1% 1.0% 10.9% 2.6% 1.6% 2.0% 2.0% -0.3%
Less: One-time Asset Write-offs with O/M Impact (KSC) 2.1 0.0 0.0 2.1 0.0 0.0 0.0 0.0 0.0 0.0 0.0 0.0
Net Operating Income or (Loss) (Operating Margin) - Included in Total USNH 7.7 3.4 7.1 3.9 0.9 7.2 1.8 0.4 0.3 2.0 2.1 (0.3) Operating Margin % Including Strategic Investments - Included in Total USNH 0.9% 0.4% 0.8% 0.5% 0.1% 1.0% 10.9% 2.6% 1.6% 2.0% 2.0% -0.3%
Add Back Strategic Investment Expense 0.0 2.6 2.4 0.0 2.6 2.4 0.0 0.0 0.0 0.0 0.0 0.0
Net Operating Income or (Loss) - Excluding Strategic Investments/Non-Recurring 7.7 6.0 9.5 3.9 3.5 9.6 1.8 0.4 0.3 2.0 2.1 (0.3) Operating Margin % - Excluding Strategic Investments/Non-Recurring 0.9% 0.7% 1.1% 0.5% 0.5% 1.3% 10.9% 2.6% 1.6% 2.0% 2.0% -0.3%
Net Non-Operating Income or (Loss). 50.3 32.3 30.9 54.5 36.9 33.2 (2.8) (2.7) (1.9) (1.3) (1.9) (0.4)
Total Increase(Decrease) in Net Position $58.0 $35.7 $38.0 $58.4 $37.8 $40.4 ($1.0) ($2.3) ($1.6) $0.7 $0.2 ($0.8)
UFR to Debt 62% 59% 53% 62% 59% 52% 0% 0% 0% 0% 0% 0%
All Funds. All Funds Excl Gifts and Grants Non-UFR (G- Gift Funds Only) Non-UFR (P- Grant Funds Only)
University System of New HampshireFY18 - FY20
($ in millions)

13
14
151617
1819202122232425262728293031323334353637394041
434546474849505152535455565758596061626364656667686970717273777879808182
BQ B BV BZ CA CCF CV CY CZ DDED DI DL DM DDRD DV DY DZ E
FY18 Actual
FY19 P2 Projection
FY20 Budget
FY18 Actual
FY19 P2 Projection
FY20 Budget
FY18 Actual
FY19 P2 Projection
FY20 Budget
FY18 Actual
FY19 P2 Projection
FY20 Budget
Resident tuition. $108.3 $109.5 $110.7 $108.3 $109.5 $110.7 $0.0 $0.0 $0.0 $0.0 $0.0 $0.0 Nonresident tuition. 220.3 226.7 232.3 220.3 226.7 232.3 0.0 0.0 0.0 0.0 0.0 0.0 Continuing education tuition. 14.8 14.8 17.5 14.8 14.8 17.5 0.0 0.0 0.0 0.0 0.0 0.0 Student fees revenue. 17.2 18.0 17.7 17.2 18.0 17.7 0.0 0.0 0.0 0.0 0.0 0.0Gross Tuition Revenue & Fees. 360.7 369.0 378.2 360.7 369.0 378.2 0.0 0.0 0.0 0.0 0.0 0.0
Less: student financial aid. (132.8) (138.0) (141.8) (104.8) (109.7) (112.4) (9.6) (9.5) (10.5) (18.3) (18.8) (18.9)Financial Aid % of Total All Funds Gross Tuition Revenue & Fees. 36.8% 37.4% 37.5% 29.1% 29.7% 29.7% 2.7% 2.6% 2.8% 5.1% 5.1% 5.0% Net Tuition & Fees. 227.9 231.1 236.4 255.9 259.4 265.8 (9.6) (9.5) (10.5) (18.3) (18.8) (18.9) State of New Hampshire general appropriations. 55.3 55.3 55.3 55.3 55.3 55.3 0.0 0.0 0.0 0.0 0.0 0.0 Sales of auxiliary services. 149.6 149.4 150.2 149.6 149.4 150.2 0.0 0.0 0.0 0.0 0.0 0.0 Grants, Contracts and Other Operating Revenue. 192.3 191.0 193.3 55.6 52.1 52.8 24.1 22.9 24.3 112.6 116.0 116.2
Grants & contracts - direct. 97.8 101.3 101.4 0.0 0.0 0.0 0.0 0.0 0.0 97.8 101.3 101.4Grants & contracts - F&A recovery. 20.5 21.0 22.0 20.5 21.0 22.0 0.0 0.0 0.0 0.0 0.0 0.0Federal Pell grants. 13.6 13.8 13.8 0.0 0.0 0.0 0.0 0.0 0.0 13.6 13.8 13.8Operating investment income. 6.6 6.6 6.5 6.6 6.6 6.5 0.0 (0.0) 0.0 0.0 0.0 0.0Noncapital gifts. 12.3 9.0 10.2 1.4 0.6 0.5 10.9 8.4 9.7 0.0 0.0 0.0Endowment income used in operations. 17.7 18.4 19.5 5.5 5.2 5.9 12.2 13.2 13.6 0.0 0.0 0.0Other operating revenue. 23.9 20.9 19.9 21.6 18.7 17.9 1.0 1.3 1.1 1.3 0.9 1.0Other 0.0 0.0 0.0 0.0 0.0 0.0 0.0 0.0 0.0 0.0 0.0 0.0
Total Operating Revenues 625.2 626.9 635.2 516.4 516.3 524.2 14.5 13.3 13.8 94.3 97.3 97.3
Salaries and wages. 296.1 295.8 302.5 242.7 241.2 247.8 5.3 5.2 4.5 48.1 49.3 50.1 Employee Benefits 96.7 97.0 101.8 83.7 83.5 87.5 1.4 1.3 1.3 11.6 12.1 13.1 Annual OPEB Adjustment 0.0 (4.0) (2.3) 0.0 (4.0) (2.3) 0.0 0.0 0.0 0.0 0.0 0.0 Employee Compensation . 392.8 388.7 402.0 326.4 320.7 333.0 6.7 6.5 5.9 59.7 61.4 63.2 Supplies and Services . 147.9 148.9 148.4 109.7 109.9 107.2 6.1 5.9 7.4 32.1 33.1 33.8 Strategic Allocations. (0.2) (0.2) (0.2) (0.2) (0.2) (0.2) 0.0 0.0 0.0 0.0 0.0 0.0 Utilities. 9.5 8.9 9.8 9.5 8.6 9.5 0.0 0.3 0.3 0.0 0.0 0.0 Depreciation, Plant & Equipment Investment. 47.2 50.2 48.7 47.2 50.2 48.7 0.0 0.0 0.0 0.0 0.0 0.0 Interest and Other Operating Expense. 15.0 14.6 14.5 14.8 14.4 14.3 0.2 0.2 0.2 0.0 0.0 0.0
Interest expense, net. 8.0 7.4 7.0 8.0 7.4 7.0 0.0 0.0 0.0 0.0 0.0 0.0Postretirement medical actuarial expense. 0.0 0.0 0.0 0.0 0.0 0.0 0.0 0.0 0.0 0.0 0.0 0.0All Other. 6.9 7.2 7.6 6.8 7.0 7.3 0.2 0.2 0.2 0.0 0.0 0.0
Total Operating Expenses. 612.1 611.2 623.2 507.3 503.7 512.4 13.0 13.0 13.8 91.8 94.5 97.1
Incremental State of New Hampshire general appropriations. 0.0 0.0 3.1 0.0 0.0 3.1 0.0 0.0 0.0 0.0 0.0 0.0
Net Operating Income or (Loss) (Operating Margin). 13.1 15.7 15.1 9.1 12.6 14.9 1.5 0.4 0.0 2.5 2.7 0.2 Operating Margin % Including Strategic Investments 2.1% 2.5% 2.4% 1.8% 2.4% 2.8% 10.3% 2.8% 0.2% 2.7% 2.8% 0.2%
Less: One-time Asset Write-offs with O/M Impact (KSC)
Net Operating Income or (Loss) (Operating Margin) - Included in Total USNH 13.1 15.7 15.1 9.1 12.6 14.9 1.5 0.4 0.0 2.5 2.7 0.2 Operating Margin % Including Strategic Investments - Included in Total USNH 2.1% 2.5% 2.4% 1.8% 2.4% 2.8% 10.3% 2.8% 0.2% 2.7% 2.8% 0.2%
Add Back Strategic Investment Expense 0.0 0.0 0.0 0.0 0.0 0.0 0.0 0.0 0.0 0.0 0.0 0.0
Net Operating Income or (Loss) - Excluding Strategic Investments/Non-Recurring 13.1 15.7 15.1 9.1 12.6 14.9 1.5 0.4 0.0 2.5 2.7 0.2 Operating Margin % - Excluding Strategic Investments/Non-Recurring 2.1% 2.5% 2.4% 1.8% 2.4% 2.8% 10.3% 2.8% 0.2% 2.7% 2.8% 0.2%
Net Non-Operating Income or (Loss). 24.6 27.1 33.1 28.9 32.3 35.5 (2.3) (2.6) (1.5) (2.0) (2.5) (1.0)
Total Increase(Decrease) in Net Position $37.7 $42.8 $48.2 $38.0 $44.9 $50.4 ($0.8) ($2.3) ($1.5) $0.6 $0.2 ($0.8)
UFR to Debt 25% 27% 19% 25% 27% 18% 0% 0% 0% 0% 0% 0%
All Funds. Non-UFR (G - Gift Funds Only) Non-UFR (P- Grant Funds Only)All Funds Excl Gifts and Grants
University of New HampshireFY18 - FY20
($ in millions)

13
14
151617
1819202122232425262728293031323334353637394041
434546474849505152535455565758596061626364656667686970717273777879808182
EG E EL EP EQ EEVF FL FO FP FFUF FY GB GC GGHG GL GO GP G
FY18 Actual
FY19 P2 Projection
FY20 Budget
FY18 Actual
FY19 P2 Projection
FY20 Budget
FY18 Actual
FY19 P2 Projection
FY20 Budget
FY18 Actual
FY19 P2 Projection
FY20 Budget
Resident tuition. $28.3 $29.1 $29.2 $28.3 $29.1 $29.2 $0.0 $0.0 $0.0 $0.0 $0.0 $0.0 Nonresident tuition. 36.7 39.7 40.6 36.7 39.7 40.6 0.0 0.0 0.0 0.0 0.0 0.0 Continuing education tuition. 2.7 1.2 1.4 2.7 1.2 1.4 0.0 0.0 0.0 0.0 0.0 0.0 Student fees revenue. 5.2 5.2 5.3 5.2 5.2 5.3 0.0 0.0 0.0 0.0 0.0 0.0Gross Tuition Revenue & Fees. 72.8 75.3 76.5 72.8 75.3 76.5 0.0 0.0 0.0 0.0 0.0 0.0
Less: student financial aid. (25.9) (29.0) (31.1) (18.6) (21.8) (23.6) (0.8) (0.9) (1.3) (6.6) (6.4) (6.3)Financial Aid % of Total All Funds Gross Tuition Revenue & Fees. 35.5% 38.6% 40.7% 25.5% 29.0% 30.8% 1.0% 1.2% 1.6% 9.0% 8.4% 8.2% Net Tuition & Fees. 47.0 46.3 45.3 54.3 53.5 52.9 (0.8) (0.9) (1.3) (6.6) (6.4) (6.3) State of New Hampshire general appropriations. 11.5 11.5 11.5 11.5 11.5 11.5 0.0 0.0 0.0 0.0 0.0 0.0 Sales of auxiliary services. 31.5 32.0 33.0 31.5 32.0 33.0 0.0 0.0 0.0 0.0 0.0 0.0 Grants, Contracts and Other Operating Revenue. 13.8 14.0 14.3 4.0 3.9 3.9 1.3 1.7 1.7 8.4 8.4 8.7
Grants & contracts - direct. 2.7 3.0 3.1 0.0 0.0 0.0 0.0 0.0 0.0 2.7 3.0 3.1Grants & contracts - F&A recovery. 0.2 0.2 0.3 0.2 0.2 0.3 0.0 0.0 0.0 0.0 0.0 0.0Federal Pell grants. 5.7 5.5 5.6 0.0 0.0 0.0 0.0 0.0 0.0 5.7 5.5 5.6Operating investment income. 1.2 1.4 1.2 1.2 1.4 1.2 (0.0) 0.0 0.0 0.0 0.0 0.0Noncapital gifts. 0.7 0.7 1.1 0.2 0.1 0.2 0.5 0.7 0.9 0.0 0.0 0.0Endowment income used in operations. 0.7 1.0 1.2 0.1 0.2 0.3 0.6 0.8 0.8 0.0 0.0 0.0Other operating revenue. 2.5 2.3 1.9 2.3 2.1 1.9 0.2 0.2 0.0 0.1 0.0 0.0Other 0.0 0.0 0.0 0.0 0.0 0.0 0.0 0.0 0.0 0.0 0.0 0.0
Total Operating Revenues 103.7 103.8 104.1 101.3 100.9 101.3 0.6 0.8 0.4 1.9 2.1 2.4
Salaries and wages. 44.9 46.3 46.5 43.7 45.0 45.2 0.0 0.0 0.0 1.2 1.3 1.3 Employee Benefits 14.4 15.5 15.5 14.2 15.3 15.4 0.0 0.0 0.0 0.1 0.2 0.1 Annual OPEB Adjustment 0.0 (0.7) (0.4) 0.0 (0.7) (0.4) 0.0 0.0 0.0 0.0 0.0 0.0 Employee Compensation . 59.3 61.1 61.6 58.0 59.5 60.2 0.0 0.0 0.0 1.3 1.6 1.4 Supplies and Services . 23.9 23.9 24.0 22.9 22.5 22.5 0.5 0.9 0.4 0.5 0.5 1.0 Strategic Allocations. (0.3) (0.1) (0.1) (0.3) (0.1) (0.1) 0.0 0.0 0.0 0.0 0.0 0.0 Utilities. 5.0 5.4 5.7 5.0 5.4 5.7 0.0 0.0 0.0 0.0 0.0 0.0 Depreciation, Plant & Equipment Investment. 8.6 9.3 9.4 8.6 9.3 9.4 0.0 0.0 0.0 0.0 0.0 0.0 Interest and Other Operating Expense. 6.2 6.1 5.9 6.2 6.1 5.9 0.0 0.0 0.0 0.0 0.0 0.0
Interest expense, net. 3.9 3.7 3.5 3.9 3.7 3.5 0.0 0.0 0.0 0.0 0.0 0.0Postretirement medical actuarial expense. 0.0 0.0 0.0 0.0 0.0 0.0 0.0 0.0 0.0 0.0 0.0 0.0All Other. 2.3 2.4 2.4 2.3 2.4 2.4 0.0 0.0 0.0 0.0 0.0 0.0
Total Operating Expenses. 102.7 105.7 106.5 100.4 102.7 103.6 0.5 0.9 0.5 1.8 2.1 2.4
Incremental State of New Hampshire general appropriations. 0.0 0.0 0.6 0.0 0.0 0.6 0.0 0.0 0.0 0.0 0.0 0.0
Net Operating Income or (Loss) (Operating Margin). 1.0 (1.9) (1.7) 0.9 (1.8) (1.7) 0.0 (0.1) (0.0) 0.1 (0.0) 0.0 Operating Margin % Including Strategic Investments 1.0% -1.8% -1.7% 0.9% -1.8% -1.7% 4.6% -8.0% -1.1% 4.1% -1.0% 0.0%
Less: One-time Asset Write-offs with O/M Impact (KSC)
Net Operating Income or (Loss) (Operating Margin) - Included in Total USNH 1.0 (1.9) (1.7) 0.9 (1.8) (1.7) 0.0 (0.1) (0.0) 0.1 (0.0) 0.0 Operating Margin % Including Strategic Investments - Included in Total USNH 1.0% -1.8% -1.7% 0.9% -1.8% -1.7% 4.6% -8.0% -1.1% 4.1% -1.0% 0.0%
Add Back Strategic Investment Expense 0.0 2.6 2.4 0.0 2.6 2.4 0.0 0.0 0.0 0.0 0.0 0.0
Net Operating Income or (Loss) - Excluding Strategic Investments/Non-Recurring 1.0 0.7 0.7 0.9 0.8 0.7 0.0 (0.1) (0.0) 0.1 (0.0) 0.0 Operating Margin % - Excluding Strategic Investments/Non-Recurring 1.0% 0.7% 0.6% 0.9% 0.8% 0.7% 4.6% -8.0% -1.1% 4.1% -1.0% 0.0%
Net Non-Operating Income or (Loss). 5.4 1.4 0.8 4.7 1.4 1.2 0.7 0.0 (0.4) 0.0 0.0 0.0
Total Increase(Decrease) in Net Position $6.4 ($0.5) ($1.0) $5.6 ($0.4) ($0.6) $0.7 ($0.1) ($0.4) $0.1 $0.0 $0.0
UFR to Debt 9% -3% -12% 9% -3% -12% 0% 0% 0% 0% 0% 0%
All Funds. All Funds Excl Gifts and Grants Non-UFR (G- Gift Funds Only) Non-UFR (P- Grant Funds Only)
Plymouth State UniversityFY18 - FY20
($ in millions)

13
14
151617
1819202122232425262728293031323334353637394041
434546474849505152535455565758596061626364656667686970717273777879808182
GW G HB HF HG HHLH IB IE IF IJIKIL IO IR IS IWIXIY JB JE JF JJ
FY18 Actual
FY19 P2 Projection
FY20 Budget
FY18 Actual
FY19 P2 Projection
FY20 Budget
FY18 Actual
FY19 P2 Projection
FY20 Budget
FY18 Actual
FY19 P2 Projection
FY20 Budget
Resident tuition. $18.0 $17.1 $18.0 $18.0 $17.1 $18.0 $0.0 $0.0 $0.0 $0.0 $0.0 $0.0 Nonresident tuition. 39.9 38.0 37.9 39.9 38.0 37.9 0.0 0.0 0.0 0.0 0.0 0.0 Continuing education tuition. 2.4 2.3 2.6 2.4 2.3 2.6 0.0 0.0 0.0 0.0 0.0 0.0 Student fees revenue. 5.0 4.8 4.9 5.0 4.8 4.9 0.0 0.0 0.0 0.0 0.0 0.0Gross Tuition Revenue & Fees. 65.3 62.2 63.3 65.3 62.2 63.3 0.0 0.0 0.0 0.0 0.0 0.0
Less: student financial aid. (23.3) (23.6) (24.0) (17.5) (17.5) (18.1) (1.2) (1.5) (1.5) (4.7) (4.6) (4.4)Financial Aid % of Total All Funds Gross Tuition Revenue & Fees. 35.7% 38.0% 37.8% 26.7% 28.2% 28.5% 1.8% 2.4% 2.3% 7.2% 7.5% 7.0% Net Tuition & Fees. 42.0 38.5 39.4 47.9 44.7 45.3 (1.2) (1.5) (1.5) (4.7) (4.6) (4.4) State of New Hampshire general appropriations. 11.0 11.0 11.0 11.0 11.0 11.0 0.0 0.0 0.0 0.0 0.0 0.0 Sales of auxiliary services. 33.6 32.9 33.8 33.6 32.9 33.8 0.0 0.0 0.0 0.0 0.0 0.0 Grants, Contracts and Other Operating Revenue. 14.3 13.7 14.5 4.7 4.5 4.9 2.2 2.3 2.4 7.4 7.0 7.2
Grants & contracts - direct. 3.4 3.1 3.3 0.0 0.0 0.0 0.0 0.0 0.0 3.4 3.1 3.3Grants & contracts - F&A recovery. 0.4 0.4 0.4 0.4 0.4 0.4 0.0 0.0 0.0 0.0 0.0 0.0Federal Pell grants. 4.1 3.9 3.9 0.0 0.0 0.0 0.0 0.0 0.0 4.1 3.9 3.9Operating investment income. 1.4 1.4 1.4 1.4 1.4 1.4 0.1 0.0 0.0 0.0 0.0 0.0Noncapital gifts. 1.1 1.0 1.2 0.1 0.1 0.1 1.0 0.9 1.1 0.0 0.0 0.0Endowment income used in operations. 1.4 1.6 1.6 0.2 0.3 0.3 1.1 1.3 1.3 0.0 0.0 0.0Other operating revenue. 2.6 2.3 2.7 2.6 2.3 2.7 0.1 0.1 0.0 0.0 0.0 0.0Other 0.0 0.0 0.0 0.0 0.0 0.0 0.0 0.0 0.0 0.0 0.0 0.0
Total Operating Revenues 101.0 96.1 98.7 97.2 93.0 95.0 1.0 0.8 1.0 2.8 2.3 2.8
Salaries and wages. 45.3 42.4 44.0 43.3 40.8 42.2 0.2 0.2 0.2 1.8 1.4 1.6 Employee Benefits 15.7 14.7 15.2 15.2 14.2 14.8 0.1 0.1 0.1 0.4 0.4 0.3 Annual OPEB Adjustment 0.0 (0.7) (0.4) 0.0 (0.7) (0.4) 0.0 0.0 0.0 0.0 0.0 0.0 Employee Compensation . 61.0 56.4 58.8 58.5 54.3 56.5 0.3 0.3 0.3 2.191 1.8 1.9 Supplies and Services . 26.0 23.0 22.5 24.7 21.9 21.1 0.5 0.4 0.5 0.7 0.7 0.9 Strategic Allocations. (0.8) (0.1) (0.1) (0.8) (0.1) (0.1) 0.0 0.0 0.0 0.0 0.0 0.0 Utilities. 4.4 4.8 4.7 4.4 4.8 4.7 0.0 0.0 0.0 0.0 0.0 0.0 Depreciation, Plant & Equipment Investment. 8.6 8.1 8.5 8.6 8.1 8.5 0.0 0.0 0.0 0.0 0.0 0.0 Interest and Other Operating Expense. 6.5 6.3 6.0 6.5 6.3 6.0 0.0 0.0 0.0 0.0 0.0 0.0
Interest expense, net. 3.8 3.7 3.5 3.8 3.7 3.5 0.0 0.0 0.0 0.0 0.0 0.0Postretirement medical actuarial expense. 0.0 0.0 0.0 0.0 0.0 0.0 0.0 0.0 0.0 0.0 0.0 0.0All Other. 2.6 2.6 2.4 2.6 2.6 2.4 0.0 0.0 0.0 0.0 0.0 0.0
Total Operating Expenses. 105.5 98.4 100.3 101.8 95.2 96.7 0.8 0.7 0.8 2.9 2.4 2.9
Incremental State of New Hampshire general appropriations. 0.0 0.0 0.6 0.0 0.0 0.6 0.0 0.0 0.0 0.0 0.0 0.0
Net Operating Income or (Loss) (Operating Margin). (4.5) (2.3) (1.0) (4.6) (2.2) (1.1) 0.3 0.1 0.2 (0.2) (0.1) (0.1) Operating Margin % Including Strategic Investments -4.5% -2.4% -1.0% -4.8% -2.4% -1.2% 24.3% 8.0% 22.7% -6.4% -4.8% -3.0%
Less: One-time Asset Write-offs with O/M Impact (KSC) 2.1 2.1
Net Operating Income or (Loss) (Operating Margin) - Included in Total USNH (2.4) (2.3) (1.0) (2.5) (2.2) (1.1) 0.3 0.1 0.2 (0.2) (0.1) (0.1) Operating Margin % Including Strategic Investments - Included in Total USNH -2.4% -2.4% -1.0% -2.6% -2.4% -1.2% 24.3% 8.0% 22.7% -6.4% -4.8% -3.0%
Add Back Strategic Investment Expense 0.0 0.0 0.0 0.0 0.0 0.0 0.0 0.0 0.0 0.0 0.0 0.0
Net Operating Income or (Loss) - Excluding Strategic Investments/Non-Recurring (2.4) (2.3) (1.0) (2.5) (2.2) (1.1) 0.3 0.1 0.2 (0.2) (0.1) (0.1) Operating Margin % - Excluding Strategic Investments/Non-Recurring -2.4% -2.4% -1.0% -2.6% -2.4% -1.2% 24.3% 8.0% 22.7% -6.4% -4.8% -3.0%
Net Non-Operating Income or (Loss). 2.1 1.3 (1.5) 3.1 1.3 (1.5) (1.2) (0.1) 0.0 0.2 0.1 0.1
Total Increase(Decrease) in Net Position ($0.4) ($0.9) ($2.4) $0.6 ($0.9) ($2.7) ($1.0) ($0.0) $0.2 $0.0 ($0.0) $0.0
UFR to Debt 26% 23% 17% 26% 23% 16% 0% 0% 0% 0% 0% 0%
All Funds Excl Gifts and Grants Non-UFR (G- Gift Funds Only) Non-UFR (P- Grant Funds Only)All Funds.
Keene State CollegeFY18 - FY20
($ in millions)

13
14
151617
181920212223242526272829303132333435363739404142434546474849505152535455565758596061626364656667686970717273777879808182
JM J JR JV JW KKBK KR KU KV KLAL LE LH LI LLNL LR LU LV L
FY18 Actual
FY19 P2 Projection
FY20 Budget
FY18 Actual
FY19 P2 Projection
FY20 Budget
FY18 Actual
FY19 P2 Projection
FY20 Budget
FY18 Actual
FY19 P2 Projection
FY20 Budget
Resident tuition. $10.7 $10.6 $10.7 $10.7 $10.6 $10.7 $0.0 $0.0 $0.0 $0.0 $0.0 $0.0 Nonresident tuition. 2.7 2.7 2.6 2.7 2.7 2.6 0.0 0.0 0.0 0.0 0.0 0.0 Continuing education tuition. 0.8 0.9 1.1 0.8 0.9 0.9 0.0 0.0 0.2 0.0 0.0 0.0 Student fees revenue. 0.7 0.7 0.7 0.7 0.6 0.7 0.0 0.0 0.0 0.0 0.0 0.0Gross Tuition Revenue & Fees. 15.0 14.9 15.1 15.0 14.9 14.9 0.0 0.0 0.2 0.0 0.0 0.0
Less: student financial aid. (5.5) (5.5) (5.6) (0.8) (1.0) (1.0) (0.2) (0.2) (0.2) (4.5) (4.3) (4.4)Financial Aid % of Total All Funds Gross Tuition Revenue & Fees. 36.7% 36.6% 37.3% 5.5% 6.5% 6.6% 1.3% 1.5% 1.6% 30.0% 28.6% 29.1% Net Tuition & Fees. 9.5 9.5 9.4 14.1 13.9 13.9 (0.2) (0.2) (0.1) (4.5) (4.3) (4.4) State of New Hampshire general appropriations. 3.2 3.2 3.2 3.2 3.2 3.2 0.0 0.0 0.0 0.0 0.0 0.0 Sales of auxiliary services. 0.0 0.0 0.0 0.0 0.0 0.0 0.0 0.0 0.0 0.0 0.0 0.0 Grants, Contracts and Other Operating Revenue. 6.0 6.6 6.8 0.6 0.7 0.6 0.5 0.6 0.4 4.9 5.4 5.8
Grants & contracts - direct. 1.9 2.7 3.0 0.0 0.0 0.0 0.0 0.0 0.0 1.9 2.7 3.0Grants & contracts - F&A recovery. 0.0 0.0 0.1 0.0 0.0 0.1 0.0 0.0 0.0 0.0 0.0 0.0Federal Pell grants. 3.0 2.7 2.8 0.0 0.0 0.0 0.0 0.0 0.0 3.0 2.7 2.8Operating investment income. 0.4 0.4 0.4 0.4 0.4 0.4 0.0 0.0 0.0 0.0 0.0 0.0Noncapital gifts. 0.0 0.0 0.0 0.0 0.0 0.0 0.0 0.0 0.0 0.0 0.0 0.0Endowment income used in operations. 0.3 0.3 0.3 0.0 0.0 0.0 0.3 0.3 0.3 0.0 0.0 0.0Other operating revenue. 0.4 0.4 0.2 0.2 0.2 0.1 0.2 0.2 0.1 0.0 0.0 0.0Other 0.0 0.0 0.0 0.0 0.0 0.0 0.0 0.0 0.0 0.0 0.0 0.0
Total Operating Revenues 18.7 19.3 19.5 17.9 17.8 17.7 0.3 0.4 0.4 0.4 1.1 1.5
Salaries and wages. 10.2 9.9 10.5 9.4 8.7 9.1 0.2 0.2 0.2 0.6 1.0 1.2 Employee Benefits 3.2 3.1 3.3 2.9 2.6 2.8 0.1 0.1 0.1 0.2 0.4 0.4 Annual OPEB Adjustment 0.0 (0.1) (0.1) 0.0 (0.1) (0.1) 0.0 0.0 0.0 0.0 0.0 0.0 Employee Compensation . 13.3 12.8 13.7 12.3 11.2 11.8 0.2 0.2 0.2 0.8 1.4 1.7 Supplies and Services . 3.7 4.2 3.8 3.5 3.9 3.5 0.1 0.1 0.1 0.1 0.2 0.2 Strategic Allocations. (0.2) (0.0) (0.0) (0.2) (0.0) (0.0) 0.0 0.0 0.0 0.0 0.0 0.0 Utilities. 0.1 0.1 0.1 0.1 0.1 0.1 0.0 0.0 0.0 0.0 0.0 0.0 Depreciation, Plant & Equipment Investment. 0.4 0.4 0.4 0.4 0.4 0.4 0.0 0.0 0.0 0.0 0.0 0.0 Interest and Other Operating Expense. 0.3 0.4 0.4 0.3 0.4 0.4 0.0 0.0 0.0 0.0 0.0 0.0
Interest expense, net. 0.0 0.0 0.0 0.0 0.0 0.0 0.0 0.0 0.0 0.0 0.0 0.0Postretirement medical actuarial expense. 0.0 0.0 0.0 0.0 0.0 0.0 0.0 0.0 0.0 0.0 0.0 0.0All Other. 0.3 0.4 0.4 0.3 0.4 0.4 0.0 0.0 0.0 0.0 0.0 0.0
Total Operating Expenses. 17.7 17.9 18.5 16.4 16.0 16.2 0.3 0.3 0.3 0.9 1.6 1.9
Incremental State of New Hampshire general appropriations. 0.0 0.0 0.2 0.0 0.0 0.2 0.0 0.0 0.0 0.0 0.0 0.0
Net Operating Income or (Loss) (Operating Margin). 1.1 1.4 1.2 1.5 1.8 1.7 0.0 0.0 0.0 (0.5) (0.5) (0.5) Operating Margin % Including Strategic Investments 5.7% 7.1% 6.2% 8.4% 10.3% 9.3% 6.9% 8.4% 2.6% -102.3% -43.7% -31.7%
Less: One-time Asset Write-offs with O/M Impact (KSC)
Net Operating Income or (Loss) (Operating Margin) - Included in Total USNH 1.1 1.4 1.2 1.5 1.8 1.7 0.0 0.0 0.0 (0.5) (0.5) (0.5) Operating Margin % Including Strategic Investments - Included in Total USNH 5.7% 7.1% 6.2% 8.4% 10.3% 9.3% 6.9% 8.4% 2.6% -102.3% -43.7% -31.7%
Add Back Strategic Investment Expense 0.0 0.0 0.0 0.0 0.0 0.0 0.0 0.0 0.0 0.0 0.0 0.0
Net Operating Income or (Loss) - Excluding Strategic Investments/Non-Recurring 1.1 1.4 1.2 1.5 1.8 1.7 0.0 0.0 0.0 (0.5) (0.5) (0.5) Operating Margin % - Excluding Strategic Investments/Non-Recurring 5.7% 7.1% 6.2% 8.4% 10.3% 9.3% 6.9% 8.4% 2.6% -102.3% -43.7% -31.7%
Net Non-Operating Income or (Loss). 0.7 0.5 0.1 0.2 0.1 (0.4) 0.0 0.0 0.0 0.5 0.5 0.5
Total Increase(Decrease) in Net Position $1.8 $1.9 $1.3 $1.7 $1.9 $1.3 $0.0 $0.0 $0.0 ($0.0) $0.0 $0.0
UFR to Debt n/a n/a n/a 0.0% 0.0% 0% 0.0% 0.0% 0% 0.0% - 0%
All Funds. All Funds Excl Gifts and Grants Non-UFR (G- Gift Funds Only) Non-UFR (P- Grant Funds Only)
Granite State CollegeFY18 - FY20
($ in millions)

13
14
151617
1819202122232425262728293031323334353637394041
434546474849505152535455565758596061626364656667686970717273777879808182
MC M MH ML MM MMN NH NK NL NNQN NV NY NZ OO O OI OL OM O
FY18 Actual
FY19 P2 Projection
FY20 Budget
FY18 Actual
FY19 P2 Projection
FY20 Budget
FY18 Actual
FY19 P2 Projection
FY20 Budget
FY18 Actual
FY19 P2 Projection
FY20 Budget
Resident tuition. $0.0 $0.0 $0.0 $0.0 $0.0 $0.0 $0.0 $0.0 $0.0 $0.0 $0.0 $0.0 Nonresident tuition. 0.0 0.0 0.0 0.0 0.0 0.0 0.0 0.0 0.0 0.0 0.0 0.0 Continuing education tuition. 0.0 0.0 0.0 0.0 0.0 0.0 0.0 0.0 0.0 0.0 0.0 0.0 Student fees revenue. 0.0 0.0 0.0 0.0 0.0 0.0 0.0 0.0 0.0 0.0 0.0 0.0Gross Tuition Revenue & Fees. 0.0 0.0 0.0 0.0 0.0 0.0 0.0 0.0 0.0 0.0 0.0 0.0
Less: student financial aid. (0.0) 0.0 0.0 0.0 0.0 0.0 (0.0) 0.0 0.0 0.0 0.0 0.0Financial Aid % of Total All Funds Gross Tuition Revenue & Fees. 0.0% 0.0% 0.0% 0.0% 0.0% 0.0% 0.0% 0.0% 0.0% 0.0% 0.0% 0.0% Net Tuition & Fees. (0.0) 0.0 0.0 0.0 0.0 0.0 (0.0) 0.0 0.0 0.0 0.0 0.0 State of New Hampshire general appropriations. 0.0 0.0 0.0 0.0 0.0 0.0 0.0 0.0 0.0 0.0 0.0 0.0 Sales of auxiliary services. 0.0 0.0 0.0 0.0 0.0 0.0 0.0 0.0 0.0 0.0 0.0 0.0 Grants, Contracts and Other Operating Revenue. 0.6 5.3 6.2 0.6 5.3 6.1 0.0 0.0 0.0 0.0 0.0 0.0
Grants & contracts - direct. 0.0 0.0 0.0 0.0 0.0 0.0 0.0 0.0 0.0 0.0 0.0 0.0Grants & contracts - F&A recovery. 0.0 0.0 0.0 0.0 0.0 0.0 0.0 0.0 0.0 0.0 0.0 0.0Federal Pell grants. 0.0 0.0 0.0 0.0 0.0 0.0 0.0 0.0 0.0 0.0 0.0 0.0Operating investment income. (7.9) (7.6) (7.5) (7.9) (7.6) (7.5) 0.0 0.0 0.0 0.0 0.0 0.0Noncapital gifts. 0.0 0.0 0.0 0.0 0.0 0.0 0.0 0.0 0.0 0.0 0.0 0.0Endowment income used in operations. 8.0 12.5 13.3 8.0 12.5 13.3 0.0 0.0 0.0 0.0 0.0 0.0Other operating revenue. 0.2 0.1 0.1 0.2 0.1 0.1 0.0 0.0 0.0 0.0 0.0 0.0Other 0.3 0.2 0.2 0.3 0.2 0.2 0.0 0.0 0.0 0.0 0.0 0.0
Total Operating Revenues 0.6 5.3 6.2 0.6 5.3 6.1 0.0 0.0 0.0 0.0 0.0 0.0
Salaries and wages. 7.8 8.0 8.4 7.8 8.0 8.4 0.0 0.0 0.0 0.0 0.0 0.0 Employee Benefits 4.2 8.2 6.3 4.2 8.2 6.3 0.0 0.0 0.0 0.0 0.0 0.0 Annual OPEB Adjustment (5.7) (0.1) 0.0 (5.7) (0.1) 0.0 0.0 0.0 0.0 0.0 0.0 0.0 Employee Compensation . 6.4 16.2 14.7 6.4 16.2 14.7 0.0 0.0 0.0 0.0 0.0 0.0 Supplies and Services . 6.9 7.7 7.4 6.9 7.7 7.4 0.0 0.0 0.0 0.0 0.0 0.0 Strategic Allocations. 1.5 0.4 0.4 1.5 0.4 0.4 0.0 0.0 0.0 0.0 0.0 0.0 Utilities. 0.1 0.1 0.1 0.1 0.1 0.1 0.0 0.0 0.0 0.0 0.0 0.0 Depreciation, Plant & Equipment Investment. 0.3 0.3 0.2 0.3 0.3 0.2 0.0 0.0 0.0 0.0 0.0 0.0 Interest and Other Operating Expense. (9.5) (9.9) (10.2) (9.5) (9.9) (10.2) 0.0 0.0 0.0 0.0 0.0 0.0
Interest expense, net. 2.7 2.6 2.6 2.7 2.6 2.6 0.0 0.0 0.0 0.0 0.0 0.0Postretirement medical actuarial expense. 0.0 0.0 0.0 0.0 0.0 0.0 0.0 0.0 0.0 0.0 0.0 0.0All Other. (12.2) (12.5) (12.8) (12.2) (12.5) (12.8) 0.0 0.0 0.0 0.0 0.0 0.0
Total Operating Expenses. 5.6 14.8 12.6 5.6 14.8 12.6 0.0 0.0 0.0 0.0 0.0 0.0
Incremental State of New Hampshire general appropriations. 0.0 0.0 0.0 0.0 0.0 0.0 0.0 0.0 0.0 0.0 0.0 0.0
Net Operating Income or (Loss) (Operating Margin). (5.0) (9.5) (6.5) (5.0) (9.5) (6.5) 0.0 0.0 0.0 0.0 0.0 0.0 Operating Margin % Including Strategic Investments -895.6% -180.2% -105.0% -899.4% -180.4% -105.1% 100.0% 100.0% 100.0% 0.0% 0.0% 0.0%
Less: One-time Asset Write-offs with O/M Impact (KSC)
Net Operating Income or (Loss) (Operating Margin) - Included in Total USNH (5.0) (9.5) (6.5) (5.0) (9.5) (6.5) 0.0 0.0 0.0 0.0 0.0 0.0 Operating Margin % Including Strategic Investments - Included in Total USNH -895.6% -180.2% -105.0% -899.4% -180.4% -105.1% 100.0% 100.0% 100.0% n/a n/a n/a
Add Back Strategic Investment Expense 0.0 0.0 0.0 0.0 0.0 0.0 0.0 0.0 0.0 0.0 0.0 0.0
Net Operating Income or (Loss) - Excluding Strategic Investments/Non-Recurring (5.0) (9.5) (6.5) (5.0) (9.5) (6.5) 0.0 0.0 0.0 0.0 0.0 0.0 Operating Margin % - Excluding Strategic Investments/Non-Recurring -895.6% -180.2% -105.0% -899.4% -180.4% -105.1% 100.0% 100.0% 100.0% 0.0% 0.0% 0.0%
Net Non-Operating Income or (Loss). 17.5 1.8 (1.6) 17.5 1.8 (1.6) 0.0 0.0 0.0 0.0 0.0 0.0
Total Increase(Decrease) in Net Position $12.5 ($7.7) ($8.1) $12.5 ($7.7) ($8.1) $0.0 $0.0 $0.0 $0.0 $0.0 $0.0
UFR to Debt n/a n/a n/a 241.2% 231.1% 229% 0.0% 0.0% 0% 0.0% 0.0% 0%
All Funds. Non-UFR (P- Grant Funds Only)All Funds Excl Gifts and Grants Non-UFR (G- Gift Funds Only)
System OfficeFY18 - FY20

UNIVERSITY SYSTEM OF NEW HAMPSHIRE BOARD OF TRUSTEES
Financial Affairs Committee Information Items
Supporting Materials Summary Sheet
University System of New Hampshire
To: Financial Affairs Committee Re: Capital Projects Update – For Information Only, No Action Required
SUPPORTING MATERIALS (attached) – SUMMARY AND SALIENT INFORMATION
• UNH report on capital projects:o Water Treatment Planto Biological Sciences Initiative/Spaulding Hall Renovation & Expansiono UNH Manchester Bio-Manufacturing Innovation Center
• PSU report on capital projects:o PE Center Renovation HHE Cluster
• KSC report on capital projects:o Cohen Center for Holocaust & Genocide Studies Project
This report includes updates on previously approved projects. Current project activities include:
UNH Water Treatment Plant work includes:
• Completion of process piping,• Interior construction of administration area,• Construction of masonry façade.
UNH Biological Sciences Initiative work includes: • Commencing the utility and site enabling work• Development of early release package for concrete and steel bidding,• Review and advancement of construction documents.
PSU PE Center Renovation HHE Cluster work includes:
• Resolving final occupancy issues
Mason Library Academic Project work includes: • Final revision to exterior landscape
SUBMITTED BY: APPROVED BY:
Catherine A. Provencher Todd Leach Vice Chancellor Chancellor For Financial Affairs and Treasurer
Date Prepared: June 13, 2019 For the Meeting of: June 27, 2019
Agenda Item III.A.
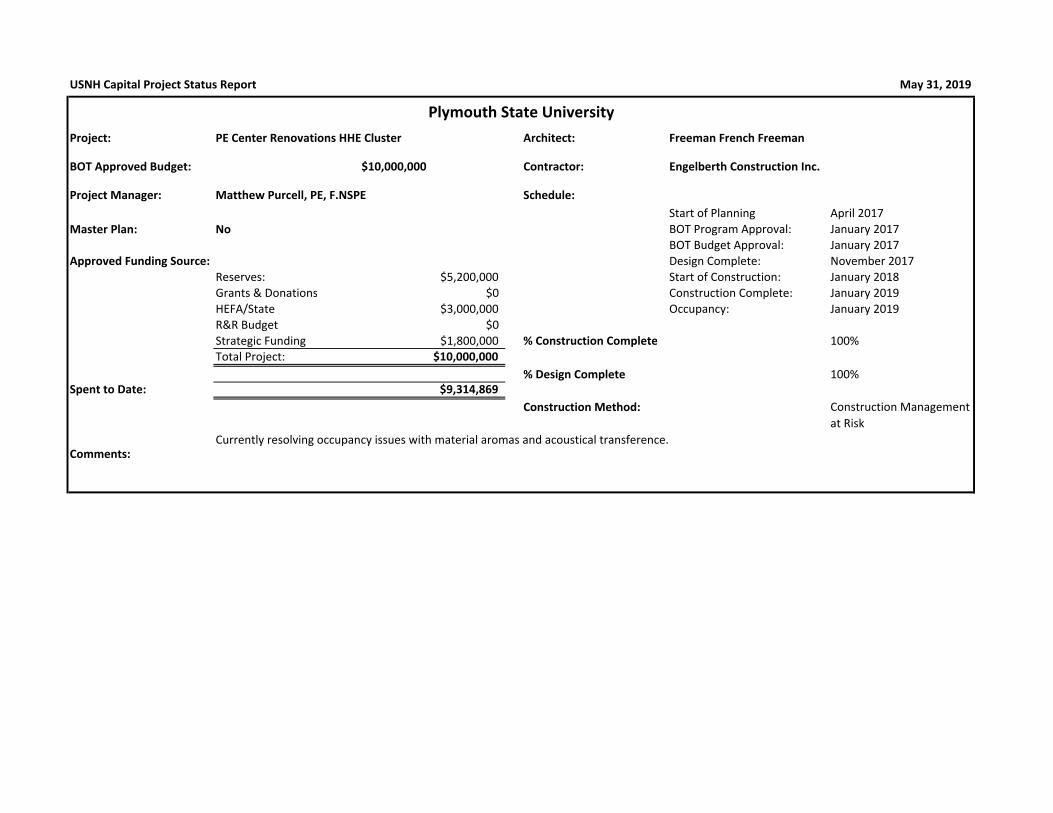
Project: PE Center Renovations HHE Cluster Architect: Freeman French Freeman
BOT Approved Budget: $10,000,000 Contractor: Engelberth Construction Inc.
Project Manager: Matthew Purcell, PE, F.NSPE Schedule:
Start of Planning April 2017
Master Plan: No BOT Program Approval: January 2017
BOT Budget Approval: January 2017
Approved Funding Source: Design Complete: November 2017
Reserves: $5,200,000 Start of Construction: January 2018
Grants & Donations $0 Construction Complete: January 2019
HEFA/State $3,000,000 Occupancy: January 2019
R&R Budget $0
Strategic Funding $1,800,000 % Construction Complete 100%
Total Project: $10,000,000
% Design Complete 100%
Spent to Date: $9,314,869
Construction Method:
Comments:
Construction Management
at Risk
USNH Capital Project Status Report May 31, 2019
Plymouth State University
Currently resolving occupancy issues with material aromas and acoustical transference.

USNH Capital Project Status Report May 31, 2019
Project: Cohen Center for Holocaust & Genocide Studies Architect: Perry Dean Architects
BOT Approved Budget: $4,500,000 Contractor: Eckman Construction
BOT Approved Budget Increase: $5,500,000
Project Manager: Colin Burdick Schedule:
Start of Planning October 2016
Master Plan: No BOT Program Approval: March 2017
BOT Budget Approval: June 2017
Approved Funding Source: Design Complete: March 2018
Reserves: $500,000 Start of Construction: May 2018
Grants & Donations $5,000,000 Construction Complete February 2019
HEFA/State $0 Occupancy: March 2019
R&R Budget $0
Other $0 % Construction Complete 100%
Total Project: $5,500,000
% Design Complete 100%
Spent to Date: $4,693,955 Construction Delivery Method:
Comments:
Keene State College
Project was completed for occupancy in March 2019. Currently on requested revisions to landscape plan
Construction Management
at Risk
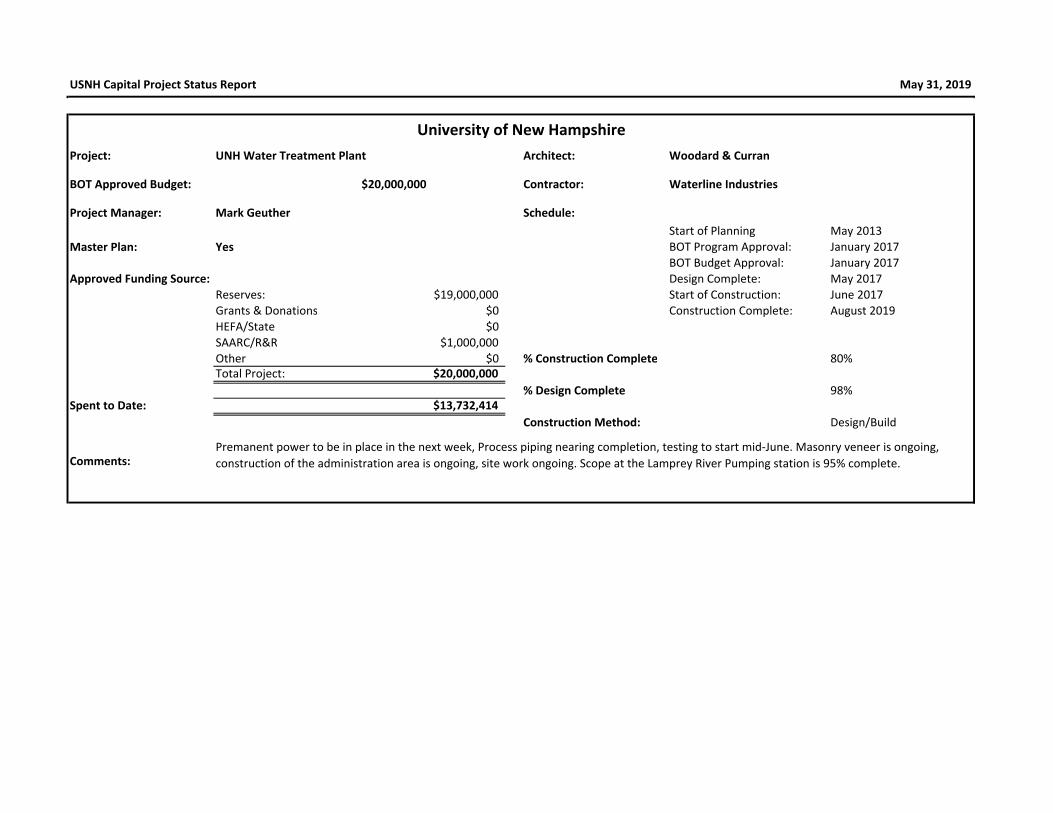
USNH Capital Project Status Report May 31, 2019
Project: UNH Water Treatment Plant Architect: Woodard & Curran
BOT Approved Budget: $20,000,000 Contractor: Waterline Industries
Project Manager: Mark Geuther Schedule:
Start of Planning May 2013
Master Plan: Yes BOT Program Approval: January 2017
BOT Budget Approval: January 2017
Approved Funding Source: Design Complete: May 2017
Reserves: $19,000,000 Start of Construction: June 2017
Grants & Donations $0 Construction Complete: August 2019
HEFA/State $0
SAARC/R&R $1,000,000
Other $0 % Construction Complete 80%
Total Project: $20,000,000
% Design Complete 98%
Spent to Date: $13,732,414
Construction Method: Design/Build
Comments:
University of New Hampshire
Premanent power to be in place in the next week, Process piping nearing completion, testing to start mid-June. Masonry veneer is ongoing,
construction of the administration area is ongoing, site work ongoing. Scope at the Lamprey River Pumping station is 95% complete.

USNH Capital Project Status Report May 31, 2019
Project: Architect: Ellenzweig Associates, Inc.
Contractor: Skanska USA Building Inc.
BOT Approved Budget*: $86,000,000
Schedule:
Project Manager: Rich Rouleau Start of Planning October 2014
BOT Program Approval: June 2018
Master Plan: Yes BOT Budget Approval: June 2018
Design Complete: July 2019
Approved Funding Source: Start of Construction: June 2019
USNH Reserves: $30,000,000 Construction Phase 1 June 2021
UNH Reserves $19,570,000 Construction Complete: January 2023
HEFA/State $35,000,000
SAARC/R&R $1,430,000 % Construction Complete 0%
Other/Gifts/Grants $0
Total Project: $86,000,000 % Design Complete 60%
Spent to Date: $3,174,594 Construction Method:
Comments:
Funding Note:
University of New Hampshire
Site and utility make-ready effort is underway. Early release package for Phase 1 concrete and steel is on track for issuance mid-June for bidding.
Balance of project will be bid in fall 2019.
Biological Sciences - Spaulding Hall Expansion &
Renovation
USNH BOT approved the full $86M funding pending State Appropriation approval. If the State does not provide $35M of Appropriation funding
then the project scale to be reduced to available funding.
Construction Management
At Risk
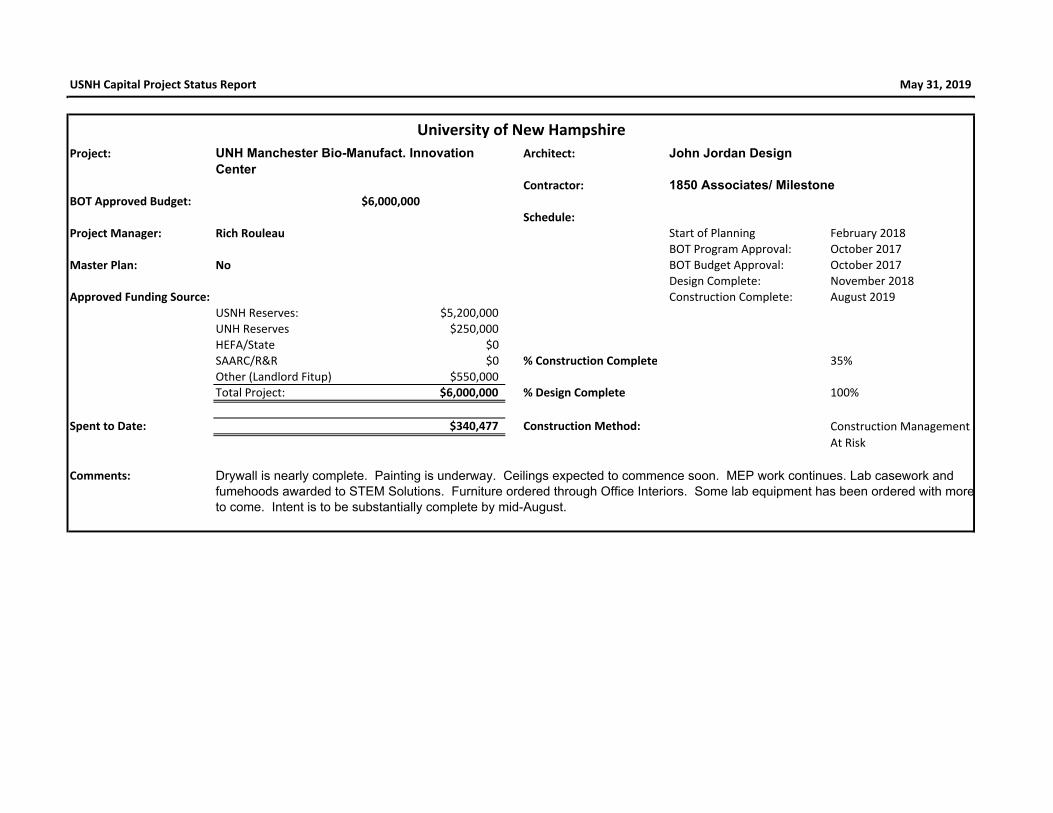
USNH Capital Project Status Report May 31, 2019
Project: Architect:
Contractor:
BOT Approved Budget: $6,000,000
Schedule:
Project Manager: Rich Rouleau Start of Planning February 2018
BOT Program Approval: October 2017
Master Plan: No BOT Budget Approval: October 2017
Design Complete: November 2018
Approved Funding Source: Construction Complete: August 2019
USNH Reserves: $5,200,000
UNH Reserves $250,000
HEFA/State $0
SAARC/R&R $0 % Construction Complete 35%
Other (Landlord Fitup) $550,000
Total Project: $6,000,000 % Design Complete 100%
Spent to Date: $340,477 Construction Method:
Comments: Drywall is nearly complete. Painting is underway. Ceilings expected to commence soon. MEP work continues. Lab casework and
fumehoods awarded to STEM Solutions. Furniture ordered through Office Interiors. Some lab equipment has been ordered with more
to come. Intent is to be substantially complete by mid-August.
University of New Hampshire
UNH Manchester Bio-Manufact. Innovation
Center
John Jordan Design
1850 Associates/ Milestone
Construction Management
At Risk

1
UNIVERSITY SYSTEM OF NEW HAMPSHIRE BOARD OF TRUSTEES
Financial Affairs Committee
Motion Sheet
University System of New Hampshire
To: Financial Affairs Committee Re: Approve FY20 Capital Budget
PROPOSED MOTION
MOVED, on recommendation of the Chancellor and Presidents, that the following motion be presented for consideration of the Board of Trustees.
MOVED, on recommendation of the Financial Affairs Committee, that the capital budget for University System units applicable to the fiscal year beginning July 1, 2019 and ending June 30, 2020 (FY20) be approved by the Board of Trustees as presented in the attachments AND FURTHER that for/during FY20:
1. In the event the State capital appropriations authorized in law arehigher or lower than currently included in the USNH capital budgets,the budgets will be adjusted to reflect the final amounts authorizedby the State.
2. Campuses and the System Office are authorized to adjust individualcapital project spending as needed assuming the total USNH annualcapital budget funded by USNH sources in FY20 is not exceededwithout additional approval and adjustments are compliant withBoard of Trustee policy for capital projects.
SUMMARY OF PROPOSED ACTION
This motion approves the capital budget for the University System for FY20.
Agenda Item III. C.

2
RATIONALE FOR PROPOSED ACTION/ PREVIOUS REVIEWS AND APPROVAL
The FY20 capital budget was prepared using the budget planning assumptions and parameters adopted by the Financial Affairs Committee in January 2019 which target capital spending (total plant and equipment) for each campus on average and measured over a five year period in an amount approximately equal to annual depreciation expense plus any capital funding from other external funding sources and any additional board approved strategic capital investments and initiatives. The budget assumes no new debt will be issued for capital projects in FY20.
As of this date, the State budget process is not complete for FY20. Accordingly, this motion provides authorization to adjust the capital budget to reflect the final amounts authorized by the State.
RELEVANT GOVERNANCE DOCUMENTS, POLICIES AND PRACTICES
State law (RSA 187-A:16) delegates to the Board of Trustees "management and control of all the property and affairs of the University System of New Hampshire" and its institutions. State law prescribes procedures by which the Board of Trustees requests and secures State funding and borrowing authorization for the acquisition of real property and the construction, renovation, and repair of all facilities.
Board of Trustee policy BOT A.2 outlines the Trustee and Financial Affairs Committee authority with regard to capital planning and budgeting. Among the responsibilities delegated to the Financial Affairs Committee is the development and approval of an annual capital budget prior to the start of each fiscal year. The implications of the annual capital budget on the annual operating budget (such as use of cash and debt financing, expected restricted gifts, construction expenditures, depreciation, additional utilities and other operating costs, and additional revenues) will be reflected in the annual budget and both budgets will be presented to the Board of Trustees for approval.
RESOURCE IMPLICATIONS
The requested capital expenditures for FY20 are $95 million of which $76 million is estimated to be funded by USNH Unrestricted Financial Resources (UFR). The projections include the Board-approved and System-funded strategic investment for UNH Spaulding Hall Expansion and Renovation of $8 million in FY20. Annual depreciation expense is approximately $67 million.
RISK MANAGEMENT CONSIDERATIONS
The quality and type of space that institutions provide has a significant impact on the ability to recruit, retain and educate students. There are risks to underinvestment in facilities including life safety issues, higher maintenance and operating costs and obsolete building systems. Maintaining competitive facilities is essential to keeping NH students in NH and to attracting out-of-state students. These factors need to be balanced with keeping the cost of education affordable.

3
SUBSEQUENT ACTION REQUIRED
Approval by the Board of Trustees, to be considered on June 28, 2019.
SUBMITTED BY: APPROVED BY: Catherine Provencher Todd Leach Vice Chancellor for Financial Affairs/ Chancellor Treasurer
Date Prepared: June 19, 2019 For the Meeting of: June 27, 2019
-- End of Motion Sheet --

University of New Hampshire5 Year Capital PlanJune 2019 BOT Summary
FY19-FY23
Funded Capital Projects Project CategoryAnticipated
Completion
Total Project
BudgetGifts &
Grants HEFA State
USNH
Funding
SAARC/
DMA/
Facilities
Budget/
Reserves
UNH Budget/
Reserves Gifts & Grants HEFA State USNH Funding
SAARC/DMA/
Facilities UNH Reserves
FY20
Projection
FY20
ActualGifts &
Grants HEFA State USNH Funding
SAARC/ DMA/
Facilities
Budget/
Reserves
UNH Budget/
Reserves
Gifts &
Grants HEFA State
USNH
Funding
SAARC/ DMA/
Facilities
Budget/
Reserves
UNH Budget/
Reserves
Gifts &
Grants HEFA State
USNH
Funding
SAARC/ DMA/
Facilities
Budget/
Reserves
UNH Budget/
Reserves
FY23
BudgetGifts &
Grants HEFA State
USNH
Funding
SAARC/ DMA/
Facilities
Budget/
Reserves
UNH Budget/
Reserves
Projected
CostsGifts &
Grants HEFA State USNH Funding
SAARC/ DMA/
Facilities Budget/
Reserves
UNH Budget/
Reserves
Major Projects $5M>
BOT Approved Jun-18 Spaulding Hall Expansion and Renovation Modernization Dec-22 86.0 3.5 - - - 3.4 - 0.1 19.1 - - 10.0 8.1 1.0 - 18.1 - - 10.0 8.1 - - 24.9 - - - 18.5 - 6.4 25.9 - - 10.0 - 15.9 12.3 - - - - - 12.3 84.6 - - 20.0 30.0 - 34.6
BOT Approved Oct-17 UNH-M Biomanufacturing Innovation Center Modernization Dec-18 5.5 4.5 - - - 4.5 - - 0.9 0.3 - - 0.7 - - 0.9 0.3 - - 0.7 - - - - - - - - - - - - - - - - - - - - - - 5.4 0.3 - - 5.2 - -
BOT Approved Jan-17 Water Treatment Plant Infrastructure Aug-19 19.5 11.0 - - - - - 11.0 2.0 1.0 - - - - 1.0 2.0 1.0 - - - - 1.0 - - - - - - - - - - - - - - - - - - - - 13.0 1.0 - - - - 12.0
>$5M Projects Closing in FY19 97.2 0.4 0.1 - - - - 0.3 - - - - - - - - - - - - - - - - - - - - - - - - - - - - 0.0 - - - - (0.0) 0.4 0.1 - - - - 0.3
Subtotal Major Projects $5M> 208.2 19.4 0.1 - - 7.9 - 11.3 22.0 1.3 - 10.0 8.8 1.0 1.0 21.0 1.3 - 10.0 8.8 - 1.0 24.9 - - - 18.5 - 6.4 25.9 - - 10.0 - - 15.9 12.3 0.0 - - - - 12.2 103.4 1.4 - 20.0 35.2 - 46.9
Other Major Projects $2M> - - - - -
Future Major Capital Projects Renewal Ongoing 92.0 - - - - - - - 4.8 - - - - - 4.8 5.8 - - - - - 5.8 15.1 - - - - - 15.1 13.6 - - - - - 13.6 11.2 - - - - - 11.2 45.7 - - - - - 45.7
Rudman Lab Fume Hood Renewal Jun-20 5.5 0.3 - - - - 0.3 - 3.5 - - - - 2.5 1.0 3.5 - - - - 2.5 1.0 1.9 - - - - 1.9 - - - - - - - - - - - - - - - 5.7 - - - - 4.7 1.0
Kendall Hall Level 3-5 Repurposing Renewal Jun-20 3.0 0.1 - - - - 0.1 - 2.9 - - - - 2.8 0.1 2.9 - - - - 2.8 0.1 - - - - - - - - - - - - - - - - - - - - - 3.0 - - - - 2.9 0.1
Philbrook Kitchen Upgrade Modernization Jun-20 3.1 2.7 - - - - - 2.7 0.4 - - - - - 0.4 0.4 - - - - - 0.4 - - - - - - - - - - - - - - - - - - - - - 3.1 - - - - - 3.1
McFarlane Greenhouse Renovation Renewal Dec-20 2.5 0.8 - - - - - 0.8 1.7 - - - - - 1.7 1.7 - - - - - 1.7 - - - - - - - - - - - - - - - - - - - - - 2.5 - - - - - 2.5
Telecom Floor Addition/1st Flr Consolidation Expansion Jun-20 2.8 0.3 - - - - - 0.3 2.5 - - - - - 2.5 2.5 - - - - - 2.5 - - - - - - - - - - - - - - - - - - - - - 2.8 - - - - - 2.8
TSAS Northwest Heat Plant Infrastructure Jun-19 4.5 3.5 0.3 - - - 1.6 1.6 - - - - - - - - - - - - - - - - - - - - - - - - - - - - - - - - - - - 3.5 0.3 - - - 1.6 1.6
>$2M Projects Closing in FY19 Various 21.1 0.6 - - - - - 0.6 - - - - - - - - - - - - - - - - - - - - - - - - - - - - - - - - - - - 0.6 - - - - - 0.6
Subtotal Major Projects $2M> 134.5 8.3 0.3 - - - 2.0 6.0 15.8 - - - - 5.3 10.5 16.8 - - - - 5.3 11.5 17.0 - - - - 1.9 15.1 13.6 - - - - - 13.6 11.2 - - - - - 11.2 66.9 0.3 - - - 9.2 57.4
Program Funds (Annual Recurring/Other) -
SAARC/DMA Ongoing 8.2 1.5 - - - 6.7 - 7.4 1.5 - - - 11.1 - 7.4 1.5 - - - 5.9 - 13.5 1.5 - - - 12.0 - 13.4 1.5 - - - 11.9 - 15.8 1.5 - - - 14.3 - 58.2 7.5 - - - 50.7 -
Strategic Infrastructure /Facilities Major Capital Infrastructure Ongoing - - - - - - - 3.0 - - - - 3.0 - 3.0 - - - - 3.0 - 3.0 - - - - 3.0 - 3.0 - - - - 3.0 - 3.0 - - - - 3.0 - 12.0 - - - - 12.0 -
Unit Project Requests (to be approved) 1.8 - - - - - 1.8 10.2 0.6 - - - 1.2 8.4 10.2 - - 0.6 - - - 1.2 8.4 3.5 0.2 1.0 - - - 2.3 0.6 - - - - - 0.6 4.0 - 3.0 - - - 1.0 20.1 0.8 4.0 - - 1.2 14.1
IT Infrastructure Ongoing 2.5 - - - - - 2.5 4.4 - - - - - 4.4 4.4 - - - - - 4.4 2.9 - - - - - 2.9 2.4 - - - - - 2.4 2.7 - - - - - 2.7 14.9 - - - - - 14.9
Athletics Renewal Ongoing 0.0 - - - - - 0.0 0.6 0.6 - - - - 0.0 0.6 0.6 - - - - 0.0 0.0 - - - - - 0.0 0.0 - - - - - 0.0 0.0 - - - - - 0.0 0.7 0.6 - - - - 0.1
Whittemore Center (Incl. Dehumidification)Deferred
MaintenanceOngoing 0.5 - - - - 0.5 - 0.9 - - - - 0.8 0.2 0.9 - - - - 0.8 0.2 0.3 - - - - - 0.3 0.4 - - - - - 0.4 0.9 - - - - - 0.9 3.0 - - - - 1.3 1.8
Memorial Union Building Renewal Ongoing 0.8 - - - - - 0.8 0.1 - - - - - 0.1 0.1 - - - - - 0.1 0.9 - - - - - 0.9 0.2 - - - - - 0.2 0.4 - - - - - 0.4 2.3 - - - - - 2.3
Campus Rec Renewal Ongoing 0.5 - - - - - 0.5 0.1 - - - - - 0.1 0.1 - - - - - 0.1 0.2 - - - - - 0.2 0.2 - - - - - 0.2 0.9 - - - - - 0.9 1.9 - - - - - 1.9
Dining Renewal Ongoing 1.9 - - - - - 1.9 0.5 - - - - - 0.5 0.5 - - - - - 0.5 0.9 - - - - - 0.9 1.0 - - - - - 1.0 0.3 - - - - - 0.3 4.4 - - - - - 4.4
Housing (Incl. Adams Tower) Renewal Ongoing 4.5 - - - - - 4.5 5.4 - - - - - 5.4 5.4 - - - - - 5.4 3.6 - - - - - 3.6 3.6 - - - - - 3.6 3.6 - - - - - 3.6 20.6 - - - - - 20.6
Office of Business Affairs Small Projects Ongoing - 0.4 - - - - - 0.4 1.1 0.5 - - - 0.1 0.6 1.1 0.5 - - - 0.1 0.6 0.6 - - - - - 0.6 0.6 - - - - - 0.6 0.4 - - - - - 0.4 3.1 0.5 - - - 0.1 2.5
Other Small Projects Ongoing - 1.3 - - - - - 1.3 6.7 - - - - 6.7 6.7 - - - - - 6.7 5.7 - - - - 5.7 5.6 - - - - - 5.6 6.2 - - - - - 6.2 25.5 - - - - - 25.5
COLSA/AES Renewal Ongoing - - - - - - - 0.2 - - - - - 0.2 0.2 - - - - - 0.2 0.2 - - - - - 0.2 0.2 - - - - - 0.2 0.2 - - - - - 0.2 0.8 - - - - - 0.8
<$2M Projects Closing in FY19/early FY20 13.8 7.3 1.7 - - - 1.1 4.6 - 1.1 - - - - (1.1) - 1.1 - - - - (1.1) - - - - - - - - - - - - - - - - - - - - - 7.2 2.7 - - - 1.1 3.5
Program Funds (Annual Recurring/Other) 29.6 3.2 - - - 8.3 18.2 40.6 4.2 - - - 16.2 20.3 40.6 4.2 - - - 11.0 25.4 35.5 1.7 1.0 - - 15.0 17.7 31.0 1.5 - - - 14.9 14.7 38.3 1.5 3.0 - - 17.3 16.6 174.8 12.0 4.0 - - 66.4 92.5
Equipment:
Transportation Buses Renewal Ongoing 2.1 1.2 - - - - 0.9 - - - - - - - - - - - - - - 1.4 - - - - - 1.4 2.3 1.8 - - - - 0.5 - - - - - - - 5.8 3.0 - - - - 2.8
Capital Equipment in Non-Plant Funds Renewal Ongoing 8.3 5.3 - 3.0 5.6 3.2 2.4 5.6 3.2 2.4 5.6 3.2 2.4 5.6 3.2 2.4 5.6 3.2 2.4 30.7 18.0 - - - - 12.7
Subtotal Equipment 10.4 6.5 - - - - 3.9 5.6 3.2 - - - - 2.4 5.6 3.2 - - - - 2.4 7.0 3.2 - - - - 3.8 7.9 5.0 - - - - 2.9 5.6 3.2 - - - - 2.4 36.5 21.0 - - - - 15.5
Software:
FAMIS Replacement Infrastructure Dec-20 1.5 - - - - - - - 1.5 - - - - - 1.5 1.5 - - - - - 1.5 - - - - - - - - - - - - - - - - - - - - - 1.5 - - - - - 1.5
Advancement CRM Infrastructure Nov-18 4.4 0.7 - - - - - 0.7 0.5 - - - - - 0.5 0.5 - - - - - 0.5 - - - - - - - - - - - - - - - - - - - - - 1.2 - - - - - 1.2
Subtotal Software 5.9 0.7 - - - - - 0.7 2.0 - - - - - 2.0 2.0 - - - - - 2.0 - - - - - - - - - - - - - - - - - - - - - 2.7 - - - - - 2.7
Total Funded Project Costs 68.4 10.0 - - 7.9 10.2 40.1 86.0 8.6 - 10.0 8.8 22.5 36.2 86.0 8.6 - 10.0 8.8 16.3 42.4 84.3 4.9 1.0 - 18.5 16.9 43.1 78.4 6.5 - 10.0 - 14.9 47.0 67.4 4.7 3.0 - - 17.3 42.4 384.3 34.7 4.0 20.0 35.2 75.6 214.9
Non-Capital Expenses for Capital Projects in Plant
Funds- (11.0) (11.0) (11.0) (11.0) (11.0) (44.0)
Total Capital Spending 68.4 10.0 - - 7.9 10.2 40.1 75.0 8.6 - 10.0 8.8 22.5 25.2 75.0 8.6 - 10.0 8.8 16.3 31.4 73.3 4.9 1.0 - 18.5 16.9 32.1 67.4 6.5 - 10.0 - 14.9 36.0 56.4 4.7 3.0 - - 17.3 31.4 340.3 34.8 4.0 20.0 35.2 75.6 170.5
Depreciation Expense (Building & Equipment) 47.3 47.3 48.7 48.7 48.7 48.7 50.1 50.1 50.9 50.9 51.7 51.7 248.6 248.6
Backout External Funding:
State Appropriations - 10.0 10.0 - 10.0 - 20.0
Gift/Grants Building Projects 4.8 4.8 4.8 1.5 3.4 1.5 16.0
Gift/Grants Equipment 5.4 3.2 3.2 3.2 3.2 3.2 18.1
USNH Funded 7.9 8.8 8.8 18.5 - - 35.2
Total Capital Spending (Under)/Over Depreciation Base 3.0 (0.4) (0.4) 0.1 (0.0) (0.0) 2.4
FY20 Budget-
OBUD
FY20 Funding Sources CUMULATIVE FUNDING SOURCE FY19-FY23FY23 Funding Sources
FY 22
Budget
FY19
Budget
FY20
Budget
FY21 Funding SourcesFY20 Funding SourcesFY19 Funding Sources
FY 21
Budget
FY22 Funding Sources

Plymouth State University
6 Year Capital Plan
All Values in Millions of Dollars
April 2019 BOT Summary
FY19-FY24
Anticipated
Completion
Total Project
Budget
Projected
Costs FY 24
Gifts &
Grants HEFA State
USNH
Funded
PSU
Reserves
Major Projects >$2M
BOT Approved 02/01/18 Geneva Smith Renovations Sep-19 $8.9M $4.2M $4.2M $.M $.M $.M $.M $.M $.M $.M $.M $.M $.M
BOT Approved 010/20/17 PE Center/HHE Cluster Jan-19 $10.M $5.7M $5.7M $.M $.M $.M $.M $.M $.M $.M $.M $.M $.M
BOT Approval Pending Turf Field with Lights ($2M Gifts) Aug-19 $4.4M $4.4M $0.5M $3.9M $.M $.M $.M $.M $.M $.M $.M $.M $.M
Subtotal Major Projects $2M> $23.3M $14.3M $10.4M $3.9M $.M $.M $.M $.M $.M $.M $.M $.M $.M
Other Major Projects >$250k
Future Hyde Hall Projects Aug-23 $17.0M $14.3M $.3M $1.M $4.M $7.5M $.5M $1.M $.M $.M $.M $.M $1.M
Belknap Renovation Sep-21 $5.0M $1.M $.3M $.7M $.M $.M $.M $.M $.M $.M $.M $.M $.M
PE Center Renovation Projects Ongoing $4.0M $4.5M $.M $.5M $2.M $1.M $.5M $.5M $.M $.M $.M $.M $.5M
Student Apts Steam Line Replacement Sep-20 $2.0M $2.M $.2M $1.8M $.M $.M $.M $.M $.M $.M $.M $.M $.M
D&M Creater Space (4th Floor) Sep-19 $1.9M $1.7M $.5M $1.2M $.M $.M $.M $.M $.M $.M $.M $.M $.M
D&M FAB Lab (1st Floor) Sep-18 $0.6M $.5M $.5M $.M $.M $.M $.M $.M $.M $.M $.M $.M $.M
HUB Roof Sep-19 $0.5M $.5M $.1M $.4M $.M $.M $.M $.M $.M $.M $.M $.M $.M
Speare Chiller Replacement Sep-18 $0.4M $.4M $.4M $.M $.M $.M $.M $.M $.M $.M $.M $.M $.M
Speare Roof Replacement Sep-18 $0.4M $.4M $.4M $.M $.M $.M $.M $.M $.M $.M $.M $.M $.M
Renovation of Chapel Sep-19 $0.4M $.5M $.1M $.4M $.M $.M $.M $.M $.M $.M $.M $.M $.M
Highland Hall Windows Sep-21 $0.3M $.3M $.M $.3M $.M $.M $.M $.M $.M $.M $.M $.M $.M
Speare Window Replacement Sep-21 $0.3M $.3M $.M $.3M $.M $.M $.M $.M $.M $.M $.M $.M $.M
CoGen plant Sep-20 $0.3M $.3M $.3M $.M $.M $.M $.M $.M $.M $.M $.M $.M $.M
Production Studio Dec-19 $0.3M $.3M $.M $.3M $.M $.M $.M $.M
Future Undefined Major Capital Projects $0.3M $4.5M $.M $.5M $.5M $.5M $1.5M $1.5M $.M $.M $.M $.M $1.5M
Subtotal Major Projects $250k> & <$2M $33.7M $31.5M $3.1M $7.4M $6.5M $9.M $2.5M $3.M $.M $.M $.M $.M $3.M
Minor Projects >$50k & <$250k
Auxiliary Projects Ongoing $3.0M $3.M $.M $.M $.M $1.M $1.M $1.M $.M $.M $.M $.M $1.M
Classroom Modernization Ongoing $2.0M $2.2M $.M $.2M $.5M $.5M $.5M $.5M $.M $.M $.M $.M $.5M
E&G Deferred Maintenance Ongoing $6.8M $6.8M $1.8M $1.3M $1.M $.7M $1.M $1.M $.M $.M $.M $.M $1.M
Subtotal Minor Projects >$50k & <$250k $11.8M $12.M $1.8M $1.5M $1.5M $2.2M $2.5M $2.5M $.M $.M $.M $.M $2.5M
Equipment
Minor Capital Equipment Ongoing $5.4M $5.4M $.9M $.9M $.9M $.9M $.9M $.9M $.M $.M $.M $.M $.9M
Subtotal Equipment $5.4M $5.4M $.9M $.9M $.9M $.9M $.9M $.9M $.M $.M $.M $.M $.9M
Total Funded Project Costs $74.2M $63.2M $16.2M $13.7M $8.9M $12.1M $5.9M $6.4M $.M $.M $.M $.M $6.4M
Less
Non-Capital Expenses for Capital Projects in Plant Funds
(Estimated Costs not Eligible for Capitalization)
$.M $.M
Total Capital Spending $63.2M $16.2M $13.7M $8.9M $12.1M $5.9M $6.4M
Depreciation Expense (Building & Equipment) $63.0M $10.5M $10.5M $10.5M $10.5M $10.5M $10.5M
Total Funding Sources $0.0M $0.0M $0.0M $0.0M $0.0M $0.0M
State Appropriations $2.M $0.0M $0.0M $0.0M $2.0M $0.0M $0.0M $.M
Gifts & Grants $4.M $0.5M $1.5M $0.0M $2.0M $0.0M $0.0M 0.0
HEFA $.M $0.0M $0.0M $0.0M $0.0M $0.0M $0.0M 0.0
USNH Funded $57.2M $15.7M $12.2M $8.9M $8.1M $5.9M $6.4M $.M $6.4M
Subtotal Funding Sources $63.2M $16.2M $13.7M $8.9M $12.1M $5.9M $6.4M $.M $.M $.M $.M $6.4M
Total System (IFB/Reserves) Capital Spend (Under)/Over Depreciation Base $.2M $5.7M $3.2M -$1.6M $1.6M -$4.6M -$4.1M
FY24 Funding Sources
FY 21 FY 22 FY 23FY 20
Funded Capital Projects
FY 19

Plymouth State University
6 Year Capital Plan
All Values in Millions of Dollars
April 2019 BOT Summary
FY19-FY24
Anticipated
Completion
Total Project
Budget
Projected
Costs FY 24
Gifts &
Grants HEFA State
USNH
Funded
PSU
Reserves
FY24 Funding Sources
FY 21 FY 22 FY 23FY 20
Funded Capital Projects
FY 19
Project Category FY 19 FY 20 FY 21 FY 22 FY 23 FY 24
Expansion $.M $.M $.M $.M $.M $.M $.M
Deferred Maintenance $19.8M $9.9M $9.9M $7.4M $9.2M $4.5M $5.5M
Renewal $8.9M $1.7M $3.1M $.7M $2.M $.9M $.5M
Modernization $7.4M $4.4M $.7M $.5M $.9M $.5M $.4M
Infrastructure $.5M $.2M $.M $.3M $.M $.M $.M
$36.6M $16.2M $13.7M $8.9M $12.1M $5.9M $6.4M

Keene State College
6 Year Capital Plan
All Values in Millions of Dollars
FY19-FY24
Projected
Costs FY23 FY24
Gifts &
Grants HEFA State USNH Funds KSC Reserve
Major Projects $2M>
BOT Approved Jan-18 Cohen Center Jan-19 $5.6M $4.8M $4.8M $0M $0M $0M $0M $0.0M $4.6M $.M $.M $.M $.2M
Monadnock Business Hub Aug-21 $9.2M $7.9M $0M $.2M $7M $0.7M $0M $0.0M $.M $.M $6.M $.M $1.9M
Joslin Hall Sep-23 $4.8M $5.0M $.M $.2M $.2M $2.4M $2.2M $.M $.M $.M $.M $.M $5.M
Elliot Hall Sep-22 $16.0M $15.8M $.M $1.M $3.5M $9.M $2.3M $.M $.M $.M $2.5M $.M $13.3M
Redfern Sep-26 $20.0M $8.5M $.M $.M $.M $.M $.5M $8.M $.M $.M $.M $.M $8.5M
Carle Sep-22 $16.0M $16.0M $.M $.M $1.M $10.M $5.M $.M $.M $16.M $.M $.M $.M
Morrison-Parker Hall Sep-25 $5.2M $1.0M $.M $.M $.M $.M $.5M $.5M $.M $.M $.M $.M $1.M
Subtotal Major Projects $76.8M $59.0M $4.8M $1.4M $11.7M $22.1M $10.5M $8.5M $4.6M $16.M $8.5M $.M $29.9M
Other Major Projects <$2M
Turf Field Replacement Nov-19 $1.0M $1.0M $.M $1.M $.M $.M $.M $.M $.M $.M $.M $.M $1.M
Spaulding Gym Sep-24 $2.0M $2.0M $.M $2.M $.M $.M $.M $.M $.M $.M $.M $.M $2.M
Subtotal Other Major Projects <$2M $3.0M $3.0M $.M $3.M $.M $.M $.M $.M $.M $.M $.M $.M $3.M
Program Funds (Annual Recurring)
E&G - Deferred Maintenance Ongoing $2.8M $2.8M $.5M $.3M $.5M $.5M $.5M $.5M $.M $.M $.M $.M $2.8M
Deferred Maintenance - Res. Life Ongoing $8.2M $8.2M $1.3M $1.1M $1.4M $1.4M $1.5M $1.5M $.M $.M $.M $.M $8.2M
Deferred Maintenance - Auxiliary Ongoing $1.M $1.0M $.2M $.2M $.2M $.2M $.2M $.2M $.M $.M $.M $.M $1.M
Deferred Maintenance - Athletics Ongoing $.9M $0.9M $.1M $.M $.2M $.2M $.3M $.3M $.M $.M $.M $.M $.9M
Life Safety Projects Ongoing $1.7M $1.7M $.2M $.3M $.3M $.3M $.3M $.3M $.M $.M $.M $.M $1.7M
Campus Infrastructure Ongoing $3.1M $3.1M $.5M $.6M $.5M $.5M $.5M $.5M $.M $.M $.M $.M $3.1M
Classroom Modernization Ongoing $1.8M $1.8M $.3M $.4M $.3M $.3M $.3M $.3M $.M $.M $.M $.M $1.8M
$19.4M $19.4M $3.1M $2.8M $3.3M $3.3M $3.5M $3.5M $.M $.M $.M $.M $19.4M
Equipment
Minor Capital Equipment $.M $0.0M $.M $.M $.M $.M $.M $.M $.M $.M $.M $.M $.M
Subtotal Equipment $.M $0.0M $.M $.M $.M $.M $.M $.M $.M $.M $.M $.M $.M
Total Funded Project Costs $99.2M $81.4M $7.9M $7.2M $15.M $25.4M $14.M $12.M $4.6M $16.M $8.5M $.M $52.3M
Non-Capital Expenses for Capital Projects in Plant Funds
(Estimated Costs not Eligible for Capitalization)$.M $.M $.M $.M $.M $.M
Total Capital Spending $81.4M $7.9M $7.2M $15.M $25.4M $14.M $12.M
Depreciation Expense (Building & Equipment) $9.M $9.M $9.M $9.M $9.M $9.M
Total Funding Sources
State Appropriations $.M $.M $6.M $2.5M $.M $.M
Gifts & Grants $4.6M $.01M $.01M $.01M $.01M $.01M
HEFA $.M $.M $.M $10.M $5.M $.M
USNH Funded $.M $.M $.M $.M $.M $.M
Total System (IFB/Reserves) Capital Spend (Under)/Over Depreciation Base -$.75M -$5.8M -$1.8M -$.1M $3.9M $.M $3.M
FY 19 FY20 FY 21 FY 22
June 2019
CUMULATIVE/TOTAL FUNDING SOURCEFunded Capital ProjectsTotal Project
Budget
Anticipated
Completion
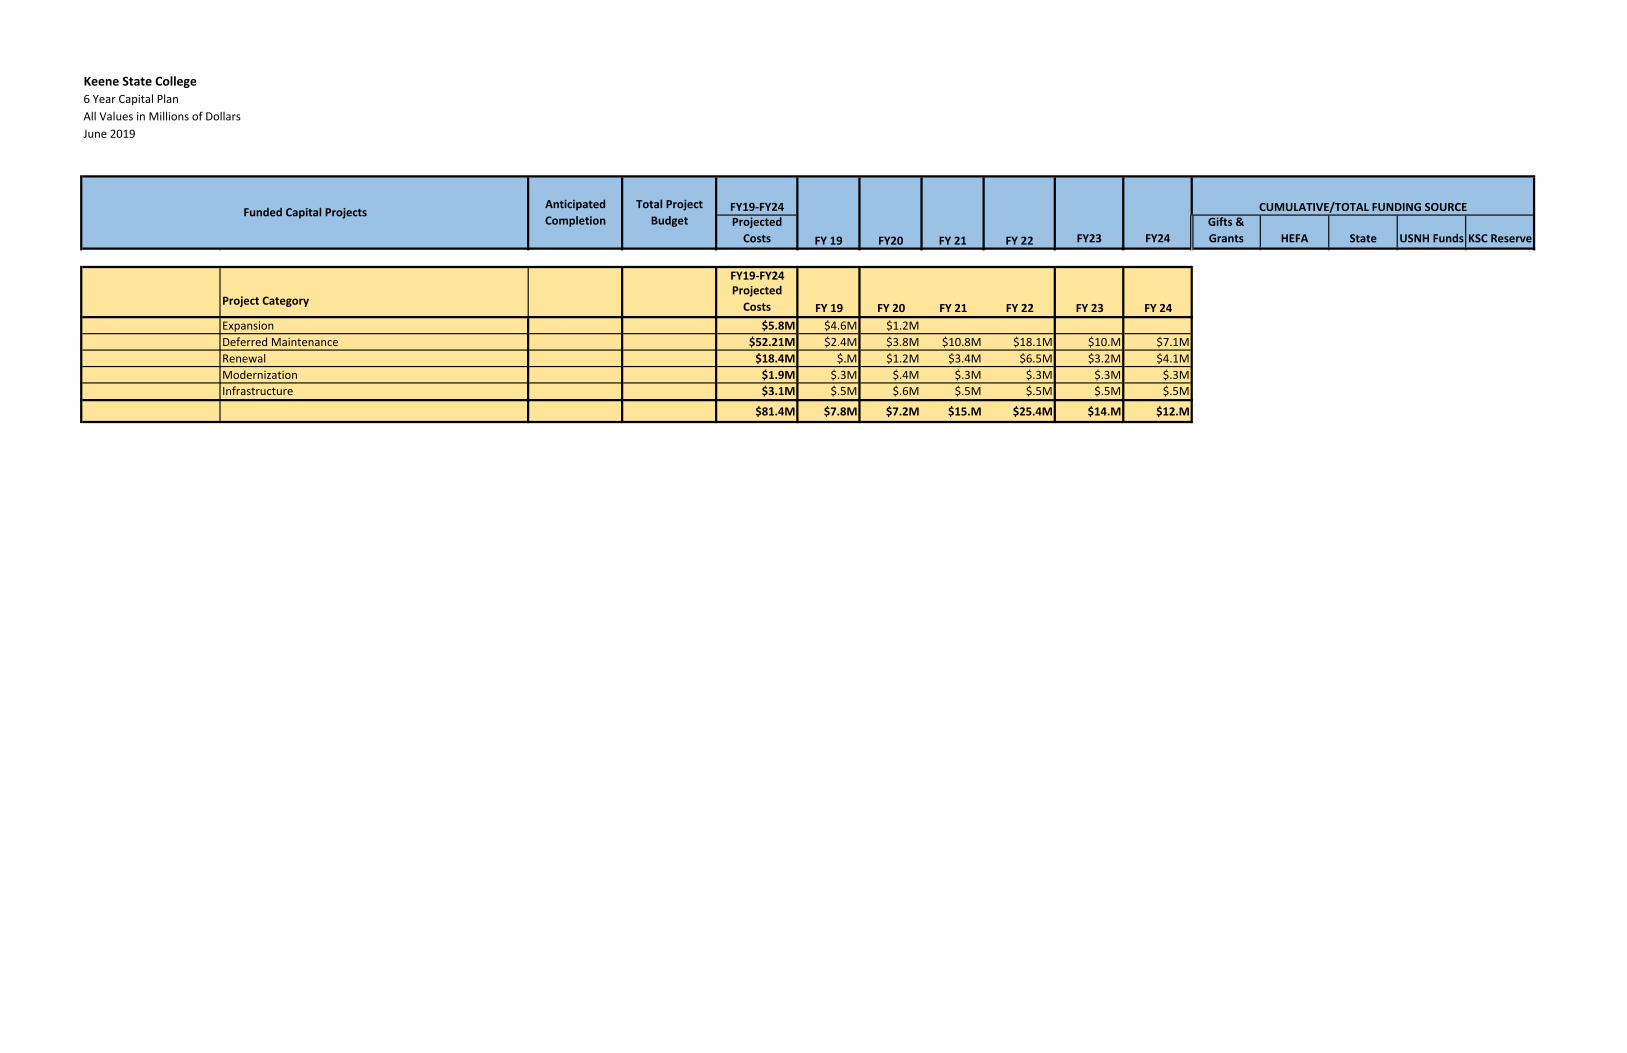
Keene State College
6 Year Capital Plan
All Values in Millions of Dollars
FY19-FY24
Projected
Costs FY23 FY24
Gifts &
Grants HEFA State USNH Funds KSC ReserveFY 19 FY20 FY 21 FY 22
June 2019
CUMULATIVE/TOTAL FUNDING SOURCEFunded Capital ProjectsTotal Project
Budget
Anticipated
Completion
FY19-FY24
Project CategoryProjected
Costs FY 19 FY 20 FY 21 FY 22 FY 23 FY 24
Expansion $5.8M $4.6M $1.2M
Deferred Maintenance $52.21M $2.4M $3.8M $10.8M $18.1M $10.M $7.1M
Renewal $18.4M $.M $1.2M $3.4M $6.5M $3.2M $4.1M
Modernization $1.9M $.3M $.4M $.3M $.3M $.3M $.3M
Infrastructure $3.1M $.5M $.6M $.5M $.5M $.5M $.5M
$81.4M $7.8M $7.2M $15.M $25.4M $14.M $12.M

Plymouth State University
Unfunded Major Capital Projects
Grafton Hall Deferred Maintenance $12.0M $.0M $.0M $.0M $.0M $1.0M $8.0M $3.0M $.0M $.0M $.0M Potential HEFA Funding/Reserves
PE Center Deferred Maintenance $44.0M $.0M $.5M $2.0M $1.0M $.5M $.5M $.5M $5.0M $10.0M $10.0M Combination IFB/DM Budgeting
Belknap Hall Deferred Maintenance $15.0M $.0M $.0M $.0M $.0M $.0M $1.0M $9.0M $5.0M $.0M $.0M Potential HEFA Funding/Reserves
Pemigewasset Hall Deferred Maintenance $15.0M $.0M $.0M $.0M $.0M $.0M $.0M $.0M $1.0M $10.0M $4.0M Potential HEFA Funding/Reserves
Replacement of White Mtn Apt Housing Deferred Maintenance $24.0M $.0M $.0M $.0M $.0M $.0M $.0M $.0M $.0M $.0M $1.0M Potential HEFA Funding/Reserves
Keene State College
Unfunded Major Capital Projects
Redfern Arts Center Deferred Maintenance $15.5M $.0M $.0M $.0M $.0M $.5M $8.0M $7.0M $.0M $.0M $.0M Multiple funding sources
Monadnock Business Hub Expansion $9.2M $.0M $1.5M $7.0M $.7M $.0M $.0M $.0M $.0M $.0M $.0M If not State funded
Carle Residence Hall Deferred Maintenance $16.0M $.0M $.0M $.0M $10.0M $5.0M $1.0M $.0M $.0M $.0M $.0M Potential HEFA Funded?
Upper Class Residence Hall (300 Bed) Deferred Maintenance $40.0M $.0M $.0M $.0M $.0M $.0M $2.0M $30.0M $8.0M $.0M $.0M Replaces Owls Nest
Spaulding Deferred Maintenance $19.0M $.5M $.0M $.0M $.0M $1.5M $16.0M $1.0M $.0M $.0M $.0M FY19/20 funded from KSC Reserves
Media Arts Center Deferred Maintenance $30.0M $.0M $.0M $.0M $.0M $.0M $2.0M $20.0M $8.0M $.0M $.0M Gifts/Multiple Sources
14-Jun-19
Unfunded Priority Projects Project CategoryTotal Project
BudgetFY 19 FY20 FY 21 FY 22 FY23 FY24 FY25 FY26 FY27 FY28 Potential Funding Sources
14-Jun-19
Unfunded Priority Projects Project CategoryTotal Project
BudgetFY 19 FY20 FY 21 FY28 Potential Funding SourcesFY 22 FY23 FY24 FY25 FY26 FY27

University of New Hampshire – Capital Priorities – 2019-2028
PROJECT PRIORITY RANKING – ALL TYPES NEEDING
USNH/UNH FUNDING OR DEBT
Added Space sq
feet
Renovated or
Replaced sq
feet
Preliminary
budget
Manchester - 88 Commmercial St/Pandora purchase Purchase n/a n/a $16,500,000
Graduate Housing Replacement for Forest Park Deferred
Maintenance
60,000 $22-25M
HEFA
Hetzel/Alexander Renovations- if Downtown Durham
Development project= NO
New/ Deferred
Maintenance
$17-30M
Undergraduate Housing Replacement- if Downtown Durham
Development project= YES
Deferred
Maintenance
13,000 70,000 $30-34M HEFA
Whittemore Center - rink improvement & renovation Deferred
Maintenance
0 30,000 $9M
CHHS Expansion - Hewitt Addition or P3 Lease Space - (CHHS
only)
Expansion 24,000-
50,000
0 $12-25M
Subtotal- Top Priorities 37-63k 160k $107-140M
Paul Creative Arts Center (PCAC) Renovation Deferred
Maintenance
0 160,000 $40-50M
Memorial Union Building (MUB) Renovate & Expand Deferred
Maintenance
10,000-
35,000
140,000 $30-40M
HEFA/Campus
Nesmith Hall Renovation Deferred
Maintenance
0 50,000 $25-30M
Huddleston Hall Renovation Deferred
Maintenance
0 46,000 $23-28M
Child Study and Development Center (CSDC) Replacement Deferred
Maintenance
8,000-12,000 10,000 $10M
$6m State?
Babcock Hall - residence hall renovations Deferred
Maintenance
0 50,000 $12-14M
HEFA
Stoke Hall undergraduate housing renovations Deferred
Maintenance
0 160,000 $35-45M
HEFA
Public Safety Complex - Replace & Expand Deferred
Maintenance
26,000 24,000 $20M
Holloway Commons Dining Concepts and Upgrades Deferred
Maintenance
0 12,000 $6M HEFA/Reserves
Morrill Hall Renovation Deferred
Maintenance
0 26,000 $10-13M
Library Archive and Special Collections Building - Replace &
Expand
Deferred
Maintenance
10,000 20,000 $15-18M
Philbrook Hall - Dining Expand & Renovate Deferred
Maintenance
8,000 42,000 $8M HEFA/Reserves
Health Services Expansion/Renovation (Health & Wellness,
PACS, SHARPP)
.
Deferred
Maintenance
17,000-
27,000
23,000 $20-25M
HEFA
Stillings Hall - Dining Renovation Deferred
Maintenance
0 42,000 $5M
HEFA/Reserves
Subtotal- Other Priorities 79-118k 805k $259-312M
TOTALS 116-181k 965k $366-452M
Downtown Durham Development Grad housing, hotel, and
office
Expansion Defer.
Maint.
75,000 62,000 $0M
The Edge Research District Expansion 50,000-
100,000
0 $0M
The Arts – combination of renovations to PCAC and selective
new facilities for the Museum of Art,
Music, Theatre & Dance, Art & Art History
Deferred
Maintenance
0 10,000-
200,000
$20-250M
Honors College - Honors Program Relocation &
Expansion at Kingsbury Hall
Expansion 23,000 6,000 $20M
Smith Hall - Welcome Center for prospective students -
other sites at Lot A or MUB east
Expansion 5,000 12,000 $5M
New England Center Repurpose Deferred
Maintenance
0 30,000 $10M
Paul College Expansion Expansion 16,000-
24,000
0 $8-12M
Field House - Ski Complex Expansion 6,000 0 $3M
Field House - Addition for Strength and Conditioning Center
relocation
Expansion 10,000 3,000 $4M
Whittemore Center - Hockey Team Area Renovation and
Expansion
Deferred
Maintenance
7,000 14,000 $10M+
South Drive Extension n/a n /a $3.6M
Flow Physics Facility improvements Expansion 10,000 1,000 $4-6M
OTHER PRIORITY PROJECTS – PRIMARILY GIFTS, GRANTS, OR PRIVATE FUNDS