Embed Size (px)
Citation preview

PREPARED FOR The Crater Planning District Commission
PREPARED BY The Economic Information Services Division of the Virginia Employment Commission Richmond Virginia, September 2007
AN
ECONOMIC
IMPACT
ANALYSIS OF
FORT LEE
2006 - 2013

AN ECONOMIC ASSESSMENT OF FORT LEE 2006 THROUGH 2013
1
AN ECONOMIC ASSESSMENT OF FORT LEE 2006 THROUGH 2013
Viewing the Impacts of Expenditures in 2006, and the Ramifications of the 2005
Base Realignment and Closure Commission Actions on the Local
Community
VIRGINIA EMPLOYMENT COMMISSION’S ECONOMIC SERVICES DIVISION
THE CRATER PLANNING DISTRICT COMMISSION
SEPTEMBER 2007

AN ECONOMIC ASSESSMENT OF FORT LEE 2006 THROUGH 2013
2
CONTENTS
SECTION PAGE INTRODUCTION ……………………………………………………………… 3 AREA OF IMPACT ……………………………………………………………. 3 METHODOLOGY ……………………………………………………………... 4 SUMMARY PROFILE 2006 …………………………………………………… 4 IMPACT ANALYSIS ……………………………………………….. ... 6 TAX ANALYSIS ………………………………………………………………. 8 IMPACT ANALYSIS AGGREGATE INDUSTRY ANALYSIS OF FORT LEE: FY 2007-2013……………. 9 IMPACT ANALYSIS TOTAL EXPENDITURES: PROJECTED FISCAL YEARS, 2007-2013……………. 10 SUMMARY OF FINDINGS …………………………………………………… 11 CONCLUSION ………………………………………………………………… 13 APPENDIX A: BRAC RECOMMENDATIONS .……………………………………………….. 15 APPENDIX B: ANNUAL SUMMARY PROFILES: FY 2006-2013 ………………………… .. 17

AN ECONOMIC ASSESSMENT OF FORT LEE 2006 THROUGH 2013
3
INTRODUCTION
Late August 2005 brought the end of a long awaited period of uncertainty as the Base Realignment and Closure Commission (BRAC) voted on a number of closure and realignment recommendations from the Secretary of Defense. Fort Lee is slated to be a net receiver of seven military functions from five states (including Virginia) over the next several years. A summary of the section of the BRAC report pertaining to Fort Lee that was sent to President George W. Bush in September 2005 can be found in Appendix A.
The economic benefits to the area from Fort Lee’s 2006 expenditures and the
unprecedented military and civilian growth are assessed in this study. Spending by Fort Lee for operations, construction, maintenance and payroll from 2006 through 2013 are measured in terms of output [value of goods and services produced and sold in the area], employee compensation, and employment in the local area. While this study is comprehensive in it’s data development and assessment, it does not attempt to calculate a net value of Fort Lee’s contribution to the economy. This study does not capture costs of new infrastructure, schools and roads that will no doubt be costs borne by the area’s economy.
The impact analysis was conducted by the Economic Operations Research (EOR) section of the Economic Information Services (EIS) Division at the Virginia Employment Commission (VEC) on behalf of Mr. Dennis Morris, Executive Director of the Crater Planning District Commission. Mr. Morris coordinated the data gathering process between the VEC and Fort Lee and served as the lead person on this project. The VEC and Fort Lee are extremely grateful for Mr. Morris’s leadership and consultation. The study was conducted using expenditure data submitted by the BRAC Synchronization Office at Fort Lee. AREA OF IMPACT
In preparing an economic impact, one needs to consider the geographical area that is
impacted. The study area is determined by analyzing the geographic area in which the economic activity occurs, taking into account the immediate impact area and the surrounding area for consideration of the forward and backward linkages. An area that is too large can produce unrealistic results, while micro regions such as a single county or city can miss the true dynamics of an economy. We use the concept of a Functional Economic Area (FEA). A FEA is a semi-self sufficient economic unit and is simply where people live, shop, and work. This analysis estimates the economic impact from the expenditures made in 2006 by Fort Lee and staff on the economies that comprise a portion of the Crater Planning District, and those expenditures that are estimated to occur as a result of the BRAC actions from 2007 to 2013. These localities are: Chesterfield, Dinwiddie, and Prince George Counties; and the Cities of Colonial Heights, Hopewell and Petersburg. Additionally, for the purpose of this study, the City of Richmond was included so that an economically sound model could be prepared.

AN ECONOMIC ASSESSMENT OF FORT LEE 2006 THROUGH 2013
4
METHODOLOGY VEC economists used IMPLAN (Impact Analysis for Planning) to estimate the impact of expenditures on jobs and salaries and wages on the defined Crater Planning District and City of Richmond area economies. IMPLAN is a regional economic impact modeling system that provides estimates of the effects on output, employment, and salaries and wages from changes in economic activity. The IMPLAN model measures the economic impact in terms of direct, indirect, and induced effects.
As an example, consider the increase in demand for computer parts. An increase in demand would cause the manufacturer of computer parts to increase production in order to meet that demand (Direct Effect). Consequently, the manufacturer would need additional production inputs, such as electronics and wire from those respective suppliers, generating an increase in production from the industries that supply the inputs (Indirect Effect). Finally, the increase in final demand would initiate an increase in household income (direct and indirect effects) generating an increase in income and employment in those industries that are recipients of household spending (Induced Effect).
It should be noted that this economic impact analysis includes BRAC recommendations and other stationing actions that were announced prior to the end of calendar year 2006. Any Department of Defense initiative impacting Fort Lee after that date is not included in this analysis. SUMMARY PROFILE 2006
Fort Lee’s employment level in Fiscal Year (FY) 2006 was 8,400 of which 3,970 were military, 4,440 civilian. The civilian population consisted of: Appropriated Funds (AF) 2,440; Non-Appropriated Funds (NAF) 390; Army Air Force Exchange Service (AAFES) 300; Commissary employees 100; and Contractor Employees 1,2101. The total cost of operating Fort Lee, including salary and wages, in 2006 totaled $739.4 million. Salary and wage expenditures of $527.4 million accounted for approximately 72 percent of the total. The remaining $212 million was spent on an array of operation and building expenditures such as construction, operations supplies, furniture and computer supplies, educational services, equipment, utilities, and consulting services. The chart below illustrates the aggregated distribution of expenditures. Professional Services and Trade are the largest categories of expenditures after employee compensation.
1 Totals vary due to rounding.

AN ECONOMIC ASSESSMENT OF FORT LEE 2006 THROUGH 2013
5
Ne t S a la ry & Wa ge s72%
Ut ilit ie s1%
Const ruc t ion/ Ma int e na nc e5%
Whole sa le / Re t a il10%
Tra nsport a t ion1%
S e rvic e s1%
P rofe ssiona l S e rvic e s7%
Hot e l/ Re st a ura nt3%
It is important to recognize that the direct expenditures shown in tables 1 and 2 are less
than the total expenditure data supplied by Fort Lee. This is due to natural leakages of money from the study area within the production stream, along with adjustments for wholesale and retail margins and consumption outside of the area – it is in a real sense, the economy at work. These factors reduce the accounting base impact to what is estimated to have remained in the area. We estimate that in 2006, that leakage was $196.6 million. Table 1 summarizes the employment and expenditures impact from the remaining $542.8 million. In FY 2006, Fort Lee supported 15,880 full-time equivalent jobs (FTE) in the area, which includes 8,400 Fort Lee staff. The total impact on the area’s economy from Fort Lee’s expenditures amounted to $803.1 million dollars.
Table 1: Summary of the Economic Impact of Fort Lee FY 2006 ($Millions)
Initial Multiplier Effects Total Employment
8,400 7,480 15,880
Expenditures
$542.8 $260.3 $803.1
Source: Virginia Employment Commission, August 2007.

AN ECONOMIC ASSESSMENT OF FORT LEE 2006 THROUGH 2013
6
IMPACT ANALYSIS
This study revealed that in FY 2006, through the expenditures of Fort Lee, $803.1 million dollars were circulated in the Crater Planning District and City of Richmond area economies. Table 1 shows the estimated economic impact of $803.1 million in total output (value of all goods and services produced) supported approximately 7,480 additional jobs, with an associated $251.5 million in employee compensation. (These jobs were in addition to the 8,400 staff employed by Fort Lee).
Table 2 reveals more detail of the impact from Fort Lee. The direct effects associated
with these expenditures after accounting for leakages and margins were an estimated $542.8 million in output and 5,020 additional jobs to carry out the Fort operations, with $167.9 million in additional employee compensation. The direct spending generated added economic activity, that is, indirect and induced spending on other goods and services in the economy. The indirect effects from local inter-industry purchases were $123.6 million in output and 1,070 jobs, with $40.7 million in employee compensation. The induced effects that stem from the increased household income from the direct and indirect effects were $136.7 million in output and 1,390 jobs, with $42.9 million in employee compensation. The value added portion of this impact, which includes employee compensation, proprietary income, and incomes from rents, royalties, and dividends, along with indirect business taxes amounted to $481.5 million.
Table 2: Economic Component Analysis of Fort Lee FY 2006 ($Millions)
Effects Total Output Value Added Employee
Comp. Employment
Direct
$542.8 $322.2 $527.4*+
$167.9 8,400*+ 5,020
Indirect
$123.6 $73.4 $40.7 1,070
Induced
$136.7 $85.9 $42.9 1,390
Total
$803.1 $481.5 $778.9 15,880 Source: Virginia Employment Commission, August 2007. Totals may not sum correctly due to rounding. * Fort Lee Salary and Wages, and Employment

AN ECONOMIC ASSESSMENT OF FORT LEE 2006 THROUGH 2013
7
The North American Industry Classification System (NAICS) is an industry classification system that groups establishments into industries based on the activities in which they are primarily engaged. It is a comprehensive system covering the entire field of economic activities, producing and non-producing. There are 20 sectors in NAICS and 1,179 industries in NAICS United States.
Table 3 is an aggregate representation of the industrial impact for 2006. It clearly shows
that Retail Trade, Health & Social Services and the Accommodation & Food Services industries had significant employment and corresponding compensation impacts stemming from personal consumption. Other industries whose impacts are more institutionally oriented are the Wholesale Trade, Finance & Insurance, and Professional - Scientific & Technical industries. These industries have relatively high values in total output – the gross dollar value of goods produced and sold in the area. Table 3: Aggregate Industry Analysis of Fort Lee FY 2006 ($MILLIONS) Source: Virginia Employment Commission, August 2007.
Industry Employment Employee Compensation Output
Ag, Forestry, Fish & Hunt. 15 $109,840 $514,430Mining 0 4,900 18,620Utilities 35 3,666,490 22,12,420Construction 440 16,996,600 40,284,790Manufacturing 130 6,871,150 38,148,363Wholesale Trade 495 31,525,900 75,150,820Transportation & Whsing 200 9,033,560 23,840,210Retail Trade 1,440 35,148,120 79,171,290Information 80 4,764,940 21,807,160Finance & Insurance 310 17,113,630 54,977,460Real Estate & Rental 190 3,718,450 36,534,450Professional/Scientific/Tech. 500 20,125,710 65,950,680Management of Companies 40 3,821,880 7,833,80Admin. & Waste Serv. 330 8,070,700 16,917,770Educational Serv. 80 2,168,330 3,777,890Health & Social Services 1,150 47,620,840 97,876,910Arts/Entertain. & Recreation 175 2,153,070 5,879,680Accommodation/Food Serv 1,170 19,236,670 58,157,340Other Services 650 16,335120 38,696,660Government & Non NAICs 60 2,932,900 79,474,620Fort Lee 8400 527,426,600
Total 15,880 $778,845,400 $803,101,530

AN ECONOMIC ASSESSMENT OF FORT LEE 2006 THROUGH 2013
8
TAX ANALYSIS The calculation of the tax receipts by the State of Virginia and the respective local governments is an essential part of this economic impact analysis.
It is estimated that total State and Local taxes collected were $52,503,600 in FY 2006 as a result of the operations of Fort Lee and the associated industries. The tax table below is divided into 3 categories: Corporate, Indirect, and Personal taxes. As seen in the indirect business category, the greatest tax amount both in absolute value and percentage of total tax collected is property tax; the second largest is sales tax.
Further analysis revealed that in the division of total taxes between the State of Virginia
and the local area, the State received approximately $32,799,600 and the area tax collections amounted to approximately $19,704,000.
Table 4: Tax Impact of Fort Lee on the State and the Local Area, by Category of Tax, FY 2006. Tax
Amount Percent of Category
Percent of Total
Corporations Corporate Profits $5,777,400 64.73 11.00 Dividends $3,147,440 35.27 6.00 Total $8,924,840 17.00 Indirect Business Taxes Motor Vehicle License $427,540 1.21 0.81 Property Tax $16,890,820 47.72 32.17 State/Local Non-Tax $1,980,960 5.60 3.77 Sales Tax $12,417,770 35.08 23.65 Severance Tax $4,170 0.01 0.01 Other Tax $3,673,675 10.38 7.00 Total $35,394,850 67.41 Personal Taxes Income Tax $7,251,725 88.17 13.74 Motor Vehicle License $278,590 3.40 0.53 Non-taxes $521,435 6.37 0.99 Property Tax $53,690 .66 0.10 Other Tax $114,474 1.40 0.22
Total $8,183,910 15.49
Total Taxes $52,503,600 Source: Virginia Employment Commission, August 2007.

AN ECONOMIC ASSESSMENT OF FORT LEE 2006 THROUGH 2013
9
IMPACT ANALYSIS AGGREGATE INDUSTRY ANALYSIS OF FORT LEE: FY 2007-2013 Table 5 presents a cumulative total of the aggregate industry analysis of Fort Lee for fiscal years 2007-2013. This table clearly reflects the positive accelerated impacts that BRAC actions will have upon the region. The most striking impact, albeit short-term, is that of construction employment. Construction employment, compensation and output will greatly benefit from the Fort Lee expansion projects through 2013. By 2008, construction employment directly related to the BRAC expansion could exceed 5,600, up from approximately 450 in 2006. While the construction employment impact will, at some point, recede to a more normal level, those industries mentioned earlier, along with all of the benefit from sustained spending by Fort Lee, will also have corresponding levels of growth. Detailed aggregate industry analyses (with summary profiles) of Fort Lee for each year are presented in Appendix B. Table 5: Aggregate Industry Analysis of Fort Lee FY 2007-2013 Employment Employment
Compensation Output
Agriculture, Forestry, Fish & Hunting 150 $1,191,730 $5,800,400Mining 0 74,910 274,754Utilities 350 42,053,000 253,570,752Construction 19,210 786,086,130 1,816,166,732Manufacturing 1,540 86,938,320 465,355,050Wholesale Trade 4,460 313,122,460 746,415,170Retail Trade 11,310 101,822,570 259,967,510Transportation & Warehousing 5,420 405,473,870 916,099,570Information 790 53,177,050 243,600,480Finance & Insurance 3,170 195,502,450 625,142,480Real Estate & Rental 1,950 42,995,220 417,327,020Professional-Scientific & Technical Services 5,650 249,586,170 767,864,450Management of Companies 380 46,940,000 96,205,070Administrative & Waste Services 3,590 97,042,990 199,834,460Educational Services 780 24,668,900 43,488,830Health & Social Services 11,260 538,470,200 1,104,057,280Arts, Entertainment, Recreation 1,760 23,558,650 64,448,800Accommodations & Food Services 10,710 192,979,860 585,867,390Other Services 6,520 179,581,440 426,478,184Government & Non NAICs 560 33,638,170 832,226,590Institutions 343,626,060
TOTAL 89,570 $3,414,904,000 $10,213,817,020Source: Virginia Employment Commission, August 2007.

AN ECONOMIC ASSESSMENT OF FORT LEE 2006 THROUGH 2013
10
IMPACT ANALYSIS TOTAL EXPENDITURES: PROJECTED FISCAL YEARS, 2007-2013
Table 6 summarizes the estimated total economic impact of the projected expenditures by
Fort Lee for FYs 2007-2013. While major troop increases do not begin until 2009, the preparation for their arrival will begin in earnest in 2007 as construction increases from $32 million to $220 million (nearly 600 percent). The value of total output is driven by this growth and will increase by 40 percent to more than $1.2 billion in 2007. The following year could be another banner year as construction more than doubles from 2007 ($507.7 million – 130 percent), pushing output growth by another 40 percent to $1.7 billion in 2008. Fort Lee induced employment in 2007 and 2008 will grow by 42 percent each year driven largely by the construction expenditures.
The year 2008 will be a high mark relative to economic growth as construction represents
40 percent of total expenditures (72 percent excluding compensation). However, with the significant expansion in 2009 and 2010, construction will continue to be one of the two dominant drivers of Fort Lee’s economic impact on the area. This period will also witness the ratcheting-up of base employment as personnel arrive at Fort Lee. Fort Lee’s personnel level should plateau at approximately 11,700 in 2011 through 2013. In 2012 and 2013 construction will once more be a major economic influence as expenditures average $275 million annually, which in turn will increase the workforce impact by 40 percent.
Certainly, the largest and most consistent driver of economic influence are the salaries
and wages paid to Fort Lee personnel, and those who derive their livelihood directly or indirectly from operations at Fort Lee* (see Impacts). Total compensation throughout the impacted area in 2006 was estimated to have been $778.9 million stemming from Fort Lee operations. For 2007, an increase to more than $930 million is estimated. Beginning in 2008, total employment compensation should average $1.2 billion per year through 2011. As Table 6 illustrates, 2012 and 2013 will see total compensation average more than $1.4 billion as the construction impacts and Fort Lee staff reach their peak.
Table 6: Total Impacts of Projected Fort Lee Expenditures for Fiscal Years 2007-2013 ($millions)
Impacts 2007 2008 2009 2010 2011 2012 2013
Direct Output
$754,109,580
$1,055,710,180
$914,402,100
$929,456,900
$834,279,800
$1,101,536,100
$1,133,861,700
Total Output
$1,149,007,630
$1,647,726,780
$1,390,186,800
$1,396,923,300
$1,230,423,000
$1,674,340,400
$1,725,209,200
Value Added
$676,085,000
$954,774,060
$818,729,500
$829,130,400
$739,282,200
$988,251,000
$1,108,429,800

AN ECONOMIC ASSESSMENT OF FORT LEE 2006 THROUGH 2013
11
Table 6: Cont’d Compensation
Fort Lee Impacts*
TOTAL
$543,249,400 $386,913,400 $930,162,800
$559,546,890 $583,726,040
$1,143,272,930
$703,555,600$465,410,900
$1,168,966,500
$807,433,400$456,092,600
$1,263,526,000
$849,441,400 $385,265,500
$1,234,706,900
$874,924,600$559,822,400
$1,434,747,000
$901,172,300$577,673,200
$1,478,845,500
Employment
Fort Lee Impacts*
TOTAL
8,400 10,910 19,310
8,400 15,830 24,230
10,300 12,550 22,850
11,490 12,070 23,560
11,730 10,040 21,770
11,730 14,030 25,760
11,730 14,140 25,870
Taxes State Local TOTAL
$42,869,860 $23,439,640 $66,309,500
$57,223,600 $28,483,660 $85,707,260
$51,252,630 $27,782,500 $79,035,130
$52,765,100 $29,367,300 $82,132,400
$48,102,180 $28,088,350 $76,190,530
$60,643,100 $32,364,400 $93,007,500
$62,035,700 $32,863,840 $94,899,550
Source: Virginia Employment Commission, August 2007. SUMMARY OF FINDINGS
The total cost of operating Fort Lee, including salary and wages, in 2006 totaled $739.4 million. Salary and wage expenditures of $527.4 million accounted for approximately 72 percent of the total. The remaining $211.9 million was spent on an array of operation and building expenditures such as construction, operations supplies, educational services, equipment, utilities, and consulting services.
All economies have naturally occurring leakages of monies from the area.
Because of this, the direct effects, or initial expenditures that remain in the area amounted to $542.8 million after accounting for $196.6 millions in leakages.
The total impact on the area’s economy, after accounting for leakages and
margins, from Fort Lee’s expenditures amounted to $803.1 million dollars in 2006.
In 2006, Fort Lee’s operations supported 15,880 full-time equivalent jobs (FTE)
in the area, which includes 8,400 Fort Lee staff.
Total compensation paid to all affected workers throughout the impacted area in 2006, was estimated to have been $778.9 million stemming from Fort Lee’s operations.
While major troop increases do not begin until 2009, the preparation for their
arrival will begin in earnest in 2007 as construction increases from $32 million in 2006 to $220.3 million (nearly 600 percent).
AN ECONOMIC ASSESSMENT OF FORT LEE 2006 THROUGH 2013
12
The value of total output2 is driven by this growth and will increase by 43 percent to more than $1.1 billion in 2007.
The following year could be another banner year as construction more than
doubles from 2007 ($507.7 million – 130 percent), pushing output growth by another 45 percent to $1.6 billion in 2008.
Fort Lee induced employment in 2007 and 2008 will grow by roughly 46 percent
each year driven largely by the construction expenditures.
The year 2008 will be a high mark relative to economic growth as construction represents 40 percent of total expenditures.
However, with the significant expansion in 2009 and 2010, construction will
continue to be one of the two dominant drivers of Fort Lee’s economic impact on the area.
This period will also witness the ratcheting-up of base employment as personnel
arrive at Fort Lee. Current projections indicate that Fort Lee’s staff level may plateau at approximately 11,700 in 2011 through 2013.
In 2012 and 2013 construction will once more be a major economic influence as
expenditures average $275 million annually, which in turn will increase the workforce impact by 40 percent.
Certainly, the largest and most consistent drivers of economic influence are the
salaries and wages that are paid to Fort Lee personnel, and those who derive their livelihood directly or indirectly from operations at Fort Lee.
Total compensation in 2006 was estimated to have been $779 million stemming
from Fort Lee functions. For 2007, an increase to $930 million is estimated.
Beginning in 2008, total employment compensation should average $1.2 billion per year through 2011.
As Table 6 illustrates, 2012 and 2013 will see total compensation average more
than $1.4 billion as the construction impacts and Fort Lee staff reach their peak.
The third dynamic to consider in this analysis is tax revenue generated as Fort Lee functions and expands. Prior to BRAC 05 influences, Fort Lee operations in 2006 generated a total of approximately $53 million dollars in state and local taxes. In the years 2007 through 2013, total taxes could approach $580 million, with $200 million of that amount in local revenue.
2 Total output is the value of all goods and services produced in the area, including salaries and wages.

AN ECONOMIC ASSESSMENT OF FORT LEE 2006 THROUGH 2013
13
CONCLUSION
The economic impact of Fort Lee has been analyzed for more than a decade. This current report, coming at the beginning of a new era of military presence in the local area, finds the impact to be growing exponentially. This report demonstrates that Fort Lee’s presence is an essential source of economic strength to the labor force, businesses, residents and local governments in the Crater Planning District, and will continue to be so for years to come. Therefore, Fort Lee’s distinction as being the region’s economic engine will continue to expand in the Crater District.

AN ECONOMIC ASSESSMENT OF FORT LEE 2006 THROUGH 2013
14
APPENDICES

AN ECONOMIC ASSESSMENT OF FORT LEE 2006 THROUGH 2013
15
APPENDIX A BRAC RECOMMENDATIONS
On September 8, 2005, the Defense Base Realignment and Closure Commission (BRAC Commission) recommended that certain realignment actions occur at Fort Lee, Virginia. These recommendations were approved by the President on September 15, 2005, and forwarded to Congress. Upon expiration of the statutory period for Congress to enact a joint resolution of disapproval on November 9, 2005, the BRAC Commission’s recommendations became law. The BRAC Commission recommendations must now be implemented as provided for in the Defense Base Realignment and Closure Act of 1990 (Public Law 101-510), as amended.
The BRAC Commission’s recommendations realign Fort Lee by relocating specified organizations and activities to the post. The BRAC Commission made six recommendations concerning Fort Lee. To enable implementation of the recommendations, the Army proposes to provide necessary facilities at Fort Lee to support the relocations. The BRAC Commission found the capacity of Fort Lee sufficient to meet the new training requirements, except for insufficient land and space available to conduct major field training exercises (FTX), to include the Warrior Training FTX. The Army proposes to use Fort A.P. Hill to conduct FTX and Explosive Ordnance Disposal (EOD) training, on the basis of its proximity to Fort Lee, its suitable lands, and its schedule availability.
The BRAC Commission made six recommendations concerning Fort Lee, which would be implemented under the proposed action as follows.1
• Establish a Sustainment Center of Excellence (SCOE) at Fort Lee. Activities that would relocate to Fort Lee and be incorporated into the SCOE are portions of the Transportation Center and School from Fort Eustis, Virginia; the Ordnance Maintenance Mechanical School of the Ordnance Center and School from Aberdeen Proving Ground, Maryland; and the Ordnance Munitions and Electronics Maintenance School (OMEMS) of the Missile and Munitions Center from Redstone Arsenal, Alabama. The Transportation Center and School and the Ordnance Center and School would be consolidated with the Quartermaster Center & School, the Army Logistics Management College, and the Combined Arms Support Command to form the SCOE.
_____________________ 1 Complete text of the BRAC Commission’s recommendations is available on the Army’s Web site at http://www.hqda.army.mil/acsimweb/brac/braco.htm.
AN ECONOMIC ASSESSMENT OF FORT LEE 2006 THROUGH 2013
16
• Establish a Joint Center for Consolidated Transportation Management Training.
Transportation Management Training from Lackland Air Force Base, Texas, would relocate to Fort Lee, Virginia, to accomplish this.
• Establish a Joint Center of Excellence for Culinary Training. Culinary Training from
Lackland Air Force Base, Texas and USN Great Lakes Training Center, Illinois, would relocate to Fort Lee.
• Co-locate Miscellaneous Department of Defense Agency, and Field Activity Leased
Locations. Close Metro Park III and IV, a leased installation in Alexandria, Virginia, by relocating the Defense Contract Management Agency (DCMA) Headquarters to Fort Lee, Virginia.
• Relocate all components of the Defense Commissary Agency (DeCA) to Fort Lee.
Defense Commissary Agency Eastern, Midwestern Regional, and Hopewell, Virginia, Offices would be consolidated at Fort Lee. Leased facilities in San Antonio, Texas; Hopewell, Virginia; and Virginia Beach, Virginia, would be closed
In addition to the five actions above, through which Fort Lee would gain functions, facilities,
and personnel, the BRAC Commission recommended the creation of a Joint Mobilization Site that would result in a loss at Fort Lee. Under this recommendation, all mobilization processing functions at Fort Lee, Virginia; Fort Eustis, Virginia; and Fort Jackson, South Carolina would be relocated to Fort Bragg, North Carolina, and Fort Bragg would be designated Joint Pre-Deployment/Mobilization Site Bragg/Pope.
Fort Lee’s military and civilian population consists of two major categories of personnel: student soldiers attending professional schools and permanent party personnel. Following implementation of the proposed action, Fort Lee’s average daily population would nearly double.
AN ECONOMIC ASSESSMENT OF FORT LEE 2006 THROUGH 2013
17
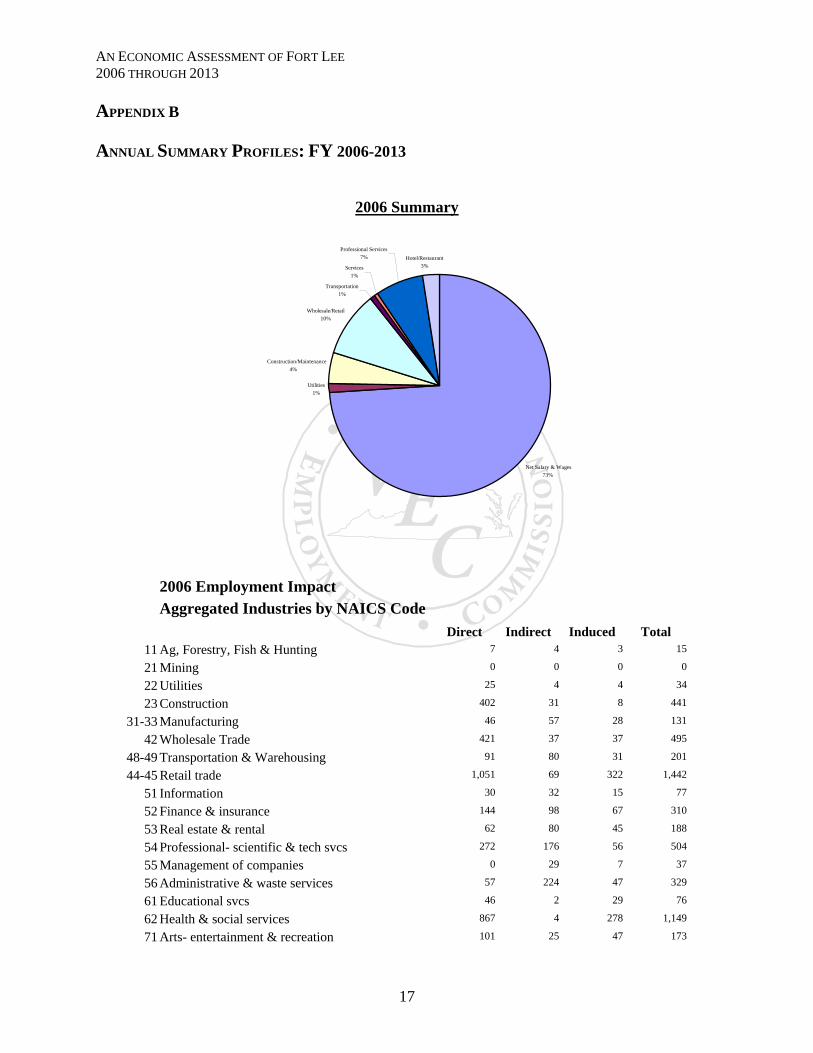
APPENDIX B ANNUAL SUMMARY PROFILES: FY 2006-2013
2006 Summary
Net Salary & Wages73%
Utilities1%
Construction/Maintenance4%
Wholesale/Retail10%
Transportation1%
Services1%
Professional Services7% Hotel/Restaurant
3%
2006 Employment Impact Aggregated Industries by NAICS Code Direct Indirect Induced Total
11 Ag, Forestry, Fish & Hunting 7 4 3 15
21 Mining 0 0 0 0
22 Utilities 25 4 4 34
23 Construction 402 31 8 441
31-33 Manufacturing 46 57 28 131
42 Wholesale Trade 421 37 37 495
48-49 Transportation & Warehousing 91 80 31 201
44-45 Retail trade 1,051 69 322 1,442
51 Information 30 32 15 77
52 Finance & insurance 144 98 67 310
53 Real estate & rental 62 80 45 188
54 Professional- scientific & tech svcs 272 176 56 504
55 Management of companies 0 29 7 37
56 Administrative & waste services 57 224 47 329
61 Educational svcs 46 2 29 76
62 Health & social services 867 4 278 1,149
71 Arts- entertainment & recreation 101 25 47 173

AN ECONOMIC ASSESSMENT OF FORT LEE 2006 THROUGH 2013
18
72 Accomodation & food services 918 61 187 1,166
81 Other services 445 44 158 647
92 Government & non NAICs 31 11 14 56
5,016 1,068 1,385 7,469 2006 Employment Compensation Impact Aggregated Industries by NAICS Code Direct Indirect Induced Total
11 Ag, Forestry, Fish & Hunting 53,485 30,954 25,402 109,841
21 Mining 0 4,027 870 4,897
22 Utilities 2,594,794 552,511 519,181 3,666,485
23 Construction 15,501,120 1,185,448 310,035 16,996,602
31-33 Manufacturing 2,401,619 2,947,425 1,522,103 6,871,147
42 Wholesale Trade 26,792,788 2,357,766 2,375,351 31,525,906
48-49 Transportation & Warehousing 3,812,849 3,832,328 1,388,379 9,033,557
44-45 Retail trade 25,331,186 1,733,290 8,083,844 35,148,320
51 Information 1,889,600 1,938,290 937,044 4,764,935
52 Finance & insurance 8,028,499 5,313,998 3,771,130 17,113,628
53 Real estate & rental 1,268,272 1,571,725 878,448 3,718,445
54 Professional- scientific & tech svcs 10,897,540 7,083,532 2,144,641 20,125,714
55 Management of companies 0 3,061,585 760,300 3,821,884
56 Administrative & waste services 1,206,263 5,687,876 1,176,563 8,070,702
61 Educational svcs 1,328,105 51,231 788,990 2,168,326
62 Health & social services 37,218,896 126,655 10,275,290 47,620,844
71 Arts- entertainment & recreation 1,334,108 218,150 600,815 2,153,072
72 Accomodation & food services 15,375,381 972,113 2,889,175 19,236,668
81 Other services 11,204,314 1,411,994 3,718,808 16,335,117
92 Government & non NAICs 1,644,281 568,521 720,105 2,932,907
$167,883,099 $40,649,416 $42,886,474 $251,418,995 2006 Output Impact Aggregated Industries by NAICS Code Direct Indirect Induced Total
11 Ag, Forestry, Fish & Hunting 229,738 168,554 116,133 514,425
21 Mining 0 15,286 3,334 18,619
22 Utilities 15,644,689 3,332,861 3,134,868 22,112,418
23 Construction 36,097,072 3,300,342 887,378 40,284,792
31-33 Manufacturing 15,943,177 13,407,072 8,798,114 38,148,364
42 Wholesale Trade 63,868,116 5,620,397 5,662,316 75,150,824
48-49 Transportation & Warehousing 13,189,360 7,666,252 2,984,600 23,840,212
44-45 Retail trade 56,716,128 3,965,901 18,489,260 79,171,288
51 Information 9,457,789 7,880,136 4,469,235 21,807,160
52 Finance & insurance 28,323,880 14,671,269 11,982,310 54,977,460
53 Real estate & rental 11,187,165 16,687,237 8,660,049 36,534,452
54 Professional- scientific & tech svcs 40,309,492 19,679,060 5,962,128 65,950,680

AN ECONOMIC ASSESSMENT OF FORT LEE 2006 THROUGH 2013
19
55 Management of companies 0 6,274,819 1,558,259 7,833,079
56 Administrative & waste services 3,393,991 11,072,248 2,451,527 16,917,766
61 Educational svcs 2,167,764 108,899 1,501,229 3,777,891
62 Health & social services 76,109,424 451,937 21,315,548 97,876,912
71 Arts- entertainment & recreation 3,695,587 573,629 1,628,461 5,897,677
72 Accomodation & food services 46,233,936 2,974,944 8,948,458 58,157,340
81 Other services 26,309,644 3,838,578 8,548,436 38,696,656
92 Government & non NAICs 57,968,796 1,917,172 19,588,646 79,474,624
Insitutions 35,958,892 0 0 35,958,892
542,804,640 123,606,591 136,690,287 803,101,531
2007 SUMMARY
Net Salary & Wages57%
Utilities1%
Construction/Maintenance24%
Wholesale/Retail8%
Transportation1%
Services1%
Professional Services6%
Hotel/Restaurant2%
2007 Employment Impact Aggregated Industries by NAICS Code Direct Indirect Induced Total
11 Ag, Forestry, Fish & Hunting 7 5 5 17
21 Mining 0 0 0 0
22 Utilities 28 5 6 40
23 Construction 2,506 35 12 2,554
31-33 Manufacturing 46 95 43 184
42 Wholesale Trade 423 60 57 541

AN ECONOMIC ASSESSMENT OF FORT LEE 2006 THROUGH 2013
20
48-49 Transportation & Warehousing 92 106 47 245
44-45 Retail trade 1,054 194 493 1,742
51 Information 31 39 23 93
52 Finance & insurance 145 121 103 369
53 Real estate & rental 63 97 69 229
54 Professional- scientific & tech svcs 274 332 86 692
55 Management of companies 0 34 11 45
56 Administrative & waste services 65 289 72 425
61 Educational svcs 46 2 44 92
62 Health & social services 895 4 426 1,325
71 Arts- entertainment & recreation 102 28 72 202
72 Accomodation & food services 942 72 286 1,301
81 Other services 451 59 241 751
92 Government & non NAICs 31 13 21 66
7,202 1,591 2,119 10,912
2007 Employment Compensation Impact Aggregated Industries by NAICS Code Direct Indirect Induced Total
11 Ag, Forestry, Fish & Hunting 55,089 35,706 39,355 130,150
21 Mining 0 6,727 1,382 8,109
22 Utilities 2,934,739 712,848 813,880 4,461,467
23 Construction 98,185,592 1,393,360 482,073 100,061,024
31-33 Manufacturing 2,473,787 4,775,640 2,383,074 9,632,500
42 Wholesale Trade 27,596,572 3,908,565 3,719,945 35,225,080
48-49 Transportation & Warehousing 3,927,302 5,208,091 2,169,476 11,304,868
44-45 Retail trade 26,155,742 5,011,902 12,732,530 43,900,172
51 Information 1,971,208 2,408,048 1,463,757 5,843,013
52 Finance & insurance 8,260,192 6,784,654 5,919,708 20,964,554
53 Real estate & rental 1,306,321 2,009,380 1,377,010 4,692,710
54 Professional- scientific & tech svcs 11,224,527 13,776,385 3,371,362 28,372,272
55 Management of companies 0 3,667,388 1,211,595 4,878,983
56 Administrative & waste services 1,379,022 7,512,583 1,842,990 10,734,595
61 Educational svcs 1,367,948 62,280 1,237,453 2,667,681
62 Health & social services 40,233,784 133,921 16,278,797 56,646,500
71 Arts- entertainment & recreation 1,374,138 256,779 934,268 2,565,184
72 Accomodation & food services 16,169,717 1,186,258 4,523,739 21,879,714
81 Other services 11,580,475 1,987,699 5,806,709 19,374,882
92 Government & non NAICs 1,698,304 733,257 1,138,378 3,569,938
$257,894,457 $61,571,468 $67,447,481 $386,913,396
2007 Output Impact Aggregated Industries by NAICS Code Direct Indirect Induced Total
11 Ag, Forestry, Fish & Hunting 236,619 218,929 180,001 635,549
21 Mining 0 24,200 5,303 29,504

AN ECONOMIC ASSESSMENT OF FORT LEE 2006 THROUGH 2013
21
22 Utilities 17,691,136 4,299,940 4,913,796 26,904,872
23 Construction 225,567,936 3,856,014 1,379,765 230,803,712
31-33 Manufacturing 16,422,189 21,184,176 13,734,318 51,340,684
42 Wholesale Trade 65,784,160 9,317,160 8,867,532 83,968,856
48-49 Transportation & Warehousing 13,585,159 10,779,838 4,658,109 29,023,106
44-45 Retail trade 58,545,660 11,467,614 29,121,672 99,134,944
51 Information 9,909,940 9,857,734 6,976,295 26,743,970
52 Finance & insurance 29,151,136 19,058,930 18,799,528 67,009,596
53 Real estate & rental 11,522,780 20,288,334 13,568,540 45,379,656
54 Professional- scientific & tech svcs 41,518,920 36,361,820 9,366,646 87,247,392
55 Management of companies 0 7,516,433 2,483,204 9,999,637
56 Administrative & waste services 3,892,507 14,310,619 3,834,412 22,037,538
61 Educational svcs 2,232,797 130,886 2,354,557 4,718,240
62 Health & social services 82,017,136 477,795 33,749,976 116,244,912
71 Arts- entertainment & recreation 3,806,470 672,847 2,532,231 7,011,548
72 Accomodation & food services 48,620,992 3,624,381 14,010,317 66,255,688
81 Other services 27,180,224 5,499,128 13,358,954 46,038,308
92 Government & non NAICs 59,718,908 2,468,860 29,587,252 91,775,024
Insitutions 36,704,896 0 0 36,704,896
$754,109,565 $181,415,636 $213,482,407 $1,149,007,631

AN ECONOMIC ASSESSMENT OF FORT LEE 2006 THROUGH 2013
22
2008 SUMMARY
Net Salar y & Wages44%
Utilities1%
Constr uction/ Maintenance41%
Wholesale/ Retail6%
Tr anspor tation1%
Ser vices0%
Pr of ess ional Ser vices5%
Hotel/ Res taur ant2%
2008 Employment Impact Aggregated Industries by NAICS Code Direct Indirect Induced Total
11 Ag, Forestry, Fish & Hunting 7 5 8 20
21 Mining 0 0 0 0
22 Utilities 28 7 9 44
23 Construction 5,619 42 18 5,679
31-33 Manufacturing 47 149 65 260
42 Wholesale Trade 426 93 85 605
48-49 Transportation & Warehousing 92 143 71 306
44-45 Retail trade 1,054 377 737 2,169
51 Information 31 47 35 113
52 Finance & insurance 145 155 154 454
53 Real estate & rental 63 120 103 286
54 Professional- scientific & tech svcs 276 561 128 966
55 Management of companies 0 40 17 57
56 Administrative & waste services 64 379 107 551
61 Educational svcs 46 3 66 114
62 Health & social services 886 4 637 1,526

AN ECONOMIC ASSESSMENT OF FORT LEE 2006 THROUGH 2013
23
71 Arts- entertainment & recreation 104 32 107 243
72 Accomodation & food services 943 88 427 1,458
81 Other services 455 80 361 896
92 Government & non NAICs 31 17 31 80
10,317 2,342 3,167 15,827
2008 Employment Compensation Impact Aggregated Industries by NAICS Code Direct Indirect Induced Total
11 Ag, Forestry, Fish & Hunting 56,740 41,350 59,569 157,659
21 Mining 0 10,795 2,147 12,942
22 Utilities 2,976,235 940,974 1,246,423 5,163,632
23 Construction 223,695,344 1,664,879 732,303 226,092,512
31-33 Manufacturing 2,548,128 7,478,114 3,645,186 13,671,427
42 Wholesale Trade 28,424,468 6,210,387 5,691,374 40,326,224
48-49 Transportation & Warehousing 4,045,192 7,159,087 3,312,092 14,516,370
44-45 Retail trade 26,923,448 10,020,084 19,592,324 56,535,856
51 Information 2,023,450 3,062,821 2,233,908 7,320,179
52 Finance & insurance 8,498,712 8,902,089 9,078,807 26,479,608
53 Real estate & rental 1,345,510 2,630,118 2,108,765 6,084,392
54 Professional- scientific & tech svcs 11,561,323 23,857,250 5,177,727 40,596,300
55 Management of companies 0 4,510,884 1,886,260 6,397,145
56 Administrative & waste services 1,396,032 10,131,864 2,820,449 14,348,345
61 Educational svcs 1,408,987 77,345 1,896,216 3,382,547
62 Health & social services 41,102,336 137,275 25,197,616 66,437,224
71 Arts- entertainment & recreation 1,415,369 307,413 1,419,347 3,142,129
72 Accomodation & food services 16,575,991 1,478,446 6,919,956 24,974,394
81 Other services 11,920,751 2,827,805 8,858,366 23,606,922
92 Government & non NAICs 1,753,839 968,221 1,758,168 4,480,228
$387,671,854 $92,417,200 $103,637,000 $583,726,033
2008 Output Impact Aggregated Industries by NAICS Code Direct Indirect Induced Total
11 Ag, Forestry, Fish & Hunting 243,707 290,448 272,571 806,726
21 Mining 0 37,601 8,242 45,844
22 Utilities 17,941,750 5,675,642 7,524,497 31,141,892
23 Construction 512,990,176 4,585,590 2,095,948 519,671,712
31-33 Manufacturing 16,915,616 32,670,570 20,948,042 70,534,224
42 Wholesale Trade 67,757,688 14,804,197 13,566,984 96,128,864
48-49 Transportation & Warehousing 13,992,839 15,198,571 7,102,831 36,294,240
44-45 Retail trade 60,268,408 22,926,716 44,811,300 128,006,424
51 Information 10,161,874 12,618,285 10,639,142 33,419,302
52 Finance & insurance 30,002,902 25,392,294 28,817,278 84,212,472

AN ECONOMIC ASSESSMENT OF FORT LEE 2006 THROUGH 2013
24
53 Real estate & rental 11,868,463 25,257,524 20,768,564 57,894,552
54 Professional- scientific & tech svcs 42,764,636 61,416,080 14,376,439 118,557,152
55 Management of companies 0 9,245,206 3,865,953 13,111,159
56 Administrative & waste services 3,938,528 18,923,402 5,859,342 28,721,272
61 Educational svcs 2,299,781 160,655 3,608,039 6,068,474
62 Health & social services 83,831,432 489,648 52,210,552 136,531,632
71 Arts- entertainment & recreation 3,920,680 802,393 3,846,951 8,570,024
72 Accomodation & food services 49,840,688 4,509,089 21,430,366 75,780,144
81 Other services 27,981,136 7,933,578 20,396,490 56,311,204
92 Government & non NAICs 61,521,200 3,255,256 43,674,320 108,450,776
Insitutions 37,468,672 0 0 37,468,672
$1,055,710,175 $266,192,745 $325,823,849 $1,647,726,760

AN ECONOMIC ASSESSMENT OF FORT LEE 2006 THROUGH 2013
25
2009 SUMMARY
Net Salary & Wages60%
Utilities1%
Construction/Maintenance21%
Wholesale/Retail8%
Transportation1%
Services1%
Professional Services6%
Hotel/Restaurant2%
2009 Employment Impact
Aggregated Industries by NAICS Code
Direct Indirect Induced Total 11 Ag, Forestry, Fish & Hunting 9 6 6 21 21 Mining 0 0 0 0 22 Utilities 34 6 7 48 23 Construction 2,709 42 14 2,765
31-33 Manufacturing 58 108 50 216 42 Wholesale Trade 474 69 65 608
48-49 Transportation & Warehousing 1,265 217 564 2,046 44-45 Retail trade 108 123 54 285
51 Information 38 45 27 110 52 Finance & insurance 178 145 118 441 53 Real estate & rental 77 115 79 271 54 Professional- scientific & tech svcs 308 376 98 782 55 Management of companies 0 40 13 53 56 Administrative & waste services 80 333 82 496 61 Educational svcs 56 3 50 109 62 Health & social services 1,083 5 487 1,574 71 Arts- entertainment & recreation 128 33 82 244 72 Accomodation & food services 1,089 85 327 1,501 81 Other services 556 70 276 902 92 Government & non NAICs 38 16 24 78

AN ECONOMIC ASSESSMENT OF FORT LEE 2006 THROUGH 2013
26
8,289 1,836 2,424 12,549
2009 Employment Compensation Impact
Aggregated Industries by NAICS Code
Direct Indirect Induced Total 11 Ag, Forestry, Fish & Hunting 71,342 44,374 46,156 161,87221 Mining 0 8,371 1,707 10,07822 Utilities 3,787,675 872,702 977,012 5,637,38923 Construction 109,582,128 1,725,035 569,442 111,876,608
31-33 Manufacturing 3,204,096 5,774,531 2,854,079 11,832,70642 Wholesale Trade 32,346,008 4,682,878 4,457,172 41,486,056
48-49 Transportation & Warehousing 4,853,515 6,303,919 2,588,543 13,745,97644-45 Retail trade 33,311,576 5,934,369 15,432,282 54,678,228
51 Information 2,523,111 2,919,025 1,745,172 7,187,30852 Finance & insurance 10,674,510 8,549,019 7,128,014 26,351,54453 Real estate & rental 1,680,608 2,475,307 1,652,960 5,808,87554 Professional- scientific & tech svcs 13,147,945 16,401,113 4,070,543 33,619,60455 Management of companies 0 4,701,135 1,503,165 6,204,30056 Administrative & waste services 1,778,907 9,084,098 2,209,548 13,072,55461 Educational svcs 1,771,242 77,697 1,487,691 3,336,62962 Health & social services 52,008,644 171,780 19,966,794 72,147,22471 Arts- entertainment & recreation 1,779,646 312,152 1,103,867 3,195,66572 Accomodation & food services 19,445,180 1,453,372 5,418,807 26,317,36281 Other services 14,849,167 2,457,821 6,918,327 24,225,31492 Government & non NAICs 2,208,740 916,898 1,389,996 4,515,635
$309,024,040 $74,865,596 $81,521,276 $465,410,927
2009 Output Impact
Aggregated Industries by NAICS Code
Direct Indirect Induced Total 11 Ag, Forestry, Fish & Hunting 306,415 270,923 211,287 788,62521 Mining 0 30,306 6,558 36,86422 Utilities 22,832,836 5,263,579 5,897,489 33,993,90423 Construction 251,873,728 4,820,738 1,629,830 258,324,288
31-33 Manufacturing 21,270,122 25,672,070 16,355,454 63,297,64442 Wholesale Trade 77,105,776 11,162,952 10,624,918 98,893,648
48-49 Transportation & Warehousing 16,389,456 13,015,834 5,544,410 34,949,70044-45 Retail trade 74,701,832 13,578,289 35,296,508 123,576,624
51 Information 12,722,019 11,923,903 8,305,626 32,951,54852 Finance & insurance 37,696,480 23,968,916 22,613,664 84,279,06453 Real estate & rental 14,881,677 25,220,532 16,270,374 56,372,58454 Professional- scientific & tech svcs 48,241,160 43,401,824 11,295,357 102,938,34455 Management of companies 0 9,635,131 3,080,785 12,715,91656 Administrative & waste services 5,020,682 17,309,668 4,583,446 26,913,79661 Educational svcs 2,890,694 163,876 2,830,692 5,885,26262 Health & social services 106,032,976 612,854 41,347,956 147,993,792

AN ECONOMIC ASSESSMENT OF FORT LEE 2006 THROUGH 2013
27
71 Arts- entertainment & recreation 4,929,753 819,367 2,991,879 8,740,99972 Accomodation & food services 58,646,248 4,439,956 16,780,514 79,866,72081 Other services 34,803,900 6,766,084 15,942,667 57,512,64892 Government & non NAICs 77,362,104 3,083,571 33,014,894 113,460,568
Insitutions 46,694,280 0 0 46,694,280 $914,402,137 $221,160,371 $254,624,307 $1,390,186,818
2010 SUMMARY
Net Salary & Wages65%Utilities
2%
Construction/Maintenance14%
Wholesale/Retail8%
Transportation1%
Services1%
Professional Services7% Hotel/Restaurant
2%
2010 Employment Impact
Aggregated Industries by NAICS Code
Direct Indirect Induced Total 11 Ag, Forestry, Fish & Hunting 10 6 6 22 21 Mining 0 0 0 0 22 Utilities 39 7 7 52 23 Construction 1,808 45 13 1,866
31-33 Manufacturing 65 100 47 212 42 Wholesale Trade 532 64 62 657
48-49 Transportation & Warehousing 1,411 172 534 2,117 44-45 Retail trade 121 123 51 295
51 Information 43 47 25 115

AN ECONOMIC ASSESSMENT OF FORT LEE 2006 THROUGH 2013
28
52 Finance & insurance 199 151 112 461 53 Real estate & rental 86 120 75 281 54 Professional- scientific & tech svcs 346 331 93 770 55 Management of companies 0 42 12 54 56 Administrative & waste services 92 338 78 508 61 Educational svcs 63 3 48 113 62 Health & social services 1,206 5 461 1,672 71 Arts- entertainment & recreation 145 36 78 258 72 Accomodation & food services 1,176 89 310 1,575 81 Other services 626 70 262 957 92 Government & non NAICs 43 16 23 82
8,009 1,764 2,296 12,069
2010 Employment Compensation Impact
Aggregated Industries by NAICS Code
Direct Indirect Induced Total 11 Ag, Forestry, Fish & Hunting 81,874 48,376 44,269 174,51921 Mining 0 8,145 1,680 9,82522 Utilities 4,383,371 908,453 947,993 6,239,81623 Construction 74,319,552 1,868,498 548,105 76,736,152
31-33 Manufacturing 3,677,367 5,549,551 2,766,311 11,993,22942 Wholesale Trade 37,159,860 4,454,054 4,320,785 45,934,696
48-49 Transportation & Warehousing 5,572,841 6,454,765 2,504,307 14,531,91344-45 Retail trade 38,236,204 4,838,826 15,046,389 58,121,420
51 Information 2,895,555 3,092,481 1,687,675 7,675,71252 Finance & insurance 12,237,600 9,092,557 6,927,571 28,257,72853 Real estate & rental 1,928,917 2,607,096 1,603,876 6,139,88954 Professional- scientific & tech svcs 15,104,865 14,837,848 3,961,262 33,903,97255 Management of companies 0 5,190,791 1,482,765 6,673,55756 Administrative & waste services 2,060,428 9,434,116 2,142,674 13,637,21861 Educational svcs 2,032,764 83,766 1,444,676 3,561,20762 Health & social services 59,950,028 196,672 19,585,986 79,732,68871 Arts- entertainment & recreation 2,042,416 334,723 1,062,659 3,439,79972 Accommodation & food services 21,399,706 1,554,832 5,252,400 28,206,93681 Other services 17,048,778 2,513,843 6,688,161 26,250,78092 Government & non NAICs 2,541,932 969,294 1,360,301 4,871,526
$302,674,057 $74,038,686 $79,379,842 $456,092,579
2010 Output Impact
Aggregated Industries by NAICS Code
Direct Indirect Induced Total 11 Ag, Forestry, Fish & Hunting 351,639 281,258 202,738 835,63521 Mining 0 30,067 6,459 36,52622 Utilities 26,423,350 5,478,936 5,721,729 37,624,01623 Construction 171,273,472 5,261,568 1,568,767 178,103,808
31-33 Manufacturing 24,411,764 24,877,592 15,809,119 65,098,476

AN ECONOMIC ASSESSMENT OF FORT LEE 2006 THROUGH 2013
29
42 Wholesale Trade 88,580,944 10,617,485 10,299,801 109,498,22448-49 Transportation & Warehousing 18,823,008 13,156,917 5,357,428 37,337,35644-45 Retail trade 85,743,832 11,071,602 34,413,896 131,229,336
51 Information 14,600,198 12,589,031 8,026,300 35,215,52852 Finance & insurance 43,230,448 25,334,974 21,966,502 90,531,92853 Real estate & rental 17,079,476 27,109,512 15,778,500 59,967,48854 Professional- scientific & tech svcs 55,426,056 39,913,624 10,985,437 106,325,11255 Management of companies 0 10,638,698 3,038,977 13,677,67556 Administrative & waste services 5,816,791 18,102,454 4,438,146 28,357,39261 Educational svcs 3,317,507 177,673 2,748,835 6,244,01462 Health & social services 122,189,544 701,682 40,535,624 163,426,84871 Arts- entertainment & recreation 5,657,639 880,354 2,880,179 9,418,17272 Accomodation & food services 64,654,908 4,752,301 16,264,275 85,671,48081 Other services 39,958,232 6,862,666 15,425,008 62,245,90492 Government & non NAICs 88,801,168 3,259,005 30,901,350 122,961,520
Insitutions 53,116,880 0 0 53,116,880 $929,456,857 $221,097,397 $246,369,067 $1,396,923,318

AN ECONOMIC ASSESSMENT OF FORT LEE 2006 THROUGH 2013
30
2011 SUMMARY
Net Salary & Wages73%
Ut ilit ies2%
Const ruct ion/ Maint enance3%
Wholesale/ Ret ail10%
Transport at ion1%
Services1%
Prof essional Services8%
Hot el/ Rest aurant2%
2011 Employment Impact
Aggregated Industries by NAICS Code
Direct Indirect Induced Total 11 Ag, Forestry, Fish & Hunting 10 6 5 21 21 Mining 0 0 0 0 22 Utilities 40 6 6 51 23 Construction 373 44 11 427
31-33 Manufacturing 67 77 38 182 42 Wholesale Trade 546 50 50 646
48-49 Transportation & Warehousing 1,442 90 432 1,964 44-45 Retail trade 125 108 41 275
51 Information 44 44 20 109 52 Finance & insurance 204 141 90 435 53 Real estate & rental 89 113 61 262 54 Professional- scientific & tech svcs 356 232 75 663 55 Management of companies 0 41 10 50 56 Administrative & waste services 96 306 63 464 61 Educational svcs 65 3 38 106 62 Health & social services 1,231 5 373 1,609 71 Arts- entertainment & recreation 150 35 63 247 72 Accomodation & food services 1,200 84 250 1,535 81 Other services 645 63 212 920

AN ECONOMIC ASSESSMENT OF FORT LEE 2006 THROUGH 2013
31
92 Government & non NAICs 44 15 18 77 6,726 1,462 1,856 10,044
2011 Employment Compensation Impact
Aggregated Industries by NAICS Code
Direct Indirect Induced Total 11 Ag, Forestry, Fish & Hunting 86,132 48,130 36,248 170,51021 Mining 0 6,720 1,412 8,13222 Utilities 4,654,590 847,419 785,252 6,287,26123 Construction 15,568,174 1,840,915 450,388 17,859,478
31-33 Manufacturing 3,868,900 4,524,461 2,289,063 10,682,42442 Wholesale Trade 39,068,532 3,565,120 3,575,777 46,209,432
48-49 Transportation & Warehousing 5,861,203 5,855,107 2,068,482 13,784,79244-45 Retail trade 40,222,520 2,622,250 12,523,951 55,368,724
51 Information 3,046,005 2,946,822 1,393,350 7,386,17752 Finance & insurance 12,860,857 8,679,825 5,748,090 27,288,77053 Real estate & rental 2,029,191 2,460,437 1,328,570 5,818,19854 Professional- scientific & tech svcs 15,880,740 10,691,187 3,291,015 29,862,94255 Management of companies 0 5,194,760 1,248,656 6,443,41656 Administrative & waste services 2,189,985 8,709,560 1,773,895 12,673,44061 Educational svcs 2,138,519 81,497 1,197,717 3,417,73362 Health & social services 63,379,996 206,436 16,402,964 79,989,39271 Arts- entertainment & recreation 2,148,687 326,764 873,347 3,348,79872 Accomodation & food services 22,351,162 1,500,657 4,346,343 28,198,16281 Other services 17,941,260 2,268,897 5,519,994 25,730,15092 Government & non NAICs 2,681,773 919,291 1,136,505 4,737,568
$255,978,226 $63,296,254 $65,991,016 $385,265,498
2011 Output Impact
Aggregated Industries by NAICS Code
Direct Indirect Induced Total 11 Ag, Forestry, Fish & Hunting 369,917 260,407 166,079 796,40221 Mining 0 25,640 5,431 31,07122 Utilities 28,057,762 5,110,586 4,738,987 37,907,33223 Construction 36,805,216 5,230,726 1,289,093 43,325,036
31-33 Manufacturing 25,683,100 20,586,642 13,046,793 59,316,53242 Wholesale Trade 93,130,800 8,498,462 8,523,866 110,153,128
48-49 Transportation & Warehousing 19,793,766 11,707,601 4,419,641 35,921,00844-45 Retail trade 90,198,832 5,999,910 28,644,614 124,843,360
51 Information 15,360,487 11,938,701 6,621,889 33,921,07652 Finance & insurance 45,446,656 23,975,912 18,217,172 87,639,74453 Real estate & rental 17,967,764 26,336,910 13,062,651 57,367,32054 Professional- scientific & tech svcs 58,269,800 29,790,182 9,121,181 97,181,16055 Management of companies 0 10,646,831 2,559,162 13,205,99356 Administrative & waste services 6,184,377 16,911,620 3,668,857 26,764,856

AN ECONOMIC ASSESSMENT OF FORT LEE 2006 THROUGH 2013
32
61 Educational svcs 3,490,098 174,138 2,278,921 5,943,15762 Health & social services 129,140,384 736,538 33,928,016 163,804,94471 Arts- entertainment & recreation 5,952,011 861,310 2,367,070 9,180,39172 Accomodation & food services 67,550,048 4,590,225 13,457,861 85,598,14481 Other services 42,047,584 6,110,792 12,741,369 60,899,74492 Government & non NAICs 93,439,272 3,090,699 24,700,656 121,230,624
Insitutions 55,391,948 0 0 55,391,948 $834,279,822 $192,583,830 $203,559,306 $1,230,422,970
2012 SUMMARY
Net Salary & Wages61%
Ut ilit ies1%
Const ruct ion/ Maint enance20%
Wholesale/ Ret ail8%
Transport at ion1%
Services1%
Prof essional Services6%
Hot el/ Rest aurant2%
2012 Employment Impact
Aggregated Industries by NAICS Code
Direct Indirect Induced Total 11 Ag, Forestry, Fish & Hunting 11 7 7 24 21 Mining 0 0 0 0 22 Utilities 40 7 8 55 23 Construction 2,876 49 16 2,941
31-33 Manufacturing 67 121 55 244 42 Wholesale Trade 550 77 73 699
48-49 Transportation & Warehousing 1,442 238 630 2,310 44-45 Retail trade 126 139 60 325
51 Information 45 51 30 125

AN ECONOMIC ASSESSMENT OF FORT LEE 2006 THROUGH 2013
33
52 Finance & insurance 204 169 131 504 53 Real estate & rental 89 131 88 309 54 Professional- scientific & tech svcs 358 417 110 885 55 Management of companies 0 46 14 60 56 Administrative & waste services 97 380 92 568 61 Educational svcs 65 3 56 124 62 Health & social services 1,227 5 544 1,776 71 Arts- entertainment & recreation 152 38 92 281 72 Accomodation & food services 1,205 96 365 1,667 81 Other services 651 81 308 1,040 92 Government & non NAICs 44 18 27 88
9,248 2,073 2,705 14,027
2012 Employment Compensation Impact
Aggregated Industries by NAICS Code
Direct Indirect Induced Total 11 Ag, Forestry, Fish & Hunting 88,715 53,716 53,491 195,92221 Mining 0 10,482 2,138 12,62022 Utilities 4,794,496 1,057,490 1,172,469 7,024,45523 Construction 122,095,808 2,097,452 667,017 124,860,280
31-33 Manufacturing 3,985,194 6,935,426 3,414,351 14,334,97042 Wholesale Trade 40,240,584 5,615,180 5,333,684 51,189,448
48-49 Transportation & Warehousing 6,037,163 7,604,975 3,079,395 16,721,53244-45 Retail trade 41,420,036 7,111,202 18,788,262 67,319,496
51 Information 3,133,389 3,548,175 2,073,476 8,755,04152 Finance & insurance 13,233,082 10,699,108 8,596,066 32,528,25653 Real estate & rental 2,090,067 3,037,501 1,983,728 7,111,29654 Professional- scientific & tech svcs 16,357,263 19,639,684 4,928,043 40,924,99255 Management of companies 0 6,085,326 1,895,237 7,980,56256 Administrative & waste services 2,255,671 11,123,010 2,646,914 16,025,59661 Educational svcs 2,202,675 95,888 1,789,232 4,087,79662 Health & social services 65,281,396 212,291 24,760,508 90,254,20071 Arts- entertainment & recreation 2,213,159 373,411 1,293,520 3,880,08972 Accomodation & food services 22,988,718 1,775,621 6,481,932 31,246,27281 Other services 18,479,498 3,050,854 8,210,538 29,740,89092 Government & non NAICs 2,770,218 1,147,080 1,711,418 5,628,716
$369,667,130 $91,273,870 $98,881,417 $559,822,428
2012 Output Impact
Aggregated Industries by NAICS Code
Direct Indirect Induced Total 11 Ag, Forestry, Fish & Hunting 380,997 328,997 245,207 955,20121 Mining 0 38,166 8,230 46,39622 Utilities 28,901,048 6,377,053 7,075,090 42,353,19223 Construction 280,789,696 5,936,604 1,909,106 288,635,424

AN ECONOMIC ASSESSMENT OF FORT LEE 2006 THROUGH 2013
34
31-33 Manufacturing 26,454,950 30,840,968 19,410,756 76,706,67242 Wholesale Trade 95,924,712 13,385,354 12,714,330 122,024,400
48-49 Transportation & Warehousing 20,387,796 15,637,023 6,571,518 42,596,33644-45 Retail trade 92,886,648 16,270,971 42,972,260 152,129,872
51 Information 15,795,851 14,459,783 9,847,139 40,102,77652 Finance & insurance 46,776,692 29,983,166 27,229,090 103,988,94453 Real estate & rental 18,506,796 31,065,866 19,494,156 69,066,81654 Professional- scientific & tech svcs 60,018,136 52,066,816 13,650,015 125,734,96855 Management of companies 0 12,472,077 3,884,350 16,356,42656 Administrative & waste services 6,369,877 21,158,058 5,466,336 32,994,27261 Educational svcs 3,594,802 202,840 3,404,445 7,202,08762 Health & social services 133,014,600 757,308 51,184,596 184,956,51271 Arts- entertainment & recreation 6,130,598 980,951 3,505,844 10,617,39372 Accomodation & food services 69,473,688 5,422,737 20,069,286 94,965,70481 Other services 43,309,008 8,365,991 18,967,492 70,642,48892 Government & non NAICs 96,261,576 3,851,205 35,593,120 135,705,904
Insitutions 56,558,584 0 0 56,558,584 $1,101,536,054 $269,601,934 $303,202,364 $1,674,340,366
2013 SUMMARY
Net Salary & Wages61%
Utilities1%
Construction/Maintenance20%
Wholesale/Retail8%
Transportation1%
Services1%
Professional Services6%
Hotel/Restaurant2%

AN ECONOMIC ASSESSMENT OF FORT LEE 2006 THROUGH 2013
35
2013 Employment Impact
Aggregated Industries by NAICS Code Direct Indirect Induced Total
11 Ag, Forestry, Fish & Hunting 11 7 7 24 21 Mining 0 0 0 0 22 Utilities 40 7 8 56 23 Construction 2,916 50 16 2,982
31-33 Manufacturing 68 122 56 246 42 Wholesale Trade 554 78 73 705
48-49 Transportation & Warehousing 1,445 242 635 2,321 44-45 Retail trade 127 140 61 328
51 Information 45 52 30 126 52 Finance & insurance 205 171 133 509 53 Real estate & rental 90 133 89 312 54 Professional- scientific & tech svcs 361 422 111 894 55 Management of companies 0 46 14 61 56 Administrative & waste services 98 384 92 574 61 Educational svcs 65 3 57 125 62 Health & social services 1,225 5 548 1,778 71 Arts- entertainment & recreation 154 38 93 284 72 Accomodation & food services 1,212 97 368 1,676 81 Other services 657 82 311 1,050 92 Government & non NAICs 44 18 27 89
9,316 2,097 2,727 14,141
2013 Employment Compensation Impact
Aggregated Industries by NAICS Code
Direct Indirect Induced Total 11 Ag, Forestry, Fish & Hunting 91,374 55,126 54,596 201,09721 Mining 0 10,966 2,235 13,20122 Utilities 4,938,599 1,090,532 1,209,851 7,238,98223 Construction 125,758,688 2,158,284 683,105 128,600,080
31-33 Manufacturing 4,104,979 7,166,217 3,519,864 14,791,05942 Wholesale Trade 41,447,800 5,804,811 5,498,915 52,751,524
48-49 Transportation & Warehousing 6,218,402 7,829,667 3,169,054 17,217,12244-45 Retail trade 42,653,468 7,423,778 19,472,726 69,549,976
51 Information 3,223,436 3,653,185 2,133,000 9,009,62152 Finance & insurance 13,617,382 11,131,011 8,883,598 33,631,99253 Real estate & rental 2,152,769 3,140,084 2,047,010 7,339,86254 Professional- scientific & tech svcs 16,848,082 20,359,100 5,098,912 42,306,09255 Management of companies 0 6,377,201 1,984,831 8,362,03256 Administrative & waste services 2,323,328 11,498,075 2,729,841 16,551,24461 Educational svcs 2,268,755 99,033 1,847,515 4,215,30362 Health & social services 67,239,832 217,946 25,805,198 93,262,97671 Arts- entertainment & recreation 2,279,564 382,537 1,324,881 3,986,982

AN ECONOMIC ASSESSMENT OF FORT LEE 2006 THROUGH 2013
36
72 Accomodation & food services 23,645,396 1,829,691 6,681,938 32,157,02481 Other services 19,033,882 3,175,392 8,443,224 30,652,50092 Government & non NAICs 2,860,914 1,193,852 1,779,796 5,834,562
Insitutions $380,706,649 $94,596,486 $102,370,088 $577,673,230
2013 Output Impact
Aggregated Industries by NAICS Code
Direct Indirect Induced Total 11 Ag, Forestry, Fish & Hunting 392,410 339,473 250,384 982,26721 Mining 0 39,943 8,607 48,55022 Utilities 29,769,634 6,575,951 7,299,961 43,645,54423 Construction 289,213,408 6,134,185 1,955,152 297,302,752
31-33 Manufacturing 27,249,972 31,849,196 19,961,652 79,060,81642 Wholesale Trade 98,802,456 13,837,393 13,108,205 125,748,048
48-49 Transportation & Warehousing 20,999,646 16,091,027 6,755,093 43,845,76444-45 Retail trade 95,655,080 16,986,168 44,537,756 157,179,008
51 Information 16,244,409 14,878,744 10,123,126 41,246,28052 Finance & insurance 48,148,860 31,205,272 28,126,598 107,480,72853 Real estate & rental 19,062,004 32,110,772 20,105,830 71,278,60854 Professional- scientific & tech svcs 61,818,920 53,945,924 14,115,479 129,880,32055 Management of companies 0 13,070,284 4,067,976 17,138,26056 Administrative & waste services 6,560,944 21,854,548 5,629,845 34,045,33661 Educational svcs 3,702,645 209,606 3,515,342 7,427,59362 Health & social services 137,005,040 777,449 53,316,164 191,098,64071 Arts- entertainment & recreation 6,314,541 1,004,912 3,590,821 10,910,27472 Accomodation & food services 71,455,008 5,587,059 20,687,450 97,729,51281 Other services 44,608,280 8,699,499 19,520,110 72,827,88892 Government & non NAICs 99,167,720 4,006,097 35,468,360 138,642,176
Insitutions 57,690,796 0 0 57,690,796 $1,133,861,772 $279,203,502 $312,143,910 $1,725,209,159